modelling branch development for forest management … · modelling branch development for forest...
TRANSCRIPT

391
MODELLING BRANCH DEVELOPMENT FOR FOREST MANAGEMENT
J. C. GRACE, D. PONT, C. J. GOULDING,
New Zealand Forest Research Institute, Private Bag 3020, Rotorua, New Zealand
and B. RAWLEY
Carter Holt Harvey Forests Ltd, P. O. Box 648, Tokoroa, New Zealand
(Received for publication 24 May 1999; revision 31 August 1999)
ABSTRACT The locations and dimensions of branches encased within a tree-stem influence the
appearance, strength, and ultimately the end-use of timber. A model which predicts branch development through time would enable the New Zealand forest industry to obtain better estimates of log and timber grades at time of harvest from inventory information collected at any time during the rotation.
Choosing the appropriate level of detail with which to model branch development for forest management requires a compromise between understanding growth processes, data collection costs, model accuracy and precision, and suitability for use by forest management.
The approach chosen was to model the occurrence of branch clusters within annual shoots on Pinus radiata D. Don, and to model the diameter growth of branches at the point of attachment to the tree stem. This approach has several major advantages. It is based on an understanding of branch morphology and basic growth processes. It allows the utilisation of existing models of annual height development, stem taper, and growth which are based on extensive field measurements. We believe that the model structure is cost-efficient in terms of the data requirements. The increased costs of data collection to develop a more detailed model of the full extent of the crown would not be matched by a similar increase in worth to the forest industry.
Keywords: branches; branch development; branch model; modelling; Pinus radiata.
INTRODUCTION
The ability to accurately predict tree growth and the development of stem quality in response to differences in tree breed, site, and silvicultural practice is necessary for the effective management of a production forest resource. When a growth and quality prediction model of individual trees is integrated with a sawing-simulator, detailed predictions of timber quantity and quality can be made. These predictions are required by management to improve silvicultural practice, value stands, design processing facilities, and market forest produce. This paper describes research carried out to predict branch development for the
New Zealand Journal of Forestry Science 29(3): 391-408 (1999)

392 New Zealand Journal of Forestry Science 29(3)
Pinus radiata plantations of New Zealand as a component of such an integrated modelling system.
A model to predict branch development should be capable of using a variety of inputs— namely, a small set of average stand parameters collected early in the life of the stand, inventory information collected at anytime during the rotation, or more detailed measurements obtained close to harvest. Determining the appropriate level of detail to include in a model requires a compromise between understanding growth processes, data collection costs, model accuracy and precision, and suitability for use by forest management.
Planted Pinus radiata Resource It is estimated that there are 1.7 million ha of P. radiata plantations in New Zealand (April
1997), within a total land area of 27 million ha (Ministry of Agriculture and Forestry 1998). Over the last five planting seasons, afforestation has occurred at an average annual rate of 76,000 ha. The plantations are intensively managed, often with several thinnings to waste early in the rotation, sometimes with one or more production thinnings and sometimes with several pruning operations to remove live green branches. The main objective of management is usually profitability. Rotations are moderately short, between 25 and 35 years, and the mean annual increment (MAI) for the stands currently being harvested averages 18 m3/ha (total merchantable volume including the volume removed by production thinning). The combination of a tree breeding programme (Shelboume et al. 1986), a recent trend to higher final-crop stockings, and the tendency for new planting to be on better sites, promises to lift MAI to perhaps over 25 m3/ha.
Pinus radiata has considerable site tolerance (Burdon, in press), and has been planted on a large range of sites with different combinations of soil and climate. In the North Island, on very good sites with appropriate silviculture, MAI can be above 45 m3/ha. Conversely, there are plantations growing on sites that are marginal for survival and growth. Separate stand growth models of P. radiata have been developed for major biogeoclimatic regions in order to account for differences in growth characteristics (Goulding 1994). Branching characteristics vary visually—for example, large branches and poor form occur when trees are grown at wide spacing on ex-pasture sites; many moderately large branches and a tendency to form swept stems occur on stands in the central North Island; and fine branches occur on trees on former sand-dune sites. The tree improvement programme (Shelboume et al. 1986) has deliberately produced different "breeds" of P. radiata, with genetically inherited differences in branching habit—multinodal with more clusters and smaller branches versus long internodes with fewer clusters and relatively larger branches. Trees with a multinodal branch habit have been planted in most stands established with genetically improved material. Branch growth responds to silviculture, with wider spacing promoting larger branches (Tombleson et al. 1990), but the ability of P. radiata branches to respond to increased spacing after thinning is not well understood.
CHOICE OF MODELLING TECHNIQUE TO SUPPORT FOREST MANAGEMENT
We consider that there is no one modelling approach that is appropriate for all situations. For forest management, the technique needs to be chosen carefully, taking into account the

Grace et al.—Modelling branch development 393
requirements of the end-use of the model, the practicality and economics of collecting data to run it, and the development costs. Models for use by management should be based on measured data and on experimental evidence, and every effort is required to ensure that predictions are unbiased, as values predicted by the model may be used directly in practice. Regardless of the level of detail in the model, it is also very important that the functions developed are logically sound, based on our knowledge of tree growth, rather than merely attempting to obtain the "best-fit" to datasets.
Process-based models have been promoted as being useful to forest managers on the basis that if the growth processes were understood and could be modelled, then the model could be used to simulate alternative management regimes. Research was carried out to develop a process-based growth model for P. radiata in New Zealand during the 1980s {see Goulding 1994). However, the results did not reach the stage of being useful for forest managers. There were several reasons for this: not all the growth processes were understood; there were limited data for estimating the model functions which were needed to apply across a wide range of sites; and the resource had been intensively monitored which enabled more accurate empirical models to be developed in a much shorter time frame.
The dimensions, frequency, and location of branches encased within a tree-stem are major factors in the appearance and strength of timber and they strongly influence the end-use value of the tree at harvest-time. Currently, many forest managers predict branch size and the effect of branches on the quality of logs using empirical relationships within the STANDP AK suite of programmes (Whiteside 1990). Whiteside (1982) measured 124 logs from unimproved P. radiata trees in the central North Island and found that the highest correlation between a variety of external branch variables and framing timber grade outturn was obtained using the mean of the three largest branches per quadrant on the log. The correlation using the mean of the largest branch per quadrant, Branch Index (Inglis & Cleland 1982), was only slightly lower. Branch Index is now predicted from an empirical function of stand variables measured or predicted at critical points during the rotation—for example, diameter at breast height (dbh) at age 20 years and dominant height at the time of the last thinning. It is considered that dbh at age 20 years adequately accounts for the effects of site fertility and stocking (M.O.Kimberley, R.L.Knowles, unpubl. data). However, this model is not dynamic, in that it does not predict branch growth given actual inventory assessments of branches in a stand. The empirical nature of its construction implies that new sawing processes may invalidate the correlations between Branch Index and timber grade yield embedded in the model. More importantly, it does not predict branching characteristics in sufficient detail to provide input data to new log-sawing simulation models being developed, such as AUTOS AW (Todoroki 1991, 1997).
When the New Zealand forest industry expressed interest in a model to predict branch development, we chose to develop a model that would form a component of an existing, integrated modelling system. Developing a completely process-based model of growth and wood quality for forest managers is still beyond our capabilities for the reasons stated previously. The model has been designed as an attempt to bridge the gap between "best-fit" models and very detailed process-based models. We have developed a series of logically sound functions each of which represent the result of many underlying physiological and morphological processes. The model was restricted to the location and dimensions of branches encased within the stem. No attempt was made to predict the complete external
394 New Zealand Journal of Forestry Science 29(3)
branch morphology or crown structure. This approach has concentrated the research effort to manageable proportions. Very detailed measurements obtained by destructive sampling of a few tree stems have been necessary to formulate the model (Grace et al 1998).
BRANCH MODEL FOR PINUS RADIATA Several components are required to develop a practical system for forest managers:
(1) A realistic description of the location and diameter of branches for individual trees at any age;
(2) The prediction of branch diameter increment, particularly the response to management practices;
(3) The enhancement of typical inventory data to provide a more detailed description of a tree's branches.
To date, research has concentrated on the first component, being able to provide a realistic description of the location and diameter of branches.
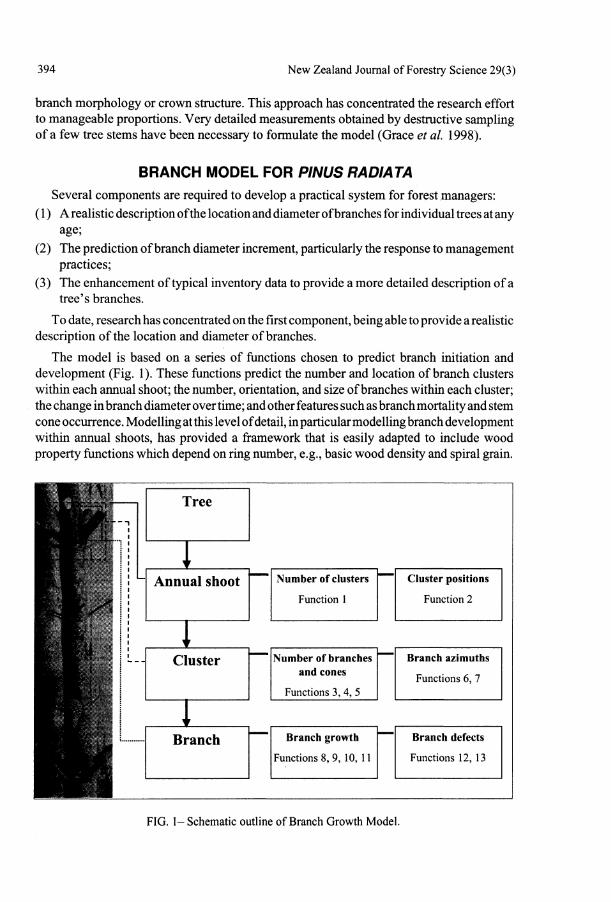
The model is based on a series of functions chosen to predict branch initiation and development (Fig. 1). These functions predict the number and location of branch clusters within each annual shoot; the number, orientation, and size of branches within each cluster; the change in branch diameter over time; and other features such as branch mortality and stem cone occurrence. Modelling at this level of detail, in particular modelling branch development within annual shoots, has provided a framework that is easily adapted to include wood property functions which depend on ring number, e.g., basic wood density and spiral grain.
IflBHEi--
^H^H^^s i
n
- - -
Tree
^ f
Annual shoot
i r Cluster
j f
Branch
Number of clusters
Function 1
Number of branches and cones
Functions 3, 4, 5
Branch growth
Functions 8, 9, 10, 11
Cluster positions
Function 2
Branch azimuths
Functions 6, 7
Branch defects
Functions 12, 13
FIG. 1- Schematic outline of Branch Growth Model.

Grace et al.—Modelling branch development 395
The inclusion of functions predicting other stem properties, e.g., compression wood and the occurrence and severity of sweep, will provide a detailed stem description which can be used in predicting strength and other properties of timber products.
Grace et al. (1998) reviewed the literature prior to defining the structure of the model. Methods for collecting data were developed and have been described in detail by Grace & Pont (1999). The remainder of this paper presents the structure of the model and the form of the individual functions as they exist in 1998. Pont (in prep.) discussed the phyllotaxy of P. radiata clusters which forms the basis of two of the functions below. The detailed data analysis required to develop each of the other functions will be the subject of future papers.
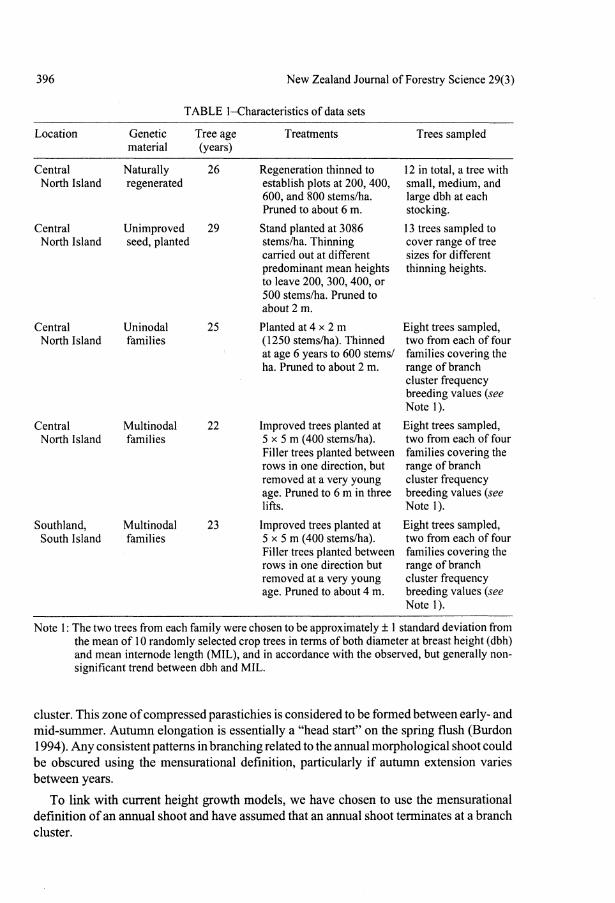
Data Collection and Analysis Over the last 4 years we have destructively sampled a total of 49 trees from five separate
experiments (Table 1). The detailed data required have caused us to limit the number of trees sampled, but the trees have been carefully selected to cover the variability in the experiments.
Data collection and model development are iterative. Given a version of the model, its generality across all sites is being tested as each new set of site-specific data is acquired. In this way functions which are shown to be valid for the new data sets are likely to be sufficient for the final model, whereas those functions which fail will require further development and more widespread data.
The approach taken with the data analysis has been to build up our understanding of a particular relationship by analysing the data first at an individual tree level, then at a site level, and then combining data across sites. This approach provides a better understanding of the data and underlying growth processes than fitting one overall equation.
Further data collection covering a wider range of tree breed, site/environment, and stand management practices is likely to be necessary to improve our understanding of branch development.
Model Functions, Rationale, and Results The current forms of the model functions are described below, and illustrated with model
output. The philosophy has been to develop simple mathematical relationships which explain the variability observed. Searching for more complex models which explain slightly more of the variability is not justified at present given the limited data and our limited understanding of the growth mechanisms. Such an approach is supported by Ratkowsky (1990) who stated that"... simplicity is preferred to complexity ... and should serve as the basic principle for scientists engaged in non-linear regression modelling".
Position in the stem where branch clusters are initiated
From a mensurational perspective, the end of one annual shoot is assumed to occur in midwinter when height increment is at a minimum. Using this definition allows annual shoot extension to be predicted with current height growth models which were developed using extensive winter measurements of tree height. However, from a morphological per-spective, the end of an annual shoot is marked by a zone of compressed parastichies above a branch
396 New Zealand Journal of Forestry Science 29(3)
TABLE 1-Characteristics of data sets
Location
Central North Island
Central North Island
Central North Island
Central North Island
Southland, South Island
Genetic material
Naturally regenerated
Unimproved seed, planted
Uninodal families
Multinodal families
Multinodal families
Tree age (years)
26
29
25
22
23
Treatments
Regeneration thinned to establish plots at 200,400, 600, and 800 stems/ha. Pruned to about 6 m.
Stand planted at 3086 stems/ha. Thinning carried out at different predominant mean heights to leave 200, 300, 400, or 500 stems/ha. Pruned to about 2 m.
Planted at 4 x 2 m (1250 stems/ha). Thinned at age 6 years to 600 stems/ ha. Pruned to about 2 m.
Improved trees planted at 5 x 5 m (400 stems/ha). Filler trees planted between rows in one direction, but removed at a very young age. Pruned to 6 m in three lifts.
Improved trees planted at 5 x 5 m (400 stems/ha). Filler trees planted between rows in one direction but removed at a very young age. Pruned to about 4 m.
Trees sampled
12 in total, a tree with small, medium, and large dbh at each stocking.
13 trees sampled to cover range of tree sizes for different thinning heights.
Eight trees sampled, two from each of four families covering the range of branch cluster frequency breeding values (see Notel).
Eight trees sampled, two from each of four families covering the range of branch cluster frequency breeding values (see Notel).
Eight trees sampled, two from each of four families covering the range of branch cluster frequency breeding values (see Note 1).
Note 1: The two trees from each family were chosen to be approximately ± 1 standard deviation from the mean of 10 randomly selected crop trees in terms of both diameter at breast height (dbh) and mean internode length (MIL), and in accordance with the observed, but generally nonsignificant trend between dbh and MIL.
cluster. This zone of compressed parastichies is considered to be formed between early- and mid-summer. Autumn elongation is essentially a "head start" on the spring flush (Burdon 1994). Any consistent patterns in branching related to the annual morphological shoot could be obscured using the mensurational definition, particularly if autumn extension varies between years.
To link with current height growth models, we have chosen to use the mensurational definition of an annual shoot and have assumed that an annual shoot terminates at a branch cluster.

Grace et al.—Modelling branch development 397
Function 1 Number of branch clusters within the annual shoot.
Previous research indicates that P. radiata forms up to six branch clusters in an annual morphological shoot (Bannister 1962), but this is influenced by many factors including genetics (Fielding 1960), tree age (Bannister 1962), annual shoot length (Bannister 1962), and site/environment (Bollmann & Sweet 1976).
For the sample trees, number of branch clusters in an annual shoot varied between one and seven. The frequency distribution varied between datasets. The differences between multinodal and uninodal trees in the central North Island are illustrated in Fig. 2. The number of branch clusters tended to increase with increasing shoot length and tree age. The prototype function developed is:
NC = ax x Aa* x La*
where:
NC is the number of branch clusters in an annual shoot A is the age of the tree when the annual shoot was formed L is the length of the annual shoot aha2, a3 are model coefficients
In the model, NC is rounded to the nearest integer. Analysis indicates that the model coefficients will vary with site and tree-breed.
• Uninodal
• Multinodal
40%- —
35%]
30%
25%
20%
15%- --- -
10% ; j^/
5% ;
0% 1 2 3 4 5 6 7
Number of branch clusters in an annual shoot
FIG. 2-Numbers of branch clusters in an annual shoot for uninodal and multinodal trees.
Function 2 The relative position of the branch clusters within the annual shoot.
The relative position of clusters within the annual shoot will depend on the number of clusters and on the length of each growth unit within the annual shoot. Bannister (1962) suggested that the relative positions of clusters may be influenced by environmental conditions. Bannister's (1962) and our data indicate that there is generally a preferred position for each cluster. There was some evidence to suggest that the relative position

398 New Zealand Journal of Forestry Science 29(3)
of clusters may vary slightly according to the multinodality of the tree. At this stage we have implemented a look-up table for the relative position of each cluster using observed means.
An illustration of the model output utilising these two functions is shown in Fig. 3. This shows individual branches within the four clusters of an annual shoot from a tree stem. The size and location of the branches are predicted by the following functions.
FIG. 3—Model output showing clusters within an annual shoot.
Number of branches and stem cones within each cluster
Function 3 The number of branches in each cluster.
The number of branches in a cluster appears to be influenced by genetics, but not by tree age. In some instances, site/environmental factors may influence the number of branches in a cluster (Fielding 1960, 1967). Analysis indicated that the number of branches per cluster was independent of the number of clusters in an annual shoot, the position of the cluster within the annual shoot, and the number of stems per hectare. Uninodal trees tended to have more branches per cluster than multinodal trees. The number of branches per cluster was similar for both sites with multinodal trees.

Grace et al.—Modelling branch development 399
The number of branches in a cluster is predicted as a random observation from a Neyman type A distribution. Data and model for multinodal trees in the central North Island are illustrated in Fig. 4.
0 1 2 3 4 5 6 7 8 9 10 11 12 13 14 15
Number of branches per cluster
FIG. 4-Observed and predicted frequency distribution for number of branches in a cluster for multinodal trees in the central North Island.
Function 4 The probability that the tree has reached reproductive maturity (produced stem cones).
In P. radiata, female cones can be borne on the main stem. They typically remain attached for several years and leave a significant defect in the stem wood. Prior to reproductive maturity, clusters contain only branches. After reproductive maturity, a cluster contains branches and/or stem cones. The age of reproductive maturity is quite variable, varying from 5 years to at least 26 years (Bannister 1962). It is also moderately heritable (M.Carson pers. comm.).
The percentage of trees which have reached reproductive maturity by a given age varied little between the data sets and it appears that one function could be used for all sites. The probability a tree has reached maturity is predicted by:
p(m) = (1 +exp(bl-b2*A))
where: A is the tree age p(m) is the probability a tree is mature at age A b\ and b2 are model coefficients
Data and the predicted function are illustrated in Fig. 5.

400 New Zealand Journal of Forestry Science 29(3)
• * • •
S> 60 u 03
I 50 O 0 £ 40
-•+• - - • — + • — *
10 15 20 25 30
Tree age when cluster first formed (years)
FIG. 5-Observed and predicted age of maturity.
Function 5 The number of stem cones in each cluster once the tree has reached reproductive maturity.
Cones do not occur in every cluster once a tree has reached reproductive maturity. They rarely occur in the last cluster of the morphological annual shoot, they occasionally occur in the second to last cluster, and are generally present in all other clusters (Bannister 1962).
Using the mensurational definition of an annual shoot, cones have been found to occur in the last cluster of an annual shoot. The probability of finding cones in this cluster appears to be slightly lower than for other clusters.
We have implemented a look-up table for the probability that cones occur in a given cluster in an annual shoot. The number of cones in a cluster is predicted using the observed frequency distribution.
Azimuthal location of branches
The azimuthal location of branches is important for determining what parts of the log can be used for different products. There are two issues which need to be addressed. Firstly, are azimuthal angles such that there are sectors of the stem without branches? Secondly, do the larger branches occur in the same azimuthal sector of the stem or are they distributed more evenly round the stem?
Function 6 Arrangement of branches in each cluster.
Examination of clusters from the top few annual shoots of both uninodal and multinodal trees in the central North Island has indicated that P. radiata has spiral phyllotaxy. For

Grace et al.—Modelling branch development 401
most clusters, successive branches in the ontogenetic sequence are separated by an angle of approximately 137.5° (Pont in prep.).
Branch diameter also tended to increase with position in the ontogenetic sequence from the base to the top of the cluster. Within a cluster, we have ranked branches in order of diameter, with successive branches being separated by 137.5°. This assumption leads to the larger branches being distributed around the stem.
Function 7 Azimuth angle of the largest branch in a cluster. In order to be able to predict the correct distribution of branches for the whole tree, we need some method to create a link between clusters. We have chosen to do this by comparing the azimuth angles of the largest branch in each cluster.
The azimuth angle for the largest branch in each cluster has been examined on 25 trees from the central North Island and five trees from the South Island. The azimuth angle of the largest branch was typically very variable. However, for 67% of the trees there was a preferred azimuth angle for the largest branch in each cluster using the Rayleigh test of uniformity (Mardia 1972). There was no trend in the azimuth angle with increasing height of the cluster.
Recent studies indicate that crowns tend to be asymmetrical to the south in the Northern Hemisphere (Rouvinen & Kuuluvainen 1997; Skatter & Kucera 1998). For our sample of trees in the Southern Hemisphere, the preferred azimuth tended to be on the northern side of the tree. It is unclear how much this angle has been influenced by the path of the sun and how much it has been influenced by the position of the sample tree within the stand. In a shelterbelt, the diameter of branches is influenced more by available space than by aspect (Tombleson & Inglis 1988). Field observation indicates that edge trees have larger branches towards open space regardless of aspect.
At present we have assumed that the azimuth angle of the largest branch in a cluster can be predicted by a random number from a circular uniform distribution which is valid for some but not all of the trees. When we have sufficient information to confidently assign mean angle and circular variance to individual trees, we can implement a preferred azimuth direction by selecting random numbers from an appropriate circular distribution.
Branch diameter
Input data for the branch model may come from measurements taken during an inventory when a few of the largest branch diameters will be estimated, or from stand parameters at a young age when little information on branching will be available.
To be able to generate diameters for all branches on a tree, the within-tree distribution for the largest branch diameter in a cluster, and the distribution of branch diameters in a cluster relative to the largest branch are predicted.
Function 8 The diameter of the largest branch within the cluster.
Several components are needed to predict the maximum diameter attainable by the largest branch in a cluster. Within a tree, the trend of diameter with cluster height will be influenced by silviculture. Within a stand, between-tree variability is likely to be a

402 New Zealand Journal of Forestry Science 29(3)
function of relative spacing. Finally, the between-stand variability needs to be predicted as a function of site characteristics.
Clusters where the branches had stopped growing were used to determine the variability in the diameter of the largest branch per cluster. Where trees had grown with no further thinning at a given nominal stocking per hectare, the diameter of the largest branch per cluster was not correlated with height of the cluster. Nor have analyses to date revealed any patterns based on cluster position within an annual shoot. The distribution of the diameter of the largest branch in each cluster was found to be approximately normal. This mean was positively correlated with tree dbh, but because tree dbh varies with age it is not a satisfactory independent variable for the model. The mean was positively correlated with a distant-independent growing space index of the form:
<F_ 10 000
dP N where:
d is the tree dbh TV is the number of stems per hectare p is a model coefficient
When trees are thinned, the younger, larger branches on the larger trees respond to the increased growing space through increased diameter growth. For these larger trees, a slight increase in the diameter of the largest branch in a cluster with increasing cluster height was observed. The "growing space index" defined to predict between-tree variability will change when a thinning occurs allowing trees with increased growing space to have bigger branches.
Previous data, collected for determining Branch Index, should be useful for determining between-site variability.
Function 9 The diameter of the other branches relative to the diameter of the largest branch.
Within a cluster, branch diameter varies considerably. When branches within a cluster are ranked in order of decreasing diameter, each successive branch has a diameter that on average is approximately 12% smaller than the previous branch (Madgwick 1994).
Our data indicate that there is considerable variability between clusters on a given tree. We have had limited success in understanding what is controlling this variability. The relative diameter of branches in a cluster is predicted using the following function:
A* - — = expC-qx^- l )^) Umax
where: n is the rank of the branch in the cluster when ranked by diameter from largest to
smallest Dn is the diameter of the nth branch in the cluster (overbark) Dmax is the maximum branch diameter in the cluster (overbark) c\, c2 are model coefficients
We have investigated whether the age of the tree when the cluster was formed, the number of branches in a cluster, and the maximum branch diameter in the cluster influence the predicted values of cx and c2. However, the results were inconclusive.

Grace et al.—Modelling branch development 403
There are statistical, but not practical, differences between the shapes of this curve for different datasets.
Implementation of Functions 6-9 is illustrated in Fig. 6. The eight branches in the simulated cluster are arranged in a helix with 137.5° between successive branches and with the largest at the top. Casual examination would suggest no pattern in branch location and size.
FIG. 6-Model output, showing arrangement of branches in a cluster. Dark line = simulated stem pith.
Branch development over time
Function 10 Branch diameter at any age.
Branch diameter adjacent to the stem increases rapidly for the first few years and then remains approximately constant (Brown 1962). Our data have confirmed this (Fig. 7).
Initial attempts to develop a function to predict branch diameter increment from current branch diameter and branch age were unsuccessful. We therefore developed a function that predicted branch diameter, adjacent to the stem, as a function of age and the maximum diameter attained. Branch diameter decreases slightly after the maximum has been reached, due to the stem growing over a tapering branch. The form of the model equation incorporates this phenomenon.
UD=Ab/(d] x UI?^x + d3xUir^xxAh + d4xUDtxxA0h
5)

404 New Zealand Journal of Forestry Science 29(3)
FIG. 7—Branch development over time.
where: Ah is the age of the branch in years UD is the branch diameter (under bark) at age Ah
UDmax is the maximum diameter attained by the branch (under bark). dx— d5 are model coefficients

Grace et al.—Modelling branch development 405
There appears to be little practical difference in the shape of the curve due to tree breed, site, or tree size.
Function 11 The vertical distance between the point of intersection of the branch pith with the stem pith and the position of the branch pith at the stem surface.
Within a cluster, at a given age, the angle between the stem and the upper side of the branch tends to decrease with increasing branch diameter. Observations on sample branches, which had been planed to expose the branch pith, indicated that the angle between the stem and the upper side of a branch is initially small but tends to increase with age (Fig 7). Jacobs (1938) suggested this is due to increasing branch weight. A better understanding of the process is necessary as it is proving difficult to develop a realistic function.
The function currently implemented is:
y = (exx UD%AX x (1 - exp(e3 x Ab))
where: y is the vertical component of the distance between the join of the stem and branch
piths and the current position of the branch pith Ab is the age of the branch UDm2iX is the maximum diameter attained by the branch (underbark) e\—ei are model coefficients
Function 12 The occurrence of bark encasement due to branch mortality.
Branches increase rapidly in diameter for a number of years. This phase of rapid growth is followed by a phase where the branch is alive but diameter remains approximately constant. Bark-encasement occurs after the branch dies.
Analysis of the central North Island data indicated that both the number of years of rapid diameter growth and the number of years that a branch remains alive while diameter remains approximately constant can be predicted as a function of the maximum diameter attained by the branch.
ya=gx xUD^x
yb =yr+ya
where: yr is number of years of rapid diameter growth ya is the number of years that the branch remains alive while its diameter remains
approximately constant yb is the number of years until a branch becomes bark encased due to branch
mortality UDimx is the maximum diameter attained by the branch (under bark)
fbfi> g\> g2> a r e model coefficients
Function 13 The occurrence of bark inclusions above the branch which are not due to mortality.

406 New Zealand Journal of Forestry Science 29(3)
Sometimes bark becomes trapped above a live branch. The amount of bark trapped varies from small patches to a continuous layer along the top surface of the branch and is a common defect in P. radiata.
Personal observations of the planed sample branches indicate that bark inclusion occurs on any large and steeper-angled branch.
As the steepness of a branch (Function 11) is predicted as a function of UDmaX9 it was logical to predict bark inclusion from only UDmax. Analysis indicated that, for a given branch diameter, bark inclusion was unlikely to be influenced by site, stocking, or genotype.
A probability table has been implemented to predict bark inclusion as a function of
W W The model's prediction of the development of an individual branch encased within a segment of the stem is illustrated in Fig. 8. The branch rapidly increases in diameter for the first few years, remains approximately the same size for several more, before becoming bark-encased after death. The paler region at the end of the branch represents bark encasement. The shape and branch angle are clearly visible.
FIG. 8—Model output showing branch development.
MANAGERS PERSPECTIVE Two anticipated forest industry applications for the described branch models are:
• The attachment of virtual branch clusters to virtual stems for input to bucking optimisers, • The inclusion of virtual branches in virtual logs for input to log processing models, such
as sawing simulators.

Grace et al.—Modelling branch development 407
In both applications the decision-support context could be harvest planning, market planning, stand valuation, mill design, or silvicultural policy determination. Every context places different weights on the accuracy of, and the necessity for, each of the various components of the model.
Every context provides different opportunities to collect input data to upgrade, re-parameterise or replace each model component. Internode length is very important in the context of supply to a sawmill producing clear components. In this context, there is likely to be the opportunity to substitute measured cluster positions for Functions 1 and 2. In another example, mean largest branch might be determined via a double sampling scheme in the context of a specific pre-harvest inventory, or predicted from a separate national model when hypothetical silvicultural regimes are being compared.
The branch modelling project has generated independent, empirically derived, functional components which work from readily available inputs. They integrate well with existing stand measurement and growth modelling approaches and are relatively easy to incorporate into different software frameworks. They are individually upgradeable, replaceable, and ultimately disposable. For forest managers, their appeal is not in their biological elegance but in their immediate utility.
CONCLUSION The model forms a logical framework to incorporate our understanding of branch
development. Enhancement of the model is planned. Currently, the prediction of branch diameter is being improved. An increment function that will predict branch growth in response to silviculture is being developed. Most of the other functions will be revisited.
The model has the potential to be a powerful tool for forest managers. The level of detail included enables data files for sawing simulators to be generated and models of wood properties can easily be included.
ACKNOWLEDGMENTS
This research was funded by the Stand Growth Modelling Co-operative and the Foundation for Research, Science and Technology. Thanks are due to M. Budianto for her contribution to the data analysis, and to the many people who have helped with the data collection.
REFERENCES BANNISTER, H.M. 1962: Some variation in the growth pattern of Pinus radiata in New Zealand. New
Zealand Journal of Science 5: 342-370. BOLLMANN, M.P.; SWEET, G.B.I 976: Bud morphogenesis of Pinus radiata in New Zealand: I. The
initiation and extension of the leading shoot of one clone at two sites. New Zealand Journal of Forestry Science 6(3): 376-392.
BROWN, G.S. 1962: Stages in branch development and their relation to pruning. New Zealand Journal of Forestry 8(4): 608-622.
BURDON, R.D. 1994: Annual growth stages for height and diameter in Pinus radiata. New Zealand Journal of Forestry Science 24(1): 11—17. .Pinus radiata. In Last, F.T. (Ed.) "Ecosystems of the World, Vol 19: Tree Crops". Elsevier, Amsterdam, The Netherlands (in press)

408 New Zealand Journal of Forestry Science 29(3)
FIELDING, J.M. 1960: Branching and flowering characteristics of Monterey pine. Forestry and Timber Bureau, Canberra, Bulletin No. 37. 1967: Some characteristics of the crown and stem ofPinus radiata. Forestry and Timber Bureau, Canberra, Bulletin No. 43.
GOULDING, C.J. 1994: Development of growth models for Pinus radiata in New Zealand— Experience with management and process models. Forest Ecology and Management 69: 331— 343.
GRACE, J.C.; PONT, D. 1999: Modelling branch development in radiata pine. Pp. 173-184 in Amaro, A.; Tome, M. (Ed.) "Empirical and Process-based Models for Forest Tree and Stand Growth Simulation". Edi<?oes Salamandra, Lisboa, Portugal.
GRACE, J.C.; BLUNDELL, W.; PONT, D. 1998: Branch development in radiata pine—Model outline and data collection. New Zealand Journal of Forestry Science 28(2): 182—194.
INGLIS, CS.; CLELAND, M.R. 1982: Predicting final branch size in thinned radiata pine stands. New Zealand Forest Service, FRI Bulletin No. 3. 17p.
JACOBS, M.R. 1938: Notes on pruning Pinus radiata, Part I. Observations on features which influence pruning. Commonwealth Forestry Bureau, Canberra, Bulletin No. 23.
MADGWICK, H.A.I. 1994: "Pinus radiata—-Biomass, Form and Growth". Madgwick, Rotorua. 428 p.
MARDIA, K.V. 1972: "Statistics of Directional Data". Academic Press. MINISTRY OF AGRICULTURE AND FORESTRY 1998: "A National Exotic Forest Description as
at 1 April 1997". Wellington. 63 p. PONT, D.: The arrangement and size of branches in within clusters in Pinus radiata (in prep.) RATKOWSKY, D. A. 1990: "Handbook of Nonlinear Regression Models". Marcel Dekker Inc. 241 p. ROUVINEN, S.; KUULUVAINEN, T. 1997: Structure and asymmetry of tree crowns in relation to
local competition in a natural mature Scots pine forest. Canadian Journal of Forest Research 27: 890-902.
SHELBOURNE, C.J.A.; BURDON, R.D.; CARSON, S.D.; FIRTH, A.; VINCENT, T.G. 1986: "Development Plan for Radiata Pine Breeding". Forest Research Institute, Ministry of Forestry, Rotorua. 142 p.
SKATTER, S.; KUCERA, B. 1998: The cause of the prevalent directions of spiral grain patterns in conifers. Trees 12: 265-273.
TODOROKl, C.L. 1991: Development of an automated sawing simulator. New Zealand Journal of Forestry Science 20(3): 332-343. 1997: Developments of the sawing simulation software, AUTOSAW: Linking wood properties, sawing, and lumber end-use. Pp. 241—247 wNepveu, G. (Ed.) "Connection Between Silviculture and Wood Quality Through Modelling Approaches and Simulation Softwares". Equipe de Recherches sur Ia Qualite des Bois, INRA- Nancy, France.
TOMBLESON, J.D.; INGLIS, CS. 1988: Comparison ofradiata pine shelterbelts and plantations. Pp. 261—278 in Maclaren, P. (Ed.) "Proceedings of the Agroforestry Symposium", Rotorua, 24-27 November 1986. New Zealand Forest Service, FRI Bulletin No. 139.
TOMBLESON, J.D.; GRACE, J.C;INGLIS,CS. 1990: Response ofradiata pine branch characteristics to site and stocking. Pp. 229-232 in James, R.N.; Tarlton, G.N. (Ed.) "New Approaches to Spacing and Thinning in Plantation Forestry". New Zealand Ministry of Forestry, FRI Bulletin No. 151.
WHITESIDE, LD. 1982: Predicting radiata pine gross sawlog values and timber grades from log variables. New Zealand Forest Service, FRI Bulletin No. 4. 35 p. 1990: STANDPAK growth modelling system for radiata pine. Pp. 106-111 in James, R.N.; Tarlton, G.N. (Ed.) "New Approaches to Spacing and Thinning in Plantation Forestry". New Zealand Ministry of Forestry, FRI Bulletin No. 151.