modelling h2s dispersion from san jacinto-tizate ... · modelling h 2 s dispersion from san...
TRANSCRIPT

Proceedings World Geothermal Congress 2015
Melbourne, Australia, 19-25 April 2015
1
Modelling H2S Dispersion from San Jacinto-Tizate Geothermal Power Plant, Nicaragua
Mariela A. Aráuz-Torres1,2
, Throstur Thorsteinsson2 and Thrainn Fridriksson
3
1United Nations University, Geothermal Training Programme, Grensasvegur 9, 108 Reykjavik, Iceland
2Environment and Natural Resources & Institute of Earth Sciences, University of Iceland. Sturlugata 7, 101 Reykjavik, Iceland
3Iceland Geosurvey, Grensasvegur 9, 108 Reykjavik, Iceland
Keywords: San Jacinto-Tizate, hydrogen sulphide, dispersion modelling, receptors, ambient air guidelines.
ABSTRACT
One of the main environmental concerns during the operation of geothermal power plants is related to hydrogen sulphide (H2S)
emissions, which negatively affect the air quality in its environs. National ambient air guidelines for H2S have not been developed
in Nicaragua; hence, project developers voluntarily follow international guidelines for atmospheric concentration and occupational
safety. Solution-mineral equilibria considerations and assumed steam consumption of the 72 MW power plant in San Jacinto-Tizate
were used to constrain the annual H2S emission at 1400 tons/year. Dispersion modelling of the H2S emission from the power plant
was carried out using AERMOD model to predict H2S ground level concentrations in the vicinity of the project. The prevailing
spatial distribution of the plume was to the west of the power plant, spreading towards west-northwest and west-southwest. The
modelling results show that the operation of the San Jacinto-Tizate geothermal power plant does not have significant impact on air
quality of the neighbouring communities, since populated areas are located outside of the predominant plume pathway during the
modelled period January-December 2012. A comparison of the model predictions with measured concentrations averaged over 24
hours within 1.5 km distance from the power plant shows an underestimation of the measured values at most of the monitoring
points, suggesting that the model predictions should be considered indicative rather than accurate. Several sources of uncertainty
that may contribute to this differences were identified, namely the source input data used for modelling, the characteristics of the
location of the control points, the operation conditions of the power plant when the measurements were made as well as the
influence of natural sources of H2S in the measured concentrations. The results, however, provide useful information to analyse the
spatial distribution and the extent of the plume during a given period, and can assist policy makers and project developer to review
and improve the air quality monitoring plans.
1. INTRODUCTION
Nicaragua, the largest country in Central America (129,500 km2), has the greatest potential for developing geothermal resources in
the region (Zúñiga, 2003). Despite the geothermal potential in the country, this renewable energy resource has not been widely
utilised so far. The most significant project in the last decade was the commissioning of a 72 MW Power Plant in the San Jacinto-
Tizate Geothermal field, in north western Nicaragua.
Polaris Energy Nicaragua S.A. (PENSA), subsidiary of Ram Power Corporation, has the concession rights for the development of a
40 km2 area in the San Jacinto-Tizate geothermal field. A 10 MWe power plant with 2x5 MW back pressure units was operated
from June 2005 to April 2012. The project expansion works began in 2008 for a new 2x36 MW condensing units power plant. In
December 2012, the installed capacity of the power plant was brought to 72 MWe. To date, full electricity production has not been
reached due to lack of steam and PENSA is currently conducting a remediation program to increase the steam resource of the field
and to bring the total generation to approximately 59 - 63 MW (Ram Power, 2013).
Geothermal fluids naturally contain various non-condensable gases (NCG), which are also naturally vented to the atmosphere
through diffusive gas discharges from areas of natural leakage, including hot springs, fumaroles, geysers, hot pools, and mud pots.
These natural discharges have taken place throughout the history of the Earth and continue today independent of geothermal power
production (Holm et al., 2012).
The amount of gases that are present in the geothermal fluid and which might be emitted to the environment depends on a variety of
factors. The main factors are the resource fluid chemistry, fluid phase (dry steam or liquid), and temperature, but the type of power
plant (back pressure, flash, dry steam, binary, or combined cycle) and the plant characteristics (efficiency and gas abatement
systems) also influence emission levels (Bloomfield et al., 2003). Gas concentrations and compositions cover a wide range, but the
predominant gases are carbon dioxide (CO2) and hydrogen sulphide (H2S). The emissions are mainly from the gas exhausters of the
power station, often discharged through a cooling tower (Hunt, 2000).
In liquid dominated reservoirs, the majority of the gases are dissolved in the fluid in the geothermal system. During utilization and
depressurisation of the geothermal fluid the gases are concentrated in the steam phase and are finally vented out of the condensers
of the turbines to the atmosphere (Gunnarsson et al., 2013). In vapour-dominated fields in which all waste fluids are re-injected,
non-condensable gases in steam are the most important discharges from an environmental perspective (Hunt, 2000). The gas
emission inevitably affects the air quality around the power plants as the concentration of the geothermal gases increases. Under
certain weather conditions and if good distribution of the gases at the disposal site is not secured, the gases can affect air quality
tens of kilometres from the power plant site (Gunnarsson et al., 2013; Thorsteinsson et al., 2013).
Studies on H2S emissions to the atmosphere have been made in many geothermal areas around the world. In some countries with
extensive geothermal development and utilisation, H2S emissions have posed the utmost environmental concern. The studies have
shown that after the development of geothermal areas, the air quality has been negatively affected in nearby towns and villages (e.g.

Aráuz-Torres et al.
2
Iceland and New Zealand). As a result new regulations on atmospheric concentration of H2S have been set and the geothermal
industry is required to lower gas emission from geothermal power plants, focusing on H2S abatement (Gunnarsson et al., 2013).
Hydrogen sulphide is heavier than air and it can accumulate in closed and/or depressed areas. Some of the fatal incidents with
volcanic gases have been attributed to the effect of H2S released by low temperature fumarolic vents or by gas bubbling through
thermal springs (D’Alessandro, 2006). H2S is both an irritant and asphyxiate gas. Levels of up to 20 ppm have generally no effects
on healthy people while for asthmatic persons this level has to be reduced to 2 ppm (WHO, 2003). Concentrations above 20 ppm
may irritate the eyes and respiratory tract, above 50-100 ppm neurotoxic effects appear and 500-1000 ppm are considered of
immediate life danger (WHO, 2003). Although the human odour threshold is very low (0.02 ppm), at a concentration of 150 ppm it
leads to loss of smell.
In the San Jacinto-Tizate geothermal field in Nicaragua, a moderate low gas concentration in the steam has been reported (CNE,
2001; IDB, 2010). Ambient air concentrations of H2S in the range of 0.001-0.02 ppm averaged over 24 hours have been reported in
the vicinity of the power plant site (PENSA, 2012); however, studies on the dispersion and spatial distribution of the emissions
have not been carried out to date.
Many countries do not have ambient air quality guidelines for H2S, as it is not perceived as a problem in most regions (IVHHN,
2014). The ambient air standards are generally health-based guideline values to protect people's health and well-being. The World
Health Organization (WHO) Air Quality Guidelines set an ambient air value of 150 µg/m3 averaged over 24 hours and also gives a
value for smell to become a nuisance at 7 μg/m3 over at 30 minute average. Likewise, occupational exposure standards provide
threshold limits for chemical substances in the working environment based on health effects safety guidelines. International
occupational exposure limits for H2S averaged over 8 hours vary from 7100 - 14200 µg/m3, European Commission (2009) and
ACGIH (2009) respectively.
In Nicaragua, a national ambient air guideline for H2S has not been developed so far, hence project developers are encouraged to
follow international standards, usually the WHO guidelines. With the recent change of technology and increased installed capacity
of the San Jacinto-Tizate power plant, concerns about the effects of the H2S emissions on air quality in the area have arisen.
Villages located near the San Jacinto-Tizate project may be exposed to H2S ambient air concentrations due to emissions from the
power plant; however this has not been yet studied in relation to the extents and relevance of the impacts. To date, the only
background data on air quality in the area consist of reports prepared by the project developer PENSA, based on limited air quality
monitoring carried out at the project site twice a year since 2006.
Dispersion software based on Gaussian plume equation has been widely applied to estimate the dispersion of various air pollutants
(Seangkiatiyuth et al., 2011; Thorsteinsson et al., 2013). The present study attempts to identify the temporal and spatial distribution
of H2S emissions from the San Jacinto-Tizate power plant through a dispersion model (AERMOD) and the question of whether the
concentration of H2S in the vicinity of the geothermal power plant could exceed ambient air standards when the it operates at full
load is addressed.
2. STUDY AREA
2.1 Location and Site Description
The San Jacinto-Tizate geothermal field is located in the municipality of Telica, Department of León, Nicaragua. The geothermal
concession covers an area of 40 km2 with an estimated potential of 200 MW. The project site is concentrated in the eastern sector of
the concession, encompassing an area of about 4 km2 at an elevation about 150 to 200 m.a.s.l.
The San Jacinto village is located about 2 km to the south of the project site (Figure 1), with an estimated population of 1,400
inhabitants and isolated from the project area by low hills. Four settlements dispersed into small dwellings are found in the eastern
sector of the concession area: El Chorro with a population around 245 inhabitants, El Apante Central with 401 inhabitants, La Cruz
del Apante with 243 inhabitants and El Ojochal de Liston with 128 inhabitants (IDB, 2010). Sparse subsistence farming and low-
scale non-intensive livestock activities prevail in the area.
The geothermal concession overlaps with a protected area; the Volcanic Complex Telica-Rota Nature Reserve, mainly located in
the western sector of the concession. The Reserve area is delimited in the 300 m elevation contour line, covering an area of
approximately 9,053 ha. It has been classified within Category IV in the International Union for Conservation of Nature (IUCN),
which management approach is to maintain, conserve and restore species and habitats in areas that have already undergone
substantial modification, necessitating protection of remaining fragments, with or without intervention (IUCN, 2014).
The project site is located in highly intervened fragmented dry habitat, which is sparsely inhabited. No threatened or endangered
species have been documented in the area (PENSA, 2008). A large part of the vegetation in the vicinity of the project has been
extremely modified by agriculture activities, cattle grazing and firewood extraction. A substantial part of the area is covered by
pasture land. There are abundant grazing lands, vast prairies, and thin forests with somewhat dense tree patches (4 - 10 m in height),
where caducifolias or subcaducifolias prevail. Arboreal species are limited to more elevated zones in the volcanic complexes and in
in areas with high geothermal activity, the vegetation is scarce (IDB, 2010). Throughout the concession area, natural geothermal
manifestations such as fumaroles, mud pools and hot springs are found.

Aráuz-Torres et al.
3
Figure 1: Location and features of the San Jacinto-Tizate geothermal concession area.
2.2 Geological Settings
The San Jacinto-Tizate geothermal field is located in north-western Nicaragua. The geological and tectonic history of the western
region has been related to the geodynamic evolution of the pacific continental margin, characterized by subduction of the Cocos
Ocean plate beneath the Caribbean Continental Plate (CNE, 2001)
The surface geology of San Jacinto largely consist products from the surrounding volcanic centres of Telica, Santa Clara and Rota,
which overlie a suite of older volcanic and epiclastic rocks that are locally intruded by porphyritic diorites. Similarly, extrusive
volcanic rocks (lavas and tuffs) and related breccias, mainly of andesitic composition, with some intercalated volcanogenic
sediments and intrusive diorites have been largely encountered in wells (White et al., 2008).
The geological succession of the field consists mostly of igneous, pyroclastic and intrusive rocks of basic-to-intermediate
composition and sedimentary deposits of primary volcanic origin. The age of the rocks varies from late Miocene to Holocene.
Different stratigraphic units have been identified, including pyroclastic-effusive units of the recent San Jacinto, Santa Clara and
Rota volcanoes, a late Pleistocene unit of the El Chorro-Tizate volcano, the extrusive domes of Ignacio del Bosque, proluvial
sediments of the San Jacinto Depression, and other units encountered only in the deep wells (Spektor, 1994).
2.2.1 Alteration Mineralogy
The hydrothermal alteration produces different alteration mineral assemblages in the rock at progressively increasing temperatures
in the geothermal system. In the San Jacinto-Tizate geothermal field, hydrothermal alteration has been studied based on
examination of drill cuttings. Depth-mineral zonation, which reflects the temperature stability of the hydrothermal minerals, is
displayed at San Jacinto-Tizate in agreement with typically observed in high temperature geothermal systems.
According to White et al. (2008), five alteration assemblages have been identified in the wells drilled in San Jacinto-Tizate,
although only three of these are common. With increasing depth from surface, these are:
1. Argillic: smectite and interlayered clays (chlorite-smectite and illite-smectite) are accompanied by zeolites (clinoptilolite,
chabazite, epistilbite/heulandite, stilbite/mordenite), quartz, pyrite, iron oxides, calcite and chlorite, with rare opal and cristobalite.
The zeolites are more or less zoned according to their temperature ranges in the shallower sections.
2. Mixed argillic-prophylitic: epidote is typically encountered at a depth of about 400-600 m, before illite replaces interlayered
clays, meaning that instead of a purely phyllic zone, there is a zone of mixed argillic and prophylitic minerals.
3. Prophylitic: epidote is accompanied by minerals such as illite, laumontite, wairakite, adularia, prehnite, quartz, chlorite, calcite
and pyrite.
4. High temperature prophylitic: rare amphibole, indicative of higher temperatures, occurs at depth in SJ9-2.
5. Contact metamorphic: minor biotite, amphibole and garnet were observed adjacent to diorite in SJ10-1.
Petrographic studies reveal disequilibrium mineral assemblages in all of the wells examined to date, with the coexistence of epidote
with interlayered illite-smectite being one of the most obvious signs. This indicates that reservoir conditions have fluctuated over
time (White et al., 2008). The relatively low calcite content compared with the common presence of zeolites is consistent with low

Aráuz-Torres et al.
4
gas in the deep fluids, while the general absence of minerals such as alunite indicates that acid fluids are restricted in their
distribution, if they occur at all in this part of the system (White et al., 2008). From the hydrothermal minerals reported in San
Jacinto-Tizate geothermal system, of outmost interest to this study is the alteration minerals involved in controlling the activity of
dissolved gases. In the case of H2S these are: epidote, quartz, prehnite, pyrite, pyrrhotite, wollastonite, anhydrite and magnetite.
Epidote (Ca2 (Al, Fe)3 Si3 (OH)) is a common mineral in geothermal reservoirs, being recognized as a key index mineral related to
temperature, permeability, and fluid composition (Bird and Spieler, 2004). In well SJ9-2 at San Jacinto-Tizate, epidote is first
identified at 600 m depth, increasing in abundance below 921 m depth. Epidote is usually associated with wairakite and quartz
(Quintero-Roman, 2010). The composition of epidote in active geothermal systems indicates a near complete solid solution
between clinozoisite (Ca2Al3Si3(OH)) and epidote (Ca2Al2FeSi3(OH)), involving substitution of Fe3+ for Al3+ on one of the three
octahedral sites. The Fe end-member (Ca2Fe3Si3(OH)) is referred to as pistachite and the composition of epidote minerals is
commonly expressed in terms of mole fraction of pistachite (Xps) which is defined as:
(1)
Epidote composition in the San Jacinto-Tizate geothermal field has not been reported to date.
Quartz (SiO2) is commonly reported in all wells and through all depths. In well SJ9-2 quartz first appears around 129 m depth, as a
small crystal (≥160-190°C). With increasing depth it occurs as euhedral and anhedral crystals, often replacing other minerals
especially plagioclase or zeolite. It also occurs as vesicles fillings or as fine veins. In thin sections quartz is associated with epidote,
calcite, wairakite and clay (Quintero-Roman, 2010).
Prehnite (Ca2Al2Si3O10(OH)) commonly occurs as a secondary mineral in basalts and related rocks. In well SJ9-2 at San Jacinto-
Tizate appears as a small crystal at 681 m, where it is associated with epidote, being scarce in the entire well (Quintero-Roman,
2010). Prehnite is a common mineral in geothermal fields, where it generally forms at temperatures between 250 and 350°C (Bird
et al., 1984). Prehnite composition depends on the substitution of ferric iron (Fe3+) for aluminium (Al3+) in the octahedral sites,
defined as moles of Fe 3+ per formula unit equivalent XFe, preh=nFe. The composition of prehnite in San-Jacinto Tizate geothermal
field is unknown.
Pyrite (FeS2) has been reported at different depths in well SJ9-2. The stratigraphy in the well consists primarily of interlayered
andesitic lavas and tuffs, where pyrite is observed disseminated in the rock and also filling vesicles and veins (Quintero-Roman,
2010).
Anhydrite (CaSO4) is a common mineral in saline geothermal areas or in sedimentary hosted geothermal system where inflow of
fluid with a saline composition commonly results in the precipitation of anhydrite. This mineral was rare in SJ9-2, just observed in
thin sections at 600 m and 1350 m depth (Quintero-Roman, 2010).
The hydrothermal minerals wollastonite (CaSiO3), pyrrhotite (FeS) and magnetite (Fe3O4) have not been reported in wells from San
Jacinto-Tizate.
2.2.2 Geochemistry
According to data from well testing and gas chemistry, the San Jacinto-Tizate is a liquid-dominated reservoir with outflows of
steam and water to surface thermal areas (CNE, 2001). The deep fluid from the reservoir has been sampled from production wells,
reporting a slightly alkaline, medium salinity, Na-Cl waters (CNE, 2001; White et al., 2008). The chemistry of the wells is quite
uniform, with calculated reservoir chloride concentrations falling in a range of 1,800 to 2,400 ppm and approximately neutral pH,
typical of high temperatures hydrothermal systems developed in young volcanic rocks (CNE, 2001).
The composition of the gas dissolved in the deep liquid is represented by 95% in volume of CO2 and 1% - 5% in volume of H2S.
The proportion of gases in the steam is of approximately 0.5% to 1.5% in weight, and the concentration of H2S in the steam is
approximately 300 to 600 ppm in weight (CNE, 2001). The gas content in the steam from San Jacinto-Tizate reservoir has also
been reported by IDB (2010), presenting a moderate low concentration (in production to date) with measured amounts of 0.45% in
weight, from which only about 8% is H2S. This represents an H2S concentration of about 360 ppm in the steam.
3. CONSTRAINTS ON THE H2S EMISSION OF THE SAN JACINTO-TIZATE GEOTHERMAL POWER PLANT
Detailed information on the concentration of dissolved gases in the steam from the San Jacinto-Tizate geothermal field was not
available for this study nor was the steam flow from wells and geochemistry of the deep liquid in the geothermal system. Therefore
an alternative method for estimating the content of dissolved gases in the geothermal fluid was used, being the gas of interest
hydrogen sulphide (H2S). The known installed capacity of the power plant (72 MW) and its estimated efficiency (in terms of MW
per kg of steam) was used to estimate the steam flow. Mineral equilibrium considerations in the geothermal system were used to
assess the H2S concentration in the steam.
3.1 Approach
Fluids from geothermal systems contain dissolved gases, such as CO2, H2S, H2, N2, CH4 and Ar. The concentration of individual
gases varies depending on geological settings, temperature and composition of the geothermal reservoir (Gunnarsson et al., 2013).
Recent studies have successfully demonstrated that the gas concentration in geothermal well discharges is controlled by
temperature-dependent equilibria between alteration minerals in the reservoir rock and gas concentration or gas ratios in the
producing aquifer (Arnórsson and Gunnlaugsson, 1985). A similar approach is used to estimate H2S gas concentration in the deep
liquid from the San-Jacinto Tizate geothermal system, given the alteration mineralogy and temperature reported for this geothermal
field.
Aráuz-Torres et al.
5
Karingithi (2002) studied the state of equilibrium between the reactive gases and selected hydrothermal mineral buffers in the
liquid-dominated, volcanic geothermal system Olkaria in Kenya. Subsequently, Karingithi et al. (2010) used chemical
geothermometers to evaluate which processes controlled the aquifer fluid compositions in the same geothermal system. The
approach largely focused on minerals that constitute assemblages that potentially could control the aquifer liquid water
concentration of the reactive gases, CO2, H2S and H2. González-Contreras (2010) analysed secondary mineral assemblages that
could be involved in controlling the concentration of components present in the fluid such as CO2, H2S and H2 in the Reykjanes
Geothermal system, SW Iceland. In this study, the control of mineral buffers on the gas chemistry in the geothermal fluid was
analysed, determining trends of gas concentration as a function of temperature.
Here the activity of dissolved H2S in the deep geothermal liquid from the San Jacinto-Tizate geothermal system is predicted
assuming equilibrium with the mineral assemblages proposed by González-Contreras (2010) and Karingithi et al. (2010), as
follows: pyrite, pyrrhotite, prehnite and epidote; pyrite, pyrrhotite and magnetite; wollastonite, pyrite, anhydrite, quartz and
magnetite; prehnite, pyrite, clinozoisite, anhydrite, quartz and magnetite.
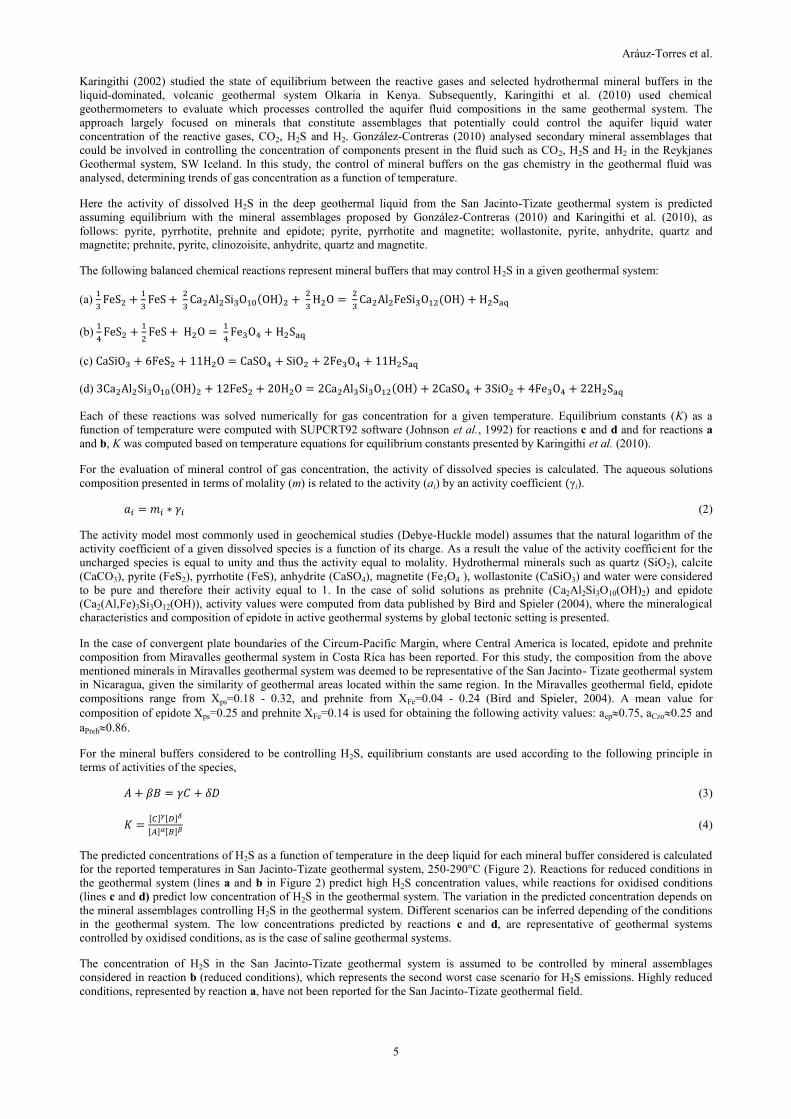
The following balanced chemical reactions represent mineral buffers that may control H2S in a given geothermal system:
(a)
( )
( )
(b)
(c)
(d) ( ) ( )
Each of these reactions was solved numerically for gas concentration for a given temperature. Equilibrium constants (K) as a
function of temperature were computed with SUPCRT92 software (Johnson et al., 1992) for reactions c and d and for reactions a
and b, K was computed based on temperature equations for equilibrium constants presented by Karingithi et al. (2010).
For the evaluation of mineral control of gas concentration, the activity of dissolved species is calculated. The aqueous solutions
composition presented in terms of molality (m) is related to the activity (ai) by an activity coefficient (γi).
(2)
The activity model most commonly used in geochemical studies (Debye-Huckle model) assumes that the natural logarithm of the
activity coefficient of a given dissolved species is a function of its charge. As a result the value of the activity coefficient for the
uncharged species is equal to unity and thus the activity equal to molality. Hydrothermal minerals such as quartz (SiO2), calcite
(CaCO3), pyrite (FeS2), pyrrhotite (FeS), anhydrite (CaSO4), magnetite (Fe3O4 ), wollastonite (CaSiO3) and water were considered
to be pure and therefore their activity equal to 1. In the case of solid solutions as prehnite (Ca2Al2Si3O10(OH)2) and epidote
(Ca2(Al,Fe)3Si3O12(OH)), activity values were computed from data published by Bird and Spieler (2004), where the mineralogical
characteristics and composition of epidote in active geothermal systems by global tectonic setting is presented.
In the case of convergent plate boundaries of the Circum-Pacific Margin, where Central America is located, epidote and prehnite
composition from Miravalles geothermal system in Costa Rica has been reported. For this study, the composition from the above
mentioned minerals in Miravalles geothermal system was deemed to be representative of the San Jacinto- Tizate geothermal system
in Nicaragua, given the similarity of geothermal areas located within the same region. In the Miravalles geothermal field, epidote
compositions range from Xps=0.18 - 0.32, and prehnite from XFe=0.04 - 0.24 (Bird and Spieler, 2004). A mean value for
composition of epidote Xps=0.25 and prehnite XFe=0.14 is used for obtaining the following activity values: aep0.75, aCzo0.25 and
aPreh0.86.
For the mineral buffers considered to be controlling H2S, equilibrium constants are used according to the following principle in
terms of activities of the species,
(3)
[ ] [ ]
[ ] [ ] (4)
The predicted concentrations of H2S as a function of temperature in the deep liquid for each mineral buffer considered is calculated
for the reported temperatures in San Jacinto-Tizate geothermal system, 250-290°C (Figure 2). Reactions for reduced conditions in
the geothermal system (lines a and b in Figure 2) predict high H2S concentration values, while reactions for oxidised conditions
(lines c and d) predict low concentration of H2S in the geothermal system. The variation in the predicted concentration depends on
the mineral assemblages controlling H2S in the geothermal system. Different scenarios can be inferred depending of the conditions
in the geothermal system. The low concentrations predicted by reactions c and d, are representative of geothermal systems
controlled by oxidised conditions, as is the case of saline geothermal systems.
The concentration of H2S in the San Jacinto-Tizate geothermal system is assumed to be controlled by mineral assemblages
considered in reaction b (reduced conditions), which represents the second worst case scenario for H2S emissions. Highly reduced
conditions, represented by reaction a, have not been reported for the San Jacinto-Tizate geothermal field.
Aráuz-Torres et al.
6
Figure 2: H2S gas concentration in the deep liquid as a function of temperature for theoretical mineral equilibrium, where
lines a and b represent reduced conditions and lines b and c, oxidised conditions.
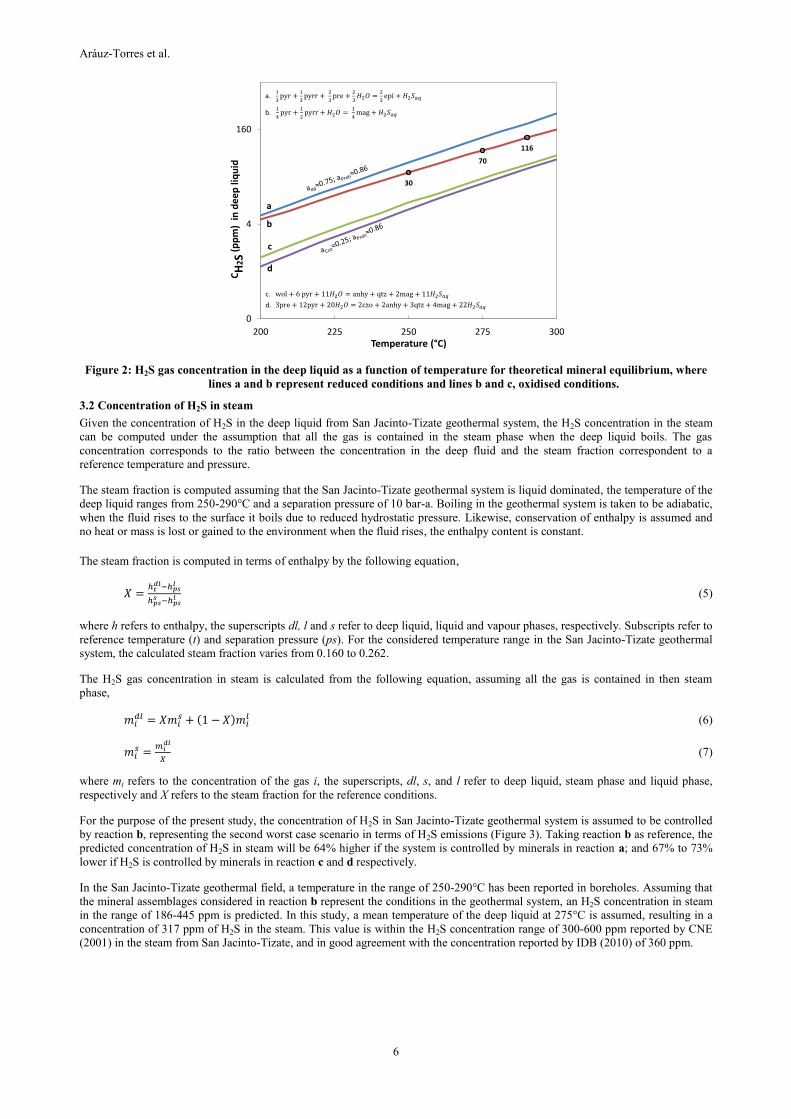
3.2 Concentration of H2S in steam
Given the concentration of H2S in the deep liquid from San Jacinto-Tizate geothermal system, the H2S concentration in the steam
can be computed under the assumption that all the gas is contained in the steam phase when the deep liquid boils. The gas
concentration corresponds to the ratio between the concentration in the deep fluid and the steam fraction correspondent to a
reference temperature and pressure.
The steam fraction is computed assuming that the San Jacinto-Tizate geothermal system is liquid dominated, the temperature of the
deep liquid ranges from 250-290°C and a separation pressure of 10 bar-a. Boiling in the geothermal system is taken to be adiabatic,
when the fluid rises to the surface it boils due to reduced hydrostatic pressure. Likewise, conservation of enthalpy is assumed and
no heat or mass is lost or gained to the environment when the fluid rises, the enthalpy content is constant.
The steam fraction is computed in terms of enthalpy by the following equation,
(5)
where h refers to enthalpy, the superscripts dl, l and s refer to deep liquid, liquid and vapour phases, respectively. Subscripts refer to
reference temperature (t) and separation pressure (ps). For the considered temperature range in the San Jacinto-Tizate geothermal
system, the calculated steam fraction varies from 0.160 to 0.262.
The H2S gas concentration in steam is calculated from the following equation, assuming all the gas is contained in then steam
phase,
( ) (6)
(7)
where mi refers to the concentration of the gas i, the superscripts, dl, s, and l refer to deep liquid, steam phase and liquid phase,
respectively and X refers to the steam fraction for the reference conditions.
For the purpose of the present study, the concentration of H2S in San Jacinto-Tizate geothermal system is assumed to be controlled
by reaction b, representing the second worst case scenario in terms of H2S emissions (Figure 3). Taking reaction b as reference, the
predicted concentration of H2S in steam will be 64% higher if the system is controlled by minerals in reaction a; and 67% to 73%
lower if H2S is controlled by minerals in reaction c and d respectively.
In the San Jacinto-Tizate geothermal field, a temperature in the range of 250-290°C has been reported in boreholes. Assuming that
the mineral assemblages considered in reaction b represent the conditions in the geothermal system, an H2S concentration in steam
in the range of 186-445 ppm is predicted. In this study, a mean temperature of the deep liquid at 275°C is assumed, resulting in a
concentration of 317 ppm of H2S in the steam. This value is within the H2S concentration range of 300-600 ppm reported by CNE
(2001) in the steam from San Jacinto-Tizate, and in good agreement with the concentration reported by IDB (2010) of 360 ppm.
30
70
116
0
4
160
200 225 250 275 300
CH
2S
(pp
m)
in d
ee
p li
qu
id
Temperature (°C)
c
d
b
a
a.
b.
c.
d

Aráuz-Torres et al.
7
Figure 3: H2S concentration in the steam from San Jacinto-Tizate geothermal system, where lines a and b represent
reduced conditions and lines b and c, oxidised conditions.
3.3 Hydrogen Sulphide Emissions
The known installed capacity of the power plant (72 MW) and its estimated efficiency (in terms of MW per kg of steam) is used to
estimate the steam flow. Given the concentration of H2S of 317 ppm in the steam and a steam consumption of 2 kg/s per MW in a
standard condensing turbine (Dickson and Fanelli, 2004), the H2S emissions from San Jacinto-Tizate power plant when it operates
at full load for a whole year was estimated as 1400 tons/year.
4. DISPERSION MODELLING
4.1 Meteorological Data
Hourly measurements of wind speed, wind direction, air temperature, pressure, relative humidity and precipitation from the weather
station run by the project developer, PENSA in the San Jacinto-Tizate geothermal power plant site were obtained for the period
January 2012 to June 2013. Daytime cloud cover reports for the same period were obtained from León weather station (code
64043), run by Nicaraguan Institute for Territorial Studies (INETER) 22 km west of the project site. Night time cloud cover was
estimated using a linear interpolation function available within R statistic software (R Core Team, 2013).
Easterly winds were identified in the project area (Figure 4), with prevailing ENE (15.6% of the time), E (14%) and SSW (13.7%)
winds with a mean wind speed of 3 ± 2 m/s. The average air temperature reported is 27 ± 3°C and the average relative humidity
(RH) 63 ± 16%.
Figure 4: Wind Rose for the SJT Weather Station January-December 2012.
4.2 AERMOD Model
AERMOD software for atmospheric dispersion modelling was used to predict the H2S concentrations in the vicinity of San Jacinto-
Tizate Geothermal Power Plant. AERMOD is a steady-state Gaussian plume model designed to estimate the near-field (less than 50
km) concentration of air pollutants. The model runs with a minimum of observed meteorological parameters and treats both surface
and elevated sources on simple and complex terrain (Cimorelli et al., 2004).
AERMOD input data is prepared from output files from AERMET and AERMAP, its meteorological and terrain pre-processors.
AERMET uses meteorological data and surface characteristics to calculate boundary layer parameters (e.g. mixing height, friction
186
317
445
10
100
1000
200 225 250 275 300
CH
2S
(pp
m)
in s
team
at
10
bar
a
Temperature (°C)
b
a
c
d
a.
b.
c.
d
NORTH
SOUTH
WEST EAST
4%
8%
12%
16%
20%
WIND SPEED
(m/s)
>= 11,1
8,8 - 11,1
5,7 - 8,8
3,6 - 5,7
2,1 - 3,6
0,5 - 2,1
Calms: 0,19%
NORTH
SOUTH
WEST EAST
4%
8%
12%
16%
20%
WIND SPEED
(m/s)
>= 11,1
8,8 - 11,1
5,7 - 8,8
3,6 - 5,7
2,1 - 3,6
0,5 - 2,1
Calms: 0,19%

Aráuz-Torres et al.
8
velocity, etc.) needed by AERMOD. AERMAP uses gridded terrain data to calculate a representative terrain-influence height and
elevation for each receptor. The input data for AERMAP was supplied in the format of a Digital Elevation Model (DEM) with a
resolution of 30 m of posting interval and 7-14 m accuracy downloaded from ASTER GDEM.
Time series of weather parameters (hourly surface observations) were input to AERMET meteorological pre-processor and upper
air data (vertical temperature gradient and wind profile) was computed by the upper air estimator within AERMET, based on hourly
surface data. The surface parameter coefficients (albedo, Bowen ratio and surface roughness) for AERMET meteorological pre-
processor were set to summer conditions for both wet and dry season model simulations of the climate in Nicaragua, considered the
closest analogue for seasonal conditions in the US and Canada, where the model was developed. Variable surface roughness
parameters were used based on the land cover around the SJT weather station. The Wieringa- Davenport roughness classification
(Wieringa, 1992) was used as reference for selecting the values to use within AERMET options. The classification used was
“Roughly open” (z0 = 0.1 m) for cultivated areas with low crops or plant covers, “Rough” (z0 = 0.2 m) for cultivated areas with
crops of varying heights and “Very rough” for areas with clumps of trees and bush land (z0 = 0.8 m).
AERMOD also incorporates the buildings downwash effect in the modelling results. The movement of air over and around
buildings generates areas of flow circulation, which can lead to increased ground level concentrations in the building wakes (RPS,
2009). In the San Jacinto-Tizate project area, the only buildings likely to affect dispersion are the power house and the cooling
towers’ own structure. Rectangular buildings were selected to represent the layout of the power plant, using a dimension (L, W, H)
of 74.7 x 18.7 x 12 m for the cooling towers and 77.8 x 32 x 16 m for the powerhouse.
Discrete Cartesian receptors and uniform Cartesian grids were defined within the modelling domain to identify areas of maximum
predicted H2S concentrations. Populated areas in the vicinity of San-Jacinto Tizate power plant were set as discrete receptors, as
well as control points defined in agreement with points from the air quality monitoring program implemented by PENSA.
In the San Jacinto-Tizate geothermal power plant, the H2S emissions are made through the cooling towers. The NCG are discharged
below the cooling tower fans to ensure mixing with the air and steam as it is blown high into the atmosphere. The H2S is then
mixed in the plume emitted through five closely spaced outlets in the cooling tower. There is a cooling tower for each 36 MW
condensing unit in San Jacinto-Tizate Power Plant. The cooling tower outlets are modelled as one point source with a combined
area of all five outlets with the characteristics shown in Table 1. Based on preliminary design parameters of the San Jacinto-Tizate
power plant, the gas temperature used is the steam temperature in the cooling tower exhaust (~40°C) and the gas exit velocity was
estimated from the airflow through the cooling tower based on a simplified scheme of the cooling needs in the system (condenser-
cooling tower).
Table 1: Source Input Data for AERMOD
SJT Power Plant 6-7 June 2013 Full year
Electricity generation (MW) 59 72
Emission rate (g/s) 37.3 45.5
Number of stacks 2 2
Base elevation (m.a.s.l.) 185 185
Release Height (m) 14 14
Gas exit velocity (m/s) 3 3
Gas exit temperature (°C) 40 40
Stack inside diameter (m) 24.6 24.6
4.3 Modelling Results
Two different periods were modelled in AERMOD. The first one considering the San Jacinto-Tizate power plant operating at full
load (72 MW) for a whole year, using meteorological data from the period January-December 2012. The second one represents a
short period on 6-7 June 2013 which was modelled in agreement with the H2S monitoring dates in the project area by PENSA.
4.3.1 Annual Average
The dispersion of the H2S emission from the San Jacinto-Tizate power plant operating at full load for a whole year was modelled in
AERMOD. In the model, long-term averages do not include calm winds or missing hours in the calculations. The annual average is
the sum of the concentrations from the non-calm/non-missing hours divided by the number of non-calm/non-missing hours.
The modelling showed that the highest concentrations are to be expected in the immediate vicinity of the power plant (Figure 5).
The maximum concentration predicted was 116µg/m3 and occurs next to the power plant building. The San Jacinto village and
other smaller settlements are located outside of the plume pathway, except for few isolated dwellings or farms located in the places
identified as Receptor A, Los Prados and El Ojochal del Listón.

Aráuz-Torres et al.
9
Figure 5: Annual average H2S concentration for the modelled conditions in 2012
4.3.2 Highest 24 Hour Average
The short term average results from AERMOD represent the highest concentrations reported by receptor for the averaging period.
The contours are based in the highest 24h average concentration by receptor, occurring at different times for different locations.
The spatial distribution of the plume for 24h averaging time extends over a wider area than the annual average, including populated
places, where H2S concentrations up to 50 µg/m3 are predicted (Figure 6). The highest concentration occurs about 1.2 km west from
the source, and also near the power plant building, where a peak value of 1462.2 µg/m3 is predicted on 7 March, 2012. In these
places, the WHO ambient air guideline of 150 µg/m3 averaged over 24 h is greatly exceeded.
The number of times that the WHO ambient air guideline is exceeded in a year is also predicted by AERMOD. According to the
model, the guideline value is exceeded at least 1-5 times within a distance about 1 km from the power plant in the W, WNW and
WSW direction. In the immediate vicinity of the power plant the guideline value is exceeded numerous times, predicting up to 77
times next to the exhaust from the cooling towers.
Figure 6: Highest H2S 24 hour average concentration at any given location for the modelled year 2012

Aráuz-Torres et al.
10
4.3.3 Highest 8 Hour Average
The highest concentration in an 8 hour averaging time was also modelled. The results show that the concentration can reach really
high levels in the immediate vicinity of the power plant, reporting a peak value of 2382 µg/m3 on 7 March, 2012 from 16:00-00:00,
located in between the Power House building and the Cooling Tower 1 structure (Figure 7). In most of the populated places the H2S
concentration ranges from 10-150 µg/m3. The 8 h average concentration is mainly used for occupational safety purposes, where the
exposure limit may vary from 7100 - 14200 µg/m3 (European Commission and ACGIH respectively). None of these exposure
limits for 8-hour averaging period is exceeded in the study area.
Figure 7: Highest H2S 8 hour average concentration at any given location for the modelled year 2012
The location of maximum concentrations for all the modelled averaging periods occurs at the same site, the west sector of the
power plant site. This result is in agreement with the prevailing ENE and E winds in the San Jacinto-Tizate project area. The peak
concentration values occurred in between the Cooling Tower 1 structure and the Power House building for all averaging times. This
can be associated to building downwash effects, since the movement of air over and around buildings generates areas of flow
circulation, which can lead to high ground level concentrations in the building wakes (RPS, 2009).
4.3.4 Comparison of Predicted and Measured Concentrations on 6-7 June 2013
The modelled period for comparing the model predictions started on 19 June at 15:00 and ended on 20 June at 14:00, covering the
same hours considered in the reported averaged concentrations. For these days, the average air temperature was 27 ± 3°C and the
average wind speed was 2 ± 1 m/s, with prevailing SSW (29 % of the time), SSE (21%) and SW (14%) winds.
During the modelled period, the majority of the H2S monitoring/control points were located within the plume (Figure 6a) and the
maximum predicted concentration occurred some 0.3 km WNW from the power plant. The comparison of the measured and
predicted averaged concentrations showed that monitoring points located outside of the modelled plume and close to the edge were
underestimated (Figure 6a and Figure 6b). Some points were fairly predicted (Cooling Tower, Power plant Unit 3 and Unit 4) and
two points located northwest from the power plant (Receptor A and SJ-11) were largely overestimated by the model.
The modelling showed a better agreement with measured concentrations when the monitoring points were located closer to the
source whereas the agreement was generally very poor for points located near the plume edge. However it should be noticed that
the fair prediction of some of the measured values at some monitoring points indicates that assumptions made to constrain the H2S
concentration as well as other source characteristics like emission temperature and velocity are not completely off from real values
but in a range of divergence.
The concentration contours obtained from modelling are certainly a useful visualization tool. It has to be underlined; however, that
a model is a simplification of a complex process in which many factors interact and therefore the results are approximations that
may not accurately reproduce or fit to measured concentrations in a given place.

Aráuz-Torres et al.
11
a b
Figure 6: a) Spatial distribution of the plume on 6-7 June 2013, b) Comparison of predicted and measured concentrations
5. DISCUSSION
The results from modelling show that the operation of the San Jacinto-Tizate geothermal power plant does not significantly affect
the air quality of the neighbouring communities. Populated places are located outside the prevailing plume pathway during the
modelled periods, in agreement with prevailing winds blowing from ENE, E and SSW in the area.
When modelling the San Jacinto-Tizate geothermal power plant operating at full load for a whole year, using weather data from
2012, AERMOD model shows that H2S emission mostly affects the air quality in the immediate vicinity of the power plant. The
plume centreline is oriented towards west, spreading to NW and SW most of the time. The surrounding villages are located outside
of the most common plume pathway, however when modelling a shorter averaging time (8h) over a whole year, concentrations in
the range of 50 -150 µg/m3 are predicted at some populated places.
The WHO ambient air guideline value for H2S (150 µg/m3 averaged over 24 h) is only exceeded within 1.2 km distance from the
power plant in the west direction. Nevertheless, the occupational safety guidelines (7000-14200 µg/m3 averaged over 8 h) are never
exceeded at any location in the study area.
Sensitivity analysis was conducted on two source input parameters, the gas exit velocity and the concentration of H2S in the steam
release from the power plant, the latter based on two possible conditions that could control the H2S concentration in the the
geothermal system. If the concentration of H2S in the geothermal reservoir was controlled by the more reducing reaction a instead
of reaction b, the predicted concentrations at ground level will increase by a constant factor (linear increase) at each receptor or
monitoring point considered, predicting 64% higher values. This however is unlikely to occur in the San Jacinto-Tizate geothermal
reservoir, because the mineral assemblages considered in reaction a represent highly reduced conditions in a geothermal system, a
condition that has not been reported for this geothermal field. When reducing the gas exit velocity from 3 m/s to 2 m/s the predicted
concentrations increased by variable rates, depending of the location of the specific monitoring points. In the case of points located
very close to the source, the predicted concentration increased up to 200% while for points located further away the concentration
increase is about 20-40%.
When comparing the results from AERMOD model with measured averaged concentrations during the period 6-7 June 2013, the
model predicts lower concentrations for the majority of the monitoring points. For two specific points located north from the source
(Receptor A and SJ-11), the model predicted much higher concentrations. Many factors can explain the mismatch in the model
predictions including accuracy of the coordinates of control points in the model, the source input data used, the characteristics of
the location of the control points and the particular operation conditions of the power plant during the air quality monitoring period,
which are unknown. In addition, natural release of H2S from fumaroles in the project area is not accounted for in the model;
although these natural sources can affect the average measured concentrations used for comparison with predicted concentrations
by the model.
To provide a better analysis of the relevance of the model results in relation to measured concentrations, some adjustment in the
input data should be made in accordance to the real operation conditions in the power plant, meaning the use of measured H2S
concentration in the steam and air flow in the cooling towers to compute the exact gas exit velocity. In addition, increasing the
number of monitoring points to cover a wider area in the west direction from the source could provide better background data for
comparison with the modelling results. The current H2S measurements are made at locations aligned to the north and south from the
source, without providing a wider spatial distribution to account for some spreading of the plume.
6. CONCLUSIONS AND RECOMMENDATIONS
The method used to constrain the gas concentration in the geothermal fluid and the emissions from the power plant can be used as
an alternative approach in cases where no reference data is available. The H2S emissions from San Jacinto-Tizate power plant when
it operates at full load for a whole year were estimated as 1400 tons/year. The same approach could be later used for planning
purposes prior to project development in certain areas.

Aráuz-Torres et al.
12
The results from AERMOD modelling for a whole year when the San Jacinto-Tizate power plant operated at full load (72 MW)
shows that H2S concentration at ground level can exceed the WHO ambient air guideline (150 µg/m3 averaged over 24 h) in the
immediate vicinity of the power plant (within 1 km W), but not in populated places and surrounding villages.
When comparing AERMOD predictions with measured H2S concentrations during the period 6-7 June 2013, the model
underestimated the concentrations in most of the monitoring points, except for two points that were greatly overestimated to the
north of the power plant. The discrepancy can be associated to factors like the source input data used for modelling and the
characteristics of the location of the control points, as well as the specific operation conditions of the power plant when the
measurements are done and the influence of H2S natural sources in the reported measured concentration.
To better assess the relevance of the model predictions, additional information is needed along with the measured H2S
concentrations, specially the power plant operation conditions. The modelling could be refined based on reliable data from the San
Jacinto-Tizate Power plant, meaning the composition of the steam as well as the air flow in the cooling towers where H2S is emitted
to the atmosphere. Based on this, a better analysis of correlation between the model predictions and measured concentrations could
be done and additional sources of discrepancies in the results could be identified.
The spatial distribution of the plume was identified predominantly in the W direction of the power plant, spreading towards WNW
and WSW for the modelled periods. The air quality trend in case of future expansion of the power plant could be easily identified
based on the modelling results, as well as the extent of the new impacted area. The most important weather conditions affecting the
modelling results are the wind speed and direction along with the atmospheric stability during different hours of the day.
The results from AERMOD model provide useful information to analyse the spatial distribution and the extent of the plume during
a given period; nevertheless the predicted H2S concentration at specific locations should be considered indicative rather than
accurate predictions of ground level concentrations. The modelling results however can assist policy makers and project developers
to review and propose improvements to the air quality monitoring plans as well as mitigating measures if needed.
The installation of a H2S continuous monitoring station at the project site is highly recommended to document the changes in air
quality in real time. While this measure is not implemented, the air quality monitoring plan of the project should be improved by
increasing the duration and frequency of the monitoring periods.
REFERENCES
ACGIH.: Threshold limit values (TLV) for chemical substance and physical agents and biological exposure indices (BES).
Cincinnati, OH,: American Conference of Governmental Industrial Hygienists (2009).
Arnórsson, S. and Gunnlaugsson, E.: New gas geothermometers for geothermal exploration-calibration and application,
Geochimica et Cosmochimica Acta, 49(6), (1985),1307–1325. doi: http://dx.doi.org/10.1016/0016-7037(85)90283-2
Bird, D. K. and Spieler, A. R.: Epidote in Geothermal Systems, Reviews in Mineralogy and Geochemistry, 56(1), (2004), 235-300.
doi: 10.2138/gsrmg.56.1.235
Bloomfield, K.,Moore, J. and Neilson, R.: Geothermal energy reduces greenhouse gases, GRC Bulletin, Climate Change Research,
March/April,(2003), 77-79.
Cimorelli, A. J.,Perry1, S. G.,Venkatram, A.,Weil, J. C.,Paine, R. J.,Wilson, R. B.,Lee, R. F.,Peters, W. D.,Brode, R. W. and
Paumier, J., O.: AERMOD: description of model formulation, USEPA, (2004).
CNE.: Nicaragua geothermal master plan, Volume I, Report prepared by GeothermEx, (2001).
D’Alessandro, W.: Gas hazard: an often neglected natural risk in volcanic areas, In J. F. Martin-Duque, C. A. Brebbia, D. E.
Emmanouloudis and U. Mander (Eds.), Geo-environment and landscape evolution II, (2006), 369-378. South Hapmpton: WIT
Press.
Dickson, M. H. and Fanelli, M.: Geothermal energy: utilization and technology, United Nations Educational, Scientific and
Cultural Organization, Paris, (2003).
EC Directive.: Commission directive 2009/161/EU, establishing a third list of indicative occupational exposure limit values,
Official Journal of the European Union, (2009), 338/87. Retrieved from www.ohs.co.uk/_images/_uploads/12.pdf.
González-Contreras, A.: Gas geochemistry of Reykjanes geothermal system, South West Iceland, University of Iceland &
University of Akureyri, Akureyri, Iceland, (2010).
Gunnarsson, I., Aradóttir, E. S., Sigfússon, B., Gunnlaugsson, E. and Júlíusson, B.: Geothermal gas emission from Hellisheiði and
Nesjavellir power plants, Iceland, GRC Transactions, 37, (2013), 785-789.
Holm, A., Jennejohn, D. and Blodgett, L.: Geothermal energy and greenhouse gas emissions, Geothermal Energy Association,
Washington DC, (2012).
Hunt, T.: Five lectures on environmental effects on geothermal energy utilization, UNU-GTP, Reports 2000, 1-109, Reykjavık,
Iceland, (2000).
IDB.: San Jacinto-Tizate geothermal power project (NI-L1057), Environmental and Social Management Report, Inter American
Development Bank, (2010).
IUCN.: Gobal protected areas programme, Protected Areas Category V, (2012). Retrieved 05/15/2014 from
http://www.iucn.org/about/work/programmes/gpap_home/gpap_quality/gpap_pacategories/gpap_category5/

Aráuz-Torres et al.
13
IVHHN.: Hydrogen sulphide (H2S), Volcanic Gases and Aerosols Index (2014). Retrieved 05/10/2014 from
http://www.ivhhn.org/index.php?option=com_content&view=article&id=83
Johnson, J. W.,Oelkers, E. H. and Helgeson, H. C. SUPCRT92: A software package for calculating the standard molal
thermodynamic properties of minerals, gases, aqueous species, and reactions from 1 to 5000 bar and 0 to 1000°C, Computers
& Geosciences, 18(7), (1992), 899-947. doi: http://dx.doi.org/10.1016/0098-3004(92)90029-Q
Karingithi, C. W.,Arnórsson, S. and Grönvold, K.: Processes controlling aquifer fluid compositions in the Olkaria geothermal
system, Kenya, Journal of Volcanology and Geothermal Research, 196(1-2), (2010), 57-76. doi:
http://dx.doi.org/10.1016/j.jvolgeores.2010.07.008
PENSA.: Environmental impact assessment (EIA), Technological reconversion in San Jacinto-Tizate for the generation of 72
MWe. Report prepared by CABAL S.A, (2008), in Spanish.
PENSA.: Environmental management report 2012, Unpublished report, Polaris Energy Nicaragua S.A., (2012), in Spanish.
Quintero-Roman, R.: Borehole Geology of Well SJ9-2, San Jacinto-Tizate geothermal field, NW-Nicaragua, UNU-GTP, Reports
2010, 27, (2010), 563-588. Reykjavík, Iceland.
Ram Power, C.: Operational Update. San Jacinto-Tizate Remediation Drilling Program, (2013). Retrieved 01/20/2014 from
http://ram-power.com/sites/default/files/assets/news-documents/Corporate%20Update%20PR%20FINAL_0.pdf
RPS.: Odour and bioaerosol assessment, Integrated waste management facility Old Kent Road, Bermondsey, London, Report
prepared for Veolia ES Southwark Ltd, RPS Planning & Development, (2009).
Spektor, S. V.: Report on geologic map of San Jacinto-Tizate geothermal field, Nicaragua, Intergeoterm, S.A., Unpublished report,
(1994).
R Core Team.: R: A language and environment for statistical computing, R Foundation for Statistical Computing, Vienna, Austria,
(2013).
Thorsteinsson, T.,Hackenbruchb, J.,Sveinbjörnssonc, E. and Jóhannsson, T.: Statistical assessment and modeling ofthe effects of
weather conditions on H2S plume dispersal from Icelandic geothermal power plants, Geothermics, 45, (2013), 31–40.
White, P.,Lawless, J.,Ussher, G. and Smith, A.: Recent results from the San Jacinto-Tizate geothermal field, Nicaragua, New
Zealand Geothermal Workshop, (2008).
WHO.: Hydrogen sulfide: human health aspects, Concise International Chemical Assessment,Geneva, (2003).
WHO.: Air quality guidelines for Europe. Second edition. Copenhagen, Denmark: WHO Regional Office for Europe, (2000).
Wieringa, J.: Updating the Davenport Roughness Classification, Journal of Wind Engineering and Industrial Aerodynamics, 41(1-
3), (1992), 357-368. doi: Doi 10.1016/0167-6105(92)90434-C
Zúñiga, A.: Geothermal Nicaragua. GRC Bulletin, International Geothermal development, (2003), 163-166.