modelling of static and fatigue failure in wind turbine blades using a parametric blade model
DESCRIPTION
Modelling of static and fatigue failure in wind turbine blades using a parametric blade model A G Dutton, M Clarke 1 , P Bonnet 2 Energy Research Unit (ERU) Rutherford Appleton Laboratory (RAL) Science and Technology Facilities Council (STFC) - PowerPoint PPT PresentationTRANSCRIPT

Modelling of static and fatigue failure in wind turbine blades using a parametric blade model
A G Dutton, M Clarke1, P Bonnet2
Energy Research Unit (ERU)Rutherford Appleton Laboratory (RAL)
Science and Technology Facilities Council (STFC)(now at 1Oxford Brookes University and 2SAMTECH Iberica)
Presented at EWEC 2010, Warsaw, 23 April 2010

Background: SUPERGEN Wind
To undertake research to improve the cost-effective reliability & availability of existing and future
large scale wind turbine systems in the UK
Research Themes:– Baselining wind turbine
performance– Drive-train loads and monitoring– Structural loads and materials – Environmental issues

Background: Blade modelling
• Which are the best materials?
• What is the optimum lay-up?
• What is the best internal structure?
• What are the size limits for wind turbine blades?
• What additional stresses do smart control devices generate in a blade?
• How should NDT measurements be interpreted?
Picture credit: LM Glasfiber
Picture credit: EWEA

Parametric blade model:Design strategy
• Parametric processing tool for creation and running of the underlying FE model
• Suitable for sensitivity analyses, flexibility, documenting, re-usability
Python script front end for automation of the Abaqus FE package Modular program Realistic load application, including quasi-static aerodynamic loading Ultimate strength & fatigue analysis Developing dynamic implementation

Parametric blade model:Geometry definition
a b
c d
aerofoil shape
=> parameter sweeps: e.g.
tip d
efle
ctio
nor
max
str
ess
d - shear web offset (mm)

Parametric blade model:Geometry definition

Parametric blade model:Lay-up

Parametric blade model:Fully distrubuted aerodynamic load

Parametric blade model:Variable mesh density...
... at the push of a button

Parametric blade model

5 MW (61 m) blade model
• Basic lay-up information
• Target mass and stiffness distributions
• Limitations of lay-up information• Overall mass
• Discretisation of lay-up info
• Required spar-cap stress profile?
• Lay-up modification
• Materials variation
• Static load case (aerodynamic load distribution)
• Fatigue lifetime

5 MW (61 m) blade model:Spar-cap stress distribution (smoothed)

5 MW (61 m) blade model:Materials
Material property
Baseline UD material
High fatigue strength material
E1T (GPa) 39.0 56.3
E1C (GPa) 38.9 -
ν12 0.29 0.25
E2T (GPa) 14.1 9.0
E2C (GPa) 14.997 -
ν21 0.95036E-01 0.95036E-01
G12 (MPa) 4.24 4.24
Material property
Baseline UD material
High fatigue strength material
XT (MPa) 776.5 1757
XC (MPa) -521.8 -978
YT (MPa) 54 54
YC (MPa) -165 165
S (MPa) 56.1 135.4
Fatigue Baseline UD High fatigue strength
S-n curve at R=0.1
S0 = 1176
b = 9.74
S0 = 1250
b = 10.59bNS1
0max

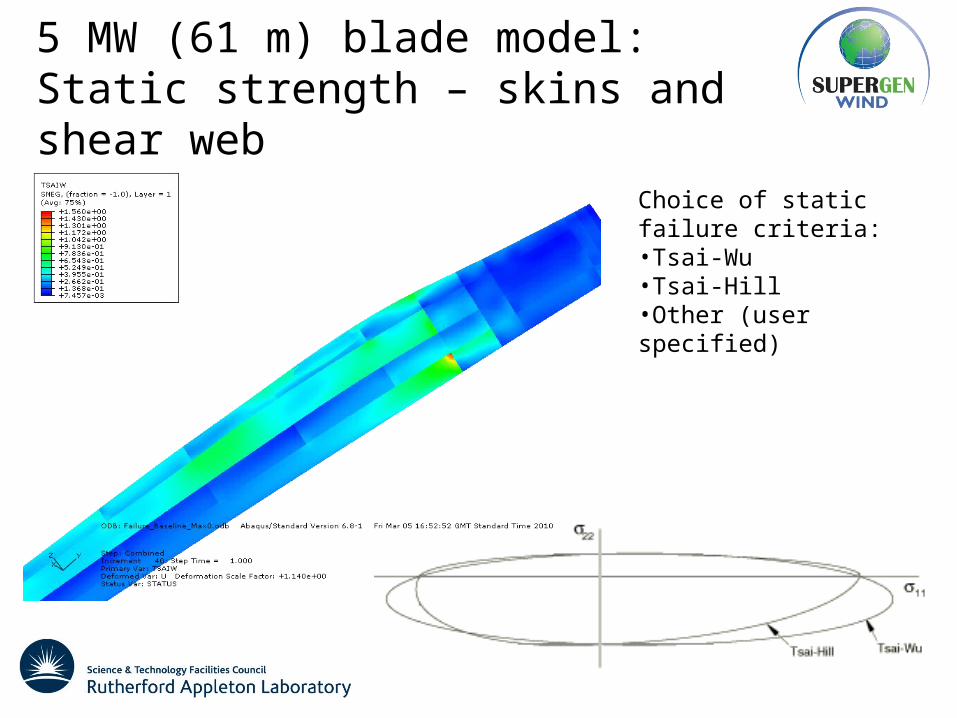
5 MW (61 m) blade model:Static strength – skins and shear web
Choice of static failure criteria:•Tsai-Wu•Tsai-Hill•Other (user specified)
5 MW (61 m) blade model:Static strength – skins and shear web
Choice of static failure criteria:•Tsai-Wu•Tsai-Hill•Other (user specified)

5 MW (61 m) blade model:Static strength – bonding paste
Cohesive element model•Normal stress component•Shear stress component•Linear up to characteristic value•Material “softening”

5 MW (61 m) blade model:Fatigue strength estimation
• Complex loading• Stochastic / semi-deterministic (cyclic) loading
• Biaxial (triaxial) stress state
IEC 61400-1
• Fatigue characterisation• Predominantly uni-directional materials data
• Uncertainty in how best to combine different stress cycles
• R-ratio (minimum:maximum stress in a load cycle)
• Combine into constant life diagram…

5 MW (61 m) blade model:Fatigue strength estimation
Constant life diagram- Linear Goodman diagram

5 MW (61 m) blade model:Fatigue strength estimation
Constant life diagram- Multiple R-values diagram
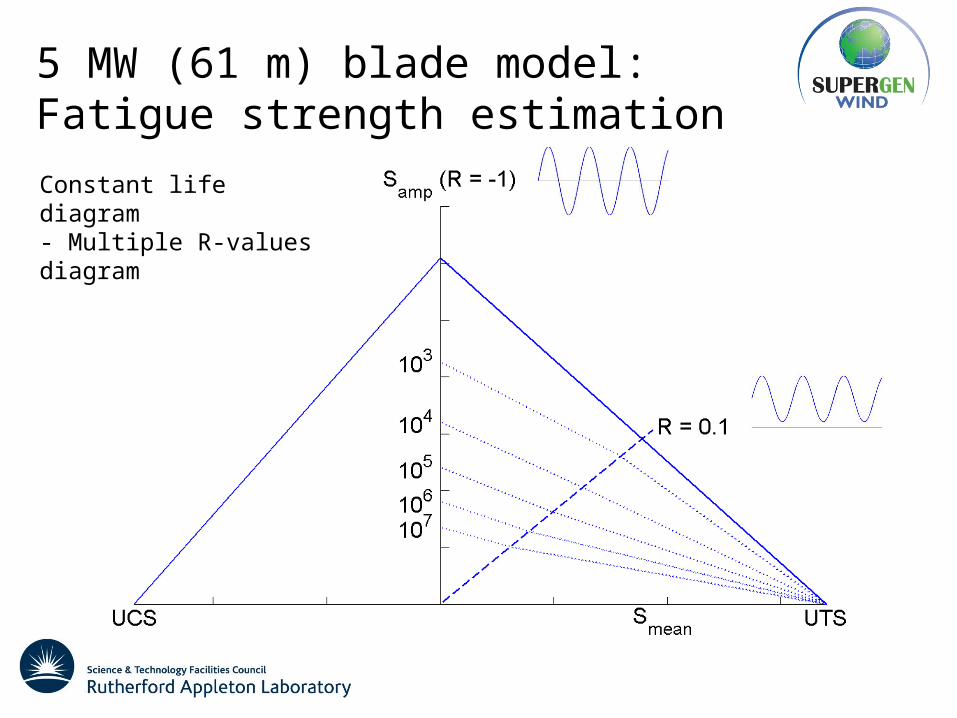
5 MW (61 m) blade model:Fatigue strength estimation
Constant life diagram- Multiple R-values diagram

5 MW (61 m) blade model:Fatigue strength estimation
• Complex loading• Stochastic / semi-deterministic (cyclic) loading
• Biaxial (triaxial) stress state
IEC 61400-1
• Fatigue characterisation• Predominantly uni-directional materials data
• Uncertainty in how best to combine different stress cycles
• R-ratio (minimum:maximum stress in a load cycle)
• Combine into constant life diagram…
• …applies to a single material direction
• How to deal with complex stress states? Biaxial stress ratio

5 MW (61 m) blade model:Biaxial stress ratio
Biaxial stress ratio is the ratio between the two largest magnitude principal stress components

5 MW (61 m) blade model:Fatigue strength estimation

5 MW (61 m) blade model:Fatigue lifetime
Baseline glass fibre Uniaxial fatigue
743.9
1
9.1178
nS
Min: 1.3 x 10⁹
593.10
1
2.1250
nS
High performance glass fibre
Min: 1.6 x 10¹⁰

Full scale blade testingThermoelastic stress analysis
Blade test: blade with defects
2211
pc
TTIsotropic materials:
Orthotropic materials: 22221111
pc
TT

Full scale blade testingThermoelastic stress analysis
Blade test: blade with defects
Blade model: normal blade
Blade model: blade with defects

Conclusions
• Flexible, parametric blade model for assessment of alternative materials
• Simple failure model in blade skin and developing damage model in bonding paste implemented
• Fatigue methodology under development
• Initial results also available for application to full-scale blade testing, control of smart blades and interpretation of condition monitoring data
• Future work planned on dynamic loading – operation in wakes from upstream turbines & “smart” blade devices

Acknowledgements
EPSRC grant no. EP/D034566/1
SUPERGEN Wind Energy Technologies Consortium
For further information please contact: