moderate and severe hypoxia elicit divergent effects on
TRANSCRIPT
This is an Accepted Article that has been peer-reviewed and approved for publication in the The
Journal of Physiology, but has yet to undergo copy-editing and proof correction. Please cite this
article as an 'Accepted Article'; doi: 10.1113/JP275945.
This article is protected by copyright. All rights reserved.
Moderate and severe hypoxia elicit divergent effects on cardiovascular function and physiological
rhythms
Melissa A. Allwood1, Brittany A. Edgett1, Ashley L. Eadie2, Jason S. Huber1, Nadya Romanova1, Philip J.
Millar1, Keith R. Brunt2, Jeremy A. Simpson1*
1Department of Human Health and Nutritional Sciences, University of Guelph, 50 Stone Road East,
Guelph, ON, N1G2W1, Canada
2Department of Pharmacology, Dalhousie Medicine New Brunswick, 100 Tucker Park Road, Saint
John, New Brunswick, E2L 4L5, Canada
Running Title: Divergent SBP responses to hypoxic gradation
Keywords: telemetry, heart rate variability, blood pressure
Table of Contents Category: Cardiovascular

This article is protected by copyright. All rights reserved.
* Correspondence to: Jeremy A. Simpson, Associate Professor, Department of Human Health and
Nutritional Sciences, University of Guelph, 50 Stone Road East, Guelph, ON, N1G2W1, Canada. E-
mail: [email protected]; phone: 519-824-4120 x56629; fax: 519-763-5902.
Melissa A. Allwood completed her PhD in hypoxia physiology at the University of Guelph
under the supervision of Dr. Jeremy A. Simpson. Presently an MD candidate at the
University of Toronto, she remains actively involved in both fundamental and translational
research. Her primary research focus is in cardiac endocrinology with special interests in
hypoxia and development. Following completion of her residency, she hopes to pursue a
post-doctoral fellowship to further her aspiration to become a cardiac clinical-scientist.
Key Points Summary
Here we provide evidence for divergent physiological responses to moderate compared to
severe hypoxia—addressing an important knowledge gap related to severity, duration and
after-effects of hypoxia encountered in cardiopulmonary situations.
The physiological responses to moderate and severe hypoxia were not proportional, linear
or concurrent with the time-of-day.
Hypoxia elicited severity-dependent physiological responses that either persisted or
fluctuated throughout normoxic recovery.
The physiological basis for these distinct cardiovascular responses implicates a shift in the
sympathovagal set point and not likely molecular changes at the artery due to hypoxic
stress.

This article is protected by copyright. All rights reserved.
Key points word count: 92
Abstract
Hypoxia is both a consequence and cause of many acute and chronic diseases. Severe
hypoxia causes hypertension with cardiovascular sequelae, however, the rare studies using
moderate severities of hypoxia support that it can be beneficial, suggesting hypoxia may not always
be detrimental. Comparisons between studies are difficult due to varied classifications of hypoxic
severities, methods of delivery and use of anesthetics. Thus, to investigate the long-term effects of
moderate hypoxia on cardiovascular health, radio-telemetry was used to obtain in vivo physiological
measurements in unanesthetized mice during 24-hours of either moderate (FIO2=0.15) or severe
(FIO2=0.09) hypoxia, followed by 72-hours of normoxic recovery. Systolic blood pressure was
decreased during recovery following moderate hypoxia but increased following severe. Moderate
and severe hypoxia increased heme oxygenase-1 expression during recovery, suggesting parity in
hypoxic stress at the level of the artery. Severe, but not moderate, hypoxia increased the low/high
frequency ratio of heart rate variability 72 hours post-hypoxia, indicating a shift in sympathovagal
balance. Moderate hypoxia dampened the amplitude of circadian rhythm while severe disrupted
rhythm during the entire insult, with perturbations persisting throughout normoxic recovery. Thus,
hypoxic severity differentially regulates circadian blood pressure.
Abbreviations
COPD, chronic obstructive pulmonary disease
EPO, erythropoietin
FIO2, fraction of inspired oxygen
HF, high frequency
HIF, hypoxia-inducible factor
This article is protected by copyright. All rights reserved.
HMOX1, heme oxygenase 1
LF, low frequency
NOS, nitric oxide synthase
PaO2, arterial oxygen pressure
RMSSD, root mean square of successive normal R-R interval differences
SBP, systolic blood pressure
SDNN, standard deviations of normal R-R intervals
Introduction
Impairments in oxygen delivery are both a cause and consequence of many acute and
chronic disease states (e.g. obstructive sleep apnea, heart failure, chronic obstructive pulmonary
disease [COPD]) and associated with a reduced quality of life and increased mortality. Investigation
of the pathophysiological consequences of hypoxia illustrate primarily detrimental outcomes of
sustained (Sheedy et al., 1996; Viganò et al., 2011; Simpson & Iscoe, 2014) or intermittent (Fletcher
et al., 1992; Campen et al., 2005; Simpson et al., 2008) severe hypoxia. Whether hypoxia is caused
by breathing low oxygen (~FIO2 <0.10) or the application of a respiratory load, the resultant hypoxic
outcome is equivalent to what would be observed physiologically at an elevation of >6500 m above
sea level (ranging between the peaks of Mount Kilimanjaro to Mount Everest). The nature of
hypoxia is a product of available oxygen, prevailing pressure, duration of exposure, adaptation and
metabolic demand (including organ-specific hypoxia). However, hypoxia is also associated with
beneficial outcomes in cognitive performance (Leconte et al., 2012). Importantly, there is no
standardization of hypoxic thresholds and it is difficult to reconcile the conditions to which each
apply due to disagreements in the classification of severities (e.g. mild, moderate and severe),
method of delivery, duration, and (in some cases) use of anaesthetic. Further, direct comparisons of
moderate and severe hypoxia are seldom (Frappell et al., 1991; Morgan et al., 2014) and studies
investigating the pathophysiology of moderate hypoxia are rare (Haider et al., 2009). This is an

This article is protected by copyright. All rights reserved.
important omission given that the clinical gradation of hypoxia in most disease states is typically mild
to moderate (approximately equivalent to FIO2=0.15; ~2500 m above sea level, e.g. Aspen, CO)
(Thomas et al., 1961; Hayashi, 1976; Tuck et al., 1984; Oswald-Mammosser et al., 1995; Mannino et
al., 2002).
Systemic reductions in arterial oxygen pressure (PaO2), either by reducing the fraction of
inspired oxygen (FIO2) or hemoglobin content, does not necessarily equate to similar hypoxia of
various organs. Activation of compensatory neural and vascular mechanisms attempt to maintain
sufficient oxygenation of vital organs. Following decreases in PaO2, expression of hypoxia inducible
factor (HIF)-1α, a highly-conserved, oxygen-sensitive transcript factor, is elevated in some organs
(e.g. brain) but remains unresponsive until PaO2 is severely reduced in others (e.g. kidney) (Stroka et
al., 2001). The time profile of HIF-1α expression also appears to be organ-specific and differ
between moderate and severe hypoxia (Stroka et al., 2001). This organ-specific transcriptional
response to hypoxia is also seen in anemia, where in response to mild, moderate and severe anemia,
heterogeneous expression of HIF-1α occurs in the brain, kidney and liver (Tsui et al., 2014; Mistry et
al., 2018). These patterns are not necessarily reflected in the expression of HIF down-stream targets
(e.g. heme-oxygenase I [HMOX-1], erythropoietin [EPO]) (Tsui et al., 2014), suggesting that HIF alone
is not sufficient to predict expression. The severity of hypoxia also produces different metabolic
responses. Both moderate and severe hypoxia depress aerobic metabolism but only severe hypoxia
increases anaerobic metabolism; changes which persist following normoxic recovery (Frappell et al.,
1991). These data support the concept that the molecular and biochemical responses to moderate
and severe hypoxia are heterogeneous.
Further discrepancies between moderate and severe hypoxia are also present in the
cardiovascular response following hypoxia. Exposure to both intermittent and sustained severe
hypoxia leads to hypertension in animals (Fletcher et al., 1992; Vaziri & Wang, 1996; Campen et al.,
2005; Zoccal et al., 2007) and humans (Olea et al., 2014). In contrast, individuals living in high-
altitude, moderately hypoxic environments do not show elevations in blood pressure (Ruiz &
Peñaloza, 1977; Bruno et al., 2014); however, the latter findings could be the result of long-term
genetic adaptations (Hochachka et al., 1996; Moore, 2001; Lorenzo et al., 2014). Interestingly,
exposure to mild, intermittent hypoxia can be cardioprotective (Navarrete-Opazo & Mitchell, 2014;
Mateika et al., 2015; El-Chami et al., 2017), but the corresponding effects in health are unknown. To

This article is protected by copyright. All rights reserved.
determine pathophyisological mechanisms, it is important to first establish the effect of variable
hypoxic gradations in health.
The objective of the present study was to compare the cardiovascular responses to
moderate and severe hypoxia followed by normoxic recovery. We hypothesized that the
physiological response to moderate hypoxia is not simply a scaled down response to severe hypoxia.
Radio-telemetry provided unanesthetized, unrestrained and continuous in vivo physiological
measurements (Kim et al., 2013) before, during and after either moderate or severe hypoxia. We
found distinct cardiovascular responses between moderate and severe hypoxia that are neither
proportional nor linear nor concurrent with the time-of-day. Divergent changes in sympathovagal
activity could be the cause for the observed differences. Finally, recovery from moderate and severe
hypoxia elicited either persistent or fluctuating cardiovascular changes during normoxic recovery.
Methods and Materials
Ethical Approval
Adult male C57Bl/6J mice were bred in our facility and aged 8-12 weeks (~25 g body weight)
prior to surgery. Animal housing was maintained at 24˚C, 45% humidity and kept to a 12-hour light-
dark cycle (lights on: 08:00h; lights off: 20:00h). Following telemetry implantation, animals were
housed individually with food and water provided ad libitum. Housing and experimental procedures
were approved by the Animal Care Committee at the University of Guelph in conformity with the
guidelines of the Canadian Council on Animal Care.
Telemetry
HDX11 murine telemetry transmitters (Data Science International, St Paul, MN, USA) were
used to measure systolic blood pressure (SBP), heart rate, core body temperature and physical
activity. Briefly, mice were anesthetized with isoflurane/oxygen (2%:100%), intubated and body
temperature was maintained using a water-filled heating pad. A local anesthetic 50:50 mix of
lidocaine (3 mg/kg) and bupivicaine (1.5 mg/kg) was administered subcutaneously at the incision
sites. The right carotid artery was isolated and the pressure catheter was inserted and secured in
This article is protected by copyright. All rights reserved.
place using 7-0 suture and vet bond (3M, London, ON, Canada). To accurately measure core body
temperature, the telemetry units were implanted in the abdomen—a 7 cm pressure catheter is
superior to the standard 5 cm length to minimize kinking of the pressure catheter, which can cause
signal dropout of the blood pressure tracing. Following insertion, the transmitter was advanced
subcutaneously to the abdomen and secured intraperitoneally. Two electrocardiography leads were
placed subcutaneously, one above the rib cage and the second above the abdominal wall, and
secured to the underlying muscle layer. Animals recovered on a warming bed and carefully
monitored for post-surgical complications. Post-operative analgesic buprenorphine (0.1 mg/kg) was
given upon awakening and at 8 and 24 hours postoperatively; subsequent analgesic was given as
required.
Two-weeks post-operatively, mice were individually housed within an environmental
chamber (Figure 1; 830-ABB, Plas Labs, Lansing, MI, USA) where oxygen levels could be titrated
accordingly (ProOx 110, BioSpherix, New York, NY, USA). Drierite (W.A.
Hammond Drierite Company, Xenia, OH, USA) and calcium carbonate were added to the chamber to
maintain constant ambient humidity and prevent elevations in carbon dioxide. Each cage was
placed on a telemetry receiver (RPC-1, Data Science International, St. Paul, MN, USA) within custom
made Faraday cages. Telemetry signals were collected every 5 minutes for 30 seconds. Ambient
temperature (C10T, Data Science International) and pressure (APR-1, Data Science International)
were also recorded throughout the duration of the study. All signals were collected using computer
acquisition software (Dataquest ART V.3.3, Data Science International) and exported to Microsoft
Excel for further analysis (Excel 2011, Microsoft, Redmond, WA, USA).
Hypoxia Study Design
Each animal was exposed to only one hypoxic insult (either moderate or severe; maximum 3
animals at a time). Baseline recordings were obtained over a weekend and hypoxia (moderate
[FIO2=0.15] or severe [FIO2=0.09]) was gradually induced Monday morning at 08:00h over 15
minutes. After 24 hours of hypoxia, ambient oxygen levels were restored and telemetry continued
for an additional 72 hours.
This article is protected by copyright. All rights reserved.
qPCR Analysis
At the end of the normoxic recovery, animals were re-anesthetized with isoflurane.
Mesenteric artery samples were isolated and excised using a dissection microscope. Following
excision, samples were immediately frozen in liquid nitrogen and stored at -80˚C until analysis. RNA
extraction was performed on ~50 mg of mesenteric arteries (pooled from 3 animals) with Trizol
reagent according to the manufacturer’s instructions (Invitrogen, Life Technologies, Burlington, ON,
Canada). RNA samples were then treated using a RNase Free DNase (Qiagen), according to
manufacturer’s instructions. Concentrations of isolated RNA were quantified using a
spectrophotometer (NanoDrop, ND1000, Thermo Scientific, Mississauga, ON, Canada). Generation
of cDNA was completed using qScript cDNA SuperMix (Quanta Biosciences, Beverly, MD, USA),
according to the manufacturer’s instructions, using standardized 100 ng of RNA per sample.
Quantitative real-time PCR was performed using SuperScript II Reverse Transcriptase (Invitrogen,
Life Technologies) with a CFX Connect Real-Time PCR Detection System (BioRad) and primers for
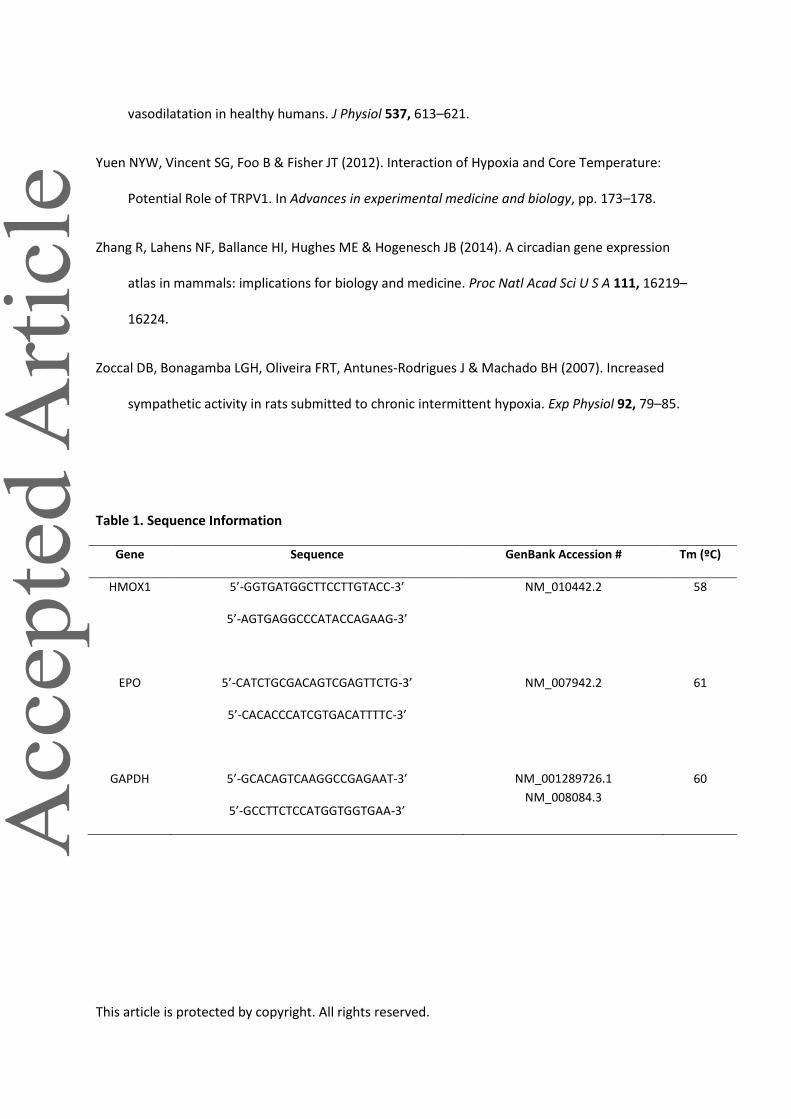
HMOX1, EPO and GAPDH, as listed in Table 1. All RNA data are expressed relative to GAPDH, which
was stable across all states with no difference in the raw CT values observed between groups
(p>0.05).
Immunoblotting
Samples were homogenized in buffer with a phosphatase and protease inhibitor cocktail and
total protein content was measured by BCA assay as previously described (Foster et al., 2017).
Briefly, samples were loaded onto a 4-20% Criterion TGX precast gel (BioRad, Mississauga, ON,
Canada) alongside 10 µl Precision Plus Protein Standards Kaleidoscope ladder (BioRad, Mississauga,
ON, Canada) and were separated by SDS-PAGE followed by immunoblotting. Nitrocellulose
membranes were rinsed in ddH2O and then incubated in Pierce Reversible Memcode Stain (Thermo
Fisher, Burlington, ON, Canada) for 5 minutes to confirm equal protein transfer. The blot was
imaged using a ChemiDoc MP Imaging System (BioRad, Mississauga, ON, Canada) prior to stain
removal (Pierce Stain Eraser, Thermo Fisher, Burlington, ON, Canada). Membranes were blocked
(5% non-fat dry milk in 1X TBS) and incubated with a primary anti-HMOX1 antibody [1:1000] (Cat:
82585, Abcam, Toronto, ON, Canada) overnight at 4˚C. Membranes were washed and subsequently
incubated with a goat anti-rabbit horseradish peroxidase conjugated secondary antibody [1:2000]

This article is protected by copyright. All rights reserved.
(Cat: 2054, Santa Cruz, Dallas, TX, USA). All antibody dilutions were completed in 1% non-fat dry
milk and membrane washes were completed in 1X TBS with 0.5% Tween. Signal was detected by
chemiluminescence (Thermo Fisher Scientific), imaged (ChemiDoc, Bio-Rad) and quantified using
Image Lab software (Bio-Rad). Values were obtained by measuring the target band relative to the
total protein of the lane.
Heart Rate Variability
Frequency-domain heart rate variability analysis was conducted using Kubios Heart Rate
Variability Analysis Software 2.2 for Windows (University of Kuopio, Finland). The continuous R-R
interval signal was re-sampled to 20 Hz and analysed by fast Fourier transformation. Spectral
analysis was completed on one 30-second epoch taken at the beginning of each hour during a
segment of the lights on period (10:00 to 18:00h─corresponding to 2 to 10 and 122 to 130 hours
Zeitgeber Time for baseline and normoxic recovery, respectively). Results are presented as the
mean value of these nine segments. This method was selected to ensure signal stationarity and
improve overall reproducibility (Thireau et al., 2008). Each file was visually inspected to verify the
absence of ectopic beats or signal artifact, defined as <5% of the total number of beats. If present,
abnormal beats were corrected using a piecewise cubic spline interpolation method. As
recommended for mice, frequency cut-offs of 0.15-1.5 Hz were selected as the low frequency (LF)
range and 1.5-5.0 Hz as the high frequency (HF) range, which has been validated pharmacologically
(Thireau et al., 2008). The LF and HF spectral values are presented in relative (%) and normalized
power (nu). Normalized power removes the contributions of very low frequency (0.00-0.15 Hz) to
total power. Total power consists of the area over the whole frequency spectrum (0.0-5.0 Hz). The
LF/HF ratio was calculated as a general marker of sympathovagal balance (Nunn et al., 2013).
Data Analysis
Raw data for SBP, heart rate, body temperature and physical activity were averaged for each
hour to obtain hourly means. For baseline measurements, data means for each parameter were
organized into 48-hour periods and then averaged between all animals. For hypoxia and normoxic
recovery, data means were averaged in its entirety between all animals. Each animal was recorded

This article is protected by copyright. All rights reserved.
at baseline prior to hypoxic exposure allowing for them to serve as their own control. Circadian
mesor (mean value around which the wave oscillates), amplitude (difference between peak/trough
and mean) and acrophase (time at which peak occurs) values were calculated and analysed using
cosinor analysis as previously described (Munakata et al., 1990; Refinetti et al., 2007). For telemetry
data, one-way repeated measures ANOVA were performed on ten 1-hour averages from each animal
during both light and dark cycles (i.e. excluding the four 1-hour intervals that bordered both cycles
to remove the influence of transition periods). If a significant main effect of time was detected,
Holm-Sidak post-hoc analysis was performed on data sets that were normally distributed. For non-
normally distributed data, Friedman’s test was used with Dunn’s post-hoc. A 5 x 2 (time x group)
mixed model ANOVA was also performed on 10-hour averaged telemetry data to determine
whether there were differences between the hypoxic conditions during lights on and lights off. If
there was a significant interaction, Holm-Sidak post-hoc analysis was performed to compare
differences between severe and moderate hypoxia at the same time point. Statistical analysis of
heart rate variability data was completed using a 2 x 2 (time x group) mixed model ANOVA, and
Holm-Sidak post-hoc analysis was performed when appropriate. Baseline and 72 hours post-hypoxia
were chosen for HRV analysis as the latter showed the most divergent response in SBP. HRV
analyses for all time points using a 5 x 2 (time x group) mixed model ANOVA are also presented. A 2
x 2 (time x group) mixed model ANOVA was performed for mRNA expression, except time and group
were both between subject comparisons. For protein data, one-tailed Mann-Whitney tests were
performed comparing hypoxic conditions to normoxia. Graphical and data analyses were completed
using GraphPad (Prism 6, GraphPad Software Inc, LaJolla, CA, USA). Differences were considered
significant at p<0.05.
Results
Body temperature and activity responses to moderate and severe hypoxia
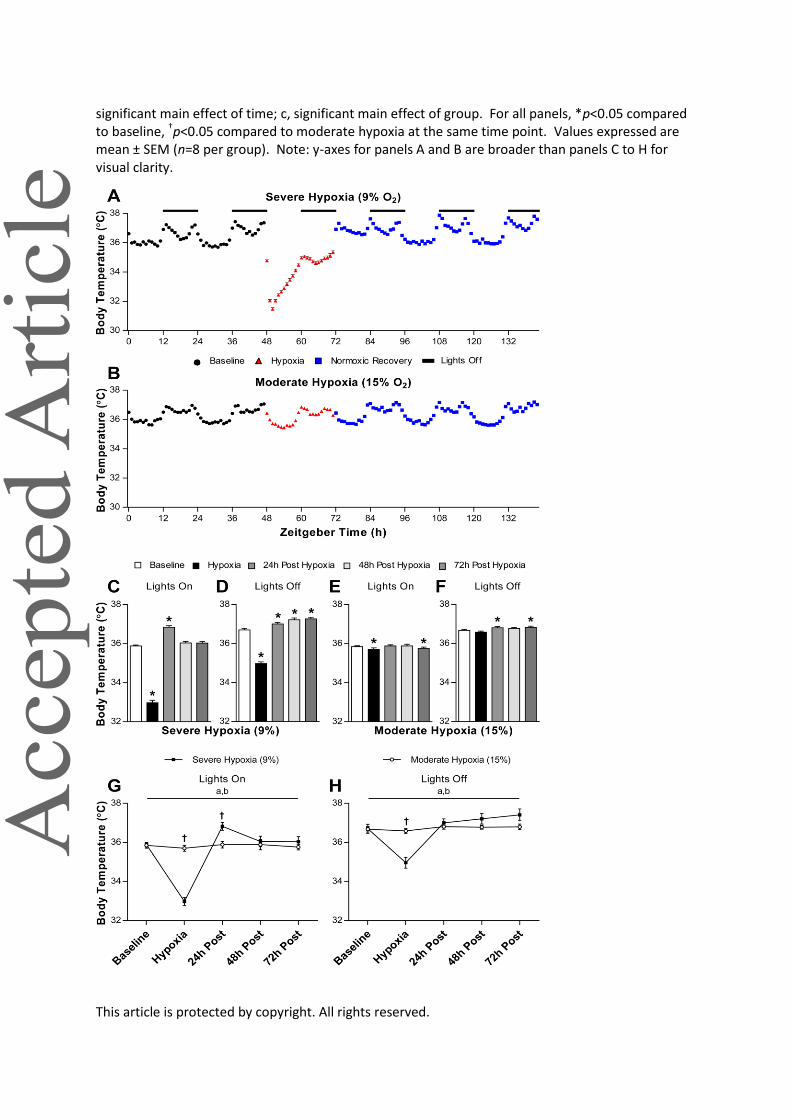
To confirm mice responded to hypoxia, we measured body temperature for hypoxia-induced
anapyrexia. Not surprisingly, and in agreement with previous research (Yuen et al., 2012), severe
hypoxia decreased body temperature during lights on and off (Figure 2A, C and D). To be certain
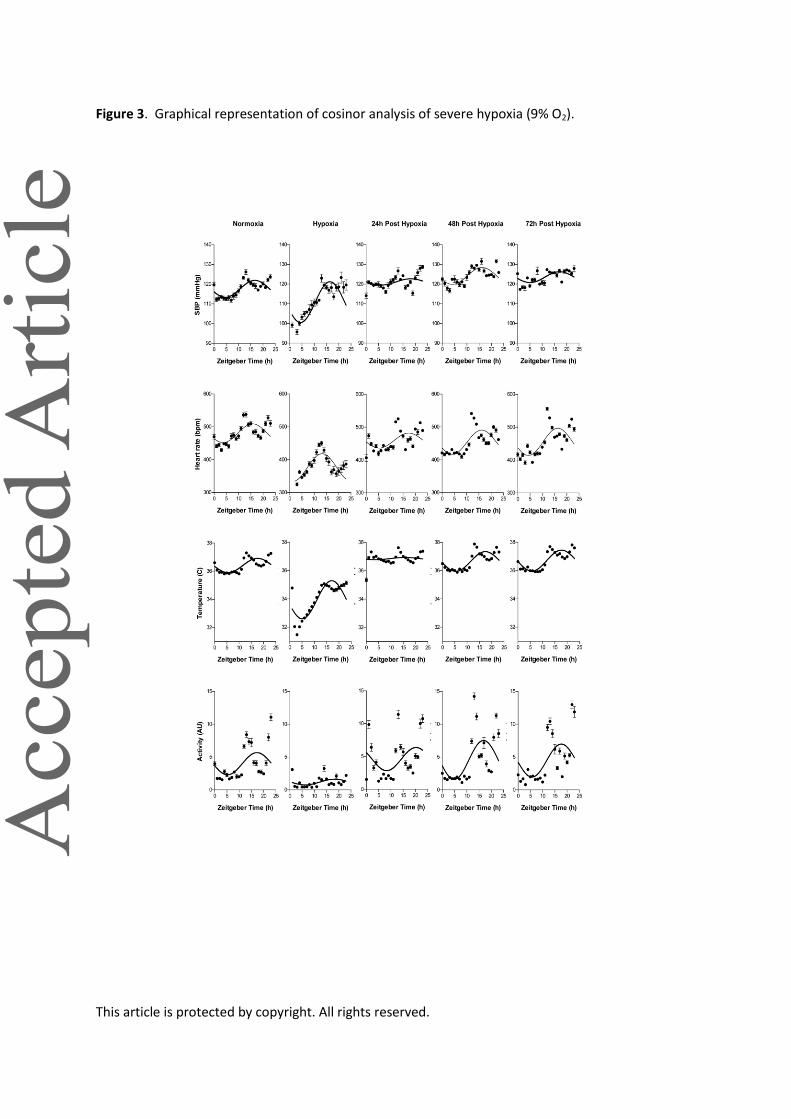
whether this was a simple static difference or an effect on circadian rhythm, we performed cosinor
analysis. Indeed, rhythm during severe hypoxia was disrupted with a mild disagreement of R2

This article is protected by copyright. All rights reserved.
(goodness-of-fit), decreased mesor and increased amplitude (Table 2, Figure 3). During moderate
hypoxia, body temperature was slightly decreased during lights off but not lights on (Figure 2B, E and
F); rhythm was unaffected (Table 2, Figure 4). To investigate whether hypoxia had any residual
effects on physiological parameters, we continued our analysis after return to normoxia (Figure 2A-
F, Table 2). While severe hypoxia had a rebound change in body temperature that persisted during
lights off, moderate hypoxia had only a modest increase in body temperature in the first 12 hours of
recovery, with another modest increase compared to baseline at 72 hours post-hypoxia. Normoxic
recovery from severe hypoxia also had a rebound effect on mesor and amplitude with a strong
disagreement of R2─where the former persisted and the latter two dissipated after 24 hours.
Normoxic recovery from moderate hypoxia did not significantly affect rhythm. A two-way (time x
group) ANOVA indicated a divergent response in body temperature to hypoxic severity (Figure 2G
and H). Severe hypoxia induced a rebound in body temperature that exceeded baseline levels
24 hours post-hypoxia, while moderate induced a mild decrease in body temperature that did not
persist during normoxic recovery.
Similar to body temperature, severe hypoxia decreased activity during lights on and off
(Figure 5A, C and D). Rhythm was disrupted, evidenced by a strong disagreement in R2 and a
decreased mesor (Table 2, Figure 3). In contrast, moderate hypoxia had no effect on overall activity
(Figure 5B, E and F) or rhythm (Table 2, Figure 4). Severe hypoxia had no effects on activity during
normoxic recovery, including rhythm. Interestingly, moderate hypoxia increased activity only at 72
hours post-hypoxia during lights off (i.e. the last 12 hours of recording). Rhythm was also disrupted
at 72 hours post-hypoxia as R2 was in mild disagreement and mesor and amplitude were increased.
A two-way (time x group) ANOVA confirmed a divergent response in activity to hypoxic severity
(Figure 5G and H) with severe, but not moderate, hypoxia causing a decrease in activity. Thus,
activity changes in response to hypoxia did not explain changes in body temperature during
normoxic recovery. In addition, there were no differences in activity between groups at baseline or
at any time post-hypoxia (data not shown), suggesting that arousal state was similar.
Systolic blood pressure responses to moderate and severe hypoxia
To determine the physiological risk for hypertension due to severity of hypoxia, we assessed
ambulatory SBP. Severe hypoxia decreased SBP during lights on but not lights off (Figure 6A, C and

This article is protected by copyright. All rights reserved.
D). Rhythm was disrupted during severe hypoxia with a mild disagreement of R2, decreased mesor
and increased amplitude, with no change in acrophase (Table 2, Figure 3). In contrast, moderate
hypoxia decreased SBP during lights off but not lights on (Figure 6B, E and F); rhythm was disrupted
with a mild disagreement of R2, decreased mesor with no change in amplitude or acrophase (Table 2,
Figure 4). Surprisingly, while severe hypoxia had a rebound change in SBP, moderate hypoxia had a
persistent change over 72 hours. Severe hypoxia also had a rebound effect on mesor and amplitude
with a strong disagreement of R2—where the former persisted and the latter two dissipated after 24
hours. Moderate hypoxia only had a persistent effect on mesor throughout 72 hours. Further, the
after-effects of severe and moderate hypoxia were most salient in lights on or lights off, respectively.
A two-way (time x group) ANOVA confirmed a divergent response in SBP to hypoxic severity (Figure
6G and H) acutely and in recovery, thus indicating hypoxic severity differentially regulates circadian
blood pressure. Body temperature and activity were similar for this subset of animals compared to
the full cohort (data not shown).
Heart rate responses to severe and moderate hypoxia
Next, we examined whether changes in blood pressure were associated with
corresponding changes in heart rate. Severe hypoxia decreased heart rate during lights on and
lights off (Figure 7A, C and D). Heart rate rhythm was also disrupted during severe hypoxia with a
mild disagreement of R2 and decreased mesor (Table 2, Figure 3). In contrast, moderate hypoxia
increased heart rate during lights on, but not lights off (Figure 7B, E and F); rhythm was disrupted
with a strong disagreement of R2 with increased mesor and decreased acrophase (Table 2, Figure 4).
During normoxic recovery, heart rate rebounded initially following severe hypoxia with fluctuations
during the 72-hour period; then returning to baseline (Figure 7C and D). There was a strong
disagreement of R2 at 24 hours following severe hypoxia, but returned to baseline by 72 hours;
mesor was decreased throughout. Conversely, moderate hypoxia decreased heart rate throughout
the majority of the normoxic recovery period. Rhythm was disrupted following moderate hypoxia,
evidenced by a mild decrease in R2 and a sustained decrease in mesor. A two-way (time x group)
ANOVA confirmed a divergent response in heart rate to hypoxic severity (Figure 7G and H). Thus,
severe and moderate hypoxia had opposing effects on heart rate during hypoxic stress with a
general reduction in heart rate during recovery.

This article is protected by copyright. All rights reserved.
Heart rate variability responses to moderate and severe hypoxia
To further investigate the mechanism underlying changes in SBP and heart rate, we utilized
heart rate variability analysis 72 hours post hypoxia as this represented the greatest difference in
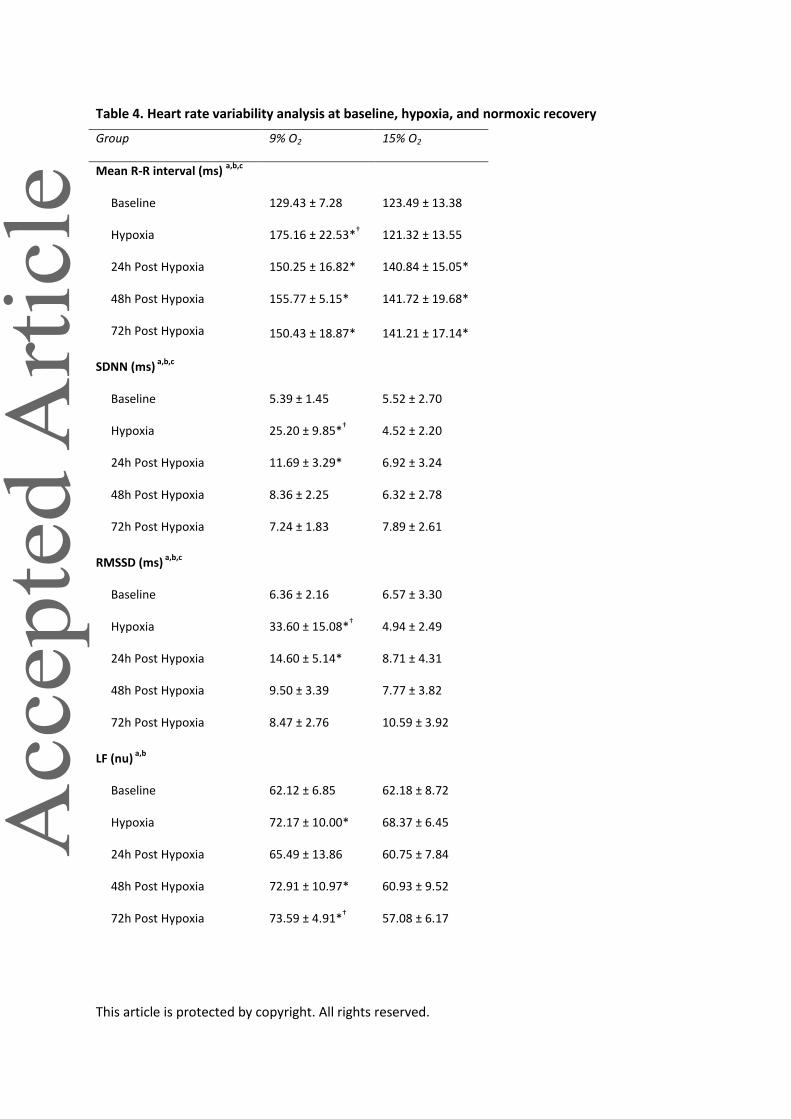
divergent SBP response (Table 3; HRV data for all time points are presented in Table 4). R-R interval
increased only in response to severe hypoxia (Figure 8A, Table 3). Moderate hypoxia increased the
standard deviations of normal R-R intervals (SDNN) and root mean square of successive normal R-R
interval differences (RMSSD) 72 hours post hypoxia compared to baseline (Table 3). Total spectral
power was also generally increased in response to hypoxia. Hypoxic severity induced a divergent
response to the LF/HF ratio; there was no change in the LF/HF ratio following moderate hypoxia
while severe increased it. The change in the LF/HF ratio in response to severe hypoxia was mediated
by an increase in the relative and normalized power of the LF band following severe hypoxia and a
corresponding decrease in the HF band. Following moderate hypoxia, the relative and normalized
power of the LF and HF bands were decreased and increased, respectively (Figure 8B and C, Table 3).
In addition, LF power was higher and HF power was lower 72 hours following severe hypoxia
compared to moderate. This was also evidenced by an increase in the LF/HF ratio following severe
compared to moderate hypoxia (Figure 8D). Thus, severe hypoxia induced a shift in sympathovagal
balance towards sympathetic dominance, while moderate hypoxia increased parasympathetic
activity with a potential decrease in sympathetic activation.
Effect of moderate and severe hypoxia on mesenteric resistance arteries
Divergence in SBP recovery from moderate and severe hypoxia was most consistent and
robust at the end of the study. Thus, to determine whether localized molecular mechanisms of
hypoxic stress in resistance arteries could account, at least in part, for the observed divergent
physiological responses, we examined gene expression of canonical targets of HIF (EPO and HMOX1)
in mesenteric arteries. Both moderate and severe hypoxia increased HMOX1 mRNA expression
while EPO was unchanged (Figure 9A and B). HMOX1 protein levels (Figure 9C-E) were in agreement
with mRNA expression. This suggests residual oxidative stress, but not tissue hypoxia, is observed in
resistance blood vessels. Physiologically, the consequence of hypoxia on SBP resides in a summation
This article is protected by copyright. All rights reserved.
of inputs—both systemic and localized. Here, we find agreement in localized stress but
disagreement in systemic sympathetic dominance.
Discussion
We demonstrate, for the first time, contrasting hemodynamic responses during normoxic
recovery following moderate and severe hypoxia. These results highlight the importance of hypoxic
severity in mediating the physiological response. Moderate and severe hypoxia both decreased SBP
during the hypoxic insult, but induced divergent hypertensive and hypotensive responses,
respectively, following normoxic recovery. While both moderate and severe hypoxia increased
expression of HMOX1, a potent hypoxia-induced vasodilator, only severe hypoxia induced a shift in
sympathovagal balance towards sympathetic dominance. Conversely, moderate hypoxia resulted in
an increase in parasympathetic activity with a potential decrease in sympathetic dominance. Thus,
the effects of hypoxia on SBP likely represent the net balance between the increased vasodilatory
effects of HMOX1 and the opposing sympathetic vasoconstriction, secondary to chemoreflex
activation. Further, both moderate and severe hypoxia disrupted circadian rhythm during the
hypoxic insult and transiently during normoxic recovery. Such observations have major implications
for our understanding of basic physiology and the role of hypoxia in disease progression.
Though rare, severe reductions in PaO2 do occur pathologically in some end-stage patients
(Edell et al., 1989; Dubois et al., 1994; Ferrer et al., 2003). These severe consequences are often the
final result of disease progression. For the majority of patients suffering from conditions where
hypoxia is a salient feature, the reductions in PaO2 are more moderate (Thomas et al., 1961;
Hayashi, 1976; Oswald-Mammosser et al., 1995; Mannino et al., 2002). Despite moderate hypoxia
being typical for many physiological (i.e. exercise, altitude) and pathological (e.g. COPD, heart
failure) conditions, severe hypoxia is more commonly used in research. While we are not the first to
investigate the physiological effects of moderate hypoxia, previous work focused largely on the
metabolic and ventilatory responses (Frappell et al., 1991; Morgan et al., 2014). In those animal
models, the relationship between moderate and severe hypoxia is scaled, similar to our findings in
body temperature and activity. However, the effects on cardiovascular measures are less clear.
While we also report divergent responses in heart rate and SBP during the hypoxic insult, there is
This article is protected by copyright. All rights reserved.
little support from the literature, largely attributed to the uniqueness and novelty of radio-telemetry
methodology.
Circadian rhythms are fundamental to our homeostasis, occur in virtually every organ in the
body, and when disrupted, exacerbate disease pathogenesis (Martino et al., 2007; Podobed et al.,
2014). Recent profiling of the mouse genome reveals that 43% of all protein-coding genes display
biological rhythm, most in an organ specific manner (Zhang et al., 2014). Loss or disruption of
circadian rhythm, or chronodisruption, is associated with worsened pathology in numerous
conditions including cancer (Sephton et al., 2000), obesity (Lamia et al., 2009) and cardiovascular
disease (de la Sierra et al., 2009; Martino et al., 2011). Further, despite evidence of hypoxic
influence on circadian rhythm through interactions between clock genes Period1 and BMAL1 with
HIF-1α, studies directed at understanding the effects of hypoxia on circadian rhythm are rare (Chilov
et al., 2001; Peek et al., 2017). Here we report that severe hypoxia suddenly and dramatically
decreased SBP, while moderate resulted in a delayed and gradual decrease. This might be explained
by differential alternations in the circadian clock (as suggested by differences in altered circadian
rhythm between hypoxic severities), resulting in altered expression/activation of HIF-1α via BMAL1
(Peek et al., 2017). We also report that severe hypoxia disrupts circadian rhythm of SBP,
temperature, heart rate and activity in mice. Notably, we are the first to demonstrate
chronodisruption in response to a more clinically relevant level of moderate hypoxia. Amplitude
dampening is associated with worsened disease progression and increased mortality (Hurd & Ralph,
1998; Mormont et al., 2000). Thus, while moderate hypoxia may not result in abolishment of
circadian rhythm, the alterations in amplitude may be indicative of pathology and hold significant
implications for patients suffering from chronic or nocturnal hypoxia. To fully understand the
pathophysiological consequences of hypoxia, it is important to evaluate different severities and
explore how they affect circadian rhythm and other factors that would play a crucial role in the
etiology of disease.
Heterogeneous activation of the HIF pathway occurs in response to different hypoxic
severities following reductions in hemoglobin concentration (anemic hypoxia) (Tsui et al., 2014) and
FIO2 (hypoxic hypoxia) (Stroka et al., 2001). Further, different severities of anemia also induce
differential expression of HIF-dependent genes, suggesting a corresponding functional difference in
the physiological response (Tsui et al., 2014; Mistry et al., 2018). Expression of EPO, nitric oxide
synthase (NOS), and monocarboxylate transporter 4 are all differentially activated between mild,
This article is protected by copyright. All rights reserved.
moderate and severe anemia in an organ-specific manner (Tsui et al., 2014). Our results
demonstrate that both moderate and severe hypoxia is associated with corresponding increases in
HMOX1 mRNA and protein. HMOX1 is an inducible enzyme responsible for catabolizing heme into
ferrous iron, biliverdin and carbon monoxide (Liu et al., 2007; Brunt et al., 2009; Allwood et al.,
2014). HMOX-derived carbon monoxide is a potent vasodilator, similar to NO, and is involved in
regulating vascular tone (Thorup et al., 1999). Further, HMOX-derived carbon monoxide also inhibits
endothelial NOS expression (Thorup et al., 1999), which is supported by decreased endothelial NOS
gene expression following both moderate and severe hypoxia in our model (data not shown).
We believe that the observed hypotension following moderate hypoxia is due to alterations
in local vascular tone resulting from increased production of HMOX-derived carbon monoxide,
despite potential reductions in endothelial NOS expression. However, following severe hypoxia, SBP
is increased due to concomitant sympathetic activation, as demonstrated by the increased LF/HF
ratio, likely as a result of chemoreflex activation. Severe hypoxia has been demonstrated previously
to increase sympathetic drive (Greenberg et al., 1999; Zoccal et al., 2007), further supporting our
findings. Differences in the cardiovascular response during the hypoxic insult between severe and
moderate hypoxia may be due, at least in part, to a physiological response via hypoxia-induced
anapyrexia. This is a well-characterized response to the proportion of hypoxia, where the
thermoregulatory set-point is decreased to reduce metabolic demands and protect tissues from
cellular damage (Steiner & Branco, 2002). This response occurs both in rodents (Robinson &
Milberg, 1970; Steiner et al., 2000) and humans (Kottke & Phalen, 1948; Robinson & Haymes, 1990),
however, as body temperature is linearly associated with heart rate in mice, this reduction in body
temperature during severe hypoxia was accompanied by depressions in heart rate and blood
pressure in our model. During severe hypoxia, there is also an acute systemic vasodilatory effect
(Fredricks et al., 1994; Marshall, 2000; Weisbrod et al., 2001) which is proposed to cause a decrease
in mean arterial pressure in rodents (Campen et al., 2005; Gonzalez et al., 2007; Marcus et al., 2009).
In agreement with this, we observed a sudden and drastic decrease in SBP during severe hypoxia
which we did not observe during moderate. In contrast, chronic exposure to severe hypoxia results
in elevated mean arterial pressure in humans (Calbet, 2003; Parati et al., 2014) and rodents (Campen
et al., 2005; Marcus et al., 2009). Thus, the differential cardiovascular responses observed following
moderate and severe hypoxia represent the net balance between local vasodilatory factors and
central neural sympathoexcitatory regulation of vasculature tone.
This article is protected by copyright. All rights reserved.
Although we used activity as a surrogate marker of arousal, a limitation of our study is the
absence of ventilation and arousal state (i.e. EEG) recordings for each animal, which may influence
heart rate variability. In addition, telemetry units were set to record only 30 seconds of data every 5
minutes. While we acknowledge the limitation that our segment length is below the 1-3 minutes
used in other studies, we found it easier to find stationarity of the signal using shorter time lengths.
To accommodate the shorter time length, we used nine 30-second segments. Indeed, the averaging
of multiple 1-minute segments produces comparable means as 3-minute data segments (Thireau et
al., 2008). Finally, though we observed disruptions to circadian rhythm during and following
hypoxia, longer durations of hypoxic stress and recovery should also be investigated. This could
provide valuable insight to whether moderate hypoxia disrupts circadian rhythm and contributes to
diseases like hypertension and mild COPD.
Impaired tissue oxygenation is present in numerous chronic diseases and is associated with
worse quality of life and clinical outcomes. Decades of research have almost exclusively focused on
investigating the effects of severe hypoxia in pathophysiological states, while the same effects of
moderate hypoxia remain uninvestigated. Further, there is no standardization for the classification
of hypoxic severities with the same reduction in FIO2 being classified as mild, moderate and severe,
depending on the study design. In contrast to hypoxic hypoxia, anemic hypoxia has defined
haemoglobin concentrations recommended by the World Health Organization for the classification
of mild, moderate and severe anemia. This lack of standardization represents a significant barrier in
the interpretation and comparison of results from different studies using reduced FIO2 as the
primary insult.
In summary, we demonstrate, for the first time, differential pressor responses during
normoxic recovery following moderate and severe hypoxia. These effects appear to be mediated, at
least in part, by different autonomic nervous system responses. These results should stimulate
additional studies investigating the therapeutic potential of moderate hypoxic exposure to improve
overall cardiovascular health. The findings of this study illustrate a critical need to revisit the basic
pathophysiology of hypoxia to promote standardization, reconcile our understanding of the
literature, and improve clinical translation.

This article is protected by copyright. All rights reserved.
Additional Information
Competing Interests
None.
Author Contributions
Conception and design of the experiments: M.A.A., J.A.S.; collection, analysis and
interpretation of data: M.A.A., B.A.E., J.S.H., N.R., A.E., P.J.M., K.R.B., J.A.S.; drafting the article or
revising it critically for important intellectual content: M.A.A., B.A.E., J.S.H., N.R., A.E., P.J.M., K.R.B.,
J.A.S. All authors have approved the final version of the manuscript and agree to be accountable for
all aspects of the work in ensuring that questions related to the accuracy or integrity of any part of
the work are appropriately investigated and resolved. All persons designated as authors qualify for
authorship, and all those who qualify for authorship are listed.
Funding
This work was funded in part by the Canadian Institutes of Health Research (Grant #
MOP111159) (J.A.S), the Natural Sciences and Engineering Research Council of Canada (to J.A.S. and
K.R.B. and P.J.M.) and the Heart and Stroke Foundation of Canada (to J.A.S. and K.R.B.). J.S.H is
supported by Natural Sciences and Engineering Research Council of Canada graduate scholarship.
A.L.E. is supported by a Nova Scotia Health Research Foundation Scotia Scholars Award and New
Brunswick Innovation Foundation Research Assistantships Initiative. M.A.A. was supported by the
Queen Elizabeth Graduate Scholarship in Science and Technology and an Ontario Graduate
Scholarship. B.A.E. was supported by funds from GlycoNet. We further acknowledge J. Southen and
B. Southen of London, Ontario, for their philanthropic support. J.A.S. is a new investigator with the
Heart and Stroke Foundation of Ontario.
Acknowledgements
None.
This article is protected by copyright. All rights reserved.
References
Allwood MA, Kinobe RT, Ballantyne L, Romanova N, Melo LG, Ward CA, Brunt KR & Simpson JA
(2014). Heme oxygenase-1 overexpression exacerbates heart failure with aging and pressure
overload but is protective against isoproterenol-induced cardiomyopathy in mice. Cardiovasc
Pathol 23, 231–237.
Bruno RM, Cogo A, Ghiadoni L, Duo E, Pomidori L, Sharma R, Thapa GB, Basnyat B, Bartesaghi M,
Picano E, Sicari R, Taddei S & Pratali L (2014). Cardiovascular function in healthy Himalayan
high-altitude dwellers. Atherosclerosis 236, 47–53.
Brunt KR, Tsuji MR, Lai JH, Kinobe RT, Durante W, Claycomb WC, Ward CA & Melo LG (2009). Heme
oxygenase-1 inhibits pro-oxidant induced hypertrophy in HL-1 cardiomyocytes. Exp Biol Med
(Maywood) 234, 582–594.
Calbet JAL (2003). Chronic hypoxia increases blood pressure and noradrenaline spillover in healthy
humans. J Physiol 551, 379–386.
Campen MJ, Shimoda LA & O’Donnell CP (2005). Acute and chronic cardiovascular effects of
intermittent hypoxia in C57BL/6J mice. J Appl Physiol 99, 2028–2035.
Chilov D, Hofer T, Bauer C, Wenger RH & Gassmann M (2001). Hypoxia affects expression of
circadian genes PER1 and CLOCK in mouse brain. FASEB J 15, 2613–2622.
Dubois P, Jamart J, Machiels J, Smeets F & Lulling J (1994). Prognosis of severely hypoxemic patients
receiving long-term oxygen therapy. Chest 105, 469–474.
Edell ES, Cortese DA, Krowka MJ & Rehder K (1989). Severe hypoxemia and liver disease. Am Rev
Respir Dis 140, 1631–1635.
El-Chami M, Sudan S, Lin H-S & Mateika JH (2017). Exposure to intermittent hypoxia and sustained
hypercapnia reduces therapeutic CPAP in participants with obstructive sleep apnea. J Appl
Physiol 123, 993–1002.
Ferrer M, Esquinas A, Leon M, Gonzalez G, Alarcon A & Torres A (2003). Noninvasive ventilation in
severe hypoxemic respiratory failure: a randomized clinical trial. Am J Respir Crit Care Med 168,
1438–1444.
Fletcher EC, Lesske J, Qian W, Miller CC & Unger T (1992). Repetitive, episodic hypoxia causes diurnal
elevation of blood pressure in rats. Hypertension 19, 555–561.
Foster AJ, Platt MJ, Huber JS, Eadie AL, Arkell AM, Romanova N, Wright DC, Gillis TE, Murrant CL,
Brunt KR & Simpson JA (2017). Central-acting therapeutics alleviate respiratory weakness
caused by heart failure-induced ventilatory overdrive. Sci Transl Med 9, eaag1303.
This article is protected by copyright. All rights reserved.
Frappell P, Saiki C & Mortola JP (1991). Metabolism during normoxia, hypoxia and recovery in the
newborn kitten. Respir Physiol 86, 115–124.
Fredricks KT, Liu Y & Lombard JH (1994). Response of extraparenchymal resistance arteries of rat
skeletal muscle to reduced PO2. Am J Physiol 267, H706-15.
Gonzalez NC, Allen J, Schmidt EJ, Casillan AJ, Orth T & Wood JG (2007). Role of the renin-angiotensin
system in the systemic microvascular inflammation of alveolar hypoxia. Am J Physiol - Hear Circ
Physiol 292, H2285–H2294.
Greenberg HE, Sica A, Batson D & Scharf SM (1999). Chronic intermittent hypoxia increases
sympathetic responsiveness to hypoxia and hypercapnia. J Appl Physiol (Bethesda, Md 1985)
86, 298–305.
Haider T, Casucci G, Linser T, Faulhaber M, Gatterer H, Ott G, Linser A, Ehrenbourg I, Tkatchouk E,
Burtscher M & Bernardi L (2009). Interval hypoxic training improves autonomic cardiovascular
and respiratory control in patients with mild chronic obstructive pulmonary disease. J
Hypertens 27, 1648–1654.
Hayashi M (1976). Studies of hypoxemia and pulmonary hemodynamics in acute myocardial
infarction. Jpn Circ J 40, 299–312.
Hochachka PW, Clark CM, Holden JE, Stanley C, Ugurbil K & Menon RS (1996). 31P magnetic
resonance spectroscopy of the Sherpa heart: a phosphocreatine/adenosine triphosphate
signature of metabolic defense against hypobaric hypoxia. Proc Natl Acad Sci U S A 93, 1215–
1220.
Hurd MW & Ralph MR (1998). The significance of circadian organization for longevity in the golden
hamster. J Biol Rhythms 13, 430–436.
Kim M, Platt MJ, Shibasaki T, Quaggin SE, Backx PH, Seino S, Simpson JA & Drucker DJ (2013). GLP-1
receptor activation and Epac2 link atrial natriuretic peptide secretion to control of blood
pressure. Nat Med 19, 567–575.
Kottke FJ & Phalen JS (1948). Effect of hypoxia upon temperature regulation of mice, dogs, and man.
Am J Physiol 153, 10–15.
de la Sierra A, Redon J, Banegas JR, Segura J, Parati G, Gorostidi M, de la Cruz JJ, Sobrino J, Llisterri JL,
Alonso J, Vinyoles E, Pallarés V, Sarría A, Aranda P, Ruilope LM & Spanish Society of
Hypertension Ambulatory Blood Pressure Monitoring Registry Investigators (2009). Prevalence
and factors associated with circadian blood pressure patterns in hypertensive patients.
Hypertens (Dallas, Tex 1979) 53, 466–472.
Lamia KA, Sachdeva UM, DiTacchio L, Williams EC, Alvarez JG, Egan DF, Vasquez DS, Juguilon H,
Panda S, Shaw RJ, Thompson CB & Evans RM (2009). AMPK regulates the circadian clock by
cryptochrome phosphorylation and degradation. Science 326, 437–440.
This article is protected by copyright. All rights reserved.
Leconte C, Léger M, Boulouard M, Tixier E, Fréret T, Bernaudin M & Schumann-Bard P (2012).
Repeated mild hypoxic exposures decrease anxiety-like behavior in the adult mouse together
with an increased brain adrenomedullin gene expression. Behav Brain Res 230, 78–84.
Liu X, Simpson JA, Brunt KR, Ward CA, Hall SRR, Kinobe RT, Barrette V, Tse MY, Pang SC, Pachori AS,
Dzau VJ, Ogunyankin KO & Melo LG (2007). Preemptive heme oxygenase-1 gene delivery
reveals reduced mortality and preservation of left ventricular function 1 yr after acute
myocardial infarction. Am J Physiol Heart Circ Physiol 293, H48-59.
Lorenzo FR et al. (2014). A genetic mechanism for Tibetan high-altitude adaptation. Nat Genet 46,
951–956.
Mannino DM, Homa DM, Akinbami LJ, Ford ES & Redd SC (2002). Chronic obstructive pulmonary
disease surveillance--United States, 1971-2000. Respir Care 47, 1184–1199.
Marcus NJ, Olson EB, Bird CE, Philippi NR, Morgan BJ & Morgan BJ (2009). Time-dependent
adaptation in the hemodynamic response to hypoxia. Respir Physiol Neurobiol 165, 90–96.
Marshall JM (2000). Adenosine and muscle vasodilatation in acute systemic hypoxia. Acta Physiol
Scand 168, 561–573.
Martino TA, Tata N, Belsham DD, Chalmers J, Straume M, Lee P, Pribiag H, Khaper N, Liu PP, Dawood
F, Backx PH, Ralph MR & Sole MJ (2007). Disturbed diurnal rhythm alters gene expression and
exacerbates cardiovascular disease with rescue by resynchronization. Hypertens (Dallas, Tex
1979) 49, 1104–1113.
Martino TA, Tata N, Simpson JA, Vanderlaan R, Dawood F, Kabir MG, Khaper N, Cifelli C, Podobed P,
Liu PP, Husain M, Heximer S, Backx PH & Sole MJ (2011). The primary benefits of angiotensin-
converting enzyme inhibition on cardiac remodeling occur during sleep time in murine pressure
overload hypertrophy. J Am Coll Cardiol 57, 2020–2028.
Mateika JH, El-Chami M, Shaheen D & Ivers B (2015). Intermittent hypoxia: a low-risk research tool
with therapeutic value in humans. J Appl Physiol 118, 520–532.
Mistry N, Mazer CD, Sled JG, Lazarus AH, Cahill LS, Solish M, Zhou Y-Q, Romanova N, Hare AG, Doctor
A, Fisher JA, Brunt KR, Simpson JA & Hare GMT (2018). Red Blood Cell Antibody Induced
Anemia Causes Differential Degrees of Tissue Hypoxia in Kidney and Brain. Am J Physiol Integr
Comp Physiolajpregu.00182.2017.
Moore LG (2001). Human Genetic Adaptation to High Altitude. High Alt Med Biol 2, 257–279.
Morgan BJ, Adrian R, Bates ML, Dopp JM & Dempsey JA (2014). Quantifying hypoxia-induced
chemoreceptor sensitivity in the awake rodent. J Appl Physiol 117, 816–824.
Mormont MC, Waterhouse J, Bleuzen P, Giacchetti S, Jami A, Bogdan A, Lellouch J, Misset JL, Touitou
Y & Lévi F (2000). Marked 24-h rest/activity rhythms are associated with better quality of life,
This article is protected by copyright. All rights reserved.
better response, and longer survival in patients with metastatic colorectal cancer and good
performance status. Clin Cancer Res 6, 3038–3045.
Munakata M, Imai Y, Minami N, Sasaki S, Ichijyo T, Yoshizawa M, Sekino H, Abe K & Yoshinaga K
(1990). Cosinor analysis of changes in circadian blood pressure rhythm with aging in
spontaneously hypertensive rats. Tohoku J Exp Med 161, 55–64.
Navarrete-Opazo A & Mitchell GS (2014). Therapeutic potential of intermittent hypoxia: a matter of
dose. 307, R1181–R1197.
Nunn N, Feetham CH, Martin J, Barrett-Jolley R & Plagge A (2013). Elevated blood pressure, heart
rate and body temperature in mice lacking the XLαs protein of the Gnas locus is due to
increased sympathetic tone. Exp Physiol 98, 1432–1445.
Olea E, Agapito MT, Gallego-Martin T, Rocher A, Gomez-Niño A, Obeso A, Gonzalez C & Yubero S
(2014). Intermittent hypoxia and diet-induced obesity: effects on oxidative status, sympathetic
tone, plasma glucose and insulin levels, and arterial pressure. J Appl Physiol 117, 706–719.
Oswald-Mammosser M, Weitzenblum E, Quoix E, Moser G, Chaouat A, Charpentier C & Kessler R
(1995). Prognostic factors in COPD patients receiving long-term oxygen therapy. Chest 107,
1193–1198.
Parati G, Bilo G, Faini A, Bilo B, Revera M, Giuliano A, Lombardi C, Caldara G, Gregorini F,
Styczkiewicz K, Zambon A, Piperno A, Modesti PA, Agostoni P & Mancia G (2014). Changes in 24
h ambulatory blood pressure and effects of angiotensin II receptor blockade during acute and
prolonged high-altitude exposure: a randomized clinical trial. Eur Heart J 35, 3113–3122.
Peek CB, Levine DC, Cedernaes J, Taguchi A, Kobayashi Y, Tsai SJ, Bonar NA, McNulty MR, Ramsey KM
& Bass J (2017). Circadian Clock Interaction with HIF1α Mediates Oxygenic Metabolism and
Anaerobic Glycolysis in Skeletal Muscle. Cell Metab 25, 86–92.
Podobed P, Pyle WG, Ackloo S, Alibhai FJ, Tsimakouridze E V, Ratcliffe WF, Mackay A, Simpson J,
Wright DC, Kirby GM, Young ME & Martino TA (2014). The day/night proteome in the murine
heart. Am J Physiol Regul Integr Comp Physiol 307, R121-37.
Refinetti R, Cornélissen G & Halberg F (2007). Procedures for numerical analysis of circadian
rhythms. Biol Rhythm Res 38, 275–325.
Robinson KA & Haymes EM (1990). Metabolic effects of exposure to hypoxia plus cold at rest and
during exercise in humans. J Appl Physiol 68, 720–725.
Robinson SM & Milberg J (1970). Alterations of d-amphetamine sulfate lethality and body
temperature in mice during acute altitude exposure. Toxicol Appl Pharmacol 16, 540–546.
Ruiz L & Peñaloza D (1977). Altitude and hypertension. Mayo Clin Proc 52, 442–445.

This article is protected by copyright. All rights reserved.
Sephton SE, Sapolsky RM, Kraemer HC & Spiegel D (2000). Diurnal cortisol rhythm as a predictor of
breast cancer survival. J Natl Cancer Inst 92, 994–1000.
Sheedy W, Thompson JS & Morice AH (1996). A comparison of pathophysiological changes during
hypobaric and normobaric hypoxia in rats. Respiration 63, 217–222.
Simpson JA, Brunt KR & Iscoe S (2008). Repeated inspiratory occlusions acutely impair myocardial
function in rats. J Physiol 586, 2345–2355.
Simpson JA & Iscoe S (2014). Hypoxia, not hypercapnia, induces cardiorespiratory failure in rats.
Respir Physiol Neurobiol 196, 56–62.
Steiner AA & Branco LGS (2002). Hypoxia-induced anapyrexia: implications and putative mediators.
Annu Rev Physiol 64, 263–288.
Steiner AA, Carnio EC & Branco LG (2000). Role of neuronal nitric oxide synthase in hypoxia-induced
anapyrexia in rats. J Appl Physiol 89, 1131–1136.
Stroka DM, Burkhardt T, Desbaillets I, Wenger RH, Neil DAH, Bauer C, Gassmann M & Candinas D
(2001). HIF-1 is expressed in normoxic tissue and displays an organ-specific regulation under
systemic hypoxia. FASEB J 15, 2445–2453.
Thireau J, Zhang BL, Poisson D & Babuty D (2008). Heart rate variability in mice: a theoretical and
practical guide. Exp Physiol 93, 83–94.
Thomas J, Michael O & Ewell CW (1961). Reticulocytosis and hypoxemia as prognostic signs in
congestive heart failure. Circulation 24, 1151–1153.
Thorup C, Jones CL, Gross SS, Moore LC & Goligorsky MS (1999). Carbon monoxide induces
vasodilation and nitric oxide release but suppresses endothelial NOS. Am J Physiol 277, F882–
F889.
Tsui AKY, Marsden PA, Mazer CD, Sled JG, Lee KM, Henkelman RM, Cahill LS, Zhou Y-Q, Chan N, Liu E
& Hare GMT (2014). Differential HIF and NOS responses to acute anemia: defining organ-
specific hemoglobin thresholds for tissue hypoxia. AJP Regul Integr Comp Physiol 307, R13–R25.
Tuck RR, Schmelzer JD & Low PA (1984). Endoneurial blood flow and oxygen tension in the sciatic
nerves of rats with experimental diabetic neuropathy. Brain 107, 935–950.
Vaziri ND & Wang ZQ (1996). Sustained systemic arterial hypertension induced by extended
hypobaric hypoxia. Kidney Int 49, 1457–1463.
Viganò A, Vasso M, Caretti A, Bravatà V, Terraneo L, Fania C, Capitanio D, Samaja M & Gelfi C (2011).
Protein modulation in mouse heart under acute and chronic hypoxia. Proteomics 11, 4202–
4217.
Weisbrod CJ, Minson CT, Joyner MJ & Halliwill JR (2001). Effects of regional phentolamine on hypoxic
This article is protected by copyright. All rights reserved.
vasodilatation in healthy humans. J Physiol 537, 613–621.
Yuen NYW, Vincent SG, Foo B & Fisher JT (2012). Interaction of Hypoxia and Core Temperature:
Potential Role of TRPV1. In Advances in experimental medicine and biology, pp. 173–178.
Zhang R, Lahens NF, Ballance HI, Hughes ME & Hogenesch JB (2014). A circadian gene expression
atlas in mammals: implications for biology and medicine. Proc Natl Acad Sci U S A 111, 16219–
16224.
Zoccal DB, Bonagamba LGH, Oliveira FRT, Antunes-Rodrigues J & Machado BH (2007). Increased
sympathetic activity in rats submitted to chronic intermittent hypoxia. Exp Physiol 92, 79–85.
Table 1. Sequence Information
Gene Sequence GenBank Accession # Tm (ºC)
HMOX1 5’-GGTGATGGCTTCCTTGTACC-3’
5’-AGTGAGGCCCATACCAGAAG-3’
NM_010442.2 58
EPO 5’-CATCTGCGACAGTCGAGTTCTG-3’
5’-CACACCCATCGTGACATTTTC-3’
NM_007942.2 61
GAPDH 5’-GCACAGTCAAGGCCGAGAAT-3’
5’-GCCTTCTCCATGGTGGTGAA-3’
NM_001289726.1
NM_008084.3
60

This article is protected by copyright. All rights reserved.
Table 2. Cosinor analysis of physiological parameters
Mesor Amplitude Acrophase, hours R2
9% O2
SBP (mmHg)
Baseline 117.6 ± 0.6 4.3 ± 0.9 14.5 ± 0.2 0.54
Hypoxia 110.8 ± 1.2* 10.3 ± 1.7* 20.8 ± 0.2 0.66
24h Post Hypoxia 121.1 ± 0.8* 1.6 ± 1.1* 20.4 ± 0.7 0.09
48h Post Hypoxia 124.2 ± 0.6* 4.3 ± 0.8 14.6 ± 0.2 0.58
72h Post Hypoxia 123.5 ± 0.6* 2.8 ± 0.8 20.7 ± 0.3 0.35
HR (bpm)
Baseline 481 ± 5 29 ± 7 15.0 ± 0.2 0.44
Hypoxia 376 ± 5* 42 ± 8 15.4 ± 0.2 0.62
24h Post Hypoxia 459 ± 6* 23 ± 9 14.3 ± 0.4 0.25
48h Post Hypoxia 454 ± 6* 37 ± 8 14.6 ± 0.3 0.46
72h Post Hypoxia 456 ± 7* 41 ± 10 14.6 ± 0.2 0.44
Temperature (°C)
Baseline 36.4 ± 0.1 0.5 ± 0.1 14.3 ± 0.2 0.51
Hypoxia 33.9 ± 0.1* 1.4 ± 0.2* 20.7 ± 0.2 0.71
24h Post Hypoxia 36.9 ± 0.1* 0.1 ± 0.1* 14.7 ± 1.6 0.02
48h Post Hypoxia 36.7 ± 0.1* 0.7 ± 0.1 14.3 ± 0.2 0.62
72h Post Hypoxia 36.7 ± 0.1* 0.7 ± 0.1 20.5 ± 0.2 0.65
Activity (AU)
Baseline 4.0 ± 0.5 1.7 ± 0.7 14.3 ± 0.4 0.21

This article is protected by copyright. All rights reserved.
Hypoxia 1.2 ± 0.2* 0.4 ± 0.2 14.1 ± 0.6 0.15
24h Post Hypoxia 4.6 ± 0.6 1.8 ± 0.9 13.5 ± 0.5 0.16
48h Post Hypoxia 4.6 ± 0.7 3.0 ± 0.9 20.7 ± 0.3 0.33
72h Post Hypoxia 4.5 ± 0.7 2.5 ± 1.0 20.5 ± 0.4 0.25
15% O2
SBP (mmHg)
Baseline 117.1 ± 0.9 6.0 ± 1.2 14.3 ± 0.2 0.54
Hypoxia 114.2 ± 0.9* 4.9 ± 1.3 20.5 ± 0.3 0.45
24h Post Hypoxia 114.6 ± 1.0 4.2 ± 1.4 14.0 ± 0.3 0.30
48h Post Hypoxia 110.6 ± 0.7* 4.6 ± 1.1 20.0 ± 0.2 0.47
72h Post Hypoxia 109.0 ± 0.9* 6.2 ± 1.3 20.3 ± 0.2 0.54
HR (bpm)
Baseline 516 ± 4 33 ± 6 14.5 ± 0.2 0.59
Hypoxia 537 ± 6* 16 ± 8* 1.0 ± 0.5* 0.16
24h Post Hypoxia 491 ± 6* 34 ± 8 14.3 ± 0.2 0.48
48h Post Hypoxia 490 ± 6* 29 ± 8 14.4 ± 0.3 0.40
72h Post Hypoxia 491 ± 7* 44 ± 10 14.4 ± 0.2 0.50
Temperature (°C)
Baseline 36.3 ± 0.1 0.5 ± 0.1 20.4 ± 0.1 0.73
Hypoxia 36.2 ± 0.1 0.6 ± 0.1 14.0 ± 0.2 0.71
24h Post Hypoxia 36.4 ± 0.1 0.6 ± 0.1 20.4 ± 0.2 0.69
48h Post Hypoxia 36.4 ± 0.1 0.6 ± 0.1 14.1 ± 0.2 0.68
72h Post Hypoxia 36.4 ± 0.1 0.7 ± 0.1 20.4 ± 0.1 0.76

This article is protected by copyright. All rights reserved.
Activity (AU)
Baseline 4.0 ± 0.3 1.6 ± 0.4 20.3 ± 0.3 0.39
Hypoxia 4.5 ± 0.4 2.3 ± 0.6 20.3 ± 0.3 0.42
24h Post Hypoxia 4.9 ± 0.4 2.2 ± 0.6 20.3 ± 0.3 0.39
48h Post Hypoxia 4.4 ± 0.5 2.4 ± 0.6 20.2 ± 0.3 0.40
72h Post Hypoxia 5.5 ± 0.5* 3.6 ± 0.7* 20.1 ± 0.2 0.53
Data are mean ± SEM. SBP, systolic blood pressure; HR, heart rate; mesor, midline estimating
statistic of rhythm; amplitude, half the extent of predictable variation within a cycle; acrophase, the
time of overall high values recurring in each cycle; R2, degree of curve fit. *p<0.05 compared to
baseline.
Table 3. Frequency and time domain heart rate variability analysis
15% O2 9% O2
Baseline 72h Post Hypoxia Baseline 72h Post Hypoxia
Mean R-R interval (ms) b 123.49 ± 13.38 141.21 ± 17.14 129.43 ± 7.28 150.43 ± 18.87*
SDNN (ms) b
5.52 ± 2.70 7.89 ± 2.61* 5.39 ± 1.45 7.24 ± 1.83
RMSSD (ms) b
6.57 ± 3.30 10.59 ± 3.92* 6.36 ± 2.16 8.47 ± 2.76
LF (nu) a
62.18 ± 8.72 57.08 ± 6.17* 62.12 ± 6.85 73.59 ± 4.91*†
HF (nu) a,c
37.82 ± 8.72 42.91 ± 6.17* 37.88 ± 6.85 26.41 ± 4.91*†
Total power (ms2)
b 43.35 ± 37.76 73.19 ± 36.72 31.84 ± 15.66 60.55 ± 33.49
LF/HF a,c
2.32 ± 0.87 1.79 ± 0.45 2.56 ± 1.00 3.53 ± 0.79*†
Data are mean ± SD. SDNN, standard deviations of normal R-R intervals; RMSSD, root mean square
of successive normal R-R interval differences; LF, low frequency; HF, high frequency; a, significant
interaction; b, significant main effect of time; c, significant main effect of group. *p<0.05 as
compared to baseline; †p<0.05 compared to moderate hypoxia at the same time point (n=7 per
group).
This article is protected by copyright. All rights reserved.
Table 4. Heart rate variability analysis at baseline, hypoxia, and normoxic recovery
Group 9% O2 15% O2
Mean R-R interval (ms) a,b,c
Baseline 129.43 ± 7.28 123.49 ± 13.38
Hypoxia 175.16 ± 22.53*† 121.32 ± 13.55
24h Post Hypoxia 150.25 ± 16.82* 140.84 ± 15.05*
48h Post Hypoxia 155.77 ± 5.15* 141.72 ± 19.68*
72h Post Hypoxia 150.43 ± 18.87* 141.21 ± 17.14*
SDNN (ms) a,b,c
Baseline 5.39 ± 1.45 5.52 ± 2.70
Hypoxia 25.20 ± 9.85*† 4.52 ± 2.20
24h Post Hypoxia 11.69 ± 3.29* 6.92 ± 3.24
48h Post Hypoxia 8.36 ± 2.25 6.32 ± 2.78
72h Post Hypoxia 7.24 ± 1.83 7.89 ± 2.61
RMSSD (ms) a,b,c
Baseline 6.36 ± 2.16 6.57 ± 3.30
Hypoxia 33.60 ± 15.08*† 4.94 ± 2.49
24h Post Hypoxia 14.60 ± 5.14* 8.71 ± 4.31
48h Post Hypoxia 9.50 ± 3.39 7.77 ± 3.82
72h Post Hypoxia 8.47 ± 2.76 10.59 ± 3.92
LF (nu) a,b
Baseline 62.12 ± 6.85 62.18 ± 8.72
Hypoxia 72.17 ± 10.00* 68.37 ± 6.45
24h Post Hypoxia 65.49 ± 13.86 60.75 ± 7.84
48h Post Hypoxia 72.91 ± 10.97* 60.93 ± 9.52
72h Post Hypoxia 73.59 ± 4.91*† 57.08 ± 6.17

This article is protected by copyright. All rights reserved.
HF (nu) a,b
Baseline 37.88 ± 6.85 37.82 ± 8.72
Hypoxia 27.82 ± 10.00* 31.62 ± 6.45
24h Post Hypoxia 34.50 ± 13.85 39.25 ± 7.84
48h Post Hypoxia 27.09 ± 10.97* 39.07 ± 9.52
72h Post Hypoxia 26.41 ± 4.91*† 42.91 ± 6.17
Total power (ms2)
a,b,c
Baseline 31.84 ± 15.66 43.35 ± 37.76
Hypoxia 971.04 ± 686.84*† 25.84 ± 22.81
24h Post Hypoxia 154.51 ± 86.83 50.97 ± 46.43
48h Post Hypoxia 70.33 ± 32.30 42.43 ± 29.83
72h Post Hypoxia 60.55 ± 33.49 73.19 ± 36.72
LF/HF b,c
Baseline 2.56 ± 1.00 2.32 ± 0.87
Hypoxia 4.30 ± 1.35* 3.14 ± 0.67
24h Post Hypoxia 3.43 ± 3.00 2.11 ± 0.71
48h Post Hypoxia 4.10 ± 2.27*† 2.02 ± 1.01
72h Post Hypoxia 3.53 ± 0.79 1.79 ± 0.45
Data are mean ± SD. SDNN, standard deviations of normal R-R intervals; RMSSD, root mean square
of successive normal R-R interval differences; LF, low frequency; HF, high frequency; a, significant
interaction; b, significant main effect of time; c, significant main effect of group. *p<0.05 as
compared to baseline; †p<0.05 compared to moderate hypoxia at the same time point (n=7).

This article is protected by copyright. All rights reserved.
Figure Legends
Figure 1. Hypoxia chamber and telemetry unit setup.
Figure 2. Physiological responses of body temperature during baseline, severe (A) or moderate (B) hypoxia, and 72 hours of normoxic recovery. Average body temperatures recorded following normoxia, severe hypoxia, 24 hours post-hypoxia, 48 hours post-hypoxia, and 72 hours post-hypoxia
during lights on (C; 2(4)=235.3, p<0.0001) and lights off (D; F(4,316)=269.8, p<0.0001). Average body temperatures recorded following baseline, moderate hypoxia, 24 hours post-hypoxia, 48 hours
post-hypoxia, and 72 hours post-hypoxia during lights on (E; 2(4)=23.4, p=0.0001) and lights off (F; F(4,316)=7.4, p<0.0001). Two-way ANOVA of body temperature during lights on (G; interaction F(4,56)=94.0, p<0.0001; main effect of time F(4,56)=113.1, p<0.0001; main effect of group F(1,14)=1.1, p=0.3158) and lights off (H; interaction F(4,56)=20.8, p<0.0001; main effect of time F(4,56)=29.8, p<0.0001; main effect of group F(1,14)=0.1, p=0.7579). a, significant interaction; b,
This article is protected by copyright. All rights reserved.
significant main effect of time; c, significant main effect of group. For all panels, *p<0.05 compared to baseline, †p<0.05 compared to moderate hypoxia at the same time point. Values expressed are mean ± SEM (n=8 per group). Note: y-axes for panels A and B are broader than panels C to H for visual clarity.
This article is protected by copyright. All rights reserved.
Figure 3. Graphical representation of cosinor analysis of severe hypoxia (9% O2).

This article is protected by copyright. All rights reserved.
Figure 4. Graphical representation of cosinor analysis of moderate hypoxia (15% O2).
Figure 5. Physiological responses of activity during baseline, severe (A) or moderate (B) hypoxia, and 72 hours of normoxic recovery. Average activity recorded following baseline, severe hypoxia, 24 hours post-hypoxia, 48 hours post-hypoxia, and 72 hours post-hypoxia during lights on (C;
2(4)=80.7, p<0.0001) and lights off (D; 2(4)=112.8, p<0.0001). Average body temperatures

This article is protected by copyright. All rights reserved.
recorded following baseline, moderate hypoxia, 24 hours post-hypoxia, 48 hours post-hypoxia, and
72 hours post-hypoxia during lights on (E; 2(4)=14.7, p=0.0055) and lights off (F; 2(4)=10.1, p=0.0396). Two-way ANOVA of activity during lights on (G; interaction F(4,56)=4.0, p=0.0062; main effect of time F(4,56)=10.0, p<0.0001; main effect of group F(1,14)=1.3, p=0.2791) and lights off (H; interaction F(4,56)=11.8, p<0.0001; main effect of time F(4,56)=13.5, p<0.0001; main effect of group F(1,14)=3.2, p=0.0945). a, significant interaction; b, significant main effect of time; c, significant main effect of group. For all panels, *p<0.05 compared to baseline, †p<0.05 compared to moderate hypoxia at the same time point. Values expressed are mean ± SEM (n=8 per group). Note: y-axes for panels A and B are broader than panels C to H for visual clarity.
0
2
4
6
8
10
Act
ivity
(AU
)
Lights On
*
Severe Hypoxia (9%)0
2
4
6
8
10
Lights Off
*
0
2
4
6
8
10
Lights On
Moderate Hypoxia (15%)0
2
4
6
8
10
Lights Off
*
Baseline
Hypoxia
24h Post
48h Post
72h Post
0
2
4
6
8
10
Lights On
Act
ivity
(AU
)
a,b
†
Baseline
Hypoxia
24h Post
48h Post
72h Post
0
2
4
6
8
10
Lights Off
†
a,b
0 12 24 36 48 60 72 84 96 108 120 132
0
5
10
15
Act
ivity
(AU
)
Severe Hypoxia (9% O2)
0 12 24 36 48 60 72 84 96 108 120 132
0
5
10
15
Zeitgeber Time (h)
Act
ivity
(AU
)
Moderate Hypoxia (15% O2)
A
B
C
G
D
H
E F
Baseline Hypoxia Normoxic Recovery Lights Off
Baseline Hypoxia 24h Post Hypoxia 48h Post Hypoxia 72h Post Hypoxia
Moderate Hypoxia (15%)Severe Hypoxia (9%)

This article is protected by copyright. All rights reserved.
Figure 6. Physiological responses of systolic blood pressure (SBP) during baseline, severe (A) or moderate (B) hypoxia, and 72 hours of normoxic recovery. Average SBP recorded following baseline, severe hypoxia, 24 hours post-hypoxia, 48 hours post-hypoxia, and 72 hours post-hypoxia during
lights on (C; 2(4)=85.4, p<0.0001) and lights off (D; 2(4)=41.2, p<0.0001). Average SBP recorded following baseline, moderate hypoxia, 24 hours post-hypoxia, 48 hours post-hypoxia, and 72 hours
post-hypoxia during lights on (E; 2(4)=50.9, p<0.0001) and lights off (F; 2(4)=52.5, p<0.0001). Two-way ANOVA of SBP during lights on (G; interaction F(4,24)=11.5, p<0.0001; main effect of time F(4,24)=4.6, p=0.0067; main effect of group F(1,6)=1.4, p=0.2779) and lights off (H; interaction F(4,24)=3.3, p=0.0265; main effect of time F(4,24)=0.1, p=0.9830; main effect of group F(1,6)=0.7, p=0.4329). a, significant interaction; b, significant main effect of time; c, significant main effect of group. For all panels, *p<0.05 compared to baseline, †p<0.05 compared to moderate hypoxia at the same time point. Values expressed are mean ± SEM (severe, n=4; moderate, n=5).
80
100
120
140
Syst
olic
BP
(mm
Hg)
Lights On
*
Severe Hypoxia (9%)
* * *
80
100
120
140
Lights Off
**
80
100
120
140
Lights On
Moderate Hypoxia (15%)
**
80
100
120
140
Lights Off
**
**
*
Baseline
Hypoxia
24h Post
48h Post
72h Post
80
100
120
140
Lights On
Syst
olic
BP
(mm
Hg)
a,b
Baseline
Hypoxia
24h Post
48h Post
72h Post
80
100
120
140
Lights Offa
0 12 24 36 48 60 72 84 96 108 120 132
80
100
120
140
Syst
olic
BP
(mm
Hg)
Severe Hypoxia (9% O2)
0 12 24 36 48 60 72 84 96 108 120 132
80
100
120
140
Zeitgeber Time (h)
Syst
olic
BP
(mm
Hg)
Moderate Hypoxia (15% O2)
A
B
G
Baseline Hypoxia 24h Post Hypoxia 48h Post Hypoxia 72h Post Hypoxia
Moderate Hypoxia (15%)Severe Hypoxia (9%)
Baseline Hypoxia Normoxic Recovery Lights Off
C D
H
E F
This article is protected by copyright. All rights reserved.
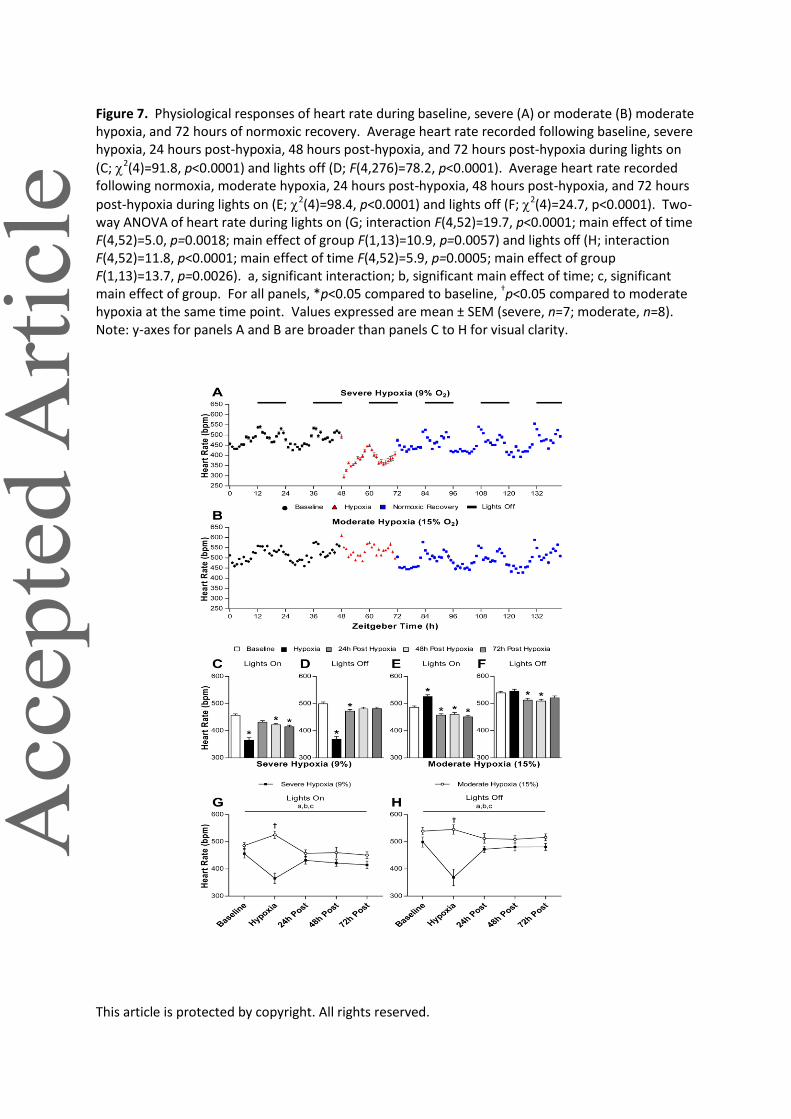
Figure 7. Physiological responses of heart rate during baseline, severe (A) or moderate (B) moderate hypoxia, and 72 hours of normoxic recovery. Average heart rate recorded following baseline, severe hypoxia, 24 hours post-hypoxia, 48 hours post-hypoxia, and 72 hours post-hypoxia during lights on
(C; 2(4)=91.8, p<0.0001) and lights off (D; F(4,276)=78.2, p<0.0001). Average heart rate recorded following normoxia, moderate hypoxia, 24 hours post-hypoxia, 48 hours post-hypoxia, and 72 hours
post-hypoxia during lights on (E; 2(4)=98.4, p<0.0001) and lights off (F; 2(4)=24.7, p<0.0001). Two-way ANOVA of heart rate during lights on (G; interaction F(4,52)=19.7, p<0.0001; main effect of time F(4,52)=5.0, p=0.0018; main effect of group F(1,13)=10.9, p=0.0057) and lights off (H; interaction F(4,52)=11.8, p<0.0001; main effect of time F(4,52)=5.9, p=0.0005; main effect of group F(1,13)=13.7, p=0.0026). a, significant interaction; b, significant main effect of time; c, significant main effect of group. For all panels, *p<0.05 compared to baseline, †p<0.05 compared to moderate hypoxia at the same time point. Values expressed are mean ± SEM (severe, n=7; moderate, n=8). Note: y-axes for panels A and B are broader than panels C to H for visual clarity.
This article is protected by copyright. All rights reserved.
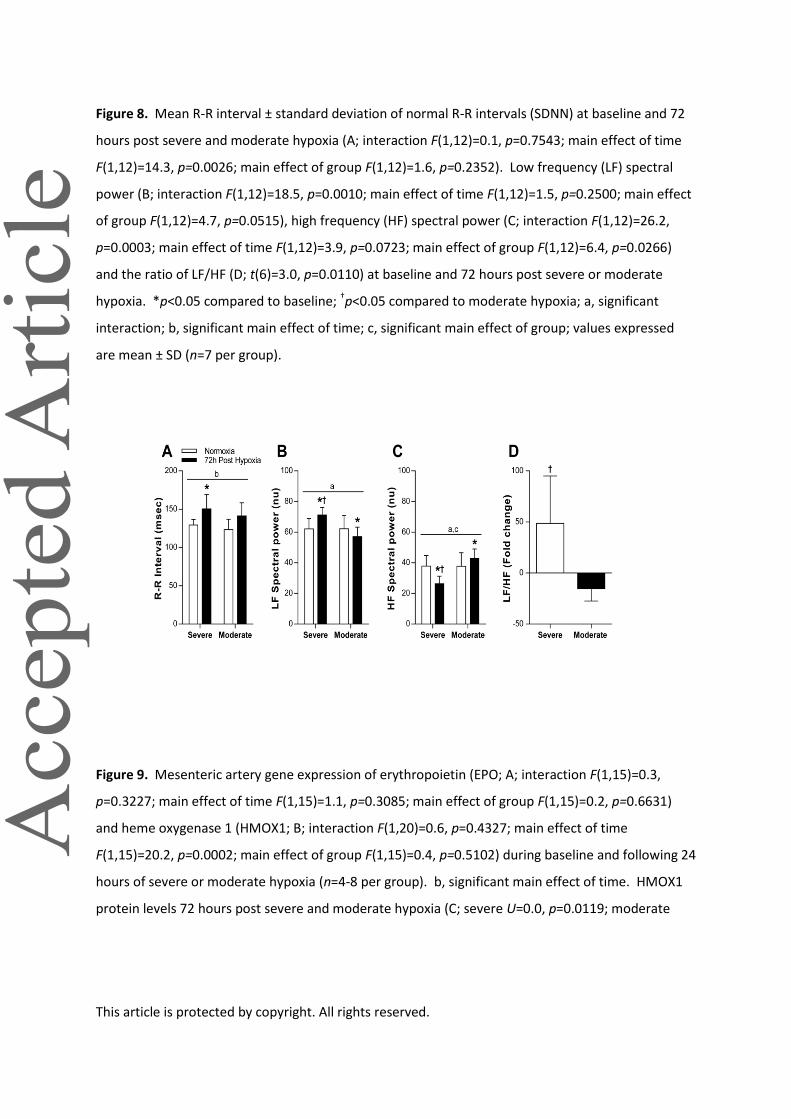
Figure 8. Mean R-R interval ± standard deviation of normal R-R intervals (SDNN) at baseline and 72
hours post severe and moderate hypoxia (A; interaction F(1,12)=0.1, p=0.7543; main effect of time
F(1,12)=14.3, p=0.0026; main effect of group F(1,12)=1.6, p=0.2352). Low frequency (LF) spectral
power (B; interaction F(1,12)=18.5, p=0.0010; main effect of time F(1,12)=1.5, p=0.2500; main effect
of group F(1,12)=4.7, p=0.0515), high frequency (HF) spectral power (C; interaction F(1,12)=26.2,
p=0.0003; main effect of time F(1,12)=3.9, p=0.0723; main effect of group F(1,12)=6.4, p=0.0266)
and the ratio of LF/HF (D; t(6)=3.0, p=0.0110) at baseline and 72 hours post severe or moderate
hypoxia. *p<0.05 compared to baseline; †p<0.05 compared to moderate hypoxia; a, significant
interaction; b, significant main effect of time; c, significant main effect of group; values expressed
are mean ± SD (n=7 per group).
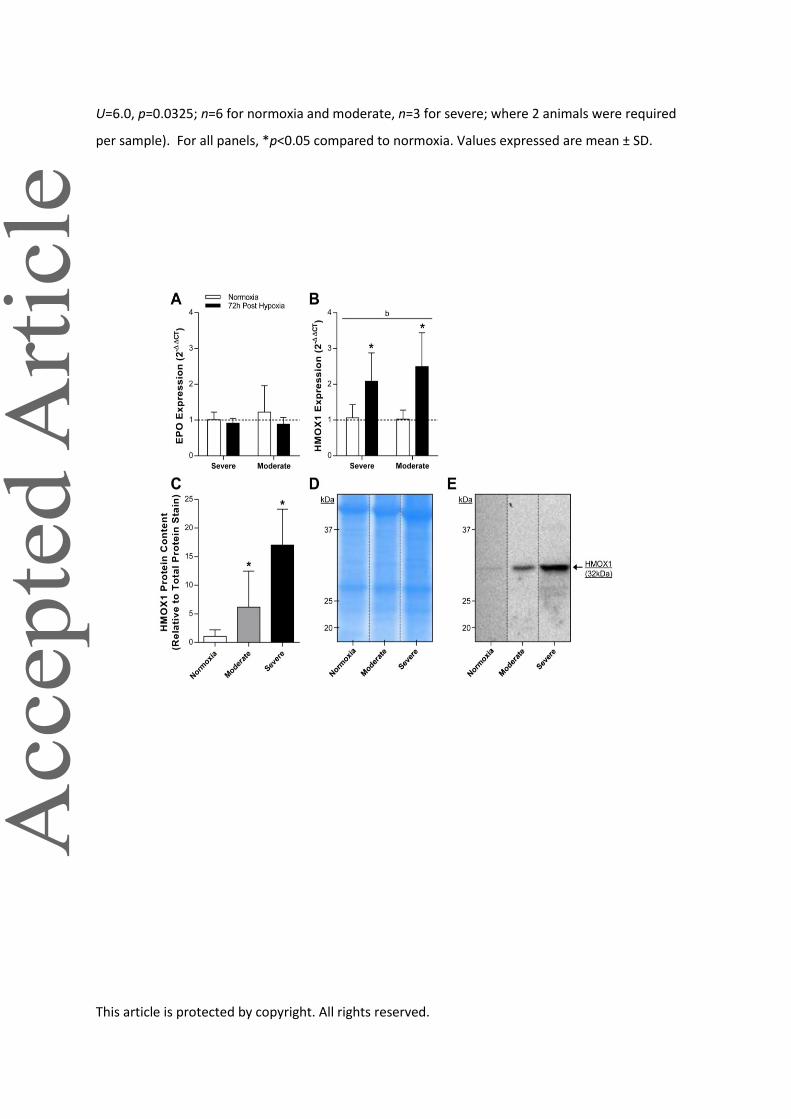
Figure 9. Mesenteric artery gene expression of erythropoietin (EPO; A; interaction F(1,15)=0.3,
p=0.3227; main effect of time F(1,15)=1.1, p=0.3085; main effect of group F(1,15)=0.2, p=0.6631)
and heme oxygenase 1 (HMOX1; B; interaction F(1,20)=0.6, p=0.4327; main effect of time
F(1,15)=20.2, p=0.0002; main effect of group F(1,15)=0.4, p=0.5102) during baseline and following 24
hours of severe or moderate hypoxia (n=4-8 per group). b, significant main effect of time. HMOX1
protein levels 72 hours post severe and moderate hypoxia (C; severe U=0.0, p=0.0119; moderate
This article is protected by copyright. All rights reserved.
U=6.0, p=0.0325; n=6 for normoxia and moderate, n=3 for severe; where 2 animals were required
per sample). For all panels, *p<0.05 compared to normoxia. Values expressed are mean ± SD.