modern mtds measurements - nptelnptel.ac.in/courses/105106114/pdfs/unit15/15_3.pdf · 15.3 modern...
TRANSCRIPT

Hydraulics Prof. B.S. Thandaveswara
Indian Institute of Technology Madras
15.3 Modern Methods of Flow Measurements
Any Engineering or natural phenomenon which deserves and attracts the attention of
Engineer needs to be studied before it can be analysed. The word study is meant to
mean 'observations and analysis'. These observations require the measurement of
phenomenon and this is where measurement techniques come into picture.
It is specially so in hydraulics considering what LEONARDO DA VINCI said about
hydraulics.
"If you have anything to do with the water, first do the experiment and then ponder
about the results".
An experiment means detail recording and measurement of phenomenon. The degree
of sophistication depending upon complexity of phenomenon and its importance. For
example measurement of discharge in a channel a gauge may be sufficient, whereas
measurement of turbulence requires hot wire anemometry and other accessory
instrumentation.
The definition of data processing is the conversion of raw data into information.
Information is such a value from which decision can be made and results inferred. Data
processing can be performed manually with the aid of simple tools as paper, pencil and
fitting cabinets or electronically with the aid of computer.
15.3.1 INSTRUMENTATION OF DATA PROCESSING
For determination of discharge one should know the relationship between stage and
discharge. A rating curve is drawn for a particular section, it is nothing but the functional
relation between stage and discharge.

Hydraulics Prof. B.S. Thandaveswara
Indian Institute of Technology Madras
STAGE (m)
DISCHARGE m3/s
H
Typical Stage Discharge Relationship
Measuring stage:
Water surface
Bed
Definition of stage
H (M.S.L)(Above Mean Sea Level)
Datum
EL 210.00 m
EL 205.00 m
EL 200.00 m
The height of a stream water surface above an arbitrary datum is called "the stage".
Stage records are also used for designing of hydraulic structures, in flood warning
systems and in planning of the use of flood plains.
Hydraulics Prof. B.S. Thandaveswara
Indian Institute of Technology Madras
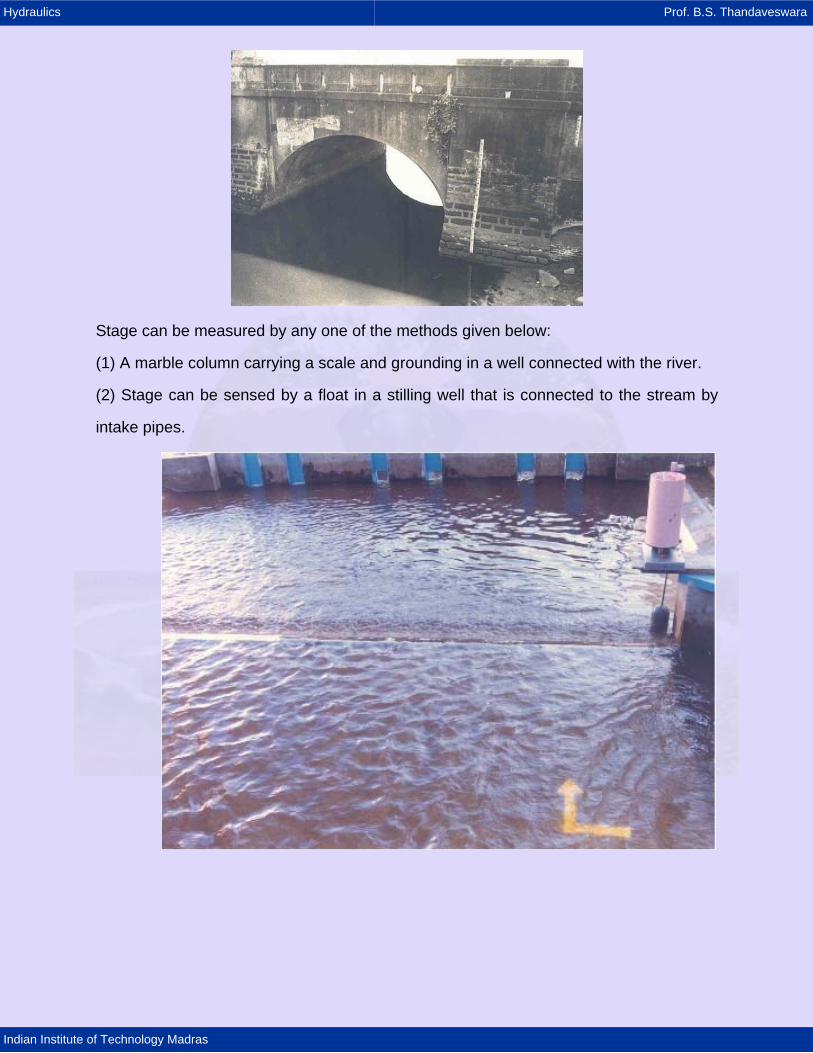
Stage can be measured by any one of the methods given below:
(1) A marble column carrying a scale and grounding in a well connected with the river.
(2) Stage can be sensed by a float in a stilling well that is connected to the stream by
intake pipes.

Hydraulics Prof. B.S. Thandaveswara
Indian Institute of Technology Madras
(3) Stage can be sensed with a gas purge system known as bubble gauge. The gas is
fed through a tube and bubbled freely from an orifice mounted in the stream. The
pressure in the tube, measured with a zero-displacement mercury monometer, is equal
to the piezometric head on the bubble orifice. It has an accuracy of about ± 2 mm.
Stage is recorded directly on a strip chart or may be punched on a paper tape to be fed
directly to a computer.
15.3.2 Stream flow measurement
Generally three methods are used for making stream flow measurements.
1. Current meter.
2. Dilution techniques.
3. Indirect methods.
(1) Current meter: Different types of current meter are available for measuring velocity
at points in a stream. The price current meter, consists of vertical axis rotor with six
curve shaped cups (vanes) pointing in a horizontal plane. The OH- meter, widely used

Hydraulics Prof. B.S. Thandaveswara
Indian Institute of Technology Madras
in Germany, is a horizontal axis meter that measures the components of velocity
parallel to the meter axis. The current meter is calibrated by noting down revolutions per
minute (rpm) for different known velocity and calibration curve is plotted velocity is
measured at 0.2 to 0.8 of the flow depth.
(2) Dilution technique: Two dilution techniques are (1) the steady feed method and (2)
the instantaneous, point - source time indigenous method.
For steady feed method, a solution of tracer material with concentration C1 is injected at
the constant injection rate QT
C
C2
TIMECONCENTRATION-TIME CURVE MEASURED AT X2
SKETCH OF THE REACH
X2
X2C2X1
X1
INJECTIONQT
C1 Concentration
The tracer disperses laterally into the flow and tracer concentration distribution is similar
to as shown in figure. At some point X2 downstream, where the tracer material is
approximately uniformly mixed, the flow is sampled continuously.
By continuity ( )T 1 T 2Q C = Q+Q C
in which
Q is the stream discharge, C2 is the concentration at X2
If TQ << Q and if there is no tracer loss
Hydraulics Prof. B.S. Thandaveswara
Indian Institute of Technology Madras
T 1 2
T 1
2
Q C QCthen
Q CQ=C
=
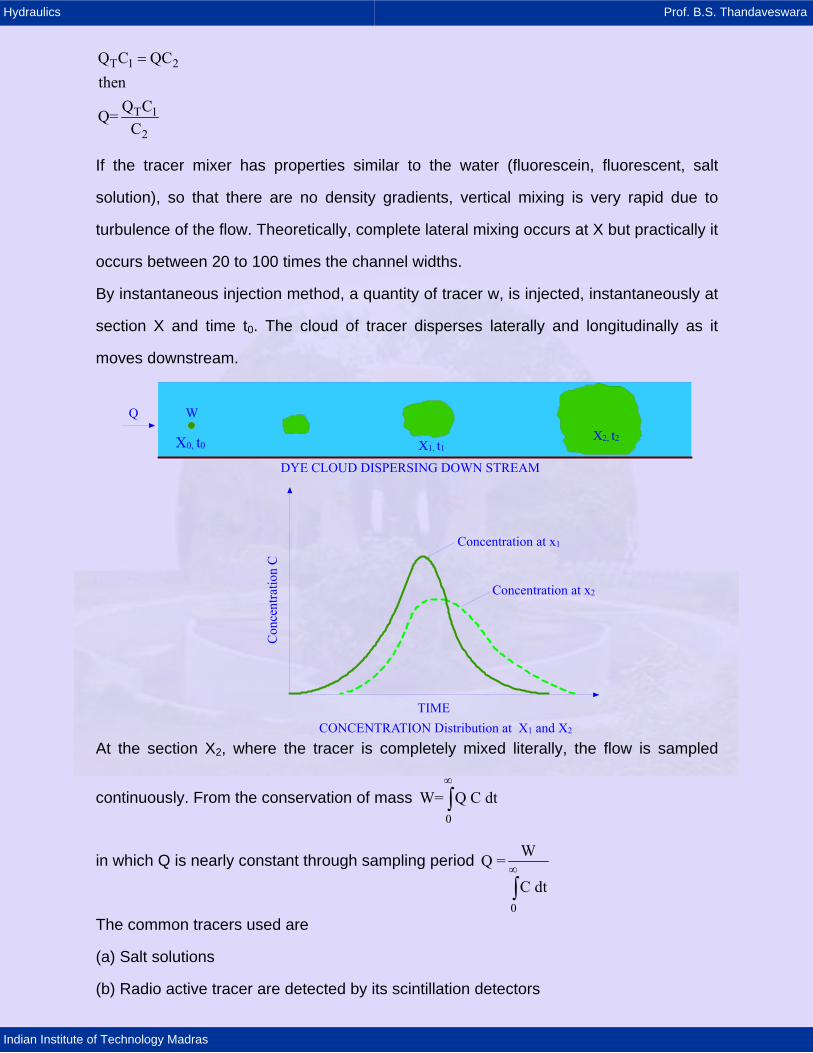
If the tracer mixer has properties similar to the water (fluorescein, fluorescent, salt
solution), so that there are no density gradients, vertical mixing is very rapid due to
turbulence of the flow. Theoretically, complete lateral mixing occurs at X but practically it
occurs between 20 to 100 times the channel widths.
By instantaneous injection method, a quantity of tracer w, is injected, instantaneously at
section X and time t0. The cloud of tracer disperses laterally and longitudinally as it
moves downstream.
W
X0, t0
Concentration at x1
Concentration at x2
TIMECONCENTRATION Distribution at X1 and X2
X1, t1X2, t2
DYE CLOUD DISPERSING DOWN STREAM
Q
At the section X2, where the tracer is completely mixed literally, the flow is sampled
continuously. From the conservation of mass 0
W= Q C dt∞
∫
in which Q is nearly constant through sampling period
0
WQ =C dt
∞
∫
The common tracers used are
(a) Salt solutions
(b) Radio active tracer are detected by its scintillation detectors

Hydraulics Prof. B.S. Thandaveswara
Indian Institute of Technology Madras
(c) Fluorescent dyes with flourometers.
Advantage of dilution method, they condensed in closed conduits, such as penstocks,
sewers pipe lines, where current-meter measurements are difficult, and they are fast
and accurate.
Disadvantages: Expensive for measuring large stream and the special equipments
required for the measurements of concentration.
(3) Indirect Method: Involved using various empirical formulae when it is impossible to
measure discharge such as during floods. Empirical formulae like Flaming, Manning,
Strickler formulae etc are used.
Determination of sediment concentration:
The distribution of sediment concentration is not uniform over the cross section. It varies
with particle size and with depth. It is found that 0.062 mm is distributed almost
uniformly.
0
10
20
30
40WATER SURFACE
SEDIMENT CONCENTRATION
15.3.3 MODERN MEASURING TECHNIQUES
The two principle techniques that are used in the modern measuring instruments are
'Electro-acoustics' (ultrasonic frequencies) and
'Electro-optics'.
Characteristics of sound transmission:
Sound transmission in an elastic medium has the characteristic of wave motion and its
speed is dependent upon the elasticity and density of the medium. For water, these
properties are in turn affected by the temperature, pressure, and salinity. An empirical
formula for the velocity of sound in water is given by

Hydraulics Prof. B.S. Thandaveswara
Indian Institute of Technology Madras
2C =141000 + 421 T - 3.7 T + 110 S + 0.018 y
in which C is the velocity of transmission on cm/s, T is the temperature of the water in
°C, S is the Salinity in pairs per thousand, y is the depth below the surface in cm.
Refraction: occurs around the solid obstacles placed in the path of transmission, or by
temperature or density stratified layers.
Reflection: Any body immersed in water everywhere to reflect sound in. In particular the
bottom and the surface of the water can reflect sound in. In particular the bottom and
the surface of the water can reflect acoustic waves. If a body is perfect reflector, all the
energy intercepted is reflected. If however, the body is an imperfect reflector part of
interrupted energy is absorbed by the body as heat and only part of the energy is
reflected.
The Ultrasonic method:
Principle: Of the ultrasonic method is to measure the velocity of flow at certain depth in
the channel by simultaneously transmitting sound pulses through the water from
transducers located in the banks on either side of the river. The transducers, which are
designed to both transmit and receive sound pulses, are not located directly but are
staggered so that angle between the pulse path and the direction of flow is between 30°
to 60° . The difference between the time of travel of the pulses in two different directions
is directly related to the average velocity of the water at the depth of the transducer.
This velocity can then be related to the average velocity of flow of the whole cross
section and, if desirable, by incorporating an area factor in the electronic processor, the
system can give an output of discharge.
FLOW
B
A
θ
rp
v
Hydraulics Prof. B.S. Thandaveswara
Indian Institute of Technology Madras
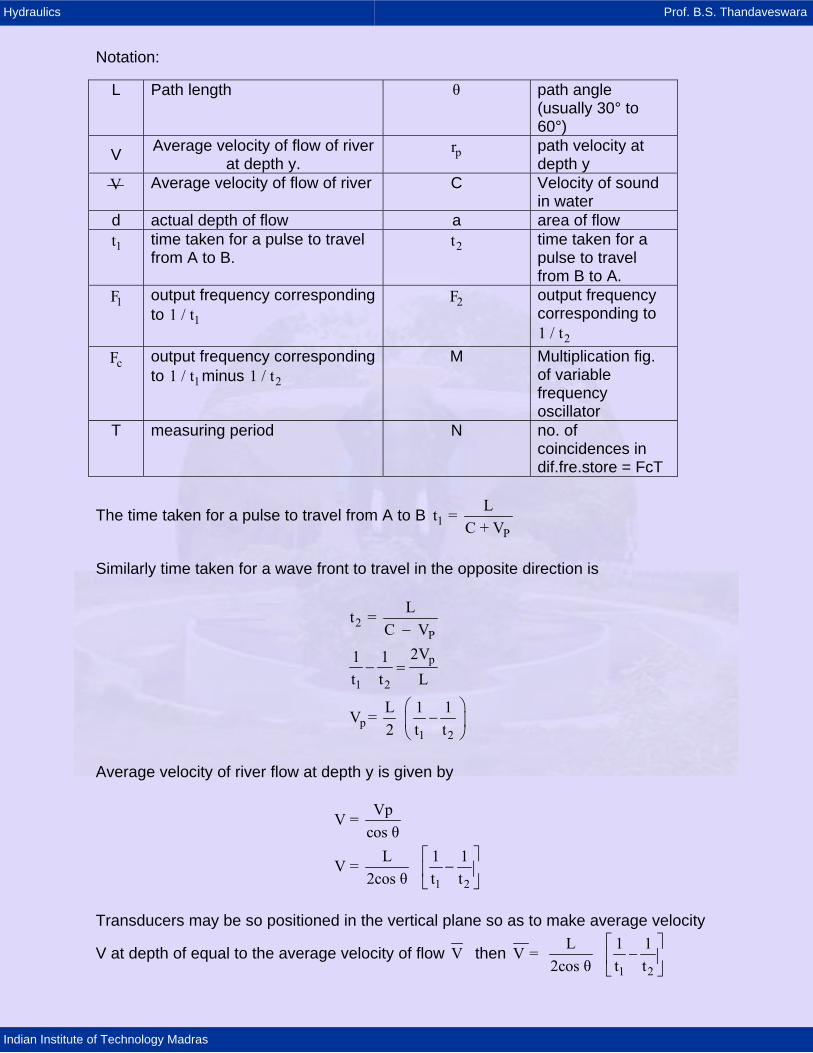
Notation:
L Path length θ path angle (usually 30° to 60°)
V Average velocity of flow of river at depth y.
pr path velocity at depth y
V Average velocity of flow of river C Velocity of sound in water
d actual depth of flow a area of flow 1t time taken for a pulse to travel
from A to B. 2t time taken for a
pulse to travel from B to A.
1F output frequency corresponding to 11 / t
2F output frequency corresponding to
21 / t
cF output frequency corresponding to 11 / t minus 21 / t
M Multiplication fig. of variable frequency oscillator
T measuring period N no. of coincidences in dif.fre.store = FcT
The time taken for a pulse to travel from A to B 1P
Lt = C + V
Similarly time taken for a wave front to travel in the opposite direction is
2P
p
1 2
p1 2
Lt = C V
2V1 1t t L
L 1 1V = 2 t t
−
− =
⎛ ⎞−⎜ ⎟
⎝ ⎠
Average velocity of river flow at depth y is given by
1 2
VpV = cos θ
L 1 1V = 2cos θ t t
⎡ ⎤−⎢ ⎥
⎣ ⎦
Transducers may be so positioned in the vertical plane so as to make average velocity
V at depth of equal to the average velocity of flow V then 1 2
L 1 1V = 2cos θ t t
⎡ ⎤−⎢ ⎥
⎣ ⎦
Hydraulics Prof. B.S. Thandaveswara
Indian Institute of Technology Madras
If 'Q' is discharge
Q = aV = V- dsinθ
2
1 2
L 1 1Q = d tanθ2 t t
⎡ ⎤−⎢ ⎥
⎣ ⎦
There are two methods of obtaining discharge in use at present, the first where the
transducers are fixed in position and station calibrated by current meter and second
case where transducers are designed to slide on either a vertical plane or an inclined
assembly. In this case no current meter measurements are necessary, self calibrating
one. By nothing transducers through number of paths in the vertical, velocity readings
are obtained along these paths. From each set of readings vertical velocity curves are
established over as large a range in stage possible. It is then possible to estimate first, a
suitable position for the fixing of the transducers into vertical and second to establish a
curve stage the co-efficient of discharge as in first method.

Hydraulics Prof. B.S. Thandaveswara
Indian Institute of Technology Madras
Projector
ReceiverProjector
Detector
RecorderComputer
Receiver A
Clock Receiver B
Pulser
L
Schematic illustration for the Arrangement of Sound Projector and Receiver
V
VP
Flowθ
2. ELECTRO-ACOUSTIC MEASUREMENT OF FLOW DEPTH
A single transducer is used as the projector and receiver of sound energy for
measurement of flow depth, using either the channel bed or water surface to reflect the
projected sound wave back toward the receiver along the same acoustic axis. This
instrument generally referred to as a depth sounder, the velocity of the water does not
affect the signal as the direction of interrogation is generally perpendicular to the flow
direction downward to the bed or upward to the water surface. Hence, the distance from
transducer to the reflecting surface can be determined directly from the time lapse
between projection and acceptor and the velocity of sound in to the water. The
schematic arrangement shown in fig.
Hydraulics Prof. B.S. Thandaveswara
Indian Institute of Technology Madras
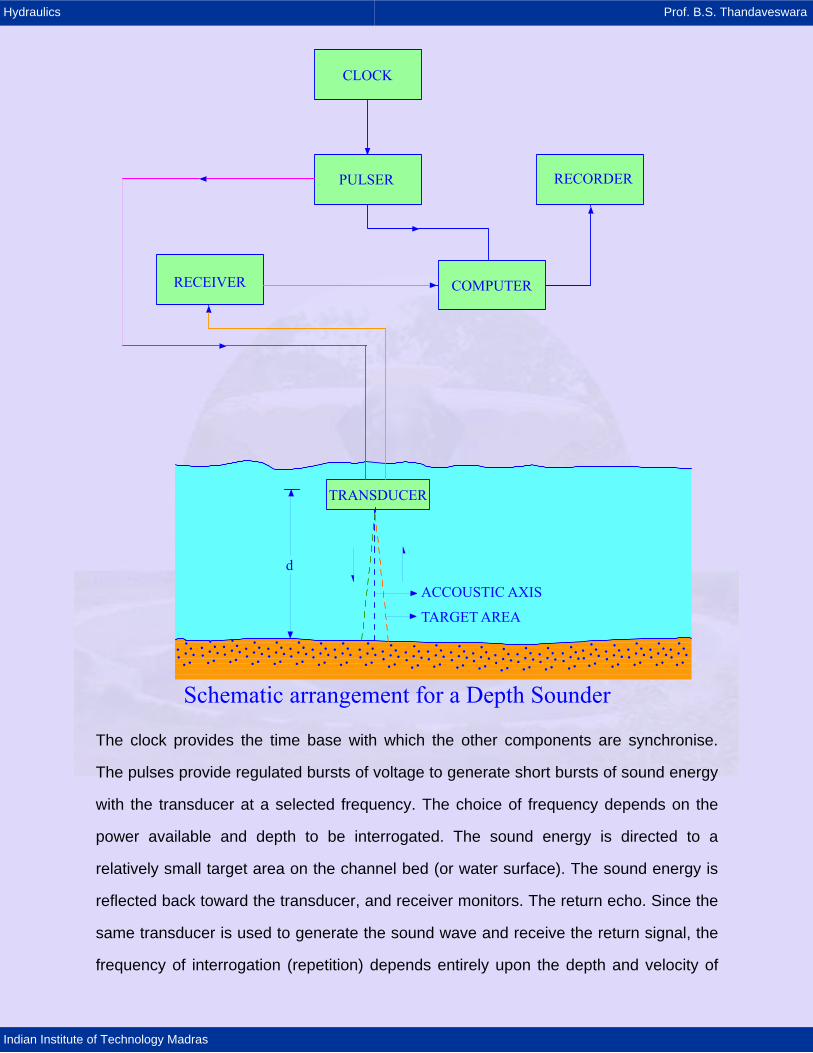
Schematic arrangement for a Depth Sounder
CLOCK
PULSER RECORDER
COMPUTERRECEIVER
TRANSDUCER
ACCOUSTIC AXIS
TARGET AREA
d
The clock provides the time base with which the other components are synchronise.
The pulses provide regulated bursts of voltage to generate short bursts of sound energy
with the transducer at a selected frequency. The choice of frequency depends on the
power available and depth to be interrogated. The sound energy is directed to a
relatively small target area on the channel bed (or water surface). The sound energy is
reflected back toward the transducer, and receiver monitors. The return echo. Since the
same transducer is used to generate the sound wave and receive the return signal, the
frequency of interrogation (repetition) depends entirely upon the depth and velocity of

Hydraulics Prof. B.S. Thandaveswara
Indian Institute of Technology Madras
the sound waves. The computer simply determines the time lapse between the clock
pulse and return echo, or signal and converts the information to voltage which can
subsequently be interpreted in time of depth.
Factors affecting the reliability of an ultrasonic depth so under.
The most notable among them is the suspended sediment concentration of the stream.
15.3.4 ELECTRO-OPTICAL INSTRUMENTS
The Principle on which these instruments work is scattering of light by particles in the
medium is the basic principle. Instruments are available which can measure 'in situ'
suspended particle concentration in a dynamic flow fluid and multi dimensional
component measurements of fluid velocity and turbulence. The first of these
instruments uses a wide-frequency band, visible light source which are the second
utilizes a narrow band coherent laser beam.
ELECTRO-OPTICAL MEASUREMENTS OF PARTICLE CONCENTRATION:
A wide frequency band electro optical instrument for measuring point concentration of a
particulate matter in a flow field has been developed. The principle of operation is based
on the forward scattering of light by particle.

Hydraulics Prof. B.S. Thandaveswara
Indian Institute of Technology Madras
ToPhotomultiplier
Tube
FocalVolume
1 cm. Gap
MirrorDarkZone
OpaqueCoating
FromLightSource
Lens 2
Lens 1
Mirror
Optic Probe details
The Photo Multiplier tube in this arrangement operates in essentially a dark field which
minimizes the ambient noise and enables detection of small concentration of particular
matter in the flow field, hence of concentration in the flow field.
15.3.5 ELECTRO-OPTICAL MEASUREMENT OF FLUID VELOCITY
The principle of an electro optical instrument for measuring fluid velocity is based on the
Doppler effect of making particular matter in a coherent light beam and determination of
frequency shifts by an optical heterodyning technique. Since only a beam of light enters
the flow field, there is no measurable disturbance as there is with other instruments
point measurements of velocity are possible as the light beam may be focused to as
small as a few microns. There is no need for prior calibration of the instrument as there
is with standard velocity measuring instruments and the response is linear over the
entire velocity range of interest. Velocities as small as a friction of a centimeter/sec. can
be measured. Electro-optical velocity instrument is also called, Laser Velocimeter, Laser
Doppler Velocimeter and laser anemometer.

Hydraulics Prof. B.S. Thandaveswara
Indian Institute of Technology Madras
15.3.6 NEW METHODS OF RIVER GAUGING
The measurement of river flow is required for river management purposes including
water resources planning, pollution prevention and flood control.
The following new methods of river gauging are designed.
(a) The moving boat method
(b) The ultrasonic method
(c) The electromagnetic method
15.3.7 THE ELECTROMAGNETIC METHOD
Faraday (1832) was the first person to notice that when the motion of water flowing in a
river cuts the vertical components of earth's magnetic field an EMF is induced. In the
water, which can be picked up by two electrodes. The EMF, which is directly
proportional to the average velocity in the river, is induced along each transverse
filament of water as the water cuts the lines of earth's vertical magnetic field. This
method was used in 1953-54 to measure the tidal flow through Dover strait. The result
of these experiments and others are both illuminating and encouraging, and the
application of this technique for gauging the flow in river was considered. However, the
relatively small unidirectional potentials induced in small rivers cannot be detected
during the presence of interfacing potentials.

Hydraulics Prof. B.S. Thandaveswara
Indian Institute of Technology Madras
Basic principle of fluid flowmeasured in pipes by electromagneticinduction
OUTPUT E
FIELD N
α v
Supply Velcoity of flow = V
Measuring System
Velocityof Water
ElectricalPotentialGenerated
Induced Magnetic Field
Principle of electromageneticriver gauging
Probes

Hydraulics Prof. B.S. Thandaveswara
Indian Institute of Technology Madras
Diagrammatic view of an electromagnetic river gauging station
Noise cancellationprobes
Cell for producingmagnetic field
Shelter forInstrumentation
BedConductivityprobe
Signal cable duct
Noise cancellation probesBed Conductivity probe
Signalprobes
Typical block diagram of an electromagnetic river gauging station
Noise cancellation probes
BuriedCoil
CoilDrive
TimingSignals
Flow of water
TimingSignals
Stage
WaterConductivity
BedConductivity
Telemetry system
Noise cancellation probes
SignalRecovery
Signal Probes
Data Processor
Data RecordingDevices

Hydraulics Prof. B.S. Thandaveswara
Indian Institute of Technology Madras
THEORY: The basic principle of the electromagnetic method of river gauging is the
Faraday generator effect where an electrical conductor in motion in a magnetic field
induces an electrical potentials. In the case of river, the conductor is the flowing water
and electrical potential induced is proportional to the average velocity of flow. Faraday's
law of electromagnetic induction relates the length of the conductor, moving in a
magnetic field, to the EMF generated by the equation
E = H v b
in which E is the EMF generated in volts; H is the Magnetic field in tests; v is the average velocity of the river in m/s; b is the river width in meter.
An electromagnetic gauging station consists of the following
(1) The coils,
(2) The probes,
(3) The coil derive unit,
(4) The signal measuring unit,
(5) The stage sensor,
(6) The water conductivity sensors,
(7) The bed conductivity sensor,
(8) The data processor and
(9) The display unit.

Hydraulics Prof. B.S. Thandaveswara
Indian Institute of Technology Madras
The probes: Eight probes made in high grade stainless steel rod or slips is used. These
consist of two signal probes placed in the magnetic field generated by the coil and
located in the banks on opposite sides of the river. These probes are used to detect the
induced potentials and to define precisely the C/s of measuring the section. Weeds and
bed sediment do not cause interference since their velocity is zero they generate zero
potentials. Thus they are considered being stationary water. The stage sensor: It is
capable of providing a digital signal to the data processor is employed to define the
measurement of C/s. The water conductivity sensor: A conventional conductivity sensor
is located into the river.
The bed conductivity: In the form of bed resistance is measured.
Information relating to the stage and discharge is recorded on punched paper tape at 16
m interval and may also be displayed visually along with time.