modern parenthood - pew research centerassets.pewresearch.org/wp-content/uploads/sites/3/... ·...
TRANSCRIPT
MARCH 14, 2013
Modern Parenthood
Roles of Moms and Dads Converge as They Balance Work and Family
FOR FURTHER INFORMATION, CONTACT
Pew Research Center
1615 L St., N.W., Suite 700
Washington, D.C. 20036
Media Inquiries:
202.419.4372
www.pewresearch.org
Table of Contents
PAGE
Overview 1
About the Data 8
SECTION I: PUBLIC OPINION SURVEY FINDINGS
Chapter 1:Changing Views About Work 9
Chapter 2:Balancing Work and Family Life 19
Chapter 3:Outcomes 23
SECTION II: TIME USE FINDINGS
Chapter 4: How Mothers and Fathers Spend Their Time 27
Chapter 5: Americans’ Time at Paid Work, Housework, Child Care, 1965 to
2011 32
Chapter 6: Time in Work and Leisure, Patterns by Gender and Family
Structure
39
References 48
Appendix 1: Additional Charts 49
Appendix 2: Characteristics of Men and Women in Different Family Settings 51
Appendix 3: Time Use Activities for Paid Work, Housework, Child Care and
Leisure 52
Appendix 4: Topline Questionnaire 53
1
PEW RESEARCH CENTER
www.pewresearch.org
Modern Parenthood Roles of Moms and Dads Converge as They Balance Work and Family
By Kim Parker and Wendy Wang
OVERVIEW
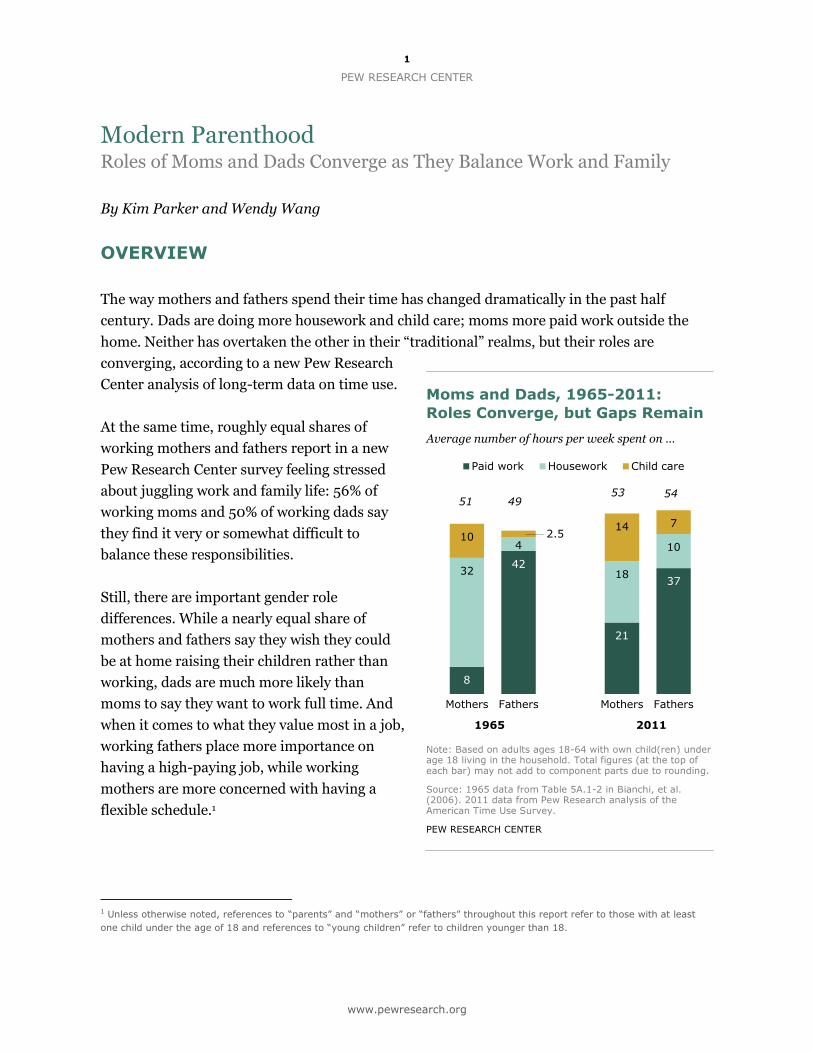
The way mothers and fathers spend their time has changed dramatically in the past half
century. Dads are doing more housework and child care; moms more paid work outside the
home. Neither has overtaken the other in their “traditional” realms, but their roles are
converging, according to a new Pew Research
Center analysis of long-term data on time use.
At the same time, roughly equal shares of
working mothers and fathers report in a new
Pew Research Center survey feeling stressed
about juggling work and family life: 56% of
working moms and 50% of working dads say
they find it very or somewhat difficult to
balance these responsibilities.
Still, there are important gender role
differences. While a nearly equal share of
mothers and fathers say they wish they could
be at home raising their children rather than
working, dads are much more likely than
moms to say they want to work full time. And
when it comes to what they value most in a job,
working fathers place more importance on
having a high-paying job, while working
mothers are more concerned with having a
flexible schedule.1
1 Unless otherwise noted, references to “parents” and “mothers” or “fathers” throughout this report refer to those with at least
one child under the age of 18 and references to “young children” refer to children younger than 18.
Moms and Dads, 1965-2011:
Roles Converge, but Gaps Remain
Average number of hours per week spent on …
Note: Based on adults ages 18-64 with own child(ren) under age 18 living in the household. Total figures (at the top of each bar) may not add to component parts due to rounding.
Source: 1965 data from Table 5A.1-2 in Bianchi, et al. (2006). 2011 data from Pew Research analysis of the American Time Use Survey.
PEW RESEARCH CENTER
37
21
42
8
10
18 32
7 14
4 10
Fathers Mothers Fathers Mothers
Paid work Housework Child care
1965 2011
2.5
51 49 53 54
2
MODERN PARENTHOOD
www.pewresearch.org
43
50
56
50
Working mothers
Working fathers
Not too/ Not at all difficult
Very/ Somewhat difficult
23
46
68
50
Mothers
Fathers
Too much
8
Too little
Right amount
3
However, mothers’ attitudes toward work have changed considerably in recent years. Among
mothers with children under age 18, the share saying they would prefer to work full time has
increased from 20% in 2007 to 32% in 2012. Tough economic times may have ushered in a
new mindset, as women in the most difficult financial circumstances are among the most likely
to say working full time is the ideal situation for them.
At the same time, the public remains conflicted about what is best for children. Among all
adults, only 16% say the ideal situation for a
young child is to have a mother who works full
time. A plurality of adults (42%) say mothers
working part time is ideal, and one-third say
it’s best for young children if their mothers do
not work at all outside of the home.
These findings are based on a new Pew
Research survey of 2,511 adults nationwide
conducted Nov. 28-Dec. 5, 2012, and an
analysis of the American Time Use Survey
(ATUS). The ATUS, which began in 2003, is a
nationally representative telephone survey that
measures the amount of time people spend
doing various activities throughout the day. It
is sponsored by the U.S. Bureau of Labor
Statistics and is conducted by the U.S. Census
Bureau. Data collected from 2003 through
2011 include interviews with more than
124,000 respondents. Comparable time diary
data are available going back as far as 1965,
allowing for an analysis of trends over a nearly
50-year period.2
Balancing Work and Family
The Pew Research survey finds that about half
(53%) of all working parents with children
under age 18 say it is difficult for them to
2 Data from 1965 to 2000 are from Suzanne Bianchi, et al., 2006, Changing Rhythms of American Family Life, which analyzed
time diary surveys conducted before the ATUS was established.
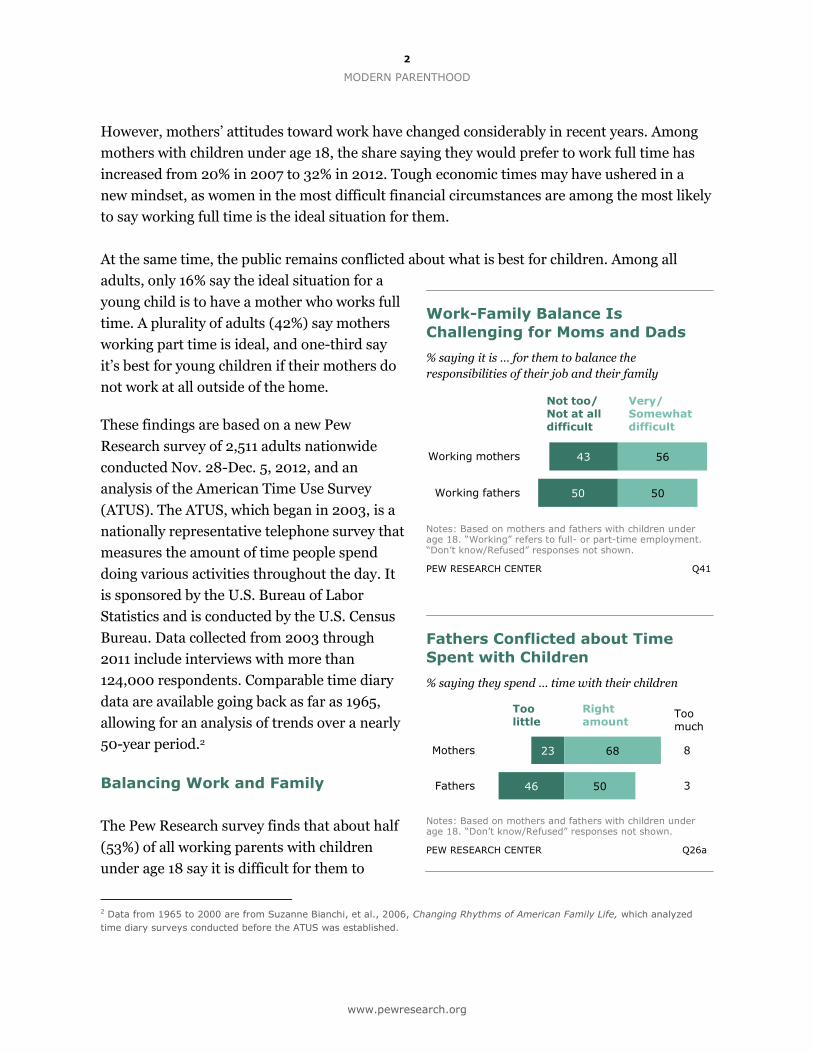
Work-Family Balance Is
Challenging for Moms and Dads
% saying it is … for them to balance the
responsibilities of their job and their family
Notes: Based on mothers and fathers with children under age 18. “Working” refers to full- or part-time employment. “Don’t know/Refused” responses not shown.
PEW RESEARCH CENTER Q41
Fathers Conflicted about Time
Spent with Children
% saying they spend … time with their children
Notes: Based on mothers and fathers with children under age 18. “Don’t know/Refused” responses not shown.
PEW RESEARCH CENTER Q26a
3
PEW RESEARCH CENTER
www.pewresearch.org
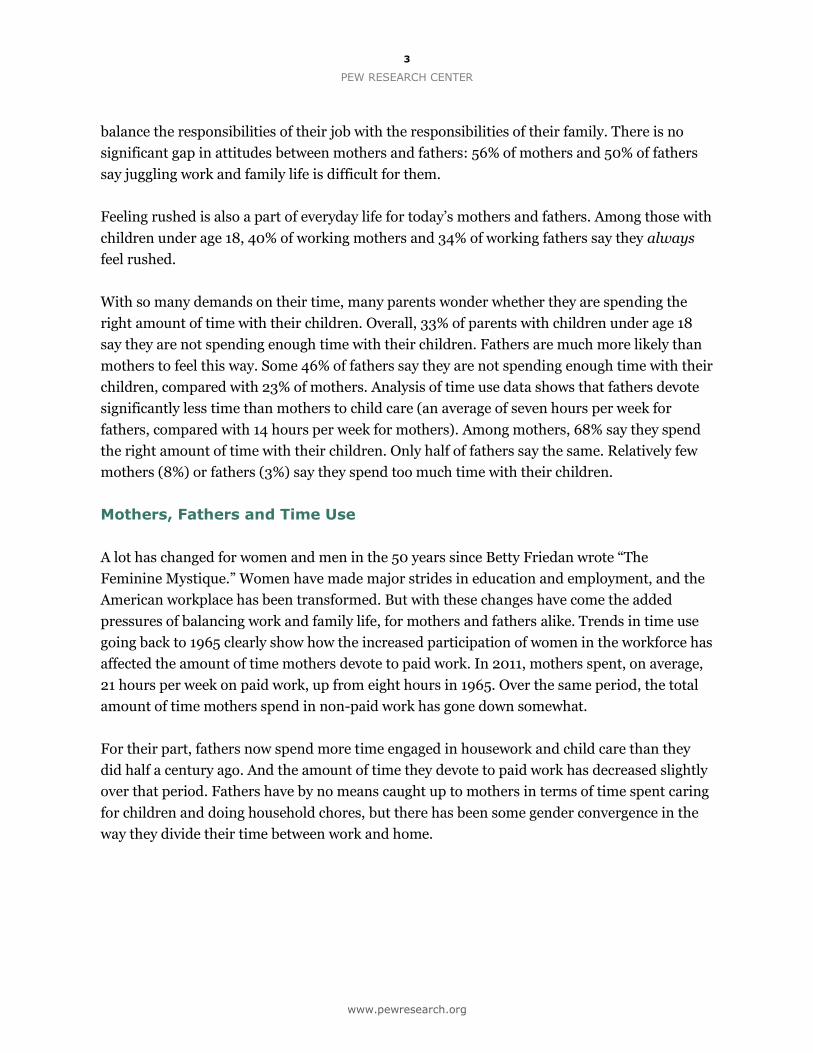
balance the responsibilities of their job with the responsibilities of their family. There is no
significant gap in attitudes between mothers and fathers: 56% of mothers and 50% of fathers
say juggling work and family life is difficult for them.
Feeling rushed is also a part of everyday life for today’s mothers and fathers. Among those with
children under age 18, 40% of working mothers and 34% of working fathers say they always
feel rushed.
With so many demands on their time, many parents wonder whether they are spending the
right amount of time with their children. Overall, 33% of parents with children under age 18
say they are not spending enough time with their children. Fathers are much more likely than
mothers to feel this way. Some 46% of fathers say they are not spending enough time with their
children, compared with 23% of mothers. Analysis of time use data shows that fathers devote
significantly less time than mothers to child care (an average of seven hours per week for
fathers, compared with 14 hours per week for mothers). Among mothers, 68% say they spend
the right amount of time with their children. Only half of fathers say the same. Relatively few
mothers (8%) or fathers (3%) say they spend too much time with their children.
Mothers, Fathers and Time Use
A lot has changed for women and men in the 50 years since Betty Friedan wrote “The
Feminine Mystique.” Women have made major strides in education and employment, and the
American workplace has been transformed. But with these changes have come the added
pressures of balancing work and family life, for mothers and fathers alike. Trends in time use
going back to 1965 clearly show how the increased participation of women in the workforce has
affected the amount of time mothers devote to paid work. In 2011, mothers spent, on average,
21 hours per week on paid work, up from eight hours in 1965. Over the same period, the total
amount of time mothers spend in non-paid work has gone down somewhat.
For their part, fathers now spend more time engaged in housework and child care than they
did half a century ago. And the amount of time they devote to paid work has decreased slightly
over that period. Fathers have by no means caught up to mothers in terms of time spent caring
for children and doing household chores, but there has been some gender convergence in the
way they divide their time between work and home.
4
MODERN PARENTHOOD
www.pewresearch.org
73
64
78
66
Among mothers who are ...
Mothers
Working
Not working
Fathers
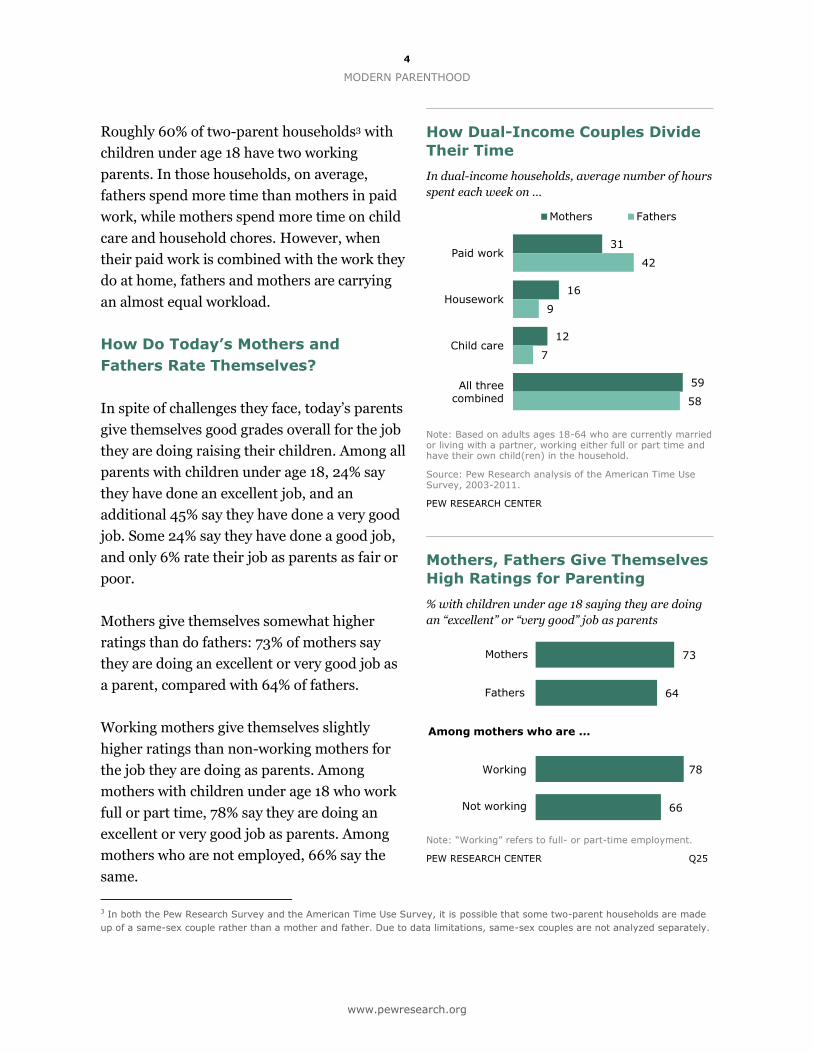
Roughly 60% of two-parent households3 with
children under age 18 have two working
parents. In those households, on average,
fathers spend more time than mothers in paid
work, while mothers spend more time on child
care and household chores. However, when
their paid work is combined with the work they
do at home, fathers and mothers are carrying
an almost equal workload.
How Do Today’s Mothers and
Fathers Rate Themselves?
In spite of challenges they face, today’s parents
give themselves good grades overall for the job
they are doing raising their children. Among all
parents with children under age 18, 24% say
they have done an excellent job, and an
additional 45% say they have done a very good
job. Some 24% say they have done a good job,
and only 6% rate their job as parents as fair or
poor.
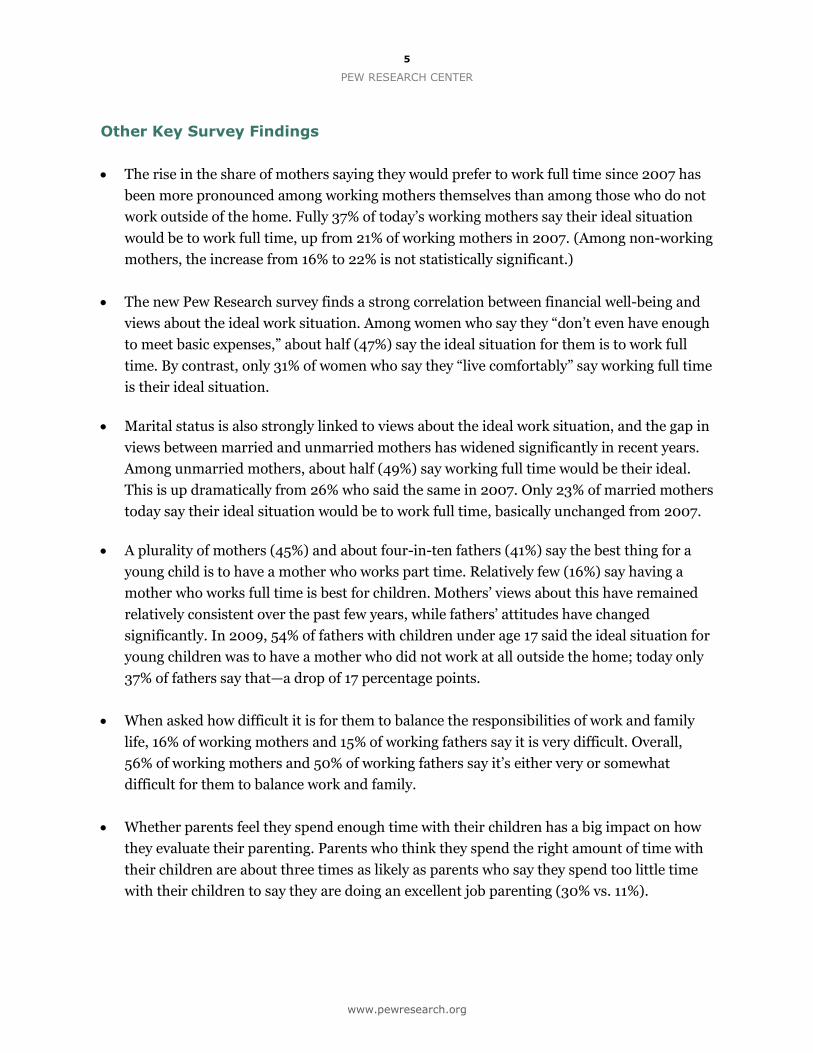
Mothers give themselves somewhat higher
ratings than do fathers: 73% of mothers say
they are doing an excellent or very good job as
a parent, compared with 64% of fathers.
Working mothers give themselves slightly
higher ratings than non-working mothers for
the job they are doing as parents. Among
mothers with children under age 18 who work
full or part time, 78% say they are doing an
excellent or very good job as parents. Among
mothers who are not employed, 66% say the
same.
3 In both the Pew Research Survey and the American Time Use Survey, it is possible that some two-parent households are made
up of a same-sex couple rather than a mother and father. Due to data limitations, same-sex couples are not analyzed separately.
How Dual-Income Couples Divide
Their Time
In dual-income households, average number of hours
spent each week on …
Note: Based on adults ages 18-64 who are currently married or living with a partner, working either full or part time and have their own child(ren) in the household.
Source: Pew Research analysis of the American Time Use Survey, 2003-2011.
PEW RESEARCH CENTER
Mothers, Fathers Give Themselves
High Ratings for Parenting
% with children under age 18 saying they are doing
an “excellent” or “very good” job as parents
Note: “Working” refers to full- or part-time employment.
PEW RESEARCH CENTER Q25
31
16
12
59
42
9
7
58
Mothers Fathers
Paid work
Housework
Child care
All three combined
5
PEW RESEARCH CENTER
www.pewresearch.org
Other Key Survey Findings
The rise in the share of mothers saying they would prefer to work full time since 2007 has
been more pronounced among working mothers themselves than among those who do not
work outside of the home. Fully 37% of today’s working mothers say their ideal situation
would be to work full time, up from 21% of working mothers in 2007. (Among non-working
mothers, the increase from 16% to 22% is not statistically significant.)
The new Pew Research survey finds a strong correlation between financial well-being and
views about the ideal work situation. Among women who say they “don’t even have enough
to meet basic expenses,” about half (47%) say the ideal situation for them is to work full
time. By contrast, only 31% of women who say they “live comfortably” say working full time
is their ideal situation.
Marital status is also strongly linked to views about the ideal work situation, and the gap in
views between married and unmarried mothers has widened significantly in recent years.
Among unmarried mothers, about half (49%) say working full time would be their ideal.
This is up dramatically from 26% who said the same in 2007. Only 23% of married mothers
today say their ideal situation would be to work full time, basically unchanged from 2007.
A plurality of mothers (45%) and about four-in-ten fathers (41%) say the best thing for a
young child is to have a mother who works part time. Relatively few (16%) say having a
mother who works full time is best for children. Mothers’ views about this have remained
relatively consistent over the past few years, while fathers’ attitudes have changed
significantly. In 2009, 54% of fathers with children under age 17 said the ideal situation for
young children was to have a mother who did not work at all outside the home; today only
37% of fathers say that—a drop of 17 percentage points.
When asked how difficult it is for them to balance the responsibilities of work and family
life, 16% of working mothers and 15% of working fathers say it is very difficult. Overall,
56% of working mothers and 50% of working fathers say it’s either very or somewhat
difficult for them to balance work and family.
Whether parents feel they spend enough time with their children has a big impact on how
they evaluate their parenting. Parents who think they spend the right amount of time with
their children are about three times as likely as parents who say they spend too little time
with their children to say they are doing an excellent job parenting (30% vs. 11%).
6
MODERN PARENTHOOD
www.pewresearch.org
Among mothers with children under age 18, married moms are happier overall than
unmarried moms. Fully 43% of married mothers say they are very happy with their life
these days; only 23% of unmarried mothers say the same. There is also a significant gap in
happiness between working and non-working mothers: 45% of non-working mothers say
they are very happy, compared with 31% of mothers who work either full or part time.
When other factors (race, ethnicity, income and education) are taken into account,
marriage is a significant predictor of a mother’s happiness while employment status is not.
Other Key Time Use Findings
The amount of time parents spend with their children continues to go up. Fathers have
nearly tripled their time with children since 1965. Mothers’ time with children has also
increased, and today’s mothers spend more time with their children than mothers did in
the 1960s. There is still a large gender gap in time spent with children: Mothers spend
about twice as much time with their children as fathers do (13.5 hours per week for
mothers in 2011, compared with 7.3 hours for fathers).
The amount of time parents spent doing housework has changed significantly too. Fathers’
time spent doing household chores has more than doubled since 1965 (from an average of
about four hours per week to about 10 hours). Mothers’ time doing housework has gone
down significantly over the same period (from 32 hours per week to 18).
Married parents spend more time at work than unmarried parents, counting housework,
child care and paid work together, and have less leisure time than other parents. Married
parents are also more egalitarian than cohabiting couples. Married fathers’ time in paid
and unpaid work totals about 55.5 hours per week, 1.4 hours more than that of married
mothers. Yet the total work hours for cohabiting fathers are almost three hours less than
that of cohabiting mothers.
When paid work, child care and housework are combined, parents in dual-income
households have a more equal division of labor than parents in single-earner households.
In dual-income households, fathers put in, on average, 58 hours of total work time a week,
compared with 59 hours for mothers. In households where the father is the sole
breadwinner, his total workload exceeds that of his spouse or partner by roughly 11 hours
(57 vs. 46 hours per week). In households where the mother is the sole breadwinner, her
total workload exceeds that of her spouse or partner by about 25 hours (58 vs. 33 hours per
week).
7
PEW RESEARCH CENTER
www.pewresearch.org
Men spend more time than women in leisure activities (such as watching TV, playing
games, socializing and exercising). The gender gap in leisure time is bigger among men and
women who do not have children in the house (37 hours per week for men vs. 32 hours per
week for women). Among parents with children under age 18, fathers spend, on average,
28 hours per week on leisure activities, while mothers spend 25 hours on leisure.
Roadmap to the Report
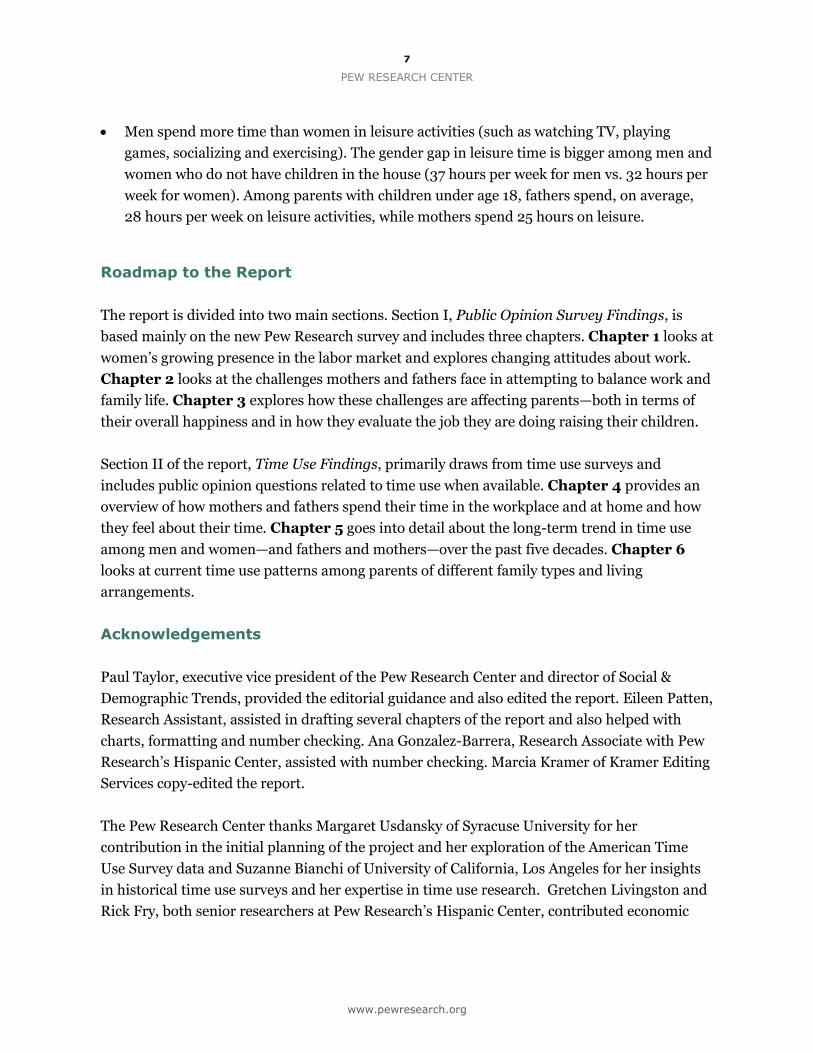
The report is divided into two main sections. Section I, Public Opinion Survey Findings, is
based mainly on the new Pew Research survey and includes three chapters. Chapter 1 looks at
women’s growing presence in the labor market and explores changing attitudes about work.
Chapter 2 looks at the challenges mothers and fathers face in attempting to balance work and
family life. Chapter 3 explores how these challenges are affecting parents—both in terms of
their overall happiness and in how they evaluate the job they are doing raising their children.
Section II of the report, Time Use Findings, primarily draws from time use surveys and
includes public opinion questions related to time use when available. Chapter 4 provides an
overview of how mothers and fathers spend their time in the workplace and at home and how
they feel about their time. Chapter 5 goes into detail about the long-term trend in time use
among men and women—and fathers and mothers—over the past five decades. Chapter 6
looks at current time use patterns among parents of different family types and living
arrangements.
Acknowledgements
Paul Taylor, executive vice president of the Pew Research Center and director of Social &
Demographic Trends, provided the editorial guidance and also edited the report. Eileen Patten,
Research Assistant, assisted in drafting several chapters of the report and also helped with
charts, formatting and number checking. Ana Gonzalez-Barrera, Research Associate with Pew
Research’s Hispanic Center, assisted with number checking. Marcia Kramer of Kramer Editing
Services copy-edited the report.
The Pew Research Center thanks Margaret Usdansky of Syracuse University for her
contribution in the initial planning of the project and her exploration of the American Time
Use Survey data and Suzanne Bianchi of University of California, Los Angeles for her insights
in historical time use surveys and her expertise in time use research. Gretchen Livingston and
Rick Fry, both senior researchers at Pew Research’s Hispanic Center, contributed economic
8
MODERN PARENTHOOD
www.pewresearch.org
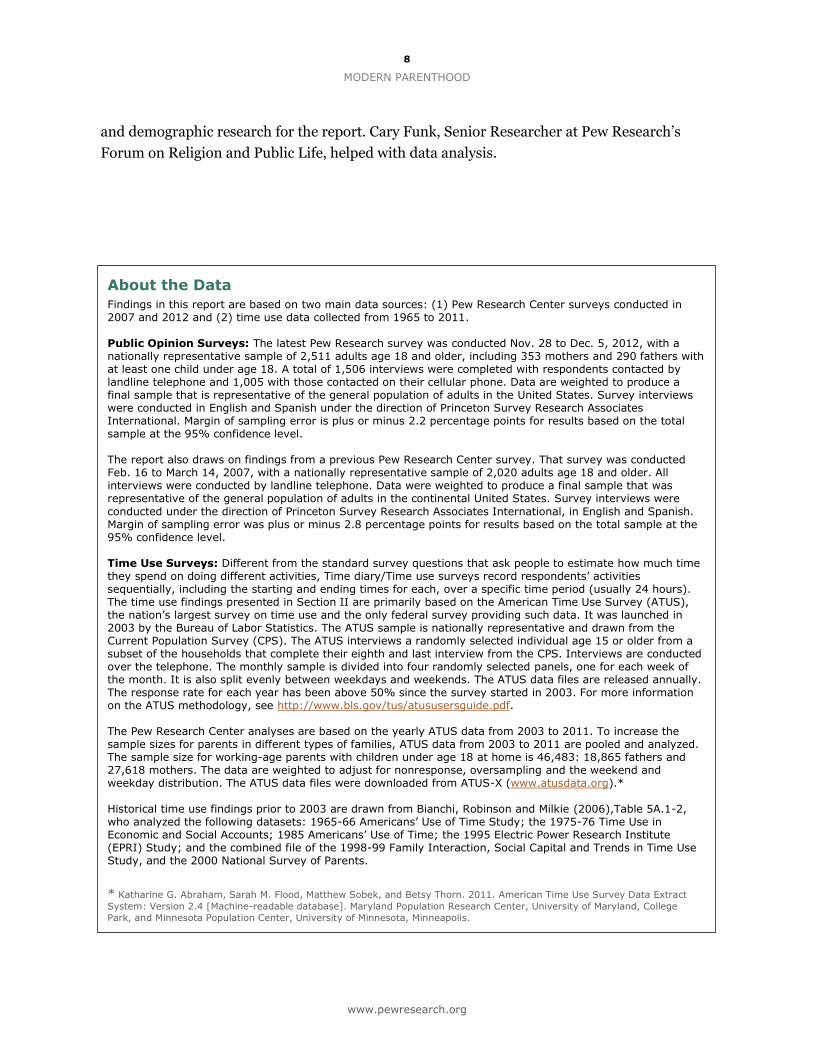
About the Data
Findings in this report are based on two main data sources: (1) Pew Research Center surveys conducted in 2007 and 2012 and (2) time use data collected from 1965 to 2011. Public Opinion Surveys: The latest Pew Research survey was conducted Nov. 28 to Dec. 5, 2012, with a nationally representative sample of 2,511 adults age 18 and older, including 353 mothers and 290 fathers with at least one child under age 18. A total of 1,506 interviews were completed with respondents contacted by landline telephone and 1,005 with those contacted on their cellular phone. Data are weighted to produce a final sample that is representative of the general population of adults in the United States. Survey interviews were conducted in English and Spanish under the direction of Princeton Survey Research Associates International. Margin of sampling error is plus or minus 2.2 percentage points for results based on the total sample at the 95% confidence level. The report also draws on findings from a previous Pew Research Center survey. That survey was conducted Feb. 16 to March 14, 2007, with a nationally representative sample of 2,020 adults age 18 and older. All interviews were conducted by landline telephone. Data were weighted to produce a final sample that was representative of the general population of adults in the continental United States. Survey interviews were
conducted under the direction of Princeton Survey Research Associates International, in English and Spanish. Margin of sampling error was plus or minus 2.8 percentage points for results based on the total sample at the 95% confidence level. Time Use Surveys: Different from the standard survey questions that ask people to estimate how much time they spend on doing different activities, Time diary/Time use surveys record respondents’ activities sequentially, including the starting and ending times for each, over a specific time period (usually 24 hours). The time use findings presented in Section II are primarily based on the American Time Use Survey (ATUS), the nation’s largest survey on time use and the only federal survey providing such data. It was launched in 2003 by the Bureau of Labor Statistics. The ATUS sample is nationally representative and drawn from the Current Population Survey (CPS). The ATUS interviews a randomly selected individual age 15 or older from a subset of the households that complete their eighth and last interview from the CPS. Interviews are conducted over the telephone. The monthly sample is divided into four randomly selected panels, one for each week of the month. It is also split evenly between weekdays and weekends. The ATUS data files are released annually. The response rate for each year has been above 50% since the survey started in 2003. For more information on the ATUS methodology, see http://www.bls.gov/tus/atususersguide.pdf. The Pew Research Center analyses are based on the yearly ATUS data from 2003 to 2011. To increase the sample sizes for parents in different types of families, ATUS data from 2003 to 2011 are pooled and analyzed. The sample size for working-age parents with children under age 18 at home is 46,483: 18,865 fathers and 27,618 mothers. The data are weighted to adjust for nonresponse, oversampling and the weekend and weekday distribution. The ATUS data files were downloaded from ATUS-X (www.atusdata.org).* Historical time use findings prior to 2003 are drawn from Bianchi, Robinson and Milkie (2006),Table 5A.1-2, who analyzed the following datasets: 1965-66 Americans’ Use of Time Study; the 1975-76 Time Use in Economic and Social Accounts; 1985 Americans’ Use of Time; the 1995 Electric Power Research Institute (EPRI) Study; and the combined file of the 1998-99 Family Interaction, Social Capital and Trends in Time Use Study, and the 2000 National Survey of Parents.
* Katharine G. Abraham, Sarah M. Flood, Matthew Sobek, and Betsy Thorn. 2011. American Time Use Survey Data Extract
System: Version 2.4 [Machine-readable database]. Maryland Population Research Center, University of Maryland, College
Park, and Minnesota Population Center, University of Minnesota, Minneapolis.
and demographic research for the report. Cary Funk, Senior Researcher at Pew Research’s
Forum on Religion and Public Life, helped with data analysis.
9
PEW RESEARCH CENTER
www.pewresearch.org
SECTION I: PUBLIC OPINION SURVEY FINDINGS
CHAPTER 1: CHANGING VIEWS ABOUT WORK
Much of the change in the way mothers and fathers spend their time has been driven by
women’s growing presence in the workplace. And the pressures of modern parenthood are
inextricably linked to the competing demands of work and home life that face both mothers
and fathers today.
Although they have reached near parity with men in terms of their representation in the labor
force, many women, especially mothers, still wrestle with what their “ideal” situation would
be—working or not working, working full time vs. part time. Since 2007, there has been a
significant spike in the share of mothers who say working full time would be ideal for them.
This chapter will explore mothers’ changing views about work and what the public believes is
best for children. It will also look at what
mothers and fathers value most in a job.
Women in the Labor Force
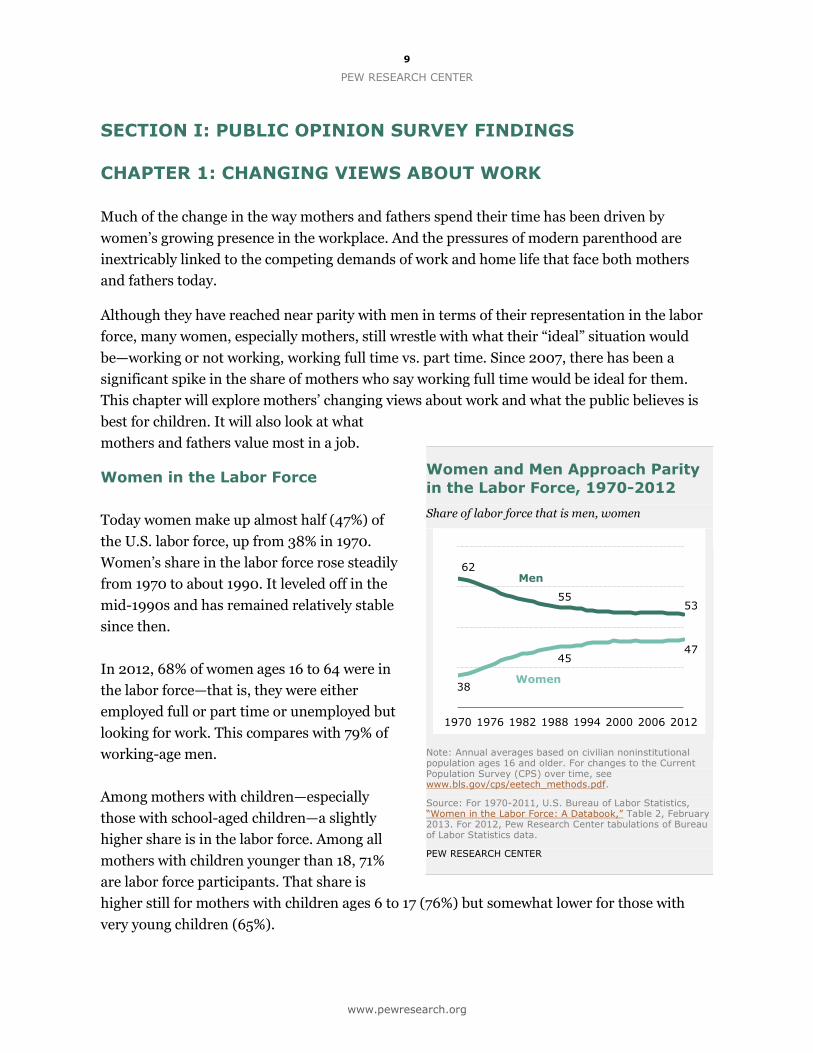
Today women make up almost half (47%) of
the U.S. labor force, up from 38% in 1970.
Women’s share in the labor force rose steadily
from 1970 to about 1990. It leveled off in the
mid-1990s and has remained relatively stable
since then.
In 2012, 68% of women ages 16 to 64 were in
the labor force—that is, they were either
employed full or part time or unemployed but
looking for work. This compares with 79% of
working-age men.
Among mothers with children—especially
those with school-aged children—a slightly
higher share is in the labor force. Among all
mothers with children younger than 18, 71%
are labor force participants. That share is
higher still for mothers with children ages 6 to 17 (76%) but somewhat lower for those with
very young children (65%).
Women and Men Approach Parity
in the Labor Force, 1970-2012
Share of labor force that is men, women
Note: Annual averages based on civilian noninstitutional population ages 16 and older. For changes to the Current Population Survey (CPS) over time, see www.bls.gov/cps/eetech_methods.pdf.
Source: For 1970-2011, U.S. Bureau of Labor Statistics, “Women in the Labor Force: A Databook,” Table 2, February 2013. For 2012, Pew Research Center tabulations of Bureau of Labor Statistics data.
PEW RESEARCH CENTER
38
45 47
62
55 53
1970 1976 1982 1988 1994 2000 2006 2012
Women
Men
10
MODERN PARENTHOOD
www.pewresearch.org
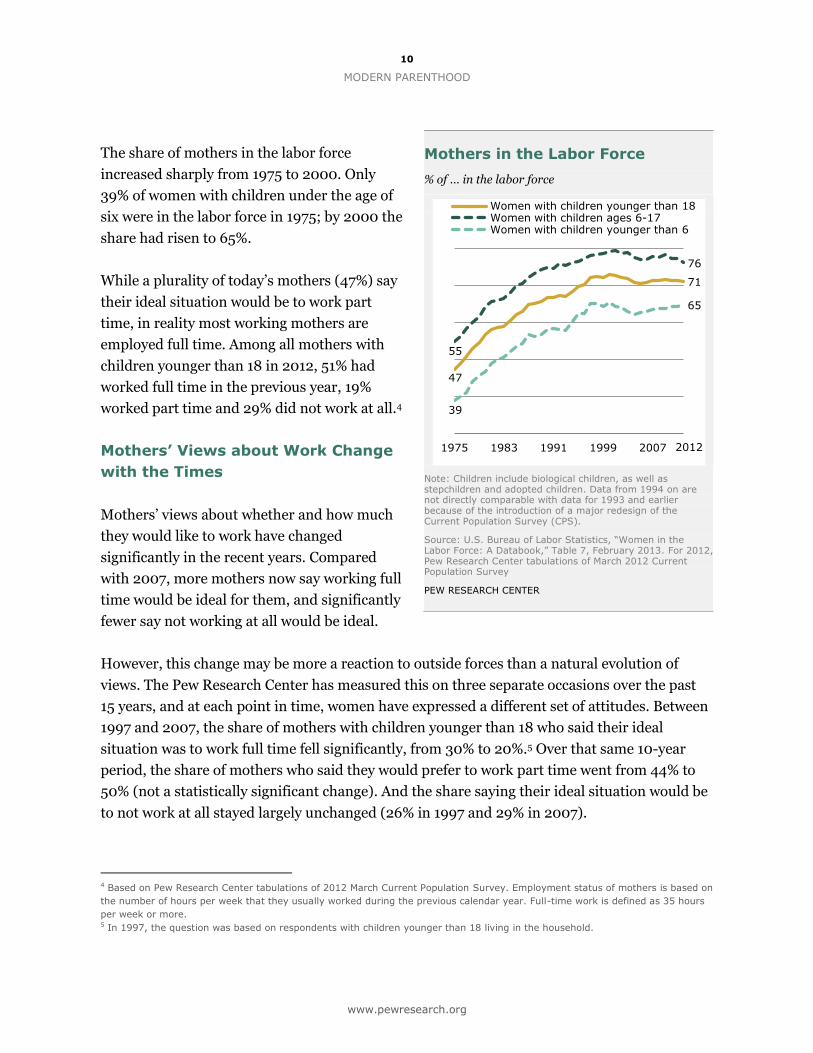
The share of mothers in the labor force
increased sharply from 1975 to 2000. Only
39% of women with children under the age of
six were in the labor force in 1975; by 2000 the
share had risen to 65%.
While a plurality of today’s mothers (47%) say
their ideal situation would be to work part
time, in reality most working mothers are
employed full time. Among all mothers with
children younger than 18 in 2012, 51% had
worked full time in the previous year, 19%
worked part time and 29% did not work at all.4
Mothers’ Views about Work Change
with the Times
Mothers’ views about whether and how much
they would like to work have changed
significantly in the recent years. Compared
with 2007, more mothers now say working full
time would be ideal for them, and significantly
fewer say not working at all would be ideal.
However, this change may be more a reaction to outside forces than a natural evolution of
views. The Pew Research Center has measured this on three separate occasions over the past
15 years, and at each point in time, women have expressed a different set of attitudes. Between
1997 and 2007, the share of mothers with children younger than 18 who said their ideal
situation was to work full time fell significantly, from 30% to 20%.5 Over that same 10-year
period, the share of mothers who said they would prefer to work part time went from 44% to
50% (not a statistically significant change). And the share saying their ideal situation would be
to not work at all stayed largely unchanged (26% in 1997 and 29% in 2007).
4 Based on Pew Research Center tabulations of 2012 March Current Population Survey. Employment status of mothers is based on
the number of hours per week that they usually worked during the previous calendar year. Full-time work is defined as 35 hours
per week or more. 5 In 1997, the question was based on respondents with children younger than 18 living in the household.
Mothers in the Labor Force
% of … in the labor force
Note: Children include biological children, as well as stepchildren and adopted children. Data from 1994 on are not directly comparable with data for 1993 and earlier because of the introduction of a major redesign of the Current Population Survey (CPS).
Source: U.S. Bureau of Labor Statistics, “Women in the Labor Force: A Databook,” Table 7, February 2013. For 2012, Pew Research Center tabulations of March 2012 Current Population Survey
PEW RESEARCH CENTER
47
71
55
76
39
65
1975 1983 1991 1999 2007
Women with children younger than 18 Women with children ages 6-17 Women with children younger than 6
2012
11
PEW RESEARCH CENTER
www.pewresearch.org
30
20
32
1997 2007 2012
37
21
50
60
11
19
2012
2007
Full time Part time Not at all
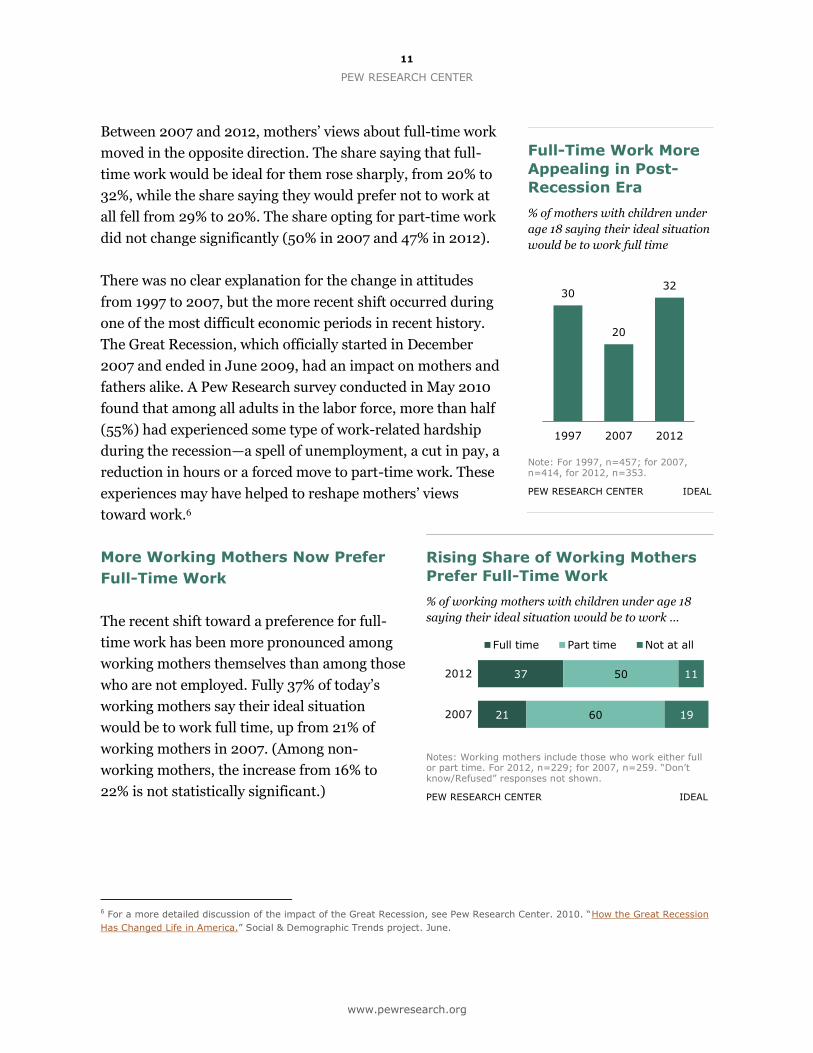
Between 2007 and 2012, mothers’ views about full-time work
moved in the opposite direction. The share saying that full-
time work would be ideal for them rose sharply, from 20% to
32%, while the share saying they would prefer not to work at
all fell from 29% to 20%. The share opting for part-time work
did not change significantly (50% in 2007 and 47% in 2012).
There was no clear explanation for the change in attitudes
from 1997 to 2007, but the more recent shift occurred during
one of the most difficult economic periods in recent history.
The Great Recession, which officially started in December
2007 and ended in June 2009, had an impact on mothers and
fathers alike. A Pew Research survey conducted in May 2010
found that among all adults in the labor force, more than half
(55%) had experienced some type of work-related hardship
during the recession—a spell of unemployment, a cut in pay, a
reduction in hours or a forced move to part-time work. These
experiences may have helped to reshape mothers’ views
toward work.6
More Working Mothers Now Prefer
Full-Time Work
The recent shift toward a preference for full-
time work has been more pronounced among
working mothers themselves than among those
who are not employed. Fully 37% of today’s
working mothers say their ideal situation
would be to work full time, up from 21% of
working mothers in 2007. (Among non-
working mothers, the increase from 16% to
22% is not statistically significant.)
6 For a more detailed discussion of the impact of the Great Recession, see Pew Research Center. 2010. “How the Great Recession
Has Changed Life in America.” Social & Demographic Trends project. June.
Full-Time Work More
Appealing in Post-
Recession Era
% of mothers with children under
age 18 saying their ideal situation
would be to work full time
Note: For 1997, n=457; for 2007, n=414, for 2012, n=353.
PEW RESEARCH CENTER IDEAL
Rising Share of Working Mothers
Prefer Full-Time Work
% of working mothers with children under age 18
saying their ideal situation would be to work …
Notes: Working mothers include those who work either full or part time. For 2012, n=229; for 2007, n=259. “Don’t know/Refused” responses not shown.
PEW RESEARCH CENTER IDEAL
12
MODERN PARENTHOOD
www.pewresearch.org
31
35
37
47
33
40
40
33
34
25
22
19
Full time Part time Not at all
Live comfortably
How would you describe your household's financial situation?
Meet basic expenses with a little left over
Just meet basic expenses
Don't have enough to meet basic expenses
Only 11% of working mothers say their ideal situation would be not to work at all, down from
19% in 2007. Part-time work remains the most appealing option for working mothers; 50%
now say working part time would be ideal for them, down marginally from 60% in 2007.
Among mothers who do not work outside the home, in 2007, roughly half (48%) said not
working was their ideal situation. Today only 36% of these mothers say the same. The share
saying they would prefer to work either full or part time has increased slightly over the same
period (from 49% in 2007 to 63% now).
For their part, fathers prefer full-time work. Fully 75% of fathers with children under age 18
say working full time is ideal for them. Some 15% say working part time would be ideal, and
10% say they would prefer not to work at all. In general, fathers’ views about what is ideal for
them have not changed significantly in recent years. In 2007, 72% of fathers with children
under age 18 said working full time would be ideal for them, 12% said they would like to work
part time and 16% said they would prefer not to work at all.
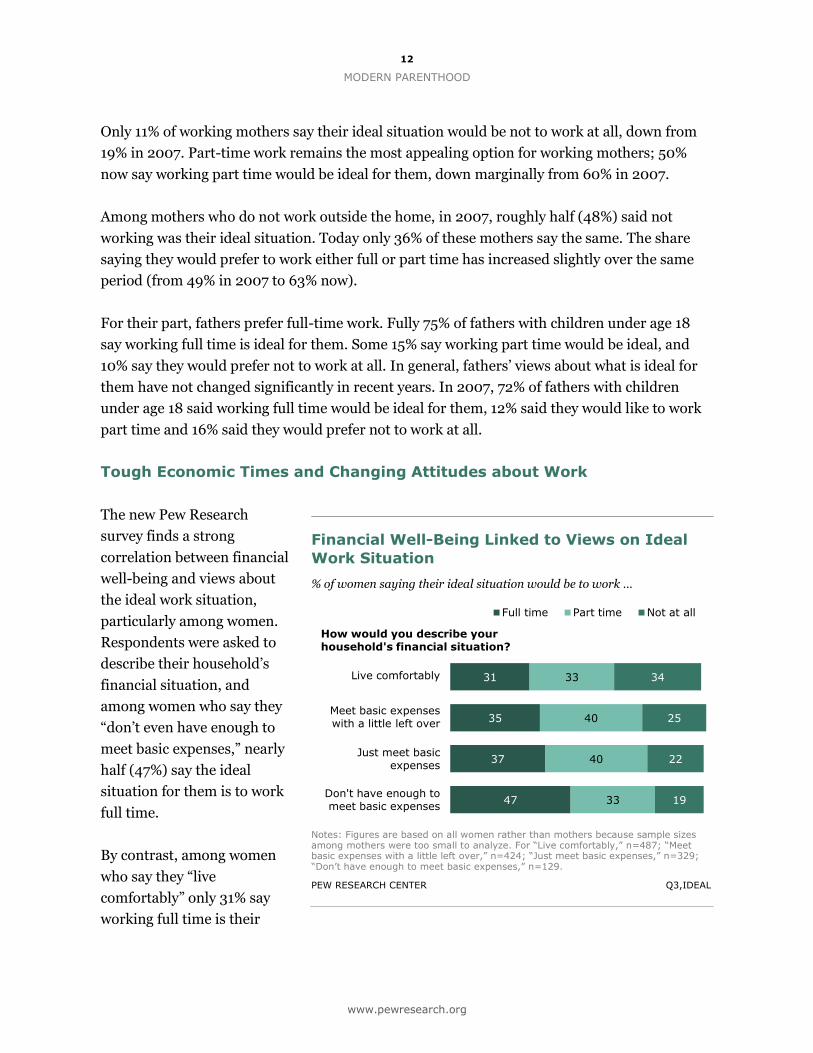
Tough Economic Times and Changing Attitudes about Work
The new Pew Research
survey finds a strong
correlation between financial
well-being and views about
the ideal work situation,
particularly among women.
Respondents were asked to
describe their household’s
financial situation, and
among women who say they
“don’t even have enough to
meet basic expenses,” nearly
half (47%) say the ideal
situation for them is to work
full time.
By contrast, among women
who say they “live
comfortably” only 31% say
working full time is their
Financial Well-Being Linked to Views on Ideal
Work Situation
% of women saying their ideal situation would be to work …
Notes: Figures are based on all women rather than mothers because sample sizes among mothers were too small to analyze. For “Live comfortably,” n=487; “Meet basic expenses with a little left over,” n=424; “Just meet basic expenses,” n=329; “Don’t have enough to meet basic expenses,” n=129.
PEW RESEARCH CENTER Q3,IDEAL
13
PEW RESEARCH CENTER
www.pewresearch.org
23
49
17
26
53
36
52
46
23
15
30
26
Full time Part time Not at all
Married
Unmarried
Married
2012
2007
Unmarried
ideal situation. Fully one-third (34%) of this group says not working at all would be ideal for
them. Women who say they can meet their basic expenses but do not live comfortably are more
evenly split between whether working full time or working part time would be ideal for them.
Similarly, income is tied to mothers’ views about what is ideal for them. Some 40% of mothers
with annual family incomes of less than $50,000 say full-time work would be best for them,
compared with 25% of mothers with incomes
of $50,000 or higher.
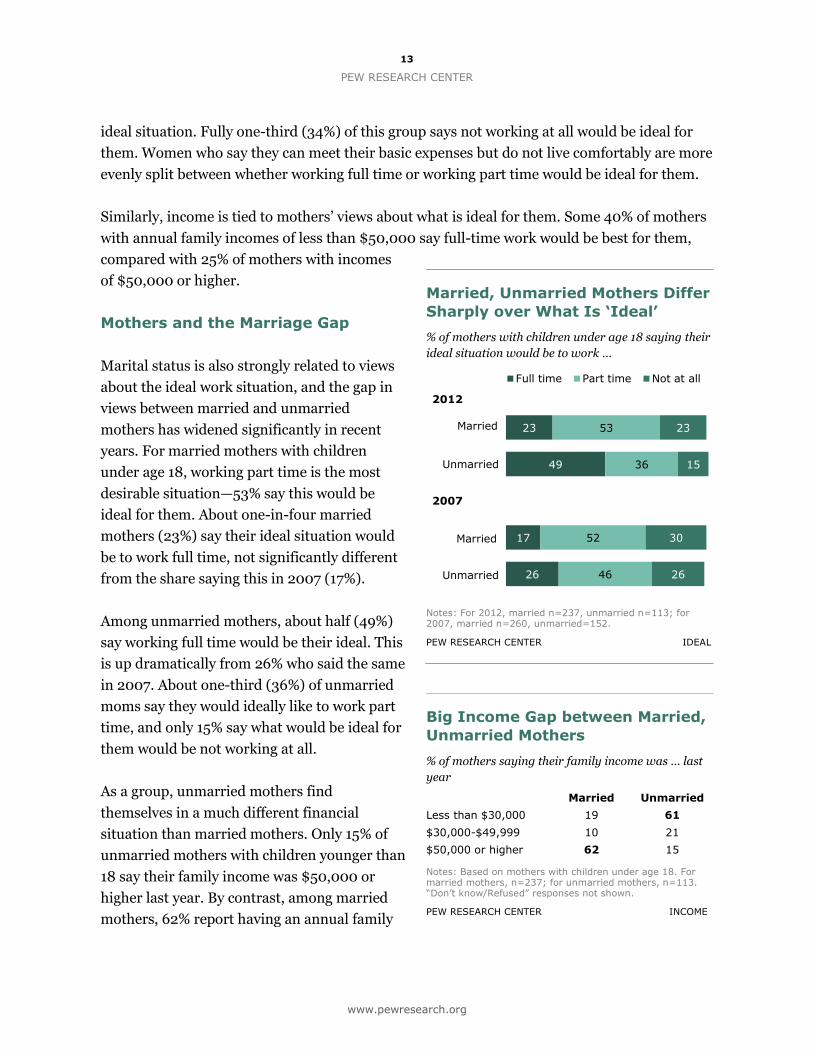
Mothers and the Marriage Gap
Marital status is also strongly related to views
about the ideal work situation, and the gap in
views between married and unmarried
mothers has widened significantly in recent
years. For married mothers with children
under age 18, working part time is the most
desirable situation—53% say this would be
ideal for them. About one-in-four married
mothers (23%) say their ideal situation would
be to work full time, not significantly different
from the share saying this in 2007 (17%).
Among unmarried mothers, about half (49%)
say working full time would be their ideal. This
is up dramatically from 26% who said the same
in 2007. About one-third (36%) of unmarried
moms say they would ideally like to work part
time, and only 15% say what would be ideal for
them would be not working at all.
As a group, unmarried mothers find
themselves in a much different financial
situation than married mothers. Only 15% of
unmarried mothers with children younger than
18 say their family income was $50,000 or
higher last year. By contrast, among married
mothers, 62% report having an annual family
Married, Unmarried Mothers Differ
Sharply over What Is ‘Ideal’
% of mothers with children under age 18 saying their
ideal situation would be to work …
Notes: For 2012, married n=237, unmarried n=113; for 2007, married n=260, unmarried=152.
PEW RESEARCH CENTER IDEAL
Big Income Gap between Married,
Unmarried Mothers
% of mothers saying their family income was … last
year
Married Unmarried
Less than $30,000 19 61
$30,000-$49,999 10 21
$50,000 or higher 62 15
Notes: Based on mothers with children under age 18. For married mothers, n=237; for unmarried mothers, n=113. “Don’t know/Refused” responses not shown.
PEW RESEARCH CENTER INCOME
14
MODERN PARENTHOOD
www.pewresearch.org
16
12
16
11
45
49
41
32
33
36
37
54
2012
2009
2012
2009
Full time Part time Not at all
Mothers
Fathers
income of $50,000 or higher. Among unmarried mothers, fully 61% say their income was
below $30,000 last year. This compares with 19% among married mothers. This suggests that
choosing full-time work may be more of an economic necessity than a lifestyle choice,
especially for unmarried mothers.
According to data from the U.S. Census Bureau, the share of single mothers has been steadily
rising over the past 50 years. In 1960, only 8% of mothers with children in their custody were
single mothers. Today, about three-in-ten (31%) mothers are unmarried.7
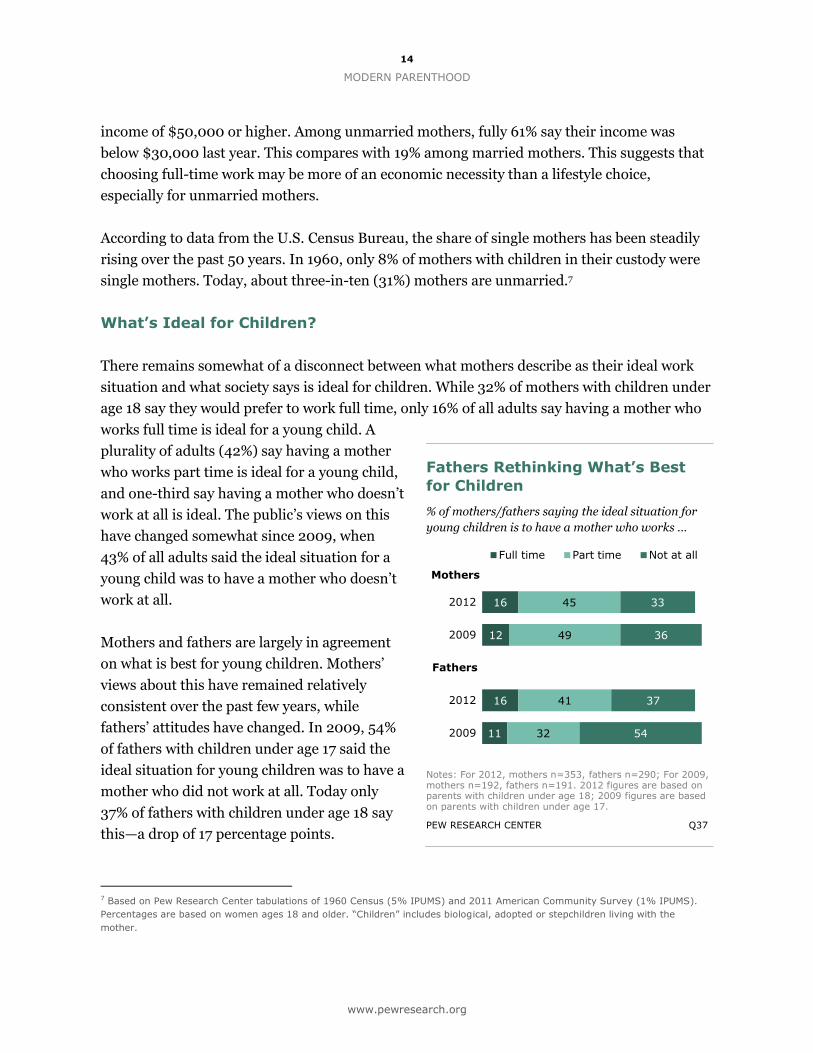
What’s Ideal for Children?
There remains somewhat of a disconnect between what mothers describe as their ideal work
situation and what society says is ideal for children. While 32% of mothers with children under
age 18 say they would prefer to work full time, only 16% of all adults say having a mother who
works full time is ideal for a young child. A
plurality of adults (42%) say having a mother
who works part time is ideal for a young child,
and one-third say having a mother who doesn’t
work at all is ideal. The public’s views on this
have changed somewhat since 2009, when
43% of all adults said the ideal situation for a
young child was to have a mother who doesn’t
work at all.
Mothers and fathers are largely in agreement
on what is best for young children. Mothers’
views about this have remained relatively
consistent over the past few years, while
fathers’ attitudes have changed. In 2009, 54%
of fathers with children under age 17 said the
ideal situation for young children was to have a
mother who did not work at all. Today only
37% of fathers with children under age 18 say
this—a drop of 17 percentage points.
7 Based on Pew Research Center tabulations of 1960 Census (5% IPUMS) and 2011 American Community Survey (1% IPUMS).
Percentages are based on women ages 18 and older. “Children” includes biological, adopted or stepchildren living with the
mother.
Fathers Rethinking What’s Best
for Children
% of mothers/fathers saying the ideal situation for
young children is to have a mother who works …
Notes: For 2012, mothers n=353, fathers n=290; For 2009, mothers n=192, fathers n=191. 2012 figures are based on parents with children under age 18; 2009 figures are based on parents with children under age 17.
PEW RESEARCH CENTER Q37
15
PEW RESEARCH CENTER
www.pewresearch.org
31
17
13
18
13
38
44
42
47
37
25
33
36
28
40
Black
Hispanic
White
Younger than 50
50 and older
Full time Part time Not at all
Race/Ethnicity
Age
Mothers’ views about what is best for children differ widely depending on their own
circumstances. Mothers who are employed full time are much more likely than mothers who
do not work to say having a working mother is ideal for a young child (75% vs. 44%). Even so,
most full-time working mothers don’t endorse their own situation. Only 22% say having a
mother who works full time is best for a young child, while 53% say having a mother who
works part time is ideal. About one-in-five (19%) mothers who work full time say having a
mother who doesn’t work at all is best for a child.
Mothers who don’t work have a much different view. Fully half (51%) say having a mother who
stays home is ideal for a young child. Only 11% say having a full-time working mother is ideal,
and 32% say having a mother who works part time is the best situation for a young child.
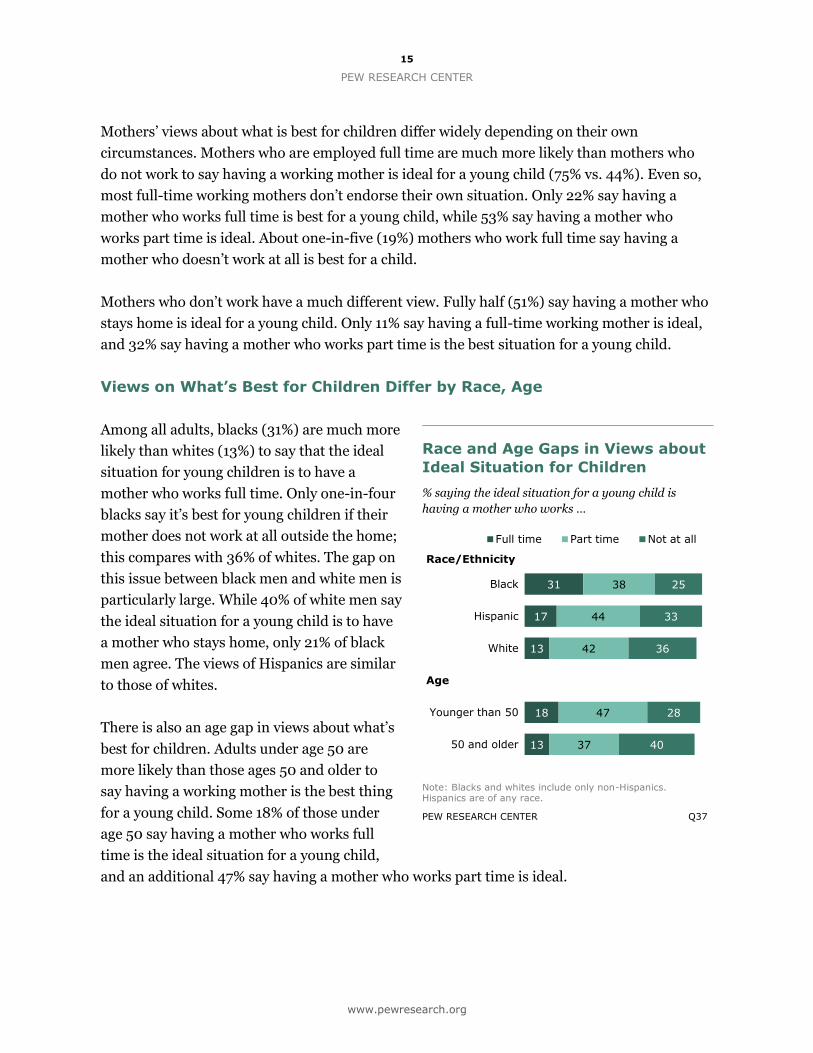
Views on What’s Best for Children Differ by Race, Age
Among all adults, blacks (31%) are much more
likely than whites (13%) to say that the ideal
situation for young children is to have a
mother who works full time. Only one-in-four
blacks say it’s best for young children if their
mother does not work at all outside the home;
this compares with 36% of whites. The gap on
this issue between black men and white men is
particularly large. While 40% of white men say
the ideal situation for a young child is to have
a mother who stays home, only 21% of black
men agree. The views of Hispanics are similar
to those of whites.
There is also an age gap in views about what’s
best for children. Adults under age 50 are
more likely than those ages 50 and older to
say having a working mother is the best thing
for a young child. Some 18% of those under
age 50 say having a mother who works full
time is the ideal situation for a young child,
and an additional 47% say having a mother who works part time is ideal.
Race and Age Gaps in Views about
Ideal Situation for Children
% saying the ideal situation for a young child is
having a mother who works …
Note: Blacks and whites include only non-Hispanics. Hispanics are of any race.
PEW RESEARCH CENTER Q37
16
MODERN PARENTHOOD
www.pewresearch.org
78
74
70
30
80
69
48
40
Working mothers Working fathers
Job security
A job they enjoy
A flexible schedule
A high-paying job
By contrast, among those ages 50 and older, only 13% say having a full-time working mother is
ideal for children, and 37% say having a mother who works part time would be best. Fully 40%
of those ages 50 and older say the ideal situation for a young child is to have a mother who
doesn’t work at all outside the home. Only 28% of adults under age 50 agree. The age
differences are more pronounced among men than among women.
What’s Ideal for Mothers and Fathers with Young Children?
Survey respondents were also asked what the ideal situation is for mothers and fathers with
young children. Among all adults, only 12% say it’s best for mothers of young children to work
full time. A 47% plurality say working part time is the ideal situation for mothers of young
children, and one-third say it’s best if these mothers not work at all outside the home.
The public has much different views about what is best for fathers of young children. Fully
seven-in-ten adults say the ideal situation for men with young children is to work full time.
One-in-five endorse part-time work for fathers of young children, and only 4% say the ideal
situation for these dads would be not to work at all.
Fathers themselves are bigger proponents than
mothers of full-time work for parents with
young children. Among fathers with children
under age 18, 17% say the ideal situation for
mothers of young children is to work full time.
Only 7% of mothers agree with this. When it
comes to what’s ideal for fathers, there is
somewhat more agreement: 75% of fathers say
the ideal situation for fathers of young children
is to work full time; 66% of mothers agree.
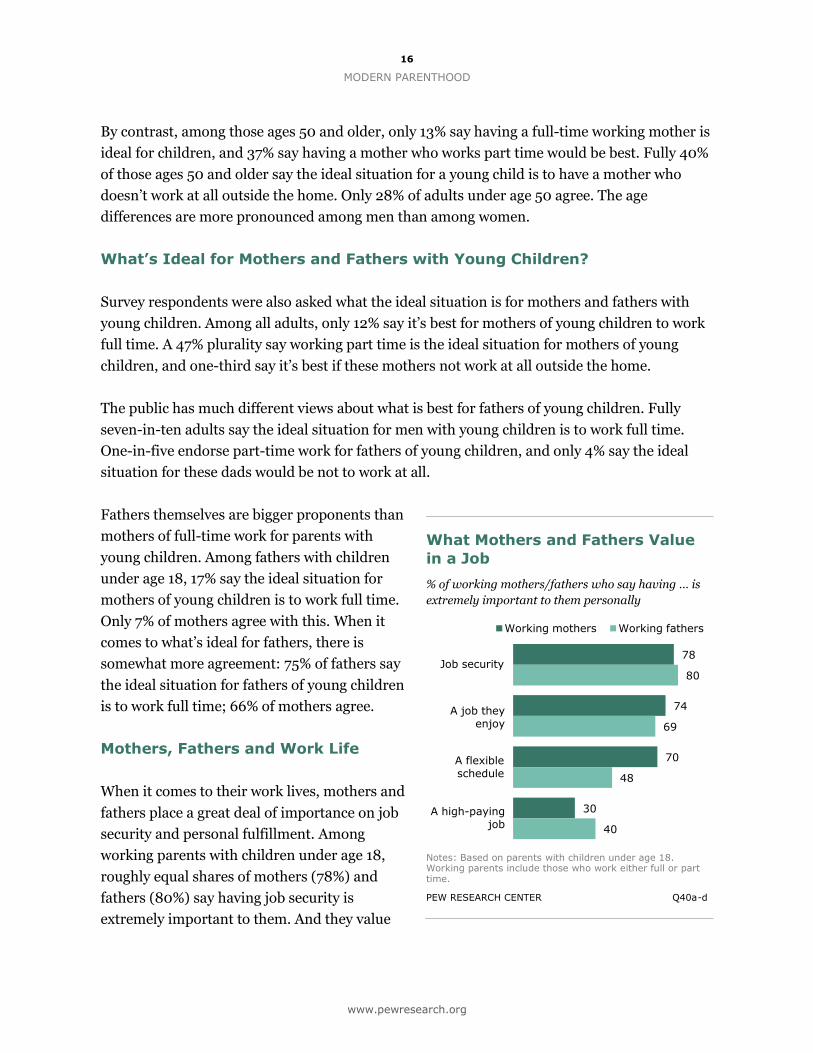
Mothers, Fathers and Work Life
When it comes to their work lives, mothers and
fathers place a great deal of importance on job
security and personal fulfillment. Among
working parents with children under age 18,
roughly equal shares of mothers (78%) and
fathers (80%) say having job security is
extremely important to them. And they value
What Mothers and Fathers Value
in a Job
% of working mothers/fathers who say having … is
extremely important to them personally
Notes: Based on parents with children under age 18. Working parents include those who work either full or part time.
PEW RESEARCH CENTER Q40a-d
17
PEW RESEARCH CENTER
www.pewresearch.org
34
27
38
21
55
62
52
64
10
9
9
12
Men
Women
Fathers
Mothers
Completely satisfied
Mostly satisfied
Completely/Mostly dissatisfied
nearly as much having a job they enjoy: 74% of working mothers and 69% of working fathers
say this is extremely important to them.
Having a flexible work schedule is much more important to working mothers than it is to
working fathers. Fully seven-in-ten working mothers with children under age 18 say having a
flexible schedule is extremely important to them. Only about half (48%) of working fathers
place the same level of importance on this.
There is a large gap between parents and non-parents in the value each places on having a
flexible work schedule. Among working women with no children under age 18, only 43% say
having a flexible work schedule is extremely important to them (vs. 70% of working mothers).
And among working men with no minor children, 36% say this is extremely important (vs.
48% of working fathers).
Mothers and fathers differ in the importance they place on having a high-paying job. Four-in-
ten working fathers say having a high-paying job is extremely important to them, compared
with three-in-ten working mothers.
Among working mothers, there is a significant
gap between those who are married and
unmarried in terms of the value they place on
having a high-paying job. Only 26% of those
who are married say this is extremely
important to them personally, while 39% of
those who are unmarried say having a high-
paying job is extremely important.
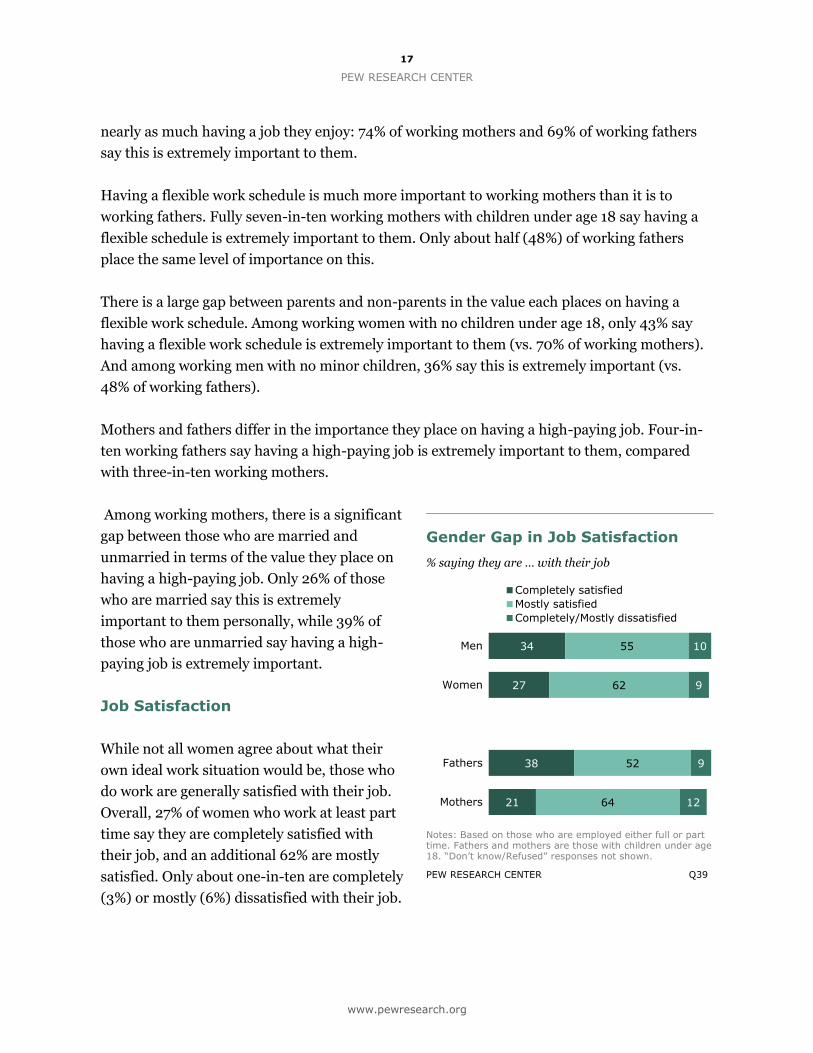
Job Satisfaction
While not all women agree about what their
own ideal work situation would be, those who
do work are generally satisfied with their job.
Overall, 27% of women who work at least part
time say they are completely satisfied with
their job, and an additional 62% are mostly
satisfied. Only about one-in-ten are completely
(3%) or mostly (6%) dissatisfied with their job.
Gender Gap in Job Satisfaction
% saying they are … with their job
Notes: Based on those who are employed either full or part time. Fathers and mothers are those with children under age 18. “Don’t know/Refused” responses not shown.
PEW RESEARCH CENTER Q39

18
MODERN PARENTHOOD
www.pewresearch.org
Women who work part time are no more or less satisfied with their jobs than those who work
full time.
Working mothers are less satisfied with their jobs than are working women who do not have
minor children. Among all working mothers with children under age 18, 21% say they are
completely satisfied with their job; this compares with 32% of working women without
children under age 18.
Men are more likely than women to say they are completely satisfied with their job (34% vs.
27%). And the gap between mothers and fathers is even wider. Among working fathers with
children under age 18, 38% say they are completely satisfied with their job (only 21% of
working mothers say the same).
19
PEW RESEARCH CENTER
www.pewresearch.org
34
20
37
32
36
31
37
27
46
47
47
45
47
44
47
45
18
31
16
22
15
25
15
28
Mothers
Fathers
Married
Unmarried
Working
Not working
Always Sometimes Almost never
Has children <18
No children <18
Among adults with children <18 ...
CHAPTER 2: BALANCING WORK AND FAMILY LIFE
One of the challenges for working parents is finding enough time to do it all. Many say they feel
rushed, and more than half say they have difficulty balancing the responsibilities of their job
and their family life. While working mothers and fathers divide their time differently—with
fathers concentrating somewhat more on paid work and mothers more on home and
children—moms and dads are equally likely to find the juggling act challenging.
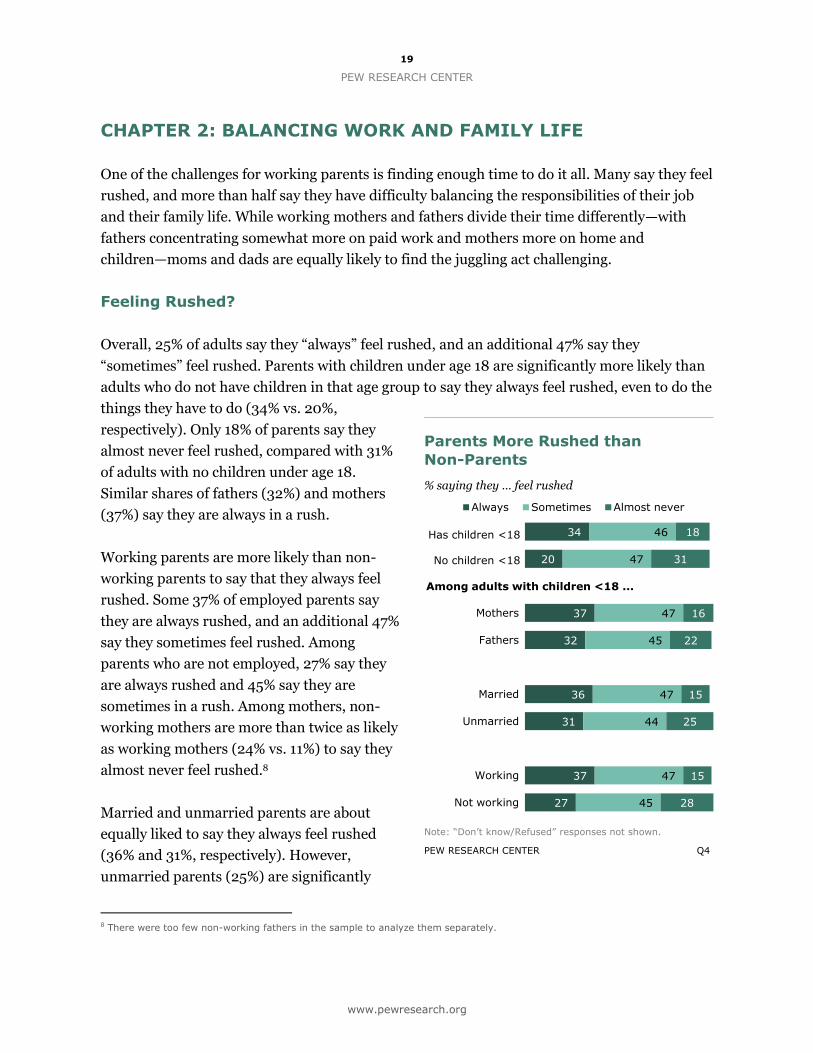
Feeling Rushed?
Overall, 25% of adults say they “always” feel rushed, and an additional 47% say they
“sometimes” feel rushed. Parents with children under age 18 are significantly more likely than
adults who do not have children in that age group to say they always feel rushed, even to do the
things they have to do (34% vs. 20%,
respectively). Only 18% of parents say they
almost never feel rushed, compared with 31%
of adults with no children under age 18.
Similar shares of fathers (32%) and mothers
(37%) say they are always in a rush.
Working parents are more likely than non-
working parents to say that they always feel
rushed. Some 37% of employed parents say
they are always rushed, and an additional 47%
say they sometimes feel rushed. Among
parents who are not employed, 27% say they
are always rushed and 45% say they are
sometimes in a rush. Among mothers, non-
working mothers are more than twice as likely
as working mothers (24% vs. 11%) to say they
almost never feel rushed.8
Married and unmarried parents are about
equally liked to say they always feel rushed
(36% and 31%, respectively). However,
unmarried parents (25%) are significantly
8 There were too few non-working fathers in the sample to analyze them separately.
Parents More Rushed than
Non-Parents
% saying they … feel rushed
Note: “Don’t know/Refused” responses not shown.
PEW RESEARCH CENTER Q4
20
MODERN PARENTHOOD
www.pewresearch.org
47
68
43
50
53
31
56
50
Has children <18
No children <18
Mothers
Fathers
Not too/ Not at all difficult
Very/ Somewhat difficult
more likely than married parents (15%) to say they almost never feel rushed.
Parents who live in dual-income households report feeling busier than those who live in a
household where only one spouse or partner is employed. About four-in-ten (39%) parents in
dual-earner partnerships say they are always rushed, compared with 28% of parents for whom
either they or their partner is not working.
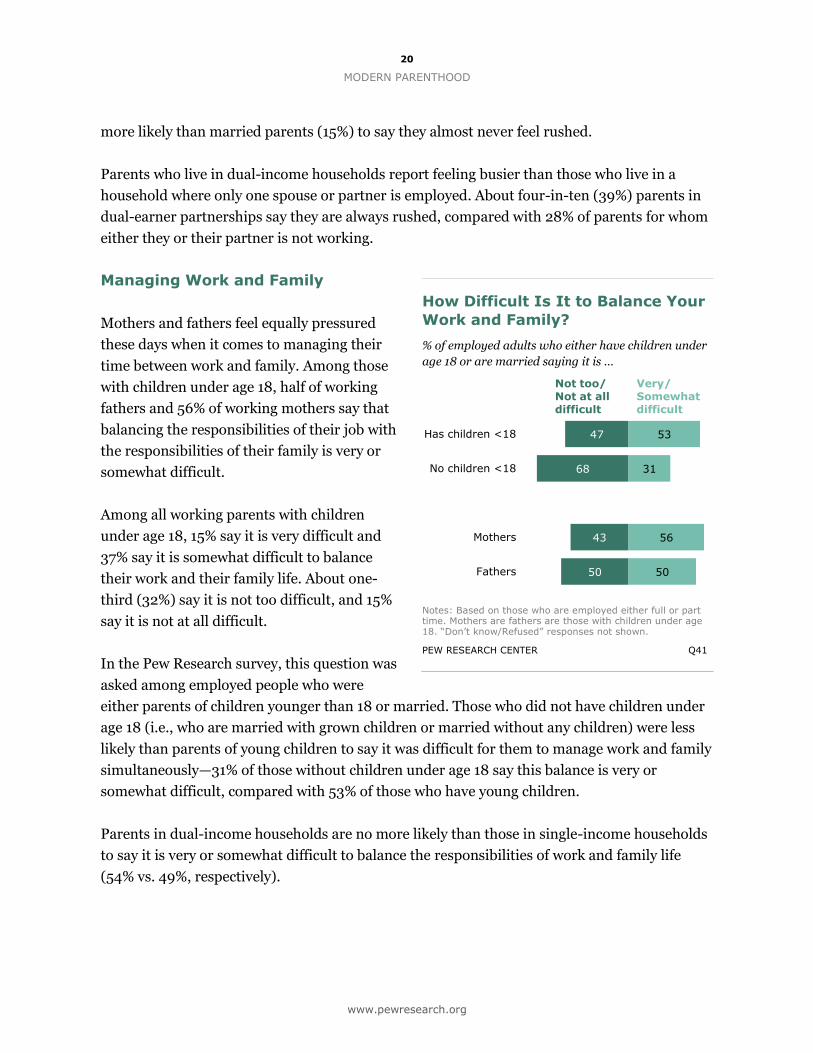
Managing Work and Family
Mothers and fathers feel equally pressured
these days when it comes to managing their
time between work and family. Among those
with children under age 18, half of working
fathers and 56% of working mothers say that
balancing the responsibilities of their job with
the responsibilities of their family is very or
somewhat difficult.
Among all working parents with children
under age 18, 15% say it is very difficult and
37% say it is somewhat difficult to balance
their work and their family life. About one-
third (32%) say it is not too difficult, and 15%
say it is not at all difficult.
In the Pew Research survey, this question was
asked among employed people who were
either parents of children younger than 18 or married. Those who did not have children under
age 18 (i.e., who are married with grown children or married without any children) were less
likely than parents of young children to say it was difficult for them to manage work and family
simultaneously—31% of those without children under age 18 say this balance is very or
somewhat difficult, compared with 53% of those who have young children.
Parents in dual-income households are no more likely than those in single-income households
to say it is very or somewhat difficult to balance the responsibilities of work and family life
(54% vs. 49%, respectively).
How Difficult Is It to Balance Your
Work and Family?
% of employed adults who either have children under
age 18 or are married saying it is …
Notes: Based on those who are employed either full or part time. Mothers are fathers are those with children under age 18. “Don’t know/Refused” responses not shown.
PEW RESEARCH CENTER Q41
21
PEW RESEARCH CENTER
www.pewresearch.org
There is no historical trend for the Pew Research question, so it is difficult to say how the level
of difficulty men and women experience in balancing work and family life has changed over
time. However, another national survey offers some clues. The Families and Work Institute
conducted a survey of the U.S. workforce in 2008 that included questions about work-life
balance. This survey found that fathers were more much likely to feel conflicts between their
working lives and personal lives in 2008 than they had been in 1977, while mothers
experienced only a modest increase in these conflicts over the same period. In 1977, 35% of
employed fathers whose spouse or partner worked and 41% of employed mothers in dual-
earner couples said they experienced at least some work-life conflict.9 In 2008, the share of
fathers saying this had increased to 60%, while the share of mothers saying so went up only
marginally to 47%.10
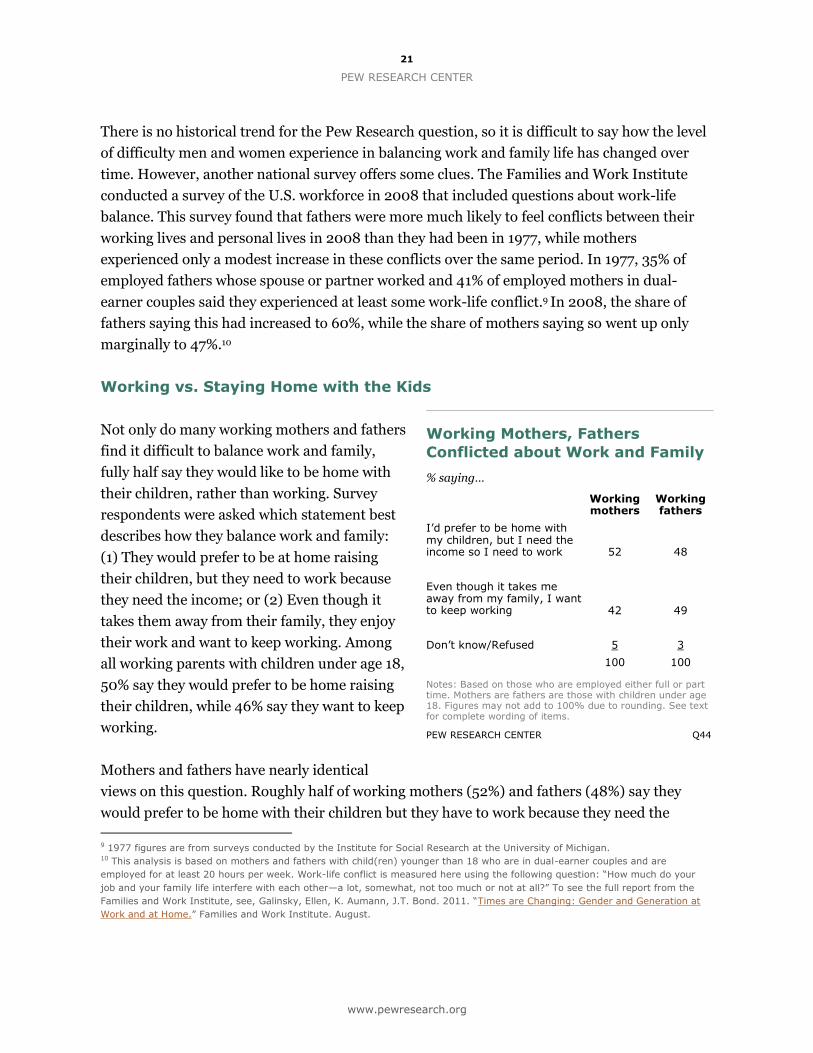
Working vs. Staying Home with the Kids
Not only do many working mothers and fathers
find it difficult to balance work and family,
fully half say they would like to be home with
their children, rather than working. Survey
respondents were asked which statement best
describes how they balance work and family:
(1) They would prefer to be at home raising
their children, but they need to work because
they need the income; or (2) Even though it
takes them away from their family, they enjoy
their work and want to keep working. Among
all working parents with children under age 18,
50% say they would prefer to be home raising
their children, while 46% say they want to keep
working.
Mothers and fathers have nearly identical
views on this question. Roughly half of working mothers (52%) and fathers (48%) say they
would prefer to be home with their children but they have to work because they need the
9 1977 figures are from surveys conducted by the Institute for Social Research at the University of Michigan. 10 This analysis is based on mothers and fathers with child(ren) younger than 18 who are in dual-earner couples and are
employed for at least 20 hours per week. Work-life conflict is measured here using the following question: “How much do your
job and your family life interfere with each other—a lot, somewhat, not too much or not at all?” To see the full report from the
Families and Work Institute, see, Galinsky, Ellen, K. Aumann, J.T. Bond. 2011. “Times are Changing: Gender and Generation at
Work and at Home.” Families and Work Institute. August.
Working Mothers, Fathers
Conflicted about Work and Family
% saying…
Working mothers
Working fathers
I’d prefer to be home with my children, but I need the income so I need to work 52 48
Even though it takes me away from my family, I want to keep working 42 49
Don’t know/Refused 5 3
100 100
Notes: Based on those who are employed either full or part time. Mothers are fathers are those with children under age 18. Figures may not add to 100% due to rounding. See text for complete wording of items.
PEW RESEARCH CENTER Q44
22
MODERN PARENTHOOD
www.pewresearch.org
63
39
62
42
35
55
36
53
Less than $50,000
$50,000 or higher
No college
Some college/ College graduate
Would prefer to be home, but need income
Enjoy work,
want to keep
working
Income
Education
Some college or more
income. Some 42% of mothers and 49% of fathers say that even though work takes them away
from their families, they enjoy their work and want to keep working. (These differences are not
statistically significant.)
NBC News and the Wall Street Journal asked this question of working mothers 12 years ago,
and opinions have changed very little since then. In 2000, 48% of working mothers with
children under age 18 said they would prefer
to be home with their children but needed to
work, and 44% said they would like to keep
working even though it took them away from
their family.11
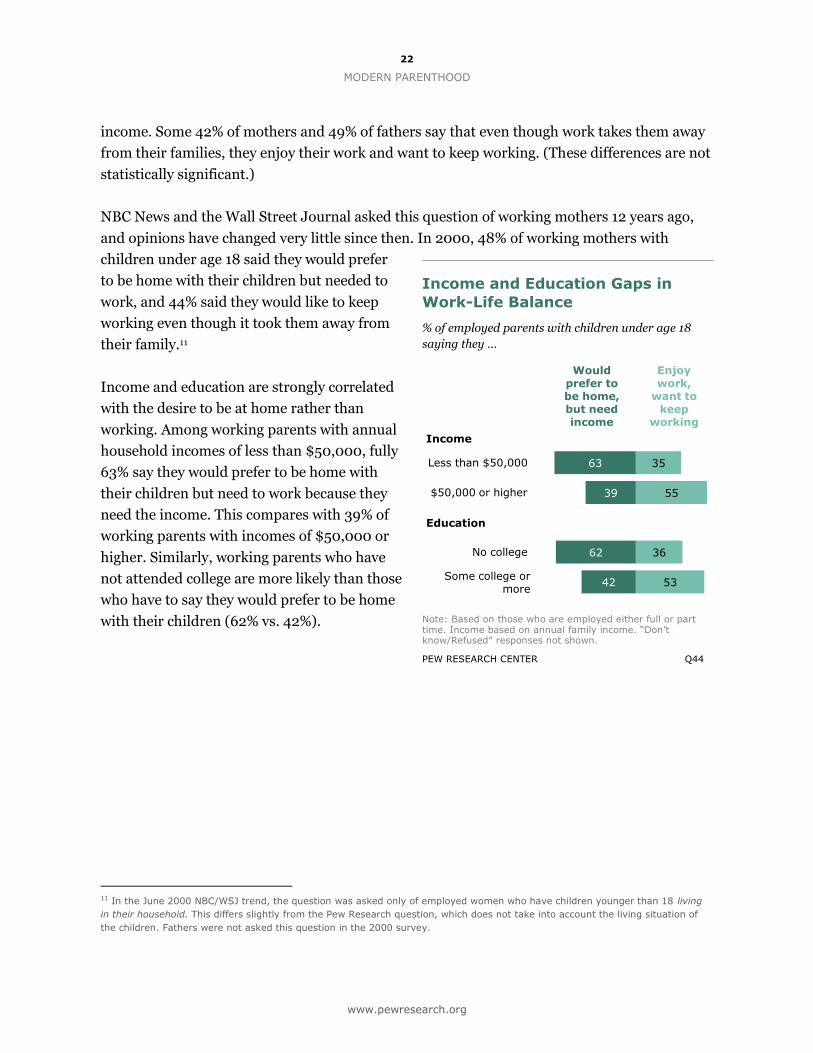
Income and education are strongly correlated
with the desire to be at home rather than
working. Among working parents with annual
household incomes of less than $50,000, fully
63% say they would prefer to be home with
their children but need to work because they
need the income. This compares with 39% of
working parents with incomes of $50,000 or
higher. Similarly, working parents who have
not attended college are more likely than those
who have to say they would prefer to be home
with their children (62% vs. 42%).
11 In the June 2000 NBC/WSJ trend, the question was asked only of employed women who have children younger than 18 living
in their household. This differs slightly from the Pew Research question, which does not take into account the living situation of
the children. Fathers were not asked this question in the 2000 survey.
Income and Education Gaps in
Work-Life Balance
% of employed parents with children under age 18
saying they …
Note: Based on those who are employed either full or part time. Income based on annual family income. “Don’t know/Refused” responses not shown.
PEW RESEARCH CENTER Q44
23
PEW RESEARCH CENTER
www.pewresearch.org
73
64
72
63
78
66
Mothers
Fathers
Married parents
Unmarried parents
Working
Not working
Among mothers ...
24
30
11
45
47
43
Excellent Very good
All parents with children <18
Time spent with children:
Right amount
Too little
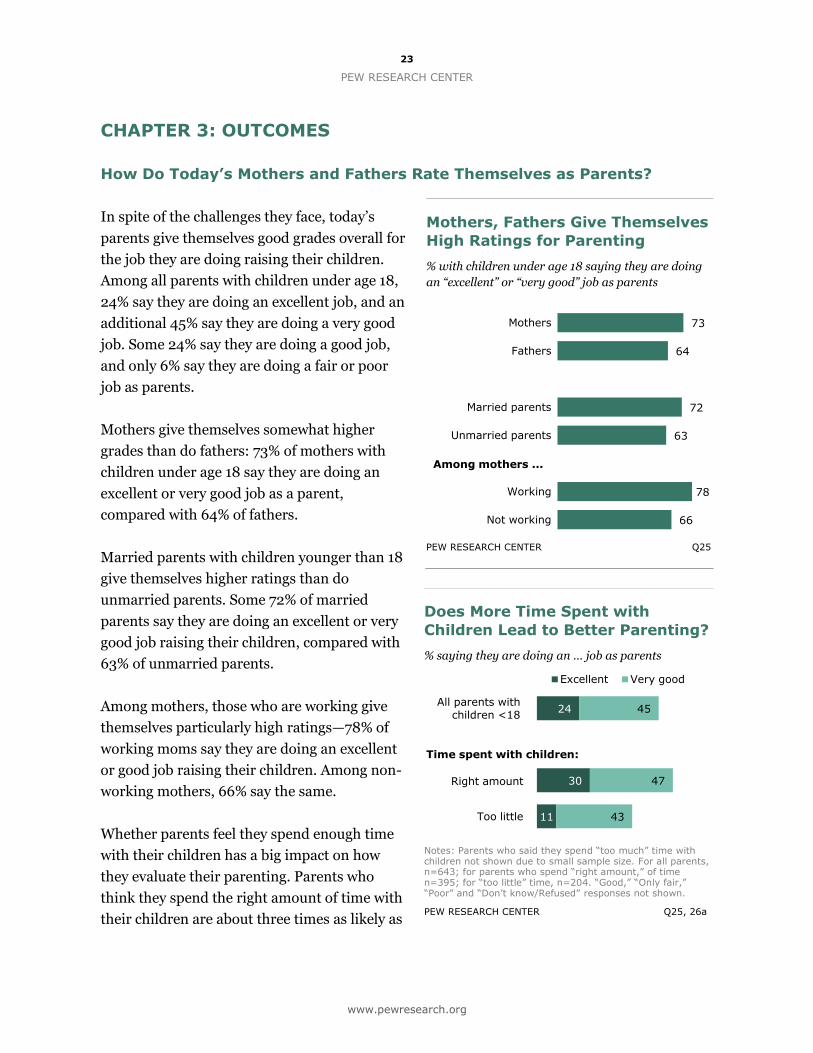
CHAPTER 3: OUTCOMES
How Do Today’s Mothers and Fathers Rate Themselves as Parents?
In spite of the challenges they face, today’s
parents give themselves good grades overall for
the job they are doing raising their children.
Among all parents with children under age 18,
24% say they are doing an excellent job, and an
additional 45% say they are doing a very good
job. Some 24% say they are doing a good job,
and only 6% say they are doing a fair or poor
job as parents.
Mothers give themselves somewhat higher
grades than do fathers: 73% of mothers with
children under age 18 say they are doing an
excellent or very good job as a parent,
compared with 64% of fathers.
Married parents with children younger than 18
give themselves higher ratings than do
unmarried parents. Some 72% of married
parents say they are doing an excellent or very
good job raising their children, compared with
63% of unmarried parents.
Among mothers, those who are working give
themselves particularly high ratings—78% of
working moms say they are doing an excellent
or good job raising their children. Among non-
working mothers, 66% say the same.
Whether parents feel they spend enough time
with their children has a big impact on how
they evaluate their parenting. Parents who
think they spend the right amount of time with
their children are about three times as likely as
Mothers, Fathers Give Themselves
High Ratings for Parenting
% with children under age 18 saying they are doing
an “excellent” or “very good” job as parents
PEW RESEARCH CENTER Q25
Does More Time Spent with
Children Lead to Better Parenting?
% saying they are doing an … job as parents
Notes: Parents who said they spend “too much” time with children not shown due to small sample size. For all parents, n=643; for parents who spend “right amount,” of time n=395; for “too little” time, n=204. “Good,” “Only fair,” “Poor” and “Don’t know/Refused” responses not shown.
PEW RESEARCH CENTER Q25, 26a
24
MODERN PARENTHOOD
www.pewresearch.org
31
24
36
30
38
23
48
60
49
47
49
48
17
14
11
17
10
21
Parents
Not parents
Mothers
Fathers
Married
Unmarried
Very happy Pretty happy Not too happy
Among parents with children <18 ...
parents who say they spend too little time with their children to say they are doing an excellent
job parenting (30% vs. 11%). Overall, 77% of parents who say they spend the right amount of
time with their kids also say they are doing an excellent or very good job as parents; only 54%
of those who say they spend too little time rate themselves as doing an excellent or very good
job.
Similarly, parents who say they have difficulty balancing work and family life are harder on
themselves when it comes to evaluating their parenting. Among working parents who say
balancing the responsibilities of their job and their family is difficult for them, two-thirds give
themselves an excellent or very good rating for the job they are doing as parents. By contrast,
among working parents who say balancing these responsibilities is not difficult for them, 77%
give themselves high marks.
Parents’ self-evaluations differ somewhat by key demographic groups. Among parents with
children of any age, white and black parents give themselves similar grades for their parenting,
while Hispanic parents are much harder on themselves. Only 56% of Hispanic parents say they
are doing an excellent or very good job as
parents, while 72% of white parents and 67%
of black parents give themselves high marks
for parenting.12
Education is also linked to parents’ self-
assessments. Among parents with children
under age 18, those who have attended or
graduated from college rate their parenting
more favorably than those who have not
attended college: 73% of parents with some
college experience say they are doing an
excellent or very good job as parents,
compared with 63% of those with no college
experience.
12 Analysis of racial and ethnic differences is based on parents with children of any age due to small sample sizes among those
with children under age 18.
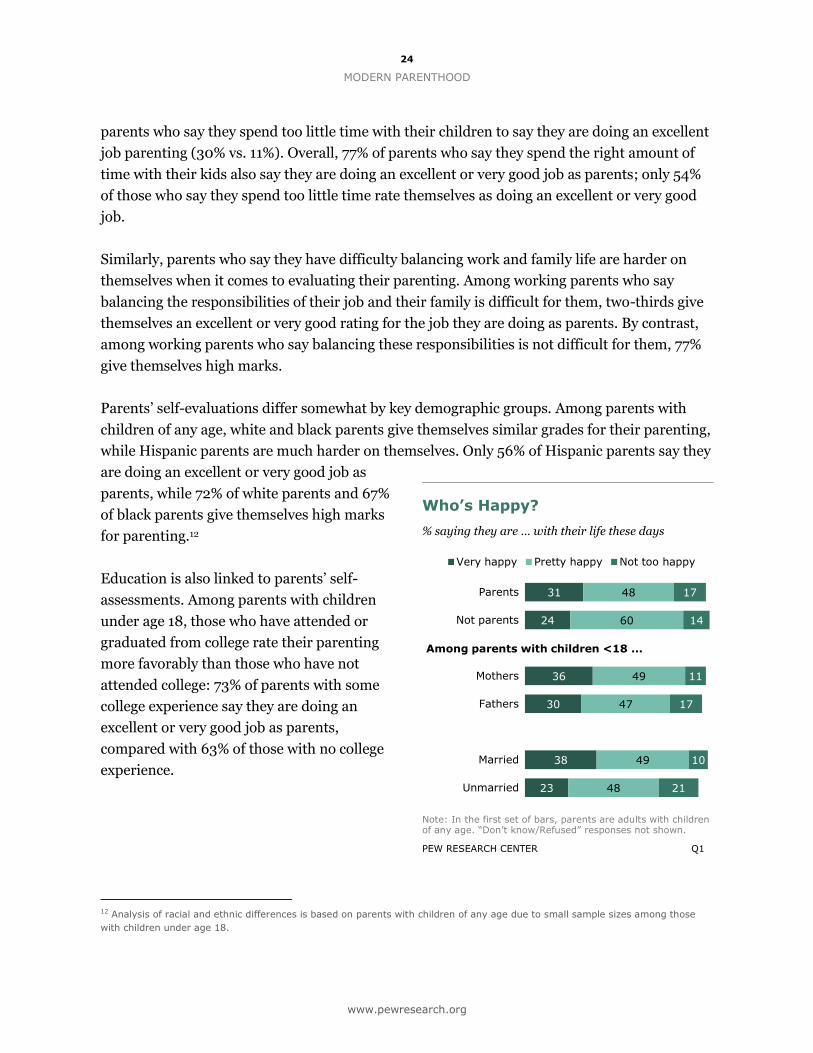
Who’s Happy?
% saying they are … with their life these days
Note: In the first set of bars, parents are adults with children of any age. “Don’t know/Refused” responses not shown.
PEW RESEARCH CENTER Q1
25
PEW RESEARCH CENTER
www.pewresearch.org
43
23
45
31
Married
Unmarried
Not working
Working
Mothers who are ...
Some Parents are Happier than Others
The stresses and joys of parenthood are inextricably linked to overall happiness and well-
being. It is nearly impossible, using survey data alone, to disaggregate the factors that
contribute to happiness. However, some interesting patterns emerge relating to work and
family life.
In general, adults with children of any age tend to be somewhat happier than those who do not
have children.13 Three-in-ten parents (31%)
say they are “very happy,” 48% say they are
“pretty happy” and 17% say they are “not too
happy.” Among adults with no children, 24%
say they are very happy, 60% say they are
pretty happy and 14% say they are not too
happy.
Among parents with children under age 18,
mothers (36%) and fathers (30%) report
roughly equal levels of happiness. However, a
slightly larger share of fathers than mothers
say they are not too happy (17% vs. 11%).
Married parents are happier than unmarried
parents (38% vs. 23% say they are very
happy).
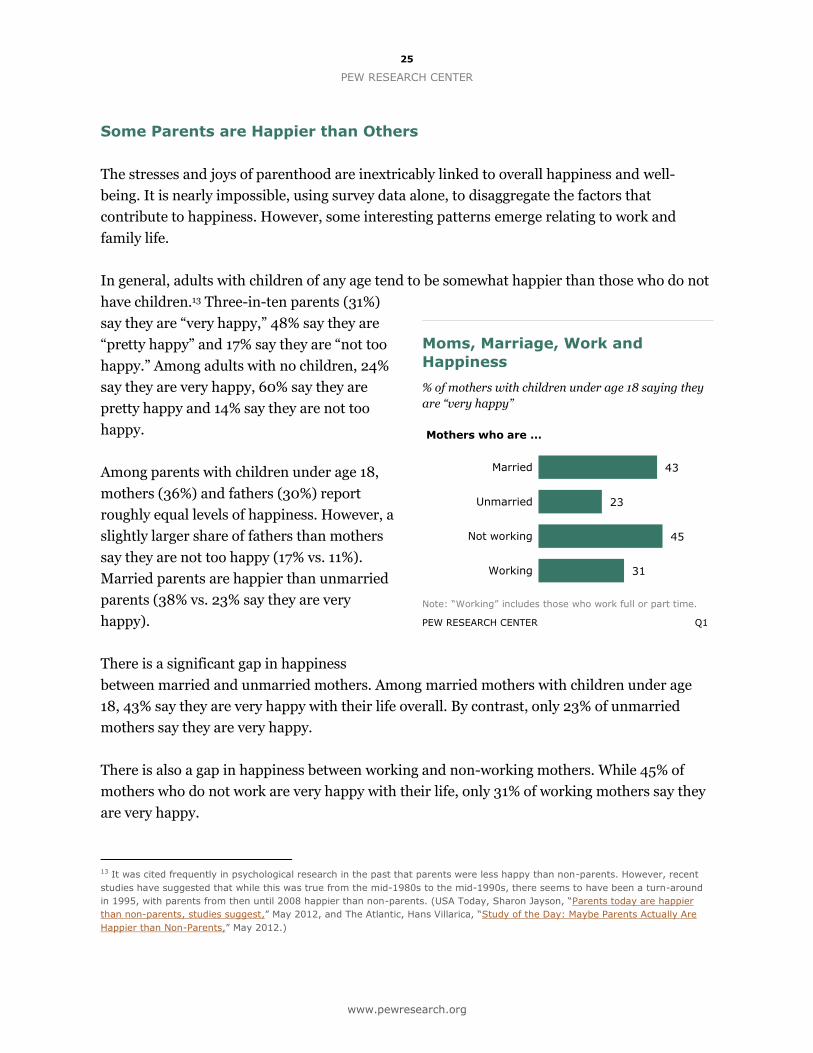
There is a significant gap in happiness
between married and unmarried mothers. Among married mothers with children under age
18, 43% say they are very happy with their life overall. By contrast, only 23% of unmarried
mothers say they are very happy.
There is also a gap in happiness between working and non-working mothers. While 45% of
mothers who do not work are very happy with their life, only 31% of working mothers say they
are very happy.
13 It was cited frequently in psychological research in the past that parents were less happy than non-parents. However, recent
studies have suggested that while this was true from the mid-1980s to the mid-1990s, there seems to have been a turn-around
in 1995, with parents from then until 2008 happier than non-parents. (USA Today, Sharon Jayson, “Parents today are happier
than non-parents, studies suggest,” May 2012, and The Atlantic, Hans Villarica, “Study of the Day: Maybe Parents Actually Are
Happier than Non-Parents,” May 2012.)
Moms, Marriage, Work and
Happiness
% of mothers with children under age 18 saying they
are “very happy”
Note: “Working” includes those who work full or part time.
PEW RESEARCH CENTER Q1
26
MODERN PARENTHOOD
www.pewresearch.org
26
36
26
36
56
51
46
51
Very happy Pretty happy
Balancing work and family life is ...
Time spent with children:
Right amount
Too little
Difficult
Not difficult
Further statistical analysis suggests that marriage trumps employment status when it comes to
moms’ happiness. When race, ethnicity,
educational attainment and income are held
constant, marital status is a significant
predictor of overall happiness, but work status
is not.14
Work-Life Balance and Happiness
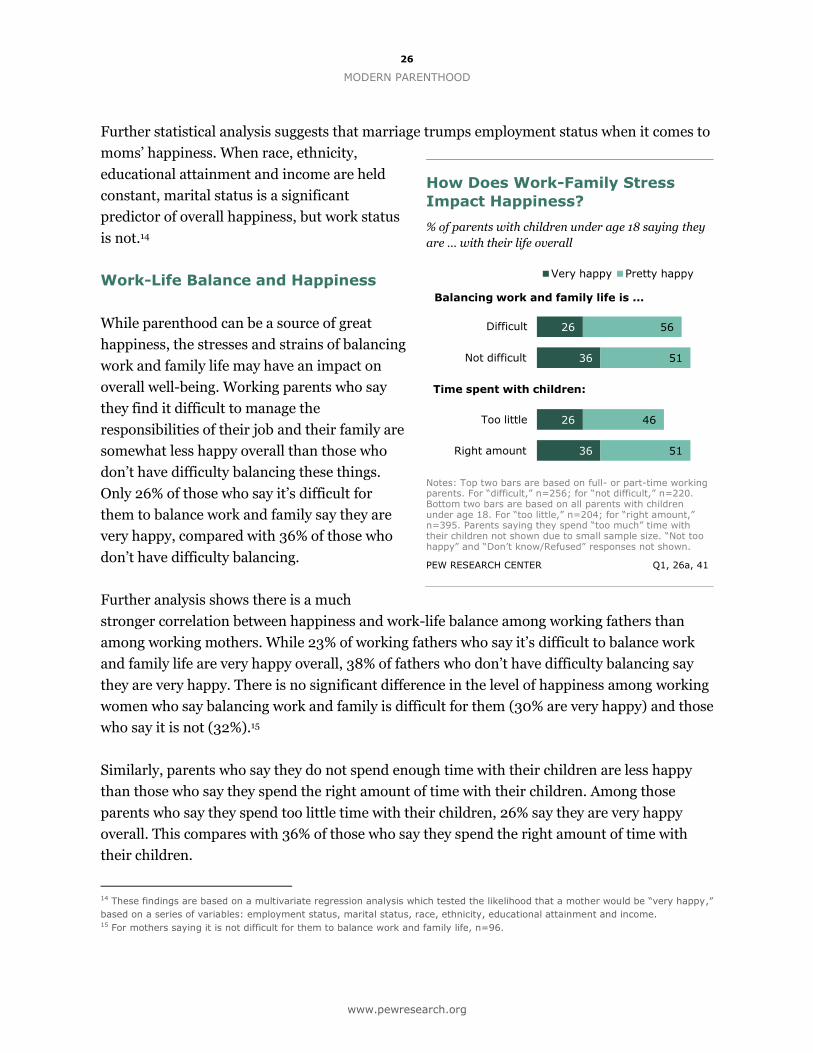
While parenthood can be a source of great
happiness, the stresses and strains of balancing
work and family life may have an impact on
overall well-being. Working parents who say
they find it difficult to manage the
responsibilities of their job and their family are
somewhat less happy overall than those who
don’t have difficulty balancing these things.
Only 26% of those who say it’s difficult for
them to balance work and family say they are
very happy, compared with 36% of those who
don’t have difficulty balancing.
Further analysis shows there is a much
stronger correlation between happiness and work-life balance among working fathers than
among working mothers. While 23% of working fathers who say it’s difficult to balance work
and family life are very happy overall, 38% of fathers who don’t have difficulty balancing say
they are very happy. There is no significant difference in the level of happiness among working
women who say balancing work and family is difficult for them (30% are very happy) and those
who say it is not (32%).15
Similarly, parents who say they do not spend enough time with their children are less happy
than those who say they spend the right amount of time with their children. Among those
parents who say they spend too little time with their children, 26% say they are very happy
overall. This compares with 36% of those who say they spend the right amount of time with
their children.
14 These findings are based on a multivariate regression analysis which tested the likelihood that a mother would be “very happy,”
based on a series of variables: employment status, marital status, race, ethnicity, educational attainment and income. 15 For mothers saying it is not difficult for them to balance work and family life, n=96.
How Does Work-Family Stress
Impact Happiness?
% of parents with children under age 18 saying they
are … with their life overall
Notes: Top two bars are based on full- or part-time working parents. For “difficult,” n=256; for “not difficult,” n=220. Bottom two bars are based on all parents with children under age 18. For “too little,” n=204; for “right amount,” n=395. Parents saying they spend “too much” time with their children not shown due to small sample size. “Not too happy” and “Don’t know/Refused” responses not shown.
PEW RESEARCH CENTER Q1, 26a, 41
27
PEW RESEARCH CENTER
www.pewresearch.org
SECTION II: TIME USE FINDINGS
CHAPTER 4: HOW MOTHERS AND FATHERS SPEND THEIR TIME
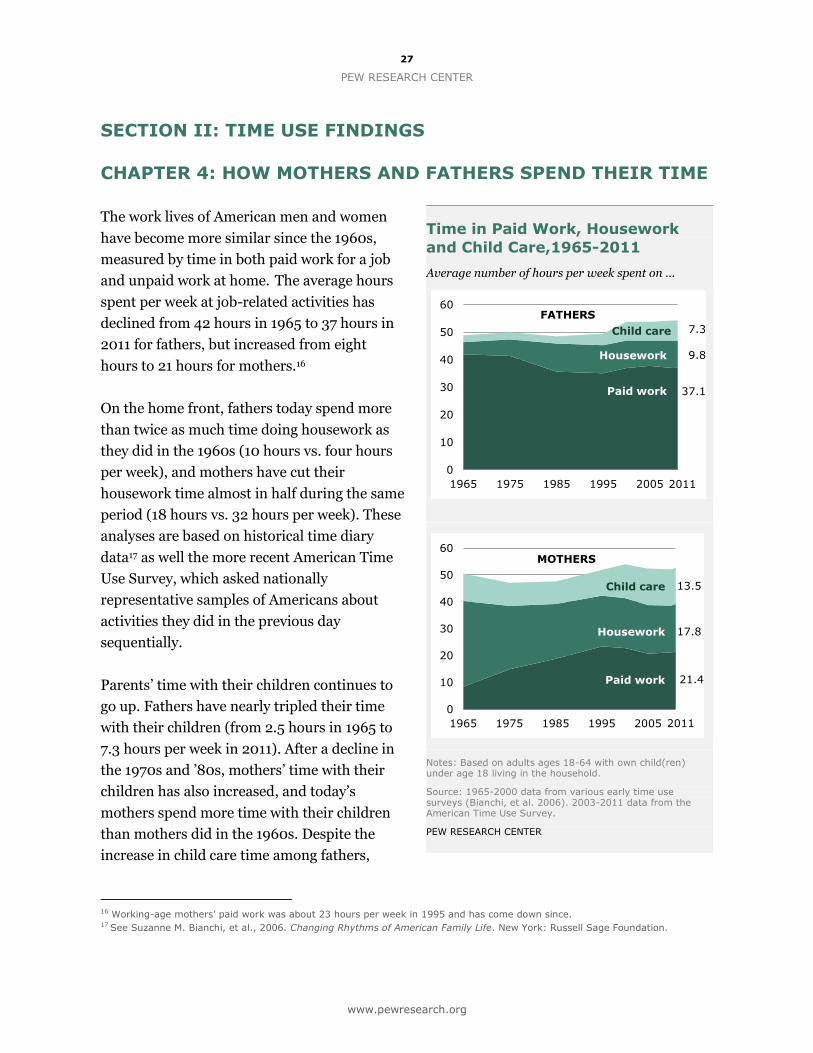
The work lives of American men and women
have become more similar since the 1960s,
measured by time in both paid work for a job
and unpaid work at home. The average hours
spent per week at job-related activities has
declined from 42 hours in 1965 to 37 hours in
2011 for fathers, but increased from eight
hours to 21 hours for mothers.16
On the home front, fathers today spend more
than twice as much time doing housework as
they did in the 1960s (10 hours vs. four hours
per week), and mothers have cut their
housework time almost in half during the same
period (18 hours vs. 32 hours per week). These
analyses are based on historical time diary
data17 as well the more recent American Time
Use Survey, which asked nationally
representative samples of Americans about
activities they did in the previous day
sequentially.
Parents’ time with their children continues to
go up. Fathers have nearly tripled their time
with their children (from 2.5 hours in 1965 to
7.3 hours per week in 2011). After a decline in
the 1970s and ’80s, mothers’ time with their
children has also increased, and today’s
mothers spend more time with their children
than mothers did in the 1960s. Despite the
increase in child care time among fathers,
16 Working-age mothers’ paid work was about 23 hours per week in 1995 and has come down since. 17 See Suzanne M. Bianchi, et al., 2006. Changing Rhythms of American Family Life. New York: Russell Sage Foundation.
Time in Paid Work, Housework
and Child Care,1965-2011
Average number of hours per week spent on …
Notes: Based on adults ages 18-64 with own child(ren) under age 18 living in the household.
Source: 1965-2000 data from various early time use surveys (Bianchi, et al. 2006). 2003-2011 data from the American Time Use Survey.
PEW RESEARCH CENTER
0
10
20
30
40
50
60
1965 1975 1985 1995 2005
Housework
Paid work
Child care
2011
7.3
9.8
37.1
FATHERS
0
10
20
30
40
50
60
1965 1975 1985 1995 2005
Housework
Paid work
Child care
2011
13.5
17.8
21.4
MOTHERS
28
MODERN PARENTHOOD
www.pewresearch.org
American mothers spend about twice as much time with their children as fathers do. 18 In 2011,
the average child care time is 7.3 hours per week for fathers and 13.5 hours per week for
mothers.
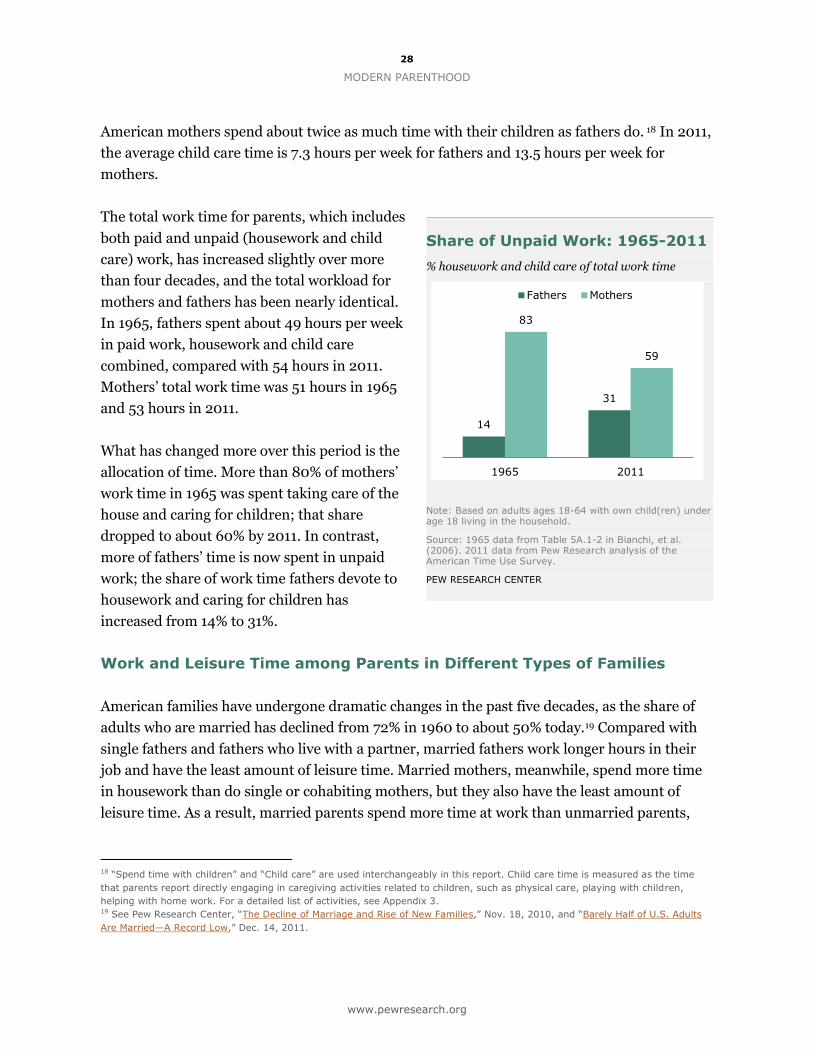
The total work time for parents, which includes
both paid and unpaid (housework and child
care) work, has increased slightly over more
than four decades, and the total workload for
mothers and fathers has been nearly identical.
In 1965, fathers spent about 49 hours per week
in paid work, housework and child care
combined, compared with 54 hours in 2011.
Mothers’ total work time was 51 hours in 1965
and 53 hours in 2011.
What has changed more over this period is the
allocation of time. More than 80% of mothers’
work time in 1965 was spent taking care of the
house and caring for children; that share
dropped to about 60% by 2011. In contrast,
more of fathers’ time is now spent in unpaid
work; the share of work time fathers devote to
housework and caring for children has
increased from 14% to 31%.
Work and Leisure Time among Parents in Different Types of Families
American families have undergone dramatic changes in the past five decades, as the share of
adults who are married has declined from 72% in 1960 to about 50% today.19 Compared with
single fathers and fathers who live with a partner, married fathers work longer hours in their
job and have the least amount of leisure time. Married mothers, meanwhile, spend more time
in housework than do single or cohabiting mothers, but they also have the least amount of
leisure time. As a result, married parents spend more time at work than unmarried parents,
18 “Spend time with children” and “Child care” are used interchangeably in this report. Child care time is measured as the time
that parents report directly engaging in caregiving activities related to children, such as physical care, playing with children,
helping with home work. For a detailed list of activities, see Appendix 3. 19 See Pew Research Center, “The Decline of Marriage and Rise of New Families,” Nov. 18, 2010, and “Barely Half of U.S. Adults
Are Married—A Record Low,” Dec. 14, 2011.
Share of Unpaid Work: 1965-2011
% housework and child care of total work time
Note: Based on adults ages 18-64 with own child(ren) under age 18 living in the household.
Source: 1965 data from Table 5A.1-2 in Bianchi, et al. (2006). 2011 data from Pew Research analysis of the American Time Use Survey.
PEW RESEARCH CENTER
14
31
83
59
1965 2011
Fathers Mothers
29
PEW RESEARCH CENTER
www.pewresearch.org
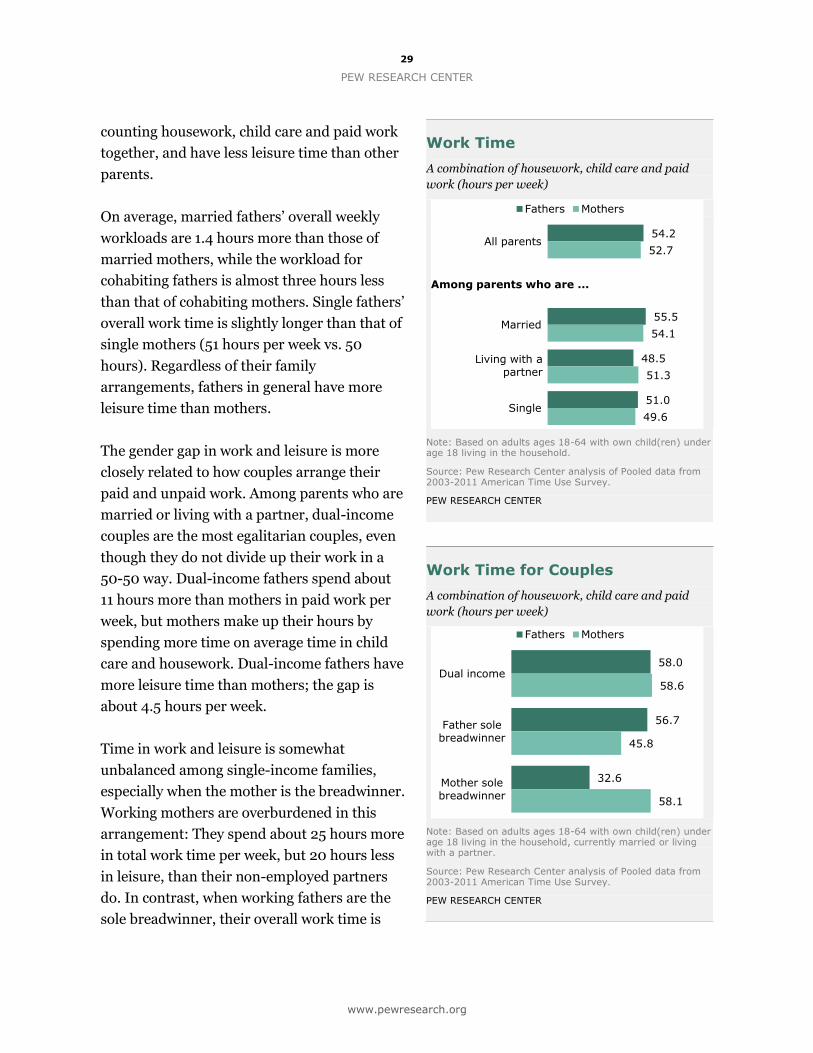
counting housework, child care and paid work
together, and have less leisure time than other
parents.
On average, married fathers’ overall weekly
workloads are 1.4 hours more than those of
married mothers, while the workload for
cohabiting fathers is almost three hours less
than that of cohabiting mothers. Single fathers’
overall work time is slightly longer than that of
single mothers (51 hours per week vs. 50
hours). Regardless of their family
arrangements, fathers in general have more
leisure time than mothers.
The gender gap in work and leisure is more
closely related to how couples arrange their
paid and unpaid work. Among parents who are
married or living with a partner, dual-income
couples are the most egalitarian couples, even
though they do not divide up their work in a
50-50 way. Dual-income fathers spend about
11 hours more than mothers in paid work per
week, but mothers make up their hours by
spending more time on average time in child
care and housework. Dual-income fathers have
more leisure time than mothers; the gap is
about 4.5 hours per week.
Time in work and leisure is somewhat
unbalanced among single-income families,
especially when the mother is the breadwinner.
Working mothers are overburdened in this
arrangement: They spend about 25 hours more
in total work time per week, but 20 hours less
in leisure, than their non-employed partners
do. In contrast, when working fathers are the
sole breadwinner, their overall work time is
Work Time
A combination of housework, child care and paid
work (hours per week)
Note: Based on adults ages 18-64 with own child(ren) under age 18 living in the household.
Source: Pew Research Center analysis of Pooled data from 2003-2011 American Time Use Survey.
PEW RESEARCH CENTER
Work Time for Couples
A combination of housework, child care and paid
work (hours per week)
Note: Based on adults ages 18-64 with own child(ren) under age 18 living in the household, currently married or living with a partner.
Source: Pew Research Center analysis of Pooled data from 2003-2011 American Time Use Survey.
PEW RESEARCH CENTER
54.2
55.5
48.5
51.0
52.7
54.1
51.3
49.6
All parents
Married
Living with a partner
Single
Fathers Mothers
Among parents who are ...
Living with a partner
58.0
56.7
32.6
58.6
45.8
58.1
Dual income
Father sole breadwinner
Mother sole breadwinner
Fathers Mothers
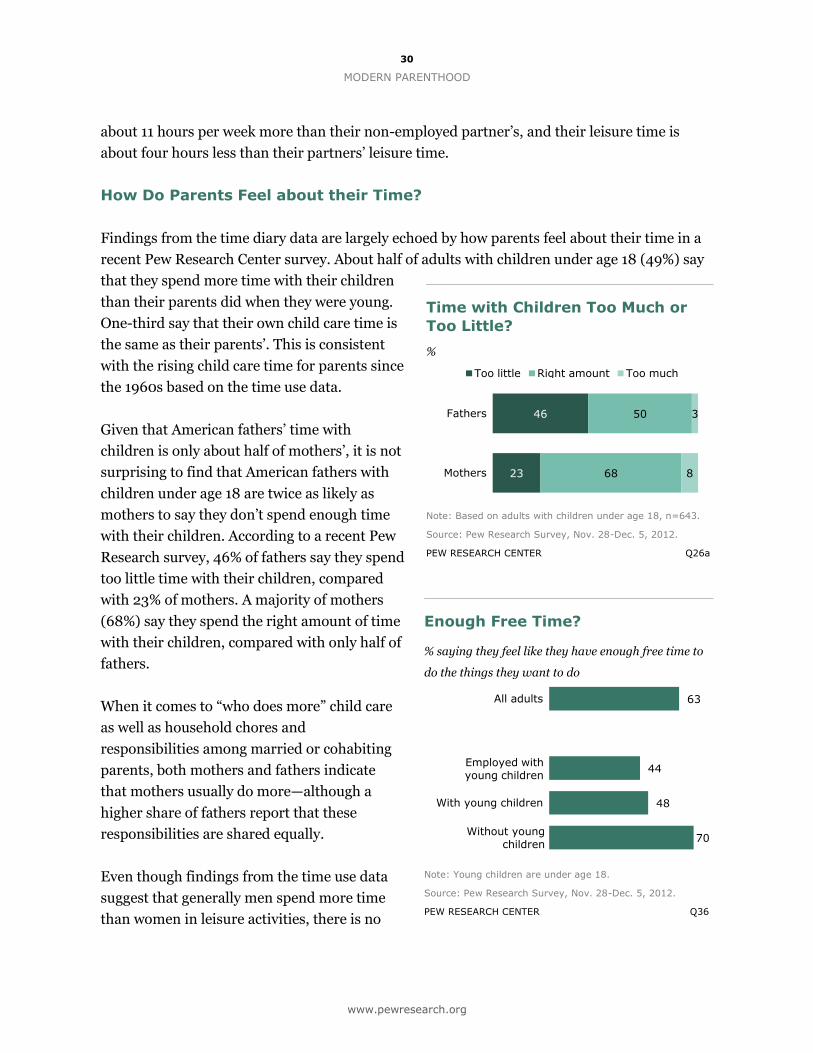
30
MODERN PARENTHOOD
www.pewresearch.org
46
23
50
68
3
8
Fathers
Mothers
Too little Right amount Too much
63
44
48
70
All adults
With young children
Without young children
Employed with young children
Without young children
about 11 hours per week more than their non-employed partner’s, and their leisure time is
about four hours less than their partners’ leisure time.
How Do Parents Feel about their Time?
Findings from the time diary data are largely echoed by how parents feel about their time in a
recent Pew Research Center survey. About half of adults with children under age 18 (49%) say
that they spend more time with their children
than their parents did when they were young.
One-third say that their own child care time is
the same as their parents’. This is consistent
with the rising child care time for parents since
the 1960s based on the time use data.
Given that American fathers’ time with
children is only about half of mothers’, it is not
surprising to find that American fathers with
children under age 18 are twice as likely as
mothers to say they don’t spend enough time
with their children. According to a recent Pew
Research survey, 46% of fathers say they spend
too little time with their children, compared
with 23% of mothers. A majority of mothers
(68%) say they spend the right amount of time
with their children, compared with only half of
fathers.
When it comes to “who does more” child care
as well as household chores and
responsibilities among married or cohabiting
parents, both mothers and fathers indicate
that mothers usually do more—although a
higher share of fathers report that these
responsibilities are shared equally.
Even though findings from the time use data
suggest that generally men spend more time
than women in leisure activities, there is no
Time with Children Too Much or
Too Little?
%
Note: Based on adults with children under age 18, n=643.
Source: Pew Research Survey, Nov. 28-Dec. 5, 2012.
PEW RESEARCH CENTER Q26a
Enough Free Time?
% saying they feel like they have enough free time to
do the things they want to do
Note: Young children are under age 18.
Source: Pew Research Survey, Nov. 28-Dec. 5, 2012.
PEW RESEARCH CENTER Q36
31
PEW RESEARCH CENTER
www.pewresearch.org
significant gender difference in how adults view their free time. Among parents with children
under age 18, 48% say that they generally feel like they have enough free time to do the things
they want to do. The share falls to 44% among working parents with young children. In
contrast, a vast majority of parents without young children (70%) report that they have enough
free time, in part because a higher share of these adults are retired.
The rest of this section goes into details about the long-term trend of Americans’ time at work
and at home as well as time use patterns among parents of different family types and living
arrangements. Public opinion questions related to time use are also discussed when available.
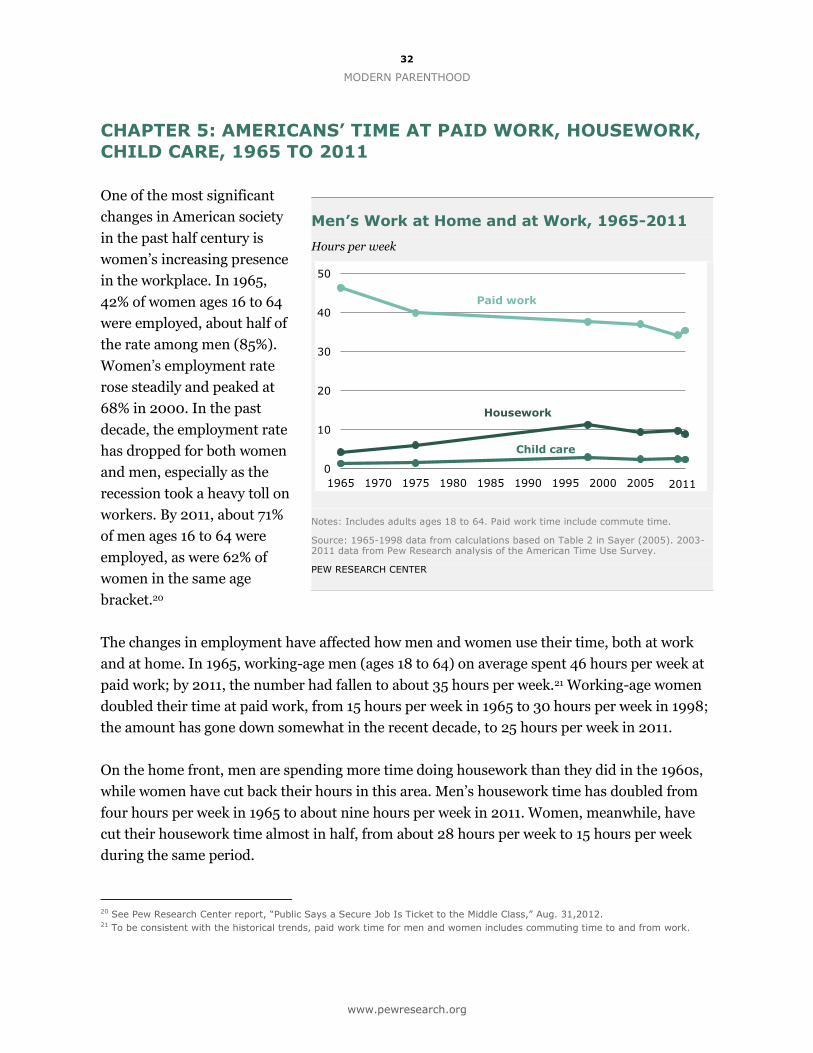
32
MODERN PARENTHOOD
www.pewresearch.org
CHAPTER 5: AMERICANS’ TIME AT PAID WORK, HOUSEWORK,
CHILD CARE, 1965 TO 2011
One of the most significant
changes in American society
in the past half century is
women’s increasing presence
in the workplace. In 1965,
42% of women ages 16 to 64
were employed, about half of
the rate among men (85%).
Women’s employment rate
rose steadily and peaked at
68% in 2000. In the past
decade, the employment rate
has dropped for both women
and men, especially as the
recession took a heavy toll on
workers. By 2011, about 71%
of men ages 16 to 64 were
employed, as were 62% of
women in the same age
bracket.20
The changes in employment have affected how men and women use their time, both at work
and at home. In 1965, working-age men (ages 18 to 64) on average spent 46 hours per week at
paid work; by 2011, the number had fallen to about 35 hours per week.21 Working-age women
doubled their time at paid work, from 15 hours per week in 1965 to 30 hours per week in 1998;
the amount has gone down somewhat in the recent decade, to 25 hours per week in 2011.
On the home front, men are spending more time doing housework than they did in the 1960s,
while women have cut back their hours in this area. Men’s housework time has doubled from
four hours per week in 1965 to about nine hours per week in 2011. Women, meanwhile, have
cut their housework time almost in half, from about 28 hours per week to 15 hours per week
during the same period.
20 See Pew Research Center report, “Public Says a Secure Job Is Ticket to the Middle Class,” Aug. 31,2012. 21 To be consistent with the historical trends, paid work time for men and women includes commuting time to and from work.
Men’s Work at Home and at Work, 1965-2011
Hours per week
Notes: Includes adults ages 18 to 64. Paid work time include commute time.
Source: 1965-1998 data from calculations based on Table 2 in Sayer (2005). 2003-2011 data from Pew Research analysis of the American Time Use Survey.
PEW RESEARCH CENTER
0
10
20
30
40
50
1965 1970 1975 1980 1985 1990 1995 2000 2005 2010
Child care
Housework
Paid work
2011
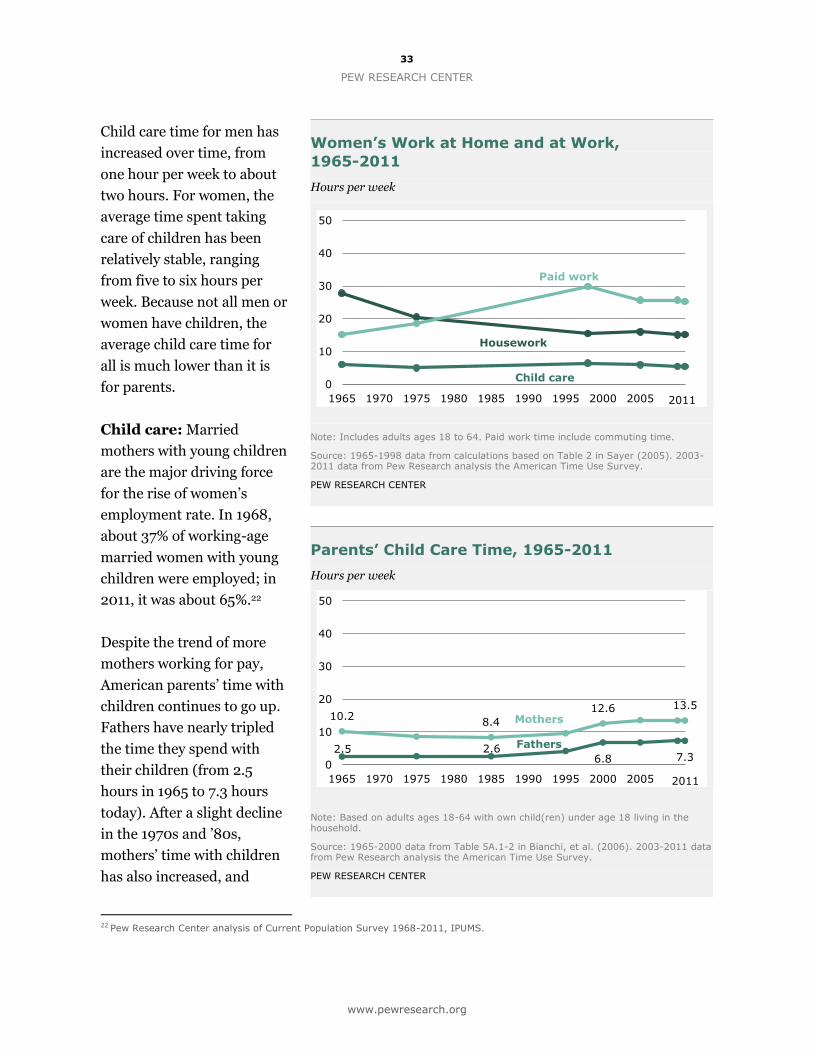
33
PEW RESEARCH CENTER
www.pewresearch.org
Child care time for men has
increased over time, from
one hour per week to about
two hours. For women, the
average time spent taking
care of children has been
relatively stable, ranging
from five to six hours per
week. Because not all men or
women have children, the
average child care time for
all is much lower than it is
for parents.
Child care: Married
mothers with young children
are the major driving force
for the rise of women’s
employment rate. In 1968,
about 37% of working-age
married women with young
children were employed; in
2011, it was about 65%.22
Despite the trend of more
mothers working for pay,
American parents’ time with
children continues to go up.
Fathers have nearly tripled
the time they spend with
their children (from 2.5
hours in 1965 to 7.3 hours
today). After a slight decline
in the 1970s and ’80s,
mothers’ time with children
has also increased, and
22 Pew Research Center analysis of Current Population Survey 1968-2011, IPUMS.
Women’s Work at Home and at Work,
1965-2011
Hours per week
Note: Includes adults ages 18 to 64. Paid work time include commuting time.
Source: 1965-1998 data from calculations based on Table 2 in Sayer (2005). 2003-2011 data from Pew Research analysis the American Time Use Survey.
PEW RESEARCH CENTER
Parents’ Child Care Time, 1965-2011
Hours per week
Note: Based on adults ages 18-64 with own child(ren) under age 18 living in the household.
Source: 1965-2000 data from Table 5A.1-2 in Bianchi, et al. (2006). 2003-2011 data from Pew Research analysis the American Time Use Survey.
PEW RESEARCH CENTER
0
10
20
30
40
50
1965 1970 1975 1980 1985 1990 1995 2000 2005 2010
Child care
Housework
Paid work
2011
10.2 8.4
12.6 13.5
2.5 2.6 6.8 7.3
0
10
20
30
40
50
1965 1970 1975 1980 1985 1990 1995 2000 2005 2010
Fathers
Mothers
2011
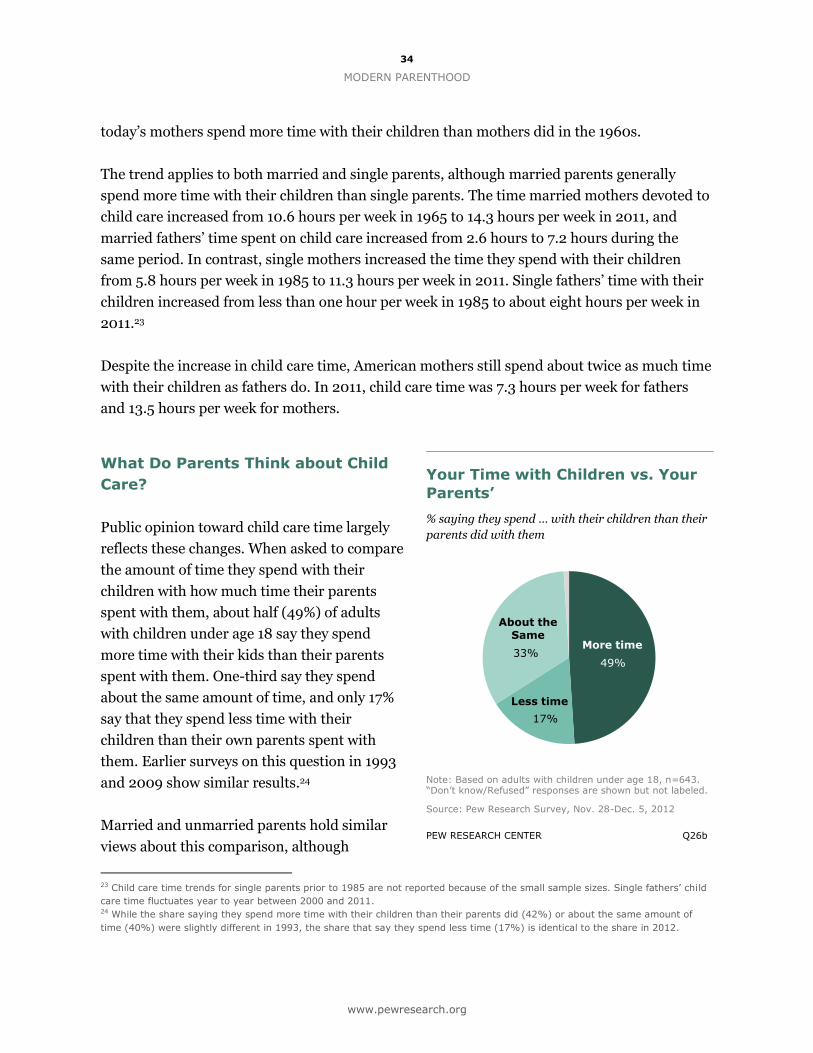
34
MODERN PARENTHOOD
www.pewresearch.org
49%
17%
33% More time
About the Same
Less time
today’s mothers spend more time with their children than mothers did in the 1960s.
The trend applies to both married and single parents, although married parents generally
spend more time with their children than single parents. The time married mothers devoted to
child care increased from 10.6 hours per week in 1965 to 14.3 hours per week in 2011, and
married fathers’ time spent on child care increased from 2.6 hours to 7.2 hours during the
same period. In contrast, single mothers increased the time they spend with their children
from 5.8 hours per week in 1985 to 11.3 hours per week in 2011. Single fathers’ time with their
children increased from less than one hour per week in 1985 to about eight hours per week in
2011.23
Despite the increase in child care time, American mothers still spend about twice as much time
with their children as fathers do. In 2011, child care time was 7.3 hours per week for fathers
and 13.5 hours per week for mothers.
What Do Parents Think about Child
Care?
Public opinion toward child care time largely
reflects these changes. When asked to compare
the amount of time they spend with their
children with how much time their parents
spent with them, about half (49%) of adults
with children under age 18 say they spend
more time with their kids than their parents
spent with them. One-third say they spend
about the same amount of time, and only 17%
say that they spend less time with their
children than their own parents spent with
them. Earlier surveys on this question in 1993
and 2009 show similar results.24
Married and unmarried parents hold similar
views about this comparison, although
23 Child care time trends for single parents prior to 1985 are not reported because of the small sample sizes. Single fathers’ child
care time fluctuates year to year between 2000 and 2011. 24 While the share saying they spend more time with their children than their parents did (42%) or about the same amount of
time (40%) were slightly different in 1993, the share that say they spend less time (17%) is identical to the share in 2012.
Your Time with Children vs. Your
Parents’
% saying they spend … with their children than their
parents did with them
Note: Based on adults with children under age 18, n=643. “Don’t know/Refused” responses are shown but not labeled.
Source: Pew Research Survey, Nov. 28-Dec. 5, 2012
PEW RESEARCH CENTER Q26b
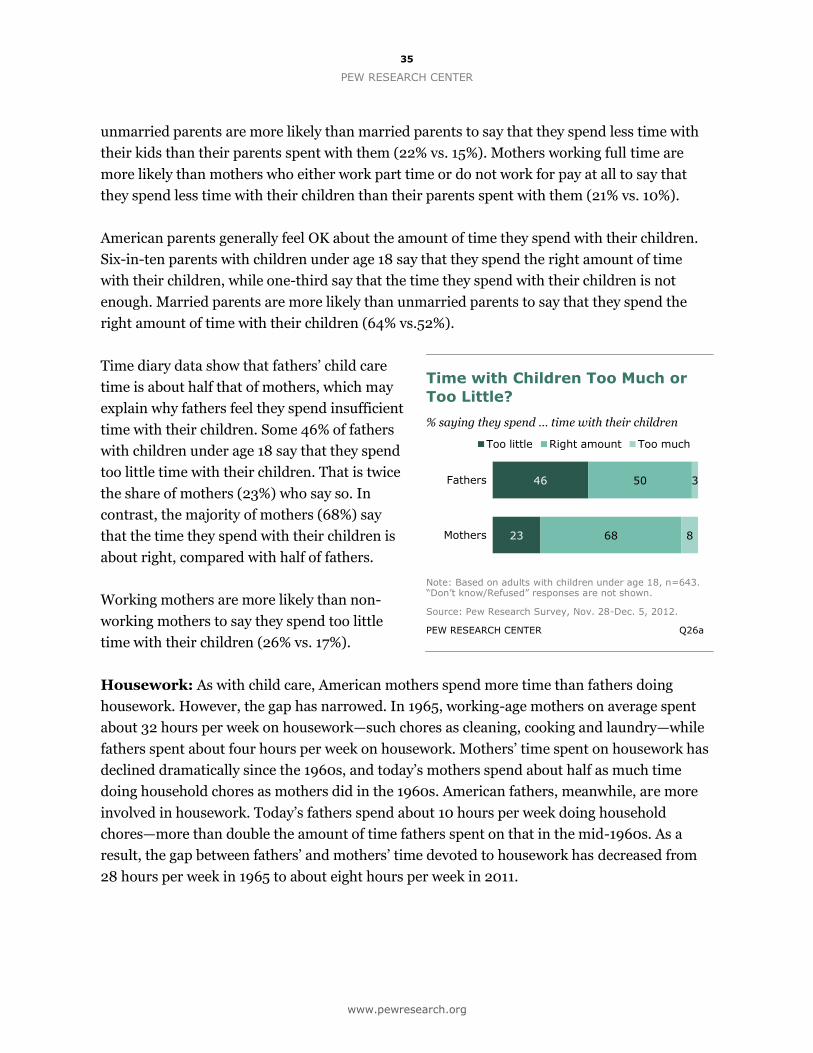
35
PEW RESEARCH CENTER
www.pewresearch.org
46
23
50
68
3
8
Fathers
Mothers
Too little Right amount Too much
unmarried parents are more likely than married parents to say that they spend less time with
their kids than their parents spent with them (22% vs. 15%). Mothers working full time are
more likely than mothers who either work part time or do not work for pay at all to say that
they spend less time with their children than their parents spent with them (21% vs. 10%).
American parents generally feel OK about the amount of time they spend with their children.
Six-in-ten parents with children under age 18 say that they spend the right amount of time
with their children, while one-third say that the time they spend with their children is not
enough. Married parents are more likely than unmarried parents to say that they spend the
right amount of time with their children (64% vs.52%).
Time diary data show that fathers’ child care
time is about half that of mothers, which may
explain why fathers feel they spend insufficient
time with their children. Some 46% of fathers
with children under age 18 say that they spend
too little time with their children. That is twice
the share of mothers (23%) who say so. In
contrast, the majority of mothers (68%) say
that the time they spend with their children is
about right, compared with half of fathers.
Working mothers are more likely than non-
working mothers to say they spend too little
time with their children (26% vs. 17%).
Housework: As with child care, American mothers spend more time than fathers doing
housework. However, the gap has narrowed. In 1965, working-age mothers on average spent
about 32 hours per week on housework—such chores as cleaning, cooking and laundry—while
fathers spent about four hours per week on housework. Mothers’ time spent on housework has
declined dramatically since the 1960s, and today’s mothers spend about half as much time
doing household chores as mothers did in the 1960s. American fathers, meanwhile, are more
involved in housework. Today’s fathers spend about 10 hours per week doing household
chores—more than double the amount of time fathers spent on that in the mid-1960s. As a
result, the gap between fathers’ and mothers’ time devoted to housework has decreased from
28 hours per week in 1965 to about eight hours per week in 2011.
Time with Children Too Much or
Too Little?
% saying they spend … time with their children
Note: Based on adults with children under age 18, n=643. “Don’t know/Refused” responses are not shown.
Source: Pew Research Survey, Nov. 28-Dec. 5, 2012.
PEW RESEARCH CENTER Q26a
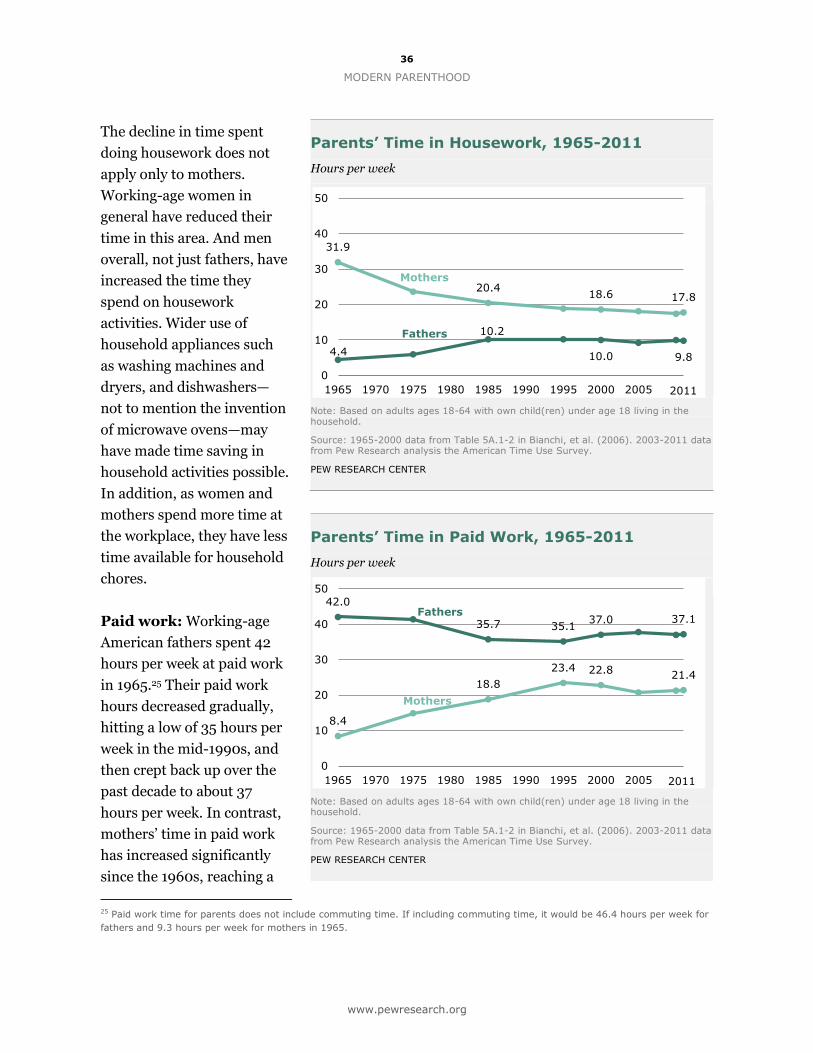
36
MODERN PARENTHOOD
www.pewresearch.org
The decline in time spent
doing housework does not
apply only to mothers.
Working-age women in
general have reduced their
time in this area. And men
overall, not just fathers, have
increased the time they
spend on housework
activities. Wider use of
household appliances such
as washing machines and
dryers, and dishwashers—
not to mention the invention
of microwave ovens—may
have made time saving in
household activities possible.
In addition, as women and
mothers spend more time at
the workplace, they have less
time available for household
chores.
Paid work: Working-age
American fathers spent 42
hours per week at paid work
in 1965.25 Their paid work
hours decreased gradually,
hitting a low of 35 hours per
week in the mid-1990s, and
then crept back up over the
past decade to about 37
hours per week. In contrast,
mothers’ time in paid work
has increased significantly
since the 1960s, reaching a
25 Paid work time for parents does not include commuting time. If including commuting time, it would be 46.4 hours per week for
fathers and 9.3 hours per week for mothers in 1965.
Parents’ Time in Housework, 1965-2011
Hours per week
Note: Based on adults ages 18-64 with own child(ren) under age 18 living in the household.
Source: 1965-2000 data from Table 5A.1-2 in Bianchi, et al. (2006). 2003-2011 data from Pew Research analysis the American Time Use Survey.
PEW RESEARCH CENTER
Parents’ Time in Paid Work, 1965-2011
Hours per week
Note: Based on adults ages 18-64 with own child(ren) under age 18 living in the household.
Source: 1965-2000 data from Table 5A.1-2 in Bianchi, et al. (2006). 2003-2011 data from Pew Research analysis the American Time Use Survey.
PEW RESEARCH CENTER
31.9
20.4 18.6 17.8
4.4
10.2
10.0 9.8
0
10
20
30
40
50
1965 1970 1975 1980 1985 1990 1995 2000 2005 2010
Fathers
Mothers
2011
8.4
18.8
23.4 22.8 21.4
42.0
35.7 35.1 37.0 37.1
0
10
20
30
40
50
1965 1970 1975 1980 1985 1990 1995 2000 2005 2010
Fathers
Mothers
2011
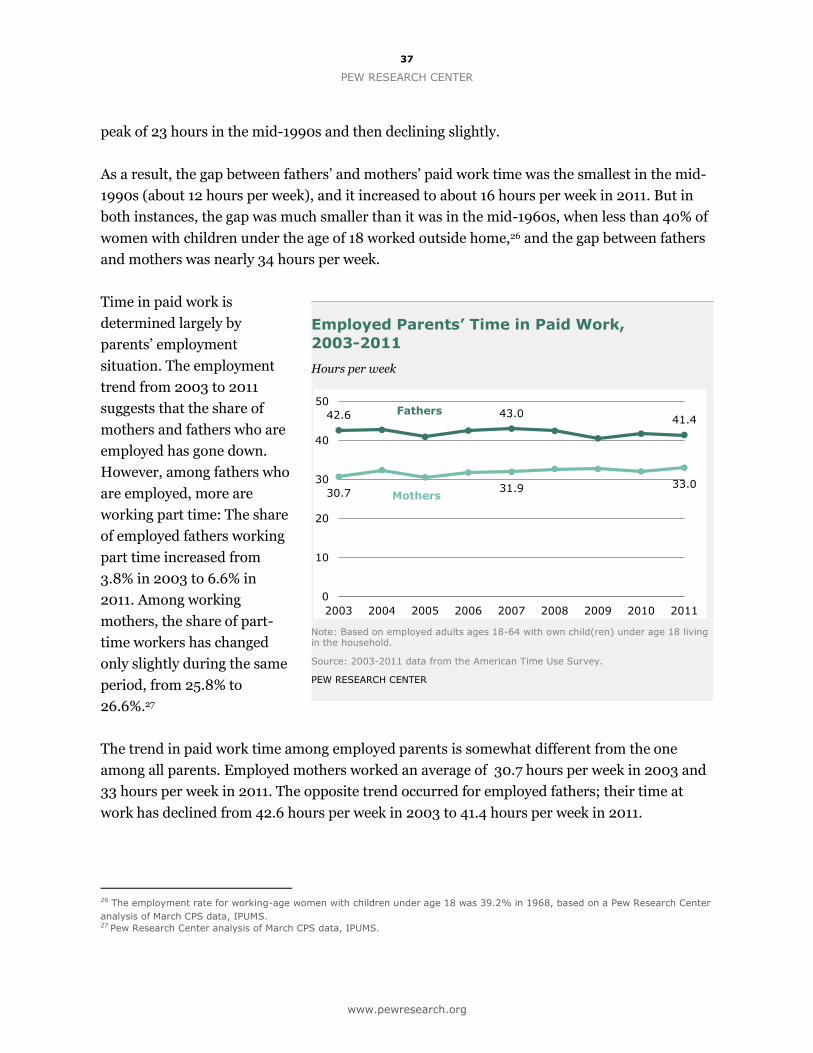
37
PEW RESEARCH CENTER
www.pewresearch.org
peak of 23 hours in the mid-1990s and then declining slightly.
As a result, the gap between fathers’ and mothers’ paid work time was the smallest in the mid-
1990s (about 12 hours per week), and it increased to about 16 hours per week in 2011. But in
both instances, the gap was much smaller than it was in the mid-1960s, when less than 40% of
women with children under the age of 18 worked outside home,26 and the gap between fathers
and mothers was nearly 34 hours per week.
Time in paid work is
determined largely by
parents’ employment
situation. The employment
trend from 2003 to 2011
suggests that the share of
mothers and fathers who are
employed has gone down.
However, among fathers who
are employed, more are
working part time: The share
of employed fathers working
part time increased from
3.8% in 2003 to 6.6% in
2011. Among working
mothers, the share of part-
time workers has changed
only slightly during the same
period, from 25.8% to
26.6%.27
The trend in paid work time among employed parents is somewhat different from the one
among all parents. Employed mothers worked an average of 30.7 hours per week in 2003 and
33 hours per week in 2011. The opposite trend occurred for employed fathers; their time at
work has declined from 42.6 hours per week in 2003 to 41.4 hours per week in 2011.
26 The employment rate for working-age women with children under age 18 was 39.2% in 1968, based on a Pew Research Center
analysis of March CPS data, IPUMS. 27 Pew Research Center analysis of March CPS data, IPUMS.
Employed Parents’ Time in Paid Work,
2003-2011
Hours per week
Note: Based on employed adults ages 18-64 with own child(ren) under age 18 living in the household.
Source: 2003-2011 data from the American Time Use Survey.
PEW RESEARCH CENTER
30.7 31.9 33.0
42.6 43.0 41.4
0
10
20
30
40
50
2003 2004 2005 2006 2007 2008 2009 2010 2011
Fathers
Mothers
38
MODERN PARENTHOOD
www.pewresearch.org
Commuting time is another factor that is related to the work time, even though it is unpaid.
Between 2003 and 2011, commuting time for employed adults ages 18 to 64 went up from 2.8
hours per week to 3.2 hours. On average, men spend about one hour more per week
commuting than women do. Parents’ commuting hours are similar to adults overall, and
fathers spend more time commuting than do mothers.
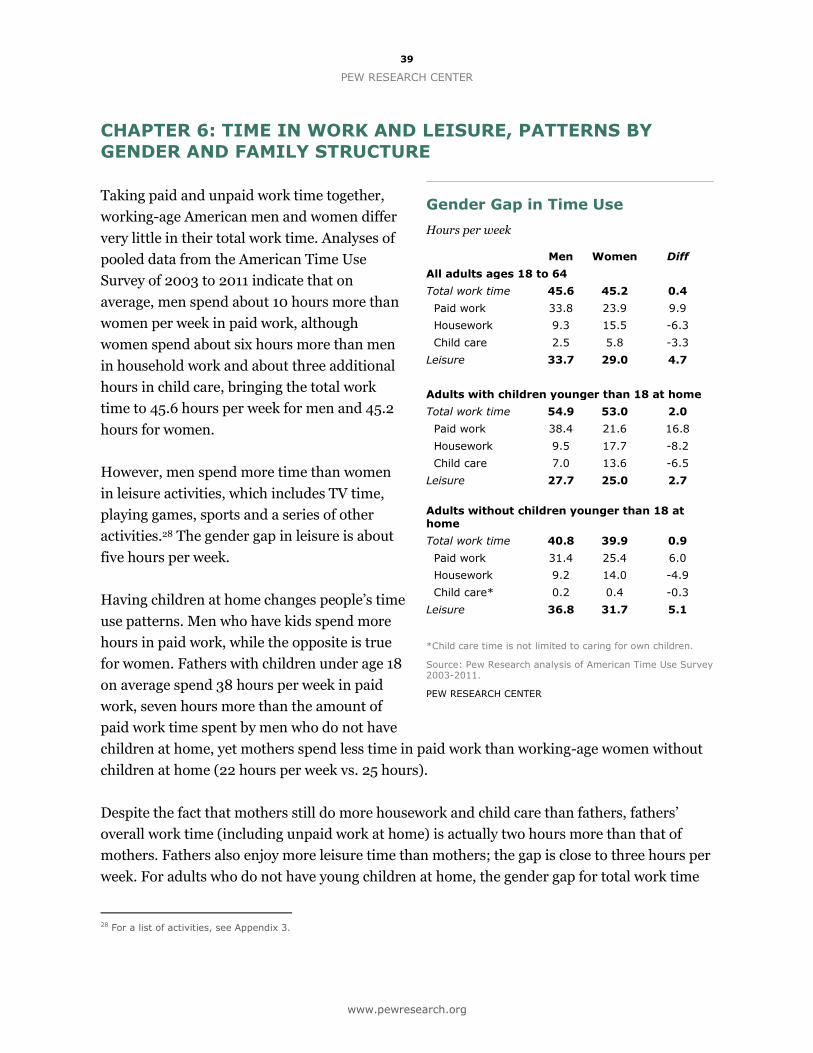
39
PEW RESEARCH CENTER
www.pewresearch.org
CHAPTER 6: TIME IN WORK AND LEISURE, PATTERNS BY
GENDER AND FAMILY STRUCTURE
Taking paid and unpaid work time together,
working-age American men and women differ
very little in their total work time. Analyses of
pooled data from the American Time Use
Survey of 2003 to 2011 indicate that on
average, men spend about 10 hours more than
women per week in paid work, although
women spend about six hours more than men
in household work and about three additional
hours in child care, bringing the total work
time to 45.6 hours per week for men and 45.2
hours for women.
However, men spend more time than women
in leisure activities, which includes TV time,
playing games, sports and a series of other
activities.28 The gender gap in leisure is about
five hours per week.
Having children at home changes people’s time
use patterns. Men who have kids spend more
hours in paid work, while the opposite is true
for women. Fathers with children under age 18
on average spend 38 hours per week in paid
work, seven hours more than the amount of
paid work time spent by men who do not have
children at home, yet mothers spend less time in paid work than working-age women without
children at home (22 hours per week vs. 25 hours).
Despite the fact that mothers still do more housework and child care than fathers, fathers’
overall work time (including unpaid work at home) is actually two hours more than that of
mothers. Fathers also enjoy more leisure time than mothers; the gap is close to three hours per
week. For adults who do not have young children at home, the gender gap for total work time
28 For a list of activities, see Appendix 3.
Gender Gap in Time Use
Hours per week
Men Women Diff
All adults ages 18 to 64
Total work time 45.6 45.2 0.4
Paid work 33.8 23.9 9.9
Housework 9.3 15.5 -6.3
Child care 2.5 5.8 -3.3
Leisure 33.7 29.0 4.7
Adults with children younger than 18 at home
Total work time 54.9 53.0 2.0
Paid work 38.4 21.6 16.8
Housework 9.5 17.7 -8.2
Child care 7.0 13.6 -6.5
Leisure 27.7 25.0 2.7
Adults without children younger than 18 at home
Total work time 40.8 39.9 0.9
Paid work 31.4 25.4 6.0
Housework 9.2 14.0 -4.9
Child care* 0.2 0.4 -0.3
Leisure 36.8 31.7 5.1
*Child care time is not limited to caring for own children.
Source: Pew Research analysis of American Time Use Survey 2003-2011.
PEW RESEARCH CENTER
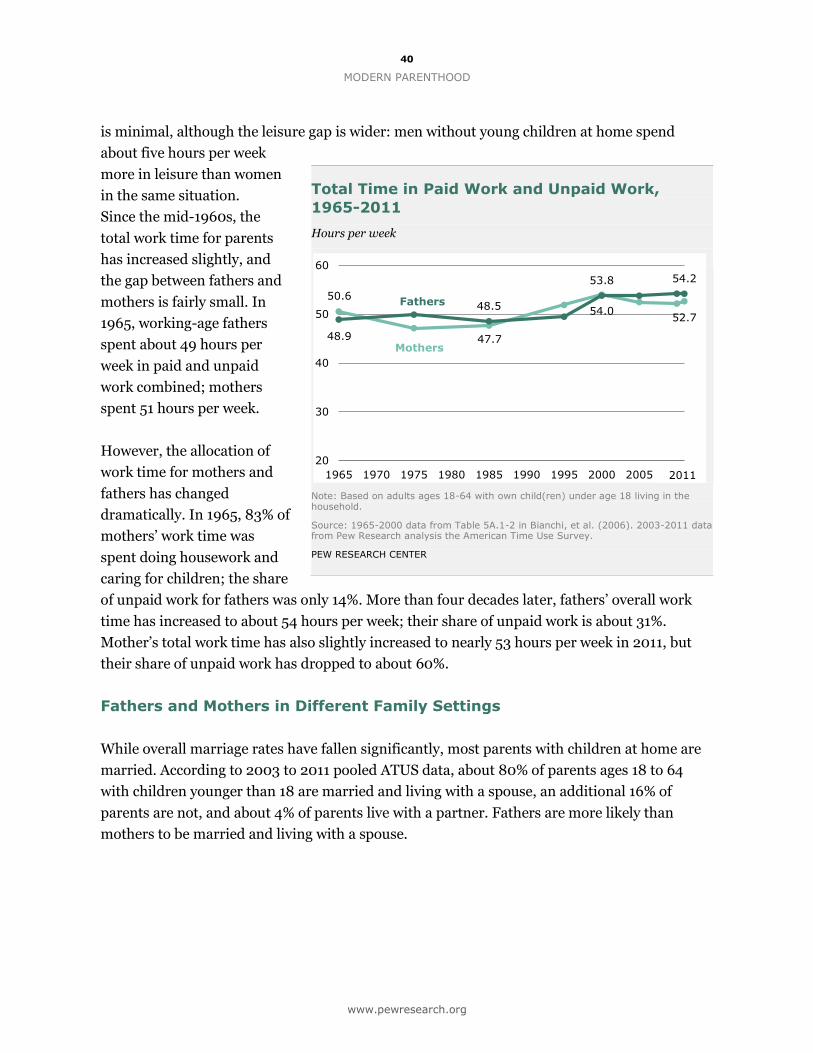
40
MODERN PARENTHOOD
www.pewresearch.org
is minimal, although the leisure gap is wider: men without young children at home spend
about five hours per week
more in leisure than women
in the same situation.
Since the mid-1960s, the
total work time for parents
has increased slightly, and
the gap between fathers and
mothers is fairly small. In
1965, working-age fathers
spent about 49 hours per
week in paid and unpaid
work combined; mothers
spent 51 hours per week.
However, the allocation of
work time for mothers and
fathers has changed
dramatically. In 1965, 83% of
mothers’ work time was
spent doing housework and
caring for children; the share
of unpaid work for fathers was only 14%. More than four decades later, fathers’ overall work
time has increased to about 54 hours per week; their share of unpaid work is about 31%.
Mother’s total work time has also slightly increased to nearly 53 hours per week in 2011, but
their share of unpaid work has dropped to about 60%.
Fathers and Mothers in Different Family Settings
While overall marriage rates have fallen significantly, most parents with children at home are
married. According to 2003 to 2011 pooled ATUS data, about 80% of parents ages 18 to 64
with children younger than 18 are married and living with a spouse, an additional 16% of
parents are not, and about 4% of parents live with a partner. Fathers are more likely than
mothers to be married and living with a spouse.
Total Time in Paid Work and Unpaid Work,
1965-2011
Hours per week
Note: Based on adults ages 18-64 with own child(ren) under age 18 living in the household.
Source: 1965-2000 data from Table 5A.1-2 in Bianchi, et al. (2006). 2003-2011 data from Pew Research analysis the American Time Use Survey.
PEW RESEARCH CENTER
50.6
47.7
54.0 52.7
48.9
48.5
53.8 54.2
20
30
40
50
60
1965 1970 1975 1980 1985 1990 1995 2000 2005 2010
Fathers
Mothers
2011
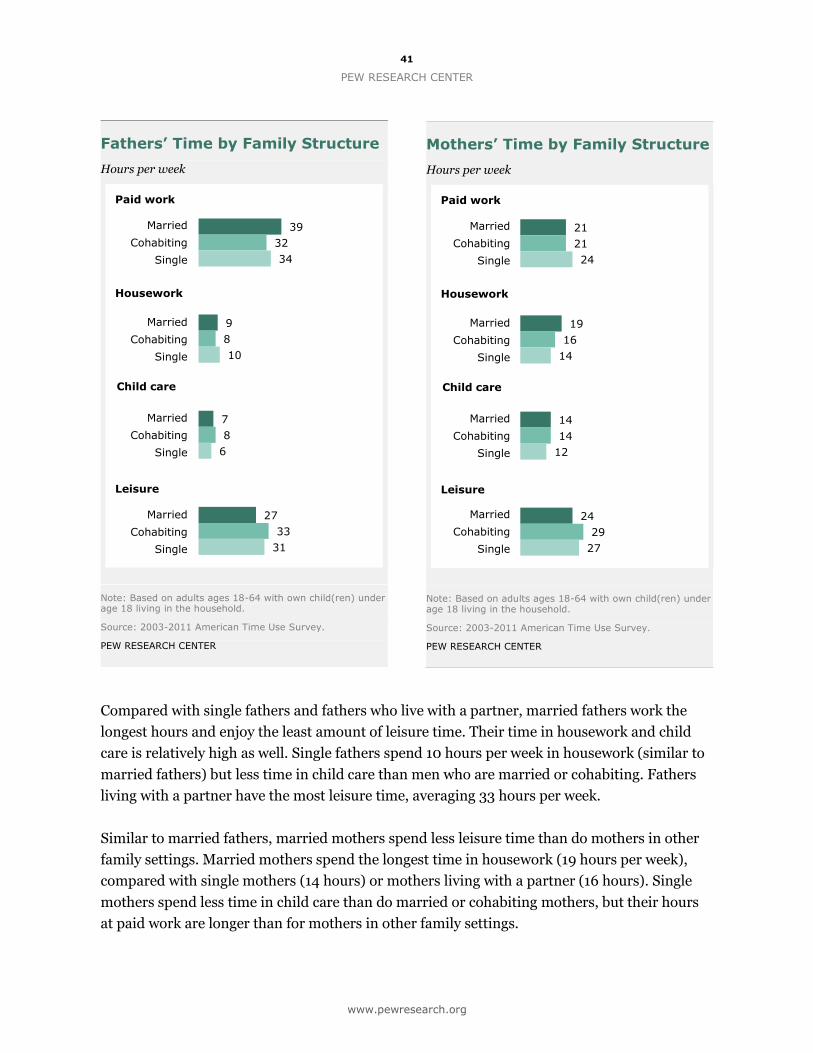
41
PEW RESEARCH CENTER
www.pewresearch.org
Compared with single fathers and fathers who live with a partner, married fathers work the
longest hours and enjoy the least amount of leisure time. Their time in housework and child
care is relatively high as well. Single fathers spend 10 hours per week in housework (similar to
married fathers) but less time in child care than men who are married or cohabiting. Fathers
living with a partner have the most leisure time, averaging 33 hours per week.
Similar to married fathers, married mothers spend less leisure time than do mothers in other
family settings. Married mothers spend the longest time in housework (19 hours per week),
compared with single mothers (14 hours) or mothers living with a partner (16 hours). Single
mothers spend less time in child care than do married or cohabiting mothers, but their hours
at paid work are longer than for mothers in other family settings.
Fathers’ Time by Family Structure
Hours per week
Note: Based on adults ages 18-64 with own child(ren) under age 18 living in the household.
Source: 2003-2011 American Time Use Survey.
PEW RESEARCH CENTER
Mothers’ Time by Family Structure
Hours per week
Note: Based on adults ages 18-64 with own child(ren) under age 18 living in the household.
Source: 2003-2011 American Time Use Survey.
PEW RESEARCH CENTER
39
9
7
27
32
8
8
33
34
10
6
31
Paid work
Housework
Child care
Leisure
Married
Cohabiting
Single
Married
Cohabiting
Single
Married
Cohabiting
Single
Married
Cohabiting
Single
21
19
14
24
21
16
14
29
24
14
12
27
Paid work
Housework
Child care
Leisure
Married
Cohabiting
Single
Married
Cohabiting
Single
Married
Cohabiting
Single
Married
Cohabiting
Single
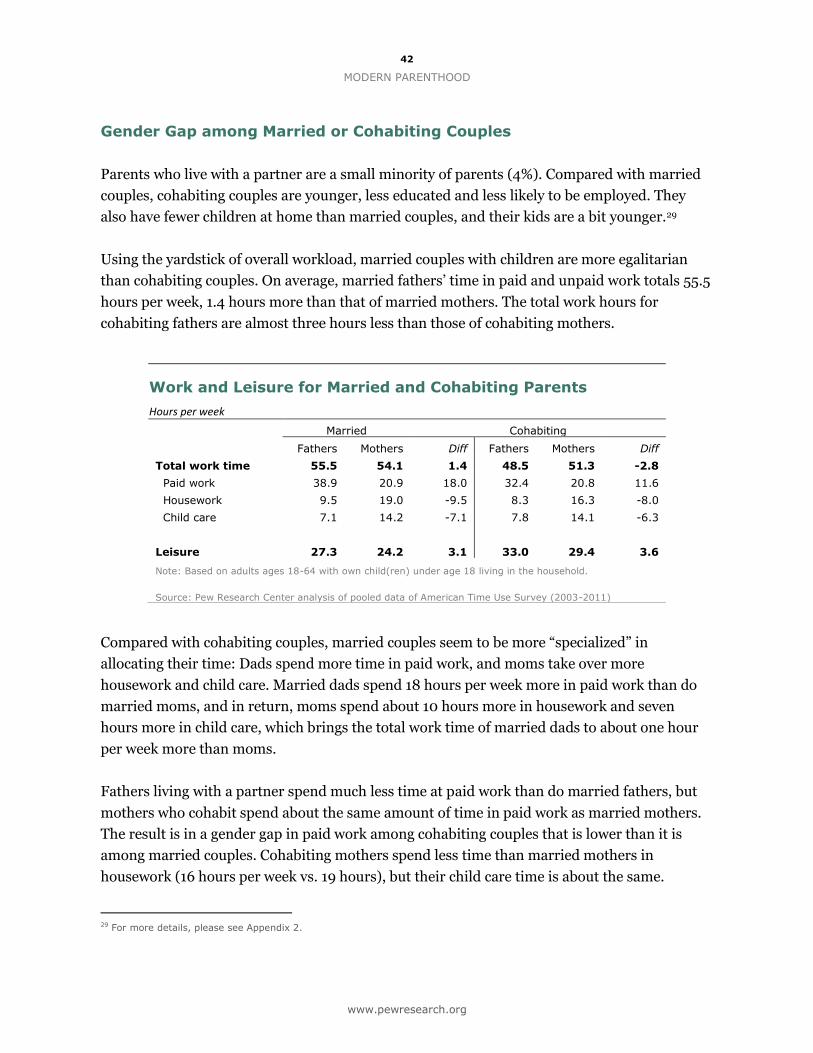
42
MODERN PARENTHOOD
www.pewresearch.org
Gender Gap among Married or Cohabiting Couples
Parents who live with a partner are a small minority of parents (4%). Compared with married
couples, cohabiting couples are younger, less educated and less likely to be employed. They
also have fewer children at home than married couples, and their kids are a bit younger.29
Using the yardstick of overall workload, married couples with children are more egalitarian
than cohabiting couples. On average, married fathers’ time in paid and unpaid work totals 55.5
hours per week, 1.4 hours more than that of married mothers. The total work hours for
cohabiting fathers are almost three hours less than those of cohabiting mothers.
Compared with cohabiting couples, married couples seem to be more “specialized” in
allocating their time: Dads spend more time in paid work, and moms take over more
housework and child care. Married dads spend 18 hours per week more in paid work than do
married moms, and in return, moms spend about 10 hours more in housework and seven
hours more in child care, which brings the total work time of married dads to about one hour
per week more than moms.
Fathers living with a partner spend much less time at paid work than do married fathers, but
mothers who cohabit spend about the same amount of time in paid work as married mothers.
The result is in a gender gap in paid work among cohabiting couples that is lower than it is
among married couples. Cohabiting mothers spend less time than married mothers in
housework (16 hours per week vs. 19 hours), but their child care time is about the same.
29 For more details, please see Appendix 2.
Work and Leisure for Married and Cohabiting Parents
Hours per week
Married Cohabiting
Fathers Mothers Diff Fathers Mothers Diff
Total work time 55.5 54.1 1.4 48.5 51.3 -2.8
Paid work 38.9 20.9 18.0 32.4 20.8 11.6
Housework 9.5 19.0 -9.5 8.3 16.3 -8.0
Child care 7.1 14.2 -7.1 7.8 14.1 -6.3
Leisure 27.3 24.2 3.1 33.0 29.4 3.6
Note: Based on adults ages 18-64 with own child(ren) under age 18 living in the household.
Source: Pew Research Center analysis of pooled data of American Time Use Survey (2003-2011)
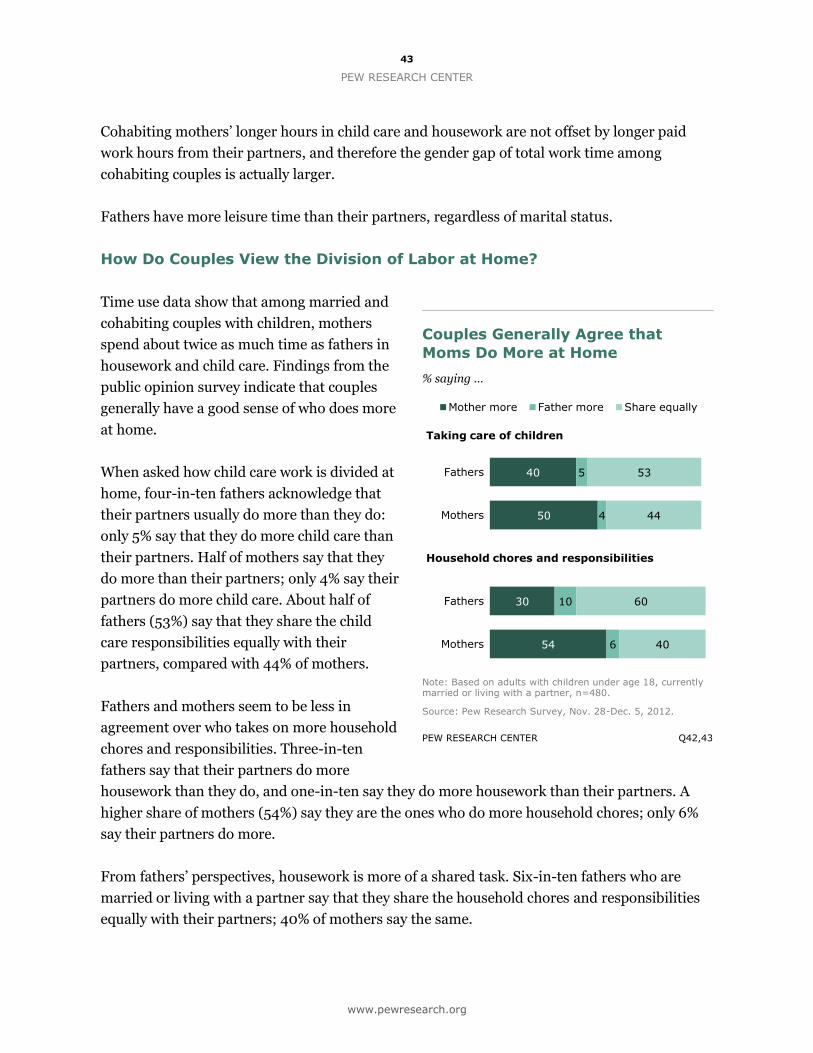
43
PEW RESEARCH CENTER
www.pewresearch.org
40
50
30
54
5
4
10
6
53
44
60
40
Fathers
Mothers
Fathers
Mothers
Mother more Father more Share equally
Taking care of children
Household chores and responsibilities
Cohabiting mothers’ longer hours in child care and housework are not offset by longer paid
work hours from their partners, and therefore the gender gap of total work time among
cohabiting couples is actually larger.
Fathers have more leisure time than their partners, regardless of marital status.
How Do Couples View the Division of Labor at Home?
Time use data show that among married and
cohabiting couples with children, mothers
spend about twice as much time as fathers in
housework and child care. Findings from the
public opinion survey indicate that couples
generally have a good sense of who does more
at home.
When asked how child care work is divided at
home, four-in-ten fathers acknowledge that
their partners usually do more than they do:
only 5% say that they do more child care than
their partners. Half of mothers say that they
do more than their partners; only 4% say their
partners do more child care. About half of
fathers (53%) say that they share the child
care responsibilities equally with their
partners, compared with 44% of mothers.
Fathers and mothers seem to be less in
agreement over who takes on more household
chores and responsibilities. Three-in-ten
fathers say that their partners do more
housework than they do, and one-in-ten say they do more housework than their partners. A
higher share of mothers (54%) say they are the ones who do more household chores; only 6%
say their partners do more.
From fathers’ perspectives, housework is more of a shared task. Six-in-ten fathers who are
married or living with a partner say that they share the household chores and responsibilities
equally with their partners; 40% of mothers say the same.
Couples Generally Agree that
Moms Do More at Home
% saying …
Note: Based on adults with children under age 18, currently married or living with a partner, n=480.
Source: Pew Research Survey, Nov. 28-Dec. 5, 2012.
PEW RESEARCH CENTER Q42,43
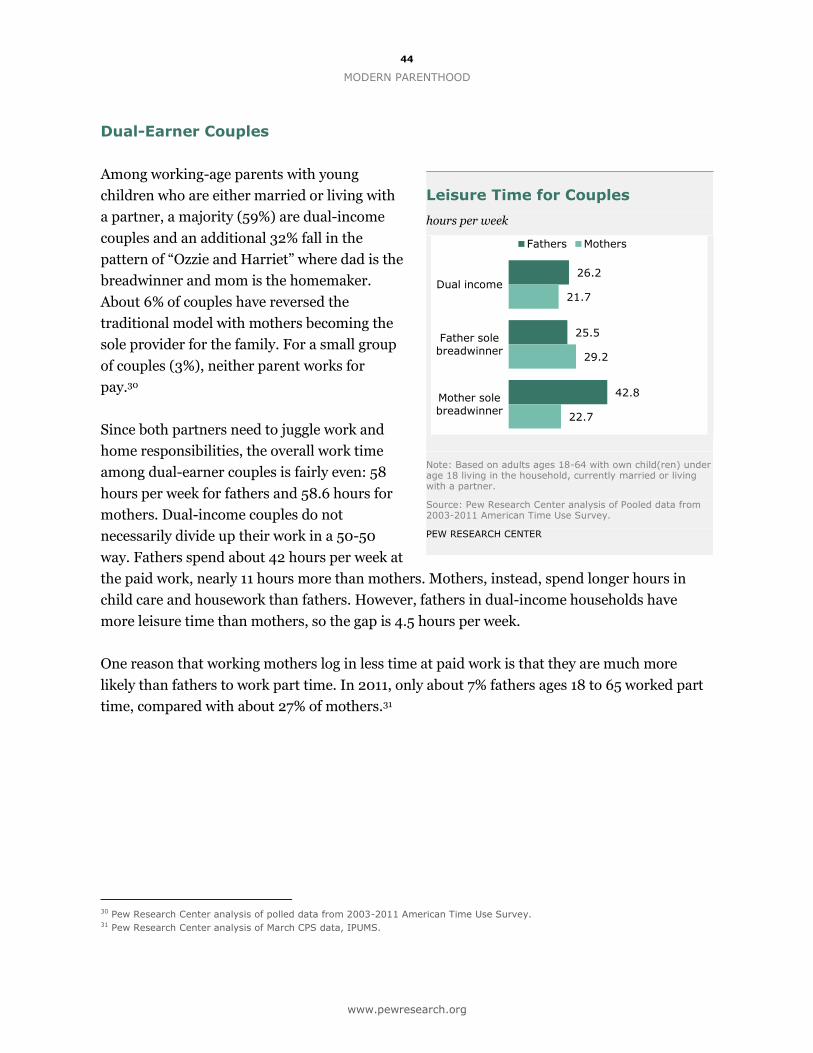
44
MODERN PARENTHOOD
www.pewresearch.org
Dual-Earner Couples
Among working-age parents with young
children who are either married or living with
a partner, a majority (59%) are dual-income
couples and an additional 32% fall in the
pattern of “Ozzie and Harriet” where dad is the
breadwinner and mom is the homemaker.
About 6% of couples have reversed the
traditional model with mothers becoming the
sole provider for the family. For a small group
of couples (3%), neither parent works for
pay.30
Since both partners need to juggle work and
home responsibilities, the overall work time
among dual-earner couples is fairly even: 58
hours per week for fathers and 58.6 hours for
mothers. Dual-income couples do not
necessarily divide up their work in a 50-50
way. Fathers spend about 42 hours per week at
the paid work, nearly 11 hours more than mothers. Mothers, instead, spend longer hours in
child care and housework than fathers. However, fathers in dual-income households have
more leisure time than mothers, so the gap is 4.5 hours per week.
One reason that working mothers log in less time at paid work is that they are much more
likely than fathers to work part time. In 2011, only about 7% fathers ages 18 to 65 worked part
time, compared with about 27% of mothers.31
30 Pew Research Center analysis of polled data from 2003-2011 American Time Use Survey. 31 Pew Research Center analysis of March CPS data, IPUMS.
Leisure Time for Couples
hours per week
Note: Based on adults ages 18-64 with own child(ren) under age 18 living in the household, currently married or living with a partner.
Source: Pew Research Center analysis of Pooled data from 2003-2011 American Time Use Survey.
PEW RESEARCH CENTER
26.2
25.5
42.8
21.7
29.2
22.7
Dual income
Father sole breadwinner
Mother sole breadwinner
Fathers Mothers
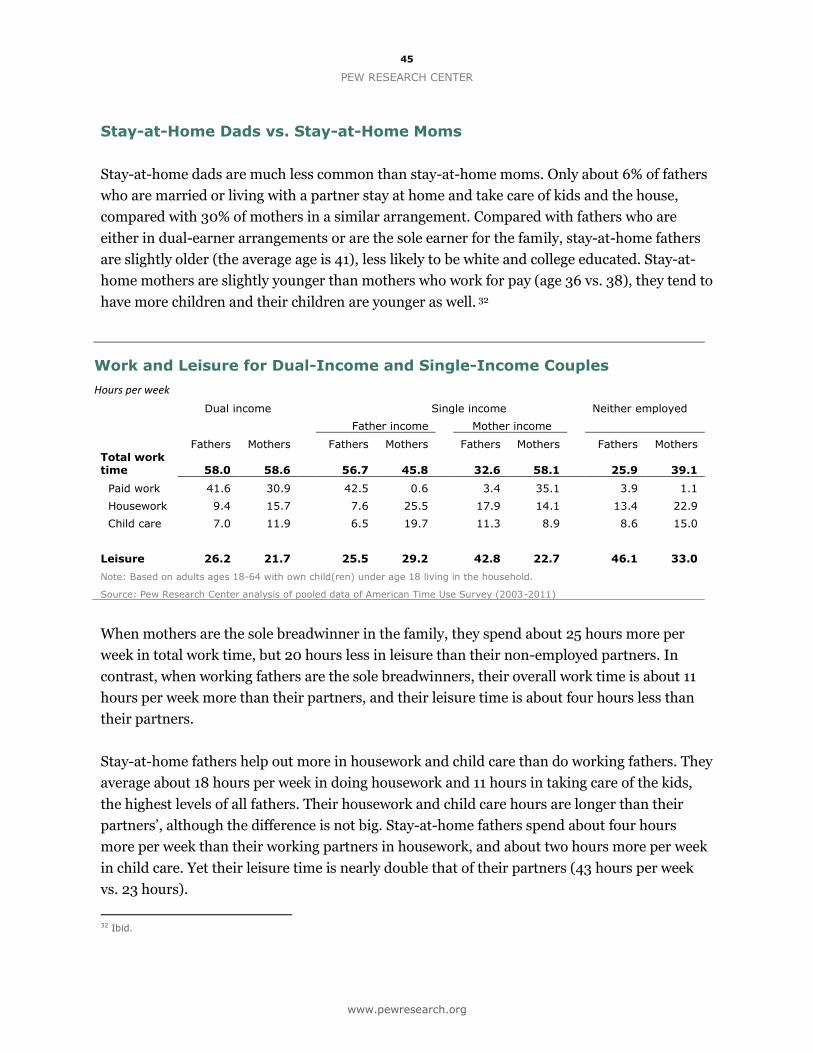
45
PEW RESEARCH CENTER
www.pewresearch.org
Stay-at-Home Dads vs. Stay-at-Home Moms
Stay-at-home dads are much less common than stay-at-home moms. Only about 6% of fathers
who are married or living with a partner stay at home and take care of kids and the house,
compared with 30% of mothers in a similar arrangement. Compared with fathers who are
either in dual-earner arrangements or are the sole earner for the family, stay-at-home fathers
are slightly older (the average age is 41), less likely to be white and college educated. Stay-at-
home mothers are slightly younger than mothers who work for pay (age 36 vs. 38), they tend to
have more children and their children are younger as well. 32
When mothers are the sole breadwinner in the family, they spend about 25 hours more per
week in total work time, but 20 hours less in leisure than their non-employed partners. In
contrast, when working fathers are the sole breadwinners, their overall work time is about 11
hours per week more than their partners, and their leisure time is about four hours less than
their partners.
Stay-at-home fathers help out more in housework and child care than do working fathers. They
average about 18 hours per week in doing housework and 11 hours in taking care of the kids,
the highest levels of all fathers. Their housework and child care hours are longer than their
partners’, although the difference is not big. Stay-at-home fathers spend about four hours
more per week than their working partners in housework, and about two hours more per week
in child care. Yet their leisure time is nearly double that of their partners (43 hours per week
vs. 23 hours).
32 Ibid.
Work and Leisure for Dual-Income and Single-Income Couples
Hours per week
Dual income Single income Neither employed
Father income Mother income
Fathers Mothers Fathers Mothers Fathers Mothers Fathers Mothers Total work time 58.0 58.6 56.7 45.8 32.6 58.1 25.9 39.1
Paid work 41.6 30.9 42.5 0.6 3.4 35.1 3.9 1.1
Housework 9.4 15.7 7.6 25.5 17.9 14.1 13.4 22.9
Child care 7.0 11.9 6.5 19.7 11.3 8.9 8.6 15.0
Leisure 26.2 21.7 25.5 29.2 42.8 22.7 46.1 33.0
Note: Based on adults ages 18-64 with own child(ren) under age 18 living in the household.
Source: Pew Research Center analysis of pooled data of American Time Use Survey (2003-2011)
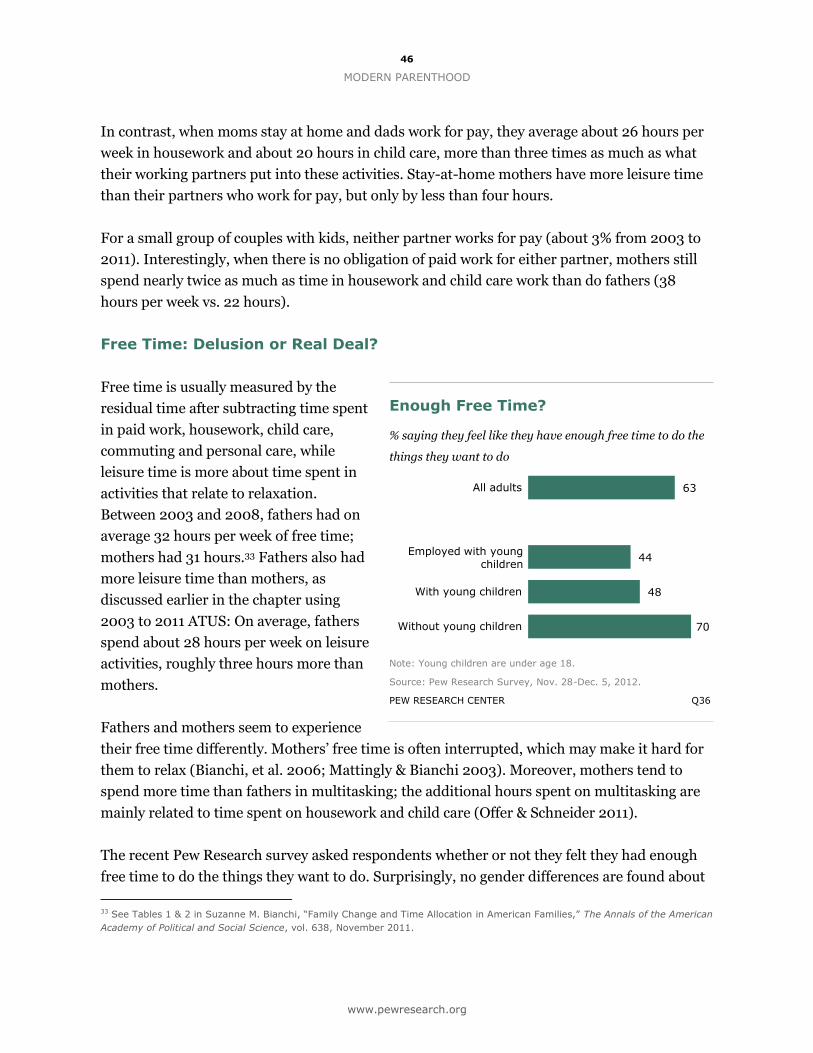
46
MODERN PARENTHOOD
www.pewresearch.org
63
44
48
70
All adults
With young children
Without young children
Employed with young children
In contrast, when moms stay at home and dads work for pay, they average about 26 hours per
week in housework and about 20 hours in child care, more than three times as much as what
their working partners put into these activities. Stay-at-home mothers have more leisure time
than their partners who work for pay, but only by less than four hours.
For a small group of couples with kids, neither partner works for pay (about 3% from 2003 to
2011). Interestingly, when there is no obligation of paid work for either partner, mothers still
spend nearly twice as much as time in housework and child care work than do fathers (38
hours per week vs. 22 hours).
Free Time: Delusion or Real Deal?
Free time is usually measured by the
residual time after subtracting time spent
in paid work, housework, child care,
commuting and personal care, while
leisure time is more about time spent in
activities that relate to relaxation.
Between 2003 and 2008, fathers had on
average 32 hours per week of free time;
mothers had 31 hours.33 Fathers also had
more leisure time than mothers, as
discussed earlier in the chapter using
2003 to 2011 ATUS: On average, fathers
spend about 28 hours per week on leisure
activities, roughly three hours more than
mothers.
Fathers and mothers seem to experience
their free time differently. Mothers’ free time is often interrupted, which may make it hard for
them to relax (Bianchi, et al. 2006; Mattingly & Bianchi 2003). Moreover, mothers tend to
spend more time than fathers in multitasking; the additional hours spent on multitasking are
mainly related to time spent on housework and child care (Offer & Schneider 2011).
The recent Pew Research survey asked respondents whether or not they felt they had enough
free time to do the things they want to do. Surprisingly, no gender differences are found about
33 See Tables 1 & 2 in Suzanne M. Bianchi, “Family Change and Time Allocation in American Families,” The Annals of the American
Academy of Political and Social Science, vol. 638, November 2011.
Enough Free Time?
% saying they feel like they have enough free time to do the
things they want to do
Note: Young children are under age 18.
Source: Pew Research Survey, Nov. 28-Dec. 5, 2012.
PEW RESEARCH CENTER Q36
47
PEW RESEARCH CENTER
www.pewresearch.org
how men and women evaluate their free time, nor did fathers and mothers differ in their views.
More than six-in-ten adults say that generally they feel like they have enough free time to do
the things they want to do.
Adults ages 65 or older are more likely than adults at younger ages to say that they have
enough free time, and the adults in their 30s and 40s are the least likely to say so. About eight-
in-ten adults ages 65 and older (83%) say that they have enough free time to do the things they
want to do, compared with 63% of adults ages 18 to 29, 64% of those ages 50 to 64 and 52% of
those ages 30 to 49.
Having young children is associated with how people feel about their free time. Seven-in-ten
adults who do not have children under age 18 say that they have enough free time, compared
with 48% of adults with young children. Some 72% of adults with grown children over ages 18
feel that they have enough free time to do the things they want to do.
Unmarried parents are more likely than married parents to say that they do not have enough
time to do the things they want to do. And working parents with young children feel a lack of
free time: More than half (55%) say they do not have enough free time, and 44% say that they
do. Employed fathers and mothers view their free time similarly.
48
MODERN PARENTHOOD
www.pewresearch.org
References
Bianchi, Suzanne M., John P. Robinson, and Melissa A. Milkie. 2006. Changing Rhythms of
American Family Life. New York: Russell Sage Foundation.
Abraham, Katharine G., Sarah M. Flood, Matthew Sobek, and Betsy Thorn. 2011. American
Time Use Survey Data Extract System: Version 2.4 [Machine-readable database]. Maryland
Population Research Center, University of Maryland, College Park, and Minnesota Population
Center, University of Minnesota, Minneapolis.
Mattingly, M.J., and Suzanne M. Bianchi. 2003. “Gender Difference in the Quantity and
Quality of Free Time: The U.S. Experience,” Social Forces, March 2003, vol. 81, no. 3, pp. 999-
1030.
Offer, Shira, and Barbara Schneider. 2011 “Revisiting the Gender Gap in Time-Use Patterns:
Multitasking and Well-Being among Mothers and Fathers in Dual-Earner Families,” American
Sociological Review, vol. 76, no. 6, pp. 809-833.
Sayer, Liana C. 2005. “Gender, Time and Inequality: Trends in Women’s and Men’s Paid
Work, Unpaid Work and Free Time,” Social Forces, vol. 84, no. 1, pp. 285-303.
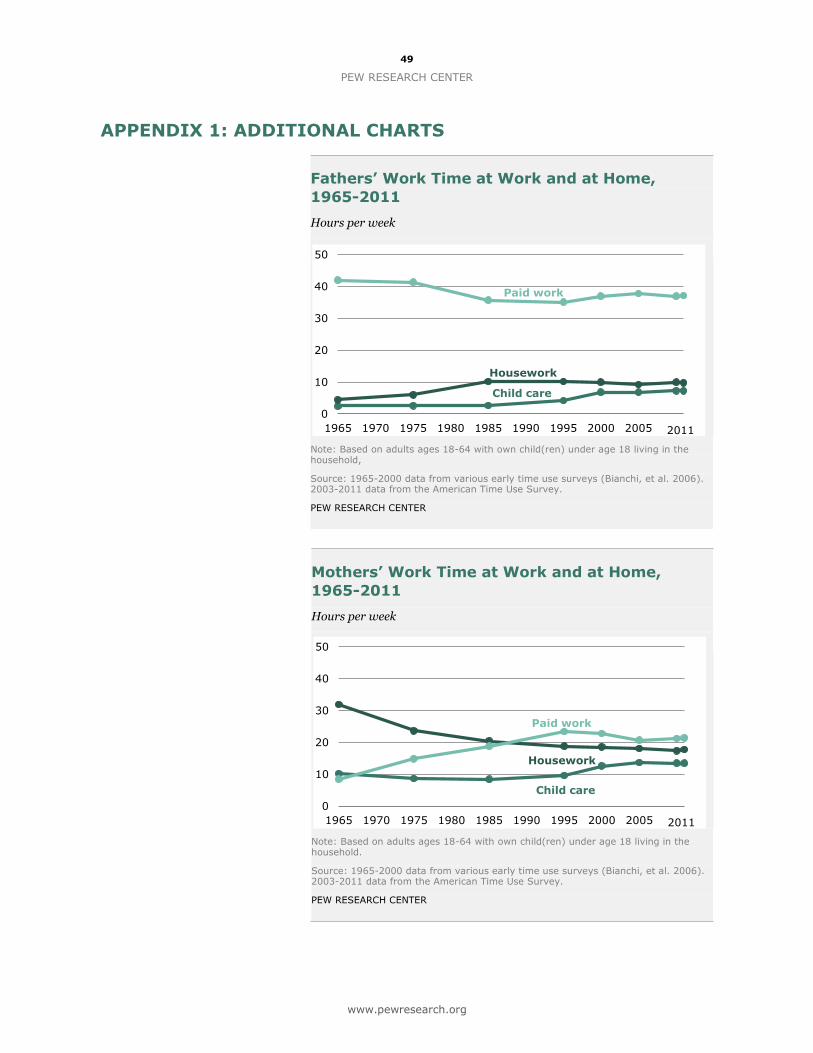
49
PEW RESEARCH CENTER
www.pewresearch.org
APPENDIX 1: ADDITIONAL CHARTS
Fathers’ Work Time at Work and at Home,
1965-2011
Hours per week
Note: Based on adults ages 18-64 with own child(ren) under age 18 living in the household,
Source: 1965-2000 data from various early time use surveys (Bianchi, et al. 2006). 2003-2011 data from the American Time Use Survey.
PEW RESEARCH CENTER
Mothers’ Work Time at Work and at Home,
1965-2011
Hours per week
Note: Based on adults ages 18-64 with own child(ren) under age 18 living in the household.
Source: 1965-2000 data from various early time use surveys (Bianchi, et al. 2006). 2003-2011 data from the American Time Use Survey.
PEW RESEARCH CENTER
0
10
20
30
40
50
1965 1970 1975 1980 1985 1990 1995 2000 2005 2010
Child care
Housework
Paid work
2011
0
10
20
30
40
50
1965 1970 1975 1980 1985 1990 1995 2000 2005 2010
Child care
Housework
Paid work
2011
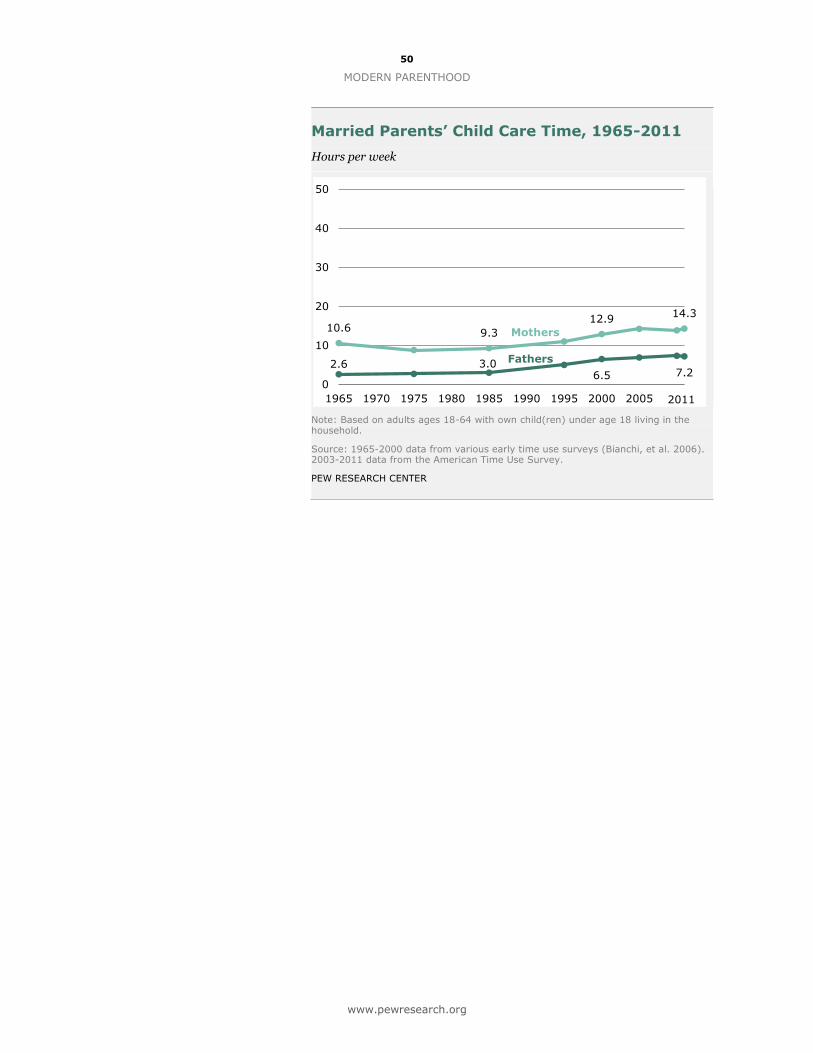
50
MODERN PARENTHOOD
www.pewresearch.org
Married Parents’ Child Care Time, 1965-2011
Hours per week
Note: Based on adults ages 18-64 with own child(ren) under age 18 living in the household.
Source: 1965-2000 data from various early time use surveys (Bianchi, et al. 2006). 2003-2011 data from the American Time Use Survey.
PEW RESEARCH CENTER
10.6 9.3
12.9 14.3
2.6 3.0 6.5 7.2
0
10
20
30
40
50
1965 1970 1975 1980 1985 1990 1995 2000 2005 2010
Fathers
Mothers
2011
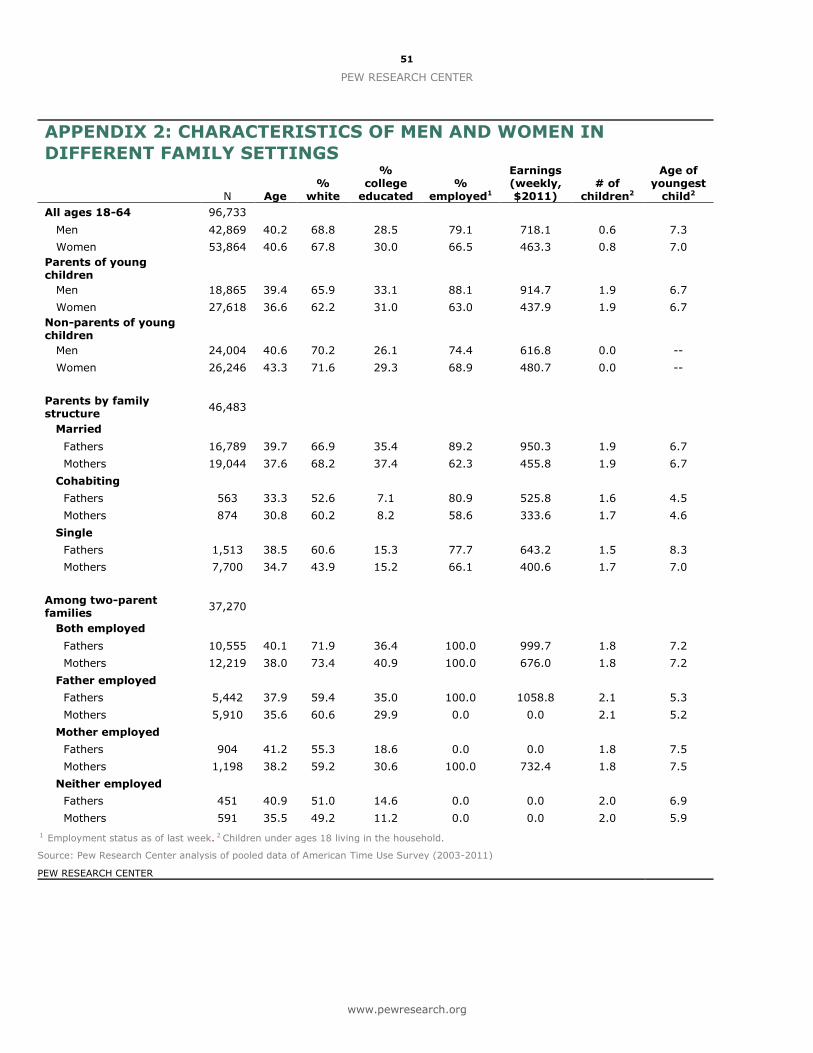
51
PEW RESEARCH CENTER
www.pewresearch.org
APPENDIX 2: CHARACTERISTICS OF MEN AND WOMEN IN
DIFFERENT FAMILY SETTINGS
N Age %
white
% college
educated %
employed1
Earnings (weekly, $2011)
# of children2
Age of youngest
child2
All ages 18-64 96,733 Men 42,869 40.2 68.8 28.5 79.1 718.1 0.6 7.3
Women 53,864 40.6 67.8 30.0 66.5 463.3 0.8 7.0
Parents of young children
Men 18,865 39.4 65.9 33.1 88.1 914.7 1.9 6.7
Women 27,618 36.6 62.2 31.0 63.0 437.9 1.9 6.7
Non-parents of young children
Men 24,004 40.6 70.2 26.1 74.4 616.8 0.0 --
Women 26,246 43.3 71.6 29.3 68.9 480.7 0.0 --
Parents by family structure
46,483
Married Fathers 16,789 39.7 66.9 35.4 89.2 950.3 1.9 6.7
Mothers 19,044 37.6 68.2 37.4 62.3 455.8 1.9 6.7
Cohabiting
Fathers 563 33.3 52.6 7.1 80.9 525.8 1.6 4.5
Mothers 874 30.8 60.2 8.2 58.6 333.6 1.7 4.6
Single
Fathers 1,513 38.5 60.6 15.3 77.7 643.2 1.5 8.3
Mothers 7,700 34.7 43.9 15.2 66.1 400.6 1.7 7.0
Among two-parent families
37,270
Both employed Fathers 10,555 40.1 71.9 36.4 100.0 999.7 1.8 7.2
Mothers 12,219 38.0 73.4 40.9 100.0 676.0 1.8 7.2
Father employed
Fathers 5,442 37.9 59.4 35.0 100.0 1058.8 2.1 5.3
Mothers 5,910 35.6 60.6 29.9 0.0 0.0 2.1 5.2
Mother employed
Fathers 904 41.2 55.3 18.6 0.0 0.0 1.8 7.5
Mothers 1,198 38.2 59.2 30.6 100.0 732.4 1.8 7.5
Neither employed
Fathers 451 40.9 51.0 14.6 0.0 0.0 2.0 6.9
Mothers 591 35.5 49.2 11.2 0.0 0.0 2.0 5.9
1 Employment status as of last week. 2 Children under ages 18 living in the household. Source: Pew Research Center analysis of pooled data of American Time Use Survey (2003-2011)
PEW RESEARCH CENTER
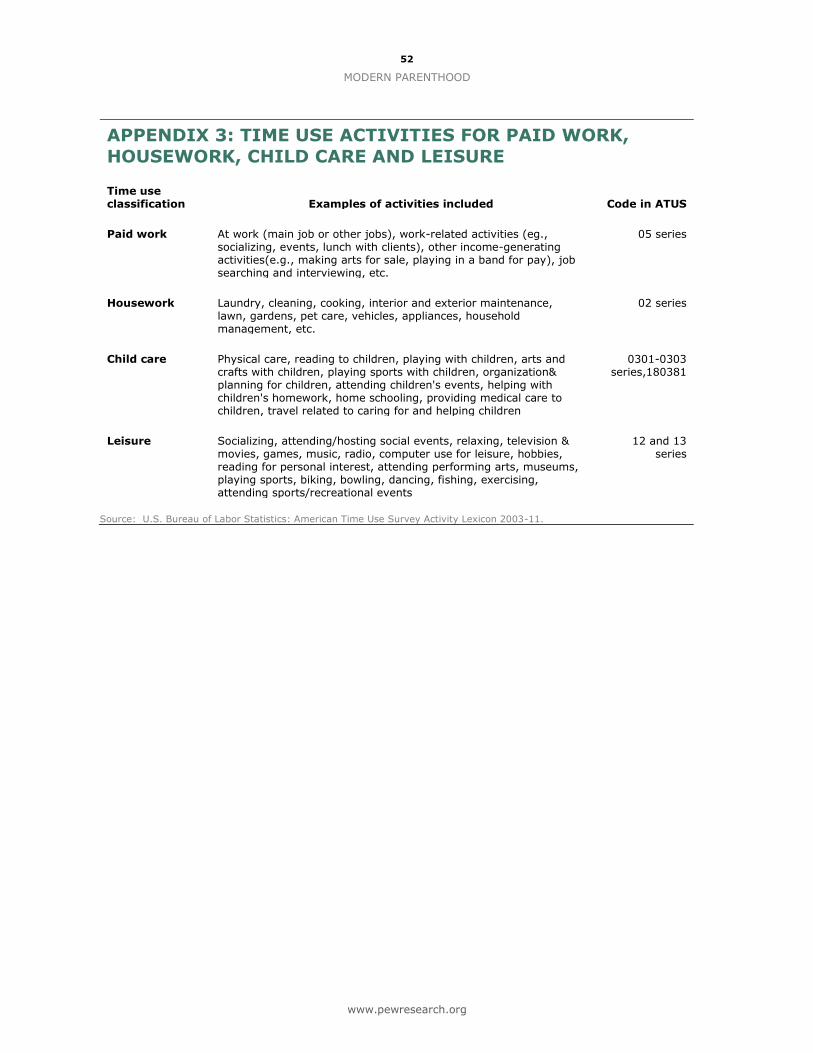
52
MODERN PARENTHOOD
www.pewresearch.org
APPENDIX 3: TIME USE ACTIVITIES FOR PAID WORK,
HOUSEWORK, CHILD CARE AND LEISURE
Time use classification Examples of activities included Code in ATUS
Paid work At work (main job or other jobs), work-related activities (eg., socializing, events, lunch with clients), other income-generating activities(e.g., making arts for sale, playing in a band for pay), job searching and interviewing, etc.
05 series
Housework Laundry, cleaning, cooking, interior and exterior maintenance, lawn, gardens, pet care, vehicles, appliances, household management, etc.
02 series
Child care Physical care, reading to children, playing with children, arts and crafts with children, playing sports with children, organization& planning for children, attending children's events, helping with children's homework, home schooling, providing medical care to children, travel related to caring for and helping children
0301-0303 series,180381
Leisure Socializing, attending/hosting social events, relaxing, television & movies, games, music, radio, computer use for leisure, hobbies, reading for personal interest, attending performing arts, museums, playing sports, biking, bowling, dancing, fishing, exercising, attending sports/recreational events
12 and 13 series
Source: U.S. Bureau of Labor Statistics: American Time Use Survey Activity Lexicon 2003-11.
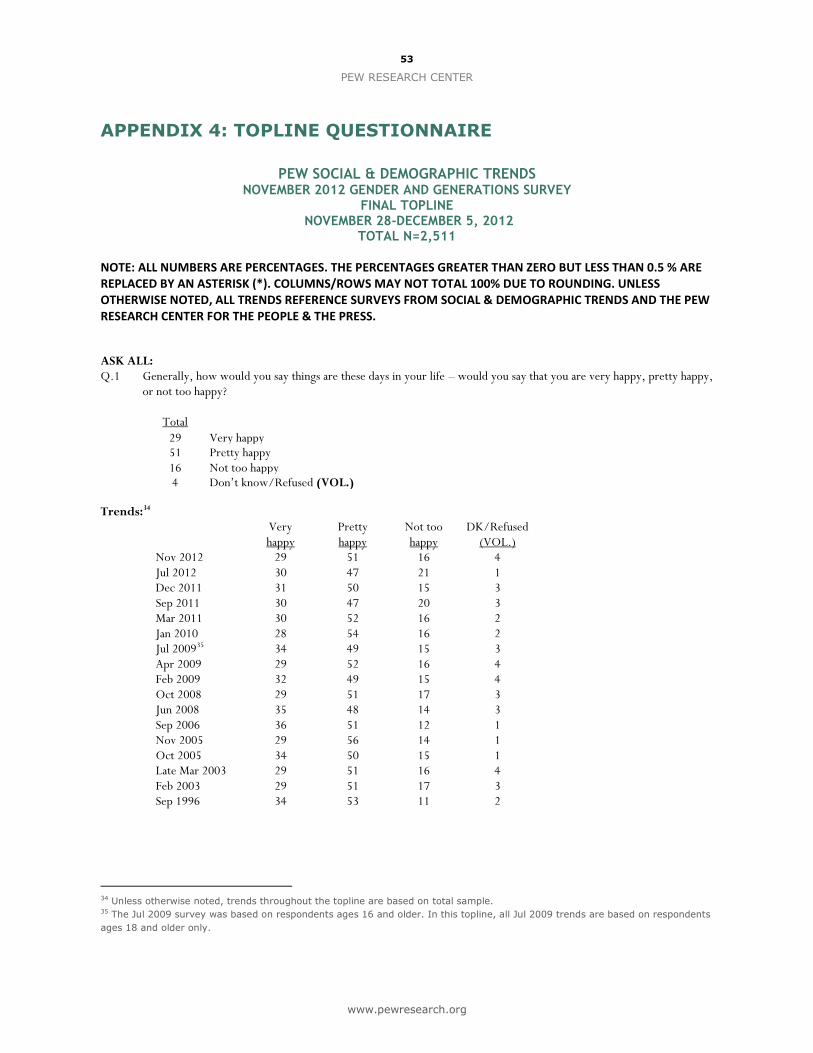
53
PEW RESEARCH CENTER
www.pewresearch.org
APPENDIX 4: TOPLINE QUESTIONNAIRE
PEW SOCIAL & DEMOGRAPHIC TRENDS
NOVEMBER 2012 GENDER AND GENERATIONS SURVEY FINAL TOPLINE
NOVEMBER 28-DECEMBER 5, 2012 TOTAL N=2,511
NOTE: ALL NUMBERS ARE PERCENTAGES. THE PERCENTAGES GREATER THAN ZERO BUT LESS THAN 0.5 % ARE REPLACED BY AN ASTERISK (*). COLUMNS/ROWS MAY NOT TOTAL 100% DUE TO ROUNDING. UNLESS OTHERWISE NOTED, ALL TRENDS REFERENCE SURVEYS FROM SOCIAL & DEMOGRAPHIC TRENDS AND THE PEW RESEARCH CENTER FOR THE PEOPLE & THE PRESS. ASK ALL: Q.1 Generally, how would you say things are these days in your life – would you say that you are very happy, pretty happy,
or not too happy?
Total
29 Very happy 51 Pretty happy 16 Not too happy 4 Don’t know/Refused (VOL.)
Trends:34
Very happy
Pretty happy
Not too happy
DK/Refused (VOL.)
Nov 2012 29 51 16 4 Jul 2012 30 47 21 1 Dec 2011 31 50 15 3 Sep 2011 30 47 20 3 Mar 2011 30 52 16 2 Jan 2010 28 54 16 2 Jul 200935 34 49 15 3 Apr 2009 29 52 16 4 Feb 2009 32 49 15 4 Oct 2008 29 51 17 3 Jun 2008 35 48 14 3 Sep 2006 36 51 12 1 Nov 2005 29 56 14 1 Oct 2005 34 50 15 1 Late Mar 2003 29 51 16 4 Feb 2003 29 51 17 3 Sep 1996 34 53 11 2
34 Unless otherwise noted, trends throughout the topline are based on total sample. 35 The Jul 2009 survey was based on respondents ages 16 and older. In this topline, all Jul 2009 trends are based on respondents
ages 18 and older only.
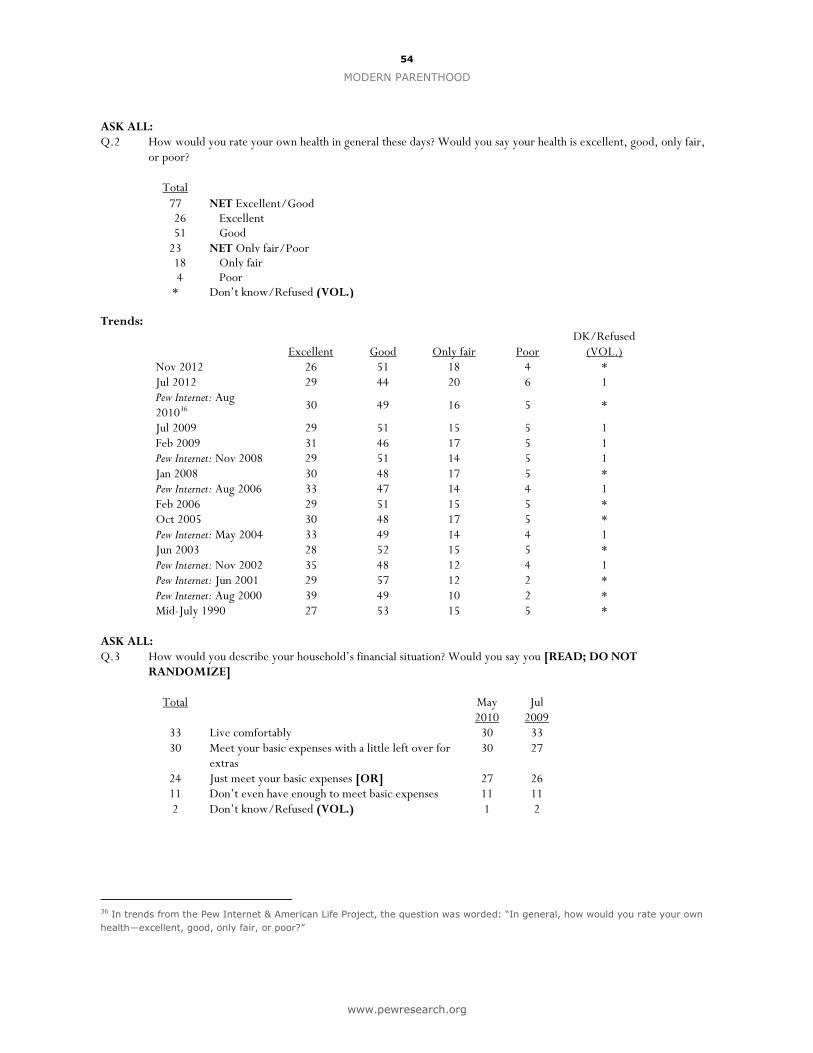
54
MODERN PARENTHOOD
www.pewresearch.org
ASK ALL: Q.2 How would you rate your own health in general these days? Would you say your health is excellent, good, only fair,
or poor?
Total
77 NET Excellent/Good 26 Excellent 51 Good
23 NET Only fair/Poor 18 Only fair 4 Poor
* Don’t know/Refused (VOL.) Trends:
Excellent Good Only fair
Poor DK/Refused
(VOL.) Nov 2012 26 51 18 4 * Jul 2012 29 44 20 6 1 Pew Internet: Aug 201036
30 49 16 5 *
Jul 2009 29 51 15 5 1 Feb 2009 31 46 17 5 1 Pew Internet: Nov 2008 29 51 14 5 1 Jan 2008 30 48 17 5 * Pew Internet: Aug 2006 33 47 14 4 1 Feb 2006 29 51 15 5 * Oct 2005 30 48 17 5 * Pew Internet: May 2004 33 49 14 4 1 Jun 2003 28 52 15 5 * Pew Internet: Nov 2002 35 48 12 4 1 Pew Internet: Jun 2001 29 57 12 2 * Pew Internet: Aug 2000 39 49 10 2 * Mid-July 1990 27 53 15 5 *
ASK ALL: Q.3 How would you describe your household’s financial situation? Would you say you [READ; DO NOT
RANDOMIZE]
Total May 2010
Jul 2009
33 Live comfortably 30 33 30 Meet your basic expenses with a little left over for
extras 30 27
24 Just meet your basic expenses [OR] 27 26 11 Don’t even have enough to meet basic expenses 11 11 2 Don’t know/Refused (VOL.) 1 2
36 In trends from the Pew Internet & American Life Project, the question was worded: “In general, how would you rate your own
health—excellent, good, only fair, or poor?”
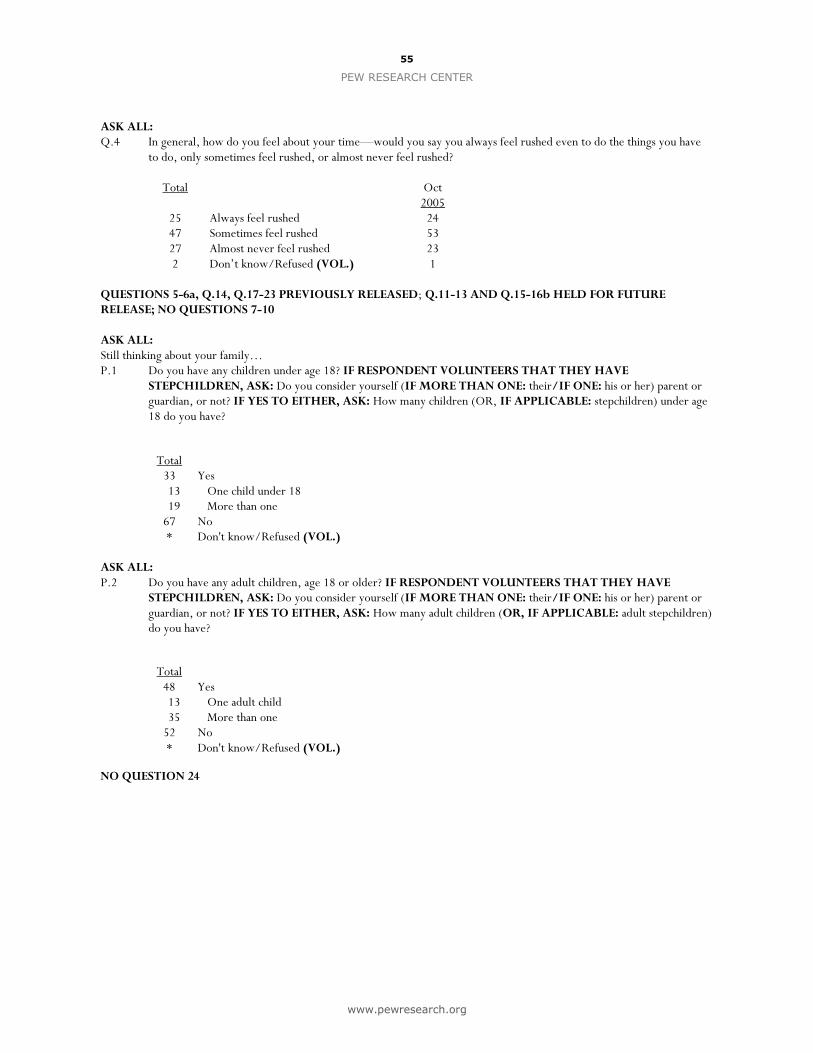
55
PEW RESEARCH CENTER
www.pewresearch.org
ASK ALL: Q.4 In general, how do you feel about your time—would you say you always feel rushed even to do the things you have
to do, only sometimes feel rushed, or almost never feel rushed?
Total Oct 2005
25 Always feel rushed 24 47 Sometimes feel rushed 53 27 Almost never feel rushed 23 2 Don’t know/Refused (VOL.) 1
QUESTIONS 5-6a, Q.14, Q.17-23 PREVIOUSLY RELEASED; Q.11-13 AND Q.15-16b HELD FOR FUTURE RELEASE; NO QUESTIONS 7-10 ASK ALL: Still thinking about your family… P.1 Do you have any children under age 18? IF RESPONDENT VOLUNTEERS THAT THEY HAVE
STEPCHILDREN, ASK: Do you consider yourself (IF MORE THAN ONE: their/IF ONE: his or her) parent or guardian, or not? IF YES TO EITHER, ASK: How many children (OR, IF APPLICABLE: stepchildren) under age 18 do you have?
Total
33 Yes 13 One child under 18 19 More than one
67 No * Don't know/Refused (VOL.)
ASK ALL: P.2 Do you have any adult children, age 18 or older? IF RESPONDENT VOLUNTEERS THAT THEY HAVE
STEPCHILDREN, ASK: Do you consider yourself (IF MORE THAN ONE: their/IF ONE: his or her) parent or guardian, or not? IF YES TO EITHER, ASK: How many adult children (OR, IF APPLICABLE: adult stepchildren) do you have?
Total
48 Yes 13 One adult child 35 More than one
52 No * Don't know/Refused (VOL.)
NO QUESTION 24
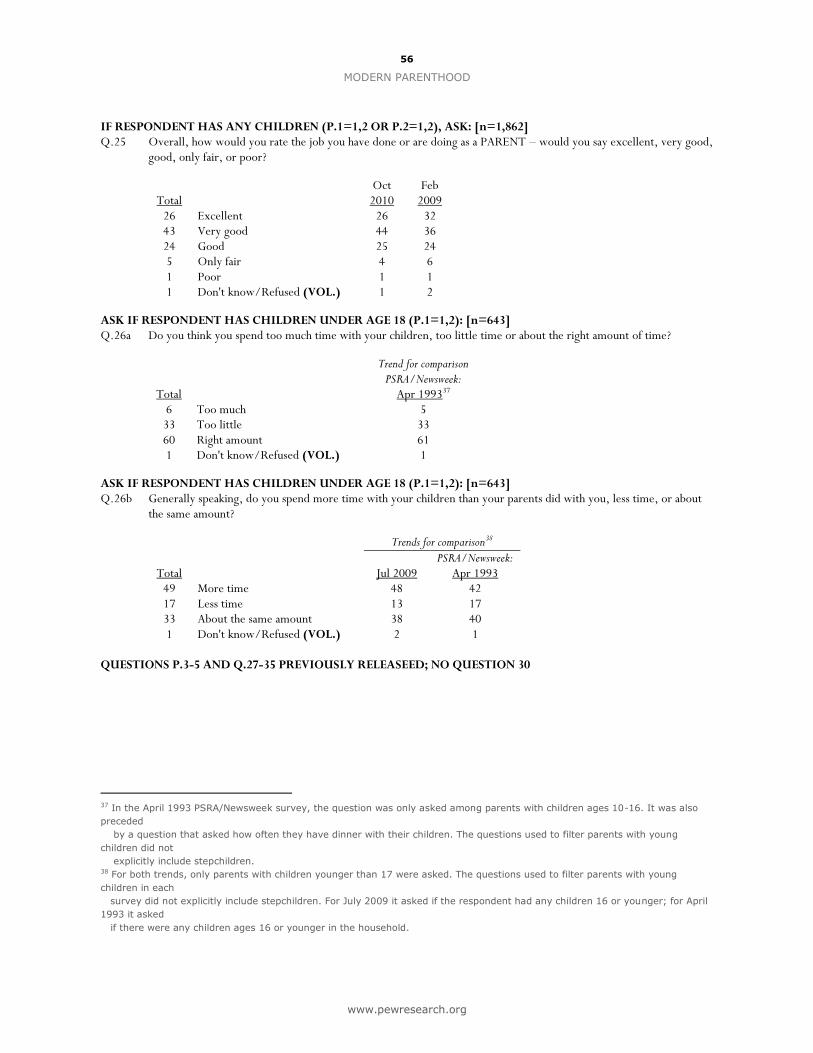
56
MODERN PARENTHOOD
www.pewresearch.org
IF RESPONDENT HAS ANY CHILDREN (P.1=1,2 OR P.2=1,2), ASK: [n=1,862] Q.25 Overall, how would you rate the job you have done or are doing as a PARENT – would you say excellent, very good,
good, only fair, or poor?
Total
Oct 2010
Feb 2009
26 Excellent 26 32 43 Very good 44 36 24 Good 25 24 5 Only fair 4 6 1 Poor 1 1 1 Don't know/Refused (VOL.) 1 2
ASK IF RESPONDENT HAS CHILDREN UNDER AGE 18 (P.1=1,2): [n=643] Q.26a Do you think you spend too much time with your children, too little time or about the right amount of time?
Trend for comparison
Total PSRA/Newsweek:
Apr 199337 6 Too much 5
33 Too little 33 60 Right amount 61 1 Don't know/Refused (VOL.) 1
ASK IF RESPONDENT HAS CHILDREN UNDER AGE 18 (P.1=1,2): [n=643] Q.26b Generally speaking, do you spend more time with your children than your parents did with you, less time, or about
the same amount?
Trends for comparison38
Total
Jul 2009
PSRA/Newsweek: Apr 1993
49 More time 48 42 17 Less time 13 17 33 About the same amount 38 40 1 Don't know/Refused (VOL.) 2 1
QUESTIONS P.3-5 AND Q.27-35 PREVIOUSLY RELEASEED; NO QUESTION 30
37 In the April 1993 PSRA/Newsweek survey, the question was only asked among parents with children ages 10-16. It was also
preceded
by a question that asked how often they have dinner with their children. The questions used to filter parents with young
children did not
explicitly include stepchildren. 38 For both trends, only parents with children younger than 17 were asked. The questions used to filter parents with young
children in each
survey did not explicitly include stepchildren. For July 2009 it asked if the respondent had any children 16 or younger; for April
1993 it asked
if there were any children ages 16 or younger in the household.
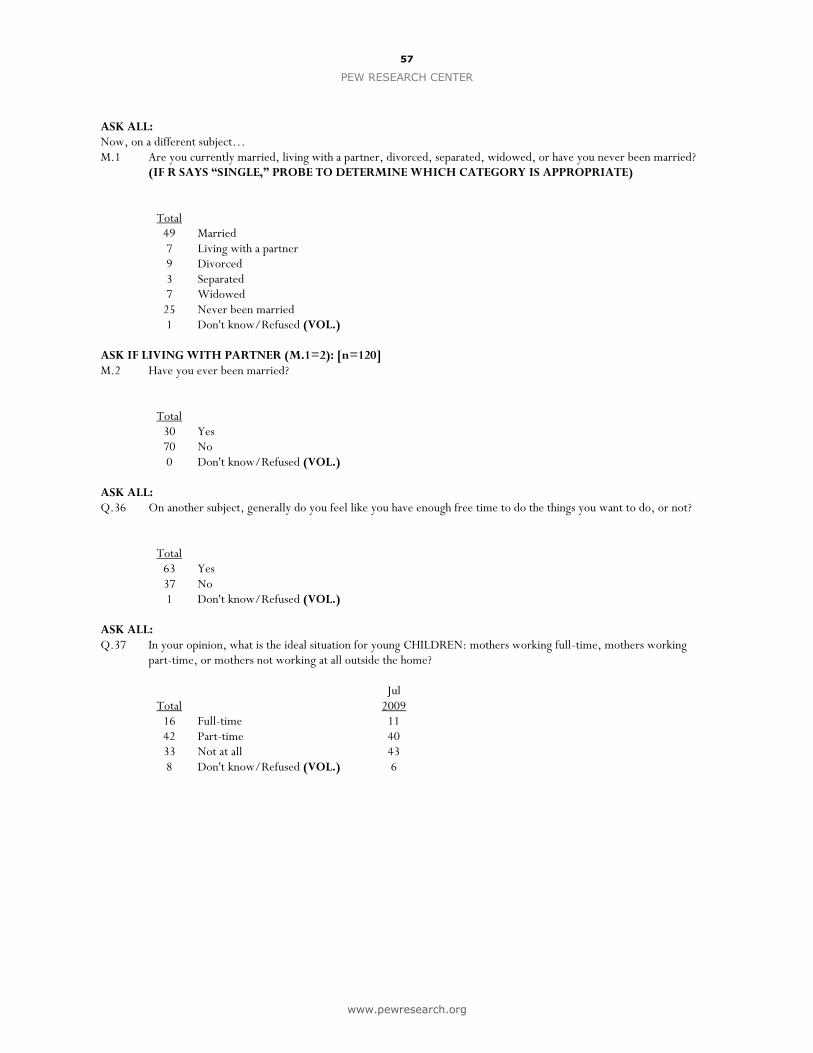
57
PEW RESEARCH CENTER
www.pewresearch.org
ASK ALL: Now, on a different subject… M.1 Are you currently married, living with a partner, divorced, separated, widowed, or have you never been married?
(IF R SAYS “SINGLE,” PROBE TO DETERMINE WHICH CATEGORY IS APPROPRIATE)
Total
49 Married 7 Living with a partner 9 Divorced 3 Separated 7 Widowed
25 Never been married 1 Don't know/Refused (VOL.)
ASK IF LIVING WITH PARTNER (M.1=2): [n=120] M.2 Have you ever been married?
Total
30 Yes 70 No 0 Don't know/Refused (VOL.)
ASK ALL: Q.36 On another subject, generally do you feel like you have enough free time to do the things you want to do, or not?
Total
63 Yes 37 No 1 Don't know/Refused (VOL.)
ASK ALL: Q.37 In your opinion, what is the ideal situation for young CHILDREN: mothers working full-time, mothers working
part-time, or mothers not working at all outside the home?
Total
Jul 2009
16 Full-time 11 42 Part-time 40 33 Not at all 43 8 Don't know/Refused (VOL.) 6
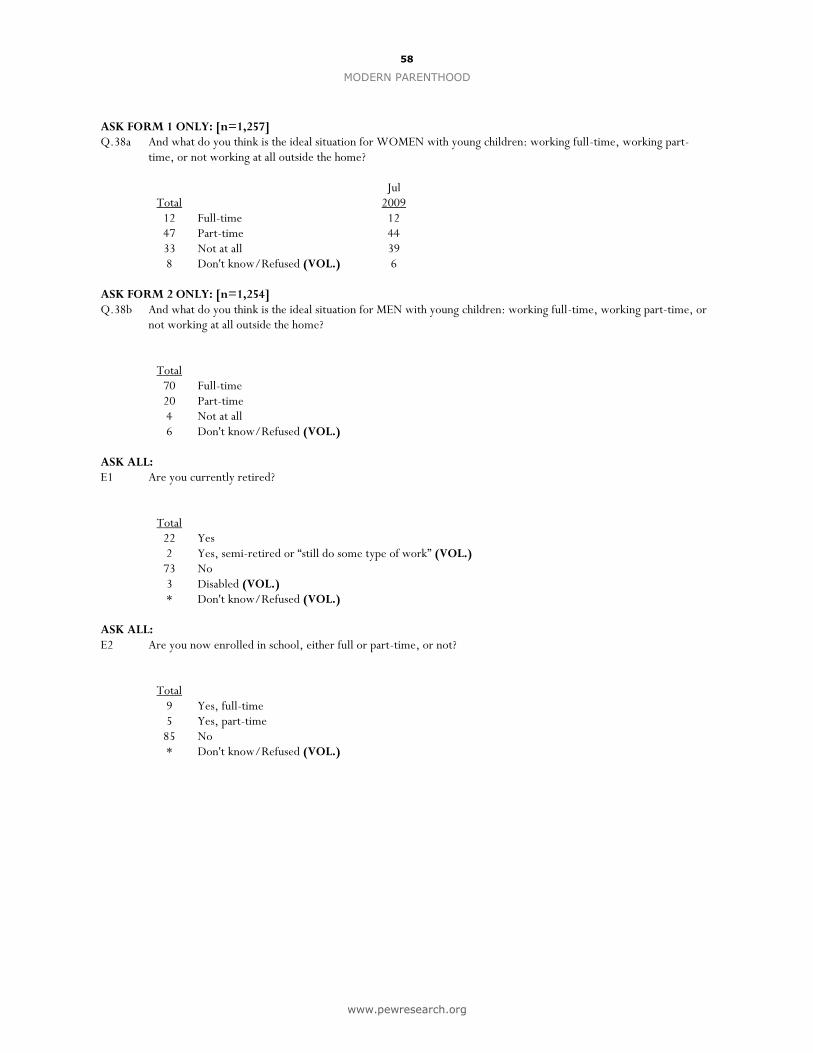
58
MODERN PARENTHOOD
www.pewresearch.org
ASK FORM 1 ONLY: [n=1,257] Q.38a And what do you think is the ideal situation for WOMEN with young children: working full-time, working part-
time, or not working at all outside the home?
Total
Jul 2009
12 Full-time 12 47 Part-time 44 33 Not at all 39 8 Don't know/Refused (VOL.) 6
ASK FORM 2 ONLY: [n=1,254] Q.38b And what do you think is the ideal situation for MEN with young children: working full-time, working part-time, or
not working at all outside the home?
Total
70 Full-time 20 Part-time 4 Not at all 6 Don't know/Refused (VOL.)
ASK ALL: E1 Are you currently retired?
Total
22 Yes 2 Yes, semi-retired or “still do some type of work” (VOL.)
73 No 3 Disabled (VOL.) * Don't know/Refused (VOL.)
ASK ALL: E2 Are you now enrolled in school, either full or part-time, or not?
Total
9 Yes, full-time 5 Yes, part-time
85 No * Don't know/Refused (VOL.)
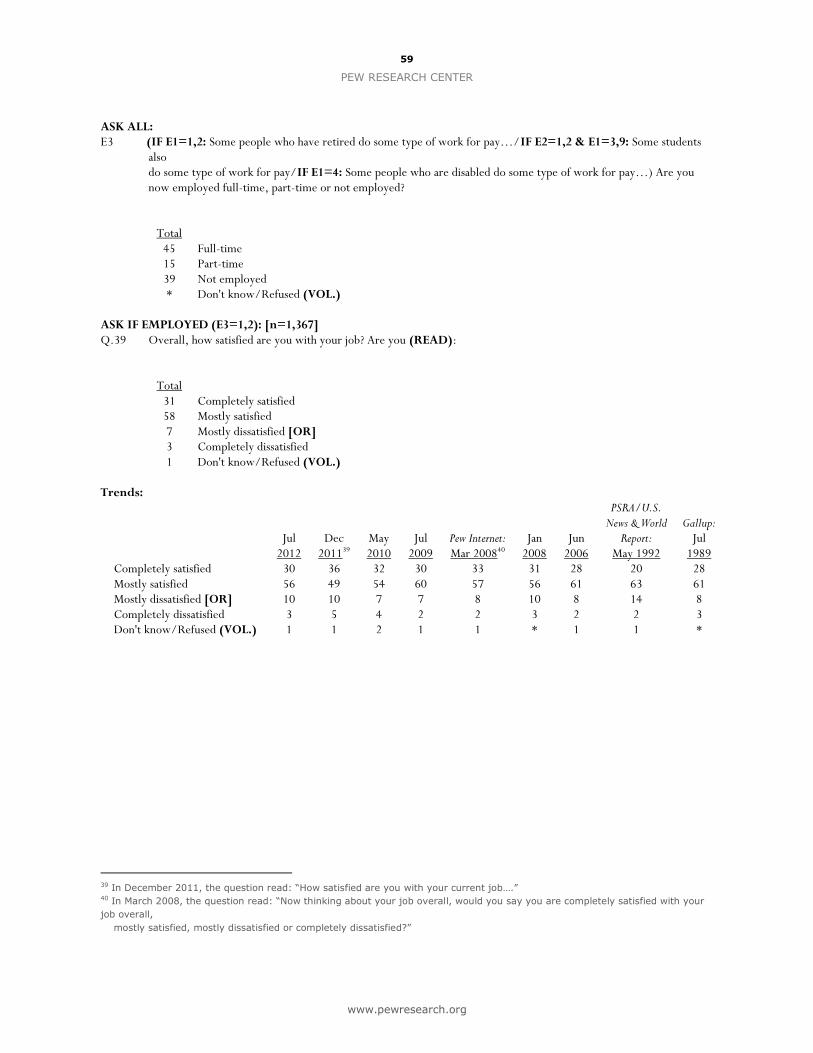
59
PEW RESEARCH CENTER
www.pewresearch.org
ASK ALL: E3 (IF E1=1,2: Some people who have retired do some type of work for pay…/IF E2=1,2 & E1=3,9: Some students
also do some type of work for pay/IF E1=4: Some people who are disabled do some type of work for pay…) Are you now employed full-time, part-time or not employed?
Total
45 Full-time 15 Part-time 39 Not employed * Don't know/Refused (VOL.)
ASK IF EMPLOYED (E3=1,2): [n=1,367] Q.39 Overall, how satisfied are you with your job? Are you (READ):
Total
31 Completely satisfied 58 Mostly satisfied 7 Mostly dissatisfied [OR] 3 Completely dissatisfied 1 Don't know/Refused (VOL.)
Trends:
Jul 2012
Dec 201139
May 2010
Jul 2009
Pew Internet: Mar 200840
Jan 2008
Jun 2006
PSRA/U.S. News & World
Report: May 1992
Gallup:
Jul 1989
Completely satisfied 30 36 32 30 33 31 28 20 28 Mostly satisfied 56 49 54 60 57 56 61 63 61 Mostly dissatisfied [OR] 10 10 7 7 8 10 8 14 8 Completely dissatisfied 3 5 4 2 2 3 2 2 3 Don't know/Refused (VOL.) 1 1 2 1 1 * 1 1 *
39 In December 2011, the question read: “How satisfied are you with your current job….” 40 In March 2008, the question read: “Now thinking about your job overall, would you say you are completely satisfied with your
job overall,
mostly satisfied, mostly dissatisfied or completely dissatisfied?”
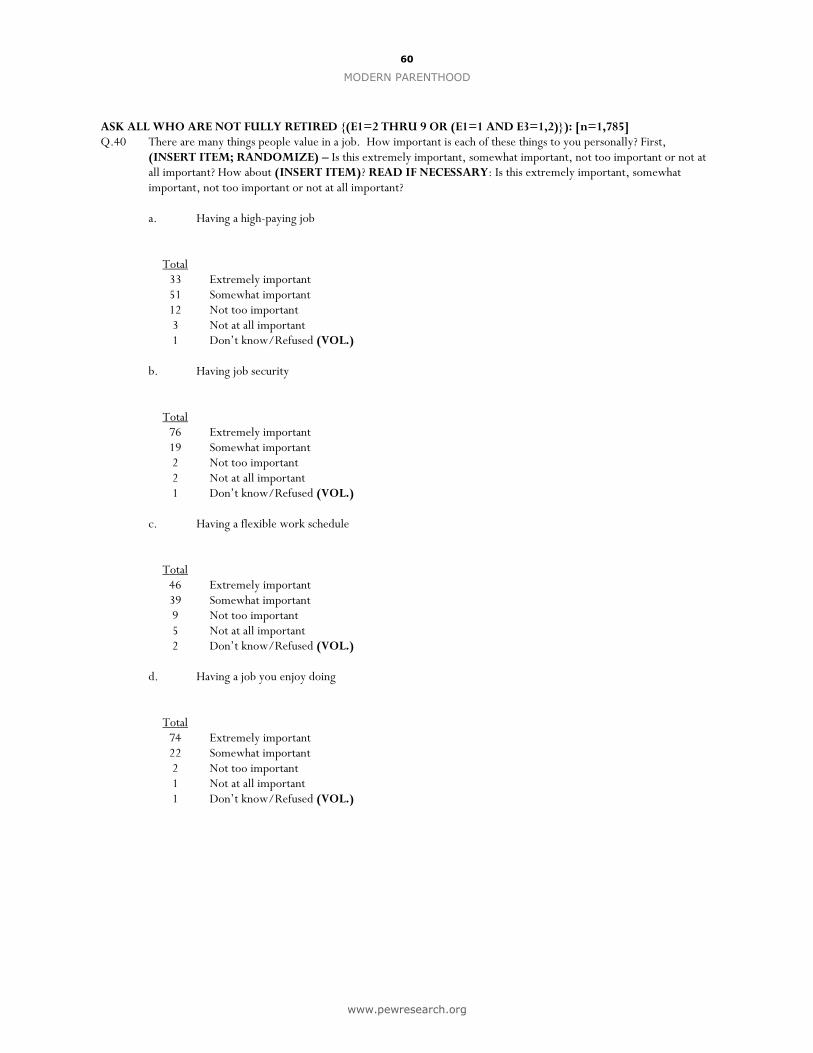
60
MODERN PARENTHOOD
www.pewresearch.org
ASK ALL WHO ARE NOT FULLY RETIRED {(E1=2 THRU 9 OR (E1=1 AND E3=1,2)}): [n=1,785] Q.40 There are many things people value in a job. How important is each of these things to you personally? First,
(INSERT ITEM; RANDOMIZE) – Is this extremely important, somewhat important, not too important or not at all important? How about (INSERT ITEM)? READ IF NECESSARY: Is this extremely important, somewhat important, not too important or not at all important?
a. Having a high-paying job
Total
33 Extremely important 51 Somewhat important 12 Not too important 3 Not at all important 1 Don’t know/Refused (VOL.)
b. Having job security
Total
76 Extremely important 19 Somewhat important 2 Not too important 2 Not at all important 1 Don’t know/Refused (VOL.)
c. Having a flexible work schedule
Total
46 Extremely important 39 Somewhat important 9 Not too important 5 Not at all important 2 Don’t know/Refused (VOL.)
d. Having a job you enjoy doing
Total
74 Extremely important 22 Somewhat important 2 Not too important 1 Not at all important 1 Don’t know/Refused (VOL.)
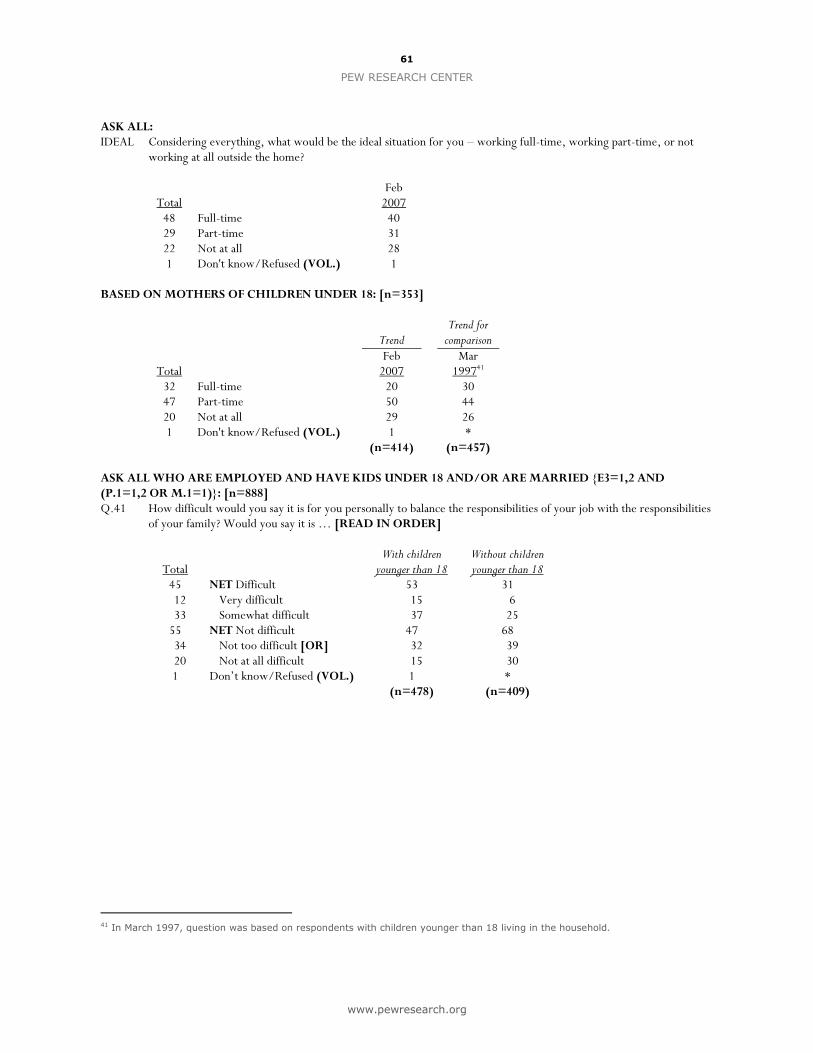
61
PEW RESEARCH CENTER
www.pewresearch.org
ASK ALL: IDEAL Considering everything, what would be the ideal situation for you – working full-time, working part-time, or not
working at all outside the home?
Total
Feb 2007
48 Full-time 40 29 Part-time 31 22 Not at all 28 1 Don't know/Refused (VOL.) 1
BASED ON MOTHERS OF CHILDREN UNDER 18: [n=353]
Trend
Trend for comparison
Total
Feb 2007
Mar 199741
32 Full-time 20 30 47 Part-time 50 44 20 Not at all 29 26 1 Don't know/Refused (VOL.) 1 * (n=414) (n=457)
ASK ALL WHO ARE EMPLOYED AND HAVE KIDS UNDER 18 AND/OR ARE MARRIED {E3=1,2 AND (P.1=1,2 OR M.1=1)}: [n=888] Q.41 How difficult would you say it is for you personally to balance the responsibilities of your job with the responsibilities
of your family? Would you say it is … [READ IN ORDER]
Total
With children younger than 18
Without children younger than 18
45 NET Difficult 53 31 12 Very difficult 15 6 33 Somewhat difficult 37 25
55 NET Not difficult 47 68 34 Not too difficult [OR] 32 39 20 Not at all difficult 15 30 1 Don’t know/Refused (VOL.) 1 * (n=478) (n=409)
41 In March 1997, question was based on respondents with children younger than 18 living in the household.
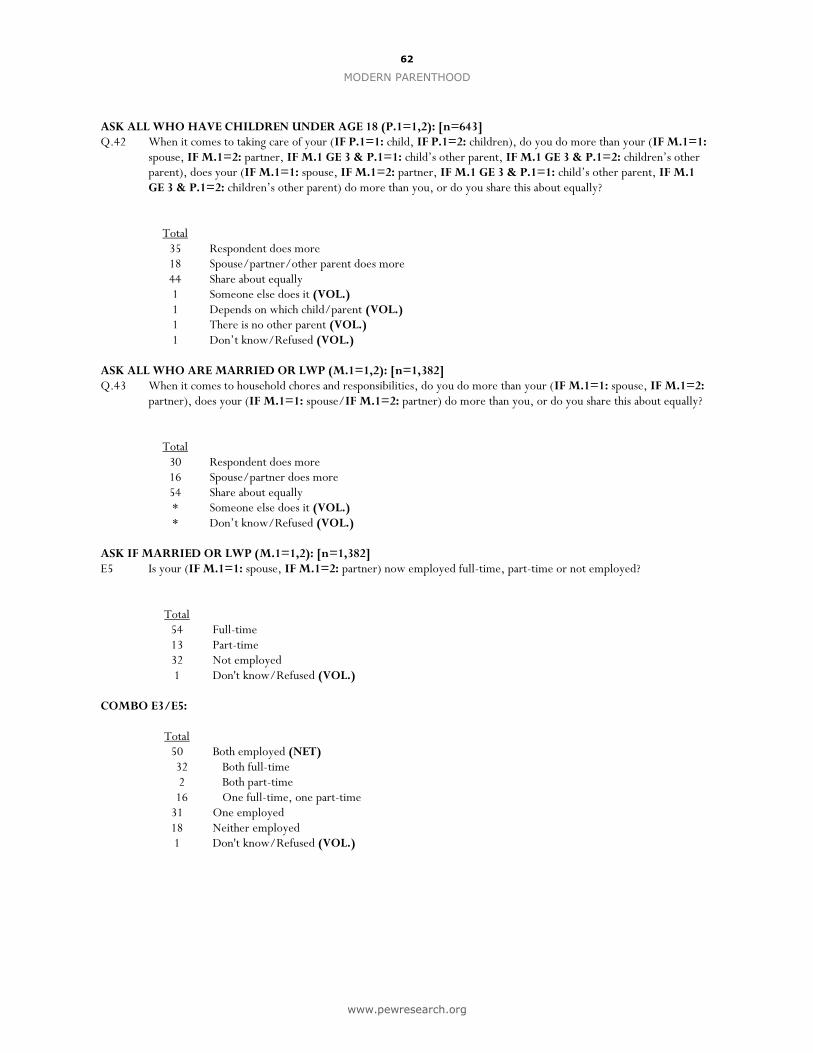
62
MODERN PARENTHOOD
www.pewresearch.org
ASK ALL WHO HAVE CHILDREN UNDER AGE 18 (P.1=1,2): [n=643] Q.42 When it comes to taking care of your (IF P.1=1: child, IF P.1=2: children), do you do more than your (IF M.1=1:
spouse, IF M.1=2: partner, IF M.1 GE 3 & P.1=1: child’s other parent, IF M.1 GE 3 & P.1=2: children’s other parent), does your (IF M.1=1: spouse, IF M.1=2: partner, IF M.1 GE 3 & P.1=1: child’s other parent, IF M.1 GE 3 & P.1=2: children’s other parent) do more than you, or do you share this about equally?
Total
35 Respondent does more 18 Spouse/partner/other parent does more 44 Share about equally 1 Someone else does it (VOL.) 1 Depends on which child/parent (VOL.) 1 There is no other parent (VOL.) 1 Don’t know/Refused (VOL.)
ASK ALL WHO ARE MARRIED OR LWP (M.1=1,2): [n=1,382] Q.43 When it comes to household chores and responsibilities, do you do more than your (IF M.1=1: spouse, IF M.1=2:
partner), does your (IF M.1=1: spouse/IF M.1=2: partner) do more than you, or do you share this about equally?
Total
30 Respondent does more 16 Spouse/partner does more 54 Share about equally * Someone else does it (VOL.) * Don’t know/Refused (VOL.)
ASK IF MARRIED OR LWP (M.1=1,2): [n=1,382] E5 Is your (IF M.1=1: spouse, IF M.1=2: partner) now employed full-time, part-time or not employed?
Total
54 Full-time 13 Part-time 32 Not employed 1 Don't know/Refused (VOL.)
COMBO E3/E5:
Total
50 Both employed (NET) 32 Both full-time 2 Both part-time
16 One full-time, one part-time 31 One employed 18 Neither employed 1 Don't know/Refused (VOL.)
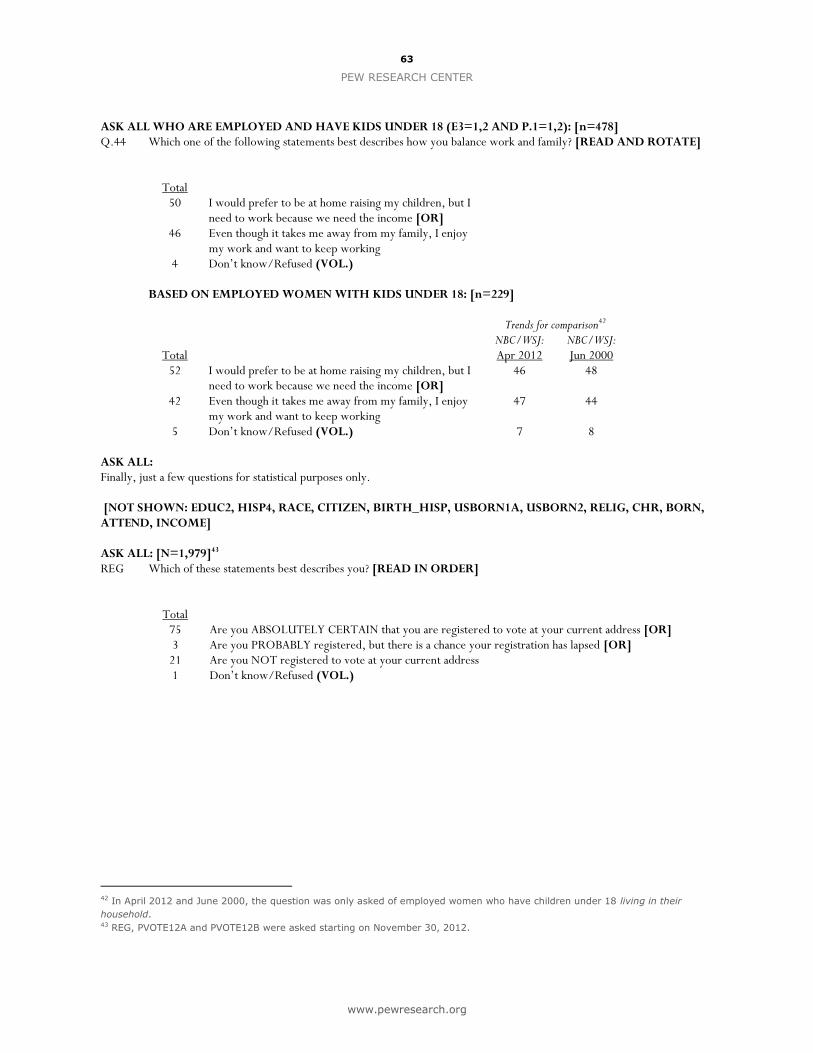
63
PEW RESEARCH CENTER
www.pewresearch.org
ASK ALL WHO ARE EMPLOYED AND HAVE KIDS UNDER 18 (E3=1,2 AND P.1=1,2): [n=478] Q.44 Which one of the following statements best describes how you balance work and family? [READ AND ROTATE]
Total
50 I would prefer to be at home raising my children, but I need to work because we need the income [OR]
46 Even though it takes me away from my family, I enjoy my work and want to keep working
4 Don’t know/Refused (VOL.) BASED ON EMPLOYED WOMEN WITH KIDS UNDER 18: [n=229]
Trends for comparison42
Total NBC/WSJ:
Apr 2012 NBC/WSJ: Jun 2000
52 I would prefer to be at home raising my children, but I need to work because we need the income [OR]
46 48
42 Even though it takes me away from my family, I enjoy my work and want to keep working
47 44
5 Don’t know/Refused (VOL.) 7 8 ASK ALL: Finally, just a few questions for statistical purposes only. [NOT SHOWN: EDUC2, HISP4, RACE, CITIZEN, BIRTH_HISP, USBORN1A, USBORN2, RELIG, CHR, BORN, ATTEND, INCOME] ASK ALL: [N=1,979]43 REG Which of these statements best describes you? [READ IN ORDER]
Total
75 Are you ABSOLUTELY CERTAIN that you are registered to vote at your current address [OR] 3 Are you PROBABLY registered, but there is a chance your registration has lapsed [OR]
21 Are you NOT registered to vote at your current address 1 Don’t know/Refused (VOL.)
42 In April 2012 and June 2000, the question was only asked of employed women who have children under 18 living in their
household. 43 REG, PVOTE12A and PVOTE12B were asked starting on November 30, 2012.
64
MODERN PARENTHOOD
www.pewresearch.org
ASK ALL REGISTERED VOTERS (REG=1): PVOTE12A In the 2012 presidential election between Barack Obama and Mitt Romney, did things come up that kept
you from voting, or did you happen to vote? ASK IF YES (PVOTE12A=1): PVOTE12B Did you vote for Obama, Romney or someone else?
BASED ON REGISTERED VOTERS: [n=1,604]
Total
89 Voted 41 Obama 33 Romney 4 Other candidate
11 Don’t know/Refused (VOL.) 11 Did not vote (includes too young to vote) * Don’t remember if voted/ Refused (VOL.)
ASK ALL: PARTY In politics TODAY, do you consider yourself a Republican, Democrat, or independent?
Total 24 Republican 33 Democrat 34 Independent 4 No preference (VOL.) * Other party (VOL.) 4 Don’t know/Refused (VOL.)
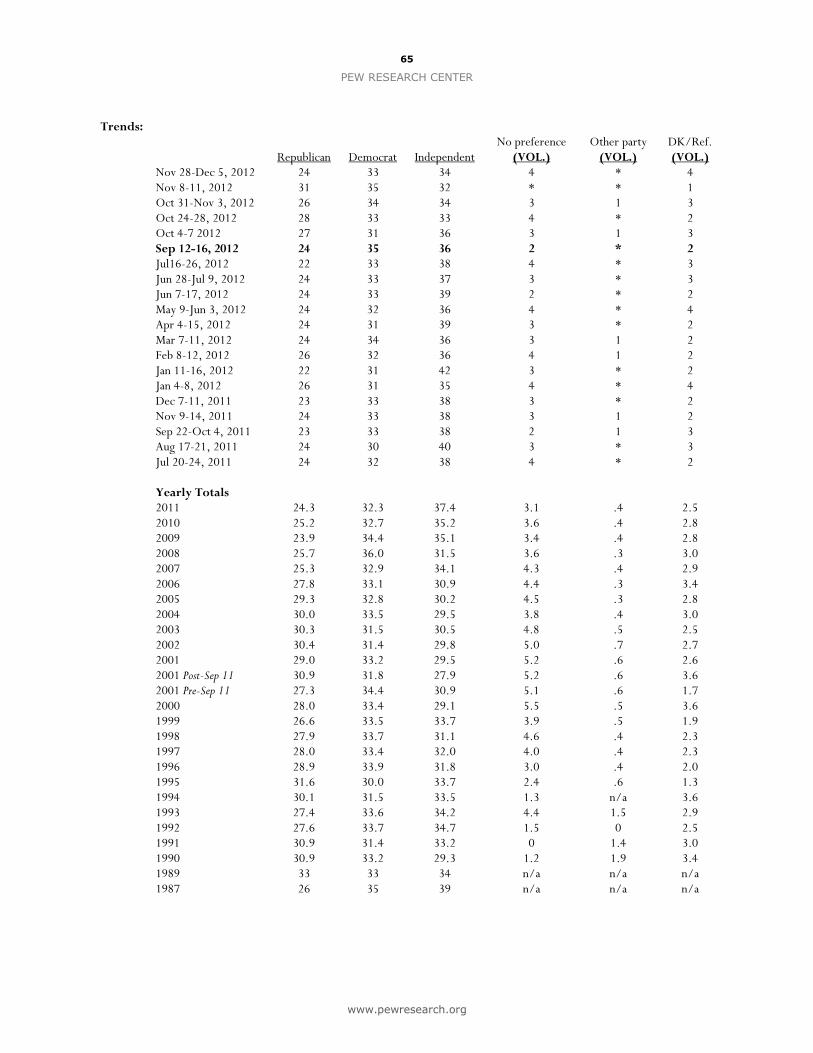
65
PEW RESEARCH CENTER
www.pewresearch.org
Trends:
Republican
Democrat
Independent No preference
(VOL.) Other party
(VOL.) DK/Ref. (VOL.)
Nov 28-Dec 5, 2012 24 33 34 4 * 4 Nov 8-11, 2012 31 35 32 * * 1 Oct 31-Nov 3, 2012 26 34 34 3 1 3 Oct 24-28, 2012 28 33 33 4 * 2 Oct 4-7 2012 27 31 36 3 1 3 Sep 12-16, 2012 24 35 36 2 * 2 Jul16-26, 2012 22 33 38 4 * 3 Jun 28-Jul 9, 2012 24 33 37 3 * 3 Jun 7-17, 2012 24 33 39 2 * 2 May 9-Jun 3, 2012 24 32 36 4 * 4 Apr 4-15, 2012 24 31 39 3 * 2 Mar 7-11, 2012 24 34 36 3 1 2 Feb 8-12, 2012 26 32 36 4 1 2 Jan 11-16, 2012 22 31 42 3 * 2 Jan 4-8, 2012 26 31 35 4 * 4 Dec 7-11, 2011 23 33 38 3 * 2 Nov 9-14, 2011 24 33 38 3 1 2 Sep 22-Oct 4, 2011 23 33 38 2 1 3 Aug 17-21, 2011 24 30 40 3 * 3 Jul 20-24, 2011 24 32 38 4 * 2 Yearly Totals 2011 24.3 32.3 37.4 3.1 .4 2.5 2010 25.2 32.7 35.2 3.6 .4 2.8 2009 23.9 34.4 35.1 3.4 .4 2.8 2008 25.7 36.0 31.5 3.6 .3 3.0 2007 25.3 32.9 34.1 4.3 .4 2.9 2006 27.8 33.1 30.9 4.4 .3 3.4 2005 29.3 32.8 30.2 4.5 .3 2.8 2004 30.0 33.5 29.5 3.8 .4 3.0 2003 30.3 31.5 30.5 4.8 .5 2.5 2002 30.4 31.4 29.8 5.0 .7 2.7 2001 29.0 33.2 29.5 5.2 .6 2.6 2001 Post-Sep 11 30.9 31.8 27.9 5.2 .6 3.6 2001 Pre-Sep 11 27.3 34.4 30.9 5.1 .6 1.7 2000 28.0 33.4 29.1 5.5 .5 3.6 1999 26.6 33.5 33.7 3.9 .5 1.9 1998 27.9 33.7 31.1 4.6 .4 2.3 1997 28.0 33.4 32.0 4.0 .4 2.3 1996 28.9 33.9 31.8 3.0 .4 2.0 1995 31.6 30.0 33.7 2.4 .6 1.3 1994 30.1 31.5 33.5 1.3 n/a 3.6 1993 27.4 33.6 34.2 4.4 1.5 2.9 1992 27.6 33.7 34.7 1.5 0 2.5 1991 30.9 31.4 33.2 0 1.4 3.0 1990 30.9 33.2 29.3 1.2 1.9 3.4 1989 33 33 34 n/a n/a n/a 1987 26 35 39 n/a n/a n/a
66
MODERN PARENTHOOD
www.pewresearch.org
ASK ALL: PARTY In politics TODAY, do you consider yourself a Republican, Democrat, or independent? ASK IF INDEP/NO PREF/OTHER/DK/REF (PARTY=3,4,5,9): PARTYLN As of today do you lean more to the Republican Party or more to the Democratic Party?
Total 36 Republican/lean Republican 48 Democrat/lean Democrat 16 Refused to lean
ASK ALL: IDEO In general, would you describe your political views as... [READ]
Total 8 Very conservative
29 Conservative 35 Moderate 15 Liberal 7 Very liberal 6 Don’t know/Refused (VOL.)
[NOT SHOWN: HH1, HH2, OWNRENT]