modification of the hydraulic jump by submerged jets
TRANSCRIPT

Scholars' Mine Scholars' Mine
Masters Theses Student Theses and Dissertations
1966
Modification of the hydraulic jump by submerged jets Modification of the hydraulic jump by submerged jets
Edward Leon Tharp
Follow this and additional works at: https://scholarsmine.mst.edu/masters_theses
Part of the Civil Engineering Commons
Department: Department:
Recommended Citation Recommended Citation Tharp, Edward Leon, "Modification of the hydraulic jump by submerged jets" (1966). Masters Theses. 5775. https://scholarsmine.mst.edu/masters_theses/5775
This thesis is brought to you by Scholars' Mine, a service of the Missouri S&T Library and Learning Resources. This work is protected by U. S. Copyright Law. Unauthorized use including reproduction for redistribution requires the permission of the copyright holder. For more information, please contact [email protected].

MODIFICATION OF THE HYDRAULIC JUMP BY SUBMERGED JETS
BY
EDWARD LEON THARP
A
THESIS
submitted to the faculty of the
UNIVERSITY OF MISSOURI AT ROLLA
in partial fulfillment of the requirements for the degree of
MASTER OF SCIENCE IN CIVIL ENGINEERING
Rolla, Missouri
1965
Approved by

ii
ABSTRACT
Tests were performed in order to determine the effect of submerged
jets injecting water into the base of the hydraulic jump. The jump was
studied in terms of the fol l owing properties: specific energy of the
flow leaving the hydraulic jump, length of the hydraulic jump, tailwater
depth, and wave formation properties. These properties for the hydraulic
jump with submerged jets were compared to the natural hydraulic jump.
Results of the tests indicate that: submerged jets at any angle
tested tend to decrease the specific energy of the water leaving the
jump and are more effective than the impulse-momentum principle
indicates, submerged jets may be as effective as baffle piers in re
ducing the length of the jump, and submerged jets at any angle tend to
decrease the required tailwater depth of the hydraulic jump .

ACKNOWLEDGMENTS
The author wishes to express his appreciation to Professor
Paul R. Munger of the Civil Engineering Department for his constant
guidance and council in the preparation of this thesis .
The author is also grateful to other members of the Civil
Engineering Staff and the Computer Center Personnel for their help
in interpreting the test results.
iii

iv
TABLE OF CONTENTS
PAGE
ABSTRACT • • • • • • • • • • • • • • • • • • • • • • • • • • • . • • • • • • • • • • • • • • • • • • • • • • • • • • • • • • • • i i
A CKN OOLE OOME 'N'r • • • • • • • • • • • • • • • • • • • • • • • • • • • • • • • • • • • • • • • • • • • • • • • • • • • • • • i i i
LIST OF FIGURES • • • • • • • • • • • • • • • • • • • • • • • • • • • • • • • • • • • • • • • • • • • • • • • • • • • • . v
LIST OF TABLES • • • • • • • • • • • • • • • • • • • • • • • • • • • • • • . • • • • • • • • • • • • • • • • • • • • • • • vi
N 0}-fE NCI..A T'UR.E • • • • • • • • • • • • • • • • • • • • • • • • • • • • • • • • • • • • • • • • • • • • • • • • • • • • • • • • vi i
I.
II.
III.
IV.
v.
VI.
VII.
IN'I'RODUCTI ON ••••••••••• •••• ••••••• •••••• ••••• ••• • •• ••••••••• ••
LITERATURE REVIEW ••••••••••••••••••••••••••••••••••.••••••••••
TESTING EQUIPMENT.
TESTING PROCEDURE •••••••• • •••••• • ••••••••• ••••••••••• • ••••••••
DISCUSSION OF RESULTS •••••••••••••••••••••••••••••••••••• • ••••
CONCLUSIONS ••••••••••••••••• • ••••••••••••••••••••.••••••••••••
REC~NDATIONS ••••••••••••••• • •• •••• • •• •• •• •••• ••••••••••••••
1
3
8
12
17
31
32
BI BLIOORA.PliY. • • • • • • • • • • • • • • • • • • • • • • • • • • • • • • • • • • • • • • • • • • • • • • • • • • • • • • • 3 3
VITA •••••• •• •••• • •• •• •• • . ..... ........ ... ........................ . 34

v
LIST OF FIGURES
FIGURE PAGE
1 SIDE VIEW OF TESTING APPARATUS. .. ... .. ..... .... .... ..... .. 9
2 ISOMETRIC OF TESTING APPARATUS. ......... .... .. . .... . .... .. 10
3 TEST FLlJl.fE . • • • • • • . • • • • • . . • • • • . . • • • • • • • . • • • • • • • • • • • • • • . . • • • 11
4 RATIO OF TAILWATER DEPTH TO ENTERING DEPTH VERSUS FROUDE NlJMBER • • • • • • • • • • • • • • • • • • • • • • • • • • • • • • • • • • • • • • • • • • • • • • • • • • • • 18
5 EXIT SPECIFIC ENERGY VERSUS FROUDE NlJMBER.. .. ....... . . .... 19
6 RATI O OF FLOW THROUGH THE JETS TO FLOW OVER THE SPILLWAY VERSUS FROUDE NlJMBER. .... .. ...... .... . .. ..... ........... . . 20
7 ACTUAL AND THEORETI CAL SPECIFIC ENERGY OF WATER LEAVING THE JUMP VERSUS FROUDE NlJMBER... . . . ........... . .... . . . ... . 23
8 RATIO OF LENGTH OF JUMP TO ENTERING DEPTH VERSUS FROUDE N1Jl.IBER • • • • • • • • • • • • • • • • • • • • • • • • • • . • • • • • • • • • • • • • • • • • • • • • • • • • 2 5
9 RATIO OF WAVE HEIGHT TO ENTERING DEPTH VERSUS FROUDE NlJMBER . • • . • . . • • . • . . • • • • . . . • • . . • • . . . . • • . . . . • . • . . . • • . . • . • . • . 30

vi
LIST OF TABLES
TABLE PAGE
I INTERPRETATION OF TEST RESULTS.. . ...... . ........ . .. . . . .... 27

vii
NOMENCLATURE
The symbols are defined as they first appear in the text but are
given here in alphabetical order for convenience.
D0
Diameter of the jets in feet
H
g
Depth of water entering the stilling basin in feet
Tail water depth of the hydraulic jump in feet
Specific energy of the water entering the stilling basin in feet
Specific energy of the water leaving the hydraulic jump in feet
Froude number of the water entering the stilling basin
Acceleration of gravity in feet per second per second
Head on the spillway crest in feet
Length of the hydraulic jump in feet
Flowrate through the four jets in cubic feet per second
Flowrate over the spillway in cubic feet per second
Velocity of the water entering the stilling basin in feet per second
Velocity of the water leaving the stilling basin in feet per second
Wave height in feet
Angle between the copper tubes and the horizontal in degrees, measured in the upstream direction.

I. INTRODUCTION
The hydraulic jump is a very useful and reliable phenomenon in
open channel flow . Its primary purpose is to reduce or eliminate
erosion at the discharge end of a stil ling basin. This is accomplished
by dissipating much of the kinetic energy of the high-velocity stream
entering the stilling basin.
The high-velocity stream is broken into two components as it
enters the hydraulic jump: the principal s tream, and the surface
roller. Both of these components help dissipate some of the energy;
however, the surface roller seems to be the most effective. Therefore,
any method of increasing the amount of flow going to the surface roller
should have an effect on the amount of energy dissipated by the jump.
Common methods of accomplishing this are the use of baffle piers, end
sills, and chute blocks.
A few laboratory studies have been made to determine the feasi
bility of using submerged jets to aid in energy dissipation, and to
determine what effects they might have on the other properties of the
hydraulic jump. Most of these studies have been conducted with the
jets flush with the floor of the s tilling basin . If the tubes delivering
water to the jump protruded through the f loor of the basin, it is logical
that they should have a more significant effect due to the action of the
jets in breaking up the principal stream in the hydraulic jump, as well
as the baffle pier action of the tubes. Also, the angle at which the
tubes deliver flow into the hydraulic jump should be a factor in
determining the effec t on the properties of the jump.
This investigation has been undertaken to determine what effect
the tubes protruding through the floor of the stilling basin will have

on the jump, as well as the effect of variation of the angle at which
the jets deliver water t o t he jump. The effect on the jump will be
judged by the t ailwat er depth, length of jump , the wave format i on
properties of the jump, and the exit specific energy of the jump.
2

3
II . LI TERATURE REVIEW
During the past several years, there has probably been more work
done in connection with the hydraulic jump than any other phas e of
hydraulics . Most of this work falls into two distinct phases: the
hydraulic jump as it occurs naturally, and methods of altering the
form of the hydraulic jump .
Hydraul ic jump studies require the establishment of basic,
mathematical fluid flow relationships that must exist between various
elements of the hydraulic jump . These re l ationships are then verified
experimentally in the laboratory. I t is generally accepted that the
impulse -momentum principle can be applied to the vertical e l ements of
the jump .
The relationships for the horizontal elements of the hydraulic
jump are not as easy to establish. It was not until 1932 when Boris
1 A. Bakhmeteff and Arthur E. Matzke made an extensive study of the
horizontal elements that the basic knowledge was acquired. These two
men made significant contributions to the existing knowledge of the
hydraulic jump . Firs t, they showed conclusively that the Froude number
was the significant parameter for dynamic similarity. This dimension-
less number was developed by the laws of dimensional analysis and shows
that in open channel flow, gravity forces are the contr olling fac tors.
Since the Froude number is dimensionless , it will apply equally well to
either the mode l or the prototype. Second, they plotted accurate
profiles of t he hydraulic jump at various Froude numbers. Third, they
gave a rather accurate definition of the end point of the hydraulic jump
as well as accurate measurements of the length.

4
2 A. J. Peterka has since made extensive studies of the horizontal
elements of the hydraulic jump. From these studies, he was able to show
that results obtained by Bakhmeteff and Matzke were not universally
acceptable because the six inch flume, with which they made their tests,
was so narrow that the frictional effects were significant. However,
when corrections were made for these effects, the correlation was very
good. He also shows that there have been many different definitions of
the end point of the hydraulic jump, but when correlated by the same
definition, these end points compare favorably.
2 Peterka has also c lassi fied the jump into four distinct classes
according to the value of the entering Froude number. He points out
that a well-behaved jump can be expected when the entering Froude number
is between 4.50 and 9.00 .
The other phase of work dealing with the hydraulic jump is the
investigation of methods to alter the form of the jump, which is achieved
by placing appurtenances in the stilling basin to control the jump .
These alterations may accomplish one or more of the following: stabilize
the position of the jump, shorten the length of the jump, reduce the
tailwater depth required for the jump to form, and improve the
characteristics of the downstream flow pattern. The appurtenances,
which may be used either singularly or in several combinations, are of
three distinct types: chute block, baffle piers, and end sills.
Chute blocks are installed at the entrance to the stilling basin.
Their main purpose is to increase the effective depth of the entering
stream, break the flow into a number of jets, and increase the turbu lence
which is required for energy dissipation . The required length of the
basin is shortened because of these effects . Careful consideration

must be given to the use of chute blocks where the flow carries debris ,
ice or other materials that may damage the blocks and reduce their
effectiveness. I t is usually r ecommended that the height of chute
blocks be equal to the dep th of the entering stream . However, the
2 recommended width ranges from equal to t he entering s tream depth, to
0 . 75 times the entering stream depth . 3
Baffle piers are installed in t he stilling basin to s t abi l ize the
jump, increase the turbulence, and thereby help dissipate energy. "For
low flows, baffle piers help t o compensate for a slight deficiency of
tailwater depth, and for high f l ows , they help to deflect the flow away
from the riverbed." 3 Therefore, they are very he lpful in reducing t he
tailwater dep th and shortening the length of the bas in. Experimenters
generally agree that the height of the baffle piers should be equal to
about 2.5 times the enteri ng water depth, that the width be 0 .7 5 times
the height, and that they cover about 50 percent of the total width of
the basin . Piers should be l ocated from 0.8 to 0 .9 times the tailwater
depth fr om the chute b l ocks . Peterka2 points out that any rounding of
5
the corner s greatly reduces the effectiveness of the pier because s quare
edges help produce eddies that aid in energy dissipation. Usual ly the
use of baffle piers will reduce t he required length of the basin in
which the jump forms by 10 percent . The main disadvantage to t heir use
is their inability to withstand damage due to cavitation and float ing
debris .
The end sill is a l so used to stabilize the f l ow and to deflec t the
current away from the streambed as the flow leaves the basin. This
creates a back current that causes transported material to be depos ited
against the back face of the sill. 3 According to Elevatorski, "An end

sill is a vertical, stepped, sloped, or dentated wall constructed at
the downstream end of the s tilling basin ." The use of seven general
types of low end sills is discussed in his work. According to Foster
and Skrinde,4
high end sills may be used where the hydraulic jump will
not occur under the natural tailwater depth.
Roller type stilling basins are also used. This type basin uses a
6
tailwater depth in excess of that required for a hydraulic jump to form .
The excessive tailwater depth is usually obtained by using a high end
sill . The entering water causes large, reverse surface rollers which
dissipate much of the energy. A standing wave i s formed over the end
si ll as the water l eaves the basin which also dissipates some of the
energy. Near the channel bottom, behind the end sill, a ground roller
is for med. This roller has a mild velocity in the upstream direction
which deposits material toward the dam rather than away from the dam.
The material deposited by the roller can be a disadvantage in using this
stilli ng basin. 5 In the Pfeiffer St illing Basin described by Schokl itsch
6 and I ng, the end sill has been rep laced by a rising column of water
which creates a similar effect.
Although most stilling basin design procedur es have been deve loped
from model studies, fairly accurate predictions may be made of prototype
behavior. "The reason why little progress has been made in comparing
the hydraulic performance of a model to its prototype may be explained
by the lack of interest, particularly after the prototype is in
satisfact ory operation; a natural reliance on model theory ; and the
7 difficulties in making pr ototype measurements." However, some tests
have been performed on various hydraulic structur es . Schulz states
that tests on various structures "---show that performances general l y
8 have been in line with the model tests." From tests made on University

7
Dam at I owa City, it can be shown that the discrepancy between the dam
and a 1:12 model is about 5 percent for discharge measurements. 9
Blaisdell, with his experiments on two models, one of which was half the
size of the other, shows that "---within the limits of experimenta l
' error, the results obtained on the half model agreed with the full
model."lO Hickox11 also shows that the measured spillway coefficients
of discharge for Norris Dam are within 3.9 percent of those measured
on a 1 : 72 model . Based on the results that have been obtained by past
experimenters, results obtained from model studies should also be
representative of conditions that could be expected with a prototype
in the field.
12 0 In 1965, J obson used submerged jets at an angle of 60 and f lush
with the floor of the testing f l ume as appurtenances to modify the
hydraulic jump. This study is made as a continuation of his efforts to
determine the effect , on the hydraulic jump, of tubes through the floor
of the flume at various ang l es.

8
III. TESTING EQUIPMENT
All tests were performed with a flume , twelve feet long, one foot
wide, and two and one-half feet high, Figures 1, 2, and 3. The first
eight feet of the walls are made of clear plexiglass, and the last four
feet of the wall and the floor are of marine plywood. A twenty-four
inch ogee spillway made of plaster of Paris is located with its crest
twenty-six inches from the entrance of the f l ume . The spillway was
built as recommended by the Bureau of Reclamation, 13 assuming a four
inch des ign head and using a twelve inch radius for the toe of the
spillway.14 The spillway as well as the floor of the flume were well
waxed to make them as smooth and waterproof as possible.
Ten inches downstream from the toe of the spillway, four evenly
spaced, one-half inch copper tubes were placed with a total length of
two inches through the floor of the flume . The tubes were connected
by a manifold of twenty- eight gage metal and fiberglass to a two and
one-half inch cast iron feeder pipe. The inlet to this pipe is
located in the reservoir behind the spillway.
At t he outlet of the flume, a s luice gate enabled accurate control
of the tailwater depth. Upon leaving the flume, the water passed
through a tank. This tank, by means of an eas ily opened and closed
outlet, permitted the collection and weighing of the water when
necessary. Otherwise, the water was allowed to flow through the tank
into the floor drains.
Water for this apparatus was supplied at a pressure of forty
pounds per square inch by a one thousand gallon per minute pump powered
by a forty horsepower e lectric motor.

.S~u1ct. GATE. Pit:..L.i)MGTE..R
D, I
[.·:; n· GA<:.t---_____ _../
-----Lj >;
.S.TILU~'C? [)ASitl-
/
Doi~JY {. . - -
q :/ "~ f ·T--
.t -------· l: -
I /if:;' /f):
. -----,1-"~-t-/ /> >/ -~ "<!. - - _:::~ / <'-'-
Cu TuBING~-:,. --~-~--] --i .,.NWOLD ' (TIN -- v1 \~.. < !FiccRGLAS< ' - -·';J I - --~ ; ?", C I
·-· ·._ -;)----------~: ,:..-- .·_ J -~ - '
MANOM~T~R _______ ..rr=;--::_ . ~c~ INcUNE..O
L-----------------------------------------------------------------------------------~ SIDE... Vlt:.W OF TE.STitlG APPA-RATUS
FIGUF~E.. 1.0

SLUICI:. GATE PI~C. OM E.. T O .( STAFF" GAGE. Poi NT (, A<:.£. ~5TILLI).Iu B ASIN
. ~ ) ..........
r--- j -j
~~ n A ~ (' /d" / / / /]/ 1 r ______,_____ )1 z± c. I."' Cu Tue1N<e) /-~-----_../
MANifOL D
INCL!NE..O MI',NOME.TER~
I~OME..TRIC OF" T E. 5 TINC:> APPARATUS
fi GURE. 2_ ..... 0

11
FIGURE 3. TEST FLUME

12
IV. TESTING PROCEDURE
The actual hydraulic jump was investigated after preliminary tests
were conducted to es t ablish various relationships . First the relation-
ship between head, at the spillway cres t, and flowrate was established.
The crest depth (H) was measured by the use of a point gage and an Ames
Dial, and the flowrate was calculated from the time necessary to collect
a given weight of water. The point gage was read to the nearest 0.0001
inch, which is within 0.1 percent of the smallest head measured, and
the calculated flowrate was accurate to within 1.5 percent . With the
fifteen tests performed, it was found that the following equation as
12 given by J obson was satisfactory:
Q = 6.453 n1 ·535 . • • •••• •••••••••••• •• ••••••• ••• ( 1)
where Q is the flowrate over the crest of the spillway in cubic fee t
per second and H is the head in feet at the spill way crest. It was
found that the deviation between Equation (1) and the measured values
of flowrate was acceptable.
h f . f h . 12 The next step was t e veri 1cation o t e equat1on,
El = 254 .7 n3 - 147.78 H2
+ 31.754 H- .9304 . ••.••••.. . (2)
where E1
is the entering specific energy in feet and H is the head over
the spillway crest. This was accomplished by placing four pitot tubes
through the floor of the flume and connecting them to manometers which
were read to the nearest 0.01 inch. By averaging the manometer readings
and measuring the head (H), it was found that the average deviation
between Equation (2) and measured energy was within an allowable
engineering accuracy of 5 percent .
13
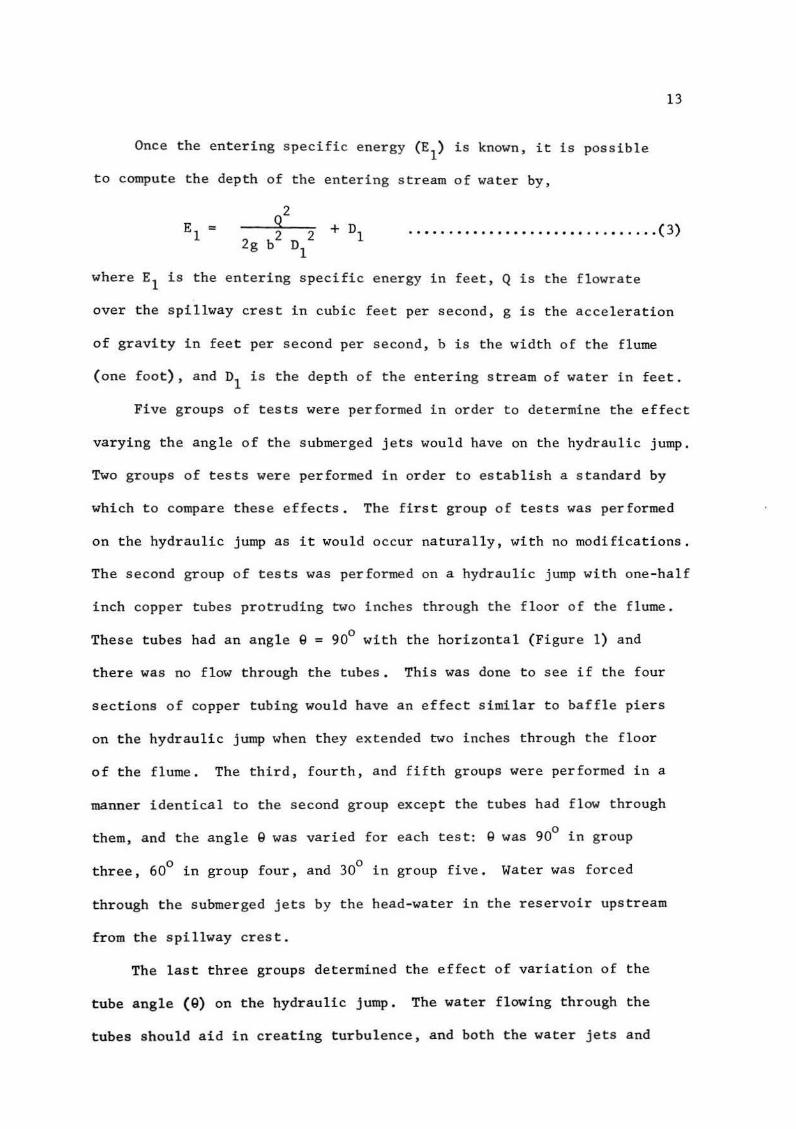
Once the entering specific energy (E1
) i s known, it is possible
to compute the depth of the entering stream of water by,
E = 1 .•••..•••.•••••..•••••...••. . .. ( 3)
where E1 is the entering specific energy in feet, Q is the flowrate
over the s pillway crest in cubic feet per second, g is the acceleration
of gravity in feet per second per second , b is the width of the flume
(one foot), and n1 is the depth of the entering stream of water in feet.
Five groups of tests were per formed in order to determine the effect
varying the angle of the submerged jets would have on the hydraulic jump.
Two groups of tests were performed in order to establish a standard by
which to compare these effects. The first group of tests was performed
on the hydraulic jump as it would occur naturally, with no modifications.
The second group of tests was performed on a hydraulic jump with one- half
inch copper tubes protruding two inches through the floor of the flume .
These tubes had an angle Q = 90° with the horizontal (Figure 1) and
there was no flow through the tubes. This was done to see if the four
sect ions of copper tubing would have an effect similar to baffle piers
on the hydraulic jump when they extended two inches through the floor
of the flume . The third, fourth, and fifth groups were performed in a
manner identical to the second group except the tubes had f l ow through
d 1 n • d f h n 90° • them, an the ang e ~ was var1e or eac test: ~ was 1n group
three, 60° in group four, and 30° in group five. Water was forced
through the submerged jets by the head-water in the reservoir upstream
from the spillway crest.
The last three groups determined the effect of variation of the
tube angle (9) on the hydraulic jump. The water flowing through the
tubes shoul d aid in creating turbulence, and both the water jets and

14
copper tubes should cause an effect s imilar to baffle piers . The tubes
were placed ten inches from the entrance to the stilling basin, which
was also the start of the hydraulic jump.
The flowrate delivered to the jump by the tubes was calculated by
determining the head loss in 2.88 feet of two and one-half inch cast
iron feeder pipe . This was accomplished by using an inclined water over
monoclorobenzene .manometer . The head loss was determined and the flow
rate through the tubes (Q0
) was calculated by the simultaneous solution
of the continuity and Darcy-Weisbach equations.
The testing procedure was essentially the same for all tests.
First, the flowrate over the spillway was adjusted by the use of a five
inch gate valve in the supply line. The tailwater depth was adjusted
next by the sluice gate at the exit from the flume . This depth was in
creased until the beginning of the jump occurred at the entrance of the
stilling basin. The stilling basin entrance also coincided with the toe
of the spillway. The beginning of the hydraulic jump was defined as the
start of the surface turbulence. Once the beginning of the jump was
adjusted, a period of two hours or more was allowed to pass before
actual test measurements were made. This period of time was allowed
to elapse in order that all parts of the hydraulic jump would be
stabilized.
Measurements were started by reading the head at the spillway
crest (H), obtained by a point gage and Ames dial. Values of the head
at the beginning and end of each test were taken and these readings
averaged.
The next measurement was the tailwater depth (D2) . This was
deter mined by two piezometer tubes attached to the floor of the flume

15
forty-nine inches downstream from the entrance to the stilling basin.
Readings of both tubes were taken to the nearest 0.01 inch at the be-
ginning and end of each test , and the values averaged.
The third measurement determined the maximum f luctuation of the
water surface downstream from the hydraulic jump. The wave height ( A)
was measured by reading a staff gage mounted on the outside of the flume
located forty-four inches downstream from the entrance to the stilling
basin . Measurements were taken to the nearest 0 . 001 foo t. The maximum
water surface e l evat ions were measured during a twenty-second int erval.
The wave height (l) is the difference between the two readings, and
is considered a measure of the downstream wave formation properties of
the hydraulic jump . This measurement was taken at the beginning and
end of the t est and the readings averaged.
The next step , where applicable, was the determination of the head
loss through the 2.88 feet of feeder pipe. This was determined by
reading the difference in l evels of the inclined water over
monoclorobenzene manometer and converting manometer reading to pressure
drop in feet of water . The manometer was also read at the end of the
test and the two readings averaged.
The other measurement taken was the l ength of the hydraulic jump .
For comparison purposes , the end of the hydraulic jump was defined as
" ---identical with the end of the top roller. A light object placed
on the surface of the water at the end of the roller wi l l have a fifty
12 percent chance of moving upstream." The end of the roller was
determined by dropping one hundred smal l corks through a movable guide
pipe placed on the top of the flume. These corks were dropped at one
inch intervals and the number of corks going upstream were counted.

16
This was repeated from the point where the surface roller had an up-
stream velocity approximately ninety percent of the time, to where it
had an upstream velocity approximately ten percent of the time. Then a
plot was made of location from the start of the jump versus the number
of pieces of cork going upstream. A well established jump plotted as a
smooth curve which enabled the determination of the end of the top roller
to the nearest 0.1 inch.
In summary, the fol lowing data was taken during each test: the head
over the spillway crest (H), the tailwater depth (D2), the wave height
(A), the head loss through the feeder pipe where applicable, and the
length of the jump (L3).
The flowrate over the crest of the spi llway was found by using
Equation (1). The depth of the entering stream of water was calculated
by solution of Equations (1), (2), and ( 3). The exit specific energy
(E2) was calculated from Bernoulli's equation . The values LJ, D2 , Q0 ,
A, and E2
were plotted versus the entering Froude number (F1):
D 1 1
. ••••• • ••• ... • .•••• ••• .•...•...... . .. ( 4)
where F1
is the Froude number of the entering stream of water, v1 is
the velocity of the entering water in feet per second, D1 is the depth
of the entering stream in feet, and g is the acceleration of gravity in
feet per second per second .
Figures 4, 5, 6, 8, and 9 were plotted by using equations (1), (2),
( 3), and (4), and the values of L3
, D2 , Q0 , and A that were measured
during tests. Figures 5, 6, 8, and 9 are in dimensionless form and shoul
apply equally well to prototype performance, within the limits of
experimental error.
17
V. DISCUSSION OF RESULTS
A main consideration in analyzing the hydraulic jump is the specific
energy of the water leaving the jump. This energy is a function of the
entering Froude number for jumps created without the use of submerged
jets. When water is added, through the submerged jets, the exit specific
energy depends on the entering Froude number and the relative flow
through the submerged jets . Figures 4, 5, and 6 will be analyzed to-
gether because of this relationship between the exit specific energy
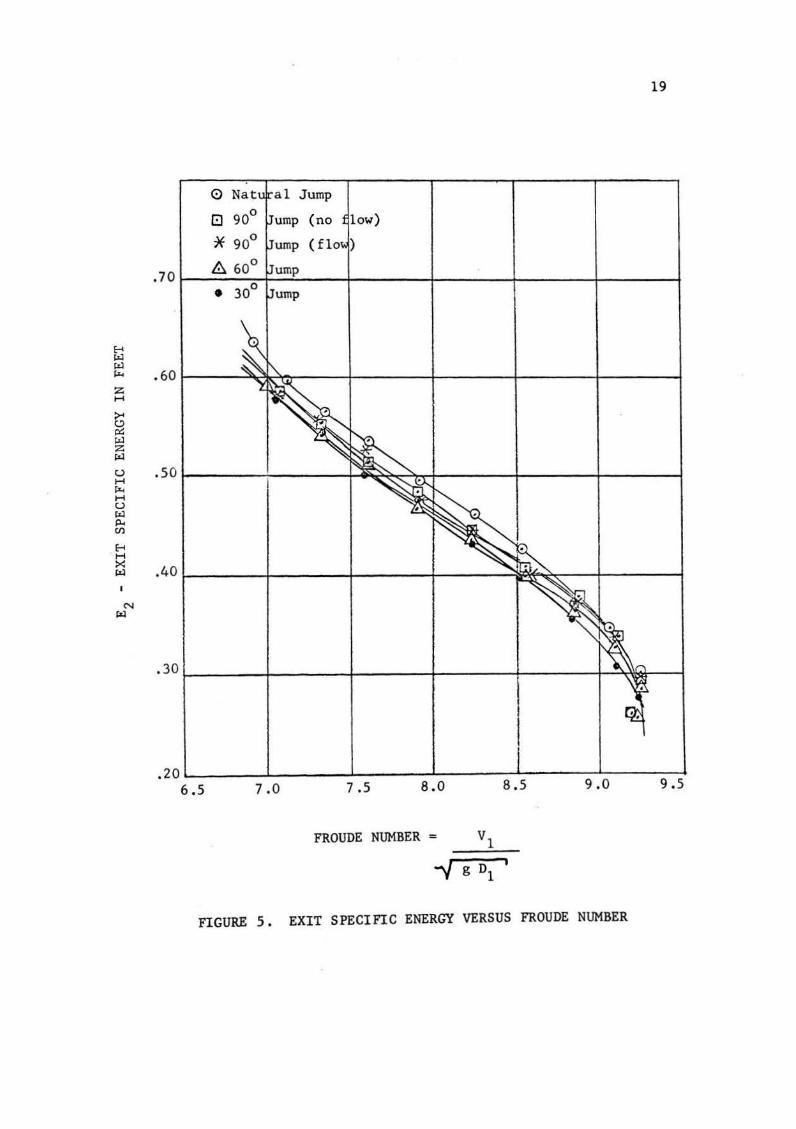
(E2), tailwater depth (D2), relative flow through the tubes (Q0
/Q), and
the entering Froude number. Figure 4 relates the ratio of tailwater
depth to the entering depth and the Froude number . Figure 5 is a plot
of the specific energy leaving the jump versus the Froude number.
Figure 6 depicts the relationship between the ratio of flowrate through
the tubes to the flowrate over the s pil lway and the Froude number.
To s i mplify the discuss ion of results, a name will be given to each
of the five hydraulic jumps investigated . The hydraulic jump with no
modifications will be called the natural jump; the jump occurring with
the tubes through the floor at 90° but with no f l ow wil l be ca lled the
90° jump (no f l ow); the jump with tubes at 90° but with flow will be
called the 90° jump (flow); the jump with tubes at 60° and with flow
will be called the 60° jump; and the jump with the tubes at 30° with
flow will be cal led the 30° jump.
The graph of D2
/D1
versus Froude number, Figure 4, indicates that
the tubes behave somewhat like baffle piers for the 90° jump (no flow),
90° jump (flow), and the 60° jump. For these cases , D2/D1 increases
more rapidly with increasing Froude number, between F1 = 8.50 and
F1
= 9.25, than it did for the natural hydraulic jump. However, D2/D1

0 ~
,.-... N
A '-"
::X:: t w A
,.-... ~ ~ WA ~ '-"
~::X:: ~ ~ . ~w ~A
~0 oz 0~ HW
~~ .-I
A ,_ N
A
18
0 Nat al Jump
(!] 90° Jump (no low)
* 90° Jump (flo )
13.0 8 60° .Jump
• 30° Jump
12 .o
11.0
10.0
9.0
8.0~----~------~-------L------~------L-----~ 6.5 7 .0 7.5 8.0 8.5 9.0
FROUDE NUMBER = Vl
-J g Dl I
FIGURE 4·. · .' RATIO . OF TAILWATER DEPTH TO ENTERING DEPTH VERSUS FROUDE NUMBER
9 .5
~ w w ~
z H
>< (.!) p::: w z w (,) H ~ H (,) w p.. (/)
~ H X w
N w
.60
.so
.40
0
8 (no low)
(flo )
19
.20 ~----~~----~~----~------~------~------~ 9 .0 9.5 6 .5 7.0 7 .5 8 . 0 8.5
FROUDE NUMBER V l
-v g Dl
FIGURE 5 . EXIT SPECIFIC ENERGY VERSUS FROUDE NUMBER

. so
""""' 0 0' -C/)
~-~s .40
~~ ~~ ;x:::j (.!)H ::::>~ 0CI)
~~ .30 ~
~~ ~~
0 ~
0~ 0....:1 H~ .20 ~0 ~~
~ 0
0'
. 10
o.o 6 .5
* 90° Jump (flo )
8 60° Jump
• 30° Jump
7.0 7.5 8.0 8.5 9 .0
FROUDE NUMBER =
FI GURE 6. RATIO OF FL~ THROUGH THE JETS TO FLOW OVER THE SPILLWAY VERSUS FROUDE NUMBER
20
9 . 5

21
for the 30° jump increased much slower than it did for the natural jump
between the same Froude numbers (F1
= 8.50 and F1
= 9 . 25).
Figure 5 indicates that introducing water through the jets at any
angl e generally reduces the exit specific energy. The tubes at 90° (no
flow) also reduce the specific energy (E2) except at Froude numbers
between 9.00 and 9.25, where the energy is identical to that of the
natural jump.
The values of E2 for all jumps are the same at a Froude number of
9.25. At this point the value of D2 /D1 for the 90° jump (no flow) is
99 percent of that of the natural jump, b2/D1 for the 60° jump is 95
percent of that of the natural jump, and D2/D1 for the 30° jump is
only 87 percent of that of the natural jump. The 30° jump has a
significant reduction in the required tailwater depth at this Froude
number. Also at this Froude 0 jump (flow) is number, Q /Q for the 90 0
equal to Q /Q for the 60° jump, but Q /Q for the 30° jump is reduced to 0 0
87 percent of that of the other two jumps.
The sped fie energy of the 30° jump is significantly lower than
that of the other jumps from F1 = 9.25 to F1 = 8.45, at which point the
exi t energy is equa'l to that of the 60° jump. At this point the exit
energy is reduced to 94 percent of that of the natural jump and D2/D1
for the 30° jump is 92 percent of that of the natural jump' compared to
93 . 5 percent for the 60° jump, 95 percent for the 90° jump (flow), and
97 percent for the 90° jump (no flow). Also at this point Q /Q is 0
reduced 1 percent for the 60° jump and 2 percent for the 30° jump when
compared to the 90° jump (flow).
When the impulse-momentum principle is applied between the beginning
and end of the jump with tubes inserted through the floor, the following

22
equation is obtained when the flume is of unit width:
2 2 Q + Q Cos g
0 .••.••• ••• . ... .•. •. ( 5)
where g is the acceleration of gravity in feet per second per second,
D1 is the depth of water entering the stilling basin in feet, n2
is the
tailwater depth of the hydraulic jump in feet, Q is the flowrate over
the crest of the spillway in cubic feet per second, Q is the flowrate 0
through the tubes in cubic feet per second, g is the angle the tubes
make with the horizontal in degrees, and D is the diameter of the tubes 0
in feet. Sol ution of Equations (1), (3), (5) and Bernoulli's equation
gives the theoretical value of the specific energy leaving the jump .
The values of actual and theoretical exit specific energies (E2
) are
plotted versus Froude number in Figure 7 .
The measured specific energy E2 is lower than the theoretical value
obtained by applying Equation (5). The measured values of E2 for the
90° jump (flow) average 1 . 3 percent less than the theoretical values,
the measured values of E2 for the 60° jump average 2 .0 percent less than
the theoretical values, and the measured values of E2 for the 30° jump
average 4.6 percent less than the theoretical values. Figure 7 is
plotted with one curve representing the theoretical values of the exit
specific energy for the 90° jump (flow), 60° jump, and the 30° jump.
Since the variation in the flow through the tubes (Q ) and the angle at 0
which the jets delivered their flow (Q) had a negligible effect on the
theoretical exit specific energy of the jump, it was neglected. On the
other hand, with the tubes injecting f l ow at 90°, 60°, or 30°, there is a
significant effect on the actual exit specific energy as shown in the figure.
12 The r esults above are contrary to those obtained by J obson when
the submerged jets are flush with the floor of the basin. He found that

>< 0 ~ 1-<J z 1-<J
c..> H ~ H c..> 1-<J p..p.. C/)~ ~......,
< ~~ E-IE-1 w ~~ ~~ (-1 <
1-<J O...:l z <~ w ~E-1 <<: :;::J~ E-1 c..>~ <O
N w
* Jump (f ow), actu 1
A Jump, a tual
Jump, a tual
• 70 A Jun~o t eoretical
A Jump, t eoretical .. Jump, t eoretical
. 60
.so
.40
.30
.20 6.5 7.0 7.5 8.0 8.5 9.0
FROUDE NUMBER =
FIGURE 7. ACTUAL AND THEORETICAL SPECIFIC ENERGY OF WATER LEAVING THE JUMP VERSUS FROUDE NUMBER
23
9.5

24
the theoretical exit specific energy was less than the actual exit
specific energy. Results of this study however, shows that the relation-
ship between actual and theoretical specific energy (E2
) has been
reversed. This is another indication that the tubes have an effect,
similar to baffle piers, of helping to dissipate energy in the jump.
Although energy dissipation is probably the most important effect
that the tubes and submerged jets have on the hydraulic jump, the effect
on the length of the jump i s much more noticeable. In Figure 8, the
ratio of length of jump (LJ) to the entering depth (D1) is plotted versus
Froude number . The curve for the natural jump agrees fairly well with
12 that of Jobson at values of F1 ~ 8.0, but at l ower Froude numbers his
plot remains linear . The results of this study indicate that for
values of F1 ~8.0 a nonlinear relationship exists . This may be explained
by noting the difficulty of holding a jump at these high flowrates . As
stated in the testing procedure, the length of the jump was determined
by dropping corks into the basin and counting those going upstream.
However, at the higher flowrates, these corks caused the jump to move
back from the entrance to the stilling basin, and made the length of jump
very hard to determine.
The curve for the 90° jump (no flow) shows an effect similar to
J obson ' s curve for baffle piers but much less pronounced. The 90° jump
(flow) shows that for F1 ~ 8.5, LJ /D1 decreases rapidly in comparison
to the natural jump. This can be explained by the fact that the tubes
act similar to an end sil l and contain the jump. At Froude numbers less
than 8.5 however, more turbulence is created around the tubes and L3/D1
increases to values greater than those of the natural jump .

0 E-t -'I .-4 '-"
~
~ 'I -~ .-1 Ot=l
'-" ::X:: E-t!J::
§@~ ~~
~§@ H
OP:: H~ E-tE-t
~~
.-1 A -'I .-4
25
55 0 Nat ral Jump
G 90° Jump (no low)
* 90° Jump )
50 A 60° Jump
G 30 Jump
45
40
35
30
20 ~------L-------~------~------~~----~~---n~ 6.5 7 .0 7.5 8.0 8.5 9.0 9 .5
FROUDE NUMBER =
D I 1
FIGURE 8 . RATIO OF LENGTH OF JUMP TO ENTERING DEPTH VERSUS FROUDE NUMBER

26
The 60° jump shows a still more pronounced effect at the higher
Froude numbers in retaining the jump, and at the lower Froude numbers
LJ / D1remains slightly less than the values for the natural jump.
0 The 30 jump does not follow this trend. At the high Froude numbers
LJ /D1 is slightly less than that of the natural jump and follows a
smooth curve to the low Froude numbers where L3
!n1
is much less than
that of the natural jump. At Froude numbers less than 8.0, the 30°
jump is almost as effective as baffle piers.12 The high values of
L3 /D1 for high Froude numbers (low flow) is probably caused by the low
value of D2 /n1 . This value of n2;n1
is low because n2
is not deep
enough to cause the high velocity flow of the entering stream of water
to be forced up from the floor of the basin. This means that the high
velocity flow -stream passes under the tube outlets, which are above the
floor, and the energy of the stream must be dissipated in the area
behind the tubes. Therefore, the influence of the jets on the length of
the hydraulic jump is very small. At the lower Froude numbers, n2 is
large enough to force the high velocity flow -stream up from the floor of
the basin and directly into the flow from the jets, therefore, greatly
reducing LJ (Table I).
Table I depicts the relationship between the Froude number, tail-
water depth (D2), n2 ;n
1, L
3/n1, and Q
0/Q for each of the five jumps
investigated. At a Froude number of 9.23 the tailwater depth n2 , for
the 30° jump, is much less than that for the 60° and 90° jumps. This
indicates that since the ratio n2;n1
is low compared to the other jumps,
the high velocity stream passes under the tube outlets and causes L3 /D1
to be almost as large as it is for the natural jump. At the same time
Q /Q is much less for the 30° jump than it is for the other two jumps 0
with flow t hrough the jets.

27
TABLE I
INTERPRETATION OF TEST RESULTS
Experimental
Fl Jump Values of n2 D2/Dl L
3/D1 Qo/Q
Name (feet)
9.23 Natural .2979 12.58 51.2 90° (no flow) .2925 12.49 50.5 90° (flow) .2883 12 . 28 45.0 .330
60° .2761 11.91 37 .7 .330 30° .2642 11.00 48.0 .269
8.55 Natural .4141 11 .64 42 . 1 90° (no flow) . 3996 11.27 41.0 90° (flow) .3925 11.02 41.9 .185
60° .3842 10.83 38 .3 .176 30° .3798 10.69 33.0 .160
7.05 Natural .5942 9.54 32.6 90° (no flow) . 3679 9.18 31.1 90° (flow) .5592 9.08 35 .1 .101
60° .5573 9.00 31.6 .092 30° .5567 8.97 22 .4 .088

28
When the Froude number is 8.55 however, D2
for the 30° jump is much
closer to the value of D2 for the 60° J·ump. Th f D /D · 1 ere ore 2 1 1s c oser to
the va lue that is expected from the trends of the other jumps , and LJ/Dl
for the 30° jump is lower than LJ / D1 for the other jumps . From this, D2
is large enough to force the principal stream up from the floor of the
basin to a position close to the tube outlets . Therefore, LJ/D1
, for the
30° jump, is . reduced to a value less than LJ/D1
for the other jumps.
At this Froude number the values of Q /Q for the other jumps with flow 0
through the tubes are starting to converge.
At a Froude number of 7.05, the value of D2
for the 30° jump is
very close to that for t he 60° jump. Here, the high velocity stream is
forced from the floor of the basin directly into the path of the flow
from the jets, for the 30° jump; therefore, LJ/D1
is dreastically re
duced when compared to the other four jumps . At this Froude number,
Q /Q is almost the same value for all three jumps modified by flow 0
through the tubes.
Figure 9 is a plot of the ratio of the wave height (A) to the
entering depth (D1
) versus Froude number. For all Froude numbers the
60° jump is rougher than the natural jump. The 90° jump (no flow) is
smoother than the natural jump at Froude numbers greater than 8 .10 but
rougher at Froude numbers less than 8.10. The 90° jump (flow) is
rougher than the natural jump when the Froude number is less t han 7.60
and a lso when it is greater than 8 .80. At a Froude number less than
7.50, the 30° jump is rougher than the natural jump and at a Froude number
greater than 7.50 is smoother. Peterka2
considers a natural jump rough at
Froude numbers greater than 9.00. On this basis the 60° jump would always
be rough, and the 90° jump (flow) would be rough at Froude number greater
than about 8.80. All other jumps should perform satisfactorily, between

29
Froude numbers of 9.00 and 7.30, as far as downstream wave formation
properties are concerned. This generally indicates that at both low and
high Froude numbers the tubes, or the tubes and jets combined, tend to
increase the turbulence and make the jump rougher than the natural
hydraulic jump.

0 E-t
30
0 Nat ral Jump
El 90° Jump (no low)
* 90° Jump (flo )
5.0 & 60° Jump
• 30° Jump
* ?k
4.0
2.0~-----t------;-----~~----~------+-----~
l.or------t------;-----~------~------~----~
0.0--------~------~------~------~------~------~ 8.5 9.0 9.5 6.5 7.0 7.5 8.0
FROUDE NUMBER = vl
FIGURE 9. RATIO OF WAVE HEIGIIT TO ENTERING DEPTH VERSUS FROUDE NUMBER

31
VI. CONCLUSIONS
Results of this study lead to the following conclusions:
1. For Froude numbers greater than 9.20 the modification of the
hydraulic jump by submerged jets, at various angles, has very little
effect on the exit specific energy.
2. When the impulse-momentum equation is applied to the hydraulic
jump with submerged jets protruding through the floor of the basin , it
gives values of exit specific energy greater than the values measured:
approximately 1 percent greater for the 90° jump (flow), approximately
2 percent greater for the 60° jump, and approximately 5 percent greater
0 for the 30 jump.
3. Tubes and jets at 30° reduce the length of the jump about 25
percent from that of the natural jump at Froude numbers l ess than 8 .00 .
This is almost as effective as baffle piers in reducing the length of
the jump at these Froude numbers.
4 . The exit specific energy of the jump is a function of D2/D1 ,
Q /Q, and the Froude number . 0
5. 0 Tubes and jets at 60 make the jump rougher than the natural
hydraulic jump at all Froude numbers.
6 . 0 Tubes and jets at an angle of 30 greatly reduce the tailwater
depth for Froude numbers greater than 8 .50, when compared to the tail-
water depth for the other jumps.
0 0 7 . At high Froude numbers the jets at 90 (flow) and 60 act
similar t o end si lls to retain the jump.

32
VII. RECOMMENDATIONS
Other areas of this study need to be investigated. The author feels
that they are 'as follows:
1. Tests should be performed to determine the effects of baffle
piers and submerged jets in combination.
2. Tests should be performed to determine the best location and
spacing of the submerged jets in the basin.
3. Tests should be conducted to determine the optimum number of
submerged jets.
4. A series of tests should be performed to determine the effect
of varying the value of Q /Q. 0
5. Tests should be conducted to determine the optimum size of the
submerged jets.
6. A group of tests should be performed to determine the erosion
and cavitation effects of tubes placed in the stilling basin.

33
BIBLIOGRAPHY
1. BAKHEMETEFF, B. A. and MATZKE, A. E. (1936) The Hydraulic Jump in Terms of Dynamic Similarity. American Society of Civil Engineers. Trans. Vol . 101, p. 630- 650.
2. PETERKA, A. J. (1963) Hydrau lic Design of Stilling Basins and Energy Dissipaters, A Water Resources Technical Publication, Engineering Monograph, No. 25, p. 1-43.
3. ELEVATORSKI, E. A. (1959) Hydraulic Energy Dissipaters, McGraw-Hill, p. 75-109.
4. FOSTER, J. W. and SKRINDE, R. A. (1950) Control of the Hydraulic Jump by Sills. American Society of Civil Engineers. Trans. Vol. 115, p. 973-1022 .
5. ELEVATORSKI, E. A. (1959) Hydraulic Energy Dissipaters, McGraw-Hill, p. 152- 154.
6. SCHOKLITSCH, T. A. and I NG (1937 ) Hydraulic Structures. New York. The American Society of Mechanical Engineers, Vol. II, p. 926.
7. WARNOCK, J. E. (1944) Hydraulic Structures. American Society of Civil Engineers. Trans. Vol. 109, p . 3-4.
8. SCHULZ, E. H. (1944) Schulz on Model-Prototype Conformity . American Society of Civil Engineers. Trans. Vol. 109, p. 143-144.
9. SOUCEK, E. (1944) Meter Measurements of Discharge, University Dam.
10.
11.
12.
13.
American Society of Civil Engineers. Trans. Vol. 109, p. 86-99.
BLAI SDELL , F. W. (1948) Development and Hydraulic Design, Saint Anthony Falls Stilling Basin. American Society of Civil Engineers. Trans. Vol . 113, p. 483-561.
HICKOX, J . E. (1944) Spillway Coefficients, Norris Dam. American Society of Civil Engineers. Trans. Vol. 109, p. 68-76.
JOBSON, H. E. (1965) The Effect of Submerged Jets on the Hydraulic Jump. Thesis, p. 1-45.
U.s. Bureau of Reclamation. Design of Small Dams, (1960). p 0 270-301.
14. BARROWS, H. K., s. G. (1943) Water Power Engineering. New York, McGraw-Hill, p. 352 .

VITA
Edward Leon Tharp was born June 14, 1943 in Boonville, Missouri.
He is the son of Glenn E. and Vena (Jones) Tharp.
He received his elementary schooling from the Husted and Martins
town elementary schools and his secondary education from Unionville,
Missouri High School, graduating in 1961.
In September, 1961, he enrolled at the Missouri School of Mines
and Metallurgy (now University of Missouri at Rolla) and in 1965 he
received a Bachelor of Science Degree in Civil Engineering.
His practical experience has consisted of summer employment with
The U. So Public Health Service in 1962 and 1963 and Humble Oil
Company in 1965.
On March 6, 1966, he was married to Miss Sharon Kay Piercy of
Carthage, Missouri .
34