modificaton and validation of the linear amplitude...
TRANSCRIPT
Hintz, Velasquez, Johnson, and Bahia 1
MODIFICATON AND VALIDATION OF THE LINEAR AMPLITUDE
SWEEP TEST FOR BINDER FATIGUE SPECIFICATION
Submission date: August 1, 2010
Word count 4952 plus 2 Tables and 8 Figures
Total number of words: 7452
Cassie Hintz (Corresponding Author)
Graduate Research Assistant
Department of Civil and Environmental Engineering
University of Wisconsin - Madison, 53706
Email: [email protected]
Ph: (608)-890-2566
Raul Velasquez, Ph.D.
Research Associate
Department of Civil and Environmental Engineering
University of Wisconsin - Madison, 53706
Email: [email protected]
Carl Johnson, Ph.D.
Stark Asphalt
A Division of Northwest Asphalt Products, Inc.
Milwaukee, WI 53225
Email: [email protected]
Hussain Bahia, Ph.D.
Professor
Department of Civil and Environmental Engineering
University of Wisconsin - Madison, 53706
Email: [email protected]
Submitted for publication and presentation at the
Transportation Research Board Annual Meeting
January 23-27, 2011
Washington, D.C.

Hintz, Velasquez, Johnson, and Bahia 2
ABSTRACT
Current asphalt binder specifications lack the ability to characterize asphalt binder damage
resistance to fatigue loading. Multiple accelerated testing procedures that attempt to efficiently
and accurately characterize asphalt binder contribution to mixture fatigue are currently under
investigation. One of these tests that has received significant acceptance by experts and has been
submitted as a draft AASHTO standard is the Linear Amplitude Sweep test (LAS) which is
based on using viscoelastic continuum damage (VECD) mechanics to predict binder fatigue life
as a function of strain in pavement. The LAS test uses cyclic loading with systematically
increasing load amplitudes to accelerate damage and provides sufficient data for analysis in less
than 30 minutes. While results of the current linear amplitude sweep testing protocol are
promising, there has been some concerns regarding the time and complex numerical procedures
required for the analysis. In addition, there are concerns regarding the strain amplitudes proposed
for the LAS as they do not lead to sufficient damage accumulation for a range of polymer
modified binders. This paper presents simplifications of the current analysis procedures and
evaluates the influence of using extended strain levels to impose sufficient damage for better
calculation of the binder fatigue law parameters. To validate the effectiveness of the modified
procedure, the results were correlated to the fatigue performance recorded by the LTPP program
with consideration of the pavement structure. Fair correlations were found showing the potential
for effective use of the modified method in the binder specifications.
INTRODUCTION
The current PG specification to evaluate asphalt fatigue resistance is based on the linear
viscoelastic properties of the material (i.e., |G*|·sin). However, this approach lacks the ability to
characterize actual damage resistance (1-2). Furthermore, this specification does not account for
pavement structure or traffic loading as the measurement is made at a specific strain level, for a
very few cycles of loading. The developers of the PG fatigue parameter were aware of this
limitation, but they speculated that binder in pavements function mostly in the linear visco-
elastic range and thus strain is not likely to affect their properties. They also assumed that energy
estimated in this range can be a good indicator of binders’ resistance to fatigue. Since late
1990’s there has been increased focus on challenging the assumptions, particularly for modified
asphalts that have better fatigue resistance and show more non-linear response to loading.
Therefore, there is currently a considerable amount of effort placed on the development of an
asphalt binder test procedure that can accurately determine the binder's contribution to asphalt
mixture fatigue by means of damage characterization.
Multiple procedures, such as the time sweep, have been proposed to improve the current
fatigue specification. The time sweep is a test method that consists of applying repeated cyclic
loading at fixed load amplitude to a binder specimen using the Dynamic Shear Rheometer
(DSR). The time sweep was developed during NCHRP Project 9-10 (1) to solve the deficiencies
of the current specification. The test is based on the definition of fatigue damage: degradation of
material integrity under repeated loading. The procedure allows for selection of load amplitude,
thus allowing for consideration of pavement structure and traffic loading. However, time sweep
tests are time consuming and repeatability is often difficult to attain.
Recently, an effort has been placed on developing an accelerated asphalt binder fatigue
test to replace the time sweep. Accelerated procedures that systematically increase the load
Hintz, Velasquez, Johnson, and Bahia 3
amplitude have shown great potential for fatigue resistance characterization (3). The focus of
this paper is to modify the test procedure originally developed by Johnson and Bahia (4) as a
surrogate to the time sweep test. This accelerated method, called the linear amplitude sweep
(LAS), consists of a series of cyclic loads at systematically linearly increasing strain amplitudes
at a constant frequency of 10 Hz. Similarly to the time sweep, the LAS test is run in the DSR and
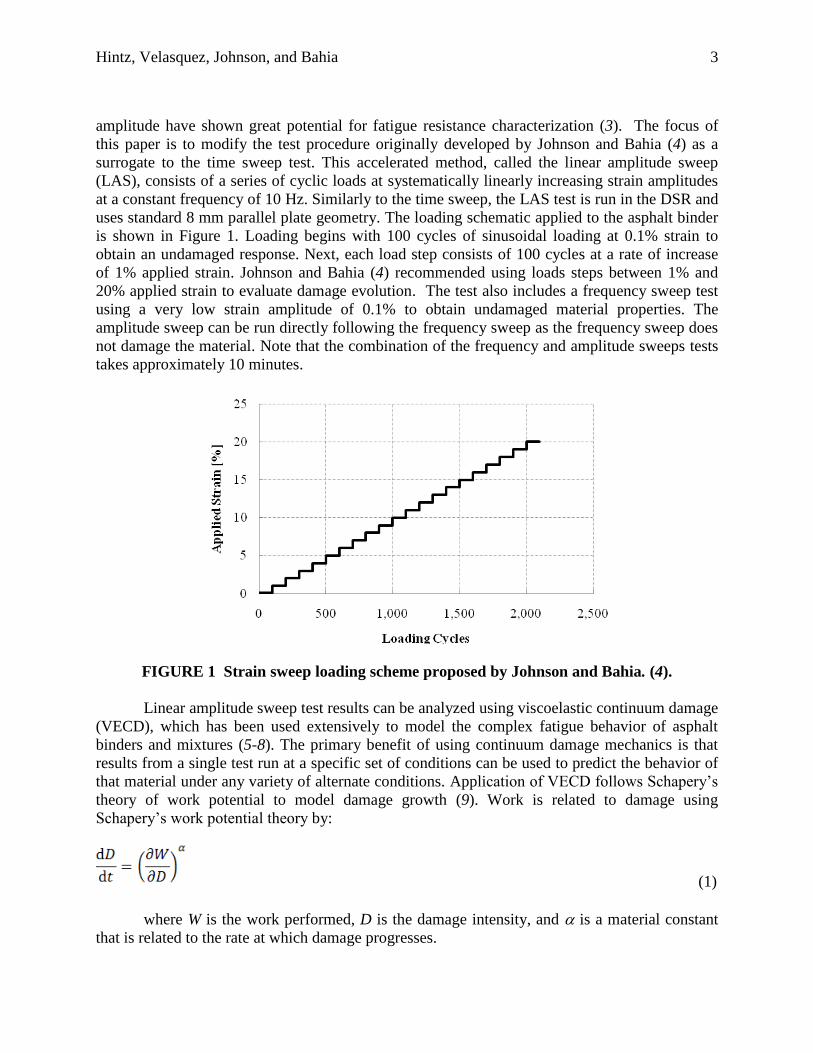
uses standard 8 mm parallel plate geometry. The loading schematic applied to the asphalt binder
is shown in Figure 1. Loading begins with 100 cycles of sinusoidal loading at 0.1% strain to
obtain an undamaged response. Next, each load step consists of 100 cycles at a rate of increase
of 1% applied strain. Johnson and Bahia (4) recommended using loads steps between 1% and
20% applied strain to evaluate damage evolution. The test also includes a frequency sweep test
using a very low strain amplitude of 0.1% to obtain undamaged material properties. The
amplitude sweep can be run directly following the frequency sweep as the frequency sweep does
not damage the material. Note that the combination of the frequency and amplitude sweeps tests
takes approximately 10 minutes.
FIGURE 1 Strain sweep loading scheme proposed by Johnson and Bahia. (4).
Linear amplitude sweep test results can be analyzed using viscoelastic continuum damage
(VECD), which has been used extensively to model the complex fatigue behavior of asphalt
binders and mixtures (5-8). The primary benefit of using continuum damage mechanics is that
results from a single test run at a specific set of conditions can be used to predict the behavior of
that material under any variety of alternate conditions. Application of VECD follows Schapery’s
theory of work potential to model damage growth (9). Work is related to damage using
Schapery’s work potential theory by:
(1)
where W is the work performed, D is the damage intensity, and is a material constant
that is related to the rate at which damage progresses.

Hintz, Velasquez, Johnson, and Bahia 4
The parameter α is taken to be 1 + 1/-m, where m is the slope a log-log plot of relaxation
modulus versus time. Johnson and Bahia. (4) proposed calculating m by converting frequency
sweep data to relaxation modulus using approximate inter-conversions presented by Schapery
and Park (10).
Quantification of work performed using dissipated energy follows Kim et al. (11).
Dissipated energy under strain controlled loading is calculated with:
(2)
where, W is dissipated energy, γ0 is shear strain, |G*| is the complex modulus, and is the
phase angle. Equation 2 can then be substituted in Equation 1 and numerically integrated to
arrive at the following equation to allow for calculation of damage intensity (D):
(3)
where ID is the initial un-damaged value of |G*|. Johnson and Bahia (4) proposed fitting
|G*|·sinversus damage to the following power law:
(4)
where C0, C1, and C2 are model coefficients. C0 can be taken as the average value of
|G*|·sinduring the 0.1% strain amplitude load step and C1 and C2 must be derived to best fit
experimental data. Determination of model coefficients using Equation 4 requires use of an
optimization tool such as Microsoft Excel's Solver to best match experimental data. After the
parameters C1 and C2 are known, the derivative of Equation 4 with respect to D can be
determined and substituted into Equation 1. Equation 1 can then be integrated to obtain the
following closed-form relation between number of cycles to failure and strain amplitude for a
defined failure criteria (3).
(5)
where k = 1 + (1 – C2);
f = loading frequency, Hz;
|G*| = undamaged complex shear modulus;
Df = damage accumulation at failure.
Simplification of Equation 5 can be accomplished to arrive at the basic form shown
below:
(6)
Hintz, Velasquez, Johnson, and Bahia 5
where,
(7) and
B = -2
The number of cycles to a given damage intensity can be calculated at any strain level
using (6). Thus, one can account for pavement structure and traffic loading by adjusting the
strain level in Equation (6).
While results of the linear amplitude sweep test are promising, there are important
concerns about the current testing and analysis protocols. In the proposed procedure, strains
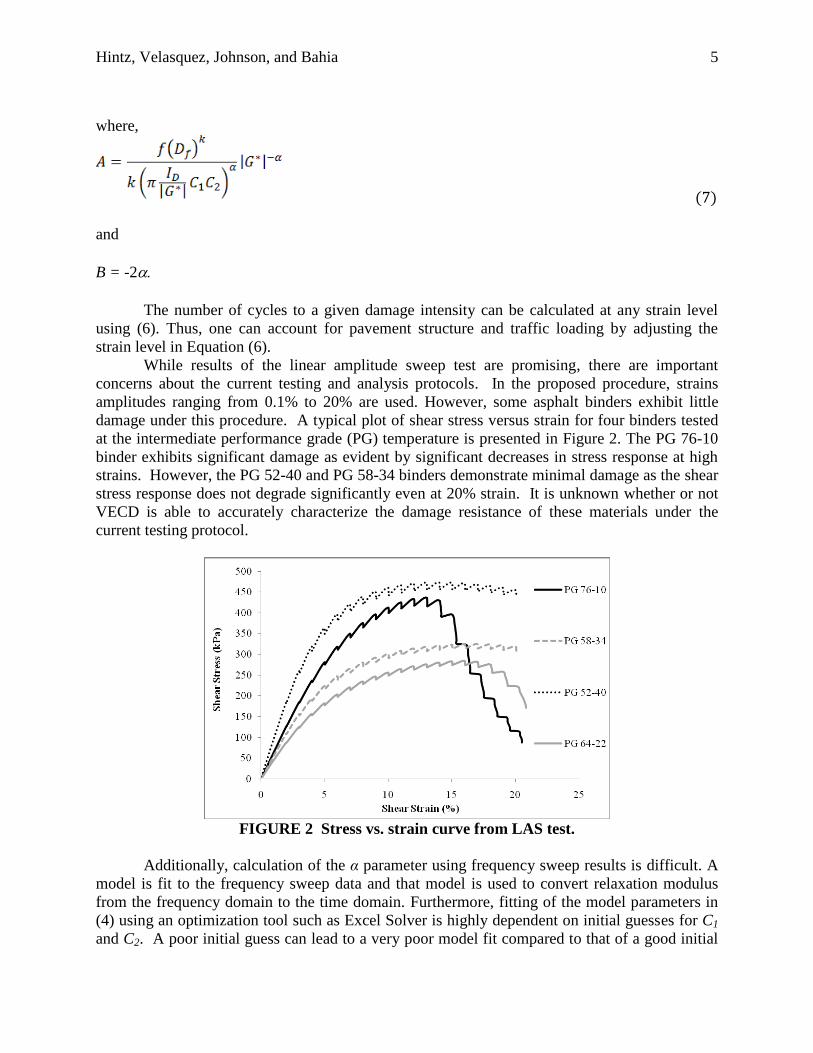
amplitudes ranging from 0.1% to 20% are used. However, some asphalt binders exhibit little
damage under this procedure. A typical plot of shear stress versus strain for four binders tested
at the intermediate performance grade (PG) temperature is presented in Figure 2. The PG 76-10
binder exhibits significant damage as evident by significant decreases in stress response at high
strains. However, the PG 52-40 and PG 58-34 binders demonstrate minimal damage as the shear
stress response does not degrade significantly even at 20% strain. It is unknown whether or not
VECD is able to accurately characterize the damage resistance of these materials under the
current testing protocol.
FIGURE 2 Stress vs. strain curve from LAS test.
Additionally, calculation of the α parameter using frequency sweep results is difficult. A
model is fit to the frequency sweep data and that model is used to convert relaxation modulus
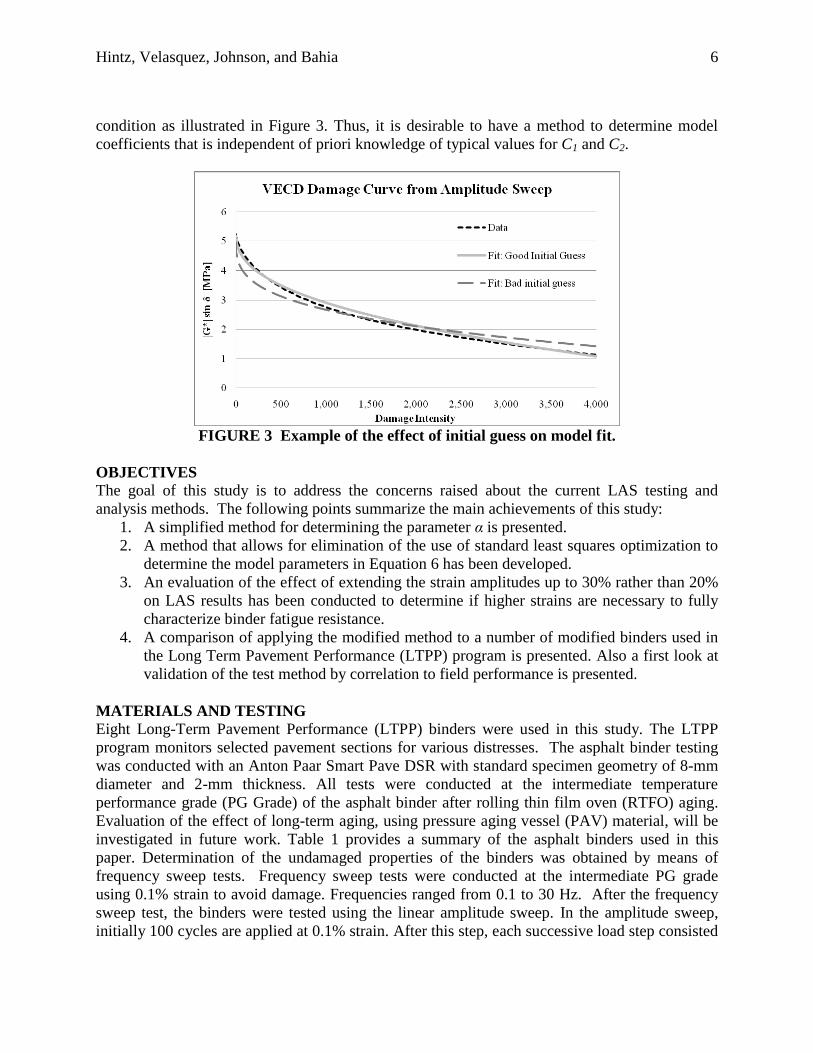
from the frequency domain to the time domain. Furthermore, fitting of the model parameters in
(4) using an optimization tool such as Excel Solver is highly dependent on initial guesses for C1
and C2. A poor initial guess can lead to a very poor model fit compared to that of a good initial
Hintz, Velasquez, Johnson, and Bahia 6
condition as illustrated in Figure 3. Thus, it is desirable to have a method to determine model
coefficients that is independent of priori knowledge of typical values for C1 and C2.
FIGURE 3 Example of the effect of initial guess on model fit.
OBJECTIVES
The goal of this study is to address the concerns raised about the current LAS testing and
analysis methods. The following points summarize the main achievements of this study:
1. A simplified method for determining the parameter α is presented.
2. A method that allows for elimination of the use of standard least squares optimization to
determine the model parameters in Equation 6 has been developed.
3. An evaluation of the effect of extending the strain amplitudes up to 30% rather than 20%
on LAS results has been conducted to determine if higher strains are necessary to fully
characterize binder fatigue resistance.
4. A comparison of applying the modified method to a number of modified binders used in
the Long Term Pavement Performance (LTPP) program is presented. Also a first look at
validation of the test method by correlation to field performance is presented.
MATERIALS AND TESTING
Eight Long-Term Pavement Performance (LTPP) binders were used in this study. The LTPP
program monitors selected pavement sections for various distresses. The asphalt binder testing
was conducted with an Anton Paar Smart Pave DSR with standard specimen geometry of 8-mm
diameter and 2-mm thickness. All tests were conducted at the intermediate temperature
performance grade (PG Grade) of the asphalt binder after rolling thin film oven (RTFO) aging.
Evaluation of the effect of long-term aging, using pressure aging vessel (PAV) material, will be
investigated in future work. Table 1 provides a summary of the asphalt binders used in this
paper. Determination of the undamaged properties of the binders was obtained by means of
frequency sweep tests. Frequency sweep tests were conducted at the intermediate PG grade
using 0.1% strain to avoid damage. Frequencies ranged from 0.1 to 30 Hz. After the frequency
sweep test, the binders were tested using the linear amplitude sweep. In the amplitude sweep,
initially 100 cycles are applied at 0.1% strain. After this step, each successive load step consisted

Hintz, Velasquez, Johnson, and Bahia 7
of 100 cycles at a rate of increase of 1% applied strain per step for 30 steps, starting at 1% and
ending at 30% applied strain. Generally, two replicates were run for each binder. However, if
results varied by more than 15%, a third replicate was run. Analysis of the results was used to
evaluate the proposed simplifications and changes to the LAS test.
TABLE 1 LTPP Binder Summary
*Measured distress is zero, but is listed as 0.01 for inclusion on logarithmic plot
SIMPLIFIED METHOD TO CALCULATE α As discussed previously, the damage exponent is calculated from undamaged rheological
properties using the slope of a log-log plot of relaxation modulus, G(t), versus time. This can be
accomplished in two ways: (a) by direct measurement of relaxation modulus from a stress
relaxation test or (b) by converting frequency sweep test data to the relaxation using approximate
methods developed by Schapery and Park (10). Note that all standard dynamic shear rheometers
are capable of conducting frequency sweep tests. This paper proposes a method to obtain from
frequency sweep test data.
The original method converts the data from the frequency to the time domain. Storage
moduli (G'(ω)) at each angular frequency (ω) must be calculated using complex modulus and
phase angle as follows:
(8)
The slope (n) of a log-log plot of G’() versus plot must be calculated at each
frequency as follows:
(9)
The parameter ’ can be calculated for each value n using:
(10)
Sample PG Test Temperature
(°C)
Pavement
Thickness (in)
Fatigue
Cracking (m2)
04-B901 76-10 37 10.7 328.0
09-0902 64-28 22 7.2 0.01*
34-0961 78-28 28 6.4 178.8
37-0962 76-22 31 8.5 0.01*
09-0961 58-34 16 6.9 2.1
34-0901 64-22 25 5.6 49.5
89-A902 52-40 10 4.9 6.7
35-0902 64-22 25 10.8 32.0
Hintz, Velasquez, Johnson, and Bahia 8
where is the gamma function, Γ(x) = (x − 1)!. After ’ is calculated for each frequency,
complex moduli as a function of frequency can be converted to relaxation moduli as a function
of time using Equation 11. The time corresponding to a given frequency are calculated as 1/ω.
(11)
Adding to the complexity of the conversion to relaxation, typically a model must be fit to
frequency sweep data prior to conversion to allow for prediction of the response at frequencies
outside of the testing range. Frequencies in the range of 0.1 Hz to 30 Hz correspond to relaxation
times ranging from approximately 0.005 to 1.59 sec using the presented inter-conversion
method. Hence, direct measurements only allow for calculation of a small range of relaxation
times, and therefore predictions of complex moduli and phase angles at additional frequencies
are advantageous in order to obtain relaxation moduli over a reasonable time span.
The conversion of frequency sweep data relaxation is largely based on the relationship
between storage modulus and frequency. Johnson (12) demonstrated that the slope of a log-log
plot of storage modulus versus frequency can be used to calculate α. Unlike the slope of the log
of relaxation modulus and log of time, the slope of a log-log plot of storage modulus versus
frequency is positive. However, the magnitude of this slope is nearly identical to the log-log plot
of the relaxation modulus versus time. Thus, α can be calculated as 1+1/m where m is the slope
of the log storage modulus versus log frequency curve. Johnson (12) concluded that for four
binders, the method for calculating α was insignificant on the resulting fatigue law parameter A
in (6) based on an analysis of variance (ANOVA). In this study, a different approach was taken
to determine if the α's calculated from relaxation modulus versus time and storage modulus
versus frequency are statistically equivalent.
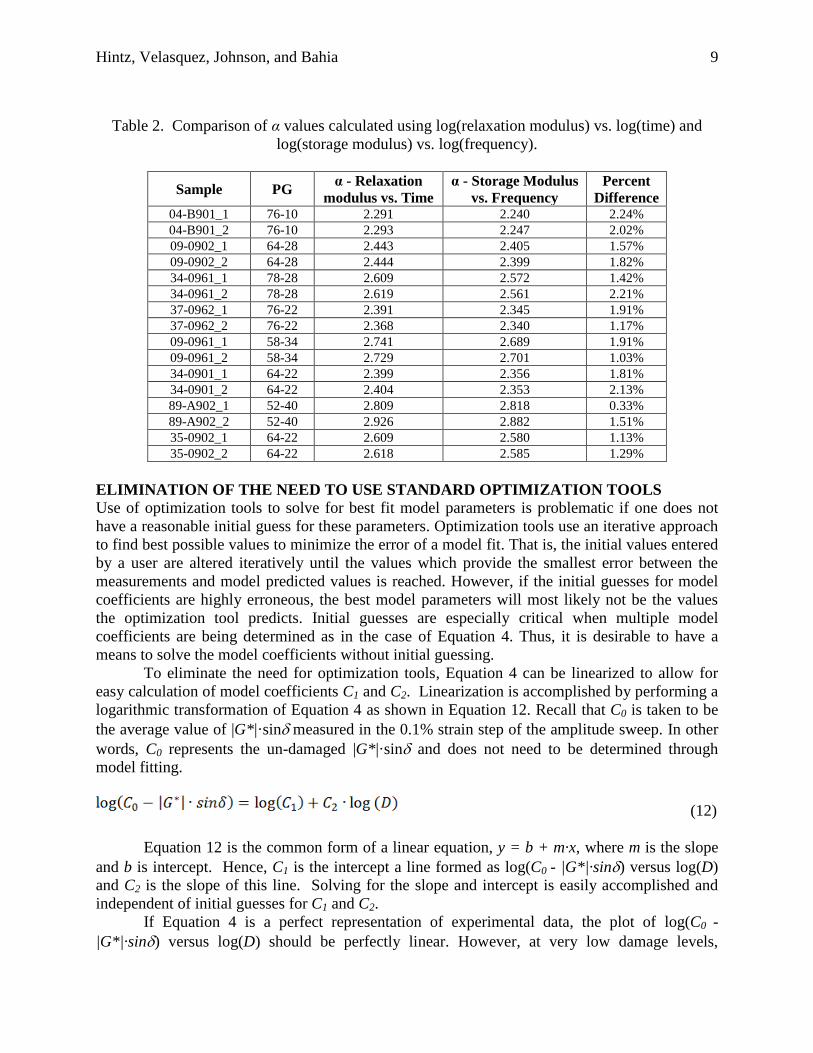
For the eight binders tested, α was determined using both methods. Two tests were run on
each binder. The α values calculated using log (relaxation modulus) versus log (time) and log
(storage modulus) versus log (frequency) are shown in Table 2. The maximum discrepancy in α
between the two methods is 2.24%. Thus, observation of individual values provides evidence
that the two calculation methods result in very similar α values.
To further evaluate if the two methods result in the same α values, a test of hypothesis of
the means of α estimated using the two methods was conducted. A t-statistic was used to test the
hypothesis that the two -means are statistically equal. That is, H0: µ1 = µ2 against H1: µ1≠µ2.
The underlying assumption of conducting the hypothesis test is that the samples are normally
distributed. Normality plots of α for both computation methods indicated that the samples are
normally distributed. The resulting test statistic, t0, computed using the two sample distributions
was 0.195 and the t-statistic using a significance level of 95% was 2.042. Since the test statistic
is in the acceptance region. The null hypothesis can not be rejected and therefore the α's
computed using the two methods are equivalent.
Hintz, Velasquez, Johnson, and Bahia 9
Table 2. Comparison of α values calculated using log(relaxation modulus) vs. log(time) and
log(storage modulus) vs. log(frequency).
Sample PG α - Relaxation
modulus vs. Time
α - Storage Modulus
vs. Frequency
Percent
Difference 04-B901_1 76-10 2.291 2.240 2.24%
04-B901_2 76-10 2.293 2.247 2.02%
09-0902_1 64-28 2.443 2.405 1.57%
09-0902_2 64-28 2.444 2.399 1.82%
34-0961_1 78-28 2.609 2.572 1.42%
34-0961_2 78-28 2.619 2.561 2.21%
37-0962_1 76-22 2.391 2.345 1.91%
37-0962_2 76-22 2.368 2.340 1.17%
09-0961_1 58-34 2.741 2.689 1.91%
09-0961_2 58-34 2.729 2.701 1.03%
34-0901_1 64-22 2.399 2.356 1.81%
34-0901_2 64-22 2.404 2.353 2.13%
89-A902_1 52-40 2.809 2.818 0.33%
89-A902_2 52-40 2.926 2.882 1.51%
35-0902_1 64-22 2.609 2.580 1.13%
35-0902_2 64-22 2.618 2.585 1.29%
ELIMINATION OF THE NEED TO USE STANDARD OPTIMIZATION TOOLS
Use of optimization tools to solve for best fit model parameters is problematic if one does not
have a reasonable initial guess for these parameters. Optimization tools use an iterative approach
to find best possible values to minimize the error of a model fit. That is, the initial values entered
by a user are altered iteratively until the values which provide the smallest error between the
measurements and model predicted values is reached. However, if the initial guesses for model
coefficients are highly erroneous, the best model parameters will most likely not be the values
the optimization tool predicts. Initial guesses are especially critical when multiple model
coefficients are being determined as in the case of Equation 4. Thus, it is desirable to have a
means to solve the model coefficients without initial guessing.
To eliminate the need for optimization tools, Equation 4 can be linearized to allow for
easy calculation of model coefficients C1 and C2. Linearization is accomplished by performing a
logarithmic transformation of Equation 4 as shown in Equation 12. Recall that C0 is taken to be
the average value of |G*|·sinmeasured in the 0.1% strain step of the amplitude sweep. In other
words, C0 represents the un-damaged |G*|·sin and does not need to be determined through
model fitting.
(12)
Equation 12 is the common form of a linear equation, y = b + m·x, where m is the slope
and b is intercept. Hence, C1 is the intercept a line formed as log(C0 - |G*|·sin) versus log(D)
and C2 is the slope of this line. Solving for the slope and intercept is easily accomplished and
independent of initial guesses for C1 and C2.
If Equation 4 is a perfect representation of experimental data, the plot of log(C0 -
|G*|·sin) versus log(D) should be perfectly linear. However, at very low damage levels,

Hintz, Velasquez, Johnson, and Bahia 10
experimental data exhibits nonlinear trend. The plot of log(C0 - |G*|·sin) versus log(D) for a
typical binder is shown in Figure 4. If data at damages below 100 are ignored, the linear fit is
greatly improved as evidence by Figure 5. Thus, if C1 and C2 are determined using data
corresponding to damage levels above 100, an adequate model fit is attained.
FIGURE 4 Linear fit of log(C0 - |G*|·sin) versus log(D) including all experimental data.
FIGURE 5 Linear fit of log(C0 - |G*|·sin) versus log(D) excluding damages below 100.
Both Excel Solver and the linearization method were used to determine C1 and C2 for the
eight asphalt binders tested using all strains, (i.e. up to 30%). The fatigue law parameter A in
Hintz, Velasquez, Johnson, and Bahia 11
Equation (6) obtained using the two methods were compared. For this analysis, A was chosen to
be defined using the damage intensity corresponding to a 35% decrease from the initial |G*|·sin
as recommended by Johnson and Bahia. (4). Therefore, in the proceeding analyses, A will be
noted as A35. The fatigue law parameter B only depends on α and therefore is independent of the
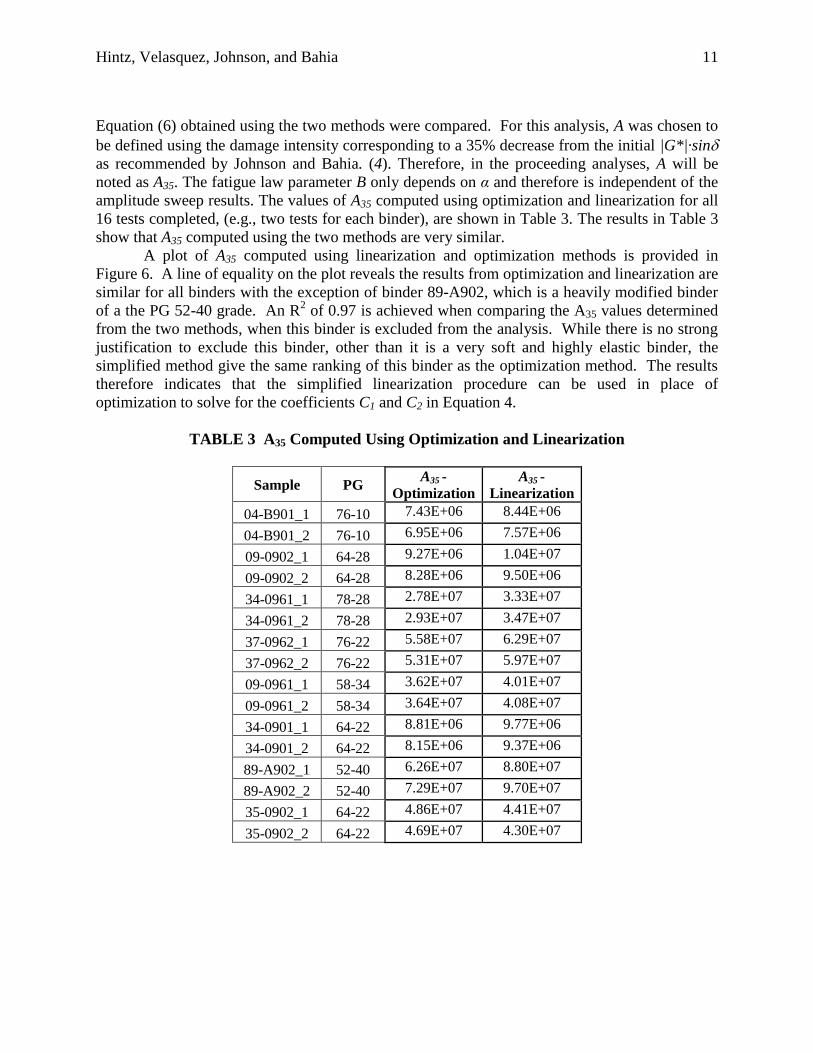
amplitude sweep results. The values of A35 computed using optimization and linearization for all
16 tests completed, (e.g., two tests for each binder), are shown in Table 3. The results in Table 3
show that A35 computed using the two methods are very similar.
A plot of A35 computed using linearization and optimization methods is provided in
Figure 6. A line of equality on the plot reveals the results from optimization and linearization are
similar for all binders with the exception of binder 89-A902, which is a heavily modified binder
of a the PG 52-40 grade. An R2 of 0.97 is achieved when comparing the A35 values determined
from the two methods, when this binder is excluded from the analysis. While there is no strong
justification to exclude this binder, other than it is a very soft and highly elastic binder, the
simplified method give the same ranking of this binder as the optimization method. The results
therefore indicates that the simplified linearization procedure can be used in place of
optimization to solve for the coefficients C1 and C2 in Equation 4.
TABLE 3 A35 Computed Using Optimization and Linearization
Sample PG A35 -
Optimization A35 -
Linearization
04-B901_1 76-10 7.43E+06 8.44E+06
04-B901_2 76-10 6.95E+06 7.57E+06
09-0902_1 64-28 9.27E+06 1.04E+07
09-0902_2 64-28 8.28E+06 9.50E+06
34-0961_1 78-28 2.78E+07 3.33E+07
34-0961_2 78-28 2.93E+07 3.47E+07
37-0962_1 76-22 5.58E+07 6.29E+07
37-0962_2 76-22 5.31E+07 5.97E+07
09-0961_1 58-34 3.62E+07 4.01E+07
09-0961_2 58-34 3.64E+07 4.08E+07
34-0901_1 64-22 8.81E+06 9.77E+06
34-0901_2 64-22 8.15E+06 9.37E+06
89-A902_1 52-40 6.26E+07 8.80E+07
89-A902_2 52-40 7.29E+07 9.70E+07
35-0902_1 64-22 4.86E+07 4.41E+07
35-0902_2 64-22 4.69E+07 4.30E+07

Hintz, Velasquez, Johnson, and Bahia 12
FIGURE 6 Comparison of A35 computed using different methods to derive power law
coefficients to model |G*|·sinversus D curve.
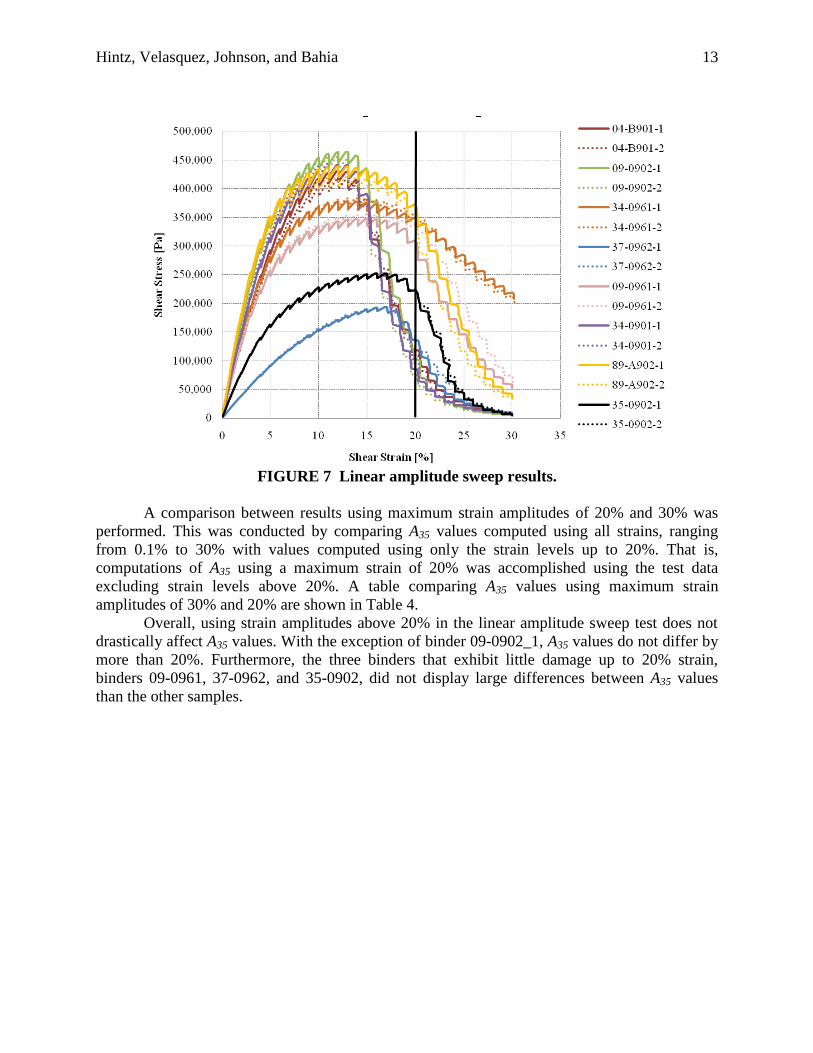
EFFECT OF USING HIGHER STRAINS ON LAS RESULTS
Figure 7 shows stress-strain curves for the binders tested using the linear amplitude sweep
procedure. It can be observed in Figure 7 that some of the binders (09-0961, 37-0962, and 35-
0902), do not exhibit significant decreases in stress at 20% strain in the LAS test which could
result in poor prediction of damage. However, all binders display a considerable reduction in
stress when additional higher strain amplitudes are applied. The following analysis determines if
strains in excess of 20% are needed better characterization of damage behavior .
Hintz, Velasquez, Johnson, and Bahia 13
FIGURE 7 Linear amplitude sweep results.
A comparison between results using maximum strain amplitudes of 20% and 30% was
performed. This was conducted by comparing A35 values computed using all strains, ranging
from 0.1% to 30% with values computed using only the strain levels up to 20%. That is,
computations of A35 using a maximum strain of 20% was accomplished using the test data
excluding strain levels above 20%. A table comparing A35 values using maximum strain
amplitudes of 30% and 20% are shown in Table 4.
Overall, using strain amplitudes above 20% in the linear amplitude sweep test does not
drastically affect A35 values. With the exception of binder 09-0902_1, A35 values do not differ by
more than 20%. Furthermore, the three binders that exhibit little damage up to 20% strain,
binders 09-0961, 37-0962, and 35-0902, did not display large differences between A35 values
than the other samples.
Hintz, Velasquez, Johnson, and Bahia 14
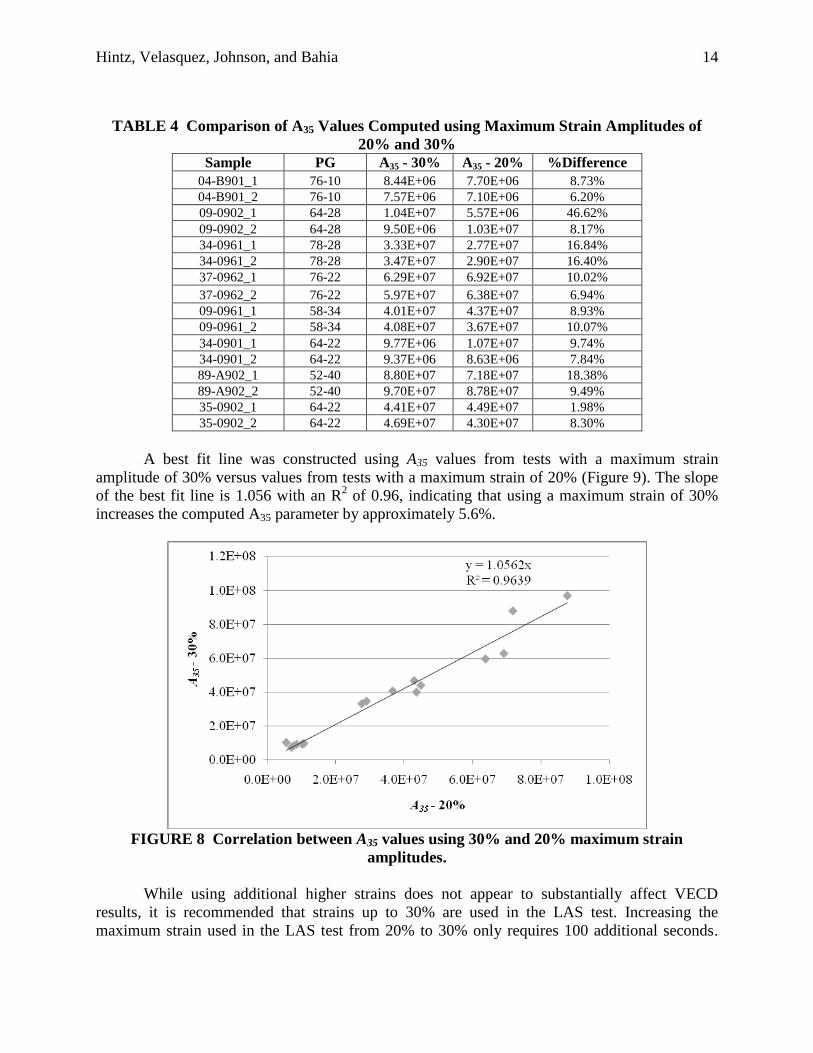
TABLE 4 Comparison of A35 Values Computed using Maximum Strain Amplitudes of
20% and 30%
Sample PG A35 - 30% A35 - 20% %Difference
04-B901_1 76-10 8.44E+06 7.70E+06 8.73%
04-B901_2 76-10 7.57E+06 7.10E+06 6.20%
09-0902_1 64-28 1.04E+07 5.57E+06 46.62%
09-0902_2 64-28 9.50E+06 1.03E+07 8.17%
34-0961_1 78-28 3.33E+07 2.77E+07 16.84%
34-0961_2 78-28 3.47E+07 2.90E+07 16.40%
37-0962_1 76-22 6.29E+07 6.92E+07 10.02%
37-0962_2 76-22 5.97E+07 6.38E+07 6.94%
09-0961_1 58-34 4.01E+07 4.37E+07 8.93%
09-0961_2 58-34 4.08E+07 3.67E+07 10.07%
34-0901_1 64-22 9.77E+06 1.07E+07 9.74%
34-0901_2 64-22 9.37E+06 8.63E+06 7.84%
89-A902_1 52-40 8.80E+07 7.18E+07 18.38%
89-A902_2 52-40 9.70E+07 8.78E+07 9.49%
35-0902_1 64-22 4.41E+07 4.49E+07 1.98%
35-0902_2 64-22 4.69E+07 4.30E+07 8.30%
A best fit line was constructed using A35 values from tests with a maximum strain
amplitude of 30% versus values from tests with a maximum strain of 20% (Figure 9). The slope
of the best fit line is 1.056 with an R2 of 0.96, indicating that using a maximum strain of 30%
increases the computed A35 parameter by approximately 5.6%.
FIGURE 8 Correlation between A35 values using 30% and 20% maximum strain
amplitudes.
While using additional higher strains does not appear to substantially affect VECD
results, it is recommended that strains up to 30% are used in the LAS test. Increasing the
maximum strain used in the LAS test from 20% to 30% only requires 100 additional seconds.

Hintz, Velasquez, Johnson, and Bahia 15
Testing the binders up to a level of = 30% leads to a significant degradation of material integrity
and is thought to be the best representation of fatigue damage behavior.
Correlation of LAS Results with Fatigue Performance of LTPP Sections
The United States Long-Term Pavement Performance (LTPP) program maintains records of the
pavement distress on select sections of interstate highways. The asphalt binders used in this
study are included in several of these pavement sections. The pavement distress indicator used
by LTPP for fatigue cracking is cracked area per 500 meters of pavement length section. Linear
amplitude sweep results from this study were compared with measured fatigue cracking. Due to
the fact that pavement thickness greatly affects the strains at the bottom of the pavements where
fatigue cracking initiates, LTPP cracked area measurements were normalized by pavement
thicknesses. Cracked areas normalized by pavement thickness were plotted against number of
cycles to failure predictions at 4% strain using LAS results. With the exception of binder 09-
0902, the LAS results correlated well with field measurements as shown in Figure 9. This
provides promising evidence that the LAS test is capable of measuring asphalt binder
contribution to mixture fatigue.
FIGURE 9 Fatigue cracking from LTPP measurements compared to the LAS number of
cycles to failure.
CONCLUSIONS
Based on the experimental results presented in this paper, the following conclusions can be
drawn:
A simplified method that avoids the use of inter-conversion methods for the calculation
of the α parameter needed in the VECD analysis was successfully implemented.
Viscoelastic Continuum Damage (VECD) coefficients can be easily obtained by applying
a logarithmic transformation to the damage curves. The use of this linearization technique
Hintz, Velasquez, Johnson, and Bahia 16
eliminates the need of optimization tools that required initial guesses for estimation of the
model coefficients.
It is recommended to modify the current Linear Amplitude Sweep procedure to include
strains ranging from 0.1% to 30% due to the fact that significant material degradation is
achieved for strain levels above 20%. Moreover, testing time only increases by 100
seconds with respect to the current procedure.
VECD analysis of LAS test results yields promising correlations between accelerated
binder fatigue life and measured cracking in actual pavements constructed as part of the
LTPP program. It is believed that method could be further improved by investigating a
method to separate non-linearity from damage accumulation to more accurately predict
fatigue lives will be investigated. Accounting for non-linearity could possibly delineate
results from tests using strain amplitudes ranging from 0.1% to 20% and tests including
strains exceeding 20%.
ACKNOWLEDGEMENTS
This research was sponsored by the Asphalt Research Consortium (ARC), which is funded by
the United States' Federal Highway Administration (FHWA). This support is greatly appreciated.
REFERENCES
1. Bahia, H. U., Hanson, D. I., Zeng, M., Zhai, H., Khatri, M. A., and R.M. Anderson.
Characterization of Modified Asphalt Binders in Superpave Mix Design, NCHRP Report
459, National Academy Press, Washington, D.C., 2001.
2. Bahia, H. U., Zhai, H., Zeng, M., Hu, Y., and P. Turner. Development of Binder
Specification Parameters Based on Characterization of Damage Behavior. Journal of the
Association of Asphalt Paving Technologists, Vol. 70, 2002, pp. 442-470.
3. Maratono, W. and H.U. Bahia. Developing a Surrogate Test for Fatigue of Asphalt
Binders. Proceedings from the 87th Annual Meeting of the Transportation Research
Board. (2008).
4. Johnson, C.M. and H.U. Bahia. Evaluation of an Accelerated Procedure for Fatigue
Characterization of Asphalt Binders. Submitted for publication in Road Materials and
Pavement Design. 2010.
5. Kim, Y.R., and D. N. Little. One-Dimensional Constitutive Modeling of Asphalt
Concrete. Journal of Engineering Mechanics, Vol. 116, No. 4, 1990, pp. 751--772.
6. Park, S. W., Y.R. Kim, and R.A. Schapery. A Viscoelastic Continuum Damage Model
and Its Application to the Uniaxial Behavior of Asphalt Concrete. Mechanics of
Materials, Vol. 24, 1996, pp. 195-223.
Hintz, Velasquez, Johnson, and Bahia 17
7. Chirstensen, D.W. and R.F. Bonaquist. Practical Application of Continuum Damage
Theory to Fatigue Phenomena in Asphalt Concrete Mixtures. Journal of the Association
of Asphalt Paving Technologists, Vol. 74, 2005, pp. 963-1002.
8. Kutay, M.E., N.H. Gibson, and J. Youtcheff. Conventional and Viscoelastic Continuum
Damage (VECD) Based Fatigue Analysis of Polymer Modified Asphalt Pavements.
Journal of the Association of Asphalt Paving Technologists, Vol. 77, 2008, pp. 395-434.
9. Schapery, R. A. Correspondence principles and a Generalized J Integral for Large
Deformation and Fracture Analysis of Viscoelasic Media. International Journal of
Fracture, Vol. 25, No. 3, 2984, pp. 195-223.
10. Schapery, R. A., and Park, S. W. Methods of Interconversion Between Linear
Viscoelastic Material Functions - Part II: An Approximate Analytical Method.
International Journal of Solids & Structures, Vol. 36, 1999, pp. 1677-1699.
11. Kim, Y., Lee, H. J., Little, D. N., and Y.R. Kim. A Simple Testing Method to Evaluate
Fatigue Fracture and Damage Performance of Asphalt Mixtures. Journal of the
Association of Asphalt Paving Technologists, Vol. 75, 2006, pp. 755-788.
12. Johnson, C.M. Estimating Asphalt Binder Fatigue Resistance using an Accelerated Test
Method. Ph.D Thesis. University of Wisconsin - Madison, Madison, 2010.