modular green roof retro-fit system development … · the shingle creek watershed in hennepin...
TRANSCRIPT

WENCK File #1240-117 August 2015
Prepared for:
Shingle Creek Watershed Management Commission
Minnesota Pollution Control Agency
3235 Fernbrook Lane Plymouth, MN 55447 shinglecreek.org 520 Lafayette Road North St. Paul, MN 55155-4194 pca.state.mn.us
Modular Green Roof Retro-fit System Development Research
Study Final Report

Acknowledgments
Funding for this project was provided by the Minnesota Pollution Control Agency through a grant from the United States Environmental Protection Agency, Section 319 Nonpoint Source Management Fund, and by the Shingle Creek Watershed Management Organization. Additional support was provided by the City of Robbinsdale, Minnesota and the Three Rivers Park District.
Ed Matthiesen, P.E., Wenck Associates, Project Engineer and Principle Investigator Diane Spector, Wenck Associates, Project Scientist Lucius Jonett, PLA, Wenck Associates, Project Landscape Designer Susan Nelson, Wenck Associates, Designer Richard McCoy, P.E., Robbinsdale, Minnesota, Public Works Director/City Engineer John Barten, Thre Rivers Park District, Director of Natural Resources For more information: [email protected] [email protected] [email protected]
Prepared by:
WENCK Associates,
Inc.
7500 Olson Memorial
Highway
Suite 300
Golden Valley, MN 55427
Phone: 763-252-6800
1-1
Table of Contents
1.0 SUMMARY .......................................................................................................................................... 1-3
2.0 BENCH TESTING ............................................................................................................................. 2-1
2.1 Evaluation of Growing Media .............................................................................................. 2-1
3.0 FIELD TESTING ............................................................................................................................... 3-1
3.1 Field Testing and Evaluation of Growing Media ........................................................... 3-1
3.2 Installation ................................................................................................................................. 3-3
3.3 Monitoring Results .................................................................................................................. 3-5
3.3.1 Moisture Retention ................................................................................................. 3-5
3.3.2 Plant Robustness .................................................................................................... 3-9
4.0 CONCLUSIONS ................................................................................................................................ 4-1
4.1 Bench Testing ........................................................................................................................... 4-1
4.2 Field Testing .............................................................................................................................. 4-1
4.3 Cost ............................................................................................................................................... 4-1
4.4 Installation Guidance ............................................................................................................. 4-2
APPENDIX A Monitoring data
TABLES
Table 2.1. Planting media mixes. .................................................................................................................. 2-2
Table 2.2. Planting media weights and holding capacities. ................................................................. 2-4
Table 2.3. Planting media mix variations 6-a and 7-a. ......................................................................... 2-4
Table 2.4. Planting media 6-a and 7-a weights and holding capacities. ........................................ 2-5
Table 2.5. Duration of moisture retention in the planting media mixes. ....................................... 2-5
Table 4.1. Estimated cost of do-it-yourself modules. ............................................................................ 4-2
FIGURES
Figure 2.1. PVC pipe cylinder with mesh bottom used in bench testing. ....................................... 2-3
Figure 2.2. Draining the cylinders filled with saturated planting mixes. ........................................ 2-3
Figure 2.3. Water retention of selected containers. ............................................................................... 2-6
Figure 3.1. Tray filled with a planting mix and Sedum seedlings. .................................................... 3-1
Figure 3.2. Erosion control fabric protecting the light-weight planting mix. ................................ 3-2
Figure 3.3. Planted trays on an enclosed asphalt parking lot. ........................................................... 3-2
Figure 3.4. Tray Series 10 on May 7, 2013. .............................................................................................. 3-3
Figure 3.5. Tray Series 10 on June 13, 2013. .......................................................................................... 3-3
Figure 3.6. Installation at the Robbinsdale (L) and Brooklyn Park sites (R). ............................... 3-4
Figure 3.7. Final layout at Robbinsdale site, June 14, 2013. .............................................................. 3-4
Figure 3.8. Final layout at Brooklyn Park site, June 18, 2013. .......................................................... 3-5
Figure 3.9. Final layout at Maple Plain site, July 15, 2013. ................................................................. 3-5
Figure 3.10. Brooklyn Park location 2013 best moisture group. ....................................................... 3-6
Figure 3.11. Brooklyn Park site 2014 best moisture group. ............................................................... 3-6
Figure 3.12. Robbinsdale location 2013 best moisture group. ........................................................... 3-7

1-2
Figure 3.13. Robbinsdale location 2014 best moisture group. ........................................................... 3-7
Figure 3.14. Maple Plain location 2013 best moisture. ......................................................................... 3-8
Figure 3.15. Maple Plain location 2014 best moisture. ......................................................................... 3-8
Figure 3.16. Maple Plain location plant growth comparison. .............................................................. 3-9
Figure 3.17. Brooklyn Park location plant growth comparison. ....................................................... 3-10
Figure 3.18. Robbinsdale location plant growth comparison. ........................................................... 3-11

1-3
1.0 Summary
The Shingle Creek watershed in Hennepin County is highly urbanized, with thirteen nutrient-
impaired lakes and two streams – Bass and Shingle Creeks – impaired for dissolved oxygen,
impaired biota, bacteria and chloride. TMDLs for the impairments in the watershed have
been completed and all call for reducing pollutant loading and runoff volume to the impaired
waters.
Runoff from impervious surfaces conveys nutrients, sediment, bacteria and other pollutants
to the receiving waters. Urban rooftop drainage is very often directly connected to drainage
systems, and can contribute 15-20 percent of total annual runoff from an urbanized
watershed. Green roofs are a BMP increasing in popularity, but they can be expensive and
are difficult to retrofit when existing roofs have little additional load bearing capacity.
The objective of this project was to develop and test several versions of a do-it-yourself
light-weight, portable, modular system of soil media and plants that could be constructed
and installed by non-professionals on existing rooftops to catch and retain precipitation that
would otherwise be converted to urban runoff. The modules would be suitable for
installation on existing roofs without the need for supplemental structural reinforcement,
membrane installation to combat leakage, or intensive maintenance such as supplemental
irrigation.
GOALS:
1. Develop and test a light-weight, portable, modular system of soil media and plants
that can be installed as a green roof by non-professionals on existing roof-tops.
2. Customize the applications of the modular green roof system to cold weather
climates like that of Minnesota.
3. Identify local retail sources of materials for modular green roof components and
provide guidance for cost-estimation of site-specific installations.
4. Develop guidance for design and assembly/installation of the modular green roof
system.
This project was completed between 2012 and 2015, and included three phases. The first
was a bench test to evaluate several planting mixes for moisture-retaining capacity and dry
and wet weight. The second, field test was completed over three growing seasons. Various
planting mixes were added to plastic garden trays and planted with Sedum. These trays
were placed on a parking lot from June 2012 to June 2013, subjected to various watering
regimes, and intensively monitored and weighed. From June 2013 to June 2015 the trays
were placed on test rooftops at three locations in the Twin Cities Metro Area. Soil moisture
was periodically monitored and supplemental watering was provided when it fell below a
threshold. Plant growth and robustness was noted. The trays remain in place as of August
2015 for continued observation, although no additional monitoring is taking place.
The results of this study were used to develop a brochure guiding do-it-yourselfers through
the process of designing, assembling, planting, and maintaining their own modular green
roofs. While there are now modular systems available commercially, those are generally not
planted with local-hardy plants, have a higher wet-weight load, and can be double the cost
of constructing and planting your own.

2-1
2.0 Bench Testing
The initial testing phase was to determine suitable combinations of light-weight growing
media that minimize the bulk weight of the plant growing media, maximize water-holding
capacity to facilitate storage and eventual loss through evapotranspiration, and support
healthy plant growth. This bench testing was completed in summer 2012 at the Wenck
Associates, Inc. office lab in Maple Plain, Minnesota.
2.1 EVALUATION OF GROWING MEDIA
Six materials that are commonly available at local garden supply retailers were selected for
the bench testing based on their properties of weight, water retention and benefit to plant
growth.
Perlite Lightweight, inorganic, porous aggregate used in potting soils that
helps prevent soil compaction, increasing aeration of the soil. Perlite
has low water retention.
Vermiculite Lightweight, highly water-absorbent, inorganic material that can be
used as a soilless growing media. Its inclusion in a planting mixture
helps retain air, nutrients and moisture.
Biochar Organic soil amendment created by pyrolysis (heating biomass in the
absence, or under reduction, of oxygen) that is rich in carbon and can
endure in soil for hundreds of years. Biochar increases soil fertility,
raises productivity and has a unique ability for attracting and holding
moisture and nutrients.
Organic Compost Compost generated through the microbial decay process that is
typically used to amend planting media. Organic compost adds
nutrients to the soil to support plant growth and helps retain
moisture.
Earthworm Castings Organic compost generated through the use of worms to breakdown
biomass into a nutrient rich organic fertilizer and soil conditioner in a
form that is further refined than organic compost and more easily
absorbed by plants..
Hydrogel Inorganic, super-absorbent polymer capable of holding quantities of
water multiple times heavier than the polymer itself. Hydrogel
releases the water as the planting soil dries out, significantly reducing
water depletion and improving plant survival and growth without
increasing irrigation and maintenance.
Eleven different planting media mixes were created with varying amounts of the six
materials as shown in Table 2.1. The primary variation was different ratios of organic to
inorganic content, with the secondary variable being the different quantities of materials
used to meet the selected organic/inorganic ratios. The intent was to see if there was a
correlation between organic content and water holding capacity. During live plant testing
performance of plant growth would be monitored for effects from lower organic
compositions.

2-2
Table 2.1. Planting media mixes. Soil
Mix #
Perlite (cups)
Vermiculite (cups)
Compost (cups)
BioChar (cups)
Earthworm
Casting (cups)
Hydrogel (tsp)
Organic Composition
1 5.5 5.5 1.1 1.1 0.5 ~1 80% inorganic
20% organic
2 8.33 2.75 1.1 1.1 0.5 ~1 80% inorganic
20% organic
3 10.0 1.1 1.1 1.1 0.5 ~1 80% inorganic
20% organic
4 2.75 8.33 1.1 1.1 0.5 ~1 80% inorganic
20% organic
5 1.1 10.0 1.1 1.1 0.5 ~1 80% inorganic
20% organic
6 5.9 5.9 0.83 0.83 0.41 ~1 85% inorganic
15% organic
7 6.6 6.6 0.27 0.27 0.14 ~1 95% inorganic
5% organic
8 8.9 3.0 0.83 0.83 0.41 ~1 85% inorganic
15% organic
9 10.0 3.33 0.27 0.27 0.14 ~1 95% inorganic
5% organic
10 3.0 8.9 0.83 0.83 0.41 ~1 85% inorganic
15% organic
11 3.33 10.0 0.27 0.27 0.14 ~1 95% inorganic
5% organic
During bench testing dry weight, wet weight and water retention capacity for each mix were
assessed using in custom containers that were easy to weigh and allowed water drainage
without losing media mix. A 14 foot long, 8 inch diameter PVC municipal water main pipe
was cut into 11 separate tubes ranging from 5 inches long to 8 inches long. Sun Guard 90
window screening was cut into pieces sized to cover one end of the PVC pipe section and
snugly fastened on with Gorilla brand tape (Figure 2.1). Each container was labeled with a
number from 1 to 11 and the corresponding planting media mix was placed inside.
Each container and its unique planting media mix were weighed for dry weight; volume of
soil mix ranged from 13.7-14.0 cups. The heaviest was mixture 2 at 25.8 ounces and the
lightest was 7 at 13.4 ounces. As the amount of inorganic material was increased, the
amount of organic material was decreased and the weight of the mixture decreased. The
organic component had a higher contribution to the soil mixture weight.
Each container was saturated with water and then covered/sprayed with water until the
water was draining through the screen at a steady flow. The containers were left to drain
until no more water left the container and then weighed for their wet weight to determine
the water holding capacity of each soil mix (Figure 2.2). The samples were allowed to dry
overnight before being saturated and weighed again. That process was repeated twice, to
give three measurements. The results and average amounts of water held by each planting
media mix are shown in Table 2.2.

2-3
Figure 2.1. PVC pipe cylinder with mesh bottom used in bench testing.
Figure 2.2. Draining the cylinders filled with saturated planting mixes.

2-4
Table 2.2. Planting media weights and holding capacities.
Contain
er
Soil Mix
Dry
Weight
(oz.)
Test #1
Water
Capacity
(oz.)
Test #2
Water
Capacity
(oz.)
Test #3
Water
Capacity
(oz.)
Water
Capacity to
Dry Weight
Ratio
1 22.3 30.8 43.4 43.6 1.96
2 25.8 30.6 40.5 42.6 1.65
3 25.7 31.2 39.8 40.7 1.58
4 23.1 28.5 41.3 44.1 1.91
5 22.5 30.1 42.7 45.6 2.03
6 20.0 29.2 43.8 44.0 2.20
7 13.4 34.2 48.2 49.1 3.66
8 20.5 35.4 46.9 46.8 2.28
9 13.6 32.5 45.5 45.5 3.35
10 18.4 31.1 42.7 43.2 2.35
11 13.9 32.5 47.6 49.3 3.55
The soil mixes that had less organic material were able to hold slightly more water, while
having a lower soil weight. The soil mixtures that showed the best results were the soils in
containers 7 and 11. They had a relatively low soil weight and a high amount of water
collected. Another added benefit of these soils was a high drainage rate, which prevented
the soil from holding standing water that could drown plants or create conditions that
promote mold and mildew growth, while still absorbing the largest quantity of water as it
passed through.
Two more planting media mixes were created, variations of mixes 6 and 7 since they
performed well. Hydrogel was removed from these two variations, 6-a and 7-a, to assess
changes in water capacity and saturated weight. The composition of the planting media
mixes are shown in Table 2.3. The results of their saturation tests are shown in Table 2.4.
By testing these variations, it became clear that the hydrogel beads greatly increased the
amount of water that could be absorbed. Although the water held without the hydrogel is
still very high, 28.9 ounces (6-a) and 29.7 ounces (7-a), it is much less than the same soil
mixes with hydrogel, 44.0 ounces (mix 6) and 49.1 ounces (mix 7).
Table 2.3. Planting media mix variations 6-a and 7-a.
Test
Soil
#
Perlite
(cups)
Vermiculite
(cups)
Compost
(cups)
BioChar
(cups)
Earthworm
Casting
(cups)
Hydrogel
(tsp)
Organic
Composition
6 5.9 5.9 0.83 0.83 0.41 ~1 85% inorganic
15% organic
6-a 5.9 5.9 0.83 0.83 0.41 0 80% inorganic
15% organic
7 6.6 6.6 0.27 0.27 0.14 ~1 95% inorganic
5% organic
7-a 6.6 6.6 0.27 0.27 0.14 0 95% inorganic
5% organic

2-5
Table 2.4. Planting media 6-a and 7-a weights and holding capacities.
Contain
er
Soil Mix
Dry
Weight
(oz.)
Test #1
Water
Capacity
(oz.)
Test #2
Water
Capacity
(oz.)
Test #3
Water
Capacity
(oz.)
Water
Capacity to
Dry Weight
Ratio
6 20.0 29.2 43.8 44.0 2.20
6-a 18.6 * * 28.9 1.55
7 13.4 34.2 48.2 49.1 3.66
7-a 13.6 * * 29.7 2.18
*Only one water capacity test was done for the late soil variations to stay in step with the
rest of the project.
The final step of bench testing was to measure the water retained in the planting media
mixes over the duration of the drying process. The original intent was to continue until the
planting media mixes reached their dry weights, but after nine days it was apparent the
time to dry would extend to at least 30 days for some containers and it was critical to plant
the trays and begin the growing season field trials. A summary of the drying weights, or
duration of moisture retention, follows in Table 2.5. Select mixes are illustrated in Figure
2.3.
Table 2.5. Duration of moisture retention in the planting media mixes.
Contain
er
Weight
of
Dry Soil
(oz.)
Water Capacity (oz.)
Day 0 Day 2 Day 5 Day 8 Day 9
1 22.3 43.6 36.7 33.1 29.3 28.3
2 25.8 42.6 35.2 30.4 26.8 25.9
3 25.7 40.7 33.8 29.1 25.5 24.6
4 23.1 44.1 39.2 35.6 32.0 30.9
5 22.5 45.6 40.5 37.6 34.2 33.1
6 20.0 44.0 38.4 34.5 31.0 30.1
7 13.4 49.1 43.5 40.4 37.1 36.1
8 20.5 46.8 40.5 36.4 33.1 32.3
9 13.6 45.5 40.2 36.1 32.8 31.8
10 18.4 43.2 38.4 35.0 31.5 30.4
11 13.9 49.3 44.0 40.8 37.4 36.4
6-a* 18.6 28.9 27.5 24.2 20.7 19.8
7-a* 13.6 29.7 28.2 25.2 22.2 21.5
*Measurements had one less day of duration since the media mixes were not created until
Day 0. Thus, Day 2 is actually Day 1, Day 5 to Day 4, etc.

2-6
Figure 2.3. Water retention of selected containers.
The data from measuring the water retained in the soil after several days of drying showed
that the water retained was released at a slow steady rate. After nine days the reduction in
the amount of water retained was still decreasing, and some of the soil mixes still held over
60% of their retained water with and without hydrogel in the mix. The overall range of
drying days for soil containers to return to their dry weights ranged from 9 to 30 days.
0.0
5.0
10.0
15.0
20.0
25.0
30.0
35.0
40.0
45.0
50.0
0 5 10 15 20 25 30 35
Wa
ter
Ca
pa
cit
y (o
z)
Drying Days
Water Retention of Selected Containers
1
2
7
9
7a

3-1
3.0 Field Testing
Phase Two of the project was to test the planting media mixes outdoors in experimental
modular panels by monitoring soil moisture and temperature, weather conditions affecting
the plots, weight per square foot of the different panels, and plant health and robustness.
3.1 FIELD TESTING AND EVALUATION OF GROWING MEDIA
Thirty-nine two by two foot plastic garden trays were used to field test the modular system:
three trays of each of the thirteen planting media mixes from the bench testing phase of the
project. Each tray was filled to a depth of four inches and then levelled. The trays were
planted with a hardy Sedum provided by a local grower, Natural Shore Technologies of
Maple Plain, MN (Figure 3.1). The trays were covered with an erosion control fabric to
prevent wind dispersion of the light-weight planting mix (Figure 3.2). In July 2012 they
were set out on a fenced-in asphalt parking lot at the Wenck Associates office in Maple
Plain, MN to simulate the light, heat and wind conditions that would be expected on a roof
top (Figure 3.3). During this initial phase each of the three trays in a set was subjected to
different watering regimes: regular watering, intermittent watering, and no watering. This
allowed the experiment to test each soil mix against each other while also testing the
results of the different watering regimes.
Figure 3.1. Tray filled with a planting mix and Sedum seedlings.

3-2
Figure 3.2. Erosion control fabric protecting the light-weight planting mix.
Figure 3.3. Planted trays on an enclosed asphalt parking lot.

3-3
3.2 INSTALLATION
Over the course of the remaining 2012 growing season the trays were watered according to
their specified regime and schedule and monitored for soil moisture and temperature,
weather conditions affecting the plots, weight per square foot of the different panels, and
plant health and robustness. At the close of the 2012 growing season, the trays were left on
the parking lot for the entire 2012-2013 winter season. In spring 2013 the planting trays
were evaluated to determine winter losses and if there was any degradation of the planting
media mix’s water retention capabilities.
Figure 3.4. Tray Series 10 on May 7, 2013.
Figure 3.5. Tray Series 10 on June 13, 2013.
In June 2013 the trays were deployed to three field sites: a Three Rivers Park District
facility building at the Coon Rapids Dam Regional Park in Brooklyn Park in the West
Mississippi watershed; on the roof of the City Maintenance Facility in Robbinsdale in the
Shingle Creek watershed; and on the roof of the Wenck Associates office building in Maple
Plain, in the Pioneer-Sarah Creek watershed.

3-4
Figure 3.6. Installation at the Robbinsdale (L) and Brooklyn Park sites (R).
Figure 3.7. Final layout at Robbinsdale site, June 14, 2013.

3-5
Figure 3.8. Final layout at Brooklyn Park site, June 18, 2013.
Figure 3.9. Final layout at Maple Plain site, July 15, 2013.
3.3 MONITORING RESULTS
When the trays were deployed, local staff were trained to monitor the trays for moisture
content, weight, pH and plant survivability. The local staff also observed and recorded
information about ease of installation, maintenance, and durability. During the 2013
growing season plants were watered by local staff when moisture content was below 2 (on a
scale of 1 -10). During the 2014 growing season plants only received water during
precipitation events and were not watered by local staff unless they totally dried out.
Following a final assessment of plant health for the project, the modules were left in place
and will be periodically observed for long-term sustainability, although no monitoring will
take place.
3.3.1 Moisture Retention
The planting mixes tended to fall into three groups – one with the best moisture-retention
capacity, one with the least moisture retention, and an in-between group. As noted above,
variants were made of two of the most promising mixes, numbers 6 and 7, by eliminating
the hydrogel in the mix. Those variants performed less well, indicating the importance of
adding hydrogel into the planting medium.
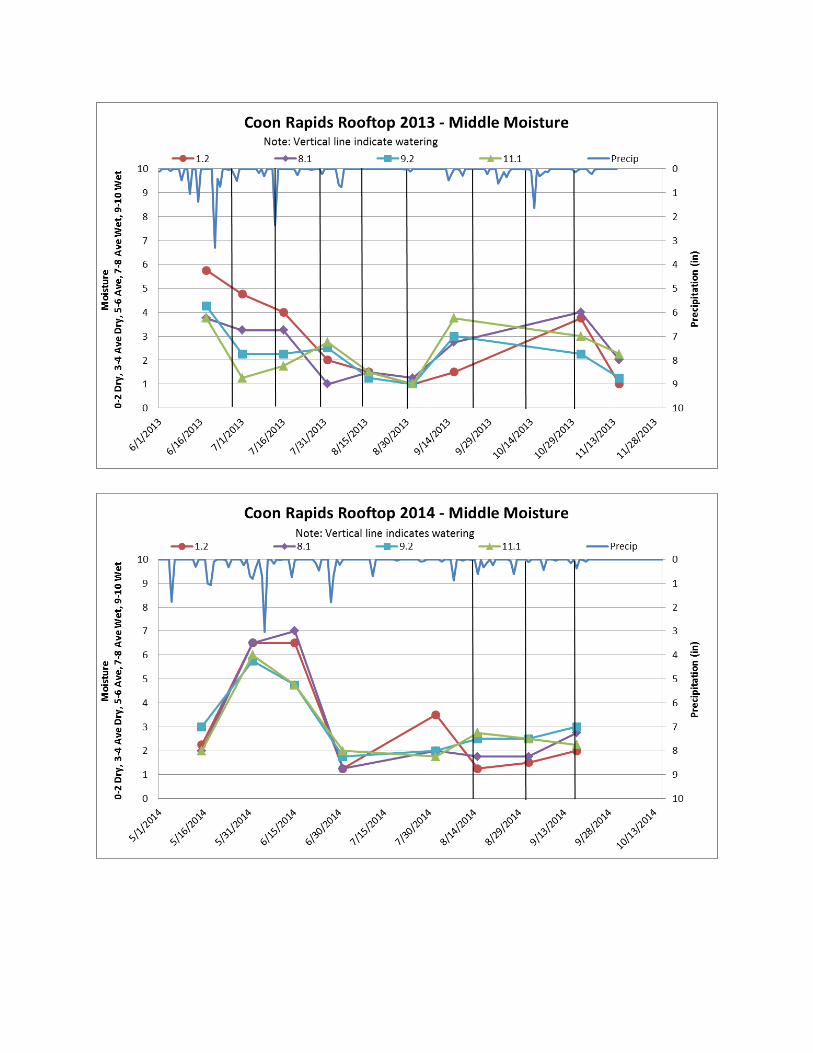
Figures 3.10 to 3.15 show how soil moisture responded to precipitation and watering over
the two monitoring seasons for the “Best Moisture” groups. In the tray numbering system,
the first number indicates the soil mix and the second number which of the three trays it is.
So, tray 3.2 is planting mix 3 and it was tray number 2 with that mix. Mixes 4, 5, and 6
were consistently in the best group. Graphs for all the groups are included in Appendix A.

3-6
Figure 3.10. Brooklyn Park location 2013 best moisture group.
Figure 3.11. Brooklyn Park site 2014 best moisture group.

3-7
Figure 3.12. Robbinsdale location 2013 best moisture group.
Figure 3.13. Robbinsdale location 2014 best moisture group.

3-8
Figure 3.14. Maple Plain location 2013 best moisture.
Figure 3.15. Maple Plain location 2014 best moisture.

3-9
3.3.2 Plant Robustness
Not surprisingly, plant robustness was related to the ability of the mix to retain moisture.
Mixes 4, 5, and 6 showed good plant growth and robustness at all locations, while the other
mixes were variable. Plant hardiness appeared somewhat better at the Brooklyn Park
location, which has some wind protection and partial shade. Both the Robbinsdale and Maple
Plain locations had full exposure to the sun.
Figures 3.16 to 3.18 show plant condition in July 2014, after two year’s growth. Soil mixes
are indicated; NP means No Plants. Those trays were also monitored to see if there was any
difference in moisture-holding performance.
Figure 3.16. Maple Plain location plant growth comparison.

3-10
Figure 3.17. Brooklyn Park location plant growth comparison.

3-11
Figure 3.18. Robbinsdale location plant growth comparison.

4-1
4.0 Conclusions
The objective of this project was to develop and test several versions of a light-weight,
portable, modular system of soil media and plants that could be constructed and installed by
non-professionals on existing rooftops to catch and retain precipitation that would otherwise
be converted to urban runoff. The modules would be suitable for installation on existing
roofs without the need for supplemental structural reinforcement, membrane installation to
combat leakage, or intensive maintenance such as supplemental irrigation.
4.1 BENCH TESTING
Several of these media mixes show promise for installation on existing roofs with their low
bulk weights, water absorbance and retention qualities that minimize the necessity or
frequency of irrigation, relatively low cost of materials, and simplicity in mixing, facilitating
the installation by non-professionals.
There was no direct correlation between organic composition and water holding capacity:
the inorganic materials provided more than expected water holding capacity to the soil
mixes. This provides the greatest opportunity for cost savings, as mixes 7, 9 and 11 were
the cheapest with 95% inorganic and 5% organic material, and had the highest water
holding capacities.
It took two saturations to fully charge the planting media mixes to the maximum water
holding potential of the media. This is important for large scale installation projects and is a
recommended installation step, especially if a dry period with low precipitation was expected
for installation.
4.2 FIELD TESTING
Field testing revealed plant mixes that were superior in terms of moisture retention and
plant robustness. In general, mixes 4, 5, 6, and 6 performed best in the field testing. The
second year of field testing was intended to be completed with no watering, relying only on
natural precipitation. However, there were extended hot and dry periods that dried out the
modules and stressed the plants, so some supplemental watering was provided. Less was
required on the Brooklyn Park site rooftop, which had some shade and some more wind
protection than the others. Some supplemental watering may be required in dry years, even
when the plants are mature and well-established, so access to the roof and water should be
considered when assessing the suitability of roofs for placement.
4.3 COST
Table 4.1 shows the cost of the do-it-yourself system by module. While there were
differences in cost between the soil mixes, the bulk of the expense is in the cost of the tray
and the plants. The costs for this do-it-yourself system were based on what was spent for
single bags of materials delivered onsite. There would be cost savings for the bulk orders
needed for large scale installation and depending on whether materials could be picked up
versus being delivered. This cost estimate does not include the value of the labor time to
assemble, plant, and install the modules.
Commercially available, pre-planted modules range in cost from $20-50 per square foot.
Delivery and installation can double that cost. The do-it yourself modules developed for this

4-2
project cost half that amount, excluding labor. However, the amount of work involved to
assemble and plant is not extensive.
Table 4.1. Estimated cost of do-it-yourself modules.
Soil Mix
Soil Cost Per
Module
Plant* Cost Per
Module
Cost of Tray
Erosion Control Fabric
Total 4 sf
Module Cost
Cost for 4,000 sf
Roof
Commercial DIY Kit
2 sf Module
Cost w/o
Shipping
Cost for 4,000 sf
Roof Installed
1 $2.84 $11.25 $14.76 $6.00 $34.85 $3,485.16 $45.00 $12,900.00
2 $2.85 $11.25 $14.76 $6.00 $34.86 $3,486.01 $45.00 $12,900.00
3 $2.85 $11.25 $14.76 $6.00 $34.86 $3,486.22 $45.00 $12,900.00
4 $2.85 $11.25 $14.76 $6.00 $34.86 $3,486.01 $45.00 $12,900.00
5 $2.85 $11.25 $14.76 $6.00 $34.86 $3,486.22 $45.00 $12,900.00
6 $2.61 $11.25 $14.76 $6.00 $34.62 $3,462.27 $45.00 $12,900.00
6-a $2.51 $11.25 $14.76 $6.00 $34.52 $3,451.56 $45.00 $12,900.00
7 $1.93 $11.25 $14.76 $6.00 $33.94 $3,393.52 $45.00 $12,900.00
7-a $1.82 $11.25 $14.76 $6.00 $33.83 $3,382.81 $45.00 $12,900.00
8 $2.62 $11.25 $14.76 $6.00 $34.63 $3,463.33 $45.00 $12,900.00
9 $1.94 $11.25 $14.76 $6.00 $33.95 $3,394.89 $45.00 $12,900.00
10 $2.62 $11.25 $14.76 $6.00 $34.63 $3,463.33 $45.00 $12,900.00
11 $1.94 $11.25 $14.76 $6.00 $33.95 $3,394.89 $45.00 $12,900.00
*Cost of nine 2” potted plugs. Quick-starting with 4” potted plants would be about double.
4.4 INSTALLATION GUIDANCE
A brochure entitled “How to Install and Maintain a Modular Green Roof: A Step By Step
Guide” specifies how to assemble a modulare green roof, and includes various planting
media mixes based on the best-performers in this project. In general:
1. Planting medium should have a ratio of 80-85% inorganic to 15-20% organic
material, using compost, biochar or any other organic material available and perlite
or vermiculite as a light weight bulking material.
2. It is essential to include Hydogel, which should be used according to the
manufacturers recommendation.
3. Dry weight loading will be about 3 to 4 lb/sf and wet weight loading will be 7.5 to 10
lb/sf. This can be accommodated on most flat or slightly sloped roofs.
4. Sedums are very hardy in Minnesota, and there are many varieties commonly
available.
5. Use an erosion control fabric over the soil to prevent wind loss.
6. Use 2’ x 2’ x 4” trays for easy handling.
7. You can plant with nine plants, but 16 plants would provide better immedicate
coverage.
8. Place so that the trays can be watered during extended drought periods.
.

Appendix A
Monitoring Data

(This page is intentionally blank)


Date and Time of Testing: 5/7/2013, 1:30 to 3:30 p.m.
Air Temperature: 72°F
Pavement Temperature: 100°F
Table A.1. Tray and plant conditions after first winter.
Soil Mixture
Box
Number
Weight
(lbs)
Temp
°F
Soil Moisture
1= None;
10=Saturated Plant
Growth*
Test 1 Test 2
1.1 38.4 82 6 5 M
1.2 38.5 82 6 5 M
1.3 38.3 82 3 4 L-M
2.1 33.6 82 3 2 L-M
2.2 32.4 80 4 2 L-M
2.3 30.2 79 4 5 L-M
3.1 34.4 78 2 4 L-M
3.2 31.6 76 6 8 M
3.3 30.6 74 2 4 M
4.1 32.5 80 2 1 H
4.2 33.3 78 6 4 H
4.3 32.1 79 4 6 H
5.1 23.3 80 2 4 M
5.2 35.4 80 2 4 M
5.3 35.9 80 6 2 M-H
6.1 27.0 84 2 2 M-H
6.2 26.8 83 2 2 M-H
6.3 26.5 80 4 8 M
7.1 34.2 79 1 2 L-M
7.2 30.4 78 4 2 L-M
7.3 26.7 76 3 7 L-M
8.1 33.7 76 2 3 L-M
8.2 32.2 76 4 4 L-M
8.3 34.0 76 4 3 L-M
9.1 36.4 82 2 2 L
9.2 33.4 80 2 4 L
9.3 23.9 78 2 3 L
10.1 26.7 78 7 6 L-M
10.2 27.4 78 4 6 M
10.3 28.0 78 2 4 L-M
11.1 30.3 79 2 10 L
11.2 26.2 79 4 6 L
11.3 24.3 79 2 4 L
6-a.1 23.7 82 2 2 L-M
6-a.2 22.8 82 2 2 L
6-a.3 20.8 80 2 2 L
7-a.1 17.9 82 1 1 L
7-a.2 23.2 82 1 1 L
7-a.3 21.8 82 1 1 H
*Note: All plants survived the winter, some had trays had noticeably more growth than others. H = Heavy; M-H = Medium-Heavy; M = Medium; L-M = Light-Medium; L = Light plant growth.