modulation of antigen presenting cell function to affect ... · 1.2 dendritic cell discovery,...
TRANSCRIPT

Modulation of Antigen Presenting Cell Function to Affect Innate and Adaptive
Immune Responses: Implications for Organ Transplantation
Dr Natasha Rogers
MBBS (Hons), FRACP
Transplantation Immunology Laboratory Basil Hetzel Institute for Medical Research,
The Queen Elizabeth Hospital, and Hanson Institute
Department of Medicine,
Faculty of Health Sciences, University of Adelaide
Submitted in fulfilment of the Degree of Doctor of Philosophy,
University of Adelaide, December 2010

2
TABLE OF CONTENTS
Thesis Abstract 11
Declaration 13
Honours and Awards 14
Publications 15
Presentations 16
Acknowledgements 18
CHAPTER 1: INTRODUCTION 25
1.1 Transplantation and the quest for tolerance 25
1.2 Dendritic cell discovery, characterisation and biology 28
1.2.1 DC lineage 29
1.2.2 DC phenotype 32
1.2.2.1 Murine DC subsets 35
1.2.2.2 Human DC subsets 38
1.2.2.2.1 MDC markers – C-type lectins 38
1.2.2.2.2 PDC markers 40
1.3 The dual function of DC in transplantation 42
1.3.1 DC function 42
1.3.2 The passenger leukocyte theory – immunogenic DC 45
1.3.3 DC density as a marker of organ allogenicity 47
1.3.4 Renal ischaemia-reperfusion injury 48
1.3.5 Tolerogenic DC 51
1.3.6 Allograft tolerance as a function of DC phenotype 51
1.4 The generation of tolerogenic DC in vitro 55
1.4.1 Manipulation of in vitro culture conditions 55
1.4.1.1 Interleukin-10 55
1.4.1.2 Transforming growth factor-� 56
1.4.2 Pharmacologic manipulation 56
1.4.3 Manipulation with cell by-products 58
1.4.4 Genetic manipulation 59

3
1.4.5 Recipient pre-conditioning with tolerogenic DC 61
1.5 Mechanisms of DC-induced tolerance 62
1.5.1 Regulatory T-cells 62
1.5.1.1 Functional studies 63
1.5.2 T regulatory type 1 (TR1) cells 64
1.5.3 T-cell anergy 64
1.5.4 T-cell deletion 65
1.5.5 Induction of T helper (Th2) cells 65
1.6 DC immunotherapy 67
1.6.1 Genetic manipulation of DC 67
1.6.2 Liposomes 70
1.6.2.1 Liposome structure 70
1.6.2.2 Liposome synthesis 72
1.6.2.3 Systemic behaviour of liposomes in vivo 73
1.6.2.4 Liposome trafficking 77
1.6.2.5 Utility of liposomes in pathophysiological states 77
1.7 Non-human primates in transplantation research 79
1.8 Thesis aims and hypotheses 81
CHAPTER 2: MATERIALS AND METHODS
2.1 Cell culture 82
2.1.1 Human 82
2.1.1.1 In vitro propagation of human monocyte-derived DC 82
2.1.1.2 Generation of nylon wool T-cells 83
2.1.1.3 Dendritic cell (one-way) MLR 83
2.1.1.4 Isolation of T-cells from an MLR using Automacs® 84
2.1.1.5 Secondary MLR 86
2.1.2 Marmoset 88
2.1.2.1 Marmoset colony maintenance 88
2.1.2.2 Peripheral blood sampling 88
2.1.2.3 Cell isolation protocols 89
2.1.2.4 PBMC isolation 89

4
2.1.2.5 One-way MLR 89
2.1.3 Murine 90
2.1.3.1 Isolation and administration of allogeneic murine DC 90
2.2 Flow cytometry 92
2.2.1 Flow cytometric analysis of dendritic cell surface markers 92
2.2.2 Flow cytometric analysis T-cell surface and intracellular markers 92
2.2.3 Staining for apoptotic/necrotic T-cells following co-culture with DC 96
2.3 Enzyme-linked immunosorbent assay 96
2.4 Immunofluorescent staining and confocal miscroscopy 97
2.4.1 Immunofluorescence for NF-�B-p50 97
2.4.1.1 Hu-Mo-DC (in vitro) 97
2.4.1.2 Murine spenocytes and renal APC (in vivo) 97
2.4.2 Immunofluorescence for DiI-labelled liposomes 97
2.4.3 Measurement of superoxide dismutase using dihydroethiudium 98
2.4.4 Terminal deoxynucleotidyl transferase dUTP nick-end labelling 98
2.4.5 Immunofluorescent staining for 3-nitrotyrosine and thioredoxin-interacting
protein 99
2.5 Polymerase chain reaction techniques 99
2.5.1 RNA extraction 99
2.5.2 RNA quantitation 100
2.5.3 Reverse transcription of RNA and cDNA synthesis 100
2.5.4 Primer design 101
2.5.5 Synthesis of standards for RT-PCR 104
2.5.6 Agarose gel electrophoresis 104
2.5.7 Real-time PCR 105
2.6 Cloning studies 106
2.6.1 Cloning of marmoset DC-SIGN 106
2.6.1.1 Primer design 107
2.6.1.2 Ligation of DNA fragments into cloning vectors 108
2.6.1.3 Transformation of competent E. coli cells 109
2.6.2 Transfection of CHO cell lines with marmoset DC-SIGN and confirmation of
cross-reactivity of the monoclonal antibody to human DC-SIGN 110
5
2.6.2.1 Cell lines 110
2.6.2.2 Cell line transfection 110
2.6.2.3 Binding of marmoset DC-SIGN transfect CHO cells to anti-human DC-
SIGN and human DC-SIGN-targeted liposomes 111
2.7 Liposomes synthesis 111
2.7.1 Non-targeted (conventional) liposome synthesis 111
2.7.2 Synthesis of plasma membrane vesicles 111
2.7.3 Targeted liposome synthesis 112
2.7.3.1 Human DC-SIGN-targeted liposomes 112
2.7.3.2 Monoclonal antibody modification using a heterobifunctional
crosslinker 113
2.7.3.3 Mass spectrometry 114
2.8 Assessment of systemic liposome distribution and cellular uptake 116
2.8.1 Spleen digestion protocol 117
2.8.2 Kidney digestion protocol 117
2.9 Ischaemia-reperfusion injury 117
2.9.1 Generation of murine bilateral ischaemia-reperfusion injury 117
2.9.2 Assessment of renal function after bilateral renal IRI 118
2.9.3 Histologic assessment 118
2.9.3.1 Periodic acid Schiff’s stain 118
2.9.3.2 Assessment of histopathology 119
2.10 Western bloting 120
2.10.1 Protein extraction and quantitation 120
2.10.2 SDS-polyacrylamide gel electrophoresis 120
2.10.3 Protein transfer 121
2.10.4 Membrane blocking and antibody incubation 121
2.11 Statistical analysis 122
2.12 Reagents 123
2.13 Prepared buffers and solutions 126
2.14 Manufacturers 127

6
CHAPTER 3: CURCUMIN INDUCES TOLEROGENIC DENDRITIC CELLS
THAT EXPAND REGULATORY T-CELLS IN VITRO AND IN VIVO
3.1 Introduction 132
3.2 Methods 135
3.2.1 Cell culture 135
3.2.2 Animal experiments 135
3.3 Results – in vitro 137
3.3.1 Curcumin modifies the expression of DC positive co-stimulatory and negative
regulatory molecules 137
3.3.2 CurcDC are maturation-arrested 141
3.3.3 Comparison of DC cytokine production 144
3.3.4 CurcDC inhibit T-cell responsiveness in a primary MLR 148
3.3.5 Inhibition of IL-10 does not restore alloproliferative capacity to CurcDC 149
3.3.6 T-cell hyporesponsiveness following co-culture with CurcDC is associated
with lower intracellular IFN� expression but not difference in IL-10 expression 151
3.3.7 T-cell hyporesponsiveness following co-culture with CurcDC is due to the
induction of CD4+CD25hiFoxP3+ regulatory T-cells 156
3.3.8 T-cell hyporesponsiveness following co-culture with CurcDC is not due to the
induction of TH17 cells 159
3.3.9 CurcDC do not induce T-cell apoptosis 160
3.3.10 T-cells primed with CurcDC exert suppressive function consistent with
Tregs 161
3.4 Results – in vivo 165
3.4.1 Allogeneic murine CD11c+ DC migrate systemically 165
3.4.2 Allogeneic CurcDC induce CD4+CD25+FoxP3+ Tregs in vivo and immune
hyporesponsiveness in vitro 168
3.4.3 Murine CurcDC infuces in vivo impair the subsequent alloproliferative
response by expanding FoxP3+ Tregs in a non-antigen-specific manner 171
3.5 Discussion 175
CHAPTER 4: MODIFICATION OF DENDRITIC CELLS IN VITRO AND IN VIVO
USING LIPOSOMES

7
4.1 Introduction 180
4.2 Methods 182
4.2.1 Peripheral blood sampling 182
4.2.2 Cell culture 182
4.2.3 Liposome synthesis 182
4.2.4 In vivo experiments 183
4.3 Results 184
4.3.1 DC are targeted in vivo using conventional liposomes 184
4.3.2 Liposomal incorporation of immunomodulatory agents 190
4.3.2.1 IL-10 incorporates into liposomes and inhibits DC allostimulatory
capacity 190
4.3.2.2 IL-10 liposomes maintain biologic activity in vitro 192
4.3.2.3 Curcumin liposomes in vitro demonstrate immunosuppressive
activity in an MLR 194
4.3.2.4 Curcumin liposomes delivered to splenic DC in vivo inhibit DC
maturation via NF-�B 198
4.3.2.5 Splenocytes exposed to curcumin lipsoomes in vivo demonstrate
reduced allostimulatory and alloproliferative capacity and generate FoxP3+
Tregs in an ex vivo MLR 202
4.3.2.6 The addition of PMV to curcumin liposomes does not induce
antigen-specific hyporesponsiveness 206
4.4 Discussion 208
CHAPTER 5: LIPOSOMAL CURCUMIN AMELIORATES RENAL ISCHAEMIA-
REPERFUSION INJUR VIA NF-KB INHIBITION AND REDUCED OXIDATIVE
STRESS
5.1 Introduction 211
5.2 Methods 213
5.2.1 Cell culture 213
5.2.2 Murine model of bilateral ischaemia-reperfusion injury 213
5.3 Results 215
8
5.3.1 Liposomal endocytosis by renal tubular epithelial and antigen presenting cells
215
5.3.2 Curcumin liposomes suppress NF-�B activity in APC 217
5.3.3 Liposomal curcumin reduces renal dysfunction following renal IRI 221
5.3.4 Liposomal curcumin reduces renal tubular injury following renal IRI 224
5.3.5 Liposomal curcumin reduces renal tubular apoptosis following renal IRI 228
5.3.6 Liposomal curcumin reduces expression of markers of renal injury and pro-
inflammatory cytokines following renal IRI 231
5.3.7 Liposomal curcumin reduces renal neutrophil infiltration and chemokine
expression following renal IRI 234
5.3.8 Liposomal curcumin limits oxidative stress following renal IRI 238
5.3.9 Liposomal curcumin limits nitrosative stress following renal IRI 241
5.3.10 Liposomal curcumin limits thioreductase stress following renal IRI 245
5.4 Discussion 249
CHAPTER 6: SPECIFIC LIPOSOMAL TARGETING OF DENDRITIC CELLS
6.1 Introduction 254
6.2 Methods 258
6.2.1 Cell culture and analysis 258
6.2.2 Liposome synthesis 258
6.2.3 Cloning of marmoset DC-SIGN 258
6.2.4 Vector cloning 258
6.2.4.1 pGEM®-T Easy 258
6.2.4.2 pCI mammalian expression vector 259
6.2.5 Transfection of CHO cells 259
6.2.6 Mass spectrometry 260
6.3 Results 260
6.3.1 Analysis of DC-SIGN expression in hu-Mo-DC 260
6.3.2 DC-SIGN-targeted liposomes bind hu-Mo-DC 264
6.3.3 Co-culture of hu-Mo-DC with empty DC-SIGN-targeted liposome does not
change DC phenotype of allostimulatory capacity 268
6.3.4 Cloning of marmoset DC-SIGN 272
9
6.3.4.1 Determination of the nucleotide and amino acid sequences for
marmoset DC-SIGN 272
6.3.4.1 Cloning of human or marmoset DC-SIGN into pGEM®-T Easy and
pCI vectors 274
6.3.5 Binding of anti-human antibody to marmoset DC-SIGN 281
6.3.6 Binding of hu-DC-SIGN-targeted liposomes to marmoset DC-SIGN 283
6.3.7 Unmodified monoclonal antibody to human DC-SIGN fails to bind liposome
and target DC in vivo 288
6.3.8 Alterations in monoclonal antibody to facilitate liposomal attachment 290
6.4 Discussion 293
CHAPTER 7; CONCLUSIONS AND FUTURE DIRECTIONS
7.1 Summary and conclusions 299
7.2 Future directions 303
7.2.1 Planned studies for further evaluation of tolerogenic DC in vitro and in vivo
303
7.2.2 Planned studies of liposomal curcumin in ischaemia-reperfusion injury 304
7.2.3 Planned studies of liposomes in transplantation 305
REFERENCES 306
APPENDIX 340

10
Even now, I wrap what’s most fragile
in the long gauze of science.
The more elusive the truth,
the more carefully it must be carried.
- Anne Michaels
11
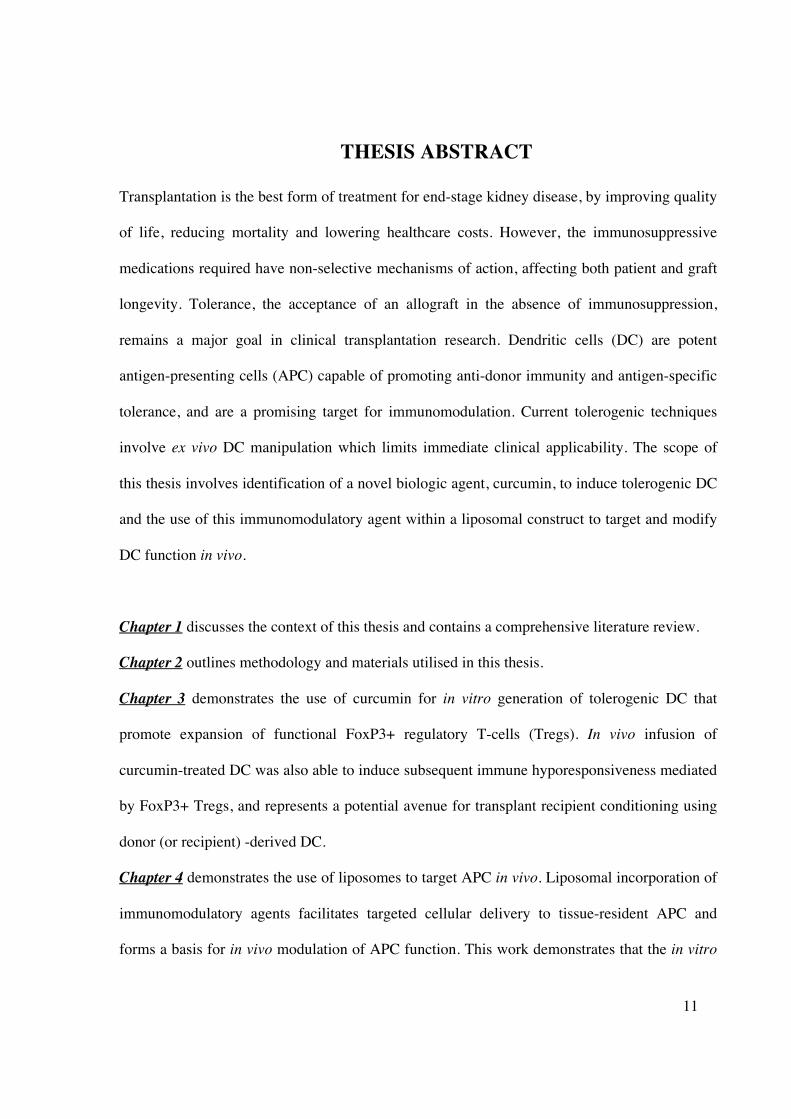
THESIS ABSTRACT
Transplantation is the best form of treatment for end-stage kidney disease, by improving quality
of life, reducing mortality and lowering healthcare costs. However, the immunosuppressive
medications required have non-selective mechanisms of action, affecting both patient and graft
longevity. Tolerance, the acceptance of an allograft in the absence of immunosuppression,
remains a major goal in clinical transplantation research. Dendritic cells (DC) are potent
antigen-presenting cells (APC) capable of promoting anti-donor immunity and antigen-specific
tolerance, and are a promising target for immunomodulation. Current tolerogenic techniques
involve ex vivo DC manipulation which limits immediate clinical applicability. The scope of
this thesis involves identification of a novel biologic agent, curcumin, to induce tolerogenic DC
and the use of this immunomodulatory agent within a liposomal construct to target and modify
DC function in vivo.
Chapter 1 discusses the context of this thesis and contains a comprehensive literature review.
Chapter 2 outlines methodology and materials utilised in this thesis.
Chapter 3 demonstrates the use of curcumin for in vitro generation of tolerogenic DC that
promote expansion of functional FoxP3+ regulatory T-cells (Tregs). In vivo infusion of
curcumin-treated DC was also able to induce subsequent immune hyporesponsiveness mediated
by FoxP3+ Tregs, and represents a potential avenue for transplant recipient conditioning using
donor (or recipient) -derived DC.
Chapter 4 demonstrates the use of liposomes to target APC in vivo. Liposomal incorporation of
immunomodulatory agents facilitates targeted cellular delivery to tissue-resident APC and
forms a basis for in vivo modulation of APC function. This work demonstrates that the in vitro

12
results demonstrated in Chapter 3 can be replicated in vivo, potentially eliminating the need for
ex vivo DC manipulation in a transplant setting.
Chapter 5 demonstrates the utility of liposomal curcumin in ameliorating aspects of ischaemia-
reperfusion injury (IRI), a consequence of transplant surgery that promotes graft
immunogenicity and limits graft longevity. For the first time renal tubular epithelial and
antigen-presenting cell endocytosis of liposomes is demonstrated, as is salvage of renal function
which is mediated by reduced pro-inflammatory cytokine and chemokine production, and
diminished oxidative stress. The results also identify thioredoxin-interacting protein (TXNIP) as
a potential novel marker of tissue injury in IRI, and curcumin effectively reduces this aspect of
cellular redox stress These data represent a novel and effective delivery method for this
immunmodulatory agent, preventing significant renal damage in a manner that has immediate
clinical applicability.
Chapter 6 describes a refinement in liposomal targeting of DC, using a DC-specific liposome
capable of binding to human monocyte-derived DC with high affinity via the receptor DC-
SIGN. The gene for marmoset DC-SIGN was cloned and the cross-reactivity of a human-DC-
targeted liposome to its marmoset counterpart was investigated in vitro. Additional attempts
were made to synthesize a marmoset DC-targeted liposome through basic, non-specific,
chemical modification of a monoclonal antibody to DC-SIGN known to be cross-reactive with
both humans and marmosets, with the aim of creating a cell-free DC-targeted negative vaccine
that could be tested in non-human primates.
Thus, the work presented in this thesis creates a platform for future studies from which DC-
based cellular and cell-free immune tolerance therapies can be developed in a transplant model.

13
DECLARATIONS
I declare that this thesis contains no material which has been accepted for the award of any
other degree or diploma in any university or tertiary institution to Natasha Mireille Rogers
and, to the best of my knowledge, contains no material previously published or written by
another person, except where due reference has been made in the text. I give consent to this
copy of my thesis when deposited in the University Library, being made available for loan
and photocopying, subject to the provisions of the Copyright Act 1968. I also give
permission for the digital version of my thesis to be made available on the web, via the
University’s digital research repository, the Australasian Digital Theses Program (ADTP)
and also through web search engines, unless permission has been granted by the University
to restrict access for a period of time. I acknowledge that the copyright of published works
contained within this thesis (as listed below) resides with the copyright holders of those
works.

14
HONOURS AND AWARDS 2010 Transplantation Society of Australia and New Zealand
Janssen-Cilag Travelling Fellowship 2010 AusBiotech-GlaxoSmithKline Student Excellence Award, South Australian and National Winner 2010 Australian and New Zealand Society of Nephrology
ANZSN Travelling Fellowship 2010 Australian and New Zealand Society of Nephrology
Novartis Overseas Travelling Fellowship 2010 Australian and New Zealand Society of Nephrology
Finalist, Young Investigator Award 2010 Australian and New Zealand Society of Nephrology
Travel grant to attend the Annual Scientific Meeting 2010 Transplantation Society of Australia and New Zealand Travel grant to attend XXII Congress of the Transplantation Society 2010 Transplantation Society of Australia and New Zealand
Young Investigators Award 2010 Transplantation Society of Australia and New Zealand
Winner, President’s Prize for best invited oral presentation 2010 Australian Society for Medical Research, Adelaide Winner, Ross Wishart Prize for best oral presentation 2007 National Health & Medical Research Council Medical Postgraduate Scholarship 2007 Kidney Health Australia
Postgraduate Scholarship 2007 The University of Adelaide
Australian Postgraduate Award

15
PUBLICATIONS
Peer reviewed papers
Rogers NM, Matthews, TJ, Kitching, AR, Coates, PT. Kidney dendritic cells: their role in homeostasis, inflammation and transplantation. Nephrology 2009 14(7):620-35. Rogers NM, Kireta S, Coates PTH. Curcumin generates maturation-resistant dendritic cells and T regulatory cells in vitro. Clin Exp Immunol, Accepted June 2010. Rogers NM, Stephenson M, Kitching AR, Horowitz JD, Coates PT. Amelioration of renal ischemia-reperfusion injury by liposomal delivery of an NF�B inhibitor to renal tubular epithelial and antigen presenting cells. Submitted to Br J Pharmacol, minor revision undertaken and resubmitted.
Rogers NM, Collins MG, Coates PTH. Marmoset kidney histology and progression:
implications for disease models. Submitted to Am J Primatol.
Rogers NM, Jesudason S, Kireta S, Lim WH, Russ GR, Coates PTH. Blood and tissue
dendritic cell subsets in common marmoset monkeys. Manuscript in preparation, to be submitted to Exp Haematol March 2011.
Prasad S, Rogers NM, Collins MG, Coates PTH. Non-human primate dendritic cells.
Manuscript to be submitted to Immunol Cell Biol March 2011.
Abstract publications
Rogers NM, Stephenson MD, Coates PT. Liposomal curcumin ameliorates renal
ischaemia-reperfusion injury via NFkappaB inhibition and antioxidant pathways. Immunol Cell Biol 2010; 88(6): A28
Rogers NM, Kireta S, Coates PT. Curcumin generates maturation-resistant dendritic cells and T regulatory cells in vitro. Immunol Cell Biol 2010; 88(6): A24 Rogers NM, Coates PT. Curcumin generates maturation-arrested “FAST” dendritic cells that expand regulatory T cells in vitro and in vivo. Nephrology 2010; 15(S4): 40
16
PRESENTATIONS
Invited presentations
“Modulation of innate and adaptive immunity to facilitate organ transplantation”
- Department of Ophthalmology, Flinders Medical Centre, South Australia,
November 2010
- Welcome Centre, Oxford, UK, November 2010
- Beth Israel Deaconess Medical Centre, Boston, USA October 2010
- Basil Hetzel Institute for Medical Research, South Australia, October 2010
- Thomas E. Starzl Institute, University of Pittsburgh, USA, September 2010
- Flinders Medical Centre Seminar Series, South Australia, August 2010
- Vascular Medicine Institute, University of Pittsburgh, USA, May 2010
Conference presentations
Oral presentations
Rogers NM, Stephenson MD, Coates PT. “Liposomal curcumin ameliorates renal
ischaemia-reperfusion injury via NFkappaB inhibition and antioxidant pathways”
- Australian Society for Medical Research Annual Scientific Meeting, Adelaide, June
2010
- Transplantation Society of Australia and New Zealand, Annual Scientific Meeting,
Canberra, June 2010
- XXIII International Congress of the Transplantation Society, Vancouver, August
2010
- Young Investigator Award, Australian and New Zealand Society of Nephrology,
Perth, September 2010
- The Queen Elizabeth Hospital Research Day, Adelaide, October 2010 Rogers NM, Kireta S, Coates PT. “Curcumin generates maturation-resistant dendritic cells and T regulatory cells in vitro and in vivo”
- President’s Prize, Transplantation Society of Australia and New Zealand Annual
Scientific Meeting, Canberra, June 2010
Rogers NM, Stephenson M, Kireta S, Coates PTH. “Amelioration of ischaemia-reperfusion injury using liposomal curcumin”
- The Queen Elizabeth Hospital Research Day, Adelaide, October 2009
Mini-oral presentations
Rogers NM, Coates PT. Curcumin generates maturation-arrested “FAST” dendritic cells
that expand regulatory T cells in vitro and in vivo”
- Australian and New Zealand Society of Nephrology Annual Scientific Meeting, Perth, September 2010

17
Poster presentations
Rogers NM, Coates PT. Curcumin generates maturation-arrested “FAST” dendritic cells
that expand regulatory T cells in vitro and in vivo”
- XXIII International Congress of the Transplantation Society, Vancouver, August
2010 Rogers NM, Stephenson M, Parish CR, Thomas R, Coates PTH. “Alteration of innate and adaptive immune responses using liposomal curcumin”
- Australasian Society of Immunology Conference, Gold Coast, December 2009 Rogers NM, Parish CR, Russ GR, Coates PTH. “Specific targeting of dendritic cells using tolerogenic liposomes”
- The Queen Elizabeth Hospital Research Day, Adelaide, October 2008

18
ACKNOWLEDGEMENTS
Firstly, I sincerely thank my supervisor, A/Prof Toby Coates for his mentorship. I have greatly respected and admired Toby’s enthusiasm and scientific thinking, and it has been a privilege to work with him. I would also like to thank Prof Graeme Russ (RAH, Adelaide), Prof Chris Parish (ANU, Canberra), Dr Shane Grey (Garvan Institute, Sydney) and Prof Ranjeny Thomas (Diamantine Institute, Brisbane) for their valuable intellectual input. I also sincerely thank Prof Clive Prestidge and Dr Timothy Barnes (Ian Wark Institute, UniSA) who allowed me to use the necessary equipment to make liposome preparations, without which I could not have performed so many experiments. I would like to acknowledge the support of the National Health and Medical Research Council for the provision of the scholarship (and extension) that has enabled me to undertake my PhD. I am indebted to the most important person in our laboratory, Svjetlana Kireta, who taught and helped me with everything. She was never too busy, and always ready to assist, teach, and listen. I am also grateful to all the staff and students of the TIL during my tenure, especially Julie Johnston, Matthew Stephenson, Clyde Milner, Chris Drogemuller, Darling Rojas, Claire Jessup, Michael Collins, Daisy Mohanasundaram, Amy Hughes, Boris Fedoric, and Austin Milton, for practical assistance, teaching, helpful discussions, insights and thoughtful feedback. Thank you for providing a friendly, accommodating and generous environment in which to develop skills and learn. The staff at the IMVS Animal Facility require mention, particularly Kelly Wicks for her assistance with all the mouse injections. I would like to thank Chris Drogemuller (RAH/Hanson Institute) for guidance with marmoset DC-SIGN cloning and sequence analysis, John Brealy (TQEH) for electron microscopy assistance, Katherine Pilkington (Detmold Facility, Hanson Institute) for flow sorting expertise and friendship, staff at the South Australian Red Cross Blood Service and the donors for providing blood samples. A special mention must go to Prof John Horowitz whose objective insight, judgement and humour was a great salve in moments of frustration. I have been blessed with magnificent parents who have been utterly reliable back-up baby sitters on innumerable occasions, and provided scientific advice, moral support and encouragement at every step. Thank you all for everything; this would not have been achieved without your continuous help. To my husband David, your support of me has made all this possible. . And finally, beautiful child, Orli, born before this madness began. You have provided me with laughter, frustration, sleepness nights and joy. I hope one day you might be interested enough to look at this thesis, disregard the fact it is not bound in pink, and understand what I was doing on those nights away from you.

19
ABBREVIATIONS [3H] thymidine – tritiated thymidine
AA-DC – alternatively activated dendritic cells
Ab/anti- – antibody
ADCC – antibody-dependent cell-mediated cytotoxicity
Ag – antigen
ALP – alkaline phosphatase
APC – antigen presenting cell
APC – allophycocyanin
ATP – adenosine triphosphate
Automacs� – automated magnetic cells separator
bp – base pair
BDCA – blood dendritic cell antigen
BM- bone marrow
BODIPY – boron-dipyrromethene
cDC – conventional dendritic cells
CCL – CC chemokine ligand
CCR – CC chemokine recpetor
CD – cluster of differentiation
CD40L – CD40 ligand
CD62L – CD62 ligand
cDC – conventional DC
cDNA - complementary deoxyribonucleic acid
CHO cell – chinese hamster ovary cell
CM – complete medium
CNI – calcineurin inhibitor
CpG – cytosine-guanine oligonucleotide
CPM – counts per minute
CsA - cyclosporine
CTL – cytotoxic lymphocyte
CTLA-4 – cytotoxic T lymphocyte associated antigen-4

20
CTRL - control
CurcDC – curcumin-treated dendritic cells
CYC - cychrome
DAPI - 4’,6-diamindino-2-phenylindole
DC – dendritic cell
DC-LAMP – dendritic-cell-lysosome-associated membrane protein
DC-SIGN – dendritic cell-specific intercellular adhesion molecule [ICAM]-3 grabbing non
integrin
DEPC – diethylenepyrocarbonate
dH2O – distilled water
DiI - 1,1'-dioctadecyl 3,3,3',3'-tetramethylindocarbocyanine perchlorate
DNA – deoxyribonucleic acid
dNTP – deoxynucleotide triphosphate
DOGS-NTA-Ni - 1,2-dioleoyl-sn-glycero-3-[(N-(5-amino-1 carboxypentyl)iminodiacetic acid)succinyl] (nickel salt) DSG - Deoxyspergualin
EDTA – ethylenediamine tetra acetic acid
ELISA – enzyme-linked immunosorbent assay
EM –electron microscopy
EPG – egg phosphatidylcholine
FcR – Fc receptor
FCS – foetal calf serum
FITC - Fluorescein isothiocyanate
FKBP – FK binding protein
Flt – FMS-like tyrosine kinase
Flt3L – fms-like tyrosine kinase 3 ligand
FoxP3 – forkhead box protein 3
G-CSF –granulocyte colony stimulating factor
GITR – glucorticoid-induced tumour necrosis factor receptor
GM-CSF – granulocyte-macrophage colony stimulating factor
GVHD – graft versus host disease
H3PO4 – phosphoric acid

21
H&E – haematoxylin and eosin
HI FCS – heat-inactivated foetal calf serum
HLA – human leukocyte antigen
HP – haematopoietic precursor
HPDC – dendritic cell cultured from haematopoietic precursor cells
HPRT1 - hypoxanthine phosphoribosyltransferase 1
HSP – heat shock protein
Hu MoDC – human monocyte-derived DC
iDC – immature DC
IDO – indoleamine 2,3-dioxygenase
IFN – interferon
IFN� – interferon gamma
Ig – immunoglobulin
IL – interleukin
IMVS – Institute of Medical and Veterinary Science
IKDC – interferon-producing killer dendritic cells
IP – intraperitoneal
IPTG – isopropyl �-D-1-thiogalactopyranoside
IRI – ischaemia-reperfusion injury
IV – intravenous
LAG 3 – lymphocyte activated gene 3
LB – Luria broth
LC – Langerhans cells
Lin - lineage
LPS – lipopolysaccharide
MAPK – mitogen activated protein kinase
MBL – mannose binding lectin
MCP - monocyte chemoattractant protein
MDC – myeloid DC
MFI – mean fluorescence intensity
MHC – major histocompatibility complex
MIP – macrophage inflammatory protein

22
MLR – mixed lymphocyte (leukocyte) reaction
MMLV- Malooney murine leukemia virus
MMR – macrophage-mannose receptor
MNC – mononuclear cells
mRNA – messenger ribonucleic acid
mTOR – mammalian target of rapamycin
MW – molecular weight
NaOH – sodium hydroxide
NF – nuclear factor
NFAT – nuclear factor of activated T-cells
NF-�B – nuclear factor kappa B
NH4Cl – ammonium chloride
NHP – non-human primate
NK – natural killer
NOS – nitric oxide synthase
NTA3-DTDA – 3-nitriloacetic acid ditetradecylamine
NWT – nylon wool T-cells
OCT – optimal cutting tissue
OD – optical density
OligodT – oligodeoxythymidylic acid
PB – peripheral blood
PBS – phosphate buffered saline
PBMC – peripheral blood mononuclear cell
PCR – polymerase chain reaction
PD-1 – programmed death-1
pDC – plasmacytoid DC
PD-L1 – programmed death ligand-1
PD-L2 – programmed death ligand-2
PE – phycoerythrin
PE-Cy5 - phycoerythrin-Cy-5
PE-Cy5.5- phycoerythrin-Cy-5.5
PE-Cy7- phycoerythrin-Cy-7
23
PG - prostaglandin
PI – propidium iodide
PMV – plasma membrane vesicles
Pre-DC – DC precursors
Pre-MDC – myeloid dendritic cell precursors
Pre-PDC – plasmacytoid dendritic cell precursors
PTLD – post-transplant lymphoproliferative disorder
RB – round bottom
rh - human recombinant
RNA – ribonucleic acid
RNAsin - RNase inhibitor
rpm – revolutions per minute
RPMI – Roswell Park Memorial Institute
RT-PCR – real-time polymerase chain reaction
SCF – stem cell factor
SD – standard deviation
SEB – streptococcal enterotoxin B
SEM – standard error of mean
SOD – superoxide dismutase
SOT – solid organ transplant
STAT – signal transducers and activators of transcription
Tac – tacrolimus
TCR – T-cell receptor
Th – T-helper
TGF – transforming growth factor
TGF� - transforming growth factor beta
tolDC – tolerogenic dendritic cell
TR1 – T regulatory type 1 cells
Treg – regulatory T-cell
TLR – toll-like receptor
TLR4 – toll-like receptor 4
TNF – tumour necrosis factor

24
TNF� - tumour necrosis factor alpha
TolDC – tolerogenic dendritic cells
TPO – thrombopoietin
TQEH – The Queen Elizabeth Hospital
WB – western blot
WCC – White cell count
Xgal – 5-bromo-4-chloro-3-indoyl-beta-D-galactopyranoside

25
CHAPTER 1: INTRODUCTION
1.1 Transplantation and the quest for tolerance
In 2007, 2311 Australians commenced treatment for end-stage renal failure, an annual rate
of approximately 100 per million population, and 9132 patients were regularly receiving
dialysis (1). The availability of dialysis prevents death due to uraemia but only partially
corrects a chronic uraemic state; patients have significant morbidity and mortality, and
median survival is 5 years, due largely to cardiovascular disease (2). Kidney transplantation
is the best form of renal replacement therapy; by providing restoration of organ function it
leads to improved quality of life (3), reduced mortality (4) and lower treatment costs (5).
Whilst 1-year allograft and patient survival is excellent (91% and 96% respectively), 5-year
survival is substantially worse (82% and 90% respectively) (6). Considerable improvement
was made following the introduction of cyclosporine into routine clinical practice in 1985;
further advances in immunosuppression now ensure few grafts are lost from acute
rejection. The major causes of graft failure are chronic allograft nephropathy, and death
with a functioning graft due to malignancy, cardiovascular disease and infection. The
detrimental effects on graft and patient survival are directly related to immunosuppression
(6). Table 1.1 outlines commonly used immunosuppressive agents, their mechanism of
action and an abbreviated list of important side effects.

26
Drug class Biological target Side effects Steroids • Blocks T-cell and antigen-presenting
cell-derived cytokine production and cytokine receptor expression
Diabetes mellitus Obesity Osteoporosis Hypertension Impaired wound healing
Calcineurin inhibitors (cyclosporin, tacrolimus)
• Bind cyclophilin (cyclosporin) or FK-binding protein (tacrolimus) which bind and inhibit the phosphatase calcineurin, impairing production of cytokines including IL-2
Nephrotoxicity Hyperlipidaemia Diabetes mellitus Neurotoxicity Cosmetic – hirsutism, gingival hyperplasia
mTOR inhibitors (rapamycin, everolimus)
• Blocks IL-2 activation and phosphorylation of 70 S6 kinase, inhibiting T-cell progression from G1 to S phase of the cell cycle
Impaired wound healing Hyperlipidaemia Pneumonitis Mouth ulceration
Mycophenolate mofetil
• Inhibits purine synthesis and the type II isomer of inosine monophosphate dehydrogenase (rate limiting enzyme for purine synthesis); selective lymphocyte antiproliferative effect
Pancytopaenia Gastrointestinal – gastritis, vomiting, diarrhoea
Azathioprine • Inhibits bone marrow promyelocyte proliferation • Inhibits de novo purine nucleotide synthesis
Pancytopaenia Pancreatitis
LEA29Y (Belatacept)
• High affinity CTLA4-Ig fusion protein, co-stimulatory (CD80/86) blockade
Post-transplant lymphoproliferative disorder (PTLD)
Antibodies (OKT3, ATG, rituximab, campath 1H)
• Complement-mediated clearance of lymphocytes
Cytokine release syndrome Leukopaenia Malignancy Infection
Table 1.1 Immunosuppressive agents currently used clinically, their cellular targets
and potential side effects.
The above agents are used in combination to inhibit allograft rejection, but the mechanisms
of action are largely non-specific, with a broad range of adverse effects. Adapted from
Handbook of Kidney Transplantation (4th Ed) (7).

27
The burden of excess morbidity and mortality has led to strategies aimed at minimising or
eliminating immunosuppression, and the quest for transplant tolerance. The phenomenon of
acquired immune tolerance to allogeneic tissues was identified by the murine transplant
studies of Medawar and colleagues (8) and is defined as donor-specific hyporesponsiveness
and normal allograft function in the absence of immunomodulatory interventions, whilst
maintaining the ability to reject allografts from a third party. Clinical operational tolerance
has been commonly described for orthotopic liver transplantation, but is much less frequent
following renal and exceptional after lung allografting (9). Operational tolerance may
develop in the presence of human leukocyte antigen (HLA) –mismatching, development of
donor specific antibodies, and after episodes of acute cellular rejection, and has been well-
described following haematopoietic stem cell transplantation (10, 11). Investigation of the
clinical status of tolerant patients has demonstrated peripheral T-cell clonal alteration with
absent cytokine transcript accumulation (12), increased CD4+CD25hi cells following
peripheral blood immunophenotyping (13), and differentially expressed cell-cycle
regulation genes by microarray analysis (14). The effect of vaccination also suggests
heterogeneity of the humoral and cellular arms of the immune response in tolerant
recipients, including a degree of global immunodeficiency in some (15). Specific
biomarkers to identify potential tolerant patients do not exist. Similarly, despite empirical
progress in terms of immunosuppression minimisation (16, 17) and induction of mixed
chimerism (10, 18), no tolerizing protocols are accepted in routine clinical practice.
However, exploiting the tolerogenic potential of cellular immunotherapy, particularly
dendritic cell–based therapy, provides an opportunity to accomplish this goal.
28
1.2 Dendritic cell discovery, characterisation and biology
Dendritic cells (DC) comprise a fundamental component of both the innate and adaptive
immune system. They were first recognised as a rare cell type in secondary lymphoid
tissues (19-23) and subsequently found to be the most potent antigen presenting cell (APC)
in the body (24). Derived from haematopoietic stem cell precursors, DC are present in all
tissues, with the exception of immunologically privileged sites, such as the central nervous
system (25). DC efficiently capture, process and present antigen in the context of MHC
after migrating to T-cell rich areas with secondary lymphoid tissue. As an element of
adaptive immunity, DC are uniquely capable of initiating primary immune responses
following alloantigen exposure, due to high levels of co-stimulatory molecule expression
(26). DC also possess surface pattern-recognition receptors (PRRs) that recognise
pathogen-associated molecular patterns (PAMPs) (27), surface receptors expressed by all
micro-organisms, and thus are capable of effecting innate immunity by responding to
invading infection or inflammation. DC provide the cellular link between innate and
adaptive immunity. DC are also intrinsic to the development and maintenance of tolerance
to self-antigens, primarily responsible for negative selection of self-reactive T-cells within
the thymus during T-cell ontogeny (28) and ensuring peripheral tolerance is preserved
through presentation of autologous antigens under homeostatic conditions (29), a
fundamental feature in preventing autoimmunity.
Steinman and Cohn first identified DC as a novel cell type in the peripheral lymphoid
tissues of mice (19), demonstrating a distinct cell population distinguished by elongated
cytoplasmic processes and an apparent lack of endocytic capacity. The predominant
location of DC was the spleen (particularly the white pulp vessels) (20) where they account

29
for approximately 1% of the nucleated cell population (19). DC were also isolated from
lymph nodes and Peyer’s patches but not from other organs (liver, thymus and intestine).
Further work in vivo demonstrated that DC had minimal proliferative capacity, were
continually replaced within organs from a bone marrow-derived precursor pool, and were
sensitive to steroids and ionising radiation (23). The surface markers of DC were also
distinctive, characterised by Ia antigens, but lacking surface immunoglobulin and T-cell
antigens (22). The recognition that viable DC could be maintained in vitro for several days
(22) opened the way for further studies but their scarcity within tissues continued to make
this work difficult.
1.2.1 DC lineage
DC characterisation is based upon tissue location, cell morphology and immunophenotype.
Numerous DC cell surface markers enable identification of DC subsets and maturation
status. The conventional paradigm of DC-precursor division into distinct ‘myeloid’ and
‘lymphoid’ groups is no longer accurate with significant plasticity demonstrated, even by
apparently committed DC lineages. DC derivation remains essentially undefined in vivo
and is probably influenced by cytokine microenvironment and transcription factor
expression. Evidence for myeloid lineage was derived from in vitro human and mouse DC
differentiation from monocytes. The hypothesis for lymphoid progenitors was based on the
assumption and subsequent experimental confirmation that thymic DC (which developed
intrathymically) were derived from CD4lo precursors capable of fully reconstituting the
thymic population (30, 31). Recent discovery of a common, clonal DC precursor (Lin-
MHC class II-) arising from either myeloid or lymphoid progenitor has emerged, with

30
expression of CD11c occurring further downstream representing a divergence of the
conventional DC (cDC) and plasmacytoid DC (pDC) pathways (32, 33).
In mice models of DC ontogeny there is evidence for both myeloid- (34) and lymphoid-
derived (35) precursors. Initially these lineages were thought to correlate with CD8�- and
CD8�+ DC respectively, until it became clear that either haematopoietic precursor could
generate both subsets (36, 37). To further confuse the issue, it now appears that CD8�
cannot be reliably used as a marker for peripherally circulating DC (38), with myeloid DC
induced to express CD8� in vitro (39) and myeloid progenitors generating CD8� DC
following adoptive transfer (40). Murine LC can be generated in vitro from myeloid or
CD4lo lymphoid precursors (41, 42). Similarly, pDC are generated in vitro from a common
lymphoid progenitor (43), however a myeloid origin for pDC has also been proposed on
the basis of derivation of IL3Rhi DC (putative pDC) from CD34+M-CSF+ progenitors (44).
Cytokines required for in vitro development may be dispensable or redundant in vivo. GM-
CSF and GM-CSFR deficient mice both display normal DC development, as do TNF� and
TNFR1 deficient mice (45, 46). Flt3L appears to be essential to DC differentiation and
mobilisation in vivo (in both humans and mice), and although can give rise to myeloid DC
(mDC) or pDC, it preferentially promotes development of the latter. DC are absent in mice
homozygous for Ikaros gene mutation (critical to lymphoid development), reflecting either
a lymphoid origin for DC or an altered lymphoid organ environment (47). Defects in ratio
of CD8�+ or CD8�- DC has also been reported in mice deficient for PU.1 (defective
myelomonocytic lineage) and RelB (altered T-cell development and DC maturation) (48,
49).
31
In the case of human DC, the dispute over developmental lineage has been compounded by
difficulties surrounding DC isolation and culture both in vivo and in vitro, as well as the
presence of discrete subpopulations, with individual phenotypes, functions and varying
locations. DC were also initially considered to be myeloid-derived as in vitro assays used
to generate DC in culture utilise blood monocytes. A lymphoid aetiology for DC in humans
has also been established (50, 51). Thus, a dual model of DC origin, with both myeloid and
lymphoid precursors able to generate both subpopulations may be physiologically relevant.
It is unclear whether progenitor origin subsequently determines function or whether
cytokine manipulation used to drive differentiation in vitro is replicated under physiologic
conditions. In addition, it is uncertain if DC subtypes are representative of a single lineage
in varying states of activation with eventual function dependent on local stimuli (the
functional plasticity model), or products of separate lineages with earlier segregation
creating committed precursor DC (the specialised lineage model) (52).

32
1.2.2 DC phenotype
1.2.2.1 Rodent DC
Much of what is known about the immunobiology of DC is derived from murine studies.
Murine DC may be exclusively identified by expression of CD11c, and further
subcategorised by CD8� homodimer (53). The presence (or absence) of CD8� has allowed
description of two major subtypes: CD8�+ cells are located in thymic cortex and T-cell-
rich areas of lymphoid tissue, CD8�- cells are found within the splenic marginal zone and
migrate to T-cell zones upon antigenic stimulation (54). However, a more complex range
of surface molecules exists and is outlined in Table 1.2.2.1.
33
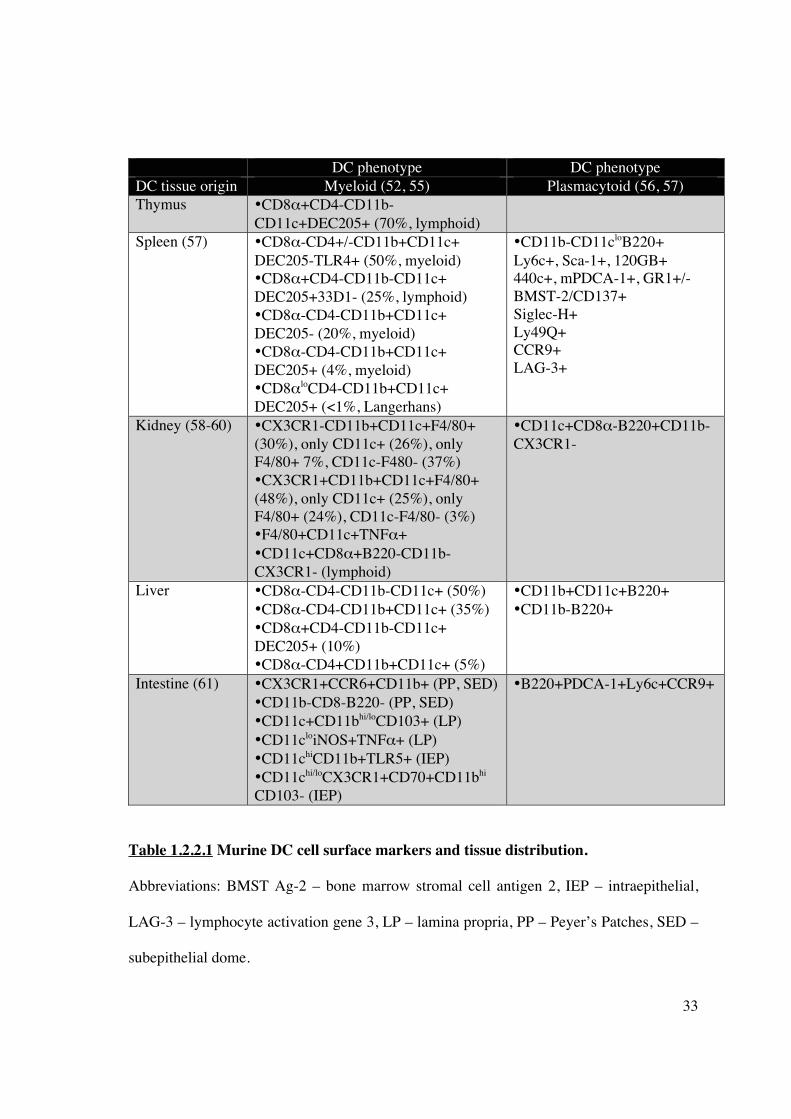
DC phenotype DC phenotype DC tissue origin Myeloid (52, 55) Plasmacytoid (56, 57) Thymus •CD8�+CD4-CD11b-
CD11c+DEC205+ (70%, lymphoid)
Spleen (57)
•CD8�-CD4+/-CD11b+CD11c+ DEC205-TLR4+ (50%, myeloid) •CD8�+CD4-CD11b-CD11c+ DEC205+33D1- (25%, lymphoid) •CD8�-CD4-CD11b+CD11c+ DEC205- (20%, myeloid) •CD8�-CD4-CD11b+CD11c+ DEC205+ (4%, myeloid) •CD8�loCD4-CD11b+CD11c+ DEC205+ (<1%, Langerhans)
•CD11b-CD11cloB220+ Ly6c+, Sca-1+, 120GB+ 440c+, mPDCA-1+, GR1+/- BMST-2/CD137+ Siglec-H+ Ly49Q+ CCR9+ LAG-3+
Kidney (58-60) •CX3CR1-CD11b+CD11c+F4/80+ (30%), only CD11c+ (26%), only F4/80+ 7%, CD11c-F480- (37%) •CX3CR1+CD11b+CD11c+F4/80+ (48%), only CD11c+ (25%), only F4/80+ (24%), CD11c-F4/80- (3%) •F4/80+CD11c+TNF�+ •CD11c+CD8�+B220-CD11b-CX3CR1- (lymphoid)
•CD11c+CD8�-B220+CD11b-CX3CR1-
Liver
•CD8�-CD4-CD11b-CD11c+ (50%) •CD8�-CD4-CD11b+CD11c+ (35%) •CD8�+CD4-CD11b-CD11c+ DEC205+ (10%) •CD8�-CD4+CD11b+CD11c+ (5%)
•CD11b+CD11c+B220+ •CD11b-B220+
Intestine (61) •CX3CR1+CCR6+CD11b+ (PP, SED) •CD11b-CD8-B220- (PP, SED) •CD11c+CD11bhi/loCD103+ (LP) •CD11cloiNOS+TNF�+ (LP) •CD11chiCD11b+TLR5+ (IEP) •CD11chi/loCX3CR1+CD70+CD11bhi CD103- (IEP)
•B220+PDCA-1+Ly6c+CCR9+
Table 1.2.2.1 Murine DC cell surface markers and tissue distribution.
Abbreviations: BMST Ag-2 – bone marrow stromal cell antigen 2, IEP – intraepithelial,
LAG-3 – lymphocyte activation gene 3, LP – lamina propria, PP – Peyer’s Patches, SED –
subepithelial dome.
34
Table 1.2.2.1 (cont’d) Myeloid DC in the splenic marginal zone efficiently stimulate
CD4+ and CD8+ T-cells, and favour Th2 differentiation under inflammatory conditions.
Lymphoid splenic DC efficiently cross-present exogenous antigens to CD8+ CTL,
maintain cross-tolerance, and favour Th1 differentiation under inflammatory conditions.
Plasmacytoid splenic DC mediate anti-viral responses via production of IFN�, and
possibly contribute to peripheral self-tolerance. By comparison, kidney mDC fail to
express CD4 or CD8� to the same degree as their splenic counterparts. However, an
immature phenotype (low CD80/86/40 expression) is demonstrated in all tissue-resident
DC, although renal DC display a greater ability to acquire foreign antigen (dextran
micropinocytosis). Intestinal DC are found throughout the lamina propria, isolated
lymphoid follicles and Peyer’s Patches. Lamina propria DC density is greater in the
intestine than spleen (11% versus 3%); functionally they are divided into 2 major classes
distinguished by expression of CD103 and their ability to differentially activate T-cells.

35
1.2.2.1.1 Murine DC subsets
Migratory DC represent conventional tissue-resident DC (cDC) and constitute 50% of
lymph node DC populations following migration from afferent lymphatics. They are
typically absent from both spleen and thymus, and initial observations suggested such cDC
died within lymph nodes, due to their paucity within efferent lymphatics. Langerhans cells
(LC) found in both epidermis and draining lymph nodes also represent classical migratory
DC, are characterised by a CD11b+CD11c+DEC205+CD4+ phenotype, high MHC class II
but variable CD8� expression, in addition to Birbeck granules, Langerin and E-cadherin
expression (57). The LC population is maintained from epidermal precursors capable of
clonal expansion, and continually effluxes to draining subcutaneous lymph nodes, although
BM replenishment has also been observed (62). Splenic DC lack a significant migratory
component and the CD4+ subtype dominates. The population arises from both localised
clonal expansion, retaining some capacity for cell division, and precursor-cell input from
bone marrow sources transiting through the circulation (63, 64). However, the splenic
precursor phenotype CD11cmidCD11bloCD45RAloCD43midSIRP�midCD4-CD8- does not
produce pDC (65). Thymic cDC are also mainly lymphoid-tissue in type, but constitute the
CD8+ subtype. Two distinct patterns of cDC development occur, one path governed by T-
cell development kinetics and another not linked to T-cell lineage and thus of bloodstream
origin (66).
Murine plasmacytoid DC have also been described (67, 68), and appear to arise from the
same common BM precursor as cDC, although they express a lymphoid development
profile similar to T- or B-cells. PDC lineage commitment is determined by the transcription
factor E2-2 which regulates expression of IFN-regulatory factors 7 and 8 (69). The

36
presence of high D-J gene rearrangements, although not essential for pDC development,
may also distinguish pDC from cDC. However, no pDC precursor lacking the ability to
transform into cDC has been identified, and BM pDC may alter their phenotype in the
context of viral infection (70). Splenic pDC are derived by passage of precursor pDC
through the peripheral circulation and subsequent acquisition of maturation markers. The
thymus can support pDC development, although their origin (endogenous versus BM-
derived) is unclear. PDC produce type I interferon and potently enhance NK-mediated
cytotoxicity. They display poor T-cell allostimulatory capacity as they lack both the
endocytic capacity displayed by cDC and cathepsins required for antigen processing. PDC
are capable of flexible T-cell responses: Th1 polarization may result from IFN� exposure;
Th2 responses independent of IL-4 are now implicated in tolerance induction (discussed
later) (71). The capacity of pDC to sense pathogens is dependent upon TLR expression and
the recognition of conserved components of micro-organisms, signalling through MyD88
and subsequently NF�B. TLR9 promotes response to CpG oligonucleotides (bacterial
DNA); TLR7 (highly homologous to TLR9) may discriminate nucleic acid structures and
single-stranded RNA viruses, and responds to synthetic guanine analogues (72-74). The
absence of TLR2-5 explains the lack of pDC response to peptidoglycans, LPS, or
poly(I:C), which mimic double-stranded viral RNA.
A new DC subset of IFN-producing killer DC (IKDC) has recently been described in mice.
They were characterised by CD11c+B220+NK1.1+CD49b+Gr1-, also expressed MHC
class II, produced type I and II interferons and mediated TRAIL-dependent cell lyses (75,
76).

37
Monocytes may also be direct precursors of migratory DC, accumulating in tissue and
spleen in response to inflammation and displaying identical function typically attributed to
pre-existent resident subsets (77-79). Under steady-state conditions, blood monocyte
subsets also transform into intestinal lymphatic DC (80). This has particular relevance to in
vitro studies of monocyte-derived DC that fail to correspond to the lymphoid counterparts
in vivo.

38
1.2.3 Human DC subsets
There are considerably fewer studies of human DC, although two broad categories of DC
have been described (myeloid and plasmacytoid DC) and at least five additional types
identified including Langerhans cell-derived DC, B-cell-like DC and follicular DC-non-
leukocytes (52, 81). The lack of expression of a canonical marker such as CD8 remains a
barrier for direct comparison with mouse DC, as there is no direct CD8+ DC equivalent.
Freshly isolated thymic, splenic and tonsillar DC demonstrate heterogeneity in CD4,
CD11b and CD11c expression, in keeping with the diversity of mouse DC (82).
The “myeloid” pathway (MHC class II+Lin-CD11c+ pre-MDC) generates Langerhans
cells (CD1a+Langerin+Birbeck granule+) found in epidermis, and interstitial DC (IDC)
(CD1a-) found in dermal and non-lymphoid tissues. MDC express other myeloid markers,
including CD4, CD45RO, CD11b, CD13, 33D1, Fc receptors (CD16, CD32, CD64), GM-
CSF receptors and all TLR (except 7, 9, 10). IDC also express distinct type I and type II C-
type lectins, including blood DC antigen (BDCA) -1 (previously denoted as CD1c) and
mannose receptors.
1.2.3.1 MDC markers - C-type lectins
MDC display an avid ability to capture antigens through several mechanisms including
macropinocytosis, phagocytosis, or adsorptive endocytosis via PRR (toll-like, C-type
lectin, or Fc receptors). C-type lectins possess carbohydrate recognition domains (CRD)
that bind sugar (mannose and galactose) motifs in a calcium-dependent manner and a
CRD-like domain that binds protein or lipids in a calcium-independent manner (83).
Typically lectins are transmembrane proteins, but may be secreted as a soluble protein (84).

39
Two distinct categories of membrane-bound lectins are recognised with grouping
dependent on the orientation of the amino terminus – outwards for type I, and inwards for
type II lectins (27). In addition, the latter only possess a single, extracellular CRD whilst
the former demonstrate several (often up to 10) such domains. The cytoplasmic tail
structure of C-type lectins varies widely, although a tyrosine-based domain targeting
intracellular endocytic vesicles, acidic amino acid and dileucine clusters appear to be
common features (27). It is the intracellular domain that mediates endocytosis, guiding the
antigen-receptor complex to distinct endosomal compartments.
The macrophage mannose receptor (MMR, CD206) is the archetypal member of the type 1
C-type lectin family and acts as predominantly as an antigen uptake and processing
receptor (85), although an additional important function is in innate host defence as a
pattern recognition receptor (PRR) detecting the pathogen-associated molecular patterns
(PAMPs) of invading microorganisms (86). DEC-205 (CD205) functions in a similar
manner for antigen internalisation, but is more specific to DC although it is also expressed
on thymic epithelial cells (87). Direct intracellular delivery of antigen to MHC class II-
containing compartments and repetitive recycling of CD205 to the DC surface allows
enhanced presentation of peptide-MHC complexes to T cells.
Type II C-type lectins exclusive to DC have also been described. Langerin (CD207)
expression is restricted to epidermal LC and involved in the formation of Birbeck granules.
DC-SIGN is the reciprocal receptor expressed by tissue-resident DC. It is structurally
similar to other C-type lectin surface markers, demonstrating carbohydrate-binding and
internalisation motifs, and is internalised when soluble ligands are bound, resulting in

40
efficient antigen presentation (88). DC-SIGN is abundantly expressed by in vitro human
monocyte-derived- (hu-Mo-) DC, and may be demonstrated on a subset of DC isolated
from the peripheral circulation (89, 90). DC-SIGN is essential to many aspects of DC
function. It was initially named for its Dendritic Cell-specific ICAM-3 grabbing
nonintegrin function and the interaction of DC-SIGN with ICAM-3 establishes the initial
DC-T-cell contact required for initiation of T cell immunity (91). It also mediates migration
of DC from blood in response to inflammatory signals or to replenish tissues, with
tethering and rolling of DC along blood vessels and lymphatics and subsequent
transendothelial migration established by binding of endothelial ICAM-2 to DC-SIGN
(89). DC-SIGN is exploited by HIV-1 through binding to the coat protein gp120, allowing
the virus to be trafficked directly to regional lymph node areas rich in T cells expressing
classical HIV receptors (CD4) (92).
PDC are distinguished phenotypically by CD45RA, high density expression of CD123
(interleukin 3 receptor � chain), distinct C-type lectins in BDCA-2 and –4 peripheral blood
and bone marrow (although BDCA-4 is not pDC specific), TLR 7 and 9, HLA-DR, and
ILT3 (93). BDCA-2 is vital to antigen internalisation and antibodies against this marker
inhibit type I interferon production. However, pDC lack lineage markers, myeloid markers
(including CD11c and CD1a) and Fc receptors.
Human DC cell surface markers are outlined in Table 1.2.3.

41
DC phenotype DC phenotype DC tissue origin Myeloid (52, 94) Plasmacytoid (52, 56) Thymus CD11c+CD11b-CD45ROlo
CD11chiCD11b+CD45ROhi (minority)
CD123+TSLP+
Spleen (57) CD11b+CD11c+CD123- HLA-DR+CD13+CD33+CD4+ CD2, CD4, CD9 CD45RO, CD68 CD1a,b,c,d Tars 1,2,4,5,6,8
CD11c-CD1a-CD123+HLA-DR+ CD13-CD33-CD4++ CD45RA Pre-T� �5 Ig1-like 14.1 Spi-B Tars 1,6,7,9,10 (+/-) ILT7
Kidney CD11c+ BDCA-1+BDCA-2- Type I C-type lections * Type II C-type lections ** CD68 DC-LAMP (mature DC)
CD11c- BDCA-1- BDCA-2+ HLA-DR+ DC-SIGN-
Liver CD45 CD11a CD18 CD200 (mature DC)
Peripheral blood (95)
• CD11c+CD123-BDCA3+ ^ • CD11c+CD16+CD14-CD33lo HLA-Droll(40-80%) • CD11c+CD1b/c+CD33+CD14- HLA-DR+ (20-50%) • CD11cloBDCA3+CD14-CD33+ HLA-DR+CD62L (2-3%) • CD14+CD2+ (exhibit DC characteristics) All subsets lack CD206, 207, 209
BDCA-2 (CD303) BDCA-4 (neuropilin-1) # CD123+/- (increases with in vitro culture) CD62L+
Table 1.2.3 Human DC cell-surface markers and tissue distribution.
* DEC205 (CD205), macrophage mannose receptor (MMR, CD206) ** DC-SIGN, dectin 1&2, DC immunoreceptor (DCIR), C-type lection receptor (CLEC1) ^ small subset # restricted to pDC in peripheral blood and bone marrow
42
1.3 The dual function of DC in transplantation – immunogenicity versus tolerance
1.3.1 DC function
DC remain critical to the maintenance of central and peripheral tolerance under
homeostatic conditions, and are essential to the initiation and regulation of adaptive T-cell
responses in solid organ and cellular transplantation. The local cytokine microenvironment
and the maturation state of DC determines an immunogenic or tolerogenic response. DC
function is facilitated by antigen uptake. In the context of an inflammatory stimulus, this
process induces maturation of immature DC which is associated with phenotypic changes,
including down-regulation of chemokine, phagocytic and endocytic receptors necessary for
antigen uptake, up-regulation of co-stimulatory molecules (CD40, CD80, CD86), down-
regulation of CD68, and up-regulation of DC-LAMP (96). There are also recognised
morphological changes associated with DC maturation including the acquirement of
improved cellular motility (97), and these changes facilitate migration of DC from the
periphery to draining lymph nodes (98). Within secondary lymphoid tissues, DC present
processed antigen/peptide coupled to major histocompatibility complexes (MHC) to T
cells, allowing for selection of antigen-specific cluster designation CD4+ T-helper cells
(26). Complete activation of T-cells requires three separate but complementary signals
(Figure 1.3.1), facilitating prolonged TCR engagement by formation of an immunological
synapse (99, 100). The physical organisation of the immunological synapse is characterised
by a ring of adhesion molecules (including CD2, CD48, LFA-1, ICAM-1) that form the
peripheral supramolecular activation cluster around the central TCR-peptide-MHC
complex (101). Expanded, activated CD4+ T-helper cells subsequently amplify the immune
responses by regulating antigen-specific (e.g. CD8+ cytotoxic T-cells, B-cells), and antigen
non-specific effectors cells (e.g. macrophages, NK cells, and eosinophils). A quiescent
43
immune response may be mediated by regulatory T-cell (Treg), T-cell anergy or deletion
(discussed in Section 1.5).
CD80/86 are also located within the immunological synapse, and possess pivotal but dual
roles in DC-T-cell interactions. Binding to CD28 facilitates T-cell activation but is also
crucial to maintaining Treg viability (102); cross-linking with CTLA-4 induces IFN�
production (and a Th1 response) and subsequently generates indoleamine 2,3-dioxygenase
(inhibiting T-cell proliferation) (103).

44
Figure 1.3.1 An outline of immunogenic DC-T-cell interaction. Direct alloantigen
presentation involves donor-derived DC presenting antigenic peptides to naïve recipient
CD4+ T-cells (TCR) in the context of (foreign) MHC class II (signal 1). Engagement of
MHC/TCR is a non-covalent and relatively weak interaction but promotes up-regulation of
DC co-stimulatory molecules CD80/86 and CD40, which interact with their respective T-
cell ligands (CD28 and CD40L) and induce activation (signal 2). Both signals lead to
production of IL-12 and IL-2, promoting active T-cell proliferation and development of
effectors T-cells capable of attacking an allograft. The production of cytokines also
stimulates activation and proliferation of catalytic CD8+ T-cells, B-cells and natural killer
(NK) cells.

45
1.3.1 The passenger leukocyte theory - immunogenic DC
Hart et al. first reported the absence of Ia+ cells (effectively DC) from long-term rat renal
allografts (104). However, in a process first described by Larsen et al. (105), donor DC
migrate from the allograft to recipient lymphoid tissue (initially draining lymph nodes and
then spleen) to initiate direct alloantigen recognition. This pathway initiates acute allograft
rejection, but may also be critical to the development of donor-specific tolerance by
inducing microchimerism through long-term parenchymal persistence of donor-derived
DC. The migratory cellular component of the interstitial compartment is then replaced by
recipient DC (106), directing the immune response towards indirect allorecognition. DC
from the recipient circulation and surrounding tissues are attracted to the allograft by
chemotactic stimuli induced by ischaemia-reperfusion injury, process foreign antigen, and
present processed donor peptides to antigen-specific T-cells in the context of recipient
MHC (Figure 1.3.2). Although this pathway only contributes to 10% of donor
alloreactivity (107), it is implicated in the development of regulatory T-cell responses and
chronic allograft nephropathy (108, 109), in addition to acute rejection (110). A third,
semi-direct pathway has been proposed by Smyth et al. (111) involving the exchange of
MHC/antigen between donor and recipient DC, T-cells and endothelium by direct cell
contact or exospores. The dominant role of the direct pathway in allograft rejection
provides a logical basis for manipulating donor-derived DC to establish a model of
transplant tolerance. However, concomitant targeting of recipient-derived DC may be
essential to establishing a successful model.

46
Figure 1.3.2 A summary of tissue-resident DC influx and efflux in relation to the kidney
Adapted from Rogers et al. (112).
47
The presence of DC within an allograft remains essential to the development of rejection
and numerous studies investigating elimination of DC have demonstrated development of
graft tolerance. Eradicating donor DC by pre-treatment with cyclophosphamide and
irradiation prior to rat cardiac allograft resulted in prolonged survival (113), as did
elimination of DC from murine islet allografts using monoclonal antibodies (114), although
not all results were consistent following transplantation across MHC barriers (115).
Restoration of immune function and consequent rejection of a previously stable graft could
also be induced by an infusion of donor DC (116). Clinically, pre-MDC and pre-PDC (but
not peripheral leukocyte) numbers are reduced immediately following solid organ
transplantation, possibly as a consequence of immunosuppressive medication (117, 118).
Peripheral blood DC precursors are reduced in both acute cardiac and renal allograft
rejection, with recovery only of circulating pre-MDC following resolution (119, 120).
These studies suggest DC are noticeably involved in the regulation of transplant immunity.
1.3.3 DC density as a marker of organ allogenicity
The development of stereological tools (which allows estimation of particle numbers
within a structure in the absence of dimensional information) has enabled quantification of
tissue-resident DC. Both DC number and their maturational state are thought to be key
determinants of allograft outcome. Analysis of non-parenchymal cells, identified by
constitutive MHC class II expression within commonly transplanted organs (heart, kidney,
pancreas), demonstrated that DC represent approximately 40-60% of tissue-resident
leukocytes (121). These results contrasted with findings in the liver, which had up to 20
times the number of leukocytes, but only 20% were DC. The authors proposed that DC
density within the organ parenchyma, rather than absolute number, is an important
48
determinant of allograft outcome. The results correlate with animal models of
transplantation – heart allografts have the highest DC density and are acutely rejected,
compared to liver grafts which display a much lower DC density and may exhibit extended
survival. The kidney, with DC density somewhere in-between, exhibits a low rate of
spontaneous acceptance. Indeed, administration of a haematopoietic growth factor fms-like
tyrosine kinas 3 ligand (Flt3L) to donors prior to liver allografting dramatically increases
DC numbers and leads to rejection of grafts that would otherwise be accepted (122, 123).
Acute cellular rejection in renal allografts in humans demonstrates significantly increased
cellular staining for DC-SIGN, with DC clusters around glomeruli (124).
1.3.4 Renal ischaemia-reperfusion injury
Mononuclear cells including DC, macrophages and CD4+ T-cells migrate into the kidney
following ischaemia-reperfusion injury (IRI) (125). This cellular infiltrate occurs even in
the absence of alloantigen, and has been demonstrated following syngeneic transplantation
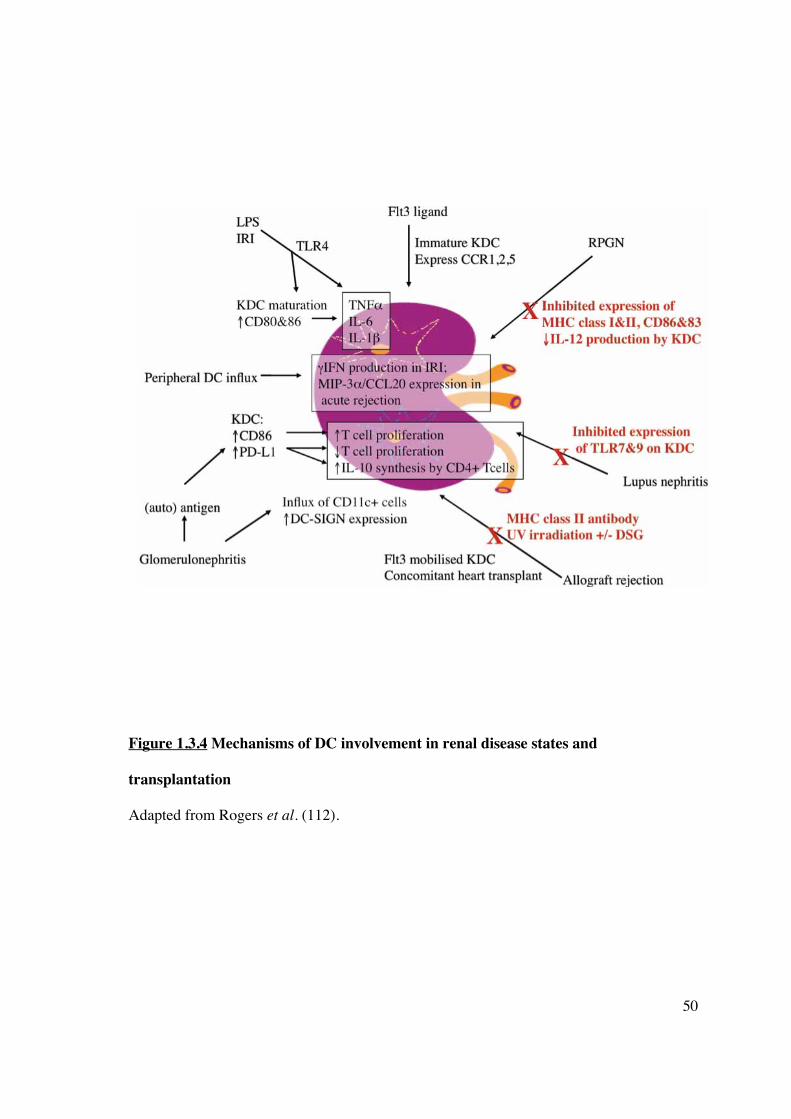
(126). Thus, DC recruitment to the site of injury forms a fundamental component of the
innate immune response and provides a link to adaptive immunity generated by the
presence of alloantigen (Figure 1.3.4). Release of pro-inflammatory cytokines (e.g. IFN�)
following the IRI sustained during organ retrieval and transplantation itself mobilises DC
into the allograft, although the origin of these cells remains unclear. Endothelial cells are
activated by hypoxia and display suppression of NO signalling due to impaired nitric oxide
synthase (NOS) activity, facilitating DC adhesion and migration (127). A component of the
innate immune response initiated by IRI is mediated by resident renal DC. Tumour necrosis
factor-alpha (TNF�) is one of the earliest synthesised cytokines responsible for generating
cellular influx and parenchymal damage. Renal DC are the predominant source, and

49
maximal TNF� production by other leukocytes is dependent on their presence (128). Most
cells express TNF receptors, and high TNF� levels at the time of inflammation or
transplantation induces renal tubular epithelial cell apoptosis and release of antigen, in
addition to binding and transendothelial migration of leukocytes. This process has
implications for the pathogenesis of glomerulonephritis and allograft rejection, which may
develop as a result of renal DC gaining access to glomerular (allo-) antigens. This process
facilitates dissemination of antigen(s) and presentation to T-cells by mature DC, thus
initiating an immunogenic response. Numerous chemokines have been reported to attract
DC to the allograft, although macrophage inflammatory protein (MIP)-3�/CCL20,
produced by proximal renal tubular epithelial cells (129) and activated monocytes (130),
appears to be the main chemokine responsible. Renal tubular MIP-3�/CCL20 expression is
increased in acute cellular rejection and provides a stimulus for accumulation of immature
DC in the renal transplant (131).
50
Figure 1.3.4 Mechanisms of DC involvement in renal disease states and
transplantation
Adapted from Rogers et al. (112).

51
1.3.5 Tolerogenic DC
DC are responsible for both central and peripheral tolerance under homeostatic conditions.
DC are vital in the development of central tolerance with thymic DC deleting self-reactive
T-cells (28). This process also occurs in the periphery, enabling tolerance to self-antigens
that would not have access to the thymus during early development (29). Tolerance during
homeostasis is preserved through immature, tissue-resident DC bearing apoptotic bodies
from cell turnover continuously trafficking to T-cell rich areas of lymph nodes and
presenting self-antigens to T-cells in the absence of co-stimulation (132). DC also obtain
cell-associated antigen by “nibbling” membrane and cytoplasm from live cells (133) and
presentation of antigens in this manner renders T-cells unresponsive (134). The conditions
under which cellular material is acquired is crucial to subsequent T-cell response as DC
phagocytosis of necrotic cells induces an immunogenic response (135). Generation of
regulatory or aneroid T cells, T cell deletion and skewed production of Th2 subset of helper
T cells are additional mechanisms of tolerance (136).
1.3.6 Allograft tolerance as a function of DC phenotype
In the transplant setting, numerous experimental observations have demonstrated the
tolerogenic potential of DC. An infusion of donor splenic DC has been shown to prolong
organ allograft survival in mice (137), persisting donor DC are seen in tolerant allograft
recipients (138, 139) and DC are an essential requirement for the donor-specific transfusion
effect of allograft tolerance (140). Tolerogenic DC are not restricted to a specific DC
subset; although mDC have been traditionally viewed as promoting tolerance, pDC have
also been implicated. Plasmacytoid DC can promote Treg responses in vitro (141-143), and

52
infused donor-derived pre-pDC prolong cardiac allograft survival (144) in a manner
enhanced by blocking CD154 (145).
Antigen-bearing DC capable of initiating either immunogenic or tolerogenic responses was
thought, at least initially, to be distinguished by maturation status. A paradigm of dual DC
function has been supported by data demonstrating that an infusion of donor (146) or
recipient (147) immature DC, or maturation-resistant DC (148) prolong graft survival in
rodent models, and the effect is potentiated by suboptimal immunosuppression (149).
There is also increasing evidence that mature DC are necessary for the maintenance of
tolerance to autologous and innocuous foreign antigens during homeostasis. Unlike
immature DC, the mature counterparts express the chemokine receptor CCR7, a
prerequisite for migration to draining lymph nodes and possess costimulatory molecules
allowing efficacious presentation of antigen to T-cells and the production of both
tolerogenic CD8+ T-cells (150) and CD4+ regulatory T-cells (Tregs) (151).

53
Morelli et al. (152) have summarised the characteristics of tolerogenic DC (tolDC),
represented in Figure 1.3.6:
� low net expression of positive co-stimulatory molecules, particularly compared to
negative regulatory molecules such as programmed death ligand-1,
� low production of IL-12p70, high IL-10 and IDO production,
� resistance to maturation in response to a variety of signals (TLR, CD40L),
� ability to generate or expand adaptive or naturally occurring Tregs and promote
apoptotic death of effector T-cells,
� maintained ability to acquire antigen,
� ability to migrate to secondary lymphoid tissue in vivo,
� in vivo longevity and resistance to NK-mediated killing.
Whilst immature DC fulfil some of the above criteria, display immunosuppressive features
in vitro (153, 154), and mildly prolong allograft survival (155, 156), such DC are not
capable of establishing prolonged inhibitory immunity required for tolerance.

54
Figure 1.3.6 Diagram of tolerogenic DC generated in vitro: potential mediators and
consequent effect on DC phenotype and function.
Adapted from Morelli et al. (152).
NOTE: This figure is included on page 54 of the print copy of the thesis held in the University of Adelaide Library.
55
1.4 Generation of tolerogenic DC in vitro
1.4.1 Manipulation of in vitro culture conditions
Alteration of the cytokine microenvironment can successfully inhibit DC maturation in
vitro to produce tolDC. Both granulocyte macrophage colony-stimulatory factor (GMCSF)
and IL-4 are required to generate hu-Mo-DC, low dose GM-CSF alone in culture medium
produces immature murine bone-marrow-derived DC that prolong allograft survival (148).
Use of IFN� (157), vasoactive intestinal peptide (158), hepatocyte growth factor (159) and
IL-21 (160) in conjunction with GM-CSF applied in vitro has also demonstrated generation
of tolDC. Interleukin-10 and transforming growth factor beta (TGF-�) both provide
negative regulatory signals (161), inhibiting DC maturation (162, 163) and inducing T-cell
anergy (164), apoptosis (165), or Th subset deviation (166).
1.4.1.1 Interleukin-10
IL-10 is produced by the Th2 subset of CD4+ helper T cells, B cells, macrophages, mast
cells, and DC subpopulations identified in Payer’s patches (167) and the liver (168). IL-10,
delivered by retrovirus or added to culture media, has multiple potent paracrine effects on
hu-Mo-DC, including decreased production of IFN� (169) and IL-12 (170) consistent with
inhibition of a Th1 response, decreased expression of co-stimulatory molecules particularly
MHC class II and CD83, inhibition of a primary allogeneic T-cell response, and induction
of antigen-specific anergic T-cells (171). IL-10-mediated T-cell anergy has been associated
with the production of regulatory T-cells (172). Mature DC appear to be resistant to the
effects of IL-10 due to lack of expression of the high-affinity receptor, IL-10R1 (173). The
ability of IL-10 to modify the T-cell-mediated inflammatory immune response has led to
interest in its use in organ transplantation. In vivo administration of IL-10 protein, IL-10
56
gene transfer and IL-10 transgenic animal models have all been tested. Human and viral
IL-10 share essential biological activity (174), although only the former has been
demonstrated to be consistently beneficial in prolonging graft survival (173). The
immunomodulatory effect of IL-10 in vivo is determined by the time-course of exposure in
relation to allografting and presumably reflects the ability of IL-10 to affect DC-mediated
T-cell activation. Patients with elevated IL-10 levels prior to bone marrow transplantation
demonstrate longer survival and a lower incidence of graft-versus-host disease (175),
although increased serum levels post-transplantation were associated with higher mortality
(176). Similarly for solid organ grafts, post-operative administration of IL-10 following
murine cardiac allografting exacerbated rejection (177), but recipient pre-treatment
enhanced survival (178).
1.4.1.2 Transforming growth factor-��
Transforming growth factor (TGF)-� exists as 3 isoforms. TGF-�1 exhibits the broadest
spectrum of biological activity, promoting early DC development but suppressing
maturation in vitro (179). In murine studies this has correlated with down-regulation of
TLR4 and reduced sensitivity to LPS stimulation, impaired T-cell stimulating capacity, an
inability to produce IL-12p70 or IL-6, and inhibited CCR7 expression (180). The molecular
target may be the transcription factor RunX3 (181). Adenoviral mediated overexpression of
TGF-�1 has enhanced tolerogenicity but promoted allograft fibrosis in vivo (182).
1.4.2 Pharmacologic manipulation
A wide array of pharmacological strategies may be used to generate tolDC in vitro:

57
� Corticosteroids – the immunosuppressive effects of steroids were initially ascribed to T-
cells alone. Steroids are now known to inhibit hu-Mo-DC differentiation (183, 184);
production of IL-10 by corticosteroid-exposed DC has been reported, as has IL-10
production by regulatory T-cells and inhibition of a Th1 response (185, 186).
� 1�,25(OH)2D3 – has marked immunomodulatory effects on both DC and T-cells.
Expression of both a vitamin D receptor (VDR) and 25-hydroxy-vitamin D3-1�-
hydroxylase by hu-Mo-DC indicates vitamin D3-mediated regulation of function (187).
Vitamin D3-treated DC are maturation-resistant (188), and the use of donor-derived vitamin
D3-modified DC in vivo combined with mycophenolate mofetil prolonged pancreatic islet
allograft survival associated with development of CD4+CD25+FoxP3+ Tregs (189).
� Calcineurin inhibitors (CNI) – cyclosporin (CsA) and tacrolimus exert their effect by
binding intracellular cyclophilin and FKBP12 respectively, inhibiting nuclear factor of
activated T-cells (NFAT)-mediated suppression of immune gene transcription (190, 191).
CNI also suppress the 20S proteasome regulator PA28-� and PA28-� subunits which are
involved in MHC class I-restricted antigen presentation to CTL (192). CsA was
demonstrated to inhibit endocytic capacity of freshly sorted CD11c+ DC, but not hu-Mo-
DC or murine BM-derived DC (193, 194). The effect of either CNI on DC maturation is
disputed, and at best moderate and heterogeneous (195, 196).
� Mammalian target of rapamycin (mTOR) inhibitors: rapamycin (sirolimus) is the most
extensively studied member of this group of drugs that complex with the intracellular
receptor FK506-binding protein 12 and inhibit downstream signalling required for DC
maturation. DC differentiation from hu-Mo- or murine BM-derived precursors is not
inhibited by rapamycin, but conditioned mDC are resistant to maturation following
exposure to a variety of stimuli (including LPS, IL-4 and CD40L) and produce limited

58
quantities of IL-12p70 (197, 198). RAPA-DC enrich for FoxP3+ Tregs in vitro and in vivo,
reduce effector T-cell expansion, and prolong rodent cardiac allograft survival in
conjunction with low-dose rapamycin (198). Unlike calcineurin inhibitors, rapamycin does
not interfere with tolerance induction (199).
� NF-�B inhibitors – NF-�B is required for functional DC maturation and a number of
immunomodulatory agents promote tolerance induction in this manner. Deoxyspergualin
(DSG) in combination with anti-CD154 has been shown to inhibit donor-specific
alloimmune responses and induce prolonged skin and cardiac allograft survival (200). Use
of the DSG analogue LF15-0195 alone generated tolDC (201), and in conjunction with
CD45RB monoclonal antibody increased parenchymal immature DC and Treg numbers
following rodent heart transplants (202). The importance of NF-�B inhibition in the
induction of tolDC is supported by evidence from RelB KO mice or use of the NF-�B
inhibitor BAY11 7082 (203).
� Others pharmacologic agents such as aspirin (204), N-acetyl cysteine (205), sanglifherin
A (206), and mycophenolate mofetil (207) have also been used to manipulate DC function
in vitro.
1.4.3 Manipulation with cell by-products
� Exosomes – are produced by most living cells following invagination of late endosomes,
which then form multivesicular structures released into the extracellular environment after
fusion with plasma cell membrane. By definition they are 50nm in diameter, contain a
cytosolic compartment and express MHC, integrins, heat-shock and cytoskeletal proteins,
and metabolic enzymes, but no proteins of nuclear, mitochondrial or Golgi origin (208-
210). In vivo, exosomes are a source of antigen, are efficiently internalised by DC

59
independent of complement without promoting maturation (although with no resistance to
subsequent maturation stimuli) and facilitate alloantigen presentation to CD4+ T-cells
(211). They have been used to manipulate the indirect pathway of allorecognition
prolonging rodent cardiac allograft survival and induce antigen-specific tolerance (212,
213).
� Apoptotic bodies – intestinal DC in afferent lymph nodes carry epithelium-derived
apoptotic bodies, critical for the maintenance of peripheral tolerance (214). Early-phase
apoptotic cells express ligands recognised by pathogen recognition receptors on DC and
fail to induce phenotypic maturation (215), unlike necrotic cells (216). This process is
regulated by the tyrosine kinase MerTK, which negatively regulates NF�B (217). In vivo,
splenic marginal zone DC endocytose apoptotic bodies mediated via complement, and
down-regulate pro-inflammatory and Th1-driving cytokine responses (218). Intravenous
injection of donor apoptotic splenocytes enhances BM engraftment across MHC barriers
and cutaneous hyporesponsiveness (219, 220), and prolongs murine cardiac allograft
survival in a manner that is mediated by recipient DC (221).
Both cell products can be used to target DC in situ and avoid ex vivo modification.
1.4.4 Genetic manipulation
Additional modulation of DC function and phenotype can be achieved by gene-transfer
technology (discussed in Section 1.6.1) for DNA delivery or RNA interference. Genes for
immunomodulatory cytokines and molecules represent obvious targets for manipulation to
induce tolDC.
� IL-10 – the potential benefits of IL-10 have been previously described (see section
1.4.1.1). IL-10-transduced DC stimulate Treg expansion and T-cell mediated IL-10
60
secretion (222), and abrogate rejection in a humanised immunodeficient mouse skin
transplant model (223).
� Cytotoxic T lymphocyte associated antigen-4 (CTLA-4) - is a member of the
immunoglobulin family expressed by T-cells, particularly Tregs (224). It is the negative
regulator for CD80 / 86 on DC and other APC, but has a higher affinity for these molecules
compared to CD28, and induces T-cell anergy. CTLA-4 immunoglobulin (CTLA-4-Ig) is
an immunosuppressive fusion protein of CTLA-4 and immunoglobulin that blocks CD28
stimulation by CD80 / 86, thereby reducing T-cell activation. DC exposed to CTLA-4-Ig in
soluble form produce IDO, which in turn inhibits clonally T-cell expansion (225). Myeloid
DC transfected with CTLA4-Ig gene constructs produce T-cell hyporesponsiveness and
inhibit IDO up-regulation (226), and enhance transplant survival (227). Soluble CTLA-4-Ig
has been used for tolerance induction in non-human primates (228).
� IDO - Indoleamine 2,3-dioxygenase (IDO) is the rate-limiting enzyme responsible for
catabolism of the essential amino acid tryptophan. Its role in the immune response was first
described in relation to inhibition of pathogen proliferation (229) and tumour cell growth
(230) an effect mediated by interferon-gamma (IFN-�) (231). The revelation that IDO was
expressed by trophoblast cells and prevented foetal rejection (232) presumably by
preventing maternal T cell attack by tryptophan depletion initiated renewed interest in IDO
and its role in regulating the immune response. IDO is expressed in cells of myeloid
lineage (including DC) and up-regulated in response to inflammatory cytokines,
particularly IFN�, IL-1, tumour necrosis factor (TNF) (233) and lipopolysaccharide (LPS)
(234). In mouse models, IDO activity has been shown to be present in the CD11c+CD8�+
subset following treatment with IFN-� (235), as well as in CD8�- DC after exposure to
CTLA4-immunoglobulin (236). BM-derived murine DC prolong skin allograft survival via

61
proliferation of CD4+CD25+FoxP3+ Tregs (237). Human DC will also express IDO in
response to the same stimuli, however experimental data showing suppression of T-cell
responses is inconsistent (238, 239). Munn et al. reported macrophage-derived DC
expressing IL-3 receptor �-chain (CD123) and chemokine CC-motif receptor 6 (CCR6)
were IDO positive (240), although attempts to repeat these findings have demonstrated that
the same DC subpopulation neither expresses IDO nor suppresses T-cell responses (239).
� other genes – induced expression of Fas ligand (CD95) or TNF-related apoptosis-
inducing ligand deletes antigen-specific T-cells, and programmed cell death ligand-1
promotes T-cell anergy. Blockade of the NF�B pathway leads to maturation-arrest of DC
and impaired T-cell activation (241, 242).
1.4.5 Recipient pre-conditioning with tolerogenic DC
Numerous small animal transplant studies have established the potential of DC
conditioning to induce indefinite vascularised allograft survival (outlined in Morelli et al.
(152)). The successful use of donor- or recipient-derived DC, with or without adjuvant
therapy to enhance tolerogenicity, provides persuasive evidence that DC infusions can
suppress the alloimmune response. However, translation of these results into pre-clinical
(non-human primate) or clinically applicable human trials has been limited. Infusion of
stably immature DC modified with vitamin D3 and IL-10, with and without CTLA4-Ig, into
rhesus macaque monkeys demonstrated initial sensitisation and subsequent non-antigen-
specific immunosuppression (243). Dhodapkar et al. (244) administered two million
influenza antigen-pulsed immature DC subcutaneously to induce short-term (30 days)
antigen-specific effectors T-cell dysfunction. Optimal DC subset, phenotype and adjunctive
manipulation, route of administration and dosing schedule, strategies to avoid NK-

62
mediated DC destruction and maintain homing to lymphoid tissue all require resolution
before DC-based therapy can attain clinical translation.
1.5 Mechanisms of DC-induced tolerance
DC may promote tolerance by multiple mechanisms (Figure 1.5) and this effect is
mediated via T-cell hyporesponsiveness.
1.5.1 Regulatory T-cells (Tregs)
Down-regulation and termination of T-cell responses to an antigenic stimulus is necessary
for homeostatic control of immunity once it has been initiated. Peripheral control of
autoreactive T-cells that have escaped thymic deletion or recognised extrathymic antigens
is also required for prevention of autoimmunity, and a distinct subset of T-cells responsible
for ensuring tolerance to self-antigens were initially identified by Gershon et al. (245). In
the absence of an immunological disturbance, “naturally occurring” regulatory T-cells
(Tregs) exist and their proportion of all circulating T-cells remains constant (246). Most
experimental evidence supports the view of a thymic origin of functionally mature Tregs,
rather than recirculating, peripherally-derived cells (247, 248). A definitive marker for
Tregs has not yet been established; regulatory activity is found predominantly, but not
exclusively, within the CD4+ population (249). Tregs co-express CD25 – the � subunit of
the IL-2 receptor – and constitute a minor population (5-10%) of T-cells within the
peripheral circulation (250) and thymus (251, 252) in normal humans. An identical
phenotype has been identified in murine lymph node (253) and thymus (252). Typically,
CD25 cannot be detected on resting CD4+ T-cells but expression is up-regulated following
antigen exposure and consequent T-cell activation. Tregs express high, sustained levels of
63
CD25 in contrast to transient expression on activated T-cells (254). Further characteristics
that distinguish Tregs include higher expression of CD5 (255), CD69 (253), the
glucocorticoid-induced tumour necrosis factor-like receptor superfamily (GITR) (256),
CD103 (257) and CD122 (251) (although the latter not in mice models (249)), lower level
expression of CD45RB (in mice only) (258), and expression of intracellular CTLA-4 (259)
and/or the transcription factor forkhead box P3 (FoxP3), although none of these markers
are pathognomonic (260).
1.5.1.1 Functional studies
In vitro assays demonstrate that CD25+ T-cells suppress both CD4+ and CD8+ CD25- T-
cells through inhibition of IL-2 mRNA production in the responder cells. Direct cell
contact is required (253) leading to G1-S phase arrest and responder cell death, and only
small numbers of Tregs are required to profoundly inhibit proliferative T-cell responses
(261). Suppressor function is antigen non-specific (262). Initial in vivo studies of Tregs
demonstrated that adoptive transfer of CD4+CD25+ cells could prevent autoimmunity in
mice (263), confer transplant tolerance when isolated from rats with long-term cardiac
allografts (264) and prevent graft-versus-host disease following bone marrow
transplantation (265). Whilst Tregs are thought not to require the presence of APC to
mediate suppression, they lead to a reduction in co-stimulatory molecule expression and
thus stimulatory capacity that may convert new effectors T-cells to a regulatory phenotype,
a process known as infectious tolerance (266-268). Linked unresponsiveness is another
mechanism for developing a tolerant state, with the recipient generating Tregs after
exposure to an incomplete complement of alloantigens (269).

64
1.5.2 T regulatory type 1 (TR1) cells
In vitro, repetitive stimulation of naïve CD4+ T-cells with allogeneic immature DC, in the
presence of IL-10, produces a T-cell phenotype that secretes high levels of IL-10 (but not
IL-2 or -4) (270). These Tregs manifest their immunosuppressive capacity on activated Th1
cells by inhibiting antigen-specific proliferation and cytokine production through direct cell
contact and autocrine production of IL-10, and TGF� and down-regulate APC stimulatory
function. This effect is antigen non-specific and can be reversed by exogenous IL-2,
demonstrating properties similar to ex vivo CD4+CD25+ T-cells. A similar result has been
demonstrated in vivo, following injection of influenza-peptide pulsed immature DC (244).
TR1 cells maintain peripheral tolerance in vivo following HLA-mismatched stem cell
transplantation and have been detected in patients with spontaneous operational tolerance
to kidney or liver allografts (271, 272). The persistence of Tregs in the peripheral
circulation appears to be dependent upon the presence of relevant antigen, as well as co-
stimulatory molecule expression on DC, particularly CD40 and CD80/86. The absence of
signalling through CD154 (CD40L) and CD28 respectively leads to impaired Treg
homeostasis and a predisposition to autoimmunity (273, 274).
1.5.3 T-cell anergy
The regulation of T-cell tolerance is also determined by the development of anergy, in
which lymphocytes exist in a hyporesponsive state following an encounter with antigen.
The functional inactivation is characterised by limited cellular proliferation, differentiation
and cytokine production and distinguishing these cells from those with a regulatory or Th2
phenotype. The B7/CD28 signalling pathway directly inhibits production of anergic factors
(275) and growth factors such as IL-2 promotes cell-cycle progression (276); anergy is the

65
product of TCR occupancy in the absence of costimulatory molecule expression by APC.
Anergic T-cells may also be generated by exposure to IL-10 directly, or to IL-10-
modulated immature DC (277). Plasmacytoid DC (pDC2) are capable of inducing CD4+ T-
cell anergy in vitro, possibly due to impaired CD40 expression and an absence of up-
regulated CD80/86 (278). Anergic T-cells are characterised by a lack of antigen-specific
proliferation, down-regulated expression of CD25, reduced production of IL-2 and IFN-�,
and in contrast to Tregs, produce neither IL-10 nor TGF-� (171, 279).
1.5.4 T-cell deletion
Data from animal models of allograft acceptance have suggested that donor DC mediate T-
cell deletion through an active process known as donor APC-induced activation-induced
cell death (AICD) (199). Apoptosis of alloreactive T-cells occurs 2 to 4 days following
murine liver transplantation and coincides with successful organ engraftment and donor-
specific tolerance (280). When liver allograft rejection is potentiated by the administration
of Flt3L (to the donor) (122), IL-12 or IL-2 (to the recipient) (280) T-cell apoptosis is
significantly reduced. Inhibition of DC costimulatory molecule surface expression
increases their apoptotic capacity for alloactivated T-cells (281).
1.5.5 Induction of T helper 2 (Th2) cells
DC can skew the immune response towards generation of Th2 subset of CD4+ helper T-
cells. Th2 responses promote production of IL-4 and IL-10, shifting away from a pro-
inflammatory IL-2 and IFN� response associated with allograft acceptance, and may also
initiate bystander suppression on APC preventing them from providing co-stimulation to
naïve T-cells and generating a Th1 immune response (282). G-CSF mobilised

66
haematopoietic stem cells induce lower rates of GVHD, by increasing percentages of stem
cell-based pDC which induce allogeneic Th2 responses (283).
Figure 1.5 Mechanisms by which DC may promote tolerance in vitro or in vivo
Adapted from Coates et al. (284).
67
1.6 DC immunotherapy
As the most potent APC, DC are fundamental to acquiring, processing, and initiating T-cell
mediated immunity following allogeneic transplantation. Ex vivo targeting of DC requires
cell isolation and propagation, antigen exposure and re-injection, an approach that is
logistically complex. This time frame required obviates their application to some clinical
situations, such as deceased organ donation. DC must be maturation-arrested: injected
immature DC may mature in vivo and promote recipient sensitisation, and only a fraction
of injected DC transit to secondary lymphoid tissue as the majority are killed by recipient
NK cells (285). A rational approach to altering the immune response to an allograft would
be to target and engineer tissue-based tolerogenic DC in vivo. This potential has been used
with success in the cancer setting with the generation of vaccines designed to initiate and
potentiate an immune response (286). Following the advances in knowledge regarding DC
biology, we propose that this technique can be varied to produce an immunosuppressive or
tolerogenic effect using an appropriate biological vector and agent. This approach would
potentially provide the advantage of targeting both donor and recipient alloimmune
responses. A variety of delivery vectors are available to potentially transducer DC function.
1.6.1 Genetic manipulation of DC
A variety of vectors, viral and non-viral, are available for transfer of genetic and
pharmacologic material into cells (Table 1.6.1). Multiple viral groups (Poxviridae,
Adenoviridae, Retroviridae) have been studied as a method of facilitating molecule
delivery. The disadvantages of viral delivery include the generation of antibody responses
to expressed viral proteins killing the target cells that should be producing the therapeutic
effect, integration of viral genes into the host chromosome, clearance of virus delivered

68
systemically and adaptive immunity to repeated administrations, difficulty altering viral
tropism to direct infection to the target cells and variable transduction efficacy. DC are
terminally differentiated and poorly targeted by some viral vectors (retroviruses).
Adenoviral transfection does not disrupt DC function, although DC maturation has been
reported (287, 288). Hu-Mo-DC lack the primary cell attachment molecule (coxsackie
adenovirus receptors) for adenovirus serotype 5 (289), although recent modifications had
facilitated high-level DC transfection via binding to cell-surface CD46 (290).
Non-viral transfection techniques include electroporation, lipofection, ultrasound, and
ballistic gene transfer. Whilst these methods avoid the biological hazard and immunogenic
disadvantages of viruses, they are plagued by low transfection efficiency (291) particularly
when targeting non-dividing cells. Liposomes, niosomes, micelles, dendrites,
microcapsules, cell ghosts and lipoproteins comprise nanotechnology and have multiple
clinical applications as pharmaceutical delivery systems since they were first discovered
(292) and their potential was first recognised (293, 294). Non-viral transduction does not
alter DC maturation, co-stimulatory molecule expression (295) or cytokine production
(296).

69
Gene therapy vector Advantages Disadvantages Non-viral nanoparticles
• Low immunogenicity • Easily modified for cellular targeting and slow degradation • Low production costs • Good safety profile • Clinical experience
• Transient gene expression (modifiable)
Adenoviral • No insertional mutagenesis • High transfection efficiency • High titres may be generated • Infects dividing and non-dividing cells • Clinical experience
• Preferential hepatic targeting • Strong immunogenicity (limits re-administration) • Moderate production costs
Retroviral • Clinical experience • Prolonged transgene expression • Transgene expressed in progeny cells
• Difficult manufacture • Potential for insertional mutagenesis • Transfection of non-dividing cells in limited
Lentiviral • Infects dividing and non-dividing cells • High transfection efficiency
• Difficult manufacture • Potential for insertional mutagenesis • Lack of clinical experience
Adeno-associated viruses
• Long-term transgene expression • Low toxicity
• Difficult manufacture • Potential for insertional mutagenesis • Strong immunogenicity • Lack of clinical experience
Table 1.6.1 Comparison of gene therapy techniques
Non-viral vectors are easily and cheaply manufactured, and can undergo extensive
modification to improve systemic distribution and cell targeting. Viral vectors can induce
high transfection efficiency but have significant safety concerns, particularly retroviruses,
which are replication-competent. Adapted from Jenne et al. (286).
70
1.6.2 Liposomes
1.6.2.1 Liposome structure
Liposomes are small particulate structures produced by suspending natural or synthetic
(phospho)lipids in water-based media. Amphiphilic lipids are poorly soluble in water as
monomers and spontaneously assemble into bilayers to form closed vesicles. In an aqueous
environment, the polar lipid heads align towards the polar (aqueous) environment whilst
the hydrophobic tails aggregate to minimise contact with water, a process known as the
hydrophobic effect. Polar molecules are unable to form hydrogen bonds to the lipophilic
areas and become more ordered around the lipid bilayer. Cross-sectional analysis of lipid
bilayers derived from computer simulation demonstrates composite layers with distinct
characteristics:
(1) the outermost layer consists of perturbed water,
(2) the second layer contains water, lipid headgroups and upper portions of acyl chains
(3) the third innermost layer consists of ordered acyl-chain segments (297).
Lipids used for liposomal preparation are derived from biological membrane lipids that
vary in charge, molecular weight and transition temperature: hydrocarbon chains are
esterified to a glycerol backbone, and this hydrophobic part is linked to a hydrophilic
headgroup (phosphate- or carbohydrate-based) that may be cationic, anionic, dipolar or
uncharged (298, 299). Thus, liposomes are biocompatible, non-antigenic, non-pyrogenic
and physiologically degradable.
Lipids possess characteristic transition temperatures that enable existence in a solid (gel) or
liquid phase, the latter facilitating random exchanges by lateral diffusion (300). Lipid
bilayer fluidity is relative to ambient temperature and determined by lipid chain transition
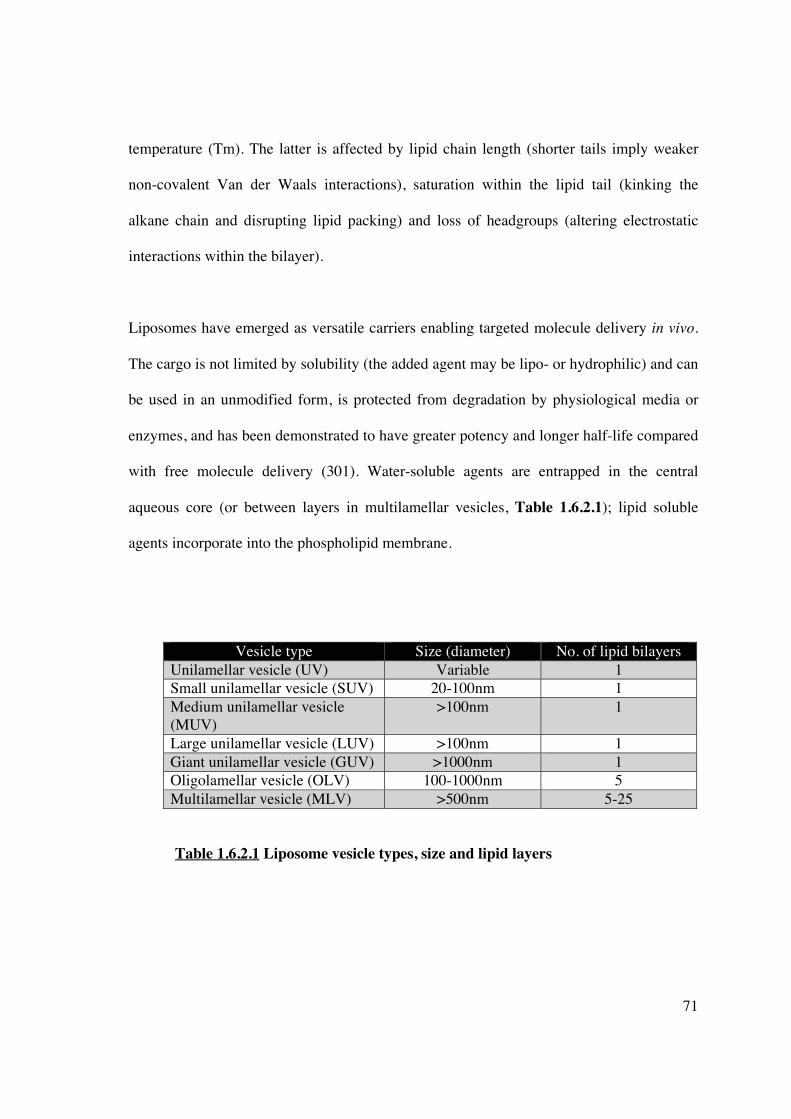
71
temperature (Tm). The latter is affected by lipid chain length (shorter tails imply weaker
non-covalent Van der Waals interactions), saturation within the lipid tail (kinking the
alkane chain and disrupting lipid packing) and loss of headgroups (altering electrostatic
interactions within the bilayer).
Liposomes have emerged as versatile carriers enabling targeted molecule delivery in vivo.
The cargo is not limited by solubility (the added agent may be lipo- or hydrophilic) and can
be used in an unmodified form, is protected from degradation by physiological media or
enzymes, and has been demonstrated to have greater potency and longer half-life compared
with free molecule delivery (301). Water-soluble agents are entrapped in the central
aqueous core (or between layers in multilamellar vesicles, Table 1.6.2.1); lipid soluble
agents incorporate into the phospholipid membrane.
Vesicle type Size (diameter) No. of lipid bilayers Unilamellar vesicle (UV) Variable 1 Small unilamellar vesicle (SUV) 20-100nm 1 Medium unilamellar vesicle (MUV)
>100nm 1
Large unilamellar vesicle (LUV) >100nm 1 Giant unilamellar vesicle (GUV) >1000nm 1 Oligolamellar vesicle (OLV) 100-1000nm 5 Multilamellar vesicle (MLV) >500nm 5-25
Table 1.6.2.1 Liposome vesicle types, size and lipid layers

72
1.6.2.2 Liposome synthesis
Several methods exist for liposome formulation: phospholipids are initially prepared by
hydration in an organic solvent that is
(1) removed by film deposition under vacuum by a rotary evaporator, then rehydrated
using aqueous buffer which induces the lipids to swell and form liposomes, or
(2) dried under a stream of N2 gas, followed by probe or bath sonication after the
addition of aqueous media (292).
When liposomes are initially made, size distribution and lamellarity are heterogeneous, but
additional procedures can generate uniformly size. The subsequent suspension can be
extruded through polycarbonate filters to produce particles of uniform size (297), or
sonicated. The former method is more likely to produce particulate uniformity; sonication
disrupts MLV, but produces liposomes with membrane defects that have a subsequent
tendency to aggregate. Spectroscopic characterisation of particle size can measure turbidity
by conventional spectrophotometers or light intensity scatter by photon correlation
spectroscopy (302, 303). Hydrophobic or hydrophilic drugs can be incorporated into
liposomes using these methods, although water-soluble agents require more efficient
approaches to achieve a higher degree of encapsulation. Lipids bilayers in a fluid state
readiy incorporate hydrophobic drugs whose solubility correlates with a high octanol-water
partition coefficient (LogP). Additional methods, such as replacement of organic solvents
(reverse phase evaporation or dehydration-rehydration) can be used to entrap
macromolecules (304), and freeze-thawing can promote protein encapsulation (305).

73
1.6.2.3 Systemic behaviour of liposomes in vivo
Biodistribution of liposomes is critical to maximising cellular targeting. Without
modification, conventional liposomes are rapidly cleared from the bloodstream within 90
minutes, predominantly by the hepatic reticuloendothelial system (306, 307) and mediated
by opsonisation (307) (Figure 1.6.2.3.1). This limits their ability to target other cellular or
tissue components. Optimising lipid composition, liposomal size, membrane fluidity, or
surface charge, it is possible to extend the therapeutic index of liposomal carriers over
conventional formulations. Alterations in lipid composition, such as the addition of
cholesterol, acts as a stabilising agent by abolishing lipid-phase transition, lowering
membrane permeability, and modulating membrane-protein interactions and lipid
exchange. The addition of sterically stabilising lipids (such as phosphatidylinositol,
polyethylene glycol or the monosialoganglioside GM1) (308), creates “stealth” liposomes,
prolonging their time in vivo by up to 2 days (309). Opsonisation, and thus non-specific
cellular uptake is reduced by
(1) shielding surface charge,
(2) increasing surface hydrophilicity,
(3) repulsion of blood components, and
(4) formation of a polymeric surface layer impermeable to opsonins (310-312).
The presence of PEG (or GM1) also improves preparation stability by preventing liposomal
aggregation in serum (311). It has been demonstrated that optimal stability is produced by
the addition of 5-10% polyethylene glycol-phosphatidyethanolamine (PEG), although
PEGylated liposomes may not fuse as effectively with their target (297).
74
Further structural changes that enhance target delivery can be made by anchoring receptors
or ligands (such as monoclonal antibody) to the liposome surface, creating
immunoliposomes (Figures 1.6.2.3.1-2) (313, 314). Targeted liposomes offer significant
advantages over conventional liposomes or free drug administration by dramatically
increasing the amount of agent delivered to a cellular target. The addition of a targeting
group also contributes to development of a “stealth” liposome phenotype, prolonging
circulation times.
Whole monoclonal antibodies (immunoglobulin of the IgG subtype, human or chimeric) or
antibody fragments are the most commonly used targeting ligands. Fragments may be
F(ab’)2 which can be generated by pepsin digestion of the Fc domain of IgG, Fab’
generated by reduction of disulfide bonds in the hinge region of F(ab’)2, or single chain Fv
(scFv) containing recombinant VL and VH regions linked by a short peptide sequence.
Targeting moieties may be attached to a liposome by covalent binding, or insertion of a
hydrophobic component into a liposomal membrane. However, the cross-linking process
can be difficult to perform and does not guarantee correct orientation of the protein on the
liposome surface, leading to reduced efficacy (315). In addition, the majority of liposome
are still hepatically endocytosed as a consequence of reduced target-liposome interaction
(316). The presence of antibodies on liposomes can increase immunogenicity by triggering
complement-mediated cytotoxicity (317, 318), promote clearance via Fc receptor-mediated
uptake by unwanted cell targets such as macrophages and mast cells, or reduce therapeutic
potential by formation of anti-idiotypic antibodies.

75
Figure 1.6.2.3.1 Diagram of stealth immunoliposome avoiding opsonisation and non-
targeted cellular uptake
Following intravenous administration, liposomes are rapidly captured by the RES and
removed from circulation. Mononuclear phagocytes do not bind liposomes themselves but
recognise opsonins bound to the liposomes surface. Opsonising proteins include
immunoglobuins, fibronectin, C-reactive protein beta-2-microglobulin. Complement
components are also capable of opsonisation, and assembly of the membrane attack
complex can induce lytic pores and release of liposomal contents. Interaction with
lipoproteins also induces release of encapsulated agents. Adapted from Torchilin (319).
NOTE: This figure is included on page 75 of the print copy of the thesis held in the University of Adelaide Library.

76
Figure 1.6.2.3.2 Diagram of a stealth immunoliposome to facilitate DC targeting in vivo
Liposomes can be preferentially directed to cells using whole antibodies or fragments
highly specific for cell-surface antigens. The use of scFv may be the least immunogenic
option and can be engineered to attach to a histidine polypeptide (6H) chain. This
combined molecule will then non-covalently link to a Ni2+-containing residue (NTA3-
DTDA), described in more detail in Chapter 6. Adapted from Altin et al. (320).
77
1.6.2.4 Liposome trafficking
The primary pathway for cellular entry is similar to viral infection: endocytosis (which
may/may not be receptor-mediated) and endosomal encapsulation (Figure 1.6.2.4).
Multiple endocytic pathways exist: clathrin- and caveolin-mediated, macropinocytosis and
phagocytosis, which may be size, composition, charge and cell-target dependent (321-323).
Endoscopes are directed towards the lysosomal pathway and eventual intracellular
degradation, or redirected for exocytosis (typically larger >1000nm diameter particles)
(324, 325).
1.6.2.5 Utility of liposomes in pathophysiological states
Liposomes may also accumulate in interstitial sites with pathological “leaky” vasculature,
such as tumours, areas of infarction or inflammation, which promote molecular
extravasation via fenestrated gaps. Accumulation is facilitated by a lack of functional
lymphatics normally responsible for drainage of macromolecules, an effect known as
enhanced permeability and retention (EPR) (326-329).
Currently, the main use of liposomes as drug carriers is cancer chemotherapy, although
they can be readily applied to the field of transplantation, with DC as a potential cellular
target.

78
Figure 1.6.2.3 Liposome-cell interactions
Liposomes can bind to or fuse with cells via (1) specific surface receptors, (2) non-specific
Fc receptors after binding to opsonins, (3) fusion with cell membrane releasing their
contents cytoplasmically, (4) micropinocytosis or passive diffusion where the liposome
membrane is adsorbed onto the cell surface, in addition to (5) direct or protein-mediated
transfer of lipid components between membranes. Liposomes encapsulated by (6)
endosomes are delivered to (6a) lysosomes or (6b) degrade the endosome, liberating the
contents. Modification of liposomes by viral components can provoke (7) endocytosis and
endosomal fusion. Uptake mechanisms 2-6 occur with unmodified liposomes; the first
mechanism is accessible only by immunoliposomes. Adapted from Torchilin (319).
NOTE: This figure is included on page 78 of the print copy of the thesis held in the University of Adelaide Library.

79
1.7 Non-human primates in transplantation research
Strategies for the use of DC immunotherapy to promote immune tolerance have been well
established in rodent models. Lesser degrees of immune system complexity and a relative
lack of environmental antigenic exposure (heterologous immunity) have ensured a
considerably easier task in successfully inducing tolerance in rodents. However,
considerable genetic, physiologic and immunologic differences to humans remains,
limiting both extrapolation of significant findings and the potential for clinical
applicability. Non-human primate (NHP) models remain a pre-requisite in translational
transplant research, and have major advantages over rodent models by virtue of genetic and
biological homology with humans. Nevertheless, evaluation of DC-based therapies in non-
human primates (NHP) remains extremely limited.
The common marmoset, Callithrix jacchus, a new world monkey, is an established
research model in areas of fertility (330), autoimmune disease (including multiple
sclerosis) (331, 332), hypertension (333), and drug screening (334, 335). It has several
advantages as an experimental model including small size, which promotes ease and lower
cost of animal husbandry, and high fecundity with no threat to species preservation
particularly when compared to other NHP species. Despite significant evolutionary
distance from humans (>55 million years), marmosets possess ample genetic similarity. In
particular, >90% homology of co-stimulatory molecules involving DC-T-cell interactions
has been demonstrated, in addition to an average of 86% homology between marmoset and
human immune-related proteins (336-338).
80
Previous work has confirmed the common marmoset, Callithrix jacchus, as a novel,
feasible NHP model to explore DC-based transplant tolerance strategies. This has
demonstrated an extensive panel of cross-reactive antibodies for immunophenotyping of
leukocyte subsets (339-341), allowed selection of immunologically disparate animals to
predict appropriate immune responsiveness in vitro and transplant studies (342, 343), and
characterised marmoset DC immunobiology (344). To date, there have been no published
studies of DC-based therapy in an NHP transplant model. The work undertaken in this
thesis with regard to the development of tolerogenic DC and in vivo DC-targeting seeks to
successfully apply these techniques to a valid NHP model.

81
1.8 Thesis aims and hypotheses
The key aims of this thesis are to:
1] examine the ability of a novel biologic agent, curcumin, to generate tolerogenic DC in
vitro, which in turn would promote immune hyporesponsiveness through the expansion of
regulatory T-cells,
2] subsequently test the ability of tolerogenic DC, modified ex vivo, to modulate the
adaptive immune response, and induce Tregs and consequent immune hyporesponsiveness
in vivo in a small animal model,
3] establish the ability of liposomes to incorporate a variety of immunomodulatory agents,
distribute systemically, and thus target and induce tolerogenic DC in vivo,
4] investigate the use of liposomes in the modification of ischaemia-reperfusion injury, a
critical event in initiating graft immunogenicity in a transplant setting, and
5] investigate the endocytic specificity of a human-DC-targeted liposome and its ability to
be used in a non-human primate model by virtue of genetic homology with humans.
This work creates a platform from which novel, cell-free, DC-based immunotherapy can be
developed in the future, and potentially applied to large animal models with translational
relevance.

82
CHAPTER 2: MATERIALS AND METHODS
This chapter describes protocols and procedures related to laboratory techniques and
animal-based procedures used in the studies in this thesis. Additional comments on specific
issues relating to methodology may also be found in other relevant chapters.
2.1 Cell culture
2.1.1 Human
2.1.1.1 In vitro propagation of human monocyte-derived DC (hu-Mo-DC)
Human monocyte–derived DC (hu-Mo-DC) were prepared according to previously
described protocols (345). Briefly, buffy coats from healthy donors were obtained from the
South Australian Red Cross Blood Service. Whole blood was transferred into 50ml
centrifuge tubes, diluted with 35ml PBS and underlayed with Ficoll-PaqueTM Plus density
gradient (Amersham Biosciences) using a pasteur pipette. Samples were centrifuged at
600g for 20 minutes at room temperature without braking, and the PBMC layer carefully
collected. If substantial red cell contamination was noted, the cell pellet was incubated in
10ml of cell lysis buffer at 37°C for 7 minutes, and washed 3 times with PBS. Viability and
cell count was assessed with trypan blue (Sigma Aldrich) staining and a haemocytometer.
PBMC fractions were resuspended and then panned in 75cm2 flasks for 45-60 minutes in
RPMI 1640 (Invitrogen) with 1% heat-inactivated foetal bovine serum (HI FBS,
Invitrogen). The non-adherent cells were removed with extensive PBS washes. The
adherent fraction was cultured for 7 days in complete medium [RPMI/10% HI FBS/2mM
L-glutamine (MultiCel)/penicillin-streptomycin 50U/ml (Cytosystems)], supplemented
with 800U/ml human recombinant GM-CSF (Schering Plough) and 400U/ml human
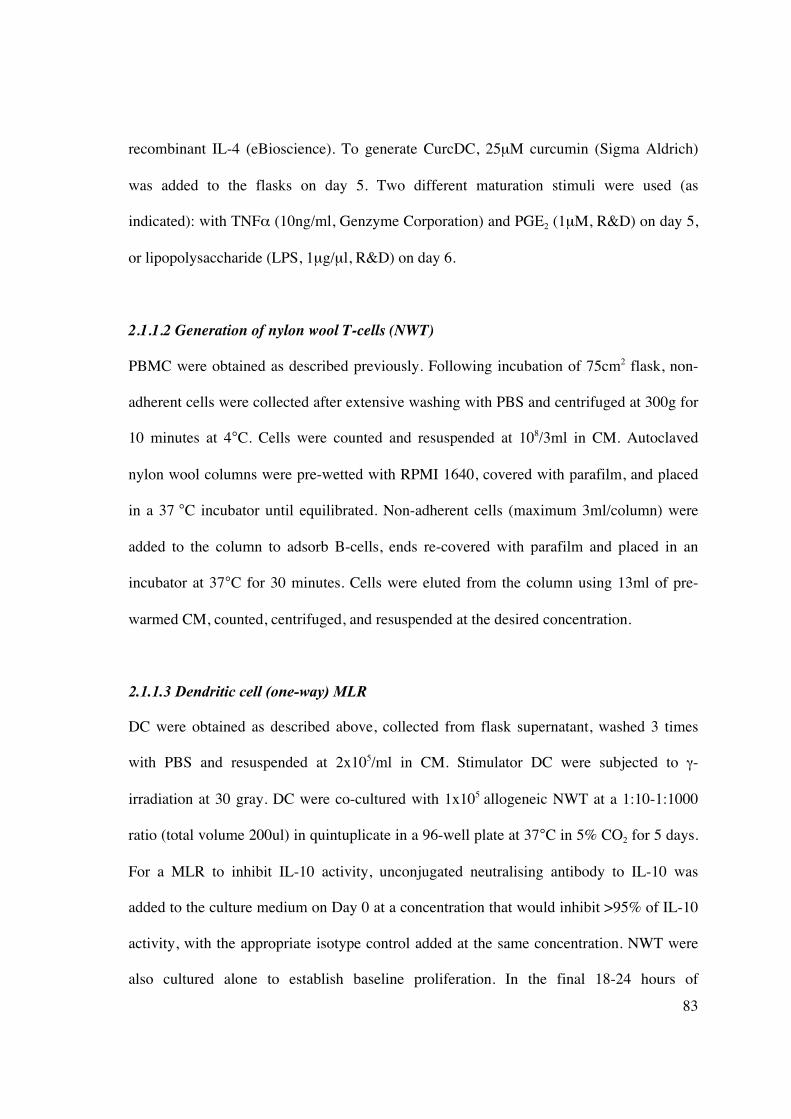
83
recombinant IL-4 (eBioscience). To generate CurcDC, 25μM curcumin (Sigma Aldrich)
was added to the flasks on day 5. Two different maturation stimuli were used (as
indicated): with TNF� (10ng/ml, Genzyme Corporation) and PGE2 (1μM, R&D) on day 5,
or lipopolysaccharide (LPS, 1μg/μl, R&D) on day 6.
2.1.1.2 Generation of nylon wool T-cells (NWT)
PBMC were obtained as described previously. Following incubation of 75cm2 flask, non-
adherent cells were collected after extensive washing with PBS and centrifuged at 300g for
10 minutes at 4°C. Cells were counted and resuspended at 108/3ml in CM. Autoclaved
nylon wool columns were pre-wetted with RPMI 1640, covered with parafilm, and placed
in a 37 °C incubator until equilibrated. Non-adherent cells (maximum 3ml/column) were
added to the column to adsorb B-cells, ends re-covered with parafilm and placed in an
incubator at 37°C for 30 minutes. Cells were eluted from the column using 13ml of pre-
warmed CM, counted, centrifuged, and resuspended at the desired concentration.
2.1.1.3 Dendritic cell (one-way) MLR
DC were obtained as described above, collected from flask supernatant, washed 3 times
with PBS and resuspended at 2x10⁵/ml in CM. Stimulator DC were subjected to �-
irradiation at 30 gray. DC were co-cultured with 1x10⁵ allogeneic NWT at a 1:10-1:1000
ratio (total volume 200ul) in quintuplicate in a 96-well plate at 37°C in 5% CO2 for 5 days.
For a MLR to inhibit IL-10 activity, unconjugated neutralising antibody to IL-10 was
added to the culture medium on Day 0 at a concentration that would inhibit >95% of IL-10
activity, with the appropriate isotype control added at the same concentration. NWT were
also cultured alone to establish baseline proliferation. In the final 18-24 hours of

84
incubation, each well was treated with 1 μCi of tritiated thymidine ([3H]; Amersham
Biosciences). Cells were harvested using a Tomtec Harvester 96 Mach III M. T-cell
proliferation via [3H] incorporation was determined in a liquid scintillation counter (Wallac
Oy Microbeta® Trilux1450) and expressed as mean (of replicate samples) counts per
minute (cpm) ± SD. Statistical comparison between groups was performed using the
Student’s t test, with p <0.05 deemed as significant.
2.1.1.4 Isolation of T-cells from a MLR using Automacs��
DC and NWT were generated as per protocol. NWT were incubated in 96-well plates with
DC at a ratio of 1:100 in CM at 37 °C, 5% CO2. After 5 days, cells were removed and
washed once in running buffer. Up to 108 cells were incubated in 80ul of rinse buffer and
20ul of anti-CD3 immunomagnetic beads (Miltenyi Biotec) for 15 minutes at 4°C in the
dark. Samples were then washed once in running buffer, resuspended in 500ul of running
buffer and processed through the Automacs� using Positive Selection settings. Purity and
yield was assessed by flow cytometry for CD3 (see Figure 2.1.1.4).
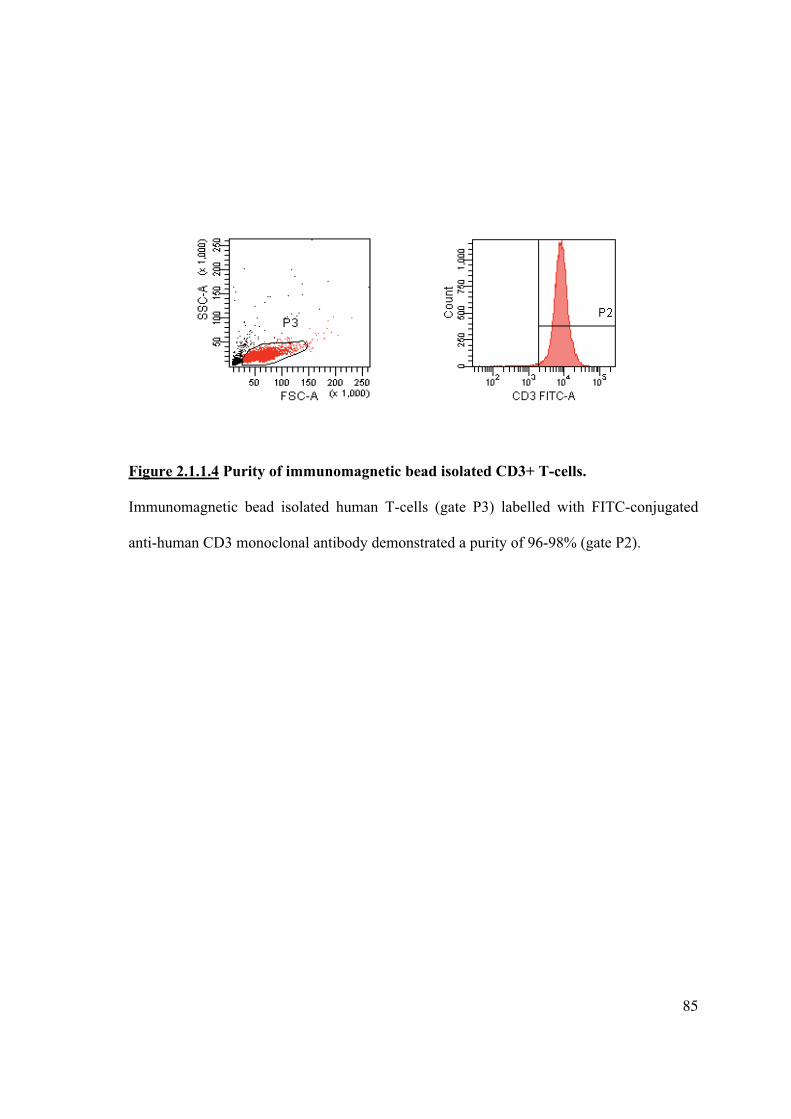
85
Figure 2.1.1.4 Purity of immunomagnetic bead isolated CD3+ T-cells.
Immunomagnetic bead isolated human T-cells (gate P3) labelled with FITC-conjugated
anti-human CD3 monoclonal antibody demonstrated a purity of 96-98% (gate P2).

86
2.1.1.5 Secondary MLR
To assess subsequent proliferative responses, T-cells (2x10⁵/ml) isolated from the primary
MLR were re-cultured with �-irradiated mature DC (2x10⁵/ml) from the same donor as the
primary MLR or 3rd party donor. For the suppression assay, T-cells isolated from the
primary MLR were co-cultured with or without naïve syngeneic T-cells (2x10⁵/ml) at
various ratios (1:1-1:20) also in the presence of �-irradiated mature DC (2x10⁵/ml) from the
same donor as the primary MLR or 3rd party donor (see Figure 2.1.1.5). All cells were
cultured in 200μl of CM in quintuplicate wells in a 96-well round-bottomed plate at 37°C
in 5% CO2 for 5 days. In the final 18 hours of incubation 1μCi of [3H]-thymidine
(Amersham Biosciences Ltd, Sweden) was added. Cells were harvested onto glass-fibre
filters (Wallac Oy, Turku, Finland) and counted in a Microbeta� Counter (Tomtec,
Hamden, USA). All experimental samples are expressed as mean (of replicate samples)
counts per minute (CPM) + SD. For flow cytometric analysis of the proliferating
population, cells were harvested and stained for relevant cell-surface and intracellular
markers as per protocol.
87
Ratio of Tresp cells:Treg cells
Tresp cells Treg cells Stimulator cells (irradiated DC)
1:0 5x10⁴ - 1x10⁴ 1:1 5x10⁴ 5x10⁴ 1x10⁴ 2:1 5x10⁴ 2.5x10⁴ 1x10⁴ 5:1 5x10⁴ 1x10⁴ 1x10⁴
10:1 5x10⁴ 0.5x10⁴ 1x10⁴ 20:1 5x10⁴ 0.3x10⁴ 1x10⁴
Figure 2.1.1.5 Suppression assay to functionally analyse regulatory T-cells generated
by tolerogenic DC.
Responder T-cells (Tresp) are T-cells syngeneic to T-cells initially co-cultured with DC in
the primary MLR. Regulatory T-cells (Tregs) represent the T-cells isolated from the
primary MLR following co-culture of T-cells with CurcDC. Tresp and Tregs were co-
cultured at different ratios with stimulator cells from the primary donor or 3rd party donor
antigens. Absolute cells numbers varied but the ratios remained constant.

88
2.1.2 Marmoset
2.1.2.1 Marmoset colony maintenance
The primate colony is closely overseen by the local Animal Ethics Committee (formerly
the Queen Elizabeth Hospital AEC and currently the Institute of Medical and Veterinary
Sciences AEC, project numbers 149/07 and 150/07). Maintenance of the colony is in
accordance with guidelines set by the National Health and Medical Research Council.
Standard operating procedures for enclosure maintenance, diet, health checks and
environmental enrichment have been developed by Animal House staff.
2.1.2.2 Peripheral blood sampling
Up to 2ml of PB was obtained via femoral vein venepuncture at any one time following
mobilisation with rhG-CSF as described previously (344). The protocol for venepuncture
was as follows:
1. Wear gloves, gown, hat and eye protection.
2. Catch marmoset and place in metal transport box. Move to procedure room.
3. Remove monkey and place in harness with legs secured by straps.
4. Feed monkey yoghurt / banana during procedure
5. Swab femoral region with 70 % ethanol
6. Use 27.5 gauge needle with syringe and draw 1 ml blood from femoral vein
7. Remove needle and place pressure on site for 3-5 min
Check for bleeding once leg is removed from straps, and again before returning monkey to
cage.

89
2.1.2.3 Cell isolation protocols
All washes were performed in 10-50ml volumes by centrifuging at 400xg for 7 minutes at
4oC and decanting the supernatant unless otherwise specified.
2.1.2.4 PBMC isolation
Whole blood was transferred into 10ml (for marmoset samples of 300-1500μl volume) or
50ml (for human samples of 10ml volume) centrifuge tubes, diluted with 7 or 35ml PBS,
respectively and underlayed with 2 or 12ml of Ficoll-Hypaque (Amersham Biosciences).
Samples were centrifuged at 800xg for 25 minutes at room temperature without braking,
and the PBMC layer carefully collected, washed 3 times with PBS with 0.5% FCS then re-
suspended in CM or running buffer. If persistent red cell contamination was noted, the cell
pellet was re-suspended in 2mls of cell lysis buffer and incubated at 37°C for 5 minutes,
and washed a further 3 times. Viability and cell count was assessed with trypan blue
(Sigma Aldrich) staining and a haemocytometer.
2.1.2.5 One-way MLR
Allogeneic PBMC from animals chosen by Caja-DRB genotyping (342) were used as
responder cells. Stimulator PBMC were subjected to irradiation at 30Gy. PBMC (1 x 10⁵
from each animal) were cultured in triplicate wells in a 96 well plate at 37º C in 5% CO2
for 5 days. To obtain baseline data, 1 x 10⁵ PBMC from each animal were cultured alone.
T-cell proliferation was determined as described above.

90
2.1.3 Murine
2.1.3.1 Isolation and administration of allogeneic murine DC
C57BL/6 mice were housed at the Institute of Medical and Veterinary Science (IMVS)
Animal House Facility (Frome Road, Adelaide, Australia) with free access to food and
water. The University of Adelaide and IMVS animal ethics committees approved all
experimental protocols. Mice were humanely euthanized by CO2 inhalation and spleen and
all lymph nodes (subcutaneous and intraperitoneal) were removed and placed in CM on ice.
Spleens were partially digested in a petri dish using collagenase D (1mg/ml, Roche) and
the cell suspension passed through a 70μm filter (BD PharMingen). Red blood cells were
lysed with NH4Cl (5ml added for 3 minutes at 37°C), washed twice with PBS and
resuspended in rinse buffer. Up to 108 cells were incubated in 400μl of rinse buffer and
100μl of anti-CD11c immunomagnetic beads (Miltenyi Biotec) for 15 minutes at 4°C in
the dark. Samples were then washed once in running buffer, resuspended in 500μl of
running buffer and processed through the Automacs� using Positive Selection settings.
Purity and yield was assessed by flow cytometry for CD11c.
CD11c+ DC were incubated overnight in CM with or without 25μM curcumin. To assess
cellular distribution in vivo, DC were also labelled with 1,1’-dioctadecyl-3, 3,3’, 3’-
tetramethylindodicarbocyanine perchlorate (DiI, 2μg/ml, Molecular Probes) for 30 minutes
at 37°C. Cells were washed 3 times in CM and resuspended in PBS (106 cells/150μl) for
injection.
One million (106) DiI-labelled DC from C57BL/6 mice were injected into MHC-
mismatched mice (BALB/c or C3H) via the tail vein. “Control” mice were injected with

91
PBS. Mice were reviewed daily by animal house attendants and no adverse effects were
documented following injection. After 7 days, mice were sacrificed in a CO2 chamber and
organs removed, including spleen, liver, kidney, inguinal and mesenteric lymph nodes.
Tissues were embedded in OCT (Tissue Tek) and snap frozen in liquid nitrogen at -70°C.
Seven μm cryosections were fixed in ice-cold acetone (Sigma Aldrich) for 5 minutes and
dried at room temperature. Sections were stained at room temperature with anti-CD11c
FITC (clone N418, Biolegend) and anti-DEC205 APC (clone NLDC-145, Miltenyi Biotec)
for 2 hours, and DAPI (4’, 6-diamindino-2-phenylindole, Molecular Probes, 15mM
solution) for 5 minutes. Slides were washed three times in PBS, mounted with fluorescent
mounting medium (Dako), and imaged on an ApoTome microscope (Zeiss) at 200x
magnification.
In additional experiments, 106 DC (unlabelled, but treated with or without curcumin), or an
equivalent amount of PBS were injected into MHC-mismatched mice. Spleens were
collected after 7 days, digested using collagenase and purified using density gradient
separation. The splenocyte population was stained for CD4, CD25 and FoxP3 (as per
protocol) and analysed by flow cytometry. A secondary MLR was performed using MNC
from injected mice added to �-irradiated MNC from C57BL/6 (same donor) or third party
donor in a 1:1 ratio (2x10⁵ cells/well). Radioisotope incorporation and flow cytometric
assessment of the responding T-cell population after 3 days was determined as described
above.

92
2.2 Flow cytometry
2.2.1 Flow cytometric analysis of dendritic cell surface markers
Cell samples were resuspended in staining buffer (50-100μl/105 cells), blocked with 1% v/v
rabbit serum (ICN Pharmaceuticals), and incubated for 20 minutes at 4°C. Samples were
aliquotted into polypropylene FACS tubes (5x10⁵ cells per tube) and incubated with
appropriate quantities of antibodies (see below) for 20 minutes in the dark at 4°C. Cells
were fixed at room temperature with 10% FACS lysing solution (BD PharMingen),
2ml/tube, and washed twice in staining buffer. All flow cytometry was performed in a
FACSCanto flow cytometer (BD PharMingen) and analysed using FACSDiva software
(v6.3.1, BD PharMingen). All data are reported in comparison to isotype-matched controls.
As single colour fluorescence was used to assess DC phenotype, compensation samples
were not required.
2.2.2 Flow cytometric analysis of human T-cell surface and intracellular markers
T-cells and �-irradiated allogeneic DC were co-cultured at a ratio of 100:1 in a primary
MLR for 5 days. T-cells from the primary MLR were isolated (as described in section
2.1.1.4) and assessed immediately for Annexin V/PI (described below) and intracellular IL-
10, incubated with 1μM SEB (Sigma) overnight prior to assessment of intracellular IL-17
and rested for 48 hours in CM prior to staining for FoxP3. T-cells were resuspended in
10μl staining buffer in a 96-well V-bottom plate and incubated with the required
monoclonal antibodies (to CD3, CD4, CD25, CD127, CD62L; 1μl/106cells) for 25 minutes
at room temperature in the dark. Cells were washed in staining buffer and permeabilised
using Fix/Perm solution (eBioscience), 175μl/well, incubating for 45 minutes in the dark at
4°C. Cells were blocked with 1% v/v rat serum for 20 minutes and then stained with the

93
relevant intracellular monoclonal antibody for 30 minutes in the dark at 4°C. After washing
in staining buffer, cells were aliquotted into polypropylene FACS tubes and flow cytometry
performed. Analysis was performed as shown in Figures 2.2.2.1-2.
Overlap of fluorescence between detection channels was compensated for at the start of
each experiment, using monoclonal antibodies with the highest fluorescence for each
channel and a small portion of the sample to be tested.
1. FITC Control (2μL of 1/10 dilution); PE Control (2μL); PE-Cy5.5 control (1μL of
1/10 dilution); PE-Cy7 control (1μL of 1/10 dilution); APC control (1μL of 1/10
dilution); APC-Cy7 control (1μL of 1/10 dilution)
2. FL1 Compensation: CD3-FITC (1μL)
3. FL2 Compensation: CD4-PE (1μL)
4. FL3 Compensation: CD4-PE-Cy5.5 (1μL)
5. FL4 Compensation: CD4-Pe-Cy7 (1μL)
6. FL5 Compensation: CD3-APC (1μL)
7. FL6 compensation: CD3-APC-Cy7 (1μL)
For multi-colour flow cytometry (>4 colours) and/or use of expanded fluorescence markers
such as Cy7-conjugated antibodies, compensation was achieved through the use of
“fluorescence minus one” (FMOs), special staining controls that employed all reagents
except for the ones of interest. This enabled determination of the exact range of the
negative population, and the positive events in the fully stained sample (346, 347).

94
Figures 2.2.2.1 Six-colour flow cytometric analysis to identify CD4+CD25hiFoxP3+
Tregs.
Viable lymphocytes were gated on forward/side scatter. T-cells were then gated to
CD3+CD4+ (P2), CD4+CD25hi (P3), and finally CD4+FoxP3+ (P4 as a function of gate
P3). Confirmation of Treg phenotype was performed by plotting P4 gated cells with
CD62L and CD127.

95
Figure 2.2.2.2 Flow cytometric analysis of T-cells to identify intracellular IFN��
expression
Viable cells (lymphocytes) were gated on forward/side scatter (P1). T-cells were then gated
according to CD3+IFN�+ (quandrant 2-4). Percentage expression was calculated based on
quandrant 1-2. A similar pattern was used to determine intracellular IL-10 expression, but
cells were also gated according to CD3+CD4+ expression.

96
2.2.3 Staining for apoptotic/necrotic T-cells following co-culture with DC
T-cells were washed twice with PBS and resuspended in binding buffer in FACS tubes,
adjusted to a cell density of 5x10⁶ cells/ml of buffer. Annexin V (5μl) was added, mixed
gently, and incubated for 15 minutes at room temperature in the dark. Cell were washed
with binding buffer, resuspended 198μL of binding buffer, and 2μl of propidium iodide
was added. Cells were analysed by flow cytometry (2-colour analysis with appropriate
compensation) within 1 hour.
2.3 Enzyme-linked immunosorbent assay (ELISA)
IL-12p70 and IL-10 concentrations were quantified concurrently in supernatant using the
ELISA Ready-SET-GO! Kit (eBiosciences) according to manufacturer instructions. DC
(1x10⁶/ml) were co-cultured with rhIFN� (20ng/ml, ProSpec-Tany) and rhCD40L (5μg/ml,
R&D) for 24 hours prior. Briefly, 96-well microplates were incubated with relevant capture
antibody overnight, washed with wash buffer (1x PBS/0.05% Tween-20) and then blocked
with 1x assay diluent for 1 hour. Standards, prepared using serial dilutions, or samples
(100μl volume) were added to wells in duplicate or triplicate respectively and incubated at
room temperature for 2 hours. Plates were washed, followed by the sequential addition of
detection antibody, Avidin-HRP, Substrate solution and stop solution (H3PO4,
ChemSupply). Plates were read using Microplate Reader (Labequip) at 450nm wavelength.
Unknown concentrations were calculated based on the standard curve.

97
2.4 Immunofluorescent staining and confocal microscopy
2.4.1 Immunofluorescence for NF-��B-p50
2.4.1.1 Hu-Mo-DC (in vitro)
DC were generated as described above, and stained for NF-�B-p50 as described previously
(348). Briefly, cells were incubated overnight in CM in Lab-Tek® chamber slides (Nunc
Nalge International). Slides were incubated with NF-�B-p50 (clone H-119, Santa Cruz
Biotechnology, dilution 1:100) for 2 hours and washed twice with PBS. Secondary
antibody (FITC goat anti-rabbit IgG, Santa Cruz Biotechnology, dilution 1:1000) was
added for 30 minutes, and DAPI (Molecular Probes, dilution 1:400) for 5 minutes. Slides
were washed three times in PBS, mounted with fluorescent mounting medium (Dako), and
imaged on an ApoTome microscope (Carl Zeiss Pty Ltd).
2.4.1.2 Murine splenocytes and renal APC (in vivo)
Antigen-presenting cells from mice injected with liposomes were treated with or without
lipopolysaccharide (LPS 1μg/μl, Sigma Aldrich) for 24 hours, stained with NF-�B-p50
antibody (Santa Cruz Biotechnology), then with goat anti-rabbit IgG FITC (Santa Cruz
Biotechnology) and finally with DAPI. Cells were imaged by confocal microscopy as
above.
2.4.2 Immunofluorescence for DiI-labelled liposomes
The organs and lymph nodes of untreated or DiI-curcumin liposome-injected C57BL/6
mice were harvested, embedded in OCT compound, and snap frozen in liquid nitrogen.
Cryosections were fixed in ice-cold acetone (Sigma Aldrich) for 5 minutes and dried at
room temperature. Sections were blocked with 10% rabbit serum and stained at room

98
temperature with the relevant antibodies, followed by 4’, 6-diamidino-2-phenylindole
(DAPI). Slides were washed twice in PBS, mounted with mounting medium (DAKO) and
imaged on an apotome microscope (Carl Zeiss Pty Ltd).
2.4.3 Measurement of superoxide dismutase (SOD) using dihydroethidium (DHE)
fluorescence
The oxidative fluorescent dye dihydroethidium (DHE, Axxora) was used to evaluate in situ
production of superoxide. DHE is freely permeable to cells and in the presence of O2- is
oxidised to ethidium bromide (EtBr), which is then is trapped intracellularly by
intercalating with DNA. EtBr is excited at 488nm with an emission spectrum of 610nm.
Unfixed frozen sections were placed on glass slides. DHE (10μM) was applied to each
tissue section and coverslipped with fluorescent mounting medium (Dako). Slides were
incubated in a light-protected humidified chamber at 37°C for 30 minutes, washed twice
with PBS then mounted with fluorescent mounting medium (Dako). Images were obtained
using an ApoTome microscope (Zeiss).
2.4.4 Terminal deoxynucleotidyl transferase dUTP nick end labelling (TUNEL) staining
TUNEL staining was used to detect DNA fragmentation due to apoptosis with a
commercially available in situ cell death detection kit (Roche) according to manufacturer
instructions. Briefly, 4um tissue sections were cut from OCT embedded tissue and placed
onto slides. Tissue was fixed with freshly prepared 4% paraformaldehyde (ChemSupply)
for 20 minutes at room temperature, blocked with 3% hydrogen peroxide in methanol and
incubated with permeabilisation solution (0.1% Triton X-100 /0.05% sodium citrate) on ice
for 2 minutes, with intervening PBS washes. TUNEL reaction mixture was added to the
99
sample and incubated at 37°C for 60 minutes in the dark. Slides were rinsed 3 times with
PBS and analysed by fluorescence microscopy at 20x magnification using an ApoTome
microscope (Zeiss).
2.4.5 Immunofluorescent staining for 3-nitrotyrosine and thioredoxin interacting protein
(TXNIP)
Unfixed frozen sections were placed on a glass slide and fixed with freshly prepared 4%
paraformaldehyde for 5 minutes, washed in PBS and then blocked using 10% goat serum.
Mouse monoclonal 3-nitrotyrosine or polyclonal TXNIP antibody (1:250 dilution) were
added to the section and incubated for 2 hours at room temperature in a humidified
chamber. Sections were washed twice in PBS, incubated with goat anti-mouse AlexaFluor
488 (1:400 dilution, Molecular Probes) or goat anti-rabbit FITC (1:400 dilution, Santa Cruz
Biotechnology) respectively for 1 hour and then 4’, 6-diamidino-2-phenylindole (DAPI)
for 5 minutes. Slides were washed three times in PBS, mounted with fluorescent mounting
medium (DAKO), and imaged on an ApoTome microscope (Zeiss).
2.5 Polymerase chain reaction (PCR) techniques
2.5.1 RNA extraction
Tissue embedded in OCT was sectioned at -20°C using a cryostat and placed in tissue lysis
buffer (Qiagen) containing 1% �-mercaptoethanol (Sigma). Alternatively, cells from tissue
culture were placed directly in lysis buffer. Samples were vortexed to ensure no tissue
clumps, and stored at –20°C until use. Total RNA was extracted using Qiagen RNeasy�
Mini Kits (Qiagen) as per manufacturer instruction. Briefly, lysates were thawed on ice,
pipetted into a QIAshredder spin column and centrifuged at >10000rpm for 2 minutes. An

100
equivalent amount of 70% ethanol was added, mixed well by pipette, added to the RNeasy
spin column and centrifuged at >10000rpm for 15 seconds. Columns were subsequently
washed with buffers RW1 and RPE. RNase-free water (Qiagen) was added to the column
(30-50μl) to elute the RNA.
2.5.2 RNA quantitation
RNA was quantitated using the Experion� RNA Stdsens Analysis Kit (Bio-Rad
Laboratories). The cleaning chip was filled with 800μl electrode cleaner and placed in the
instrument for 2 minutes. The second cleaning chip was filled with 800μl DEPC water,
placed in the instrument for 5 minutes and the lid left open to allow electrodes to dry. RNA
stain, loading buffer and gel were removed from storage and equilibrated to room
temperature. To prepare the Gel stain, 600μl RNA gel was added to the spin filter tube and
centrifuged 400g for 10 minutes. Sixty-five microlitres (65μl) was pipetted into an RNase-
free microcentrifuge tube and added to 1μl RNA stain. The solution was vortexed, pulsed
and protected from light. RNA ladder and samples were removed from storage and thawed
in ice, and 3μl aliquotted into RNase-free microcentrifuge tubes. All samples were
denatured for 2 minutes in a water bath heated to 70°C, pulsed and cooled on ice. Gel-stain
solution, filtered RNA gel, RNA ladder and samples were added to the Experion chip
according to manufacturer instructions, primed, vortexed, and added to the instrument for
analysis.
2.5.3 Reverse transcription of RNA and cDNA synthesis
One microgram (1μg) of RNA was added to 4μL oligo-dT (Amersham Biosciences) and
heated at 60°C for 5 minutes and snap cooled on ice. Reverse transcription (RT) master-

101
mix containing water, 8μL RT buffer (Gibco BRL), 200U MMLV reverse transcriptase
(Gibco BRL), 40U RNAsin (Promega) and 40μM dNTP (Promega) was added to a produce
a total volume of 40μL. Samples were vortexed and pulsed, then incubated for 60 minutes
at 37°C, heat-inactivated for 10 minutes at 70°C. Reactions were snap cooled on ice, pulsed
and adjusted with water to a cDNA concentration of 0.01μg/μl. Samples were stored at
-70°C until use.
2.5.4 Primer design
Target genes of interest were identified and primers created using NCBI Primer Blast
program (www.ncbi.nlm.nih.gov/tools/primer-blast). Primer design included the following
requirements (where possible):
1. optimum annealing temperature 65°C and a maximum difference of 2°C between
sense and anti-sense primers,
2. spanning an exon-exon junction to exclude amplification of genomic DNA,
3. minimum 7 bases annealing to template exon at the 5’ end and minimum of 4 bases
at the 3’ end,
4. primers separated by at least one intron and intron length range >2000bp.
Primers were run initially to determine the presence of a single product size (melt curve
with single peak) and to optimise cycling conditions. The designed sense and anti-sense
primers from human and mouse genes of interest are shown in the tables below (Tables
2.5.4.1 and 2.5.4.2 respectively) in addition to GenBank accession number, product size
and annealing temperature (Tm).

102
Gene GenBank Accession
number
Sense primer 5’-3’
Anti-sense primer 5’-3’
Product size (bp)
TM (°C)
Hypoxanthine guanine phosphoribosyl transferase 1
NM_000194 AgCCCTggCgTCgTgATTAg
TgATggCCTCCCATCTCCTT
175 65
IL12p40 AF180563 GCAgAggCTCTTCTgACCCC
AACggCATCCACCATgACCT
169 65
RelB NM_006509 TgACCCCTACAACgCTgggT
TAATTCggCAAATCCgCAgC
185 65
Table 2.5.4.1 Sense and anti-sense primer sequences for human DC genes of interest.
Product size and annealing temperature are included in the table. Standards for RT-PCR
were synthesised using a 3-step PCR cycle described in Section 2.5.5, and purified using a
DNA Clean and Concentrator Kit (Zyppy). RT-PCR reactions were run on a 2-stage cycle
as described in Section 2.5.7. Melt curves were confirmed and annealing temperature
optimised for each gene.

103
Gene GenBank Accession
number
Sense primer 5’-3’
Anti-sense primer 5’-3’
Product size (bp)
TM (°C)
Fractalkine NM_009142 gCAgTgACCggATCATCTCT
CTgAggAgATggggCTgTAg
201 65
Heat shock protein 70
NM_010479 ACTgCCCCgCTgATgTgATT
TgAAggACCCgACACAAgCA
180 65
Hypoxanthine guanine phosphoribosyl transferase 1 (HPRT1)
NM_013556 CCCAgCgTCgTgATTAgCg
gCACACAgAgggCCACAATg
195 65
Inducible nitric oxide synthase
NM_010927 CCTTgTTCAg CTACgCCTTC
AAggCCAAACACAgCATACC
200 63
Macrophage inflammatory protein 2
X53798 AgTgAACTgCgCTgTCAATg
TCCAggTCAgTTAgCCTTgC
150 65
Monocyte chemoattractant protein 1
NM_011333 AggTCCCTgTCATgCTTCTg
TCTggACCCATTCCTTCTTg
248 65
RANTES NM_013653 TCACCATATggCTCggACACC
CTgggTTggCACACACTTgg
159 65
Superoxide dismutase
NM_011434 ggCCAAgggAgATgTTACAA
AgACACggCTgTCAgCTTCT
199 63
Thioredoxin interacting protein (TXNIP)
NM_001009935 TCCTAgAAgAg CAgCCTACA
gCAggT
TggCTggCTggggCgATCgAg
109 65
Toll-like receptor 4
NM_021297 TgCATggATCAgAAACTCAgCA
gCCATgCCATgCCTTgTCTT
182 65
Tumour necrosis factor alpha
NM_013693 CACTggCCCAAggCgCCACA
AgAgCgTggTggCCCCTgCC
183 65
Table 2.5.4.2 Sense and anti-sense primer sequences for mouse genes of interest.

104
2.5.5 Synthesis of standards for RT-PCR
PCR for generation of standards was performed in 50μl volumes using 2x AmpliTaq
Gold� PCR Master Mix, designed primers (0.5mM at final concentration, Geneworks),
relevant cDNA (1μL) and sterile water. The reaction master-mix was prepared in a DNA-
free room, and cDNA added last. Two drops of sterile mineral oil (Sigma Aldrich) were
added to prevent evaporation and samples were vortexed and pulsed. All reactions were
performed in a Perkin Elmer Cetus DNA thermocycler (Perkin Elmer) and amplification
began with 10 minutes pre-heating at 95°C, denaturation for 30 seconds at 95°C, annealing
for 30 seconds at 65-67°C (dependent upon the calculated TM of the relevant primers), and
extension for 30 seconds at 72°C for 40 cycles. The presence of PCR product was
confirmed with 2% agarose gel electrophoresis stained with GelRed (Biotium). PCR
product was purified using DNA Clean and Concentrator5 kit (Zymo Research) as per
manufacturer instructions. Briefly, PCR product was mixed thoroughly with DNA binding
buffer, placed in a Zymo-Spin Column and centrifuged at maximum speed (>10000rpm)
for 30 seconds. Columns were washed twice with wash buffer and DNA was eluted in 10μl
nuclease-free water. DNA was quantitated using NanoDrop 1000 spectrophotometer
(Thermo Scientific).
2.5.6 Agarose gel electrophoresis
To check PCR results, 2.5μl of 6x loading buffer was mixed with 12.5μl of the PCR
product and electroporated through 2% w/v agarose (Amresco) gels using a Bio-Rad
Minigel apparatus. However, products for gel extraction or restriction digest products were
run on 1% w/v Agarose gels. DNA size markers (2μl) pUC19 (Bresatec) or SPP1/EcoRI
(Geneworks) were mixed with 2.5μl of 6x loading buffer and 10μl of water. All samples

105
were loaded onto the gel and electroporated at 85V for approximately 90 minutes. Gels
were stained with GelRed (Biotium) solution for 10 minutes and photographed under UV
illumination using InGenius gel documentation system (Syngene).
2.5.7 RT-PCR
RT-PCR amplification was performed using a Rotorgene 3000 Real-time cycler (Corbett
Research, Mortlake, Australia). Reactions were performed in a 25μl volume using 2x
AmpliTaq Gold� PCR Master Mix (Applied Biosystems), SYBR Green (Adelab), 0.5mM
designed primers (Geneworks) and cDNA of template, standard, or non-template control.
Amplification was performed using a 2-step reaction for 40 cycles: denaturation for 20
seconds at 95°C, annealing and extension for 30 seconds at 63-67°C dependent upon the
calculated melting temperature (TM). Melt curves were run with every reaction. Results
were and normalised to the housekeeping gene and analysed with Rotor-gene v5.0 (Corbett
Research).

106
2.6 Cloning of marmoset DC-SIGN, confirmation of cross-reactivity with anti-human
monoclonal antibody and human DC-SIGN-targeted liposomes
2.6.1 Cloning of marmoset DC-SIGN
2.6.1.1 Primer design
PCR primers were designed on the previously reported sequence for human and rhesus
macaque DC-SIGN (NCBI Accession Numbers NM_021155 and NM_001032870
respectively) and listed in Table 2.6.1.1. The initially designed primers: sense primer 5’
ggg gTg ACA TgA gTg ACT CCA A 3’, anti-sense internal primer 5’ gTg gCA CAg gCg
TTC CAC T 3’ failed to produce a product from marmoset cDNA. Internal primers were
then designed to amplify smaller regions of the gene.
To clarify the sequence at both 5’ and 3’ ends, additional primers were designed based on
the mRNA sequence of human DC-SIGN and DNA sequence of marmoset DC-SIGN.
Marmoset DC-SIGN was subsequently amplified using the following PCR primers based
on the confirmed marmoset sequence: sense primer 5’ ATg AgT gAC TCC CAg gAA CC
3’, antisense primer 5’ TCA ggA gAg AAg CCT TTC TTC ATC 3’. PCR products were
sequenced by Southpath and Flinders Sequencing Facility, Adelaide, Australia. Sequences
were aligned using Vector NTI software (v10, Invitrogen).
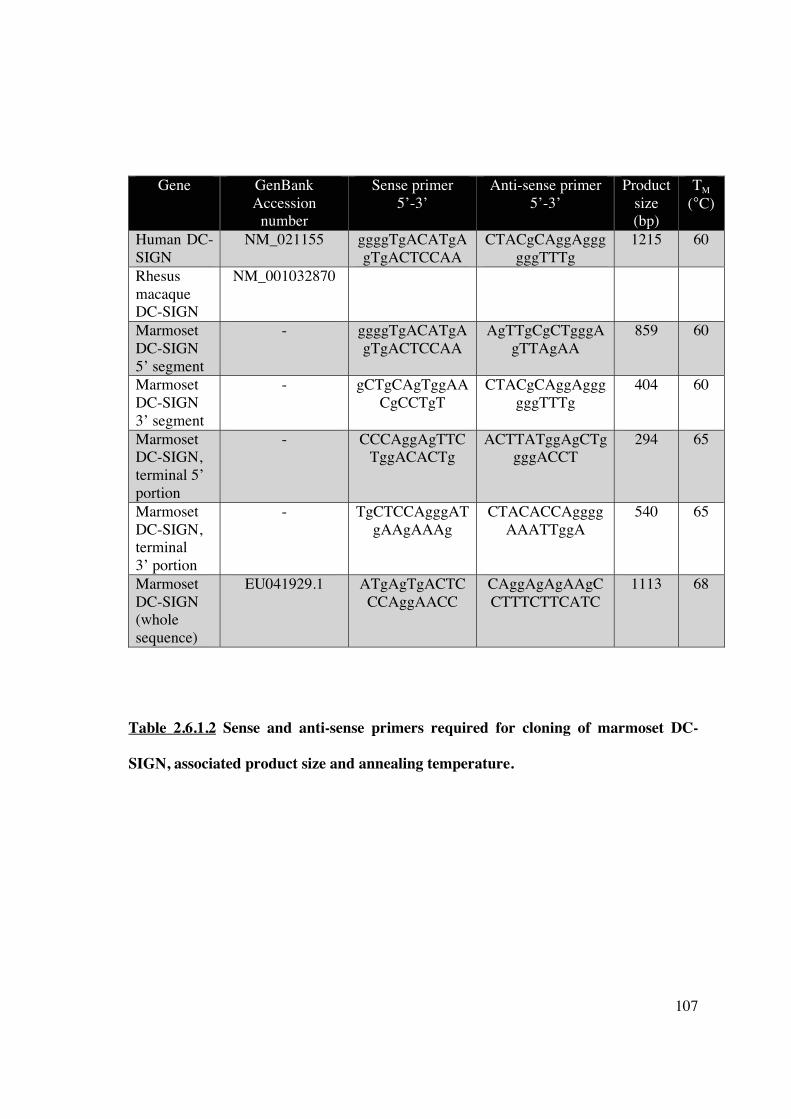
107
Gene GenBank Accession
number
Sense primer 5’-3’
Anti-sense primer 5’-3’
Product size (bp)
TM (°C)
Human DC-SIGN
NM_021155 ggggTgACATgAgTgACTCCAA
CTACgCAggAggggggTTTg
1215 60
Rhesus macaque DC-SIGN
NM_001032870
Marmoset DC-SIGN 5’ segment
- ggggTgACATgAgTgACTCCAA
AgTTgCgCTgggAgTTAgAA
859 60
Marmoset DC-SIGN 3’ segment
- gCTgCAgTggAACgCCTgT
CTACgCAggAggggggTTTg
404 60
Marmoset DC-SIGN, terminal 5’ portion
- CCCAggAgTTCTggACACTg
ACTTATggAgCTggggACCT
294 65
Marmoset DC-SIGN, terminal 3’ portion
- TgCTCCAgggATgAAgAAAg
CTACACCAggggAAATTggA
540 65
Marmoset DC-SIGN (whole sequence)
EU041929.1 ATgAgTgACTCCCAggAACC
CAggAgAgAAgCCTTTCTTCATC
1113 68
Table 2.6.1.2 Sense and anti-sense primers required for cloning of marmoset DC-
SIGN, associated product size and annealing temperature.
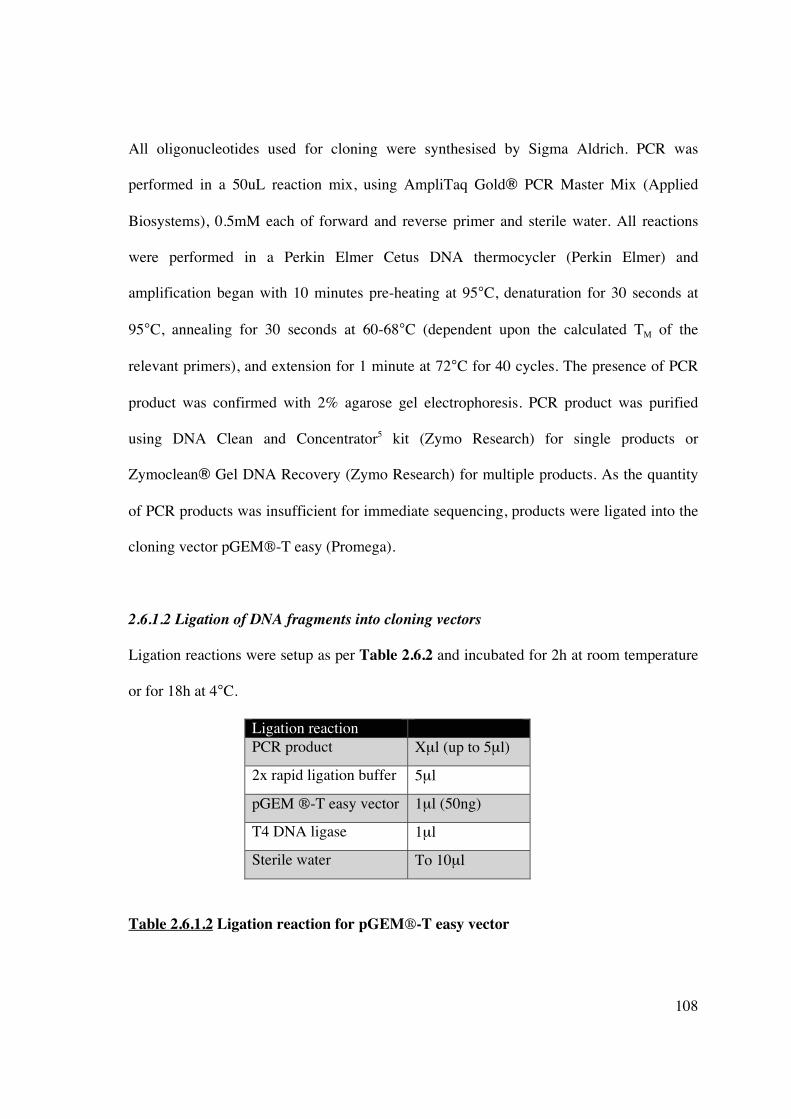
108
All oligonucleotides used for cloning were synthesised by Sigma Aldrich. PCR was
performed in a 50uL reaction mix, using AmpliTaq Gold� PCR Master Mix (Applied
Biosystems), 0.5mM each of forward and reverse primer and sterile water. All reactions
were performed in a Perkin Elmer Cetus DNA thermocycler (Perkin Elmer) and
amplification began with 10 minutes pre-heating at 95°C, denaturation for 30 seconds at
95°C, annealing for 30 seconds at 60-68°C (dependent upon the calculated TM of the
relevant primers), and extension for 1 minute at 72°C for 40 cycles. The presence of PCR
product was confirmed with 2% agarose gel electrophoresis. PCR product was purified
using DNA Clean and Concentrator5 kit (Zymo Research) for single products or
Zymoclean� Gel DNA Recovery (Zymo Research) for multiple products. As the quantity
of PCR products was insufficient for immediate sequencing, products were ligated into the
cloning vector pGEM-T easy (Promega).
2.6.1.2 Ligation of DNA fragments into cloning vectors
Ligation reactions were setup as per Table 2.6.2 and incubated for 2h at room temperature
or for 18h at 4°C.
Ligation reaction PCR product Xμl (up to 5μl)
2x rapid ligation buffer 5μl
pGEM -T easy vector 1μl (50ng)
T4 DNA ligase 1μl
Sterile water To 10μl
Table 2.6.1.2 Ligation reaction for pGEM-T easy vector

109
2.6.1.3 Transformation of competent E. coli cells
DH5� competent E. coli cells (Invitrogen) were thawed on ice; 5μl of ligation mix
(Section 2.6.2) was added immediately and incubated for 30 minutes. Following
incubation, cells were heat-shocked for 20 seconds at 42°C, placed on ice for 2 minutes,
supplemented with 950μl pre-warmed SOC medium (Sigma Aldrich) and incubated at
37°C, 225rpm for 1 hour. Two hundred microlitres (200μl) of transformed cells were
plated onto pre-warmed LB-Agar (Oxoid Ltd) plates containing ampicillin 50μg/ml
(Boehringer Ingelheim Ltd), Xgal (5-bromo-4-chloro-3-indolyl-beta-D-galactopyranoside)
40ug/ml (Amresco), and IPTG (isopropyl �-D-1-thiogalactopyranoside) 0.2mM
(Amresco), and incubated overnight at 37°C. Uncut plasmid with no insert was used as a
positive control to demonstrate transformation efficiency, whilst untransformed E. coli
cells served as a negative control.
White recombinant colonies containing inserts were selected, resuspended in 2ml LB and
incubated overnight at 37°C, 225rpm. Plasmid DNA was prepared using the Zyppy
Plasmid Miniprep kit (Zymo Research) and digested with the restriction enzyme NotI (New
England Biolabs) at 37°C for 1 hour, to release the DNA inserts. Digested plasmid was
loaded onto a 2% agarose gel and run at low voltage. DNA was visualised by Gel Red
(Biotium) staining. Sequencing was performed on six clones (2 different tissues from 3
marmosets) from 2 independent PCR reactions to obtain a consensus sequence (Sequencing
facility, Department of Haematology, Flinders Medical Centre, Adelaide, Australia).
110
2.6.2 Transfection of CHO cell line with marmoset DC-SIGN and confirmation of cross-
reactivity of monoclonal antibody to human DC-SIGN
2.6.2.1 Cell lines
Chinese Hamster Ovary (CHO) cells (American Type Culture Collection) were grown in
CM until 80% confluence achieved. At this time, cells were detached using trypsin/EDTA
solution 0.25%/0.125% (Sigma-Aldrich) and washed in PBS containing 5% FBS. Cells
were counted and used to seed 3 new flasks of the same dimension. All cells were grown at
37°C, 5% CO2.
2.6.2.2 Cell line transfection
Due to the difficulty in propagating marmoset DC and their relatively lower level of DC-
SIGN expression, CHO cells were transfected with marmoset DC-SIGN to demonstrate
binding affinity of the human monoclonal antibody. The mammalian expression vector pCI
(Promega) was prepared by NotI (New England Biolabs) restriction enzyme digestion
(incubated for 1 hour at 37°C) with associated buffer (Buffer 3), 10x BSA and water,
followed by dephosphorylation with calf intestinal alkaline phosphatase (ALP, Promega).
The correct sequence of marmoset DC-SIGN was again ligated into the cloning vector
pGEM-T easy (Promega), used to transform E. Coli DH5� competent cells and plated
onto LB-agar plates, followed by plasmid preparation (Section 2.6.1.3). Plasmid DNA was
prepared by NotI (New England Biolabs) restriction enzyme digestion and the product run
on a 1% agarose gel at low voltage. The product was purified from the gel using DNA Gel
Recovery Kit (Zymo Research) and subcloned into the expression vector at a 1:1 ratio.
Plasmid DNA was prepared using Zyppy Plasmid Maxiprep kit (Zymo research). Correct
orientation of the DNA insert was confirmed with XmaI/ApaI (New England Biolabs)

111
digestion and subsequently used to transfect an established Chinese Hamster Ovary (CHO)
cell line using LipofectAMINE2000 (Invitrogen) according to manufacturer instructions.
Mammalian expression vector without inserted DNA was also used for generating control
CHO cell transfectants. Cells were incubated for 24 hours in CM following transfection,
and collected using trypsin/EDTA 0.25%/0.125% (Sigma-Aldrich). Trypsin activity was
neutralised with neat FCS and cells were washed twice in CM prior to use.
2.6.2.3 Binding of marmoset DC-SIGN transfected CHO cells to anti-human DC-SIGN
and human-DC-SIGN-targeted liposomes
Transfected CHO cells were subsequently incubated with FITC-conjugated anti-human
DC-SIGN (clone DCN46, BD Biosciences) or isotype control for 20 minutes at 4°C, fixed
with FACS lysing solution (BD Biosciences) and washed twice in FACS wash buffer.
Cells were also incubated with human DC-SIGN-targeted liposome or PBS-liposome for
60 minutes on ice and washed twice with FACS wash buffer. Transfection efficiency,
binding to anti-human DC-SIGN monoclonal antibody and binding to human DC-SIGN-
targeted liposomes was established by flow cytometry (FACScan, Becton Dickinson) and
the data processed using CellQuest (Becton Dickinson).
2.7 Liposome synthesis
2.7.1 Non-targeted (”conventional”) liposome synthesis
Egg phosphatidylcholine (EPC, 100mg, Avanti Lipids) was dissolved in 9ml chloroform
(ChemSupply) in a 250ml capacity round bottom (RB) flask. If required, curcumin (3.5mg,
Sigma Aldrich) was dissolved in 1ml of ethanol (ChemSupply) and added to the RB flask.
The emulsion was evaporated to produce a thin film using a rotary evaporator (Buchi) at

112
85mbar pressure for 30 minutes. Liposomes were rehydrated with 2ml HEPES buffer (pH
7.4) and extruded through 400nm Nuclepore polycarbonate membrane (Whatman) 8
times. PMV (if required) were added at the time of rehydration. Size estimation was made
using a Zetasizer (Malvern Instruments) and curcumin incorporation confirmed with UV
spectrophotometry (absorbance at 460nm) after dissolving a 100μl aliquot of liposome with
1% Triton X-100 (Bio-Rad). Liposomes were stored in the dark in airtight containers at
4°C and used within 7 days. For some experiments, liposomes were fluorescently labelled
by adding 10μl/ml ethanolic stock of DiI (Molecular Probes) to the extruded liposome
dispersion. For control experiments, ethanol without curcumin was added to the initial EPC
preparation prior to evaporation.
2.7.2 Synthesis of plasma membrane vesicles (PMV)
Human PBMC or MNC from mouse spleen and lymph nodes were resuspended in PBS at a
concentration of 108 cells/ml and frozen at -20°C. After defrosting the suspension was
vortexed, sonicated at maximum power for 5 minutes, and centrifuged at 5000rpm for 5
minutes at 4°C. The supernatant was removed, placed in a 1.5ml eppendorf tube and
centrifuged at 15000rpm for 1 hour at 4°C, whilst the pelleted cell debris was discarded.
The subsequent translucent pellet was sonicated for 15 seconds, resuspended in PBS and
stored at -20°C for future use.
2.7.3 Targeted liposome synthesis
2.7.3.1 Human DC-SIGN-targeted liposomes
Liposomes were prepared by liquid film hydration. Briefly, palmitoyl-oleoyl-
phosphatyidyl-choline (POPC, Sigma Aldrich) and NTA3-DTDA (Dr Joseph Altin, John

113
Curtin School of Medical Research, ANU) with or without BODIPY dye (Molecular
Probes) were dissolved together in ethanol and evaporated under N2 gas (molar ratio 96:2:2
or 98:2). The film was rehydrated in 100μl of PBS containing 60μM NiSO4 (Avanti
Lipids). Hydrated mixtures were then sonicated (three times, 15s bursts on ice) using a
Tosco (Measuring and Scientific) 100W ultrasonic disintegrator at maximum amplitude for
2 minutes. Plasma membrane vesicles (PMV), described above, were added to the
liposomes (if required) and sonicated, after which the targeting antibody (non-targeting
antibody, or PBS for control liposomes) was engrafted. Antibody engraftment was checked
with each preparation using flow cytometry: liposomes were analysed on the basis of
forward light scatter and side light scatter (on a logarithmic scale) and FITC fluorescence,
with the relative shift in fluorescence intensity above background providing a semi-
quantitative measure of NTA3-DTDA/antibody incorporation.
2.7.3.2 Monoclonal antibody modification using a heterobifunctional crosslinker
The heterobifunctional crosslinking agent Sulfo-MBS (Pierce) was used according to
manufacturer instructions. Monoclonal antibody to human DC-SIGN (clone DCN46, BD
Pharmingen) known to be cross-reactive with marmoset DC-SIGN was added to
conjugation buffer and Sulfo-MBS crosslinker at a concentration of 1mM (to produce a 10-
fold molar excess). The mixture was vortexed and incubated for 30 minutes at room
temperature. Excess crosslinker was removed using a desalting column equilibrated with
conjugation buffer. The 6His-Cys polypeptide was added to 1mM tris(2-
carboxyethyl)phosphine (TCEP) to ensure fully reduced disulfide bonds and then added to
the desalted monoclonal antibody in a molar ratio and incubated for 30 minutes at room
temperature. Samples were then analysed using mass spectrometry.

114
2.7.3.3 Mass spectrometry
2.7.3.3.1 Electrophoresis
Four microlitres (4μl) of monoclonal antibody was diluted to 20μl in gel load buffer
containing 50nM DTT and heated at 95°C for 5 minutes. The sample was loaded onto an
Invitrogen Nu-PAGE 4-12% Bis-Tris gel along with 5μl of Novex Sharp molecular weight
standard. The gel was run at 200V for 50 minutes using MPS buffer and stained with
Coomassie Blue R-250.
2.7.3.3.2 Trypsin digestion
Bands corresponding to the IgG heavy chain were excised from the gel, destained and
digested with 100ng of trypsin. One microlitre (1μl) of sample was applied to a 600μm
AnchorChip (Bruker Daltonik GmBH) according to a previously described protocol (349).
2.7.3.3.3 Data acquisition – MALDI Mass spectrometry (MS)
MALDI TOF mass spectra were acquired using a Bruker ultraflex III MALDI TOF/TOF
mass spectrometer (Bruker Daltonik GmBH) operating in reflectron mode under the
control of the FlexControl software (v3.0, Bruker Daltonik GmBH). External calibration
was performed using peptide standards (Bruker Daltonik GmBH) that were analysed under
the same conditions. Spectra were obtained at various locations over the surface of the
matrix spot at an intensity determined by the operator.
2.7.3.3.4 Data acquisition – MALDI Tandem mass spectrometry (MS/MS)
Between 3 and 6 of the most highly abundant sample ions (non-trypsin and non-keratin)
were selected as precursors of the MS/MS analysis.

115
2.7.3.3.5 Data analysis
MS and MS/MS spectra were subjected to smoothing, background subtraction and peak
detection using flexAnalysis (v3.0, Bruker Daltonik GmBH). The spectra and mass lists
were exported to BioTools (v3.1, Bruker Daltonik GmBH). The corresponding spectra
were combined and submitted to the in-house Mascot database-searching engine (v2.2,
Matrix Science: www.matrixscience.com). The MOWSE and probability scores calculated
by the software were used as the criteria for protein identification. The MS/MS spectra of
the samples that returned a positive hit based on the combined data were submitted
independently to MASCOT. The data were also matched to the sequence of full-length
IgG2b using Sequence Editor Software (Bruker Daltonik GmBH).
2.7.3.3.6 Liquid chromatography-ESI mass spectrometry (MS & MS/MS)
Two microlitres (2μl) of the digested IgG heavy chain sample was diluted to 5μl with 3%
acetonitrile/0.1% FA and 3μl analysed.
2.7.3.3.7 Data acquisition
The samples were chromatographed using an Agilent Protein ID Chip column assembly
(40nl trap column with 0.075x150mm C-18 analytical column) housed in an Agilent
HPLC-Chip Cube Interface connected to an HCT ultra 3D-Ion-Trap mass spectrometer
(Bruker Daltonik GmBH). The column was equilibrated with 4% acetonitrile (CAN)/0.1%
FA at 0.5μl/min and the samples eluted with a CAN gradient (4%-31% in 32 minutes).
Ionizable species (300<m/z<1200) were trapped and two of the most intense ions eluting at
the time were fragmented by collision-induced dissociation (CID). In addition, a specific
inclusion list was used to preferentially fragment ions that corresponded in m/z to potential
tryptic peptides of IgG2b, containing either modification by SulfoMBS (+199.027u) or

116
both Sulfo-MBS and 6His-Cys-peptide (+1142.400u). Data analysis was performed as
described above.
2.8 Assessment of systemic liposome distribution and cellular uptake in vivo
Liposomes, with or without curcumin, were synthesised and used within 7 days. Liposomes
were labelled with DiI (FL2 channel) to enable flow cytometric analysis of cellular uptake.
Labelled liposomes (150μL) were injected into C57BL/6 mice via the tail vein and organs
(spleen, kidney, lymph nodes, pancreas) were harvested after 24 hours.
2.8.1 Spleen digestion protocol
The spleen was injected with collagenase (1mg/ml) and then pressed through a 70μm cell
strainer (BD PharMingen). Significant RBC contamination was treated with NH4CL,
followed by 3 washes with PBS. Isolated MNC were incubated overnight in CM in Lab-
Tek II chamber slides (3x10⁵ cells/well, Nunc Nalge International) with or without LPS
(for subsequent assessment of NF�B activity (as described previously), or stained with the
relevant anti-mouse monoclonal antibodies. Flow cytometric analysis of 5x10⁶ cells was
performed immediately using a FACSCanto flow cytometer, and analysed with FACSDiva
software (v6.1.3).
2.8.2 Kidney digestion protocol
Twenty-four (24) hours after injection of fluorescently labelled liposome, the kidneys were
dissected and placed into a 24 well plate with 2ml CM also containing collagenase D
(16mg/ml) and DNase (1.6mg/ml). Kidneys were injected with solution to produce visible
bleaching, incubated for 25 minutes at 37°C and mashed until the tissue was easily

117
pipetted. Cells were washed in PBS and centrifuged at 300g for 7 minutes at room
temperature. The resuspended pellet was left for 10 minutes at 4°C to allow sediment to
settle. The supernatant was removed and filtered through a 70μm cell strainer. RBC lysis
was performed using appropriate buffer and remaining cells were washed twice in PBS,
then resuspended in FACS wash buffer for antibody staining and flow cytometry.
2.9 Renal ischaemia-reperfusion injury
2.9.1 Generation of murine bilateral renal ischaemia-reperfusion injury
Male C57/B6 mice were anaesthetised using isoflurane titrated to effect with oxygen and
placed supine upon a heated operating surface. The abdomen was shaved and cleaned with
70% ethanol. A 200μl injection of warmed 0.9% saline was given subcutaneously in the
upper thigh prior to commencing. A rectal thermometer was inserted to ensure maintenance
of body temperature at 37°C during the procedure. A midline laparotomy incision was
made initially through the skin and subsequently through the peritoneum along the linea
alba. The ascending and transverse colon were moved to allow exposure of the right
kidney. The right lobe of liver was gently lifted to expose the right renal pedicle, which
was then clamped atraumatically using a microaneurysm clamp. The kidney was observed
briefly for colour change to indicate complete vascular occlusion. The bowel is returned,
and the descending colon and spleen are carefully moved across the midline to allow
exposure of the left kidney. The left renal pedicle was then clamped and the kidney
observed for colour change. The abdominal contents are returned to the abdomen and the
wound is covered with saline-soaked gauze. Additional warmed saline (200μl) was
administered subcutaneously 15 minutes after the initiation of ischaemia and prior to
abdominal wound closure. At the end of the ischaemic period (30 minutes) the clamps were

118
removed in turn and the kidneys observed for return of pink colouration. The abdomen was
sutured closed using 5/0 monofilament. Buprenorphine (0.1mg/kg) was given prior to
cessation of anaesthesia. Mice were subsequently observed in a warmed environment with
access to food and water ad libitum. At the appropriate time-point following ischaemia (4
or 24 hours), mice were humanely killed using CO2 inhalation. Cardiac puncture was
performed to obtain venous blood for biochemical measurement of urea and creatinine.
Both kidneys were removed; the upper poles were fixed in formalin for histology, middle
poles were embedded in OCT and snap frozen in liquid nitrogen, lower poles were
dissected into 1mm segments and snap frozen.
2.9.2 Assessment of renal function after bilateral renal IRI
Renal function was assessed by measurement of plasma urea and creatinine 4 or 24 hours
after IRI using the urease method (OSR 6141, Olympus), and a Jaffe creatine picric acid
reaction (OSR 6178, Olympus) analysed on a Beckman Coulter 680 or an Olympus AU640
analyzer respectively.
2.9.3 Histologic assessment of renal injury after bilateral renal IRI
2.9.3.1 Periodic Acid Schiff’s (PAS) stain
Kidney tissue was fixed in 10% formalin and embedded in paraffin. When required, 4μm
tissue sections were cut onto slides, deparaffinized and hydrated to distilled water. Slides
were placed in 0.5% Periodic acid for 5 minutes, Schiff’s reagent for 10 minutes, and
counterstained with haematoxylin for 3 minutes, with slides rinsed in distilled water
following each step. Slides were dehydrated in alcohol, dried, mounted with coverslips and
allowed to dry at room temperature overnight.

119
2.9.3.2 Assessment of histopathology
Histopathological evidence of IRI was scored on Periodic Acid Schiff (PAS) stains
assessing the following variables at 20x magnification: tubular vacuolisation, infarction,
and cast formation. A semi-quantitative scoring system was used:
1. 0-10% = 0
2. 10-25% = 1
3. 25-50% = 2
4. 50-75% = 3
5. 75-100% = 4
Scoring was performed in a blinded and independent fashion by a nephrologist and
pathologist, following random selection of 3 juxtamedullary areas per kidney (2 sections
per slide). Intrarenal neutrophil infiltration was quantified by manual counting of
juxtamedullary polymorphonuclear cells. Neutrophils were quantified in 10 randomly
chosen microscope fields at 40x magnification.

120
2.10 Western Blotting
2.10.1 Protein extraction and quantitation [bicinchoninic acid (BCA) assay]
Kidney tissue (approximately 20mg) was frozen on dry ice and stored at -80°C until used.
Tissue was thawed on wet ice and 100μl extraction buffer, containing 1% protease
inhibitor cocktail (Sigma), was added prior to homogenisation. Samples were centrifuged
at maximum speed (13000rpm) for 15 minutes at 4°C and supernatant was transferred to an
eppendorf tube. Quantification of total protein extracts was performed using a Pierce
BCA protein Assay Kit (Thermo Scientific) according to manufacturer instructions.
Standards were prepared from serial dilutions of BSA (total protein 1-10μg) and working
reagent (WR) was prepared by combining Reagents A and B (50:1 ratio). Two microlitres
(2μl) of each standard (duplicate), blank (duplicate) or unknown sample (triplicate) was
added to 48μl water pipetted into a microplate well. Each well then received 200μl of WR.
The microplate was covered and incubated at 37°C for 30 minutes. After the plate had
cooled to room temperature, the absorbance was measured at 595nm using a FLUOStar
Optima spectrophotometer (BMG Labtech). The standard curve was prepared by plotting
the average blank-corrected measurement for each BSA standard, allowing calculation of
unknown protein concentrations. To correct for any differences in protein concentration,
samples were further diluted with extraction buffer to a concentration of 2μg/μl, and then
stored at -20°C until further use.
2.10.2 SDS polyacrylamide gel electrophoresis (SDS-PAGE)
SDS-PAGE was performed using the Xcell SureLock Mini-Cell (invitrogen) according to
manufacturer instruction. Briefly, ten micrograms (10ug) of sample was added to
NuPAGE� Reducing Agent (invitrogen), NuPAGE� LDS Sample Buffer (4X, Invitrogen)
and deionised water (total volume 10μl) and heated at 70°C for 10 minutes. After allowing
121
cooling to room temperature, samples were briefly centrifuged to return any condensation
to the bottom of the tubes. Samples were then loaded into the gel placed within the Xcell
SureLock Mini-Cell filled with running buffer. A protein ladder was also loaded in one
well of each gel to monitor protein migration and provide a protein size comparison. Lids
were placed on gel tanks and connected to a power pack (Biorad). Power was set at 120
volts for the first 5 minutes and then increased to 180 volts. Gels were run until appropriate
migration of the protein ladder was observed (approximately 90 minutes).
2.10.3 Protein transfer
After SDS-PAGE, gels were removed from the plates and placed into trays containing
transfer buffer. Four pieces of blotting paper, cut just larger than the gel, were soaked in
transfer buffer and placed in a stack on a semi-dry transfer cell. After adding each piece of
blotting paper, the stack was rolled slightly with a glass tube to expel any trapped air
bubbles. PVDF membrane (Millipore), cut to the same size as the blotting paper, was
activated by soaking briefly in 100% methanol and was placed on top of the blotting paper
stack. The gel was placed immediately over the membrane; care was taken to ensure no air
bubbles were trapped between membrane and gel. A further 4 pieces of blotting paper
soaked in transfer buffer were placed over the gel and the stack was rolled lightly with a
glass tube to expel any air. The blot module was placed into the Mini-cell filled with
transfer buffer; the outer chamber with deionised water to allow heat dissipation. The
apparatus was connected to a power pack and run at 30V for 1 hour.
2.10.1.4 Membrane blocking and antibody incubation
Following transfer, membranes were washed with TBS for 5 minutes at room temperature,
incubated in blocking buffer for 1 hour at room temperature and washed with TBS/T.
Tubes were rolled on a tube roller (Ratel Instruments). Membranes were incubated

122
overnight at 4°C with gentle agitation in a 50ml Falcon tube containing 2ml of primary
antibody in dilution buffer (1:1000). Membranes were then washed 3 times with TBS/T
and incubated with appropriate HRP-conjugated secondary antibody diluted in blocking
buffer (1:2000) for 1 hour at room temperature, followed by 3 TBS/T washes. As
secondary antibodies are light sensitive, tubes were wrapped in aluminium foil. Novex
chemiluminescent substrate (Invitrogen) was added to the blot surface and imaged with a
LAS-4000 Luminescent Image Analyzer (Berthold).
2.11 Statistical analysis
Data are expressed as mean + standard deviation (SD) or standard error of the mean
(SEM). Statistical comparison between 2 groups was performed using the Student’s t-test
(parametric variables) or Mann-Whitney U-test (non-parametric variables), or between >2
groups employing analysis of variance (ANOVA), using STATA v11.0 (Stata Corporation,
College Station, TX), with p<0.05 deemed as significant.

123
2.12 Reagents
2.12.1 Human monoclonal antibodies
2.12.1.1 Primary monoclonal antibodies to detect human dendritic cell-surface molecules
1. Fluorescein isothiocyanate (FITC)-conjugated CD3 (clone SP34) – BD PharMingen
2. Phycoerythrin (PE)-conjugated CD11c (clone B-ly6) – BD PharMingen
3. FITC-conjugated CD14 (clone MY4) – Beckman Coulter
4. FITC-conjugated CD20 (clone 2H7) – BD PharMingen
5. PE-conjugated CD40 (clone mAb89) – Immunotech
6. FITC-conjugated CD56 (clone NCAM16.2) – BD PharMingen
7. FITC-conjugated CD80 (clone L307.4) – BD PharMingen
8. FITC-conjugated CD83 (HB15e) – BD PharMingen
9. FITC-conjugated CD86 (clone FUN1) – BD PharMingen
10. FITC-conjugated CD95 (clone DX2) – BD PharMingen
11. PE-conjugated CD123 (IL-3 receptor, clone 7G3) – BD PharMingen
12. FITC-conjugated CD206 (clone 19.2) – BD PharMingen
13. Cychrome (CyC)-conjugated HLA-DR (clone G46-6) – BD PharMingen
14. PE-conjugated BDCA-2 (clone AC144) – Miltenyi Biotec
15. FITC- or PE-conjugated CD209 (DC-SIGN, clone DCN46) – BD PharMingen
16. Unconjugated PD-L1 – (clone M1H1) – R&D systems
17. Unconjugated PD-L2 (clone M1H18) – R&D systems
124
18. PE-conjugated ILT2 (clone HP-F1) – Beckman Coulter
19. Unconjugated ILT4 (clone42D1) – Santa Cruz Biotechnology
2.12.1.2 Secondary antibodies
1. FITC-conjugated anti-mouse IgG1 for PD-L1 and PD-L2 – Southern Biotech
2. FITC-conjugated anti-rat IgG1 for ILT4 – Southern Biotech
2.12.1.3 Monoclonal antibodies to detect human T-cell surface and intracellular markers
1. Phycoerythrin-Cy7 (PE-Cy7) conjugated CD3 (clone UCHT1) – eBioscience
2. Phycoerythrin-Cy5.5 (PE-Cy5.5)-conjugated CD4 (clone OKT4) – eBioscience
3. Allophycocyanin (APC)-conjugated CD25 (clone BC96) – eBioscience
4. FITC-conjugated CD127 (clone BioRDR5) – eBioscience
5. PE-conjugated FoxP3 (clone PCH101) – eBioscience
6. APC-conjugated IFN� (clone 45.B3) – eBioscience
7. PE-conjugated IL10 – BD PharMingen
8. FITC-conjugated IL17 (clone eBio64Dec17) – eBioscience
9. APC-Cy7-conjugated CD62L, clone DREG-56 – eBioscience
2.12.1.4 Isotype-matched control monoclonal antibodies (human)
1. FITC-conjugated mouse IgG2b isotype control (clone 27-35) – BD Biosciences 2. PE-conjugated mouse IgG2a isotype control (clone G155-178) – BD Biosciences 3. CyC-conjugated mouse IgG2a isotype control (clone G155-178) – BD Biosciences
4. Unconjugated F’ab – isotype control for PD-L1 and PD-L2 – R&D Systems
5. Unconjugated IgG1 isotype control (for ILT4) – Santa Cruz Biotechnology
6. PE-CY5.5-conjugated mouse IgG1 K isotype – eBioscience
7. PE-CY7-conjugated mouse IgG1 K isotype – eBioscience

125
8. APC-conjugated mouse IgG1 K isotype – eBioscience
9. APC-CY7-conjugated mouse IgG1 K isotype – eBioscience
2.12.2 Mouse monoclonal antibodies
2.12.2.1 Primary monoclonal antibodies to detect mouse dendritic cell-surface markers
1. FITC- or PE-CY7-conjugated CD11c, clone N418 – Biolegend
2. PE-Cy5-conjugated B220, clone RA3-6B2 – BD PharMingen
3. PE-Cy5-conjugated F480, clone BM8 – Biolegend
4. APC-conjugated CD8�, clone 53-6.7 – Biolegend
5. FITC-conjugated PDCA-1, clone eBIO927 – eBioscience
6. APC-conjugated CD80, clone B7-1,16-10A1 – Biolegend
7. APC-conjugated MHC, clone M5/114.15.2 – Biolegend
8. FITC-conjugated MHC, clone M5/114.15.2 – Biolegend
9. PE-conjugated MHC, clone AF6_88.5 – Biolegend
10. FITC-conjugated CD86, clone B7-2GL1 – BD PharMingen
11. FITC- or PE-CY7-conjugated CD11b, clone M1/70 – BD PharMingen
12. FITC-conjugated CD40, clone 3/23 – Biolegend
13. FITC-conjugated CD83, clone Michel-19 – Biolegend
14. APC-conjugated DEC205, clone NLDC-145 – Miltenyi Biotech
15. PE-CY7-conjugated CD44, clone 1M7 – Biolegend
2.12.2.2 Monoclonal antibodies to detect mouse T-cell surface and intracellular markers
1. FITC-conjugated CD3, clone 17A2 – BD PharMingen
2. FITC-conjugated CD4, clone L3T4 – eBioscience
3. APC-conjugated CD25, clone PC61.5 – eBioscience
4. PE-conjugated FoxP3, clone FJK-16s – eBioscience

126
2.12.2.3 Isotype-matched control monoclonal antibodies (mouse)
1. FITC-conjugated IgG2b, clone RTK4530 – Biolegend
2. PE-conjugated IgG2a, clone RTK2758 – Biolegend
3. APC-conjugated IgG1, clone eBRG1 – eBioscience
4. PE-CY5-conjugated IgG1, clone MOPC-21 – Biolegend
5. PE-CY7-conjugated IgG, clone HTK888 – Biolegend
2.12.3 Other antibodies
1. Unconjugated NF-�B, clone H-119 – Santa Cruz Biotechnology
2. Unconjugated VDUP-1, clone H-115 – Santa Cruz Biotechnology
3. Unconjugated 3-nitrotyrosine, clone 39B6 – Abcam
4. AlexaFluor488-conjugated IgG2a goat anti-mouse – Invitrogen
5. FITC-conjugated IgG goat anti-rabbit – Santa Cruz Biotechnology
2.13 Prepared buffers and solutions • Binding buffer (BB) – was prepared using 10mM HEPES, 140mM NaCl, 2.5mM
CaCl2 and adjusted to pH 7.4.
• Phosphate-buffered saline (PBS) – was prepared using sodium chloride (May &
Baker), sodium phosphate (Amresco) and sodium dihydrogen orthophosphate (Ajax
Finechem).
• Complete medium (CM) – RPMI-1640 (Gibco BRL) supplemented with 10%-20 %
v/v calf serum (FCS; JRH Biosciences), 2mM L-glutamine (MultiCel), sodium
pyruvate (ICN Pharmaceuticals), penicillin-streptomycin (MultiCel) and sodium
bicarbonate (Amresco). Added cytokines and reagents included recombinant human
(rh) interleukin-4 (IL-4; eBiosciences), rh granulocyte macrophage-colony stimulating

127
factor (GM-CSF; Sandoz), bacterial lipopolysaccharide (LPS; Sigma Aldrich), tumour
necrosis factor-alpha (TNF-�; R&D Systems), rh CD40 Ligand (CD40L) and rh IFN�
(R&D Systems).
• Running buffer for immunomagnetic bead separation – PBS with 0.5% v/v FCS and
2mM Ethylenediamine tetra-acetate (EDTA; Sigma Aldrich).
• Rinse Buffer for immunomagnetic bead separation – PBS with 2mM EDTA.
• Cell lysis buffer – 0.15M ammonium chloride (Ajax Finechem), 0.01M sodium
bicarbonate, 0.1mM EDTA, in MilliQ water
• Staining buffer for flow cytometry studies – PBS with 0.01% FCS, 0.1% w/v sodium
azide (Ajaz Chemicals)
• FACS lysing solution – 10% concentrated FACS lysing solution (BD PharMingen) in
distilled water
• Conjugation buffer – PBS pH 7.2, 1mM EDTA
• Extraction buffer (TKlLysis buffer) – 50mM HEPES, pH 7,5, 150mM NaCl, 1%
Triton X-100, 1mM sodium orthovanadate (Na3VO4), 30mM sodium fluoride (NaF),
10mM sodium pyrophosphate (Na4P2O7), 10mM EDTA, 1μg/ml aprotinin, 1μg/ml
antipain, 1μg/ml pepstatin, 1μg/ml leupeptin, 2.5mM benzamidine
• Tris Buffered Saline (TBS, 10x stock solution) – 24.2g Tris base, 80g NaCl, pH
adjusted to 7.6 with 1x HCl
• Blocking buffer – 1x TBS, 0.1% Tween-20 with 5% w/v nonfat dry milk
• Running buffer (Western blots) – 25mM Tris base, 190mM glycine, 0.1% SDS
• Transfer buffer – 50mM Tris base, 40mM glycine, 1% SDS and 10% methanol
• Wash buffer (TBS/T) – 1x TBS, 0.1% Tween-20
• Primary antibody dilution buffer – 1x TBS, 0.1% Tween-20, 5% BSA
128
• 50x TAE – 1.6M trizma base, 800mM sodium acetate, 40.27mM EDTA, pH 7.2,
diluted 1/50 for use
• 6x loading buffer – 1x TAE (as above), 50% glycerol, 24% bromophenol blue
• Luria broth (LB) – 2.5g bacto-yeast extract, 5g bacto-tryptone, 5g sodium chloride,
MilliQ water to 500ml
• LB agar – 15g bacteriological agar, 1L LB, 50ug/ml ampicillin, 40μg/ml Xgal, 0.2mM
IPTG
2.14 Manufacturers
Abcam – Cambridge, UK
Adelab – Thebarton, SA, Australia
Ajax Finechem – Seven Hills, NSW, Australia
Amersham Biosciences (currently GE Healthcare) – Brown Deer, WI, USA
AMGEN Corporation – Thousand Oaks, CA, USA
Amresco – Solon, OH, USA
Apollo Cytokine Research (now Symansis) – Timaru, New Zealand
Applied Biosystems – Scoresby, VIC, Australia
Australian Red Cross Blood Service – Adelaide, SA, Australia
Avanti Lipids – Alabaster, AL, USA
Axxora – San Diego, CA, USA
BD PharMingen and BD Biosciences – San Diego, CA, USA
Beckman Coulter – Hialeah, FL, USA

129
Berthold – Bundoora, VIC, Australia
Biolegend – San Diego, CA, USA
Bio-Rad laboratories – Hercules, CA, USA
Biotium – Hayward, CA, USA
Boehringer Mannheim – Mannheim, Germany
Bresatec – now Geneworks
Bruker Daltonik GmBH – Bremen, Germany
Buchi – Flawil, Switzerland
Cambrex Bioscience – East Rutherford, NJ, USA
Carl Zeiss Pty Ltd – Oberkochen, Germany
Cell Signalling Technology – Danvers, MA, USA
Chem Supply – Gillman, SA, Australia
Conexio Genomics - Perth, WA, Australia
Corbett Research – Mortlake, NSW, Australia
Cytosystems – Castle Hill, NSW, Australia
Dako – Glostrup, Denmark
eBioscience – San Diego, CA, USA
Fisher Biotec – WA, Australia
Geneworks – Thebarton, SA, Australia
Genzyme Corporation – Cambridge, MA, USA
Gibco BRL – Geithersburg, MD, USA

130
ICN Pharmaceuticals – Costa Mesa, CA, USA
Immunotech – Marseilles, Cedex, France
Institute of Medical and Veterinary Science – Adelaide, SA, Australia
Invitrogen – Melbourne, VIC, Australia
JRH Biosciences – Lenexa, Kansas, USA
Labequip – Markham, Ontario, Canada
Mabtech – Nacka Strand, Sweden
Malvern Instruments – Worcestershire, United Kingdom
May & Baker Australia – West Footscray, VIC, Australia
Millipore Corporation – Bedford, MA, USA
Miltenyi Biotech – Bergisch Gladbach, Germany
Molecular Probes – Eugene, OR, USA
MultiCel Trace Scientific – Clayton, VIC, Australia
New England Biolabs – Ipswich, MA, USA
Nunc Nalge International – Naperville, IL, USA
Olympus – South-end-on-Sea, Essex, UK
Oxoid – Hampshire, UK
Perkin Elmer – Boston, MA, USA
Pierce Biotechnology – Rockford, IL, USA
Promega – Madison, WI, USA
131
ProSpec-Tany – Rehovot, Israel
Qiagen – Hilden, Germany
Ratek Instruments – Boronia, VIC, Australia
R&D Systems – Minneapolis, MN, USA
Roche – Basel, Switzerland
Sandoz – Pyrmont, NSW, Australia
Santa Cruz Biotechnology – Santa Cruz, CA, USA
Schering Plough – Whitehouse Station, NJ, USA
Sigma Aldrich – St Louis, MO, USA
STATA Corporation – College Station, Texas, USA
Syngene – Frederick, MD, USA
Thermo Scientific – Rockford, IL, USA
Tomtec – Hamden, CT, USA
Wallac Oy – Turku, Finland
Whatman – Kent, UK
Zymo research – Orange, CA, USA

132
CHAPTER 3: CURCUMIN INDUCES
MATURATION-ARRESTED DENDRITIC CELLS AND
EXPANDS REGULATORY T-CELLS IN VITRO AND IN VIVO
3.1 INTRODUCTION
Dendritic cells (DC) are a heterogenous population of professional antigen-presenting cells
(APC) that potently initiate primary immune responses and possess the ability to regulate
both innate and adaptive immunity (26, 98). DC are critical to the maintenance of central
and peripheral tolerance (29) and modify adaptive T-cell proliferation essential to the
immunological response to infection, inflammation and alloimmunity (152). DC capacity
to regulate T-cell responses reflects provision of critical signals mediated via the co-
stimulation molecule B7 (350, 351) and tumour necrosis factor (TNF) family members
(352, 353), in addition to cytokines (354), whose expression is altered by the
microenvironment sensed though DC surface receptors, including toll-like receptors (TLR)
(355) and CD40 (352).
DC subsets and immature or maturation-resistant DC are more likely to promote tolerance
(356, 357), although phenotypically mature DC (myeloid and plasmacytoid) demonstrate
tolerogenic potential (150, 151, 358, 359). The ratio of resting/immature to
activated/mature DC may also determine tolerance induction (270, 360, 361), as may a
Th2-polarised helper-T-cell response (362, 363). Tolerogenic DC display phenotypic
maturation and but lack functional maturation, and are characterised by high MHC
expression, low co-stimulatory molecule expression, an inability to generate biologically

133
active IL-12, and high IL-10 production (356, 357, 364). The tolerizing capabilities of DC
have been linked to the induction or expansion of regulatory T-cells (Tregs) (249). Tregs
predominate in the CD4+CD25hi T cell fraction and the transcription factor forkhead
winged helix protein-3 (FoxP3) (365) is widely accepted as the most specific marker for
Treg, although in humans it may be transiently expressed by conventional (effector) T-
cells. Additional markers, such as CD62L (366), an absence of CD127 (367), and
intracellular CTLA-4 (368, 369) have been used to define Tregs.
The production of in vitro propagated maturation-arrested DC is a promising method for
inducing tolerance. A variety of immunosuppressive drugs have shown this capacity
through NF-�B inhibition, including Bay 11-7082 (203), corticosteroids (370),
cyclosporine (371), mycophenolate mofetil (372), rapamycin (373), deoxyspergualin
(DSG) (374), and vitamin D3 (375). Antigen-exposed DC lacking the RelB subunit of NF-
�B also have the capacity to suppress previously-primed immune responses after transfer to
primed recipients, indicating that RelB is required for functional DC maturation (203).
Curcumin, an extract of Curcuma longa (turmeric), has a long history of medicinal use.
More recently, anti-oxidant (376, 377), anti-inflammatory (378), antimicrobial (379-381)
and anti-proliferative (382) properties have been identified. Its pleiotropic activity arises
from suppression of NF-�B activity via inhibition of IKK� phosphorylation (383) and
prevention of nuclear translocation of NF-�Bp65 subunit (384).

134
The aims of this chapter are:
1] to demonstrate that curcumin, through its inhibitory effect on NF-�B, directs DC
differentiation towards a tolerogenic phenotype,
2] to establish that tolerogenic DC of this nature are capable of expanding FoxP3+Tregs in
vitro, and
3] to show the potential clinical applicability of curcumin-treated donor-derived DC in
generating Tregs in vivo as a promising avenue for inducing immune hyporesponsiveness.

135
3.2 METHODS
3.2.1 Cell culture
Protocols for human–monocyte–derived DC generation, reagents and media, cell
separation and culture, flow cytometry, 1° and 2° mixed lymphocyte reactions, ELISA,
PCR and confocal microscopy are described in Chapter 2.
3.2.1.1 DC preparation and treatment with immunomodulatory agent
Hu-Mo-DC were generated as described in Section 2.1.1.1. Curcumin was diluted in CM at
37°C and allowed to dissolve prior to addition to DC cultures. GM-CSF and IL-4 were
present in culture for 7 days; curcumin was only present for 24 hours as were maturation
stimuli. An outline of this treatment approach is demonstrated in Figure 3.2.1.1.
3.2.2 Animal experiments
3.2.2.1 Mice
Male 8-12 week old C57BL/6 (H2Kb), BALB/c (H2Kd) and C3H (H2Kk) mice were
purchased from and maintained under pathogen-free conditions in the Institute of Medical
and Veterinary Science Animal Facility (IMVS). The University of Adelaide and IMVS
animal ethics committees approved all experimental protocols (project number 40/09).
3.2.2.2 Cell isolation, assessment of systemic cell distribution and proliferation assays
All protocols for reagents and media, murine splenic DC or MNC isolation, fluorescent cell
labelling, immunofluorescent staining, confocal microscopy, flow cytometry and mixed
lymphocyte reactions are described in Chapter 2.

136
Figure 3.2.1.1 Outline of DC treatment approach
Monocytes were cultured in the presence of GM-CSF and IL-4 for 5 days to generate
immature DC (immDC). LPS 1μg/μl maturation stimulus was added at day 6 for 24h to
generate mature DC (matDC). The NF-�B inhibitor curcumin was added to immDC on
Day 5 for 24h, prior to exposure to a maturation stimulus.
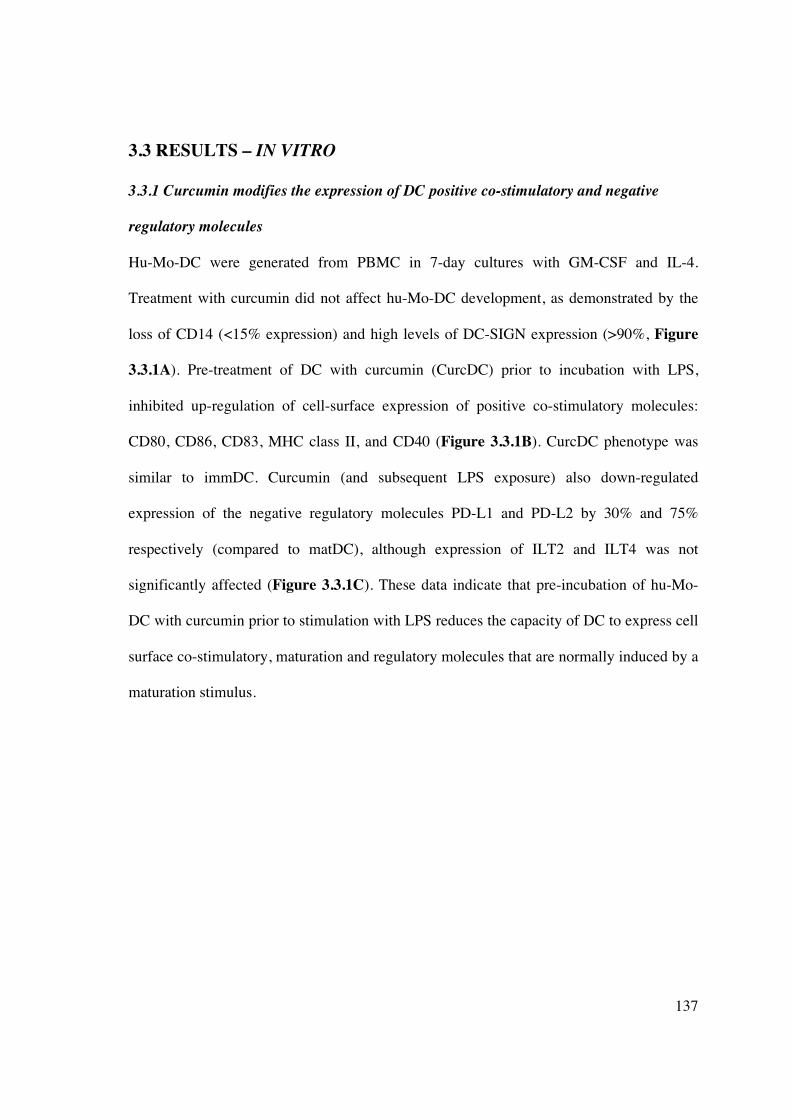
137
3.3 RESULTS – IN VITRO
3.3.1 Curcumin modifies the expression of DC positive co-stimulatory and negative
regulatory molecules
Hu-Mo-DC were generated from PBMC in 7-day cultures with GM-CSF and IL-4.
Treatment with curcumin did not affect hu-Mo-DC development, as demonstrated by the
loss of CD14 (<15% expression) and high levels of DC-SIGN expression (>90%, Figure
3.3.1A). Pre-treatment of DC with curcumin (CurcDC) prior to incubation with LPS,
inhibited up-regulation of cell-surface expression of positive co-stimulatory molecules:
CD80, CD86, CD83, MHC class II, and CD40 (Figure 3.3.1B). CurcDC phenotype was
similar to immDC. Curcumin (and subsequent LPS exposure) also down-regulated
expression of the negative regulatory molecules PD-L1 and PD-L2 by 30% and 75%
respectively (compared to matDC), although expression of ILT2 and ILT4 was not
significantly affected (Figure 3.3.1C). These data indicate that pre-incubation of hu-Mo-
DC with curcumin prior to stimulation with LPS reduces the capacity of DC to express cell
surface co-stimulatory, maturation and regulatory molecules that are normally induced by a
maturation stimulus.

138
Figure 3.3.1A Curcumin does not interfere with development of hu-Mo-DC.
Pre-treatment of DC with curcumin (on day 5 of culture) failed to alter DC differentiation,
as determined by low (<5%) CD14 and high (>95%) CD209 (DC-SIGN) expression.
Immature DC (immDC, no LPS)
Curcumin-treated DC (CurcDC, + LPS)
Mature DC (matDC, + LPS)
14%
1%
12%
97%
98%
95%
CD209 CD14

139
Figure 3.3.1B Curcumin down-regulates expression of positive co-stimulatory
molecules on hu-Mo-DC.
CurcDC failed to up-regulate positive co-stimulatory molecules when subsequently
exposed to LPS, particularly CD83.
52% 98% 1% 82% 98%
19% 86% 1% 84% 87%
72% 98% 56% 85% 99%
CD80 CD83 MHC class II CD40
MatDC
CurcDC
ImmDC
CD86

140
Figure 3.3.1C Curcumin variably down-regulates negative co-stimulatory molecules
Curcumin inhibited expression of negative regulatory molecules PDL1 and PDL2
compared to both matDC and immDC. ILT2 and ILT4 expression remained unchanged.
The histograms from all Figures 3.3.1A-C are representative data from one experiment out
of four performed; numbers represent the mean % positive cells. The gates (P2-P4)
represent isotype control.
ILT2
86%
96%
97%
1%
1%
1% 78%
82%
96%
31%
5%
47%
ImmDC
CurcDC
MatDC
ILT4 PDL1 PDL2

141
3.3.2 CurcDC are maturation-arrested
RelB-deficient DC promote immune suppression (203), consequently I next examined
markers of nuclear NF-�B activity after DC exposure to curcumin in vitro. DC (with or
without prior exposure to curcumin) were incubated overnight with LPS to promote NF-�B
signalling. RT-PCR results demonstrated significantly reduced expression of RelB,
compared to LPS-treated controls (matDC, Figure 3.3.2A), consistent with the theory that
curcumin arrests DC maturation in response to activation signals (348, 378, 384, 385).
Confocal microscopy confirmed significant cytoplasmic fluorescence and nuclear
translocation of NF-�B-p50 in matDC (Figure 3.3.2B). However, CurcDC demonstrated
little cytoplasmic and nuclear NF-�B-p50 binding (Figure 3.3.2C).

142
0
10000
20000
30000
40000
matDC CurcDC
Re
lB c
op
y n
um
be
r
(n
orm
ali
se
d t
o H
PR
T1
)
Figure 3.3.2 Curcumin generates maturation-arrested DC
Figure 3.3.2A RelB expression was measured by RT-PCR. Compared to matDC, CurcDC
demonstrated down-regulated RelB mRNA expression (decreased by 56%, *p<0.001)
consistent with a maturation-arrested state. Results are expressed as mean + SD of
quadruplicate measurements (of copy number) normalised to a housekeeping gene
(HPRT1), and are representative of 6 independent experiments.
�

143
Figure 3.3.2 CurcDC are maturation-arrested
Figure 3.3.2 MatDC or CurcDC were fixed and analysed by confocal microscopy.
Immunofluorescent staining for NF-�B-p50 subunit demonstrated failure of up-regulation
and nuclear translocation in CurcDC despite a robust maturation stimulus (3.3.2.C). Cell
nuclei (4’6-diamino-2-phenylindole: DAPI) are blue and NF-�B-p50 is green. The p50
subunit was chosen for staining as it is highly expressed in antigen-presenting cells.
B C

144
3.3.3 Comparison of DC cytokine production
NF-�B transcriptional activity is required for expression of cytokines, including IL-12
(386) and IL-10 (387), and we next compared cytokine mRNA expression and secretion in
DC in the presence or absence of curcumin, following stimulation with IFN� and CD40L.
Exposure to additional immunomodulatory agents such as CD40L and IFN� would mimic
inflammatory conditions in vivo, as might occur following exposure to alloantigen. In
addition, maturation with LPS alone failed to stimulate sufficient IL-12p70 production in
either DC population that could be detected by ELISA. IL12p40 mRNA expression was
down-regulated in CurcDC compared to controls (matDC, Figure 3.3.3A). Concurrent
measurement of supernatant cytokine production (by ELISA) demonstrated negligible
production of biologically active IL-12 (IL-12p70) by CurcDC (Figure 3.3.3B). CurcDC
were still able to produce IL-10 (Figure 3.3.3C). These data are consistent with the
observed suppression of NF-�B nuclear activity by curcumin.

145
0
200
400
600
matDC CurcDCIL12p
40 c
op
y n
um
ber
(n
orm
alised
to
HP
RT
1)
Figure 3.3.3 Curcumin inhibits DC cytokine production
Figure 3.3.3A CurcDC demonstrated lower mRNA expression of IL-12p40 (decreased by
63%, * p<0.001) compared to matDC. RT-PCR results are mean + SD of quadruplicate
measurements (of copy number) normalised to a housekeeping gene and are representative
of 6 independent experiments performed.
*

146
0
50
100
150
200
250
matDC CurcDC
Pro
du
cti
on
of
IL12p
70
(pg
/ml)
Figure 3.3.3 Curcumin inhibits DC cytokine production
Figure 3.3.3B CurcDC failed to produce detectable quantities of IL-12p70 in response to
stimulation with CD40L and IFN�. The level of IL-12p70 produced by CurcDC was
approximately 3pg/ml, at the lower level of detection of the ELISA kit. Cytokine
concentrations are expressed as mean + SD of triplicate measurements and results are
representative of 6 independent experiments performed, *p<0.001.
*

147
0
200
400
600
matDC CurcDC
Pro
du
cti
on
of
IL-1
0
(pg
/ml)
Figure 3.3.3 Curcumin inhibits DC cytokine production
Figure 3.3.3C CurcDC, following stimulation with CD40L and IFN�, were capable of
producing significant IL-10, albeit in reduced quantities compared to matDC. Cytokine
concentrations are expressed as mean + SD of triplicate measurements and results are
representative of 6 independent experiments performed, *p<0.001.
*

148
3.3.4 CurcDC inhibit T-cell responsiveness in a primary MLR Allogeneic T-cells were stimulated with CurcDC and compared to proliferation with both
matDC and immDC in a DC-MLR. Compared to matDC, CurcDC were less stimulatory
for allogeneic T-cell proliferation at all stimulator-responder ratios, at a level similar to
immDC (Figure 3.3.4).
Figure 3.3.4 CurcDC demonstrate impaired allostimulatory capacity
T-cells were co-cultured with immDC, matDC or CurcDC at varying T-cell : DC ratios for
5 days and proliferation was determined using 3H-thymidine incorporation added during
the final 18h of culture. Allostimulatory capacity of CurcDC was significantly reduced
compared to matDC at all T-cell : DC ratios and comparable to immDC (overlain). Results
shown are mean + SEM (*p<0.01 matDC versus CurcDC, matDC versus immDC) and are
representative of 4 independent experiments.
*
*
*

149
3.3.5 Inhibition of IL-10 does not restore alloproliferative capacity to CurcDC
To determine whether the Th2-driving cytokine IL-10 was the main cytokine responsible
for suppression of CurcDC allostimulatory capacity, CurcDC were co-cultured at the same
stimulator : responder ratio (1:100) in the presence of neutralising antibody to IL-10, or
appropriate control antibody. Antibodies were added at 5-times the concentration required
for 95% neutralisation of IL-10 activity, and both anti-IL-10 and its control were added the
same concentration. However, no change in allostimulatory capacity was observed (Figure
3.3.5), indicating that other cytokines are involved in altering T-cell proliferation. These
data (along with Figure 3.3.6) suggest that IL-10 was not crucial to T-cell
hyporesponsiveness and the development of FoxP3+ Tregs in vitro.
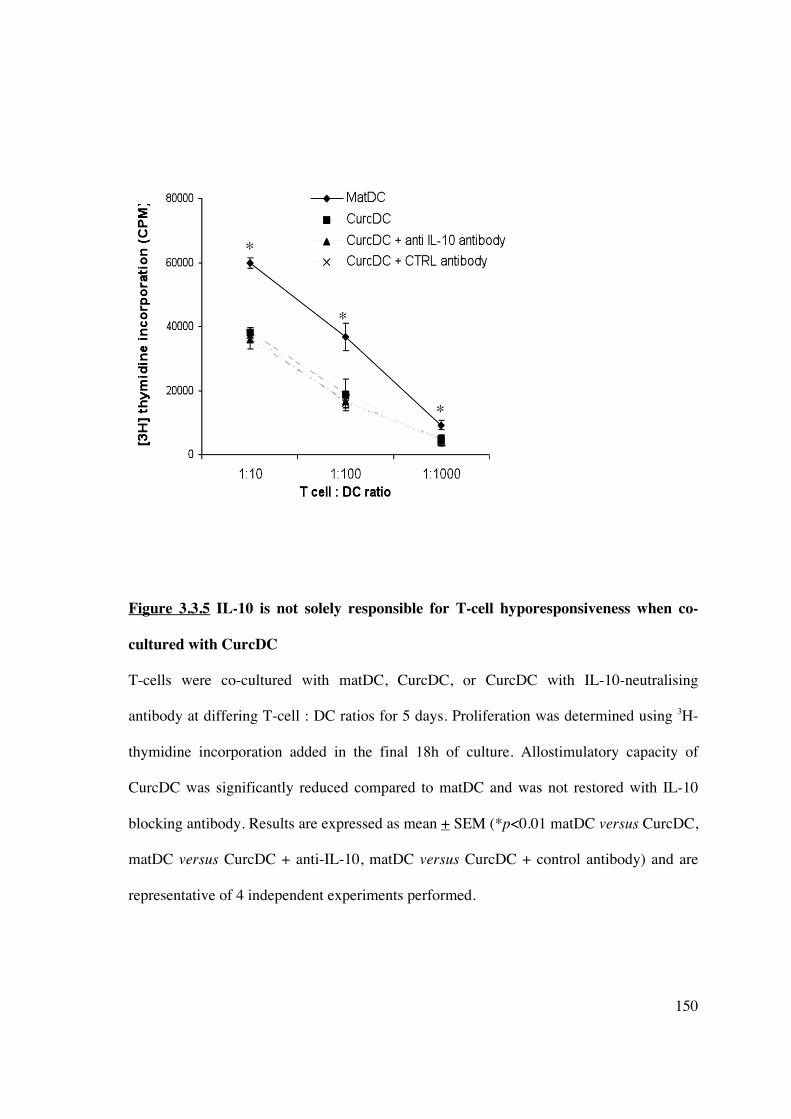
150
Figure 3.3.5 IL-10 is not solely responsible for T-cell hyporesponsiveness when co-
cultured with CurcDC
T-cells were co-cultured with matDC, CurcDC, or CurcDC with IL-10-neutralising
antibody at differing T-cell : DC ratios for 5 days. Proliferation was determined using 3H-
thymidine incorporation added in the final 18h of culture. Allostimulatory capacity of
CurcDC was significantly reduced compared to matDC and was not restored with IL-10
blocking antibody. Results are expressed as mean + SEM (*p<0.01 matDC versus CurcDC,
matDC versus CurcDC + anti-IL-10, matDC versus CurcDC + control antibody) and are
representative of 4 independent experiments performed.
*
*
*

151
3.3.6 T-cell hyporesponsiveness following co-culture with CurcDC is associated with
lower intracellular IFN�� expression but no difference in IL-10 expression.
The responding T-cell populations from the primary MLR were assessed to determine the
mechanism of reduced alloproliferative capacity associated with CurcDC. CurcDC were
compared with matDC, and added to allogeneic proliferating T-cells at a stimulator :
responder ratio of 1:100 for 5 days. T-cells were then separated from the stimulating DC
population using CD3+ immunomagnetic beads (90% purity). The proportion of T-cells
expressing intracellular IFN� was reduced in response to CurcDC (Figures 3.3.6A-B) in
keeping with previous reports of an immune deviation from Th1 helper-T cell generation
(388). There was no significant difference in intracellular IL-10 expression (Figures
3.3.6C-D).

152
Figure 3.3.6 Intracellular IFN�� expression in T-cells is reduced following co-culture
with CurcDC
Figure 3.3.6A The proportion of CD3+ T-cell expressing intracellular IFN� analysed
immediately following co-culture with matDC or CurcDC. Results are representative of 5
independent experiments performed.
50% 28%
matDC
Gated to lymphocytes, then CD3+ cells
CurcDC
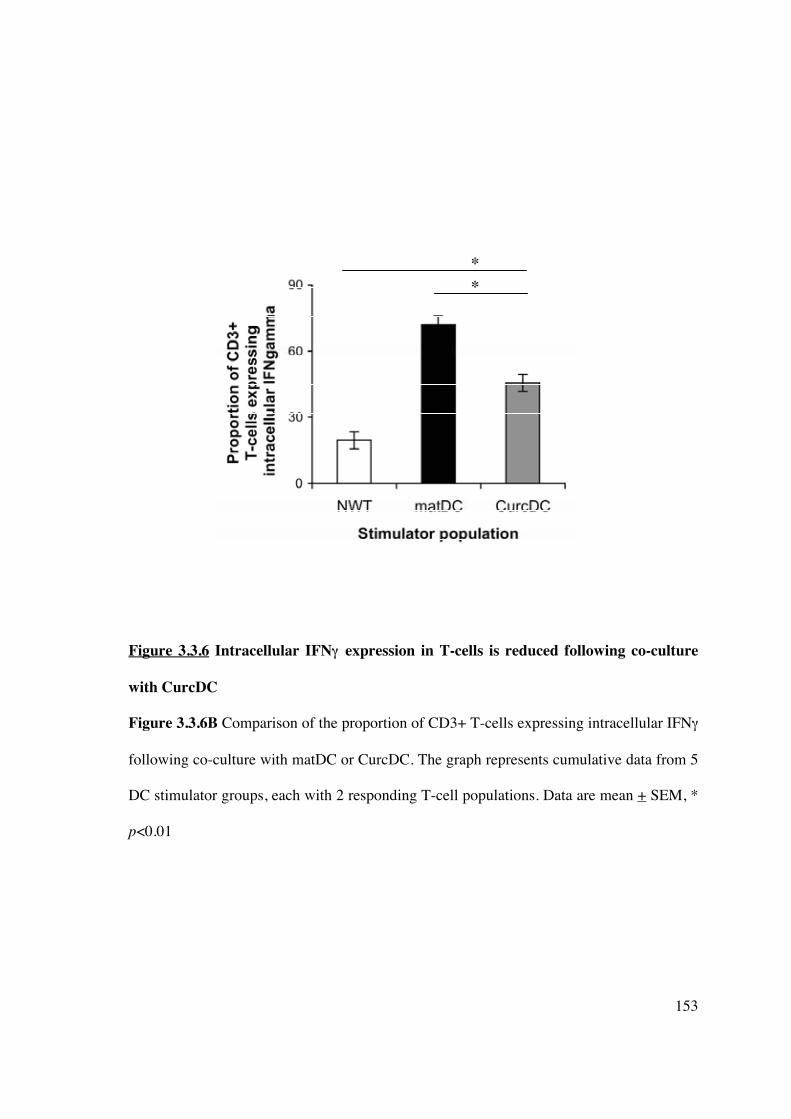
153
Figure 3.3.6 Intracellular IFN�� expression in T-cells is reduced following co-culture
with CurcDC
Figure 3.3.6B Comparison of the proportion of CD3+ T-cells expressing intracellular IFN�
following co-culture with matDC or CurcDC. The graph represents cumulative data from 5
DC stimulator groups, each with 2 responding T-cell populations. Data are mean + SEM, *
p<0.01
�
�

154
Figure 3.3.6 Intracellular IL-10 expression is not significantly reduced in T-cells
following co-culture with CurcDC
Figure 3.3.6C The proportion of CD3+CD4+ T-cells expressing intracellular IL-10 was
analysed immediately following co-culture with matDC or CurcDC. Results are
representative of 5 independent experiments performed.
matDC CurcDC
54% 40%
Gated to lymphocytes, then CD3+CD4+ cells

155
Figure 3.3.6 Intracellular IL-10 expression is not significantly reduced in T-cells
following co-culture with CurcDC
Figure 3.3.6D A comparison of the proportion of CD3+CD4+ T-cells expressing
intracellular IL-10 following co-culture with matDC or CurcDC. The graph represents
cumulative data from 5 DC stimulator groups, each with 2 responding T-cell populations.
Data are mean + SEM, ** p=0.282
**

156
3.3.7 T-cell hyporesponsiveness following co-culture with CurcDC is due to the
induction of CD4+CD25hiFoxP3+ Tregs
The proportion of Tregs was significantly increased following co-culture with CurcDC
compared to matDC (11.1% versus 4.8%, Figure 3.3.7A). This population was CD127lo
and CD62L+ confirming a Treg phenotype. Data from 8 independent experiments revealed
a 65% increase in the expansion of CD4+CD25hiFoxP3+ Tregs (p<0.001, Figure 3.3.7B).

157
Figure 3.3.7 Reduced allostimulatory capacity of CurcDC in a primary MLR is
mediated by CD4+CD25hiFoxP3+ regulatory T-cells
Figure 3.3.7A T-cell hyporesponsiveness was mediated by the generation of
CD4+CD25hiFoxP3+ T-cells that were also CD62L+ and CC127lo. Results are
representative of one experiment of 8 performed.
matDC CurcDC
4.8% 11.1%
Gated to lymphocytes, then to CD3+CD4+CD25hi cells

158
Figure 3.3.7 Reduced allostimulatory capacity of CurcDC in a primary MLR is
mediated by CD4+CD25hiFoxP3+ regulatory T-cells
Figure 3.3.7B A comparison of the proportion of CD3+CD4+CD25hiFoxP3+ T-cells
following co-culture with matDC or CurcDC, magnetic bead isolation and 48 hours
incubation in complete medium. The graph represents cumulative data from 8 independent
experiments. Data are mean + SEM, * p<0.01.
*

159
3.3.8 T-cell hyporesponsiveness following co-culture with CurcDC is not due to the
induction of TH17 cells.
There was a concurrent decrease in intracellular IL-17 expression following stimulation
with SEB (1.0% versus 2.1%, Figure 3.3.8).
Figure 3.3.8 CurcDC do not promote expansion of TH17 cells
The proportion of CD3+CD4+ T-cells expressing intracellular IL-17 analysed following
co-culture with matDC or CurcDC and subsequent overnight incubation with SEB. Results
are representative of 3 independent experiments.
matDC CurcDC
2.4% 1%
Gated to lymphocytes, then CD3+CD4+ cells

160
3.3.9 CurcDC do not induce T-cell apoptosis
The influence of CurcDC on the apoptosis of CD4+ T-cells during MLR was also
examined. As shown in Figure 3.3.9, CurcDC did not induce greater levels of late
apoptosis (Annexin V+PI+) in CD3+CD4+ cells compared with matDC.
Figure 3.3.9 T-cell apoptosis is not a mechanism for CurcDC to induce immune
hyporesponsiveness
When Annexin V/PI staining was used in flow cytometric analysis to determine the level of
T-cell apoptosis on day 5 of co-culture with CurcDC or matDC, there was no change in the
profile of late apoptotic (Annexin V+PI+) cells. The data are representative of three
separate experiments.
7.5% 1.6%
89.8% 1.1%
5.4% 0.8%
93.4% 0.4%
matDC CurcDC
Gated to lymphocytes, then CD3+CD4+ cells

161
3.3.10 T-cells primed with CurcDC exert suppressive function consistent with Tregs
To address whether T-cells from the primary MLR exerted a subsequent tolerogenic
function, T-cells isolated from the primary MLR (using CD3+ immunomagnetic beads,
95% purity) were re-stimulated with DC from the same donor or third party. T-cells primed
with CurcDC were less responsive to subsequent allogeneic stimulation (Figure 3.3.10A),
and flow cytometric analysis demonstrated a concurrent expansion in the
CD4+CD25hiFoxP3+CD127lo Treg population, although this effect was not specific for the
primary donor antigen (Figure 3.3.10B). Consistent with this tolerogenic pattern, CD4+ T-
cells primed with CurcDC exerted regulatory functions on naïve syngeneic T-cells (Figure
3.3.10C). These results indicate that CurcDC induce FoxP3+ regulatory T-cells capable of
promoting regulatory function on naïve T cells.
162
Figure 3.3.10 CurcDC are tolerogenic
Figure 3.3.10A T-cells were initially co-cultured with CurcDC or matDC, isolated from
the stimulating cell population using CD3+ magnetic beads, and restimulated in a 5-day
MLR. Stimulating DC were harvested from the same donor or third party donor and
subsequent T-cell hyporesponsiveness was not limited to the primary donor antigen. Data
are representative of 3 independent experiments, and expressed as mean + SEM, *p<0.01
(matDC versus curcDC).
*
*

163
Figure 3.3.10 CurcDC are tolerogenic and subsequent immune hyporesponsiveness is
FoxP3+ Treg-mediated
Figure 3.3.10B Compared to matDC, re-stimulation of T-cells initially co-cultured with
CurcDC significantly expanded CD4+CD25hiFoxP3+ Tregs that were CD127lo. Data are
representative of 3 independent experiments.
same donor 3rd party donor
same donor 3rd party donor
T-cells initially co-cultured with matDC
T-cells initially co-cultured with CurcDC
29.6% 28.5%
Gated to lymphocytes, then CD3+CD4+CD25hi
4.8% 10%

164
Figure 3.3.10 CurcDC are tolerogenic and expand functional Tregs
Figure 3.3.10C Naïve CD4+ T-cells were allostimulated for 5 days in the presence of
CD3+purified T-cells previously primed with CurcDC at ratios of 1:1 to 20:1,
demonstrating suppression of naïve syngeneic T-cell proliferation and confirming
regulatory function. This figure is representative of three independent experiments,
*p<0.01.
Same donor 3rd party donor
* *

165
3.4 RESULTS – IN VIVO
3.4.1 Allogeneic murine CD11c+ DC migrate systemically
To address in vivo applicability of our findings, splenic CD11c+ DC from C57BL/6 (H2b)
mice were isolated using immunomagnetic bead separation (80% purity). DC were
fluorescently labelled with DiI to assess systemic distribution after 7 days. Control (naïve)
mice received PBS alone. Confocal microscopy demonstrated widespread presence of
DiI+ve DC in liver, spleen, and kidney, in addition to mesenteric lymph nodes (Figure
3.4.1B-F). No staining was observed in spleen of PBS-injected mice (Figure 3.4.1A).
Immunofluorescent staining and confocal microscopy of spleen demonstrated co-
localisation of DiI-labelled DC, CD11c, and DEC205 (Figure 3.4.1B) confirming DC
phenotype in vivo. However, final confirmation that these DC were in fact donor-derived
(rather than donor-derived DC simply endocytosed by recipient DC) is still required.
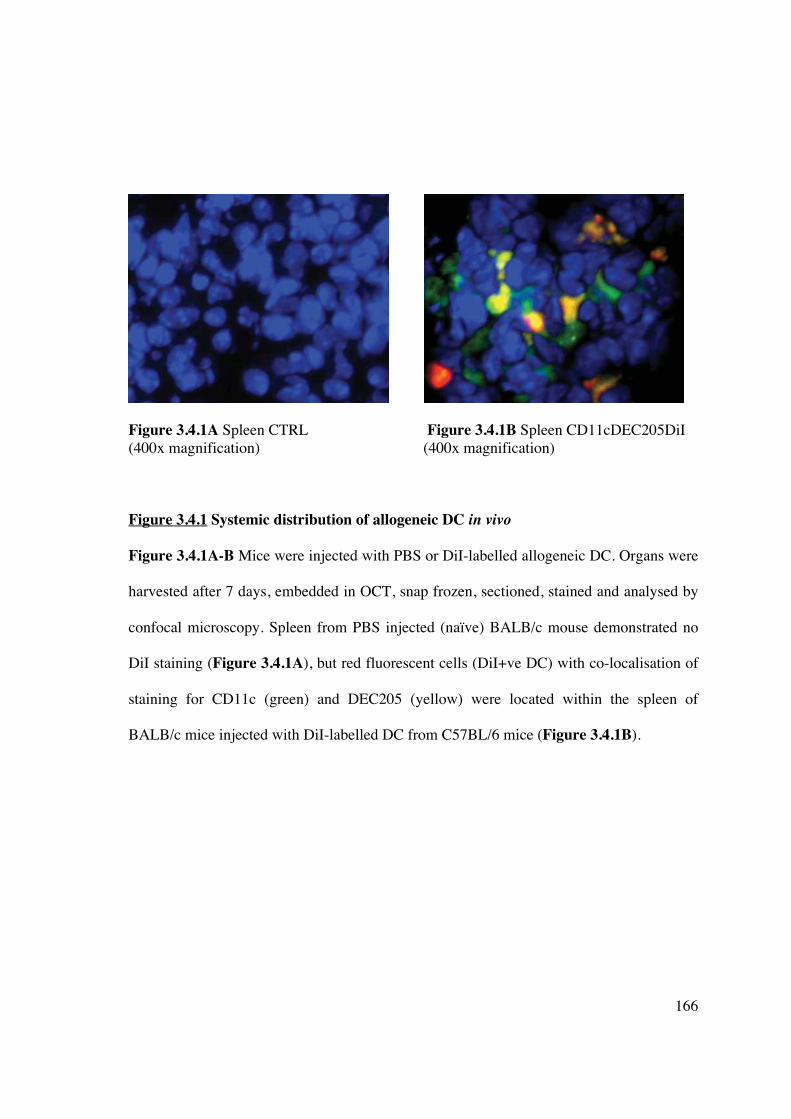
166
Figure 3.4.1A Spleen CTRL Figure 3.4.1B Spleen CD11cDEC205DiI (400x magnification) (400x magnification)
Figure 3.4.1 Systemic distribution of allogeneic DC in vivo
Figure 3.4.1A-B Mice were injected with PBS or DiI-labelled allogeneic DC. Organs were
harvested after 7 days, embedded in OCT, snap frozen, sectioned, stained and analysed by
confocal microscopy. Spleen from PBS injected (naïve) BALB/c mouse demonstrated no
DiI staining (Figure 3.4.1A), but red fluorescent cells (DiI+ve DC) with co-localisation of
staining for CD11c (green) and DEC205 (yellow) were located within the spleen of
BALB/c mice injected with DiI-labelled DC from C57BL/6 mice (Figure 3.4.1B).
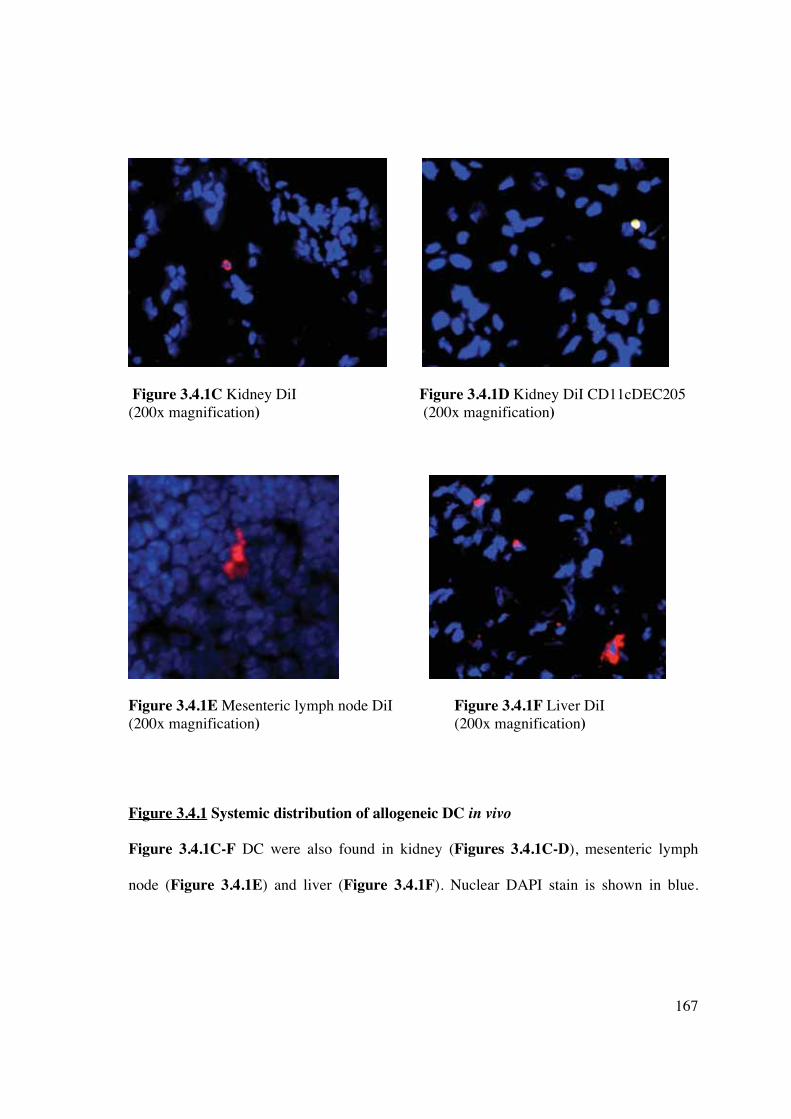
167
Figure 3.4.1C Kidney DiI Figure 3.4.1D Kidney DiI CD11cDEC205 (200x magnification) (200x magnification)
Figure 3.4.1E Mesenteric lymph node DiI Figure 3.4.1F Liver DiI (200x magnification) (200x magnification)
Figure 3.4.1 Systemic distribution of allogeneic DC in vivo
Figure 3.4.1C-F DC were also found in kidney (Figures 3.4.1C-D), mesenteric lymph
node (Figure 3.4.1E) and liver (Figure 3.4.1F). Nuclear DAPI stain is shown in blue.
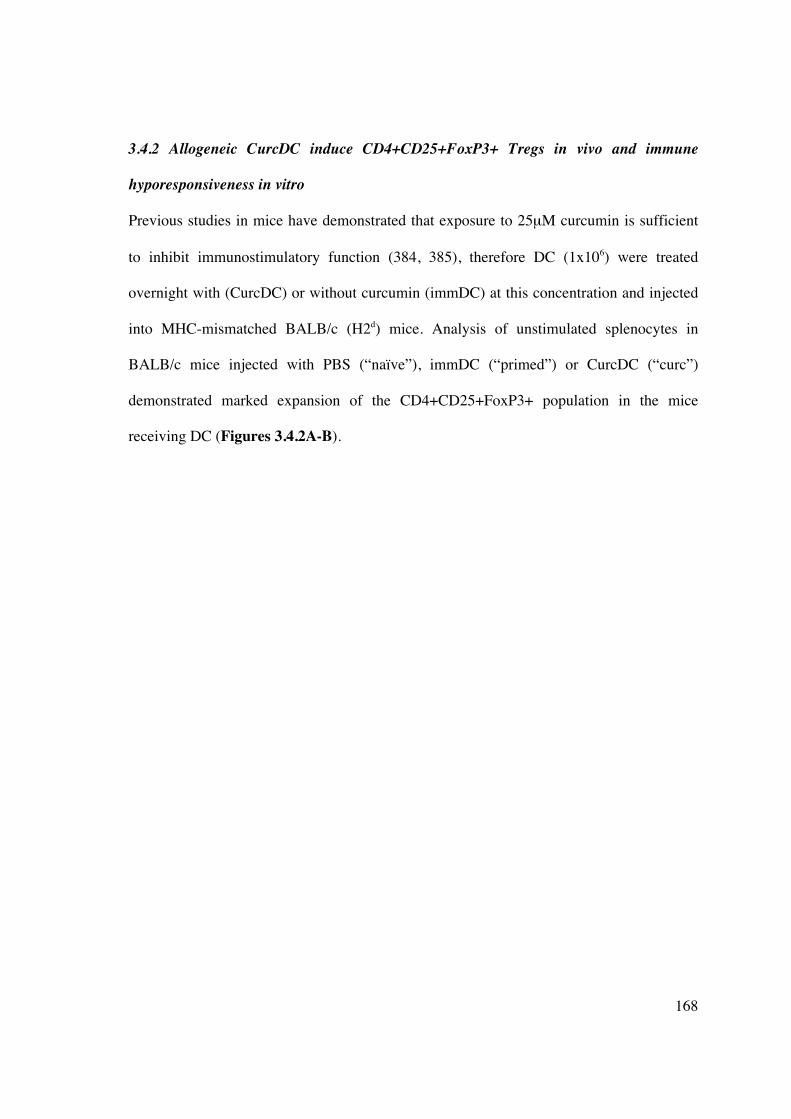
168
3.4.2 Allogeneic CurcDC induce CD4+CD25+FoxP3+ Tregs in vivo and immune
hyporesponsiveness in vitro
Previous studies in mice have demonstrated that exposure to 25μM curcumin is sufficient
to inhibit immunostimulatory function (384, 385), therefore DC (1x10⁶) were treated
overnight with (CurcDC) or without curcumin (immDC) at this concentration and injected
into MHC-mismatched BALB/c (H2d) mice. Analysis of unstimulated splenocytes in
BALB/c mice injected with PBS (“naïve”), immDC (“primed”) or CurcDC (“curc”)
demonstrated marked expansion of the CD4+CD25+FoxP3+ population in the mice
receiving DC (Figures 3.4.2A-B).

169
Figure 3.4.2 Allogeneic DC infusion promotes expansion of CD4+CD25+FoxP3+
Tregs in vivo
Figure 3.4.2A Flow cytometric analysis of the unstimulated splenocyte population
demonstrates expansion of CD4+CD25+FoxP3+ cells in mice injected with allogeneic DC,
7 days after injection. Results are representative of one experiment out of 3 performed.
4.3%
8.1%
7.5%
Naïve -injected with PBS
Primed
- injected with immDC
Curc - injected with CurcDC
Gated - CD4+
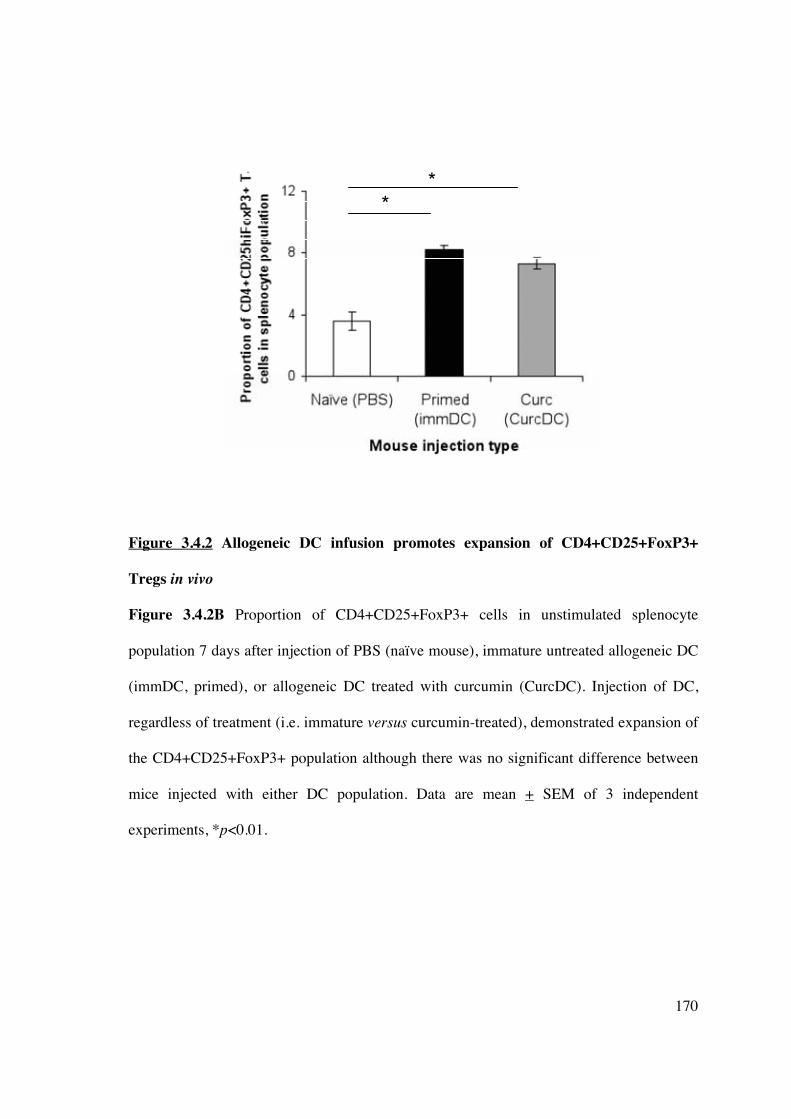
170
Figure 3.4.2 Allogeneic DC infusion promotes expansion of CD4+CD25+FoxP3+
Tregs in vivo
Figure 3.4.2B Proportion of CD4+CD25+FoxP3+ cells in unstimulated splenocyte
population 7 days after injection of PBS (naïve mouse), immature untreated allogeneic DC
(immDC, primed), or allogeneic DC treated with curcumin (CurcDC). Injection of DC,
regardless of treatment (i.e. immature versus curcumin-treated), demonstrated expansion of
the CD4+CD25+FoxP3+ population although there was no significant difference between
mice injected with either DC population. Data are mean + SEM of 3 independent
experiments, *p<0.01.
*
*

171
3.4.3 Murine CurcDC infused in vivo impair the subsequent alloproliferative response by
expanding FoxP3+ Tregs in a non-antigen-specific manner
Re-stimulation of splenocytes ex vivo in a MLR with primary donor (C57BL/6) or 3rd party
antigen (C3H, H2k) showed suppression of the alloproliferative response only in mice
injected with CurcDC (Figure 3.4.3A). Mice injected with immDC demonstrated antigen-
specific priming of the immune response. This effect was not specific for the primary
donor antigen. Flow cytometric analysis of the responding T-cell population in the
secondary MLR demonstrated expansion of CD4+CD25hiFoxP3+ T-cells (Figure 3.4.3B),
most marked in mice injected with CurcDC.

172
0
1000
2000
3000
Naïve (PBS) Primed
(immDC)
Curcumin
(CurcDC)
[3H
] th
ym
idin
e i
nc
orp
ora
tio
n
(CP
M)
Same donor
3rd party
Figure 3.4.3 CurcDC infused into mice impair subsequent splenocyte proliferative
response
Figure 3.4.3A Splenocytes from injected BALB/c mice were restimulated ex vivo for 3
days with primary donor (C57BL/6) or third party donor (C3H) antigen (irradiated
splenocytes). Infusion of immDC led to an antigen-specific primed immune response.
However, CurcDC non-specifically impaired alloproliferation compared to both naïve
(PBS injected) and primed (immDC-injected) mice (*p<0.01). Results are expressed as
mean + SEM of quintuplicate measurements, and representative of 4 independent
experiments.
*
*

173
Figure 3.4.3 CurcDC infused into mice impair subsequent splenocyte proliferative
response
Figure 3.4.3B Curc DC infused into mice impair splenocyte proliferative response in a
manner that is mediated by FoxP3+ Tregs and is not donor-antigen specific.
Naïve
- injected with PBS
Primed
- injected with immDC
Curc
- injected with CurcDC
P2=2.2%
%
P2=4.7%
P2=13.2%
%
P4=29%
P4=19.8%
P4=42.5%
same donor

174
Figure 3.4.3 CurcDC infused into mice impair subsequent splenocyte proliferative
response
Figure 3.4.3B Curc DC infused into mice impair splenocyte proliferative response in a
manner that is mediated by FoxP3+ Tregs and is not donor-antigen specific. The
responding CD4+ T-cell population in the subsequent MLR was analysed, demonstrating
expansion of the CD4+CD25hiFoxP3 following infusion of both immDC and CurcDC,
although the increase was substantially greater in the latter. Treg expansion was not
specific for the primary donor antigen. Results are representative of 2 separate experiments
each with n=2 mice per group.
P2=8.2% P4=24.8%
P2=19% P4=37.6%
3rd party donor
Primed
- injected with immDC
Curc
- injected with CurcDC

175
3.5 DISCUSSION
The differentiation of monocytes into DC under the influence of GM-CSF and IL-4
provides an in vitro model to assess the ability of immunomodulatory agents to interfere
with the process of DC differentiation and maturation. Randolph et al. (389, 390) have
demonstrated that monocytes do indeed differentiate into DC in vivo, thus an in vitro model
can be viewed as representative of this physiological process.
In this study, hu-Mo-DC propagated under standard conditions and subsequently exposed
to curcumin show impaired ability to undergo phenotypic and functional maturation
following exposure to LPS, a potent TLR agonist. CurcDC were maturation-arrested as
evidenced by 1) down-regulated positive co-stimulatory molecule expression, particularly
CD83 (Figure 3.3.1B), 2) low mRNA expression of the transcription factor RelB (Figure
3.3.2A) and failure to up-regulate NF-�B-p50 (Figure 3.3.2C), and 3) negligible
production of IL-12p70 following stimulation with LPS and/or CD40L and IFN� (Figure
3.3.3B). The most significant features of CurcDC were reduced RelB expression/NF-�B
nuclear translocation and the inability to produce bioactive IL-12 following exposure to
CD40L and IFN�. These stimuli mimic the conditions encountered by allogeneic DC when
introduced in vivo (391, 392); ligation of CD40 on unmodified DC by CD40L (CD154)
induces DC maturation and abrogates tolerogenic properties (393). The resistance of
CurcDC to maturation was observed following withdrawal of curcumin, indicating it is a
characteristic of the generated DC and not a “carry-over” effect of curcumin.
Several additional features of CurcDC were identified: negative regulators of DC
phenotype were differentially affected. PDL-1 (and PD-L2) expression was reduced,

176
although still detectable to allow engagement of the T-cell ligand PD-1. ILT2 and ILT4
expression was unaffected. These cell surface molecules are members of the
immunoglobulin gene superfamily that signal via immunotyrosine-based inhibitory motifs
to inhibit cellular responses. They bind a broad range of human leukocyte antigens (HLA)
although demonstrate higher affinity interactions with HLA-G than with classical MHC
class I (394). Maintained ILT2 expression in particular may be modulating the primary T-
cell response by decreasing TCR� phosphorylation required for ZAP70 complex formation
thus altering actin cytoskeleton formation essential for T-cell activation (395), or simply
inhibiting T-cell function through the interaction with MHC class I (396). The tolerogenic
characteristics of CurcDC also reflect a lower ratio of positive co-stimulatory to inhibitory
signals.
Curcumin has immunomodulatory properties mediated via NF-�B inhibition, including
inhibition of B-cell proliferation (397), activation of T-cells (398), down-regulation of
reactive oxygen species and nitric oxide generation by macrophages (399) and increased
NK cell cytotoxicity (378). The complex of NF-�B comprising structurally related proteins
(p50, p52, RelA, c-Rel, and RelB) has emerged as fundamental to the generation of mature
antigen presenting cells, particularly B cells (400) and myeloid DC (203). The addition of
curcumin to CM at commencement of hu-Mo-DC propagation resulted in monocyte death
(data not shown), and its use at earlier time points during DC differentiation (within 24-48h
of exposure to GM-CSF and IL-4) inhibited DC development as demonstrated by high
levels of CD14 expression and reduced DC-SIGN expression on flow cytometry (data not
shown). During DC differentiation and maturation the positive co-stimulatory molecular
profile increases, whereas inhibitory receptor concomitantly decrease, and this trend is

177
attributable to NF-�B/RelB (401, 402). Thus, modulation of NF-�B provides a promising
avenue for DC manipulation and induction of immune hyporesponsiveness. NF-�B
oligonucleotides promote survival of MHC-mismatched rodent cardiac allografts (403).
Bay 11-7082, which inhibits I�K phosphorylation thus preventing NF-�B nuclear
translocation, produced murine DC phenotypes similar to those seen in RelB-deficient mice
and imparted antigen-specific tolerance in an IL-10-dependent manner (203). An analogue
of DSG, LF15-0195, has been shown to induce MHC-mismatched cardiac allograft
acceptance via NF-�B inhibition (404).
Tolerogenic DC induce immune tolerance through several pathways, including clonal T-
cell depletion or exhaustion, anergy, deviation of helper T-cell differentiation or generation
of Tregs (249, 362). The phenotypic profile of proliferating T-cells altered in response to
curcumin-treated hu-Mo-DC, and demonstrate that inhibition of T-cell alloproliferative
capacity correlates with expansion of the CD4+CD25hiFoxP3+ regulatory T-cell
population. CurcDC failed to produce IL-12p70 essential for polarisation of a Th1
response; expression of IFN� in the responding T-cells was also down-regulated, in
keeping with development of a Th2-deviated microenvironment previously reported (388).
IFN�, in addition to TGF-� and IL-2, are critical to the generation of FoxP3+ Tregs (405-
407); analysis of supernatant cytokine production in the primary MLR would provide
additional information regarding the cytokine microenvironment promoting Treg expansion
by CurcDC.
CurcDC-primed T-cells display reduced alloproliferative capacity following re-stimulation
with alloantigen (Figure 3.3.10) and this is mediated by expansion of a

178
CD4+CD25hiCD127loFoxP3+ Treg population (Figure 3.3.10B) capable of regulating
naïve syngeneic T-cell proliferation (Figure 3.3.10C). This is consistent with previous
reports that co-stimulation is required for induction and expansion of FoxP3+ Tregs, which
is mediated by the production of IDO from DC (408, 409). However, the regulatory effect
was not alloantigen-specific, in keeping with previous studies (368, 410, 411). Multiple
CD4+ Treg subsets have been identified, including FoxP3+ Tregs, CD4+CD25-FoxP3- IL-
10 producing Tr1 cells (412, 413), and transforming growth factor-beta (TGF�+) Th3 cells
(414), although we did not demonstrate all populations. The use of CD3+ purified T-cells
did not exclude the generation of other regulatory subsets which are not exclusive to CD4+
enriched T-cells: CD8+ (358, 415), CD4-CD8- (416), gammadelta (417) and NKT cells
(418) have also been implicated.
An additional finding was the decreased production of TH17 CD4+ helper T-cells. TH17
cells express the IL-23 receptor (419), transcription factors ROR�t (420, 421) and ROR�
(16), and produce IL-22 and IL-17 (422). They also share a developmental pathway with
FoxP3+ Tregs, requiring the addition of IL-6 in the presence of TGF-� (423). Thus, the
cytokine microenvironment and anti-inflammatory effects induced by curcumin in vitro, in
addition to the up-regulation of FoxP3+ Tregs, may have altered TH17 CD4+ T-cell
lineage commitment.
Murine bone-marrow-derived DC exposed to curcumin have been previously shown to
generate FoxP3+ Tregs in vitro (385). The stability and maturation-resistance of CurcDC
under inflammatory conditions is crucial to their successful application as tolerogenic
agents in vivo that down-regulate anti-donor T-cell responses. DC that are resistant to

179
maturation offer a considerable advantage over conventional “immature” DC, as
demonstrated by our in vivo results. The latter undergo maturation in vivo, sensitising the
recipient, and limiting their effectiveness in promoting immune hyporesponsiveness. We
have demonstrated that infusion of allogeneic DC induced FoxP3+ Treg generation in vivo
(Figure 3.4.2), although only CurcDC reduced subsequent alloproliferative responses
(Figure 3.4.3A) with significant expansion of the FoxP3+ compartment (Figure 3.4.3B).
In conclusion, exogenous curcumin deviates hu-Mo-DC towards tolerogenic DC, capable
of generating FoxP3+ regulatory T-cells. The advantage of curcumin is its low
cytotoxicity, and its potency as an NF-�B inhibitor, in addition to antioxidant and anti-
inflammatory properties. Thus, the present observations provide a new way of generating
tolerogenic DC ex vivo as a therapeutic tool, with potential applications in vivo that need to
be demonstrated in a transplant model.
180
CHAPTER 4: MODIFICATION OF DENDRITIC CELLS IN
VITRO AND IN VIVO USING LIPOSOMES
4.1 INTRODUCTION
Donor-specific immune tolerance is a highly desirable goal of transplantation research. DC,
as potent immune system regulators and biosensors, promote both anti-donor immunity and
immune tolerance (26, 424). Thus, DC remain an important target for potential tolerance-
inducing therapies. Numerous in vitro studies have established the generation of
tolerogenic DC using a wide variety of stimuli, modification of culture conditions or gene
expression (144, 148, 153, 198, 425, 426). Small animal transplant studies have utilised
recipient pre-conditioning to prolong vascularized allograft survival (427-431), although
translation of such results to non-human primate models has been limited. In addition, the
optimal DC subset, phenotype, and tolerizing agent remains to be identified, as does route
of administration, cell dose, and control of DC fate in vivo. Ex vivo manipulation of either
donor- or recipient-derived DC is time-consuming and expensive, and lacks clinical
applicability. Similarly, in vivo expansion of DC using growth factors (such as Flt3L) has
yielded divergent results following transplantation (432-435).
In vivo targeting of recipient tissue-resident DC can be achieved using monoclonal
antibodies targeting DC-specific markers attached to alloantigen peptides (436), apoptotic
donor cells (437, 438) or MHC-rich exosomes (213). However, limitations exist in these
particulate delivery systems in terms of size, stability and cell-specificity. Liposomal
encapsulation of immunomodulatory agents provides a mechanism for improving
181
therapeutic drug delivery to DC. Liposomes are formed spontaneously as phospholipids
coalesce into a closed vesicular structure in an aqueous environment. Liposomes can be
formulated to deliver a wide variety of drug molecules, proteins, nucleic acids and
plasmids regardless of lipid solubility and can be processed to differ in size, charge,
composition and lamellarity to facilitate cellular delivery (see Section 1.6.2). Similarly,
membranous vesicular structures, such as plasma membrane vesicles (PMV), derived from
donor or recipient cells and expressing antigen in the form of MHC can be incorporated
into liposomes as additional immunomodulatory agents (439). A cell-free system can
overcome the difficulties associated with cell-based vaccines, targeting DC (and other APC
as required) to deliver NF�B or co-stimulatory blockade.
The aims of this chapter are:
1] to investigate the potential for liposomes to incorporate immunomodulatory agents
whilst maintaining biologic activity,
2] to illustrate that liposomes may be delivered effectively in vivo and,
3] to demonstrate that liposomes may be used to target and generate tolerogenic DC in
vivo, thus eliminating the need for ex vivo modulation.

182
4.2 METHODS
4.2.1 Peripheral blood sampling
4.2.1.1 Human
Human PBMC were derived from healthy volunteers or buffy coats obtained from the
South Australian Red Cross Blood Service and processed as described in Chapter 2
(Section 2.1.1.1).
4.2.1.2 Marmoset
Marmoset PBMC were obtained by venepuncture as described in Chapter 2 (Section
2.1.2).
4.2.2 Cell culture
Protocols for reagents and media, propagation of hu-Mo-DC, cell separation and culture,
flow cytometry, and primary mixed lymphocyte reactions are described in Chapter 2.
4.2.3 Liposome synthesis
4.2.2.1 Non-targeted (conventional) liposomes
Liposomes (with/without curcumin and/or PMV) used in vivo in the following experiments
were synthesised by thin film evaporation and rehydration at the Ian Wark Institute,
University of South Australia, Adelaide as described in Chapter 2 (Section 2.7).
4.2.2.2 IL-10-containing liposomes
Liposomes were synthesised at the John Curtin School of Medical Research, Australian
National University, Canberra as described in Chapter 2 (Section 2.7). IL-10 (Peprotech)

183
was added to the preparation at the time of rehydration. Sonicated and non-sonicated
samples were made to compare incorporation of IL-10.
4.2.2.2.1 Assessment of liposomal IL-10 concentration
IL-10 containing liposomes were pelleted (centrifuged at 50,000rpm for 45 minutes at 4°C)
and separated from the supernatant containing excess, unincorporated IL-10. The liposome
pellet was dissolved in 1% Triton X-100 to release IL-10 and the concomitant
concentration in both dissolved pellet and supernatant was quantified by the ELISA Ready-
Set-GO! kit (eBioscience) according to manufacturer instructions (Chapter 2, Section 2.3).
Plates were read using Microplate Reader (Labequip) at 450nm wavelength; unknown
concentrations were calculated based on the standard curve.
4.2.2.2 PMV synthesis
PMV were synthesised at the John Curtin School of Medical Research, Australian National
University, Canberra and subsequently incorporated into liposomes as described in Chapter
2 (Section 2.7.2).
4.2.3 In vivo experiments
4.2.3.1 Mice
Experiments were performed on 8-12 week old male C57BL/6 mice with ethics committee
approval from both the Institute of Medical and Veterinary Science (IMVS) and University
of Adelaide (project number 40/09). The mice were housed in pathogen-free conditions at
the Animal Care Facility at the IMVS (Adelaide, Australia).

184
4.3 RESULTS
4.3.1 DC are targeted in vivo using conventional liposomes
The ability of unmodified liposomes to target DC in vivo was assessed using liposomes
synthesised with phosphatidylcholine and labelled with the fluorescent marker DiI. DiI was
chosen because of its strong fluorescence, high lipophilic stability and lack of transfer
between cell membranes once incorporated. To assess the cellular fate of liposomes,
spleens were examined 24 hours after intravenous administration of DiI-labelled EPC
liposomes to mice. Whole cell suspensions from digested spleen were analysed by flow
cytometry (Figure 4.3.1.1), or complete organs were embedded, sectioned and examined
by immunofluorescence microscopy (Figure 4.3.1.2). DiI-liposomes were endocytosed
almost exclusively by MHC class II+ cells within the spleen (Figure 4.3.1.1). Flow
cytometric analysis and immunofluorescence microscopy indicated that liposomes were
taken up by CD11b+F480+CD11c- macrophages and CD11c+ myeloid and plasmacytoid
DC, including B220hiCD11clo and B220loCD11chi subsets, PDCA1+ and PDCA-CD11c+
DC, and CD8+ and CD8- DC subsets. There was also substantial uptake by CD3+ T cells
within the spleen.

185
Figure 4.3.1.1 Liposomes home to antigen presenting cells in lymphoid tissue
PBS (CTRL) or fluorescent (DiI-labelled) liposomes were injected intravenously into
C57BL/6 mice and the spleen harvested after 24 hours. Spleens were digested and the
subsequent cell suspension was stained for antigen-presenting cells, including anti-CD3
FITC, anti-CD11b FITC, anti-CD11c FITC or PE-CY7, anti-F480 PE-CY5, anti-CD8�
APC, anti-B220 PE-CY5, anti-PDCA-1 FITC or anti-MHC FITC, and analysed by flow
cytometry. Red fluorescent (DiI+) cells were gated as shown (P5) in the upper panels and
appear black in each plot. Results are representative of 3 independent experiments.
CTRL DiI-liposome
Gated to CD11c negative fraction
P5

186
Figure 4.3.1.1 Liposomes home to antigen presenting cells in lymphoid tissue
CTRL DiI-liposome

187
Figure 4.3.1.1 Liposomes home to MHC class II-expressing cells and CD3+ T-cells in
lymphoid tissue
CTRL DiI-liposome

188
Figure 4.3.1.2A-D Liposomes home to antigen presenting cells in lymphoid tissue
Fluorescent (DiI-labelled) liposomes were injected into C57BL/6 mice. The spleen
harvested after 24 hours, snap frozen in OCT, sectioned, and stained. Analysis by confocal
microscopy demonstrates endocytosis by antigen-presenting cells, predominantly
macrophages and multiple DC subsets.
Figure 4.3.1.2A CTRL spleen: mouse injected with PBS, CTRL isotypes added prior to confocal microscopy
Figure 4.3.1.2B Mouse injected with DiI-labelled liposome (red), CTRL isotypes added prior to confocal microscopy
Figure 4.3.1.2C Mouse injected with DiI-labelled liposome (red), subsequently stained for CD11c FITC (green) and B220 PE-CY5 (orange)
Figure 4.3.1.2D Mouse injected with DiI-labelled liposome (red), subsequently stained for CD11c FITC (green) and CD8� (cyan)

189
Figure 4.3.1.2E-G Liposomes home to antigen presenting cells in lymphoid tissue
Figure 4.3.1.2E Mouse injected with DiI-labelled liposome (red), subsequently stained for CD11c FITC (green) and F480 PE-CY5 (yellow)
Figure 4.3.1.2F Mouse injected with DiI-labelled liposome (red), subsequently stained for MHC FITC (green)
Figure 4.3.1.2G Mouse injected with DiI-labelled liposome (red), subsequently stained for PDCA-1 FITC (green)

190
4.3.2 Liposomal incorporation of immunomodulatory agents
4.3.2.1 IL-10 incorporates into liposomes and inhibits DC allostimulatory capacity
IL-10 is an anti-inflammatory cytokine implicated in the tolerizing process, produced by
Th2 clones (440), B-cells (441), macrophages and mast cells (442). It inhibits the
allostimulatory capacity of APC, such as monocytes, macrophages and DC, by down-
regulating co-stimulatory and intercellular adhesion molecules (443-445). Immature DC
co-cultured with IL-10 induce tolerogenic DC and alloantigen-specific anergy (164). Thus,
delivery of IL-10 to tissue-resident immature DC in vivo may be useful in down-regulating
the adaptive immune response following transplantation. Therefore, the ability of IL-10 to
incorporate into a liposome preparation and the preservation of biologic activity was
investigated.
To assess the capacity of IL-10 to incorporate into liposomes, IL-10 (250pg/ml) was added
during liposome synthesis with or without sonication of samples. The liposomes were
centrifuged to separate supernatant and pellet and an ELISA determined concurrent IL-10
concentrations. IL-10 was found predominantly in the supernatant; only 32.3pg/ml (13% of
total IL-10) was incorporated into the liposome (Figure 4.3.2.1). This increased to 20%
following sonication. The process of sonication, or freeze-thawing for liposomes made
using a dehydration-aqueous buffer rehydration method, is commonly used for
encapsulation of protein (305, 348, 446). It ruptures small (20-100nm) single unilamellar
vesicles during which the solute equilibrates throughout the liposome emulsion, and
liposomes themselves fuse to produce larger unilamellar vesicles. The heterogenously sized
population can be further modified by extrusion to produce liposomes of defined size.
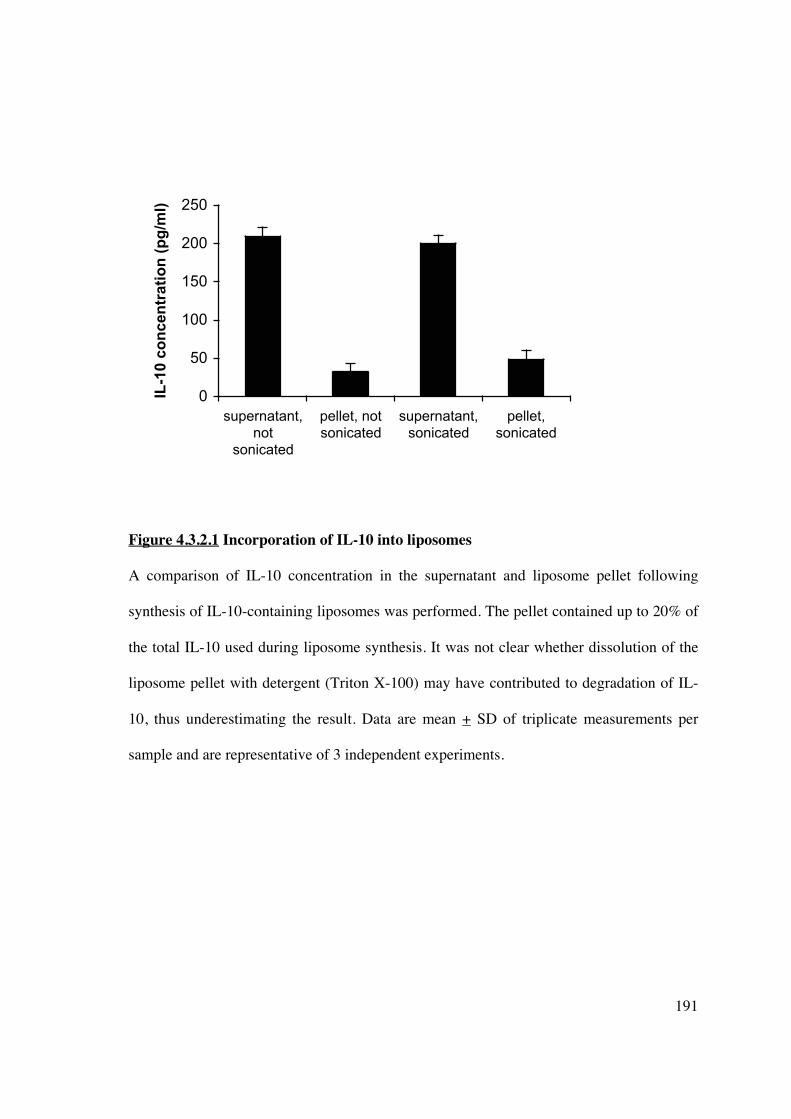
191
0
50
100
150
200
250
supernatant,
not
sonicated
pellet, not
sonicated
supernatant,
sonicated
pellet,
sonicated
IL-1
0 c
on
ce
ntr
ati
on
(p
g/m
l)
Figure 4.3.2.1 Incorporation of IL-10 into liposomes
A comparison of IL-10 concentration in the supernatant and liposome pellet following
synthesis of IL-10-containing liposomes was performed. The pellet contained up to 20% of
the total IL-10 used during liposome synthesis. It was not clear whether dissolution of the
liposome pellet with detergent (Triton X-100) may have contributed to degradation of IL-
10, thus underestimating the result. Data are mean + SD of triplicate measurements per
sample and are representative of 3 independent experiments.

192
4.3.2.2 IL-10 liposomes maintain biologic activity in vitro
Liposomes containing IL-10 were added at various doses to immature DC at day 5 for 48
hours. DC were harvested, washed 3 times in PBS, irradiated and co-cultured with
allogeneic T-cells (NWT) to assess allostimulatory capacity. IL-10 liposomes at various
doses led to a dose-dependent inhibition T-cell proliferation (Figure 4.3.2.2). A significant
inhibitory effect was detected at 5ng/ml, with an increase in inhibition up to 20ng/ml.
Previous studies have shown increasing inhibition to concentrations of 80ng/ml (164).
However, the liposomal incorporation of IL-10 is inefficient, such that achieving such
concentrations rapidly exhausts liposome and IL-10 stocks.

193
Figure 4.3.2.2 Liposomal IL-10 maintains biologic activity and inhibits DC
allostimulatory capacity in vitro
IL-10 liposomes inhibited DC allostimulatory capacity in a one-way MLR in a dose-
dependent manner. DC were cultured for 5 days in medium containing GM-CSF and IL-4
as described, resuspended and exposed to complete medium or increasing concentrations of
liposomal IL-10 for 2 days. After extensive washing, DC (1x10⁴) were co-cultured with
NWT (1x10⁵) for 5 days. T cell proliferation was quantified by [3H]TdR incorporation
during the last 18 hours of culture. Data are mean cpm + SD of quintuplicate wells. Results
are representative of 3 independent experiments. *p<0.05 compared to no IL-10.
* *
*

194
4.3.2.3 Curcumin liposomes in vitro demonstrate immunosuppressive activity in an MLR
Curcumin is a polyphenolic extract of turmeric with a broad range of biologic activities
(447) and has been shown to inhibit DC maturation (388). Its lipophilic nature lends itself
to liposomal formulation as it is incorporated within the phospholipid bilayer, and thus
would be likely to achieve higher concentrations compared less lipophilic agents, such as
IL-10.
Curcumin liposomes were synthesised as described in Chapter 2 (Section 2.7). To
demonstrate that curcumin contained within a liposomal formulation retains biologic
activity, we added serial dilutions of curcumin liposome to a human PBMC one-way MLR
and assessed proliferative response (Figure 4.3.2.3.1). We compared this to curcumin
added directly to the MLR culture medium (Figure 4.3.2.3.2). Once an inhibitory effect in
humans was demonstrated, we investigated the ability of curcumin liposomes to inhibit
alloproliferation of marmoset PBMC (Figure 4.3.2.3.3), in order to assess potential
applicability in a pre-clinical transplant model. The effect of liposomal curcumin on the
alloproliferative response of marmoset PBMC was less than that demonstrated in human
assays at the same dilution. This may be due to a difference in the ability of curcumin to
inhibit NHP NF�B activity.
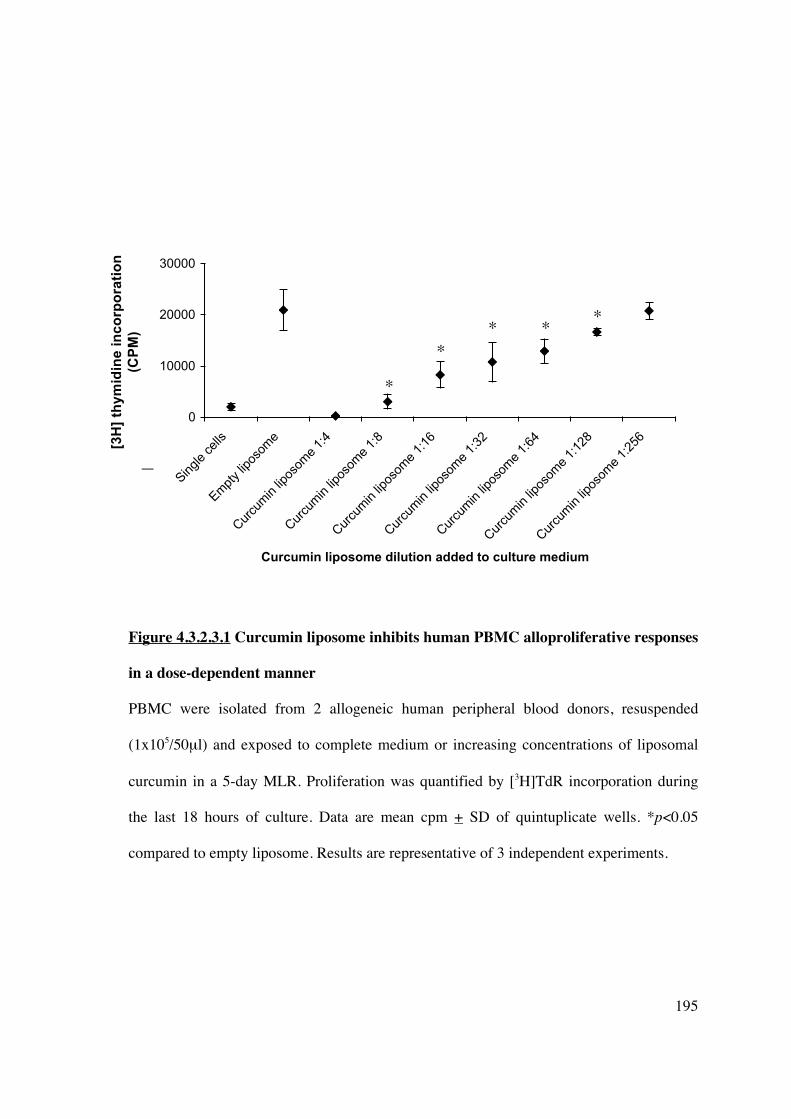
195
0
10000
20000
30000
Single cells
Em
pty liposo
me
Curc
um
in liposo
me 1
:4
Curc
um
in liposo
me 1
:8
Curc
um
in liposo
me 1
:16
Curc
um
in liposo
me 1
:32
Curc
um
in liposo
me 1
:64
Curc
um
in liposo
me 1
:128
Curc
um
in liposo
me 1
:256
Curcumin liposome dilution added to culture medium
[3H
] th
ym
idin
e i
nc
orp
ora
tio
n (
CP
M)
Figure 4.3.2.3.1 Curcumin liposome inhibits human PBMC alloproliferative responses
in a dose-dependent manner
PBMC were isolated from 2 allogeneic human peripheral blood donors, resuspended
(1x10⁵/50μl) and exposed to complete medium or increasing concentrations of liposomal
curcumin in a 5-day MLR. Proliferation was quantified by [3H]TdR incorporation during
the last 18 hours of culture. Data are mean cpm + SD of quintuplicate wells. *p<0.05
compared to empty liposome. Results are representative of 3 independent experiments.
[3H
] th
ym
idin
e i
nc
orp
ora
tio
n
(CP
M)
*
* *
* *

196
0
10000
20000
30000
Single
cells
Culture
medium
alone
40uM 20uM 10uM 5uM 2.5uM
Curcumin dilution
[3H
] th
ym
idin
e i
nc
op
ora
tio
n (
CP
M)
Figure 4.3.2.3.2 Curcumin added in vitro to CM inhibits human PBMC
alloproliferation
PBMC were isolated from 2 allogeneic human peripheral blood donors, resuspended (at
1x10⁵/50μl) and exposed to complete medium or increasing concentrations of neat
curcumin in a 5-day MLR. Proliferation was quantified by [3H]TdR incorporation during
the last 18 hours of culture. Data are mean cpm + SD of quintuplicate wells. *p<0.05
compared to empty liposome. Results are representative of 3 independent experiments.
[3H
] th
ym
idin
e in
co
rpo
rati
on
(C
PM
)
*
*
*
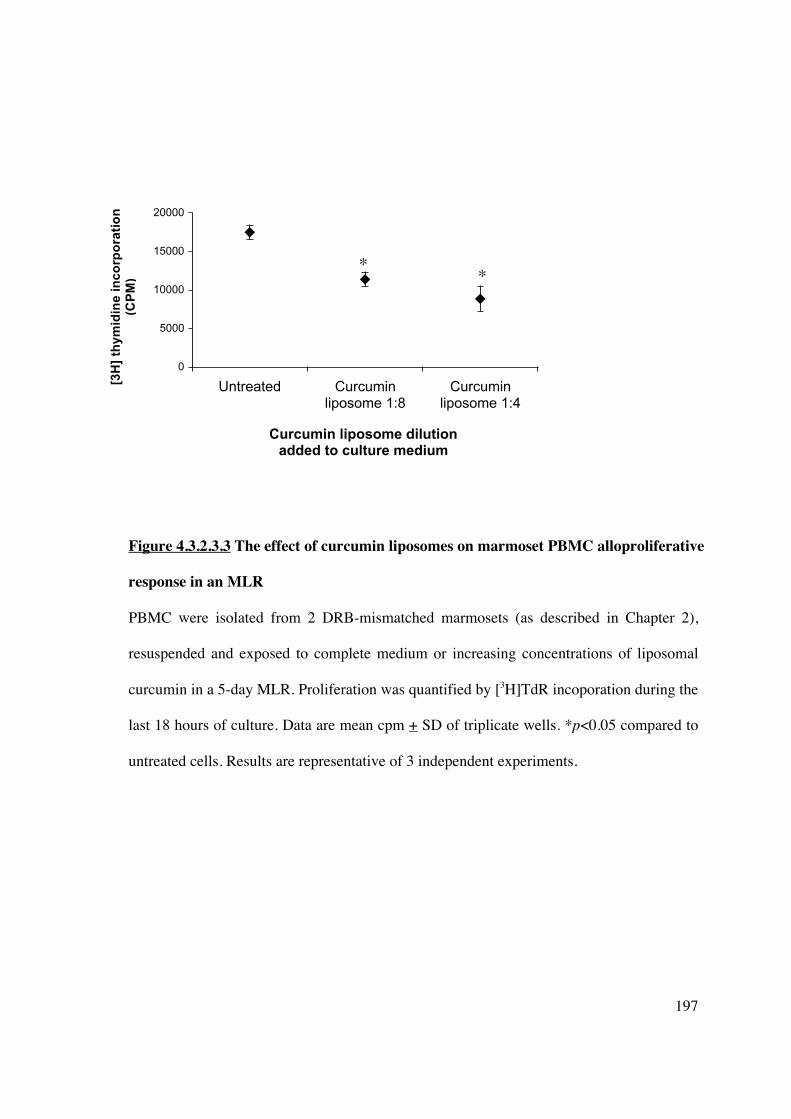
197
Figure 4.3.2.3.3 The effect of curcumin liposomes on marmoset PBMC alloproliferative
response in an MLR
PBMC were isolated from 2 DRB-mismatched marmosets (as described in Chapter 2),
resuspended and exposed to complete medium or increasing concentrations of liposomal
curcumin in a 5-day MLR. Proliferation was quantified by [3H]TdR incoporation during the
last 18 hours of culture. Data are mean cpm + SD of triplicate wells. *p<0.05 compared to
untreated cells. Results are representative of 3 independent experiments.
0
5000
10000
15000
20000
Untreated Curcumin
liposome 1:8
Curcumin
liposome 1:4
Curcumin liposome dilution added to culture medium
[3H
] th
ym
idin
e in
co
rpo
rati
on
(C
PM
)
[3H
] th
ym
idin
e i
nc
orp
ora
tio
n
(CP
M) *
*
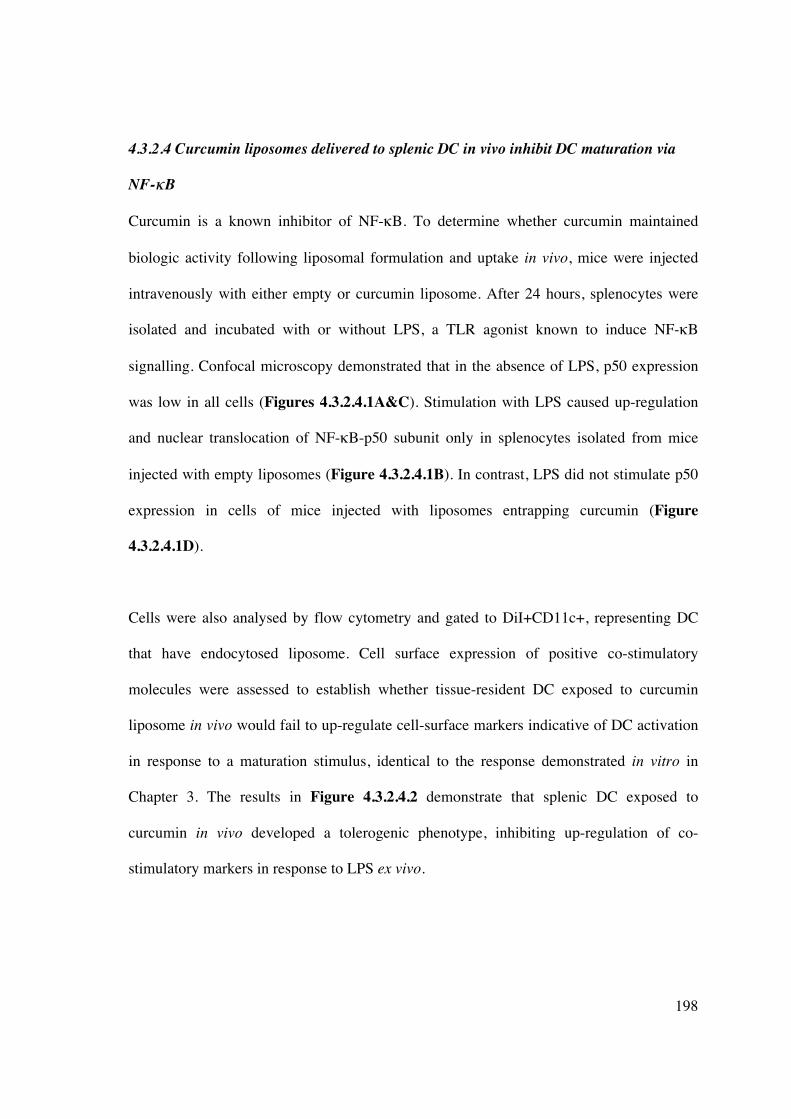
198
4.3.2.4 Curcumin liposomes delivered to splenic DC in vivo inhibit DC maturation via
NF-��B
Curcumin is a known inhibitor of NF-�B. To determine whether curcumin maintained
biologic activity following liposomal formulation and uptake in vivo, mice were injected
intravenously with either empty or curcumin liposome. After 24 hours, splenocytes were
isolated and incubated with or without LPS, a TLR agonist known to induce NF-�B
signalling. Confocal microscopy demonstrated that in the absence of LPS, p50 expression
was low in all cells (Figures 4.3.2.4.1A&C). Stimulation with LPS caused up-regulation
and nuclear translocation of NF-�B-p50 subunit only in splenocytes isolated from mice
injected with empty liposomes (Figure 4.3.2.4.1B). In contrast, LPS did not stimulate p50
expression in cells of mice injected with liposomes entrapping curcumin (Figure
4.3.2.4.1D).
Cells were also analysed by flow cytometry and gated to DiI+CD11c+, representing DC
that have endocytosed liposome. Cell surface expression of positive co-stimulatory
molecules were assessed to establish whether tissue-resident DC exposed to curcumin
liposome in vivo would fail to up-regulate cell-surface markers indicative of DC activation
in response to a maturation stimulus, identical to the response demonstrated in vitro in
Chapter 3. The results in Figure 4.3.2.4.2 demonstrate that splenic DC exposed to
curcumin in vivo developed a tolerogenic phenotype, inhibiting up-regulation of co-
stimulatory markers in response to LPS ex vivo.
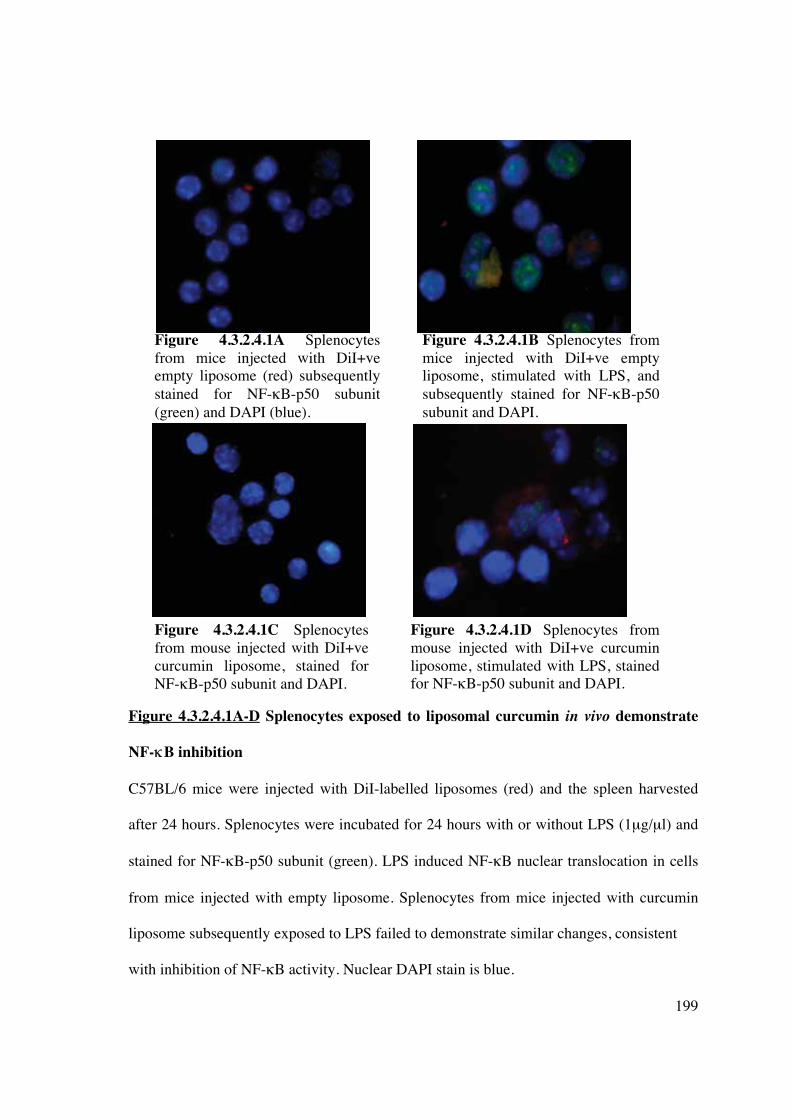
199
Figure 4.3.2.4.1A-D Splenocytes exposed to liposomal curcumin in vivo demonstrate
NF-��B inhibition
C57BL/6 mice were injected with DiI-labelled liposomes (red) and the spleen harvested
after 24 hours. Splenocytes were incubated for 24 hours with or without LPS (1μg/μl) and
stained for NF-�B-p50 subunit (green). LPS induced NF-�B nuclear translocation in cells
from mice injected with empty liposome. Splenocytes from mice injected with curcumin
liposome subsequently exposed to LPS failed to demonstrate similar changes, consistent
with inhibition of NF-�B activity. Nuclear DAPI stain is blue.
Figure 4.3.2.4.1A Splenocytes from mice injected with DiI+ve empty liposome (red) subsequently stained for NF-�B-p50 subunit (green) and DAPI (blue).
Figure 4.3.2.4.1B Splenocytes from mice injected with DiI+ve empty liposome, stimulated with LPS, and subsequently stained for NF-�B-p50 subunit and DAPI.
Figure 4.3.2.4.1C Splenocytes from mouse injected with DiI+ve curcumin liposome, stained for NF-�B-p50 subunit and DAPI.
Figure 4.3.2.4.1D Splenocytes from mouse injected with DiI+ve curcumin liposome, stimulated with LPS, stained for NF-�B-p50 subunit and DAPI.
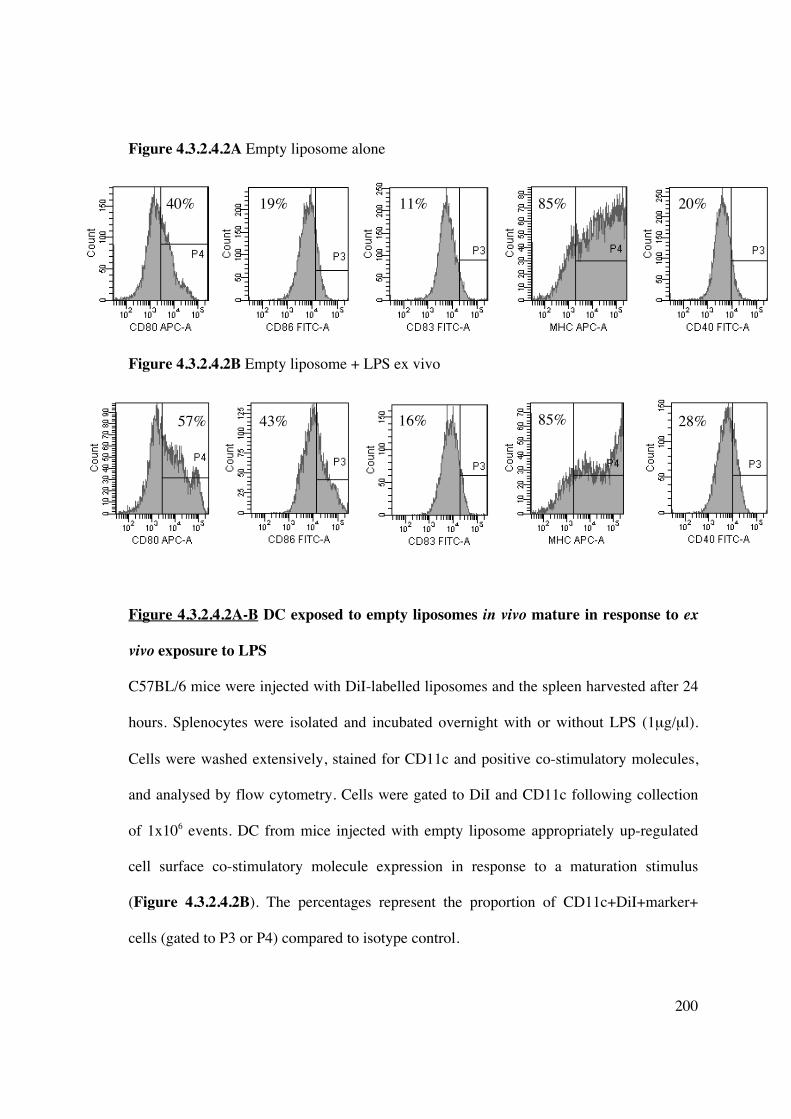
200
Figure 4.3.2.4.2A Empty liposome alone
Figure 4.3.2.4.2B Empty liposome + LPS ex vivo
Figure 4.3.2.4.2A-B DC exposed to empty liposomes in vivo mature in response to ex
vivo exposure to LPS
C57BL/6 mice were injected with DiI-labelled liposomes and the spleen harvested after 24
hours. Splenocytes were isolated and incubated overnight with or without LPS (1μg/μl).
Cells were washed extensively, stained for CD11c and positive co-stimulatory molecules,
and analysed by flow cytometry. Cells were gated to DiI and CD11c following collection
of 1x10⁶ events. DC from mice injected with empty liposome appropriately up-regulated
cell surface co-stimulatory molecule expression in response to a maturation stimulus
(Figure 4.3.2.4.2B). The percentages represent the proportion of CD11c+DiI+marker+
cells (gated to P3 or P4) compared to isotype control.
40% 19% 11% 85% 20%
57% 43% 16% 85% 28%

201
Figure 4.3.2.4.2C Curcumin liposome alone
Figure 4.3.2.4.2D Curcumin liposome + LPS ex vivo
Figure 4.3.2.4.2C-D DC exposed to liposomal curcumin in vivo demonstrate inhibition
of maturation
Cell surface expression of CD83, MHC class II and CD40, prior to treatment with LPS,
was slightly lower in CD11c+ splenic DC from mice injected with curcumin liposome
(Figure 4.3.2.4.2C) compared to cells from control mice (injected with empty liposome).
However, these DC failed to up-regulate co-stimulatory molecule expression to the same
degree (Figure 4.3.24.4.2D). Results demonstrated in Figures 4.3.2.4.2A-D are
representative of 3 independent experiments.
6%
33% 3% 77%
12%
16%
45% 28%
5%
78%

202
4.3.2.5 Splenocytes exposed to curcumin liposome in vivo demonstrate reduced
allostimulatory and alloproliferative capacity, and generate FoxP3+ Tregs in an ex vivo
MLR
Empty or curcumin liposome was injected into mice and the spleen was harvested after 24
hours. MNC were isolated, washed extensively, irradiated and co-cultured with MNC from
a MHC mismatched mouse in a 3-day MLR. MNC from mice receiving curcumin liposome
demonstrated significantly less allostimulatory capacity (Figure 4.3.2.5.1A) or less
alloproliferative capacity (Figure 4.3.2.5.1B), compared to controls. Cells from C3H or
BALB/c mice were used as responders as there was a consistently poor proliferative
response from cells isolated from C57BL/6 mice, despite MHC mismatching.
Analysis of the responding T-cell population from the primary MLR in which MNC from
injected mice were stimulators, demonstrated an increase in CD4+CD25+FoxP3+ Tregs
(Figure 4.3.2.5.2). This response was similar to the T-cell proliferative response
demonstrated in vitro in Chapter 3 using curcumin to induce tolerogenic hu-Mo-DC.

203
0
1000
2000
3000
4000
5000
C3H alone C3H : B6
empty
liposome
C3H : B6
curcumin
liposome
[3H
] th
ym
idin
e in
co
rpo
rati
on
(C
PM
)
Figure 4.3.2.5.1A Splenic MNC isolated from mice injected with curcumin liposome
demonstrate reduced allostimulatory capacity in a MLR
MNC were isolated from the spleen of mice injected with curcumin liposome or vehicle
control. After washing 3 times with PBS, MNC (1x10⁵/well) were irradiated and co-
cultured with MHC-mismatched MNC (1x10⁵/well) for 3 days. Responder cells alone
(2x10⁵ cells/well) were cultured in CM. Proliferation was quantified by [3H]TdR
incorporation during the last 18 hours of culture. Data are mean cpm + SD of quintuplicate
wells (*p<0.01 curcumin liposome versus empty liposome stimulator cells). Results are
representative of 3 independent experiments.
*
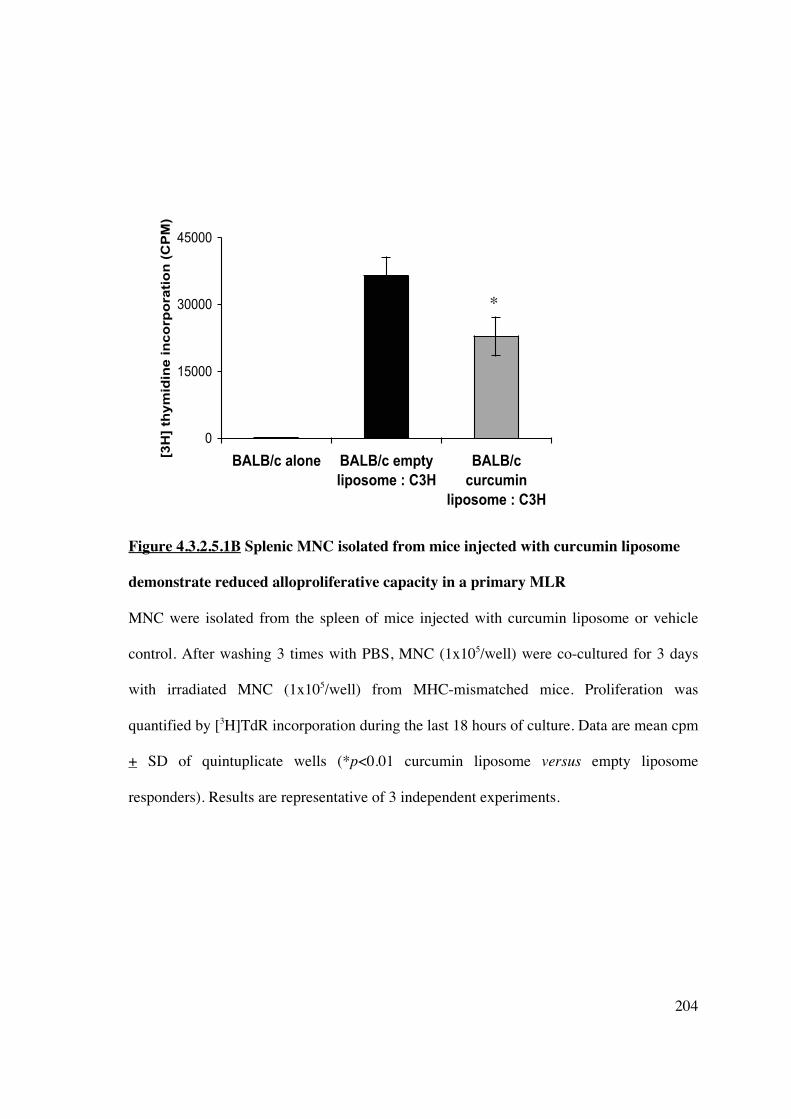
204
0
15000
30000
45000
BALB/c alone BALB/c empty
liposome : C3H
BALB/c
curcumin
liposome : C3H
[3H
] th
ym
idin
e in
co
rpo
rati
on
(C
PM
)
Figure 4.3.2.5.1B Splenic MNC isolated from mice injected with curcumin liposome
demonstrate reduced alloproliferative capacity in a primary MLR
MNC were isolated from the spleen of mice injected with curcumin liposome or vehicle
control. After washing 3 times with PBS, MNC (1x10⁵/well) were co-cultured for 3 days
with irradiated MNC (1x10⁵/well) from MHC-mismatched mice. Proliferation was
quantified by [3H]TdR incorporation during the last 18 hours of culture. Data are mean cpm
+ SD of quintuplicate wells (*p<0.01 curcumin liposome versus empty liposome
responders). Results are representative of 3 independent experiments.
*

205
Figure 4.3.2.5.2 Reduced allostimulatory capacity of MNC from curcumin liposome-
treated mice is associated with expansion of CD4+CD25+FoxP3+ Tregs
After 3-day co-culture, MNC from the primary MLR in Figure 4.3.2.5.1A were stained for
CD4 FITC, CD25 APC and FoxP3 PE, and analysed using flow cytometry. MNC co-
cultured with cells from mice receiving liposomal curcumin demonstrated expansion of
FoxP3+ Tregs compared to controls. Results are representative of 3 independent
experiments.
1.7%
1.1%
5.4%
4.5%
MNC from mice injected with empty liposome
MNC from mice injected with curcumin liposome

206
4.3.2.6 The addition of PMV to curcumin liposomes does not induce antigen-specific
hyporesponsiveness
Isolation and ex vivo modification of DC for cellular immunotherapy in transplantation
may be impractical under some circumstances. As shown in this chapter, manipulation of
DC in vivo can be achieved by using liposomes loaded with immunomodulatory agents.
Further liposomal modification may be achieved by the addition of plasma membrane
vesicles (PMV). PMV prepared from cell lines, or freshly isolated cells, retain the antigenic
signature (MHC) from which they are derived (448). Thus, liposomes used for cell-targeted
delivery of encapsulated immunomodulators could be used to transfer an antigen-specific
immunosuppressive signal by concurrent engraftment of PMV, creating a novel cell-based
vaccine.
PMV were synthesised from human PBMC (1x10⁸/ml) and stored in PBS at -80°C. T-cells
(NWT, syngeneic to the PMV) were simultaneously isolated and stored for future use.
Liposomes were synthesised with/without curcumin and/or PMV. Allogeneic hu-Mo-DC
were generated and on day 5 incubated overnight with different liposomes [(i) empty
liposome, (ii) empty liposome + PMV, (iii) curcumin liposome, (iv) curcumin liposome +
PMV], in the presence of a maturation stimulus (LPS, 1μg/μl). Cells were washed,
irradiated, and added to a one-way MLR with T-cells syngeneic or allogenenic to the PMV
(and the latter allogeneic to the stimulator DC). Proliferative response was measured after 5
days. Despite the presence of PMV, liposomal curcumin failed to induce antigen-specific
hyporesponsiveness (Figure 4.3.6). These data were similar to the lack of antigen-specific
hyporesponsiveness demonstrated following infusion of curcumin-treated DC.

207
0
10000
20000
30000
Liposome
alone
Liposome +
PMV
Curcumin
liposome
alone
Curcumin
liposome +
PMV
[3H
] th
ym
idin
e in
co
rpo
rati
on
(C
PM
)
Syngeneic T cells
3rd party T cells
Figure 4.3.2.6 Curcumin liposomes containing PMV do not induce antigen-specific
hyporesponsiveness in hu-Mo-DC
PMV were synthesised from PBMC isolated from human blood donors (as described in
Chapter 2). Liposomes, with or without curcumin and/or PMV, were synthesised and
identical volumes were added to allogeneic DC, in conjunction with a maturation stimulus
(LPS, 1μg/μl). DC were washed extensively, irradiated and co-cultured with T-cells
syngeneic or allogeneic to the PMV source, and allogeneic to DC. The stimulator :
responder ratio was 1:10. Proliferation was quantified by [3H]TdR incorporation during the
last 18 hours of culture. Data are mean cpm + SD of quintuplicate wells (*p<0.01
compared to liposome + PMV + syngeneic T cells; **p<0.01 compared to both liposome
alone + 3rd party T-cells and liposome + PMV + 3rd party T-cells, ANOVA). Results are
representative of 3 independent experiments.
*
* ** *
*

208
4.5 DISCUSSION
Gene therapy and cellular-based immunotherapy has been a promising approach for the
treatment of genetic disease, cancer therapy and induction of transplant tolerance. Viral
vectors (such as adenovirus and lentivirus) have been unable to gain widespread acceptance
for clinical application because of toxicity and immunogenicity. DC-based cellular therapy
has demonstrated success in preclinical (rodent and NHP) studies but has limited
translational ability. Liposomes are a safe alternative and are amenable to modification to
facilitate cell-targeted delivery, reduce non-specific endocytosis and prolong circulation
time, and provide varying immunomodulatory signals (314, 319, 320, 323, 449).
This chapter demonstrates liposomal incorporation of 2 different immunomodulatory
agents: IL-10 and curcumin, with maintenance of biologic activity in vitro and in vivo,
particularly with regard to altering DC allostimulatory capacity. Interleukin-10 did not
substantially incorporate into a liposome (Figure 4.3.2.1), despite sonication, suggesting
the main site of inclusion is within the central aqueous core. This would be the main factor
limiting its use as a significant amount of IL-10 required during preparation in order to
produce a clinically relevant concentration within the liposome. Both the lipophilic nature
and size of the cytokine would affect the degree of liposomal incorporation. Additional
immunomodulating cytokines that may be employed potentially include IDO, CTLA-4
(CD152), Fas ligand (CD95) and TNF-related apoptosis-inducing ligand (TRAIL).
NF-�B blockade and subsequent DC maturation-arrest has been demonstrated through the
use of gene transfer or decoy oligonucleotides (ODN). In contrast to IL-10, curcumin is
highly lipid soluble (with a high octanol:water co-efficient) and thus efficiently
209
incorporates into the phospholipid bilayer. Liposomal curcumin is biologically active in
vivo, as evidenced by NF-�B blockade in mouse splenocytes (Figure 4.3.2.4.1) and
inhibition of splenic CD11c+ DC maturation in response to LPS stimulation (Figure
4.3.2.4.2). Inhibition of PBMC proliferation by curcumin is not species-limited, with a
decrease in both human and marmoset PBMC alloproliferation (Figures 4.3.2.3.1 and
4.3.2.3.3 respectively).
Liposomal curcumin injected in vivo in to mice distribute systemically, predominantly to
the spleen, although uptake has also been documented throughout the reticuloendothelial
system, including the liver (Rogers et al., unpublished data) and the kidney (see Chapter 5,
Figure 5.4.1). All cell types, including CD11c-CD11b+F480+ macrophages, multiple
subsets of CD11c+ DC, and CD3+ T-cells endocytose liposomes. T-cells from mice
injected with curcumin liposomes display a reduction in alloproliferative capacity
compared to controls (Figure 4.3.2.5.1), in keeping with previous in vitro studies
demonstrating modulation of T-cell proliferation and activation (378, 398, 450).
DiI+CD11c+ DC from mice injected with curcumin liposomes showed down-regulation of
positive co-stimulatory molecules consistent with a degree of maturation-arrest (Figure
4.3.2.4.2), and expanded FoxP3+ Tregs as a mechanism for decrease alloproliferation.
These data were in agreement with the results from Chapter 3, where the use of curcumin
in vitro generated tolerogenic hu-Mo-DC that expanded CD4+CD25hiCD127loFoxP3+
Tregs in a subsequent MLR.
Curcumin is rapidly degraded in vitro, although the rate of decomposition is slower in
complete medium used for cell culture, with 50% decomposition after 8 hours (451). In
210
vivo <1% of oral curcumin enters the systemic circulation. Curcumin does not easily
penetrate the digestive tract and is subject to intestinal-based metabolism in both rodents
and humans involving CYP2C9 and phenol sulfotransferase enzymes (452, 453), with
further hepatic metabolism following absorption. Although phase I trials indicate that
humans can tolerate up to 12g/day without side effects (454), high doses may contribute to
adverse symptoms, such as rash and diarrhoea, likely produced by the glucuronide and
sulfate metabolites of curcumin. Liposomal incorporation of curcumin (or indeed any
immunomodulatory agent) can overcome 2 key problems in drug therapy: (1) systemic
biodistribution and (2) cellular targeting. Liposomes are biologically inert, non-
immunogenic and possess negligible intrinsic toxicity. They protect encapsulated
molecules from degradation and passively target tissues with a discontinuous endothelium
(eg liver, spleen, bone marrow). Within the systemic circulation, liposomes are opsonised
and rapidly removed by mononuclear phagocytes (455). Opsonization may be mediated by
immunoglobulins (456), fibronectin (457), C-reactive protein (458), and the complement
cascade membrane attack complex can directly induce liposomal lysis (459).
Manipulation of the physicochemical properties of liposomes improves longevity and
stability in vivo. Alteration in lipid membrane composition (308, 460, 461) (incorporation
of cholesterol, lipid ganglioside GM1, or lipids containing a polyethylene glycol head
group), reducing liposome size (462), and the use of neutral liposomes (463) (versus
charged liposomes which rapidly activate complement) or ligand-targeted liposomes
(“immunoliposomes”, discussed in Chapter 6) that selectively bind a cellular target, can
overcome some disadvantages associated with conventional liposomes.

211
CHAPTER 5: LIPOSOMAL CURCUMIN
AMELIORATES RENAL ISCHEMIA-REPERFUSION
INJURY VIA NF-��B INHIBITION AND REDUCED
OXIDATIVE STRESS.
5.1 INTRODUCTION
Renal ischemia-reperfusion injury (IRI) is a significant cause of acute and end-stage kidney
disease (ESKD), producing serious morbidity and mortality and prolonged hospitalisation
(464). IRI also occurs during the obligatory interruption of blood flow and hemodynamic
changes during the peri-operative kidney transplant period. It remains an important initiator
of acute renal transplant rejection (465) and delayed allograft function (466, 467), and a
factor in long-term graft survival (468). IRI also contributes to kidney dysfunction in a
variety of clinical settings, from cardiovascular surgery to septicemia. Acute ischemia leads
to depletion of adenosine triphosphate, inducing tubular epithelial cell (TEC) injury and
hypoxic cell death. Restoration of blood flow causes a paradoxical increase in injury by
promoting leukocyte activation and infiltration, cytokine production, and reactive oxygen
species (ROS) generation.
Multiple stimuli, including hypoxia and ROS, activate the NF-�B pathway in IRI (469,
470), which plays a central role in the regulation of numerous, damaging downstream
pathways. These targets include complement, pro-inflammatory cytokines [interluekin
(IL)-1, IL-6, tumor necrosis factor (TNF)-�] and their receptors, inflammatory mediators

212
(inducible nitric oxide synthase, iNOS) and leukocyte adhesion molecules [intercellular
adhesion molecule (ICAM) -1, vascular cell adhesion molecule (VCAM) -1]. TEC are
primarily affected, producing parenchymal injury (possibly mediated by TLR2 (471)),
although resident renal dendritic cells are the predominant source of local cytokine
synthesis (128). New therapeutic strategies that target NF-�B in both TEC and antigen-
presenting cells (APC), inhibiting the inflammatory and innate immune cascades
responsible for amplification of injury, are potentially a basis for effective treatment or
prevention of IRI.
Curcumin [diferuloylmethane, 1,7-bis-(-4-hydroxy-3-methoxiphenyl)-1,6-heptadiene-3,5-
dione)] is a polyphenol compound derived from the plant Curcuma longa. Curcumin
exhibits anti-inflammatory (472), anti-oxidant (376, 377) and immunomodulatory (473)
effects, and thus demonstrates excellent therapeutic potential. Curcumin is water-insoluble
(447) with an octanol:water partition coefficient (logPow) 3.29, limiting its utility as an
orally administered agent. Previous studies assessing the effect of curcumin on animal
models of IRI have employed oral administration with only minor functional salvage (474),
or direct infusion into the vascular tree (475), which has limited clinical applicability. The
lipid solubility of curcumin lends itself to liposomal incorporation, facilitating drug
delivery in vivo.
The aims of this chapter are:
1] to explore the potential for liposomal curcumin to be delivered to renal parenchyma
2] to establish that liposomal curcumin is protective in a model of renal IRI, and
3] to determine the mechanisms underlying putative cytoprotection.

213
5.2 METHODS
5.2.1 Tissue culture and general laboratory techniques
Protocols for the production of liposomes (with or without curcumin), reagents, cell
isolation following whole-organ digestion, flow cytometry, RNA extraction, cDNA
synthesis and RT-PCR, western blot and immunofluorescent staining, and confocal
microscopy are described in Chapter 2.
5.2.2 Mice
Experiments were performed on 7-8 week old male C57BL/6 mice with ethics approval
from both the Institute of Medical and Veterinary Scienceis (IMVS, Adelaide, Australia)
and University of Adelaide (project numbers 41/09 and 108/09). The mice were housed in
pathogen-free conditions at the Animal Care Facility at the IMVS.
5.2.2.1 Generation of bilateral ischaemia-reperfusion injury
A standardised model of bilateral, severe renal ischaemia was used, as described in Chapter
2. Figures 5.2.1.1A&B demonstrate the induction of successful ischaemia following
placement of an atraumatic microvascular clamp occluding the renal pedicle. Thirty (30)
minutes of ischaemia was chosen to induce severe histologic damage at 24 hours. Two (2)
reperfusion time-points were chosen: amelioration of injury following 24 hours of
reperfusion represents the most significant juncture for salvage of renal function; addition
of the earlier time-point (4 hours reperfusion) may demonstrate improvement in the
absence of change at 24 hours.

214
Figure 5.2.1.1 Generation of bilateral murine renal ischaemia-reperfusion injury.
Figure 5.2.1.1A Sham operated control demonstrating a well-perfused left kidney.
Figure 5.2.1.1B Ischaemic left kidney (demonstrating a purple discolouration) following
placement of an atraumatic microvascular clamp (white arrow) that occludes the renal
pedicle.
A B

215
5.3 RESULTS
5.3.1 Liposomes are endocytosed by renal tubular epithelial cells and antigen presenting
cells
To assess the cellular distribution of fluorescently labelled liposomes arriving in the kidney
24 hours after injection, kidney sections were examined by immunofluorescence, or cell
suspensions of digested kidney were analysed by flow cytometry. DiI was chosen as the
fluorescent label because of strong fluorescence, high lipophilic stability and lack of
transfer between cell membranes once incorporated. Liposomal endocytosis by renal
tubular epithelial cells (TEC) was confirmed by immunofluorescence microscopy (Figure
5.3.1A). Liposomes were also endocytosed by antigen presenting cells (APC), including
CD11c-CD11b+F480+ macrophages and subsets of CD11c+ myeloid and plasmacytoid
DC (Figure 5.3.1C).

216
Figure 5.3.1 DiI-labelled liposomal curcumin are endocytosed by renal tubular cells
Figure 5.3.1 A&B Twenty-four hours after injection, kidneys of C57BL/6 mice injected
intravenously with (A) PBS or (B) DiI-labelled (red fluorescent) liposomes were removed
and snap frozen in OCT. Sections of frozen kidney were stained with DAPI as shown
(original magnification x200). Liposomes located to renal tubular cells (Figure 5.3.1B;
G=glomerulus, T=tubule).
G
T
T T
T G
G
G
A B

217
A B
Gated to CD11c negative fraction
F480
PE
-Cy5
F480
PE
-Cy5
F480
PE
-Cy5
F480
PE
-Cy5
CD
8� A
PC
CD
8� A
PC
CD11b FITC CD11b FITC
CD11c PE-Cy7 CD11c PE-Cy7
CD11c FITC
DiI liposome CTRL

218
Figure 5.3.1C DiI-labelled liposomes are endocytosed by macrophages and DC
Twenty-four hours after injection, kidneys of C57BL/6 mice injected intravenously with
(A) PBS or (B) DiI-labelled (red fluorescence) liposomes were removed and digested.
Isolated APC were stained with anti-CD11b FITC, anti-CD11c FITC or PE-CY7, anti-
F480 PE-CY5, anti-CD8a APC, anti-B220 PE-CY5, anti-PDCA FITC, or anti-MHC APC
and analysed by flow cytometry. Red fluorescent cells were gated as shown (P2) and
appear black in each plot. Results are representative of 3 independent experiments.
A B
B22
0 PE
-Cy5
B22
0 PE
-Cy5
PDC
A-1
FIT
C
PDC
A-1
FIT
C
MH
C A
PC
MH
C A
PC
CD11c FITC
CD11c PE-Cy7 CD11c PE-Cy7
CD11c FITC
DiI liposome CTRL
219
5.3.2 Curcumin liposomes suppress NF-��B activity in APC
To determine whether NF-�B activity was suppressed after liposome uptake in vivo, mice
were injected intravenously with either empty liposome or liposome entrapping curcumin.
After 24 hours, APC isolated from kidneys were incubated with lipopolysaccharide (LPS),
a toll-like receptor (TLR) agonist that induces NF-�B signalling (476), and stained for NF-
�B-p50 subunit. Confocal microscopy demonstrated negligible staining in unstimulated
cells from vehicle (empty liposome)- or curcumin liposome-injected mice (Figures
5.3.2A&C respectively). However, there was both up-regulation and nuclear translocation
of NF-�B-p50 in APC isolated from control mice treated with LPS (Figure 5.3.2B), not
seen in APC from mice injected with curcumin liposomes (Figure 5.3.2D).

220
Generation of IRI
Figure 5.3.2 NF-��B activity is suppressed in the kidney of mice administered
liposomes encapsulating NF-�B inhibitors
Liposomes as indicated were injected intravenously and renal APC were prepared 24 hours
later. After incubation for 3 hours with or without LPS, APC were fixed and analysed by
confocal microscopy at 40x resolution. Cell nuclei are blue, DiI-labelled liposomes are red
and NF-�B-p50 is green. APC from mice pre-treated with liposomal curcumin failed to
upregulate NF-�Bp50 in response to a maturation stimulus. Results are representative of 4
independent experiments.
B DiI liposome + LPS
C DiI curcumin liposome D DiI curcumin liposome + LPS
A DiI liposome

221
5.3.3 Liposomal curcumin reduces renal dysfunction following IRI
To study the effect of curcumin liposomes on renal function after IRI, serum urea and
creatinine were measured at both 4 and 24 hours after reperfusion. Mice pre-treated with
vehicle control (empty liposome) showed significant renal dysfunction at both timepoints.
Mice receiving curcumin liposomes were significantly protected against acute renal failure
as reflected by significantly lower serum urea and creatinine levels (Figures 5.3.3A-B).

222
0
20
40
60
80
Sham IRI, 4h
reperfusion
IRI, 24h
reperfusion
Seru
m u
rea (
mm
ol/L
) Empty liposome
Curcumin liposome
Figure 5.3.3 Effect of liposomal curcumin on renal function after renal IRI
*
*
A

223
0
50
100
150
200
250
Sham IRI, 4h
reperfusion
IRI, 24h
reperfusion
Se
rum
cre
ati
nin
e (
um
ol/
L)
Empty liposome
Curcumin liposome
Figure 5.3.3 Effect of liposomal curcumin on renal function after renal IRI
Renal function of mice pre-treated with liposomal curcumin (grey bars) was improved
compared to mice receiving vehicle control (black bars) 4 and 24 hours after renal IRI (but
not sham operation) as reflected by reduced (A) serum urea (page 220) and (B) creatinine.
Data are mean + SEM of 10 mice per group. *P<0.05.
*
*
B

224
5.3.4 Liposomal curcumin reduces renal tubular injury following renal IRI
To determine the impact of liposomal curcumin on tubular injury, renal histology was
evaluated. At both 4 and 24 hours following reperfusion, ischaemic kidneys from control
mice showed widespread tubular vacuolisation, cast formation, and tubular infarction
(Figures 5.3.4A-C). Kidneys from curcumin treated mice displayed significant reductions
in less tubular damage when directly compared to kidneys of control mice.

225
0
1
2
3
4
5
Sham IRI, 4h
reperfusion
IRI, 24h
reperfusion
Tu
bu
lar
vacu
olisati
on
Empty liposome
Curcumin liposome
0
1
2
3
4
5
Sham IRI, 4h
reperfusion
IRI, 24h
reperfusion
Cast
form
ati
on
Empty liposome
Curcumin liposome
Figure 5.3.4 Effect of liposomal curcumin on renal histology following renal IRI
* *
*
*
B
A
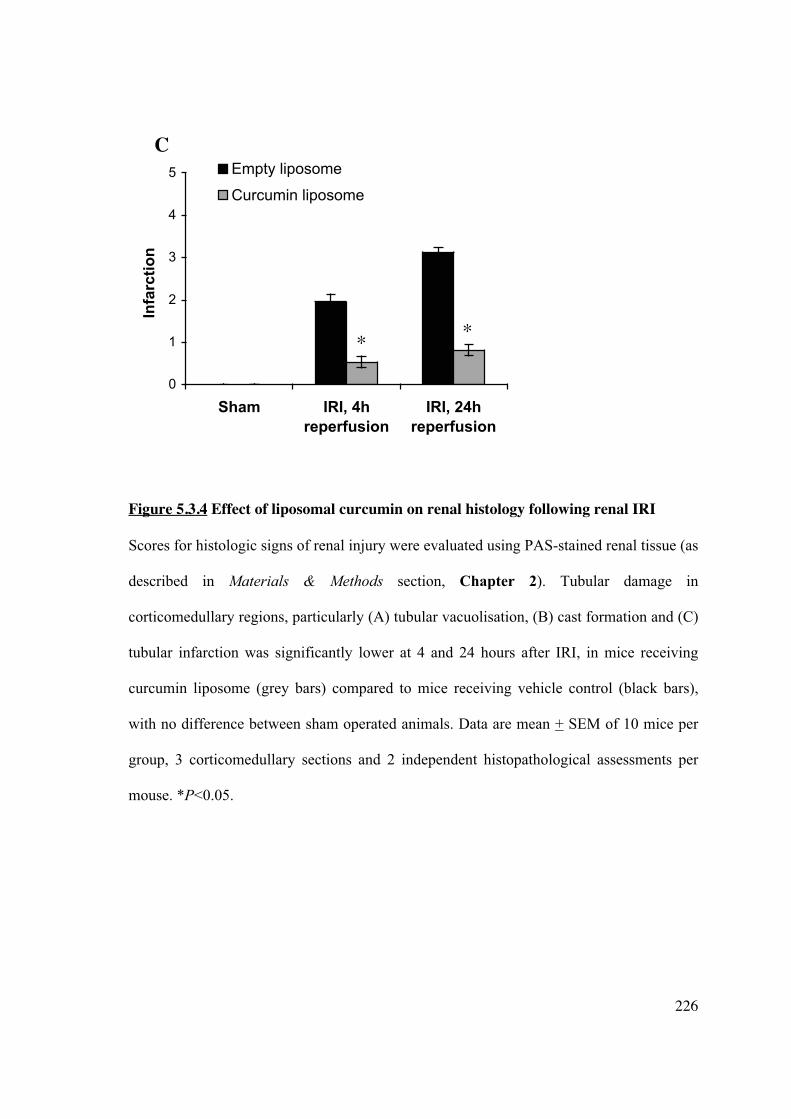
226
0
1
2
3
4
5
Sham IRI, 4h
reperfusion
IRI, 24h
reperfusion
Infa
rcti
on
Empty liposome
Curcumin liposome
Figure 5.3.4 Effect of liposomal curcumin on renal histology following renal IRI
Scores for histologic signs of renal injury were evaluated using PAS-stained renal tissue (as
described in Materials & Methods section, Chapter 2). Tubular damage in
corticomedullary regions, particularly (A) tubular vacuolisation, (B) cast formation and (C)
tubular infarction was significantly lower at 4 and 24 hours after IRI, in mice receiving
curcumin liposome (grey bars) compared to mice receiving vehicle control (black bars),
with no difference between sham operated animals. Data are mean + SEM of 10 mice per
group, 3 corticomedullary sections and 2 independent histopathological assessments per
mouse. *P<0.05.
* *
C

227
Empty liposome (vehicle control)
Sham 4h reperfusion 24h reperfusion
Curcumin liposome
Sham 4h reperfusion 24h reperfusion
Figure 5.3.4 Effect of liposomal curcumin on renal histology following renal IRI
Figure 5.3.4D shows representative histological sections of corticomedullary tissue
(original magnification x200).

228
5.3.5 Liposomal curcumin reduces renal tubular apoptosis following renal IRI
IRI in the kidney is also characterised by TEC apoptosis. Curcumin has recognised
cytoprotective characteristics, but under some circumstances may induce apoptosis and
micronucleation (477, 478). To confirm that liposomal curcumin did not induce TEC
apoptosis, terminal transferase dUTP nick-end-labelling (TUNEL) staining assessed
cellular apoptosis. Compared with sham-operated animals, mice subjected to bilateral IRI
demonstrated significant TEC apoptosis within 4 hours, and this was not increased at 24
hours reperfusion, presumably due to extensive cellular necrosis (Figure 5.3.5B). Notably,
the number of apoptotic TEC in kidneys from mice receiving liposomal curcumin was
markedly lower at both reperfusion time points.

229
Empty liposome (vehicle control)
Sham 4h reperfusion 24h reperfusion
Curcumin liposome
Sham 4h reperfusion 24h reperfusion
Figure 5.3.5 Liposomal curcumin reduces TEC apoptosis following IRI
Figure 5.3.5A Representative fluorescent photomicrographs of kidney sections illustrating
apoptotic nuclei (TUNEL fluorescent stain), representative of six sections per group
(original magnification x200).

230
0
40
80
120
160
Sham IRI, 4h
reperfusion
IRI, 24h
reperfusion
TU
NE
L p
osit
ive n
ucle
i p
er
hp
f
Empty liposome
Curcumin liposome
Figure 5.3.5 Liposomal curcumin reduces TEC apoptosis following IRI
Figure 5.3.5B Apoptotic tubular cells in kidneys from mice pre-treated with curcumin
liposome (grey bars) and vehicle control (black bars) after renal IRI or sham operation.
Data are mean + SEM of 6 mice per group. *P<0.05.
* *
231
5.3.6 Liposomal curcumin reduces expression of markers of renal injury and pro-
inflammatory cytokines following renal IRI
Production of pro-inflammatory mediators are linked with the severity of renal structural
and functional disturbance following IRI. The increased expression of TLR4 was abrogated
in mice receiving curcumin liposomes (Figure 5.3.6A), in keeping with previous studies
demonstrating that this pattern recognition receptor is upregulated in renal IRI (479).
HSP70, an endogenous factor for protecting intracellular protein integrity, was significantly
attenuated in mice treated with liposomal curcumin (Figure 5.3.6B) consistent with the
reduced tissue injury demonstrated in this group.
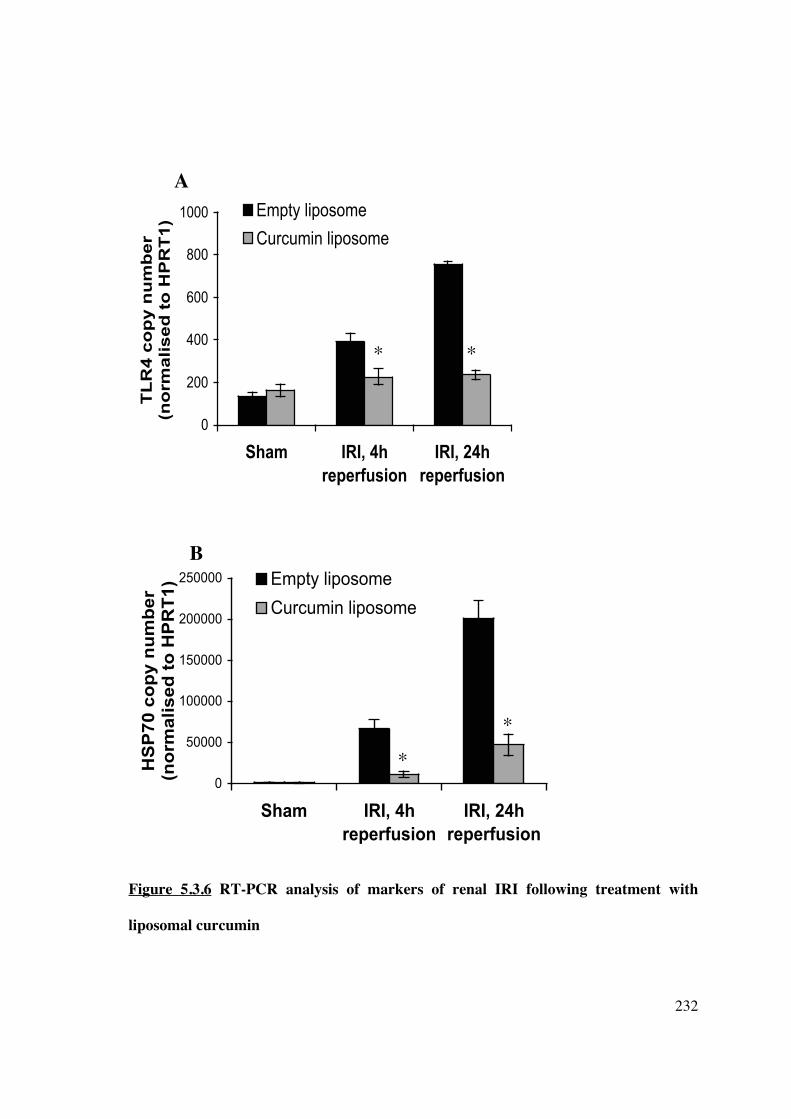
232
0
200
400
600
800
1000
Sham IRI, 4h
reperfusion
IRI, 24h
reperfusion
TL
R4
co
py
nu
mb
er
(no
rma
lis
ed
to
HP
RT
1)
Empty liposome
Curcumin liposome
0
50000
100000
150000
200000
250000
Sham IRI, 4h
reperfusion
IRI, 24h
reperfusion
HS
P7
0 c
op
y n
um
be
r (n
orm
ali
se
d t
o H
PR
T1
) Empty liposome
Curcumin liposome
Figure 5.3.6 RT-PCR analysis of markers of renal IRI following treatment with
liposomal curcumin
* *
*
*
B
A

233
0
200
400
600
Sham IRI, 4hreperfusion
IRI, 24hreperfusion
TN
Fa
lph
a c
op
y n
um
be
r (n
orm
ali
se
d t
o H
PR
T1
)
Empty liposome
Curcumin liposome
Figure 5.3.6 RT-PCR analysis of markers of renal IRI following treatment with
liposomal curcumin
Total RNA was isolated from mouse kidneys 4 and 24 hours after 30 minutes bilateral
renal IRI. Gene expression of (A) TLR4, (B) HSP70 and (C) TNF� are displayed as
absolute copy number normalised to the housekeeping gene HPRT1. In keeping with
biochemical salvage of renal function, pre-treatment of mice with liposomal curcumin
(grey bars) reduced expression of all genes at both reperfusion timepoints, when compared
to controls (black bars). Data are mean + SEM of 10 mice per group. *P<0.05.
* *
C

234
5.3.7 Liposomal curcumin reduces renal neutrophil infiltration and chemokine
expression following renal IRI
�Polymorphonuclear leukocytes in H&E sections showed reduced neutrophil infiltration in
mice pre-treated with curcumin liposomes at both 4 and 24 hours reperfusion (Figure
5.3.7A), in keeping with the known anti-inflammatory effect of curcumin (480, 481). The
effect of liposomal curcumin on chemokine mRNA expression in vivo after renal IRI was
investigated. RANTES (Figure 5.3.7B), monocyte chemoattractant protein-1 (MCP-1,
Figure 5.3.6C) and macrophage inflammatory protein-2 (MIP-2, Figure 5.3.6D) were all
reduced in curcumin-treated mice. These data are consistent with the described inhibition
of p38 MAPK, by curcumin (384), a central kinase required for the activation of NF-�B
and subsequently pro-inflammatory cytokines (482, 483).

235
0
20
40
60
Sham IRI, 4h
reperfusion
IRI, 24h
reperfusion
Ju
xta
me
du
lla
ry n
eu
tro
ph
il i
nfi
ltra
tio
n (
pe
r h
pf)
Empty liposome
Curcumin liposome
Figure 5.3.7 Liposomal curcumin reduces neutrophil infiltration following renal IRI
Figure 5.3.7A Leukocyte influx in kidneys from mice pre-treated with curcumin liposomes
(grey bars) or vehicle control (black bars) 4 and 24 hours after IRI or sham operation. The
number of neutrophils counted in 10 randomly selected high-power fields of
corticomedulla (hpf, original magnification x400), were significantly lower in mice
receiving curcumin liposomes.
*
*
A

236
0
200
400
600
800
1000
Sham IRI, 4h
reperfusion
IRI, 24h
reperfusion
RA
NT
ES
co
py
nu
mb
er
(no
rma
lis
ed
to
HP
RT
1)
Empty
liposome
Curcumin
liposome
0
2000
4000
6000
8000
Sham IRI, 4h
reperfusion
IRI, 24h
reperfusion
MC
P-1
co
py n
um
ber
(no
rmalised
to
HP
RT
1)
Empty
liposome
Curcumin
liposome
Figure 5.3.7 Liposomal curcumin reduces chemokine expression following renal IRI
* *
*
*
B
C

237
0
1500
3000
4500
6000
7500
Sham IRI, 4h
reperfusion
IRI, 24h
reperfusion
MIP
-2 c
op
y n
um
ber
(no
rmalised
to
HP
RT
1) Empty liposome
Curcumin liposome
Figure 5.3.7 Liposomal curcumin reduces chemokine expression following renal IRI
Figure 5.3.7B-D RT-PCR was used to quantify mRNA expression of (B) RANTES, (C)
MCP-1 and (D) MIP-2. High expression of all chemokine factors was observed in IRI
kidneys of mice treated with control vehicle (black bars), when compared to mice receiving
liposomal curcumin (grey bars) or sham-operated mice. Data are mean + SEM of 10 mice
per group. *P<0.05.
* *
D

238
5.3.8 Liposomal curcumin limits oxidative stress following renal IRI
IRI is associated with increased production of ROS, particularly superoxide (O2-), which is
a major mediator of cellular injury. To assess whether the renoprotective effect of curcumin
could be attributed to a reduction in the production of ROS, intracellular generation of O2-
was visualised with the fluoroprobe DHE. DHE, freely permeable to cells, is oxidised on
reaction with O2- to ethidium bromide (EtBr), which is trapped by intercalating with
nuclear DNA, and fluoresces red. Using confocal microscopy, tissue sections from mice
treated with liposome alone showed a widespread and marked increase in EtBr
fluorescence (Figure 5.3.8A). Mice pre-treated with curcumin liposome demonstrated
significantly reduced fluorescence at the same reperfusion timepoints. Concurrent
measurement of superoxide dismutase (SOD), the main enzyme responsible for
dismutation of O2- was significantly upregulated in curcumin-treated mice (Figure 5.3.8B).

239
Empty liposome (vehicle control)
Sham 4h reperfusion 24h reperfusion
Curcumin liposome
Sham 4h reperfusion 24h reperfusion
Figure 5.3.8 Liposomal curcumin reduces oxidative stress following renal IRI
Figure 5.3.8A Pre-treatment with curcumin liposomes prior to renal IRI reduced the
amount of intracellular superoxide when compared with vehicle control at 4 and 24 hours
reperfusion after IRI as shown by immunofluorescence. Photomicrographs are
representative of 6 sections per group (original magnification x200).

240
0
20000
40000
60000
80000
Sham IRI, 4h
reperfusion
IRI, 24h
reperfusion
SO
D c
op
y n
um
ber
(n
orm
alised
to
HP
RT
1)
Empty liposome
Curcumin liposome
Figure 5.3.8 Liposomal curcumin reduces oxidative stress following renal IRI
Figure 5.3.8B Renal tissue superoxide dismutase (SOD) gene expression was assessed by
RT-PCR. SOD mRNA was significantly increased by pre-treatment with curcumin
liposome at 4 and 24 hours after renal IRI (grey bars), compared to both sham operated
mice and mice pre-treated with vehicle control (black bars). Data are mean + SEM.
*P<0.05 curcumin liposome versus vehicle control, and curcumin liposome + IRI versus
curcumin liposome + sham.
*
*

241
5.3.9 Liposomal curcumin limits nitrosative stress following renal IRI
The combination of O2- with resident nitric oxide forms peroxynitrite (ONOO-), which is
capable of aggravating cellular damage by nitration of protein tyrosine residues.
Fluorescent staining for 3-nitrotyrosine demonstrated marked TEC protein nitration in mice
receiving vehicle alone, which was reduced in mice receiving liposomal curcumin (Figure
5.3.9A). Western blot analysis of kidney tissue indicated the presence of a nitrated protein
band at 47kDa (Figure 5.3.9B). These results confirm that protein nitration was
significant in the vehicle-treated mice at both 4 and 24 hours reperfusion. Oxidative stress
also induces iNOS, which aggravates tubular injury by supplying NO for peroxynitrite
formation. mRNA expression for iNOS was significantly up-regulated in mice pre-treated
with liposomal curcumin (Figure 5.3.9C), but only at 24 hours; expression at 4 hours did
not reach statistical significance (p=0.08).

242
Empty liposome (vehicle control)
Sham 4h reperfusion 24h reperfusion
Curcumin liposome
Sham 4h reperfusion 24h reperfusion
Figure 5.3.9 Liposomal curcumin reduces nitrosative stress following renal IRI
Figure 5.3.9A Pre-treatment with curcumin liposomes prior to renal IRI reduced the
amount of protein tyrosine nitration when compared with vehicle control at 4 and 24 hours
reperfusion after IRI, as shown by immunofluorescence. Photomicrographs are
representative of 6 sections per group (original magnification x200).
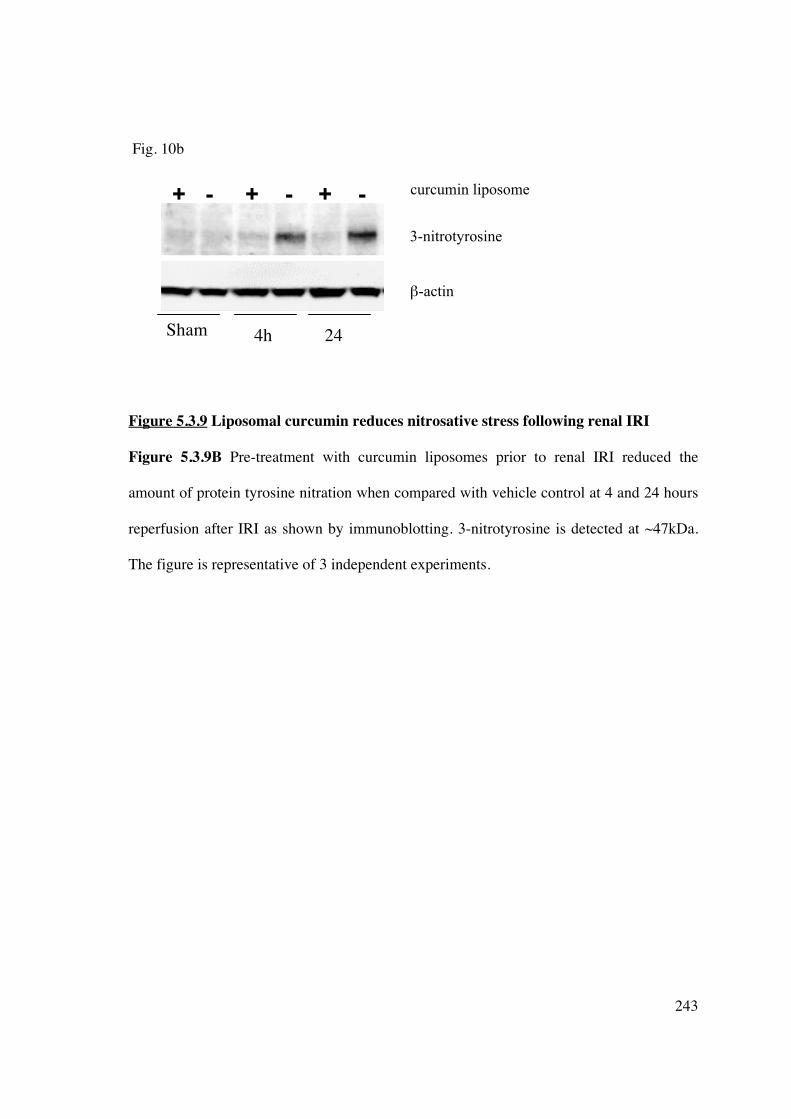
243
Fig. 10b
Figure 5.3.9 Liposomal curcumin reduces nitrosative stress following renal IRI
Figure 5.3.9B Pre-treatment with curcumin liposomes prior to renal IRI reduced the
amount of protein tyrosine nitration when compared with vehicle control at 4 and 24 hours
reperfusion after IRI as shown by immunoblotting. 3-nitrotyrosine is detected at ~47kDa.
The figure is representative of 3 independent experiments.
24
+ - + - + -
4h
3-nitrotyrosine
�-actin
Sham
curcumin liposome

244
Fig. 10c
0
2000
4000
6000
Sham IRI, 4h
reperfusion
IRI, 24h
reperfusion
iNO
S c
op
y n
um
be
r (n
orm
ali
se
d t
o H
PR
T1
)
Empty liposome
Curcumin liposome
Figure 5.3.9 Liposomal curcumin reduces nitrosative stress following renal IRI
Figure 5.3.9C Renal tissue inducible nitric oxide synthase (iNOS) gene expression was
assessed by RT-PCR. iNOS mRNA was upregulated by IRI at both 4 and 24 hours after
renal IRI (black bars), compared to both sham operated mice and mice pre-treated with
curcumin liposomes (grey bars), although the effect was only significantly different at 24
hours reperfusion. Data are mean + SEM. *P<0.05 curcumin liposome versus vehicle
control; **p=0.08.
* **

245
5.3.10 Liposomal curcumin limits thioreductase stress following renal IRI
Thioredoxin-interacting protein (TXNIP) functions as an inhibitor of the cellular
antioxidant thioredoxin by binding to redox-active cysteine residues, thus promoting
intracellular oxidative stress (484, 485). To verify expression of TXNIP in ischemic renal
tissue, immunofluorescence, western blot analysis and RT-PCR were performed. Figures
5.3.10A-C demonstrate upregulation of TXNIP protein and mRNA which was most
marked at 24 hours reperfusion, and ameliorated by pre-treatment with curcumin liposome.

246
Empty liposome
Sham 4h reperfusion 24h reperfusion
Curcumin liposome
Sham 4h reperfusion 24h reperfusion
Figure 5.3.10 Renal ischemia-reperfusion injury upregulates TXNIP and liposomal
curcumin ameliorates TXNIP expression
Figure 5.3.10A Renal IRI upregulated TXNIP expression at 4 and 24 hours reperfusion
and this expression was ameliorated by pre-treatment with liposomal curcumin, as shown
by immunofluorescence. Photomicrographs are representative of 6 sections per group
(original magnification x200).

247
Figure 5.3.10 Renal ischemia-reperfusion injury upregulates TXNIP and liposomal
curcumin ameliorates TXNIP expression
Figure 5.3.10B Pre-treatment with curcumin liposomes prior to renal IRI reduced the
amount of TXNIP protein expression when compared with vehicle control at 24 hours
reperfusion after IRI as shown by immunoblotting. TXNIP is detected at 46kDa. The figure
is representative of 3 independent experiments.
curcumin liposome
TXNIP
�-actin

248
Figure 5.3.10 Renal ischemia-reperfusion injury upregulates TXNIP and liposomal
curcumin ameliorates TXNIP expression
Figure 5.3.10C Renal parenchymal TXNIP gene expression was upregulated by IRI at
both 4 and 24 hours after renal IRI (black bars), compared to both sham operated mice and
mice pre-treated with curcumin liposomes (grey bars). Data are mean + SEM. *P<0.05
curcumin liposome versus vehicle control.
249
5.4 DISCUSSION
The major findings of this study are 1) liposomes encapsulating the lipophilic NF-�B
inhibitor curcumin provided targeted drug delivery to both renal TEC and APC; 2)
curcumin delivered to cells in this manner retained biologic activity, and 3) conferred
effective protection against renal IRI. Liposomal curcumin resulted in significant salvage
of biochemical parameters, improved histologic features particularly tubular infarction and
apoptosis, reduced neutrophil infiltration, and a concomitant decrease in pro-inflammatory
cytokine and chemokine expression. A major component of renoprotection was mediated
via decreased oxidative and nitrosative stress. For the first time we demonstrate
upregulation of TXNIP in renal IRI and a reduction in expression following administration
of liposomal curcumin.
Oxygen-derived free radicals formed following IRI aggravate tissue damage by
contributing to protein and lipid oxidation. Antioxidants demonstrate protective effects
against IRI in all organs by inhibiting ROS-induced pathogenesis. The oxygen radical
scavenger SOD protects against cell damage, and its expression is upregulated by
curcumin, attenuating intracellular superoxide formation. This correlates with previous
studies demonstrating increased total SOD activity (475). NO also influences physiological
processes in most organs, and is generated by three NOS isoforms (neuronal, endothelial
and inducible). iNOS-generated NO contributes to IR pathophysiology by facilitating
peroxynitrite production and this process is effectively down-regulated by curcumin pre-
treatment. TXNIP is clearly upregulated by IRI, and promotes oxidative stress by inhibiting
thioredoxin function and shifting intracellular redox stress. Previous in vivo studies have
localized TXNIP up-regulation to dilated tubules in a model of diabetic nephropathy (486,

250
487). Curcumin reduces renal tubular TXNIP protein and mRNA expression, providing an
additional antioxidant mechanism that may have a protective effect against IRI.
There is an increasing body of experimental work employing strategies to prevent or treat
IRI, ranging from ischemic preconditioning (488, 489), to blockade of cytokines and
chemokines (490, 491), adhesion molecules (492), complement (493, 494), and over-
expression of protective genes (495). However, delivery methods vary (direct intravenous
infusion, intraperitoneal administration, adenoviral infection) but lack immediate clinical
applicability. The liposomal encapsulation of curcumin used in this study offers targeted
cellular delivery of therapy, flexibility in administration, and safety. Liposomes allow
encapsulation of additional immunomodulatory agents, and particles, such as antigens,
DNA, proteins or peptides (496). Liposome stability, distribution and half-life in vivo may
be altered by modifying the lipid composition, such as addition of cholesterol or PEGylated
phospholipids, or changing liposome size (461, 497) and targeting antibodies can be used
to increase specificity of targeting (439).
To induce protection from IRI, liposomes must deliver to resident renal tubular cells. These
cells represent the main site of oxidative stress and damage seen following IRI. Microscopy
demonstrates these cells avidly endocytose liposomal curcumin and subsequent studies of
histology, TUNEL and DHE staining indicate that these cells are relatively protected from
IRI. Renal resident APC, macrophages and particularly DC (128, 498), are also implicated
in generation of reperfusion-related damage. Our data indicates that liposomes entrapping
curcumin efficiently block NF�B nuclear translocation in targeted APC in vivo. Flow

251
cytometric and microscopy studies indicate that liposome-loaded APC remain viable in
situ, in keeping with previous studies (348).
NF�B plays a central role in the initiation and progression of IRI. It exists in the cytoplasm
of most cells as dimers from a family of five different proteins [p50, p52, p65 (RelA),
RelB, and c-Rel]. The predominant form of NF-�B is a heterodimer of p55 and p65
proteins sequestered in the cytosol with inhibitory proteins I�Bs that prevent nuclear
translocation. A significant feature of the NF-�B signalling complex is the diversity of
agents that mediate NF-�B activation, in addition to the large number of regulated genes.
The importance of NF-�B in organ transplantation is its central role in the cytotoxic and
inflammatory cascade initiated by both warm and cold IRI. Blockade of the NF-�B
signalling pathway provides an opportunity for novel immunomodulatory therapeutic
strategies. Calcineurin inhibitors and deoxyspergualin (DSG) are known inhibitors of NF-
�B, although have not been extensively studied in IRI. Adenoviral over-expression of
I�B�, leading to decreased NF-�B DNA-binding activity ameliorating IRI and/or graft
rejection (499-501). Perfusion of allogeneic rat kidneys with NF-�B oligodeoxynucleotide
prior to transplantation abolished NF-�B activity in vivo and inhibited inflammatory
responses, particularly VCAM-1 expression (502). Sulfasalazine, a potent NF-�B inhibitor
decreased VCAM-1 and ICAM-1 expression following reperfusion in a heterotopic rodent
heart transplant model (503).
Curcumin is a polyphenolic extract of Curcuma longa (turmeric), and has a long history of
culinary and medicinal use. It possesses numerous pharmacological properties including
anti-oxidant (376, 377), anti-inflammatory (378), antimicrobial (379-381), and anti-

252
proliferative (382) activities, although the latter are independent of its ability to modulate
ROS (504). The biological activity of curcumin arises from inhibition of signal
transduction pathways, particularly suppression of NF-�B activity. Mechanisms include
prevention of DNA-binding activity, nuclear translocation of the p65 subunit (384) and
RelA (505), inhibiting phosphorylation of I�K� (383), or degradation of I�B� (505). The
extensive immunomodulatory effects of curcumin make it an attractive therapeutic option
to reduce IRI, and its lipophilicity ensures high liposome entrapment efficiency. In the
current study, delivery of curcumin liposomes did not induce obvious cytotoxicity.
Curcumin has low toxicity when delivered in mouse models and in phase I clinical trials
(506, 507). The use of liposomes to efficiently target the phagocytic capacity of both APC
and renal tubular cells exploits curcumin’s immunomodulatory, anti-inflammatory and
anti-oxidant properties.
In conclusion, this study demonstrates that liposomal curcumin can provide targeted
cellular delivery to both renal TEC and APC in vivo, conferring NF-�B-mediated
protection from IRI. Liposomal endocytosis of this cytoprotective agent by both cell
compartments is advantageous in IRI. Renal TEC are the main site of hypoxic damage and
oxidative stress following IRI, and resident APC, particularly DC, mediate the innate
immune response to parenchymal injury. Protective mechanisms are regulated through
multiple pathways, including inhibition of apoptosis, effects on neutrophil recruitment,
enhanced antioxidant enzyme expression, reduced NO generation and diminished TXNIP
expression. This treatment has potential clinical application, particularly in the setting of
organ procurement procedures that impact on perfusion. Future treatment of IRI should

253
focus on the translation of experimental protocols into clinical trials in order to improve
short- and long-term graft outcome.
254
CHAPTER 6: SPECIFIC LIPOSOMAL TARGETING OF DENDRITIC CELLS
6.1 INTRODUCTION
Liposomes provide an excellent mechanism for targeting cells in vivo and delivering
particle load, minimising potential side effects. However, as demonstrated in Chapter 5,
unmodified liposomes non-specifically target multiple cell types (eg macrophages,
neutrophils, dendritic cells, T-cells). Avoidance of reticuloendothelial cell (RES) uptake
that occurs predominantly in the liver can be achieved by additionally modifying liposomes
to carry antibody fragments (“immunoliposomes”), although coating liposomes with
immunoglobulin may paradoxically lead to enhanced RES uptake (313). Liposomal
formulations have been designed to engender specific targeting to F’ab- (313, 508) or Fc-
(509, 510) fragments of IgG antibodies directed against cell surface molecules. DC remain
important in the generation of immune hyporesponsiveness and therefore represent the best
target for the induction of transplant tolerance.
DC express numerous surface receptors, particularly C-type lectins, which are involved in
pathogen phagocytosis. Dendritic cell-specific intercellular adhesion molecule [ICAM]-3
grabbing nonintegrin (DC-SIGN, CD209) is a mannose-binding trans-membrane C-type
lectin (91) which facilitates chemokine-induced DC migration and DC binding to ICAM on
T-cells (89), thereby playing a critical role in T-cell activation (511). DC-SIGN plays an
important role in antigen uptake (particularly microbial carbohydrates) and viral
transfection efficiency, and is implicated in the transmission of HIV/SIV (512-514). DC-
SIGN is expressed in higher levels on immature tissue and monocyte-derived myeloid DC
255
compared with mature DC, reflecting the antigen uptake capacity of immature DC. It is
minimally expressed on freshly isolated blood myeloid DC (90). As a highly specific
marker for DC, particularly immature tissues-resident DC, liposomal targeting of this cell
surface marker would provide highly specific cellular in vivo targeting of
immunomodulatory agents. A further advantage for the use of DC-SIGN targeted
liposomes in vivo is the ability to test their use in a non-human primate pre-clinical
transplant model. DC-SIGN has been characterised in tissue-resident DC in rhesus
macaques, with minimal expression by circulating DC (515). A similar pattern is found in
Callithrix jacchus (Caja, common marmoset monkey), with DC-SIGN identified on
marmoset lymphoid tissue resident DC and freshly isolated BM cells (Prasad, Kireta et al.
unpublished data), although it is minimally expressed on marmoset Mo-DC (Prasad et al.
unpublished data). African green monkey Mo-DC demonstrate strong expression of DC-
SIGN, in conjunction with CD11c (516, 517), and DC-SIGN+ cells have been targeted in
vivo in cynomolgous monkeys (518).
Liposomes may be potentially designed to promote their interaction with DC receptors to
direct delivery. The presence of targeting antibodies or recombinant proteins to cell surface
receptors for liposomal targeting requires attachment onto the liposome surface, creating
immunoliposomes. Attachment may be achieved by chemical crosslinking (519), although
these reactions may be non-specific and may not anchor the protein in the correct
orientation. Effective engraftment of targeting moieties can be achieved by the use of a
novel metal chelator lipid such as, nitrilotriacetic acid ditetradecylamine (NTA3-DTDA,
Figure 6.1.1) (439, 520, 521),

256
Figure 6.1.1 The structure of NTA3-DTDA
or 1,2-dioleoyl-sn-glycero-3-{[N(5-amino-1-carboxypentyl)iminodiaceitc acid]succinyl}
(DGS-NTA, Figure 6.1.2):
Figure 6.1.2 The structure of 1,2-dioleoyl-sn-glycero-3-{[N(5-amino-1-
carboxypentyl)iminodiaceitc acid]succinyl}, DGS-NTA-Ni.

257
The aims of this chapter are:
1] to determine if a DC-SIGN targeted liposome could be generated to specifically target
hu-Mo-DC in vitro, thus potentially avoiding the non-specific cellular targeting when used
in vivo,
2] to clone marmoset DC-SIGN, and subsequently
3] establish the ability of a human DC-SIGN-targeted liposome to cross-react with
marmoset DC-SIGN for potential use in vivo.

258
6.2 METHODS
6.2.1 Cell culture and analysis
Protocols for reagents and media, propagation and culture of hu-Mo-DC, flow cytometry,
RNA extraction, cDNA synthesis and RT-PCR are described in Chapter 2.
6.2.2 Liposome synthesis
All liposomes utilised in this chapter were synthesised using sonication, performed at the
John Curtin School of Medicine, Australia National University, Canberra, as described in
Chapter 2. Targeted liposomes were synthesised using linking molecules NTA-DTDA or
DGS-NTA-Ni (as indicated), and a single chain monoclonal antibody to human DC-SIGN
(DMS-5000, Domantis Pty Ltd).
6.2.3 Cloning of marmoset DC-SIGN
Full methods, including primer sequences, are described in Chapter 2. Sequence
confirmation of marmoset and human DC-SIGN was performed by the DNA Sequencing
Facility in the Department of Haematology at Flinders University, Bedford Park, South
Australia.
6.2.4 Vector cloning
6.2.4.1 pGEM��-T Easy
PCR products (containing 3’ Adenine overhang) were cloned in the pGEM-T Easy vector
(containing 5’ thymidine overhang) carrying the ampicillin resistance gene and transformed

259
into competent DH5� E. coli cells. The transformed bacteria were plated on an LB plate
supplemented with ampicillin, Xgal and IPTG and following incubation for 16h at 37°C
visible colonies (white) were selected and grown further in 1.5ml LB under identical
conditions. Samples were then subjected to a plasmid extraction procedure, and the DNA
insert excised from the pGEM-T Easy vector with the restriction enzyme NotI. The
correct size and presence of the insert was confirmed by 1% agarose gel electrophoresis.
6.2.4.2 pCI mammalian expression vector
Full sequence human and marmoset DC-SIGN inserts excised from the pGEM-T Easy
vector were gel purified and subsequently ligated into the NotI digested pCI mammalian
expression vector at a 1:1 ratio. An identical procedure to that described in 6.2.3.1 was
followed, with transformation into competent DH5� E. coli cells and subsequent growth on
an LB-plate. Colonies containing the DC-SIGN insert were subjected to a maxi-prep
plasmid extraction procedure. The correct orientation of the inserts was determined by
digesting the vectors with XmaI/ApaI restriction enzymes. Quantification of the DNA was
performed using spectrophotometry.
6.2.5 Transfection of CHO cells
Chinese hamster ovary (CHO) cells were transfected as described previously (Section 2.6).
Briefly, 2.5μg of correctly orientated DC-SIGN DNA cloned into the mammalian
expression vector pCI (or the vector blank) was combined with 2μg of LipofectAMINE
in Opti-MEM medium. After 20 minutes of incubation at room temperature, complexes
were added to wells of a 6-well flat-bottom plate containing confluent CHO cells. Plates

260
were supplemented with CM and incubated for a further 24h under 5% CO2 at 37°C to
establish gene transduction.
6.2.6 Mass spectrometry
Mass spectrometry was used to assess successful modification of anti-human monoclonal
antibody to DC-SIGN, and performed by the Proteomics branch of the School of Molecular
and Biomedical Science, University of Adelaide, as described in Chapter 2.
6.3 RESULTS
6.3.1 Analysis of DC-SIGN (CD209) expression on hu-Mo-DC
The time-course of DC-SIGN mRNA and cell-surface protein expression was analysed by
RT-PCR and flow cytometry respectively (Figures 6.3.1A-B). DC-SIGN mRNA and
protein expression was rapidly up-regulated following exposure of monocyte-enriched
PBMC to GM-CSF and IL-4. Mature DC demonstrated significant down-regulation of
DC-SIGN mRNA expression, reflecting lower cell-surface expression. This is in keeping
with the recognised morphological and functional changes associated with maturation, such
as down-regulation of chemokine, phagocytic and endocytic receptors, up-regulation of
costimulatory molecules and acquisition of improved cellular motility (522, 523).

261
Figure 6.3.1 Time-course of DC-SIGN mRNA and protein expression in hu-Mo-DC
Figure 6.3.1.1 Analysis of DC mRNA expression of DC-SIGN (CD209) by RT-PCR
(normalised to HRPT1 gene expression) demonstrated a marked and sustained rise in
mRNA expression of DC-SIGN following generation of hu-Mo-DC in vitro. Mature DC,
exposed to LPS (1μg/μl) for 2 days prior to harvest, displayed significant down-regulation
of mRNA for DC-SIGN, at levels similar to PBMC. Results are representative of four
independent experiments.
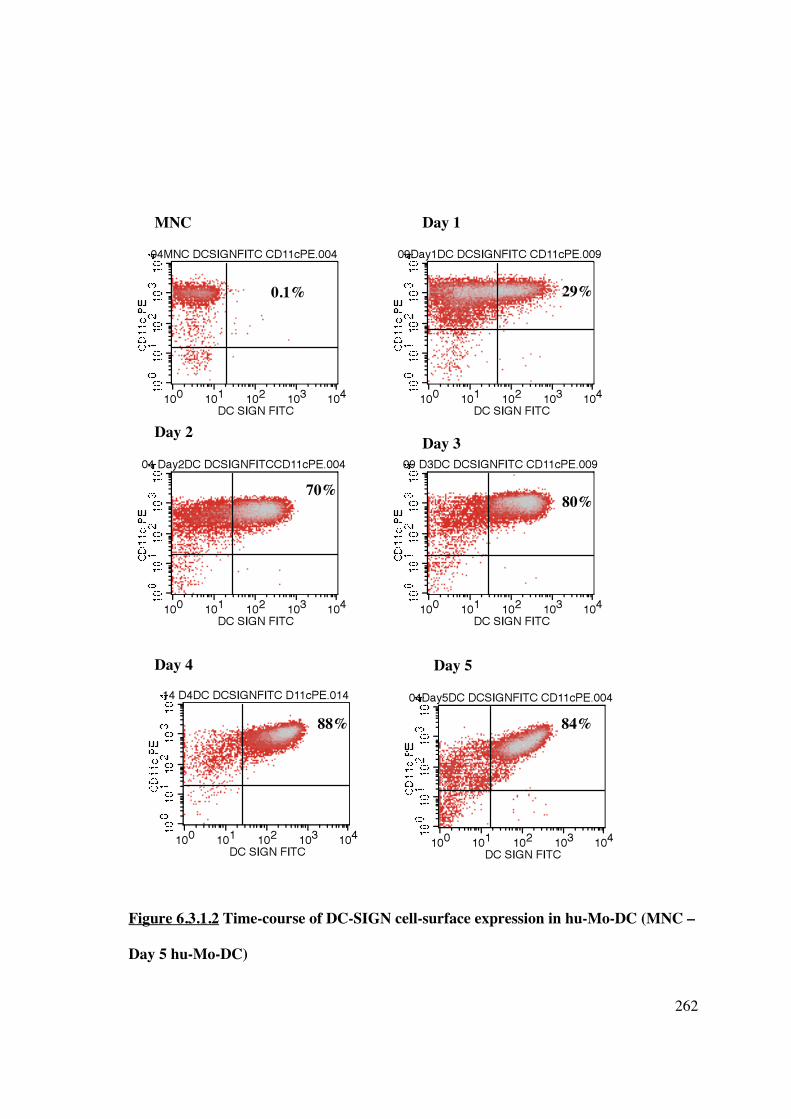
262
Figure 6.3.1.2 Time-course of DC-SIGN cell-surface expression in hu-Mo-DC (MNC –
Day 5 hu-Mo-DC)
MNC Day 1
Day 2 Day 3
Day 4 Day 5
0.1% 29%
70% 80%
88% 84%

263
Figure 6.3.1 Time-course of DC-SIGN cell-surface expression in hu-Mo-DC (Day 6 –
Day 7 & mature hu-Mo-DC)
Figure 6.3.1.2 Cell-surface expression of DC-SIGN analysed by flow cytometry. Cells
were stained for CD11c PE and DC-SIGN FITC. Percentage of CD11c+DC-SIGN+ cells
are shown in the upper right quadrant and DC-SIGN is markedly and rapidly up-regulated
following exposure to GM-CSF and IL-4 in vitro. Maximal expression of DC-SIGN is
reached after 4 days in culture. Results are representative of four independent experiments.
Day 6 Day 7
Mature DC
90% 89%
72%

264
6.3.2 DC-SIGN targeted liposome binds hu-Mo-DC in vitro
All hu-DC-SIGN targeted liposomes used for experiments in this chapter were synthesised
at the John Curtin School of Medicine, Australia National University, Canberra, as
described in Materials and Methods (Chapter 2). The single-chain monoclonal-antibody
directed against DC-SIGN (DMS-5000) was kindly provided by Domantis Pty Ltd. The
linking molecule, NTA3-DTDA, used to attach the targeting antibody to the liposome was
provided by Dr Joseph Altin (ANU). Immature hu-Mo-DC (immDC) were generated and
incubated with “control” liposome (the attached antibody was “irrelevant” ie not
recognised by any DC surface marker), “PBS” liposome (no antibody attached), or DC-
targeted liposome [the attached antibody is targeted to DC-SIGN (CD209)]. Liposomes
were labelled with a green fluorescent dye (BODIPY) to allow flow cytometric detection.
As expected, there was specific uptake of hu-DC-SIGN targeted liposome by DC,
particularly when compared to CTRL liposomes (Figure 6.3.2). Non-specific binding was
exhibited by the PBS liposomes; the reactive H2O groups associated with the Ni2+ cations
within NTA3-DTDA molecules can react with histidine residues located within the cell
membrane. Liposomal binding was confirmed using confocal microscopy (Figure 6.3.2F)
and electron microscopy (Figure 6.3.2G).
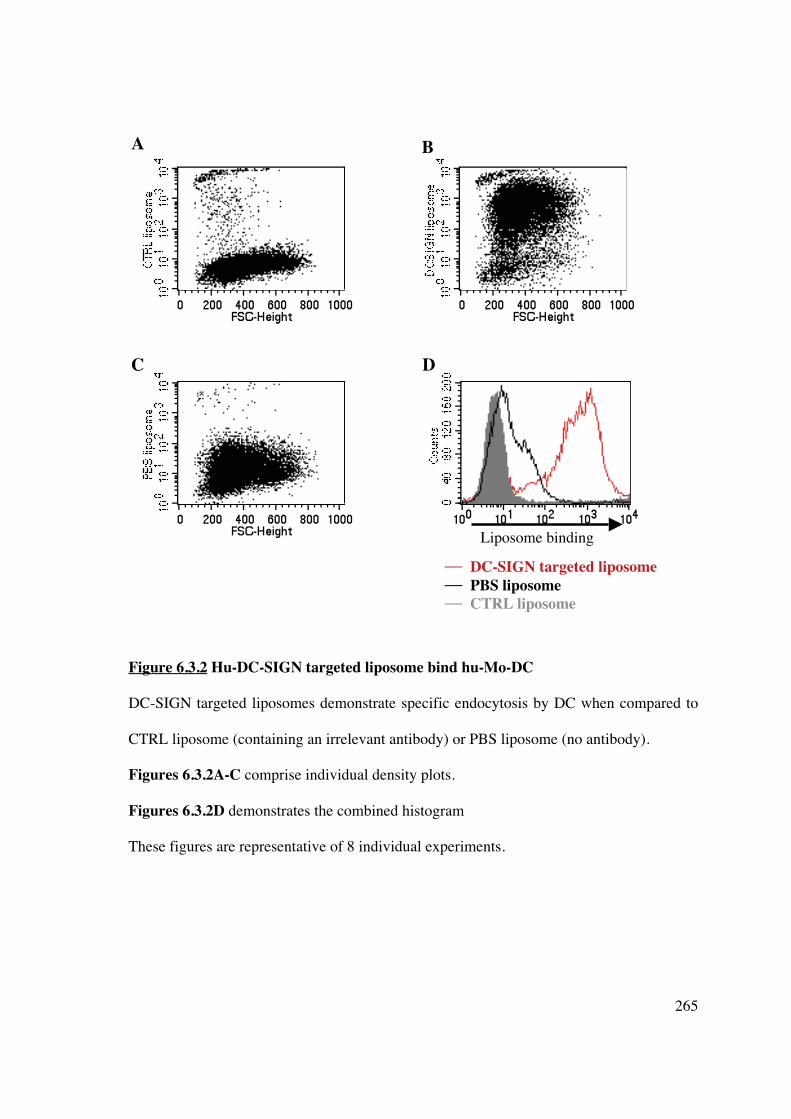
265
Figure 6.3.2 Hu-DC-SIGN targeted liposome bind hu-Mo-DC DC-SIGN targeted liposomes demonstrate specific endocytosis by DC when compared to
CTRL liposome (containing an irrelevant antibody) or PBS liposome (no antibody).
Figures 6.3.2A-C comprise individual density plots.
Figures 6.3.2D demonstrates the combined histogram
These figures are representative of 8 individual experiments.
�� DC-SIGN targeted liposome �� PBS liposome �� CTRL liposome
Liposome binding
A B
C D

266
Figure 6.3.2 Hu-DC-SIGN targeted liposome bind hu-Mo-DC
Figure 6.3.2E-F Cytospin preparations of hu-Mo-DC were incubated for 1 hour with (E)
BODPIY-labelled CTRL liposome and CTRL PE or (F) BOPDIPY-labelled DC-SIGN
targeted liposome (green) and CD11c PE (red). Nuclear DAPI stain is blue. Liposomal
binding was confirmed by confocal microscopy (original magnification x200).
Figure 6.3.2E – CTRL liposome, CTRL PE
Figure 6.3.2F – Hu-DC-SIGN targeted liposome and CD11c PE
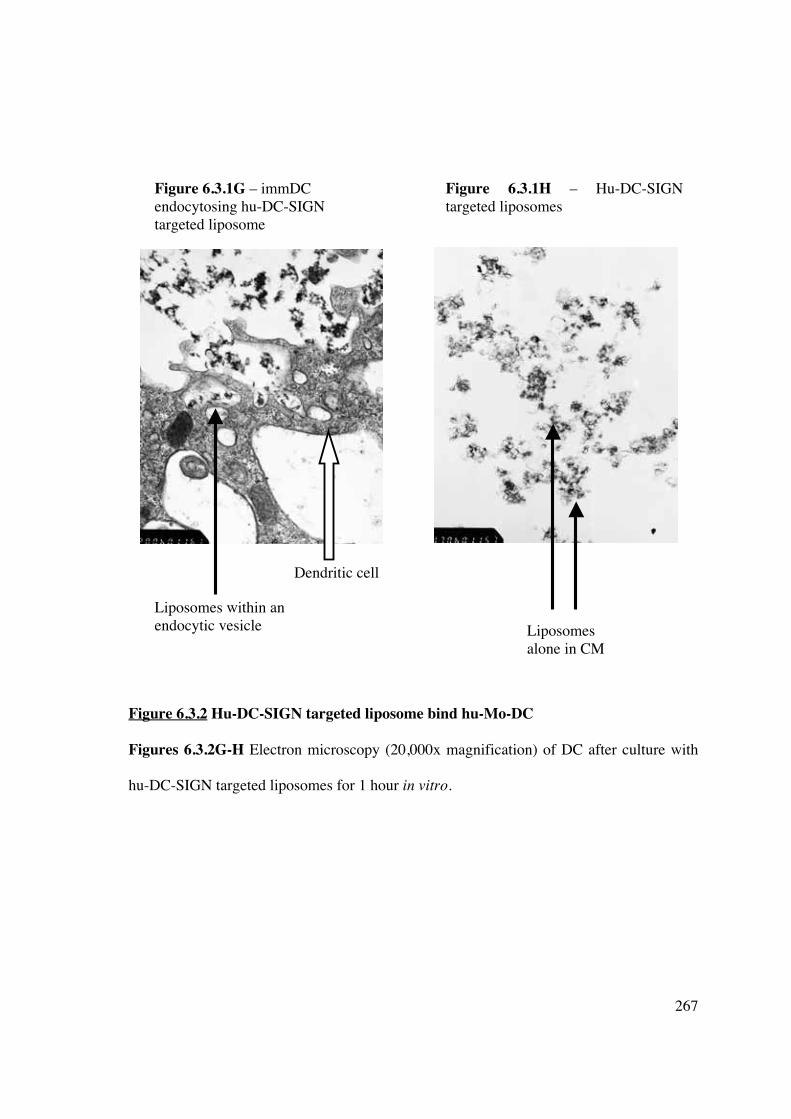
267
Figure 6.3.2 Hu-DC-SIGN targeted liposome bind hu-Mo-DC
Figures 6.3.2G-H Electron microscopy (20,000x magnification) of DC after culture with
hu-DC-SIGN targeted liposomes for 1 hour in vitro.
Figure 6.3.1G – immDC endocytosing hu-DC-SIGN targeted liposome
Figure 6.3.1H – Hu-DC-SIGN targeted liposomes
Liposomes within an endocytic vesicle
Dendritic cell
Liposomes alone in CM

268
6.3.3 Co-culture of immature or mature hu-Mo-DC with empty DC-SIGN-targeted
liposomes does not change DC phenotype or allostimulatory capacity
To establish that the liposome construct with a DC-SIGN targeting moiety but without an
incorporated immunomodulatory agent failed to change DC phenotype and function,
immature and mature DC were co-cultured in vitro with empty hu-DC-SIGN-targeted
liposomes at days 5 and 6. DC were collected on day 7, washed extensively, and stained for
cell surface markers (CD80, CD86, CD83 and MHC class II), or irradiated and added to a
MLR with allogeneic T-cells (NWT). Prior exposure of DC to liposomes in vitro did not
change expression of positive co-stimulatory molecules (Figures 6.3.3A-D) or
allostimulatory capacity (Figure 6.3.3E). The finding that empty liposomes bearing only
molecules (antibodies) engrafted by the metal-chelating linkage NTA3-DTDA cannot alter
functional DC responses suggest that their modification, by the addition of
immunomodulatory agents, can be used to modulate DC-specific immune responses in
vivo.

269
Figure 6.3.3 Hu-DC-SIGN-targeted liposomes fail to change DC phenotype
B
Figure legend
�� immature DC alone �� immature DC + liposomes �� mature DC alone �� mature DC + liposomes
Figure legend
�� immature DC alone �� immature DC + liposomes �� mature DC alone �� mature DC + liposomes
C
Figure legend
�� immature DC alone �� immature DC + liposomes �� mature DC alone �� mature DC + liposomes
Cou
nts
C
ount
s
Cou
nts
A

270
Figures 6.3.3A-C Incubation of immature and mature DC with hu-DC-SIGN-targeted
liposomes does not alter expression of positive costimulatory surface molecules, including
(A) CD80, (B) CD86, and (C) CD83.
Figure 6.3.3 Hu-DC-SIGN-targeted liposomes fail to change DC phenotype
Figure 6.3.3D Incubation of immature and mature DC with hu-DC-SIGN-targeted
liposomes does not alter expression of positive costimulatory surface molecules, including
MHC class II.
Results of Figure 6.3.3 are representative of 8 independent experiments.
Figure legend
�� immature DC alone �� immature DC + liposomes �� mature DC alone �� mature DC + liposomes
D
Cou
nts

271
Figure 6.3.3 Hu-DC-SIGN-targeted liposomes fail to alter DC allostimulatory capacity Co-culture of DC with liposomes in vitro failed to alter DC allostimulatory capacity in a
one-way MLR. Results are representative of 8 individual experiments. Data are expressed
as mean + SEM, *p<0.01 matDC vs immDC.
*
*
*

272
6.3.4 Cloning of marmoset DC-SIGN
6.3.4.1 Determination of the nucleotide and amino acid sequence for marmoset DC-
SIGN
In order to determine if hu-DC-SIGN-targeted liposomes were capable of binding to
marmoset DC-SIGN marmoset DC-SIGN was cloned. The lack of significant homology
between human and marmoset DC-SIGN meant that marmoset DC-SIGN could not be
propagated using primers for the full-length gene based on human and rhesus macaque
sequences available at www.ncbi.nih.gov/pubmed. The gene was divided roughly in half
and cloning was achieved by designing multiple sets of primers, as tabulated in Materials
and Methods (Chapter 2, Section 2.6). Sequencing was performed by the Sequencing
Facility in the Department of Haematology at Flinders Medical Centre (Bedford Park,
South Australia) and the final sequence was confirmed in 2 distinct tissues (liver, thymus
or spleen) from 3 individual marmoset monkeys. Marmoset and human DC-SIGN display
80% homology for both nucleotide and amino acid sequences. The marmoset nucleotide
sequence is truncated at 1113 base pairs (compared to 1215 base pairs for human DC-
SIGN) due to areas of deletion (Figures 6.3.4). The sequence has been confirmed by
additional groups (524).
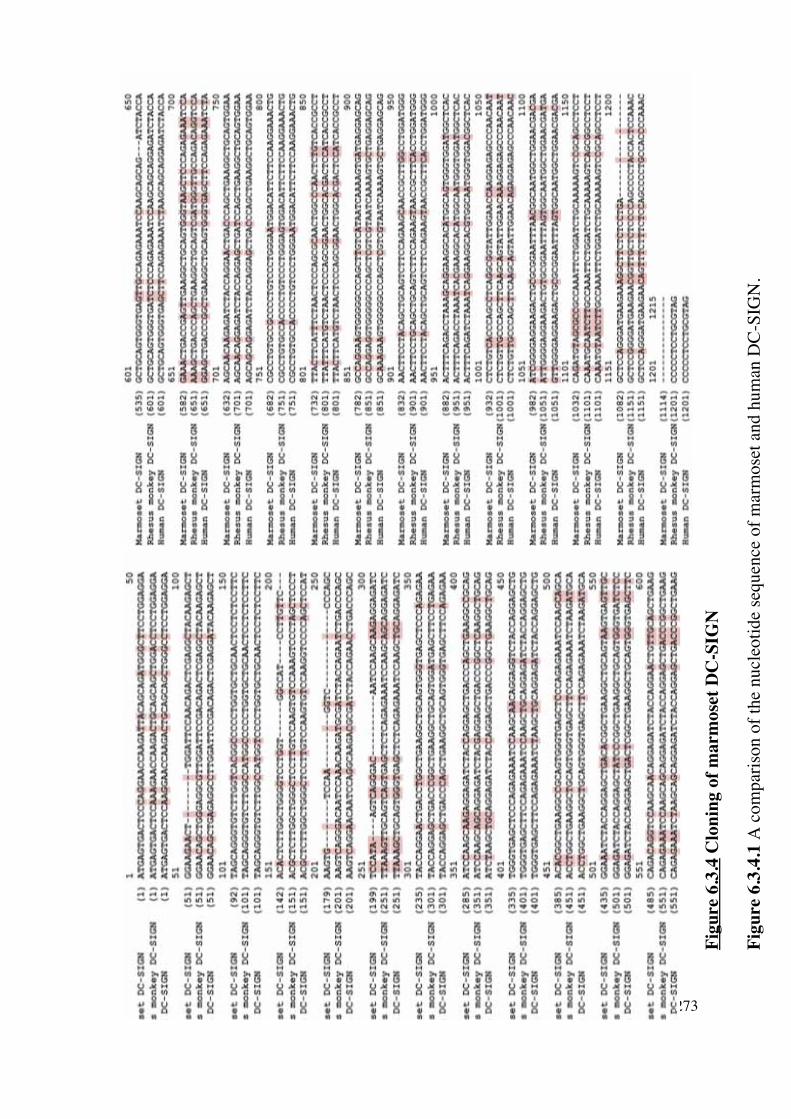
273
Fig
ure
6.3.
4 C
loni
ng o
f m
arm
oset
DC
-SIG
N
Fig
ure
6.3.
4.1
A c
ompa
riso
n of
the
nucl
eoti
de s
eque
nce
of m
arm
oset
and
hum
an D
C-S
IGN
.
222222222222222222222222222

274
Figure 6.3.4 Cloning of marmoset DC-SIGN
Figure 6.3.4.2 A comparison of the amino acid sequence of marmoset, rhesus macaque,
and human DC-SIGN. Differences between amino acids are highlighted in red. There is
approximately 80% homology between the marmoset and human sequences.

275
6.3.4.2 Cloning of human or marmoset DC-SIGN in pGEM��-T Easy and pCI vectors
Human or marmoset DC-SIGN DNA (PCR amplified products) were ligated into pGEM�-
T Easy at a 1 (50ng) to 3 (150ng) ratio of plasmid to insert (Figure 6.3.4.2.1), and
subsequently transformed into competent DH5� E. coli cells. Bacterial growth on LB-
ampicillin-Agar plates was due to successful uptake of pGEM�-T Easy vector conferring
resistance to ampicillin. Colonies were selected by blue/white discrimination (on LB-Xgal-
IPTG-Agar plates) as the T7 and SP6 promoters flank the �-peptide coding region of �-
galactosidase and successful insertion interrupts the coding sequence of this enzyme.
Colonies containing inserts were subjected to a maxi-prep plasmid procedure (Section
2.6.1.3) and screened by NotI digestion and agarose gel electrophoresis. Both human and
marmoset DC-SIGN were of the correct size, as determined from the DNA size marker
(Figure 6.3.4.2). NotI digested DC-SIGN were gel purified and ligated into the mammalian
expression vector pCI, which was also subjected to NotI digestion (Figure 6.3.4.2.2),
designed to promote constitutive expression of cloned DNA inserts in mammalian cells.

276
Figure 6.3.4.2.1 Pictorial representation of cloning marmoset DC-SIGN
Marmoset DC-SIGN was cloned as described above, and both human and marmoset DC-
SIGN were propagated using specific primers. PCR products, contained 3’adenine
overhangs were cloned into pGEM-T Easy vector containing 5’ thymidine overhangs to
improve ligation efficiency.

277
Figure 6.3.4.2.2 Comparison of human and marmoset DC-SIGN
Full-length human DC-SIGN was generated from primers based on the sequence from
GenBank. Marmoset DC-SIGN was cloned as above and the full sequence generated from
appropriate primers. The individual proteins were successfully ligated into the pGEM-T
Easy vector. The restriction enzyme NotI was used to release the DNA inserts and the
products run on a 2% agarose gel to confirm correct size and successful insertion. The
DNA size marker is SPP1 plasmid digested with EcoRI.
Figure 6.3.4.2.2A represents human DC-SIGN, expected size 1215bp
Figure 6.3.4.2.2B represents marmoset DC-SIGN, expected size 1113bp
A B

278
In order for the inserted DC-SIGN to be successfully transcribed, the orientation needs to
be in the same direction as the CMV enhancer/promoter region (Figure 6.3.4.2.3). Figures
6.3.4.2.4 depict desirable orientation of DC-SIGN DNA (human and marmoset
respectively) with respect to the direction of CMV. The Vector NTI� program was used to
determine which restriction enzymes could be used to establish correct orientation of DC-
SIGN within the pCI vector. Correct recombinants were then used to transfect CHO cells.
Figure 6.3.4.2.3 Pictorial representation of cloning marmoset DC-SIGN
Marmoset DC-SIGN was excised from pGEM-T Easy vector with NotI restriction
enzyme and cloned into NotI digested pCI mammalian expression vector.
5’
3’

279
Figure 6.3.4.2.4 Orientation of human DC-SIGN in a mammalian expression vector
The mammalian expression vector containing human DC-SIGN was digested using
XmaI/ApaI and run on a 2% agarose gel to confirm correct orientation of the DNA insert.
Correct orientation is observed in the fourth gel band, with band sizes of 4.4kbp (plasmid
DNA) and 900bp. Incorrect orientation is demonstrated in the third gel band (band sizes
4.9kbp and 350bp). The DNA size markers are SPP1 or pUC19 plasmid digested with
EcoRI.

280
Figure 6.3.4.4 Confirmation of orientation of marmoset DC-SIGN in the mammalian
expression vector pCI
The mammalian expression vector containing marmoset DC-SIGN was digested using
XmaI/ApaI and run on a 2% agarose gel to confirm correct orientation of the DNA insert.
Correct orientation is observed in both gel band samples, with band sizes of 4.3kb and
800bp. The DNA size marker is SPP1 plasmid digested with EcoRI. The red arrows on the
left highlight the DC-SIGN fragments.

281
6.3.5 Binding of anti-human DC-SIGN antibody to marmoset DC-SIGN
To test the affinity of human DC-SIGN targeted liposomes for marmoset DC-SIGN, CHO
cells were transfected with marmoset DC-SIGN inserted into a mammalian expression
vector as described in Chapter 2. Following demonstration of correct orientation of the
DNA within the expression vector, successful transfection and expression of marmoset
DC-SIGN was confirmed with anti-human DC-SIGN antibody that was cross-reactive with
marmoset DC-SIGN (Figures 6.3.5A-C).
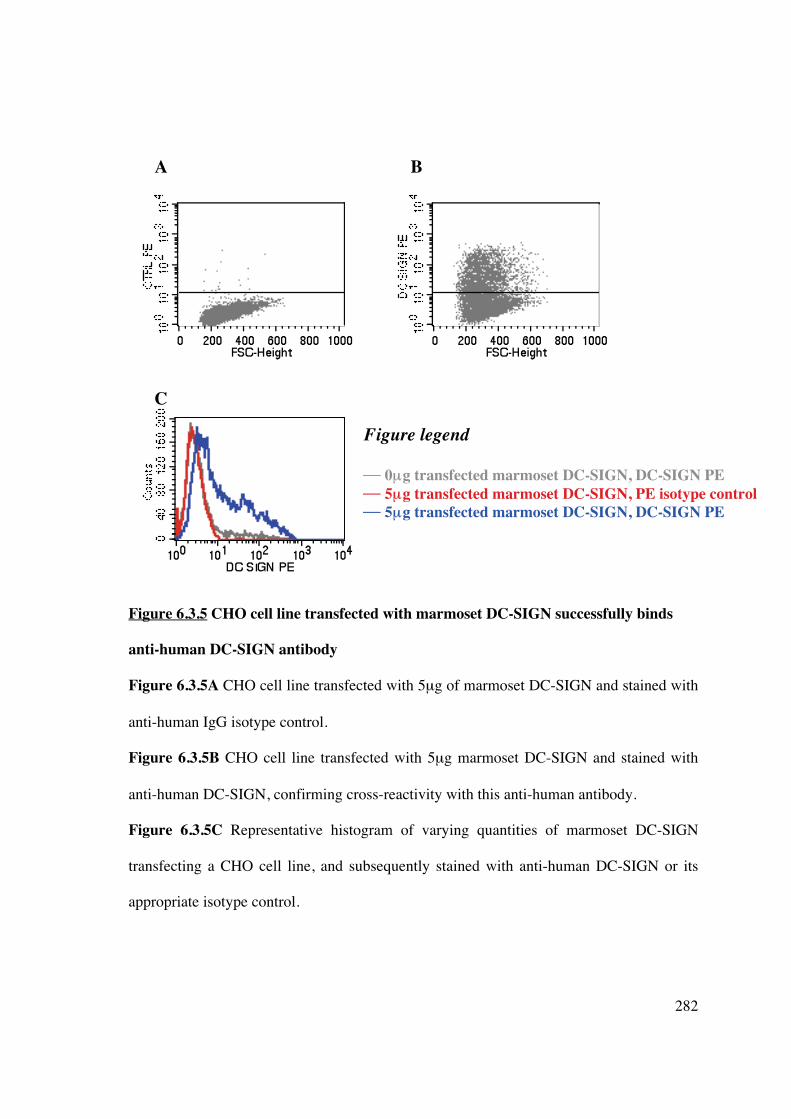
282
Figure 6.3.5 CHO cell line transfected with marmoset DC-SIGN successfully binds
anti-human DC-SIGN antibody
Figure 6.3.5A CHO cell line transfected with 5μg of marmoset DC-SIGN and stained with
anti-human IgG isotype control.
Figure 6.3.5B CHO cell line transfected with 5μg marmoset DC-SIGN and stained with
anti-human DC-SIGN, confirming cross-reactivity with this anti-human antibody.
Figure 6.3.5C Representative histogram of varying quantities of marmoset DC-SIGN
transfecting a CHO cell line, and subsequently stained with anti-human DC-SIGN or its
appropriate isotype control.
Figure legend
�� 0μμg transfected marmoset DC-SIGN, DC-SIGN PE � 5μg transfected marmoset DC-SIGN, PE isotype control �� 5μg transfected marmoset DC-SIGN, DC-SIGN PE
A B
C

283
6.3.6 Binding of human DC-SIGN-targeted liposome to marmoset DC-SIGN
DC-SIGN is a C-type lectin strongly expressed on human in-vivo myeloid DC and MoD
(525, 526). DC-SIGN has been primarily characterised in macaques, in submucosal,
lymphoid and other tissues (527, 528), however despite 92% homology between human
and macaque DC-SIGN, macaque Mo-DC only weakly express this molecule (529). In
African green monkeys, DC-SIGN is strongly expressed in lymph nodes and on the cell
surface of Mo-DC in conjunction with CD11c (530, 531). DC-SIGN+ cells have been
targeted in-vivo with anti-human antibodies in cynomolgus monkeys (532). Studies have
previously used anti-human DC-SIGN antibody to identify DC-SIGN+ cells in marmoset
spleen, lymph nodes and thymus, and have shown co-localisation with DC markers
including CD11c (Kireta, Coates et al., unpublished data). However, no significant DC-
SIGN expression was observed on in-vitro propagated marmoset DC (Prasad, Coates et al.,
unpublished data).
CHO cells transfected with either 0μg or 5μg marmoset DC-SIGN were subsequently
incubated with hu-DC-SIGN-targeted liposome. Despite successful transfection, confirmed
by binding of cross-reactive anti-human DC-SIGN in Figures 6.3.6A-B, there was minimal
binding of hu-DC-SIGN-targeted liposomes (7-10%, Figure 6.3.6D) when compared to
control (0μg transfected DNA, Figure 6.3.6C) or PBS liposome (containing no targeting
antibody, Figures 6.3.6E-F). The histogram in Figure 6.3.6G demonstrates a comparison
of results. Binding was confirmed using confocal microscopy and immunofluorescent
staining (Figure 6.3.6H-I), but was significantly lower when compared to CHO cells
transfected with human DC-SIGN (Figure 6.3.6J).

284
Figure 6.3.6 Hu-DC-SIGN targeted liposomes do not effectively target marmoset DC-
SIGN transfected CHO cells
CHO cell line was transfected with 0μg (Figures 6.3.6A, C, E) or 5μg (Figures 6.3.6B, D,
F) marmoset DC-SIGN DNA and incubated with anti-human DC-SIGN, hu-DC-SIGN
targeted liposomes or PBS liposome. Cells were analysed by flow cytometry. Results are
representative of 3 independent experiments.
E
C D
A B
F

285
Figure 6.3.6 Hu-DC-SIGN targeted liposomes do not effectively target marmoset DC-
SIGN transfected CHO cells
Figure 6.3.6G CHO cells transfected with 5μg marmoset DC-SIGN and incubated with
anti-human DC-SIGN antibody (cross-reactive with marmoset DC-SIGN, red), isotype
antibody control (grey), human DC-SIGN targeted liposome (blue), or PBS liposome
(green).
Figure legend �� 5μμg transfected marmoset DC-SIGN, antibody isotype control � 5μg transfected marmoset DC-SIGN, DC-SIGN antibody � 5μg transfected marmoset DC-SIGN, DC-SIGN targeted liposome � 5μg transfected marmoset DC-SIGN, PBS liposome
FITC
Cou
nts
G

286
Figure 6.3.6H Figure 6.3.6I
Figure 6.3.6 Hu-DC-SIGN-targeted liposomes do not effectively target marmoset DC-
SIGN transfected CHO cells
Figure 6.3.6H Confocal microscopy of CHO cells transfected with marmoset DC-SIGN
and incubated with CTRL liposome and stained for IgG PE isotype control.
Figure 6.3.6I Confocal microscopy of CHO cells transfected with marmoset DC-SIGN and
incubated with human DC-SIGN-targeted liposome (green) and stained for DC-SIGN PE
(red). Nuclear DAPI stain is blue.
DAPI CTRL liposome CTRL PE DC-SIGN

287
Figure 6.3.6 Hu-DC-SIGN targeted liposomes do not effectively target marmoset DC-
SIGN transfected CHO cells
Figure 6.3.6J Comparison of marmoset and human DC-SIGN (2.5μg DNA) transfected
CHO cell lines and the ability to bind cross-reactive monoclonal (anti-human) antibody to
DC-SIGN, hu-DC-SIGN-targeted liposome, or PBS liposome (no targeting antibody).
7.3% 26.7%
3.5%
30%
CHO cells transfected with
marmoset DC-SIGN
CHO cells transfected
with human DC-SIGN
Hu-
DC
-SIG
N
targ
eted
lipo
som
e
Hu-
DC
-SIG
N
targ
eted
lipo
som
e

288
6.3.7 Unmodified monoclonal antibody to human DC-SIGN fails to bind to liposomes
and subsequently target DC in vitro
Intellectual property issues prevented further use of DMS-5000 (single chain monoclonal
antibody to DC-SIGN linked to histidine polypeptide) in liposome constructs. IgG
monoclonal antibodies possess a cluster of histidine residues at the junction of the CH2 and
CH3 domains. The capacity of the histidine-rich motif to be exploited in an unmodified
IgG to bind the reactive H2O water moieties associated with the Ni2+ residue located in the
DGS-NTA-Ni molecule was assessed. The DGS-NTA-Ni linking molecule was used rather
than 3NTA-DTDA because the presence of multiple reactive Ni2+/H2O molecules in the
latter could prevent binding due to steric hindrance associated with the large tertiary
structure of the monoclonal antibody. Liposomes with varying concentrations of DGS-
NTA (0.5-16%) were synthesised, and equivalent molar quantities of targeting antibody to
DC-SIGN, monoclonal antibody or PBS were added and incubated for 1 hour with DC.
The cell suspension was washed extensively to remove unbound liposome and analysed by
flow cytometry.
The addition of the His-linked targeted antibody to hu-DC-SIGN (DMS-5000) to the
liposome demonstrated affinity of the construct for DC in vitro, at all concentrations
(Figure 6.3.7A). However, the addition of unmodified monoclonal antibody to the
liposome failed to improve liposomal endocytosis by DC compared to the “control”
liposome (with an irrelevant antibody), confirming that the histidine-rich residues were not
accessible to the DGS-NTA-Ni molecule (Figures 6.3.7B-C). It is likely that the tertiary
structure of the monoclonal antibody prevented access of the histidine-rich area to the Ni2+
cation.

289
Figure 6.3.7 Monoclonal antibody to DC-SIGN does not attach to liposome and
facilitate DC targeting
0.5%
2%
4%
8%
16%
Hu-DC-SIGN targeted liposome
Liposome with monoclonal antibody to DC-SIGN
Liposome with irrelevant antibody
Proportion of DGS-NTA within liposome
A B C
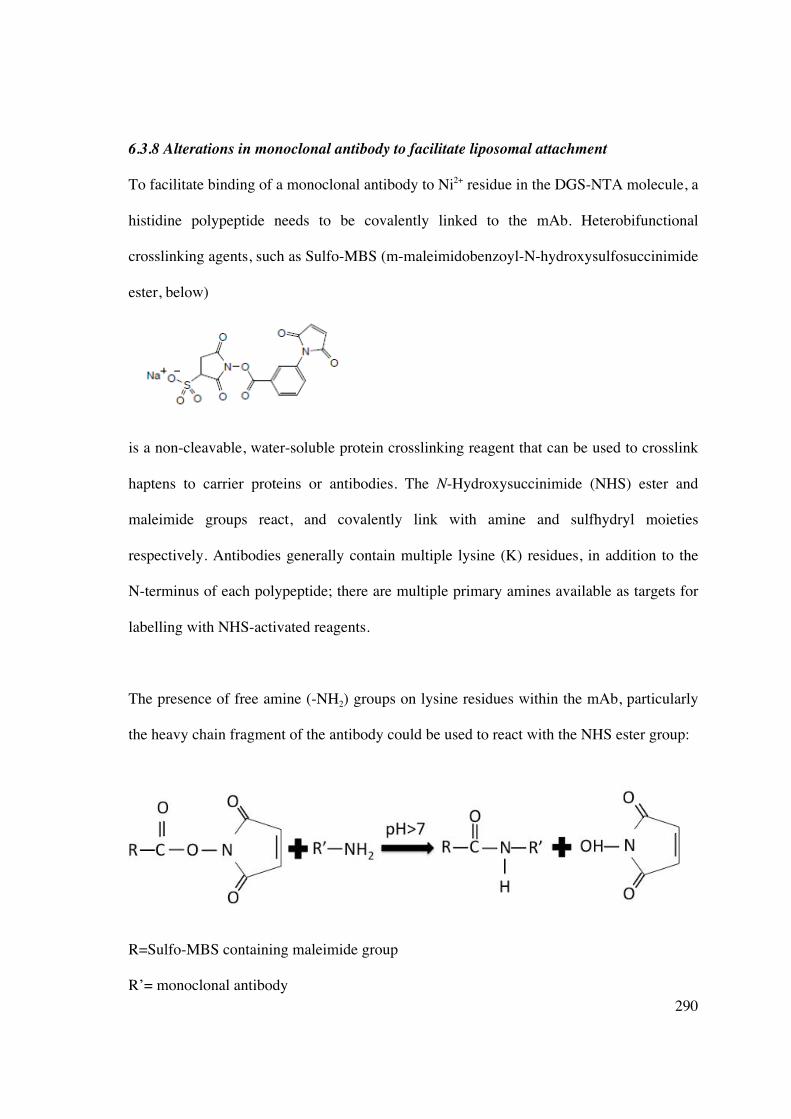
290
6.3.8 Alterations in monoclonal antibody to facilitate liposomal attachment
To facilitate binding of a monoclonal antibody to Ni2+ residue in the DGS-NTA molecule, a
histidine polypeptide needs to be covalently linked to the mAb. Heterobifunctional
crosslinking agents, such as Sulfo-MBS (m-maleimidobenzoyl-N-hydroxysulfosuccinimide
ester, below)
is a non-cleavable, water-soluble protein crosslinking reagent that can be used to crosslink
haptens to carrier proteins or antibodies. The N-Hydroxysuccinimide (NHS) ester and
maleimide groups react, and covalently link with amine and sulfhydryl moieties
respectively. Antibodies generally contain multiple lysine (K) residues, in addition to the
N-terminus of each polypeptide; there are multiple primary amines available as targets for
labelling with NHS-activated reagents.
The presence of free amine (-NH2) groups on lysine residues within the mAb, particularly
the heavy chain fragment of the antibody could be used to react with the NHS ester group:
R=Sulfo-MBS containing maleimide group
R’= monoclonal antibody

291
Subsequently, a histidine polypeptide, linked to a cysteine residue (6His-Cys-SH)
containing a free, reactive sulfhydryl group could react with the maleimide group:
R = Sulfo-MBS free maleimide group with attached monoclonal antibody
R’’= histidine polypeptide and single cysteine residue
These reactions would produce linking of the monoclonal antibody and histidine
polypeptide, leaving the latter available to bind with DGS-NTA-Ni. An alternative would
be to disrupt the disulfide bonds within the hinge region of the monoclonal antibody, using
the reduced sulfhydryl groups to link to a polypeptide containing histidine residues and a
lysine residue with a free amine group (ie 6His-Lys-NH2). The disadvantage of this
reaction would be the potential disruption of the antibody-binding site by facilitating a
reaction within the hinge region.
Several attempts were made to link the anti-human DC-SIGN monoclonal antibody that
was cross-reactive with marmoset DC-SIGN with Sulfo-MBS. The monoclonal antibody
(clone DCN46, BD PharMingen) was added to conjugation buffer and Sulfo-MBS
crosslinker at a concentration of 1mM (to produce a 10-fold molar excess). The mixture
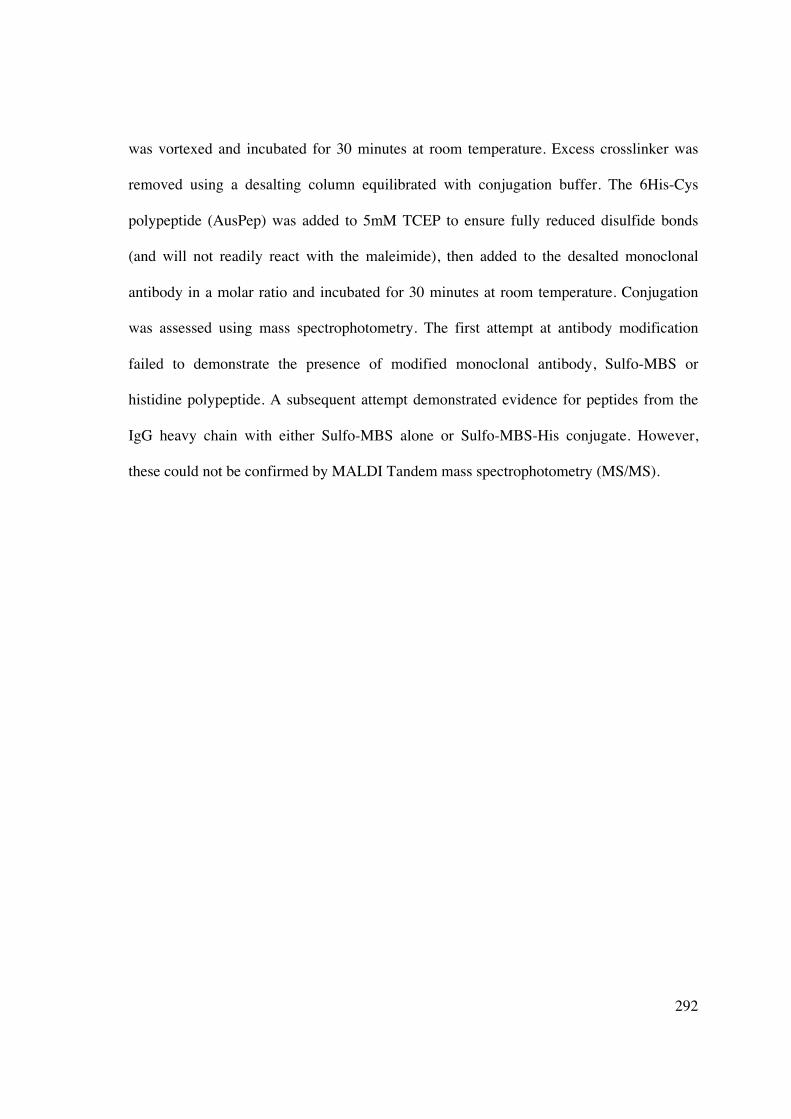
292
was vortexed and incubated for 30 minutes at room temperature. Excess crosslinker was
removed using a desalting column equilibrated with conjugation buffer. The 6His-Cys
polypeptide (AusPep) was added to 5mM TCEP to ensure fully reduced disulfide bonds
(and will not readily react with the maleimide), then added to the desalted monoclonal
antibody in a molar ratio and incubated for 30 minutes at room temperature. Conjugation
was assessed using mass spectrophotometry. The first attempt at antibody modification
failed to demonstrate the presence of modified monoclonal antibody, Sulfo-MBS or
histidine polypeptide. A subsequent attempt demonstrated evidence for peptides from the
IgG heavy chain with either Sulfo-MBS alone or Sulfo-MBS-His conjugate. However,
these could not be confirmed by MALDI Tandem mass spectrophotometry (MS/MS).

293
6.4 DISCUSSION
DC-based immunotherapies for anti-tumour immunity or induction of transplant tolerance
have shown promise in pre-clinical models (described in Section 1.3.5), but the approach
requires ex vivo manipulation. Propagation of donor-derived DC using a standard protocol
(473) requires 5-7 days, limiting potential clinical applicability particularly in the deceased-
donor transplant setting where initiation of the adaptive immune response develops rapidly
during this time. Liposomes can encapsulate antigen and immunomodulatory agents and
serve as potent delivery vehicles to antigen-presenting cells in vivo, including DC, thus
eliminating the need for in vitro manipulation. Different strategies have been explored to
target liposomes to DC in vivo, such as employing single chain antibody fragments to DC
surface molecules, CD11c and DEC205, attached via metal-chelating linkage (439). This
approach has induced dramatic anti-tumour responses in a murine cancer model, and could
be potentially exploited as a “negative vaccine” to target and inhibit DC maturation in vivo,
subsequently inducing T-cell hyporesponsiveness.
DC-SIGN, the canonical marker for DC, is an effective target to enhance specific
liposomal binding to DC. Unmodified liposomes provide an effective means of targeting
APC, and can be altered to generate cell-specific liposomes. The addition of a targeting
antibody to DC-SIGN demonstrates significant liposome specificity for DC in vitro,
although this could not be confirmed in vivo. Immobilized metal chelators, such as NTA,
have been used previously to purify recombinant proteins bearing poly-histidine tags by
metal ion affinity chromatography (533). The use of NTA-DTDA can form liposomal
suspensions with other phospholipids, and anchor 6His-bearing antibodies directed against
canonical receptors. Liposomes that do not contain immunomodulatory agents do not alter

294
DC phenotype, in terms of co-stimulatory molecule expression (including CD80, CD86,
CD83 and MHC class II) or allostimulatory function in a MLR.
The DC-SIGN gene family consists of DC-SIGN (CD209), DC-SIGNR (L-SIGN,
CD209L) expressed on lymph node and hepatic endothelia, and CD209L2 (534) which has
been identified in rhesus macaques and common chimpanzees but is absent in humans.
This study has demonstrated significant (80%) homology between marmoset and human
DC-SIGN sequences. Function of DC-SIGN is dependent upon the carbohydrate
recognition domain (CRD), separated from the transmembrane region by a neck region of a
variable number of (typically 23) amino acid repeats (534). The CRD is the most conserved
region of DC-SIGN genes (534) and its orientation and flexibility is influenced by the neck
region (524). Length variation in this region can impact on function (at least in humans)
(535), influencing in particular susceptibility to HIV infection (536-538). Evolutionary
pressures have led to alterations in the DC-SIGN gene family involving duplications and
deletions (534). Specific function of marmoset DC-SIGN has not been elucidated, although
the redundant functional activities of the gene family may ensure that overall function is
not compromised.
A CHO cell line was successfully transfected with marmoset and human DC-SIGN.
Although transfection efficiency was significantly lower in the latter, this was sufficient to
demonstrate cross-reactivity of a commercially available anti-human DC-SIGN antibody.
Human DC-SIGN-targeted liposome was effectively endocytosed by hu-Mo-DC. The
homology between human and marmoset DC-SIGN was not sufficient to ensure binding of
hu-DC-SIGN targeted liposome to CHO cells expressing marmoset DC-SIGN. Freshly
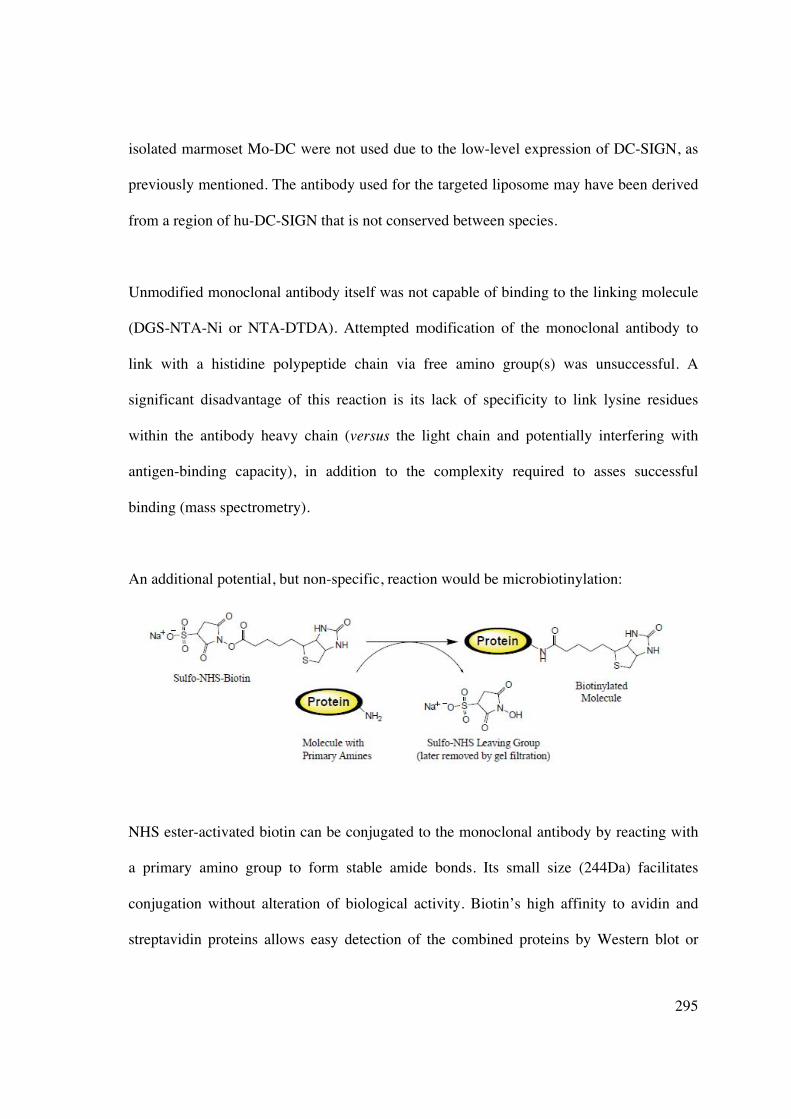
295
isolated marmoset Mo-DC were not used due to the low-level expression of DC-SIGN, as
previously mentioned. The antibody used for the targeted liposome may have been derived
from a region of hu-DC-SIGN that is not conserved between species.
Unmodified monoclonal antibody itself was not capable of binding to the linking molecule
(DGS-NTA-Ni or NTA-DTDA). Attempted modification of the monoclonal antibody to
link with a histidine polypeptide chain via free amino group(s) was unsuccessful. A
significant disadvantage of this reaction is its lack of specificity to link lysine residues
within the antibody heavy chain (versus the light chain and potentially interfering with
antigen-binding capacity), in addition to the complexity required to asses successful
binding (mass spectrometry).
An additional potential, but non-specific, reaction would be microbiotinylation:
NHS ester-activated biotin can be conjugated to the monoclonal antibody by reacting with
a primary amino group to form stable amide bonds. Its small size (244Da) facilitates
conjugation without alteration of biological activity. Biotin’s high affinity to avidin and
streptavidin proteins allows easy detection of the combined proteins by Western blot or

296
ELISA methods and subsequent liposomal binding via a 6His-Streptavidin tag. However,
the inability to direct the reaction to a particular amine group remains a disadvantage.
Once stable, specific binding can be achieved, in vivo stability and targeting would need to
be assessed. Non-targeted liposomes are endocytosed by most MNC, via Fc receptors. Use
of antibody targeting can avoid non-specific cellular uptake and potential side effects of
inadvertent drug delivery.
Increasing DC-SIGN-targeted liposome specificity for marmoset DC in vivo would entail
synthesis of a hexahistidine tagged protein at the carboxy-terminal of DC-SIGN, as
described previously (539). Amplification of the DC-SIGN recombinant protein requires
RT-PCR with primers containing the hexahistidine sequence, subsequent cloning into a
baculovirus expression system, amplification within the SF9 insect cell line, and
purification by Ni2+ -NTA affinity chromatography. Linkage of receptors onto a fluid lipid
bilayer allows receptors to move and interact laterally (leading to oligomerisation), and
interact with ligands on the apposing cell surface.
The ability of liposomes to bind their cognate receptors depends upon the density of
engrafted recombinant proteins, its orientation on the 2D surface of the liposome, and the
lipids comprising the preparation. There is variation in the proportion of hexahistidine-
tagged protein stably bound to NTA3-DTDA within the liposome (540). The most stable
binding occurs when the tag is bound simultaneously to 3x NTA head-groups. The addition
of a carrier lipid or lipophilic immunomodulatory agent allows greater membrane fluidity
so engrafted molecules can move laterally and interact. Dimerization/oligomerization

297
occurs in vivo: CD154 requires trimerization for stable interaction with CD40 (541, 542)
and dimerization of B7.1 is required for stable binding to CD28 (543, 544).
A significant limitation of all pharmaceutical nanocarriers is that the body treats them as
foreign particles that are readily opsonised and removed from circulation prior to reaching
the cellular target. Increasing liposomal delivery to the desired area may be achieved by
using liposomes with surface-attached ligands. Targeting moieties include monoclonal
antibodies, Fab’ (545) or single chain Fv (scFv) (439) fragments, peptides (546), growth
factors (547, 548), glycoproteins (549) or carbohydrates (550, 551). Immunoglobulins
(IgG) are the most widely used targeting molecule, which may be attached to liposomes by
covalent linkage to the liposome surface or direct insertion into the lipid bilayer following
modification in a manner that does not affect its antigen-binding capacity. However,
despite these targeted modifications, the majority of liposomes end up in the liver.
Additional mechanisms for preventing or reducing premature opsonization is to coat the
liposome in PEG which causes steric hindrance and reduces RES capture (308, 552).
Monoclonal antibody as the liposomal targeting ligand confers the highest specificity for
cellular targeting. However, the Fc region of whole mAb binds to the Fc receptor on most
cells, facilitating clearance from the systemic circulation (553). The use of chimeric
(murine-based) antibodies may result in production of human anti-mouse antibodies (554)
that augment liposome removal and reduce therapeutic potential. This process is not
completely circumvented by the use of fully humanised antibodies where anti-idiotypic
antibodies can still be produced. Increasingly, Fab’ and scFv antibody fragments are being
used as targeting moieties. There are several advantages over mAb: 1) slower clearance as

298
Fc-mediated clearance is eliminated (555), 2) improved targeting with the ability to select
high affinity clones, 3) engineering tags (eg 6His) (556) into a fully humanised fragment
construct. Antibodies may be coupled to liposomes by covalent (eg maleimide-PEG) or
non-covalent bonds (poly-His-Ni-NTA). The latter are less desirable for in vivo application
as the interaction between linking molecules may be out-competed by serum proteins or
cell-surface receptors, resulting in a loss of targeting (557) (557). Nevertheless,
immunoliposomal drugs are more efficacious than either free drug or non-targeted
liposomal drugs (558-560), although studies are limited to tumour immunotherapy.
In this study a novel scFv-targeting fragment directed against human DC-SIGN was used
to facilitate highly specific liposomal-targeting to DC in vitro. Marmoset DC-SIGN was
cloned and demonstrated binding of this human targeted liposome to cell line over-
expressing this protein. However, the lack of substantial binding would preclude use of this
human-antibody-targeted liposome in vivo in our non-human primate model. Additional
methods were undertaken to modify a marmoset cross-reactive monoclonal antibody
directed against hu-DC-SIGN, however, attachment of cross-linking molecules occurred
randomly (if at all) and in multiple locations. The common marmoset remains a feasible
pre-clinical transplant model, however, liposome-based therapy, particularly targeting of
DC, will need to be species-specific.
299
CHAPTER 7: CONCLUSIONS AND FUTURE
DIRECTIONS
7.1 SUMMARY AND CONCLUSIONS
The role of DC in the co-ordination of innate and adaptive immune response to foreign
antigens has been well established and characterised (26). DC are critical APC that ensure
central tolerance (561) and also control development of peripheral tolerance (436),
including the response to transplantation. Transplantation remains the most appropriate
treatment choice for ESKD. Although current immunosuppressive agents greatly improve
allograft survival, they have significant effects on patient and allograft longevity, and do
not induce tolerance. DC offer a crucial therapeutic tool to manipulate the immune
response, prevent or ameliorate graft rejection, and thus improve clinical transplantation.
However, research into DC manipulation for tolerance induction has been dominated by ex
vivo strategies, consisting of DC isolation, propagation, exposure to antigen and re-
injection. This limits potential clinical applicability both economically and logistically and
highlights the need for in vivo DC targeting. The advent of nanomedicine offers a potential
solution, and biological vehicles (such as liposomes, polymer microparticles and
dendrimers) can be exploited as targeting moieties for cell-directed drug delivery. The aims
of this thesis were to identify a novel and clinically relevant immunosuppressive agent that
clearly generated tolerogenic DC in vitro, investigate its ability to undergo liposomal
encapsulation, and subsequently target and generate tolerogenic DC in vivo. This potential

300
therapeutic avenue avoids the use of cell-based treatments and can improve both the safety
and complexity of cellular immunotherapy.
Chapter 3 examined the ability of a unique biologic agent, curcumin, to induce tolerogenic
hu-Mo-DC via NF-�B inhibition, and reports several novel observations regarding the
immunobiology of pharmacologically modified CurcDC. To date, this remains the only
study to recognise the tolerogenic potential of curcumin in hu-Mo-DC. CurcDC
demonstrate an impaired ability to undergo phenotypic and functional maturation following
multiple, clinically relevant maturation stimuli including LPS, IFN� and CD40 ligation, the
latter mimicking stimulatory interaction with activated T-cells (391, 562, 563). CurcDC
induced substantial allogeneic T-cell hyporesponsiveness in vitro, mediated by
CD4+CD25hiFoxP3+ Tregs, but not T-cell apoptosis. To demonstrate potential clinical
applicability, murine CD11c+ CurcDC were infused in vivo and induced subsequent T-cell
hyporesponsiveness ex vivo that was also FoxP3+Treg mediated.
The ability of conventional liposomes to target DC in vivo was investigated in Chapter 4.
The lack of modification of the phospholipid structure resulted in significant, systemic
reticuloendothelial cell uptake. Curcumin, due to its chemical structure endowing lipid
solubility, efficiently incorporated into liposomes and maintained biologic activity in vivo,
inhibiting NF-�B in LPS-stimulated splenic APC. Isolated MNC displayed reduced
allostimulatory capacity that was facilitated by expansion of Foxp3+ Tregs. DC that had
endocytosed liposomal curcumin failed to upregulate co-stimulatory molecules in response
to a maturation stimulus, in a manner similar to that demonstrated in vitro in Chapter 3.
The potential for using cell-derived membranes (plasma membrane vesicles) containing
301
relevant antigens (eg MHC) in a liposomal preparation was also explored. The presence of
PMV was able to provide a sufficient antigenic stimulus and induce an antigen-specific
immune response in vitro following co-culture with hu-Mo-DC. However, antigen-specific
hyporesponsiveness to curcumin was not demonstrated, in keeping with the lack of
antigen-specific hyporesponsiveness revealed in Chapter 3.
In the absence of a readily available small animal transplant model, the use of liposomal
curcumin in IRI was investigated in Chapter 5. Curcumin demonstrates anti-oxidant and
anti-inflammatory properties (447), and remains an excellent candidate to ameliorate
multiple aspects of IR-induced pathophysiology. Pre-treatment of mice undergoing
bilateral renal IRI with liposomal curcumin improved renal function, reduced renal
histologic injury and apoptosis, and decreased markers of renal injury (such as toll-like
receptor 4 and heat shock protein 70). Salvage of renal function was mediated by reduced
pro-inflammatory cytokine and chemokine expression, and diminished production of
reactive oxygen species due to concurrent upregulation of superoxide dismutase and
downregulation of inducible nitric oxide synthase. Thioredoxin-interacting protein was
identified as a potential novel marker of renal IRI, and overexpression was mitigated by
liposomal curcumin. The ability of liposomal curcumin to provide renal parenchymal
protection was facilitated by its endocytosis by both renal tubular epithelial cells and APC.
The former cell compartment is the main site of oxidative stress, and APC contribute to
inflammatory damage and antigen presentation, enhancing organ immunogenicity.
The use of conventional, unmodified liposomes in vivo is disadvantaged by rapid clearance,
primarily by macrophages, and this limits their potential for targeted delivery. Alterations

302
of liposome structure by the addition of targeting moieties, such as antibodies, can facilitate
selective cell binding. DC-SIGN is a pathognomonic marker of both human and non-
human primate DC, involved in pathogen phagocytosis (91, 512). In the setting of clinical
transplantation, the ability of DC in vitro and in vivo in small animal studies to promote a
tolerogenic phenotype must be extrapolated to large animal models, particularly non-
human primates, as a more accurate index of potential translational success. Chapter 6
demonstrated the results of cloning marmoset DC-SIGN, with significant nucleotide and
amino acid homology to its human counterpart. This has enabled demonstration of cross-
reactivity with anti-human DC-SIGN antibody and identification of resident DC within
marmoset tissue sections (Prasad et al., unpublished).
Creation of an immunoliposome specific for DC-SIGN exploits the functional aspects of
this cell-surface marker and theoretically improves the specificity of in vivo DC targeting.
Use of a human DC-SIGN-targeted liposome demonstrated high affinity for hu-Mo-DC,
but not a cell-line expressing marmoset DC-SIGN. Subsequent manipulation of a cross-
reactive antibody was unsuccessful in appropriately altering anti-human DC-SIGN for
liposomal attachment.
In conclusion, the ability to target both antigen and immunomodulatory agents directly to
DC has enormous potential for the development of effective immunotherapy in the form of
negative vaccines.

303
7.2 FUTURE DIRECTIONS
The work presented in this thesis provides the basis for a number of ongoing studies that
will firstly consolidate the potential of tolerogenic curcumin-treated DC to induce allograft
hyporesponsiveness. Secondly, evaluation of strategies for in vivo DC-based liposomal
targeting as alternative cell-free immunotherapy may facilitate beneficial transplant
outcomes, including tolerance.
7.2.1 Planned studies for further evaluation of tolerogenic DC (CurcDC) in vitro
and in vivo
• Assessment of indoleamine 2,3-dioxygenase (IDO) production by CurcDC
• Evaluating the ability of CurcDC to migrate to T-cell areas in secondary lymphoid
tissue by measuring CCR7 mRNA and surface protein levels (the cognate receptor of
CCL19 and CCL21).
• Further assessing the mechanism of Treg induction, particularly the conversion of naïve
CD4+CD25- T-cells into Treg by inducing FoxP3 expression.
• Optimising DC type (myeloid versus plasmacytoid) and source (splenic versus hepatic
versus renal; donor versus recipient) for transplant studies in vivo, in addition to
establishing the optimal route (subcutaneous versus intravenous administration),
timing, dose and frequency.
• Assessing the capacity of CurcDC to induce long-term allograft survival in a transplant
model, the effect on manifestations of both acute and chronic rejection particularly
transplant vasculopathy, the presence of allograft-infiltrating FoxP3+ Tregs, and
adoptive transfer studies.

304
• Identifying optimal combinatorial strategies with other immunosuppressive or
tolerizing agents.
• Application of curcumin-mediated modification of DC function in larger pre-clinical
transplant models, such as the common marmoset. The surgical team at The Queen
Elizabeth Hospital is currently developing the skills required for a marmoset renal
transplantation procedure, scheduled to commence next year.
7.2.2 Planned studies of liposomal curcumin in ischaemia-reperfusion injury
• In the murine model of ischaemia-reperfusion injury, establishing whether the effect of
liposomal curcumin on renal TEC or APC is more important in protecting against
development of renal injury. I will be employing a RIPmOVA mouse model
reconstituted with OT-1 T-cells, and assessing differences in antigen presentation and
T-cell proliferation in the draining renal lymph node that may be mediated by
liposomal curcumin.
• Assessing the effect of curcumin liposomes on infiltrating cell populations important in
IRI, such as CD4+ regulatory T-cells.
• Assessing longer-term outcomes (>7 days) following administration of liposomal
curcumin prior to renal IRI to ensure that NF�B blockade does not interfere with
tubular epithelial cell repair mechanisms.
• Optimising lipid composition to reduce hepatic reticuloendothelial cell uptake and
timing of administration to improve potential clinical applicability.

305
7.2.3 Planned studies of liposomes in transplantation
• Assessment of the ability of liposomal curcumin to prolong allograft survival, and
directly comparing outcomes with ex vivo manipulated tolerogenic DC (CurcDC),
given the additional ability of liposomal curcumin to target the indirect alloimmune
response.
• Assessment of the capacity of other immunomodulatory agents (eg sirolimus, CTLA-4)
to incorporate into liposomes, particularly DC-targeted liposomes, and alter both
function and phenotype of DC in vivo.
• Further investigation of PMV incorporation into liposome preparations and the ability
to induce antigen-specific hyporesponsiveness (not with curcumin which has failed to
generate antigen-specific responses in this study, but potentially with rapamycin).
• Synthesis of a marmoset DC-targeted liposome, assessment of liposome stability in
vitro and in vivo, and testing of the ability to target and modify tissue-resident DC in
vivo. On the basis of the cloned marmoset DC-SIGN gene, 3 antigenic peptide
sequences were identified, followed by mouse immunisations, generation of
hybridomas, production and purification of IgG monoclonal antibody. Ten clones are
now available for testing on marmoset and human monocyte-derived DC or transfected
cell lines to establish cross-reactivity. On the basis of these experiments, cross-reactive
clones could be modified for subsequent liposomal attachment.
In conclusion, there is wide scope for further developing both non-targeted and DC-
specific liposomes as cytoprotective and/or immunomodulatory options in a transplant
model, with a broad number of therapeutic avenues to be explored in the future.

306
REFERENCES
1. McDonald S, Chang S, Excell L. Chapter 4: Method and Location of dialysis. ANZDATA report 2008. 2008. 2. McDonald S, Excell L. ANZDATA Registry Report, Adelaide, South Australia. 2008. 3. Laupacis A, Kweown P, Pus N, Krueger H, Ferguson B, Wong C et al. A study of the quality of life and cost-utility of renal transplantation. Kidney Int 1996;50(1):235-242. 4. Wolfe R, Ashby V, Milford E, Ojo A, Ettenger R, Agodoa L et al. Comparison of mortality in all patients on dialysis, patients on dialysis awaiting transplantation, and recipients of a first cadaveric transplant. N Engl J Med 1999;341(23):1725-1730. 5. Howard K, Salkeld G, White F, McDonald S, Chadban S, Craig J et al. The cost effectiveness of increasing kidney transplantation and home-based dialysis. Nephrology 2009;14(1):123-132. 6. Campbell S, McDonald S, Excell L, Livingston B. Chapter 8: Transplantation. ANZDATA report 2008. 2008. 7. Danovitch GE. Handbook of kidney transplantation. Oxford University Press, UK 2004. 8. Billingham R, Brent L, Medawar P. Activity acquired tolerance of foreign cells. Nature 1953;172(4379):603-606. 9. Di Cocco P, Bonanni L, D'Angelo M, Clemente K, Greco S, Rizza V et al. Clinical operational tolerance after solid organ transplantation. Transplant Proc 2009;41:1278-1282. 10. Kawai T, Cosimi A, Spitzer T, Tolkoff-Rubin J, Suthanthiran M, Saidman S et al. HLA-mismatched renal transplantation without maintenance immunosuppression. N Engl J Med 2008;358:353-360. 11. Spitzer T, Delmonico F, Tolkoff-Rubin N, McAfee S, Sackstein R, Saidman S et al. Combined histocompatibility leukocyte antigen-matched donor bone marrow and renal transplantation for multiple myeloma with end stage renal disease: the induction of allograft tolerance through mixed lymphohematopoietic chimerism. Transplantation 1999;68:480-486. 12. Brouard S, Dupont A, Giral M, Louis S, Lair D, Bradeau C et al. Operationally tolerant and minimally immunosuppressed kidney recipients display strongly altered blood T-cell clonal regulation. Am J Transplant 2005;5:330-340. 13. Li Y, Koshiba T, Yoshizawa A, Yonekawa Y, Masuda K, Ito A et al. Analyses of peripheral blood mononuclear cells in operational tolerance after pediatric living donor liver transplantation. Am J Transplant 2004;4:2118-2125. 14. Brouard S, Mansfield E, Braud C, Li L, Giral M, Hsieh S et al. Identification of a peripheral blood transcriptional biomarker associated with operational renal allograft tolerance. Proc Natl Acad Sci 2006;104:15448-15453. 15. Ballet C, Roussey-Kesler G, Aubin J-T, Brouard S, Giral M, Miqueu P et al. Humoral and cellular responses to influenza vaccination in human recipients naturally tolerant to a kidney allograft. Am J Transplant 2006;6:2796-2801. 16. Shapiro R, Jordan M, Basu A, Scantlebury V, Potdar S, Tan H et al. Kidnye transplantation under a tolerogenic regimen of recipient pretreatment and low-dose postoperative immunosuppression with subsequent weaning. Ann Surg 2003;238:520-525.

307
17. Starzl T, Murase N, Abu-Elmagd K, Gray E, Shapiro R, Eghtesad B et al. Tolerogenic immunosuppression for organ transplantation. Lancet 2003;361:1502-1510. 18. Scandling J, Busque S, Dejbakhsh-Jones S, Benike C, Millan M, Shizuru J et al. Tolerance and chimerism after renal and hematopoietic-cell transplantation. N Engl J Med 2008;358(4):362-368. 19. Steinman R, Cohn Z. Identification of a novel cell type in peripheral lymphoid organs of mice. I. Morphology, quantitation, tissue distribution. J Exp Med 1973;137:1142-1162. 20. Steinman R, Adams J, Cohn Z. Identification of a novel cell type in peripheral lymphoid organs of mice. IV. Identification and distribution in mouse spleen. J Exp Med 1975;141(4):804-820. 21. Steinman R, Cohn Z. Identification of a novel cell type in peripheral lymphoid organs of mice. II Functional properties in vitro. J Exp Med 1974;139(2):380-397. 22. Steinman R, Kaplan. G, Witmer M, Cohn Z. Identification of a novel cell type in peripheral lymphoid organs of mice. V Purification of spleen dendritic cells, new surface markers, and maintenance in vitro. J Exp Med 1979;149(1):1-16. 23. Steinman R, Lustig D, Cohn Z. Identification of a novel cell type in peripheral lymphoid organs of mice. III. Functional properties in vivo. J Exp Med 1974;139(6):1431-1445. 24. Steinman R, Witmer M. Lymphoid dendritic cells are potent stimulators of the primary mixed leucocyte response in mice. Proc Natl Acad Sci USA 1978;75:5132. 25. Hart DNJ, Fabre JW. Demonstration and characterization of Ia-positive dendritic cells in the interstitial connective tissue of rat heart and other tissues, but not brain. J Exp Med 1981;153:347. 26. Banchereau J, Steinman R. Dendritic cells and the control of immunity. Nature 1998;392:245-251. 27. Figdor C, van Kyook Y, Adema G. C-type lectin receptors on dendritic cells and langerhans cells. Nat Rev Immunol 2002;2:77-84. 28. Matzinger P, Guerder S. Does T cell tolerance require a dedicated antigen-presenting cell? Nature 1989;338:74-76. 29. Steinman R, Turley S, Mellman I, Inaba K. The induction of tolerance by dendritic cells that have captured apoptotic cells. J Exp Med 2000;191(3):411-416. 30. Ardavin C, Wu L, Li C-L, Shortman K. Thymic dendritic cells and T cells develop simultaneously in the thymus from a common precursor population. Nature 1993;362:761-763. 31. Kelly K, Lucas K, Hochrein H, Metcalf D, Wu L, Shortman K. Development of dendritic cells in culture from human and murine thymic precursor cells. Cell Mol Biol 2001;47:43-54. 32. Naik S, Sathe P, Park H, Metcalf D, Proietto A, Dakic A et al. Development of plasmacytoid and conventional dendritic cell subtypes from single precursor cells derived in vitro and in vivo. Nat Immunol 2007;8:1217-1226. 33. Onai N, Obata-Onai A, Schmid M, Ohteki T, Jarossay D, Manz M. Identification of clonogenic common Flt3+M-CSFR+ plasmacytoid and conventional dendritic cell progenitors in mouse bone marrow. Nat Immunol 2007;8:1207-1216. 34. Inaba K, Inaba M, Deguchi M, Hagi K, Yasumizu R, Ikehara S et al. Granulocytes, macrophages, and dendritic cells arise from a common major histocompatibility complex

308
class II-negative progenitor in mouse bone marrow. Proc Natl Acad Sci USA 1993;90(7):3038-3042. 35. Izon D, Rudd K, DeMuth W, Pear W, Clendenin C, Lindsley R et al. A common pathway for dendritic cell and early B cell development. J Immunol 2001;167(3):1387-1392. 36. Manz M, Traver D, Miyamoto T, Weissman I, Akashi K. Dendritic cell potentials of early lymphoid and myeloid progenitors. Blood 2001;97(11):3333-3341. 37. Wu L, D'Amico A, Hochrein H, O'Keeffe M, Shortman K, Lucas K. Development of thymic and splenic dendritic cell populations from different hemopoietic precursors. Blood 2001;98(12):3376-3382. 38. Liu Y. Dendritic cell subsets and lineages, and their functions in innate and adaptive immunity. 2001;Cell(106):259-262. 39. Brasel K, de Smedt T, Smith J, Maliszewski C. Generation of murine dendritic cells from flt3-ligand-suuplemented bone-marrow cultures. Blood 2000;96:3029-3039. 40. Traver D, Akashi K, Manz M, Merad M, Miyamoto T, Engleman E et al. Development of CD8alpha-positive dendritic cells from a common myeloid prgogenitor. Science 2000;290(5499):2152-2154. 41. Zhang Y, Zhang Y, Ogata M, Chen P, Harada A, Hashimoto S et al. Transforming growth factor �1 polarizes murine hematopoietic progenitor cells to generate Langerhans-cell-like dendritic cells through a monocyte/macrophage differentiation pathway. Blood 1999;93:1208-1220. 42. Anjuere F, del Hoyo G, Martin P, Ardavin C. Langerhans cells develop from a lymphoid-committed precursor. Blood 2000;96:1633-1637. 43. Rissoan M. Subtractive hybridization reveals the expression of immunoglobulin-like transcript 7, Eph-B1, granzyme B, and 3 novel transcripts in human plasmacytoid dendritic cells. Blood 2002;100:3295-3303. 44. Olweus J BA, Warnke R, Thompson PA, Carballido J, Picker LJ, Lund-Johansen F. Dendritic cell ontogeny: a human dendritic cell lineage of myeloid origin. Proc Natl Acad Sci U S A 1997;94(23):12551-12556. 45. Vremec D, Lieschke G, Dunn A, Robb L, Metcalf D, Shortman K. The influence of granulocyte-macrophage colony-stimulating factor on dendritic-cell levels in mouse lymphoid organs. Eur J Immunol 1997;27:40-44. 46. Zhang Y, Mukaida N, Wang J, Harada A, Akiyama M, Matsushima G. Induction of dendritic-cell differentiation by granulocyte-macrophage colony-stimulating factor, stem cell factor and tumor necrosis factor � in vitro from lineage-phenotypes-negative c-kit+ murine hematopoietic progenitor cells. Blood 1997;90:4842-4853. 47. Georgopoulos K, Bigby M, Wang J, Molnar A, Wu P, Winandy S et al. The Ikaros gene is required for the development of all lymphoid lineages. Cell 1994;79:143-156. 48. Guerriero A, Langmuir P, Spain L, Scott E. PU.1 is required for myeloid-derived but not lymphoid-derived dendritic cells. Blood 2000;95:879-885. 49. Wu L, D'Amico A, Winkel K, Suter M, Lo D, Shortman K. RelB is essential for the development of myeloid-related CD8�- dendritic cells but not of lymphoid-related CD8�+ dendritic cells. Immunity 1998;9:839-847. 50. Galy A, Travis M, Cen D, Chen B. Human T, B, natural killer and dendritic cells arise from a common bone marrow progenitor cell subset. Immunity 1995;3(4):459-473.

309
51. Kelly K, Lucas K, Hochrein H, Metcalf D, Wu L, Shortman K. Development of dendritic cells in culture from human and murine thymic precursors. Cell Mol Biol 2001;47(1):43-54. 52. Shortman K, Liu Y-J. Mouse and human dendritic cell subtypes. Nat Rev Immunol 2002;2(3):151-161. 53. Vremec D, Pooley J, Hochrein H, Wu L, Shortman K. CD4 and CD8 expression by dendritic cell subtypes in mouse thymus and spleen. J Immunol 2000;164:2978-2986. 54. Reis e Sousa C, Hieny S, Scharton-Kersten T, Jankovic D, Charest H, Germain R et al. In vivo microbial stimulation induces rapid CD40 ligand-independent production of interleukin 12 by dendritic cells and their redistribution to T cell areas. J Exp Med 1997;186(11):1819-1829. 55. Johansson C, Kelsall B. Phenotype and function of intestinal dendritic cells. Semin Immunol 2005;17:284-294. 56. Matta B, Castellaneta A, Thomson A. Tolerogenic plasmacytoid DC. Eur J Immunol 2010;40:1-10. 57. Pulendran B, Maraskovsky E, Banchereau J, Maliszewski C. Modulating the immune response with dendritic cells and their growth factors. Trends Immunol 2001;22:41-47. 58. Nelson P, John R. Dendritic cells in the kidney. J Am Soc Nephrol 2007;18:2628-2635. 59. Soos T, Sims T, Barisoni L, Lin K, Littman D, Dustin M et al. CX3CR1+ interstitial dendritic cells form a contiguous network throughout the entire kidney,. Kidney Int 2006;70:591-596. 60. Dong X, Swaminathan S, Bachman L, Croatt A, Nath K, Griffin M. Resident dendritic cells are the predominant TNF-secreting cell in early renal ischemia-reperfusion injury. Kidney Int 2007;71:619-628. 61. Rescigno M, Di Sabatino A. Dendritic cells in intestinal homeostasis and disease. J Clin Invest 2009;119:2441-2450. 62. Merad M, Manz M, Karsunky H, Wagers A, Peters W, Charo I et al. Langerhans cells renew in the skin throughout life under steady-state conditions. Nat Immunol 2002;3:1135-1141. 63. Geissmann F. The origin of dendritic cells. Nat Immunol 2007;8:558-560. 64. Liu K, Waskow C, Liu X, Yao K, Hoh J, Nussenweig M. Origin of dendritic cells inperipheral lymphoid organs of mice. Nat Immunol 2007;8:578-583. 65. Naik S, Metcalf D, van Nieuwenhuijze A, Wicks I, Wu L, O'Keeffe M et al. Intrasplenic steady-state dendritic cell precursors that are distinct from monocytes. Nat Immunol 2006;7:663-671. 66. Donskoy E, Goldschneider I. Two developmentally distinct populations of dendritic cells inhabit that adult mouse thymus: demonstration by differential importation of hematogenous precursors under steady state conditions. J Immunol 2003;170:3514-3521. 67. Asselin-Pasturel C, Trincheri G. Production of type I interferons: plasmacytoid dendritic cells and beyond. J Exp Med 2005;202(4):461-465. 68. Björck P. Isolation and characterisation of plasmacytoid dendritic cells from Flt3 ligand and granulocyte-macrophage colony stimulating factor-treated mice. Blood 2001;98(13):3520-3526.

310
69. Cisse B, Caton M, Lehner M, Maeda T, Scheu S, Locksley R et al. Transcription factor E2-2 is an essential and specific regulator of plasmacytoid dendritic cell development. Cell 2008;135:37-48. 70. Zuniga E, McGavern D, Pruneda-Paz J, Teng C, Oldstone M. Bone marrow plasmacytoid dendritic cells can differentiate into myeloid dendritic cells upon virus infection. Nat Immunol 2004;5:1227-1234. 71. Colonna M, Trinchieri G, Liu Y. Plasmacytoid dendritic cells in immunity. Nat Immunol 2004;5:1219--1226. 72. Iwasaki A, Medzhitov R. Toll-like receptor control of the adaptive immune responses. Nat Immunol 2004;5:987-995. 73. Takeda K, Kaisho T, Akira S. Toll-like receptors. Ann Rev Immunol 2003;21:335-376. 74. Diebold S, Kaisho T, Hemmi H, Akira S, Reis E. Innate antiviral responses by means of TLR7-mediated recognition of single-stranded RNA. Science 2004;303:1529-1531. 75. Chan C, Crafton E, Fan H, Flook J, Yoshimura K, Skarica M et al. Interferon-producing killer dendritic cells provide a link between innate and adaptive immunity. Nat Med 2006;12:207-213. 76. Taieb J, Cahput N, Menard C, Apetoh L, Ullrich E, Bonmort M et al. A novel dendritic cell subset involved in tumor immunosurveillance. Nat Med 2006;12:214-219. 77. Ginhoux F, Tacke F, Angeli V, Bogunovic M, Loubeau M, Dai X et al. Langerhans cells arise from monocytes in vivo. Nat Immunol 2006;7:265-273. 78. Leon B, Lopez-Bravo M, Ardavin C. Monocyte-derived dendritic cells formed at the infection site control the induction of protective T helper 1 responses against Leishmania. Immunity 2007;26:519-531. 79. Tacke F, Randolph G. Migratory fate and differentiation of blood monocyte subsets. Immunobiology 2006;211:609-618. 80. Yrlid U, Jenkins C, MacPherson G. Relationships between distinct blood monocyte subsets and migrating intestinal lymph dendritic cells in vivo under steady-state conditions. J Immunol 2006;176:4155-4162. 81. Grouard G, Durand I, Filgueira L, Banchereau J, Liu Y-J. Dendritic cells capable of stimulating T cells within germinal centres. Nature 1996;384:364-367. 82. Shortman K, Liu Y. Mouse and human dendritic cell subtypes. Nat Rev Immunol 2002;2:151-161. 83. Kogelberg H, Feizi T. New structural insights into lectin-type proteins of the immune system. Curr Opin Struct Biol 2001;11(5):635-643. 84. Wintergerst E, Manz-Keinke H, Plattner H, Schlepper-Schäfer J. The interaction of a lung surfactant protein (SP-A) with macrophages is mannose dependent. Eur J Cell Biol 1989;50(2):291-298. 85. Sallusto F, Cella M, Danieli C, Lanzavecchia A. Dendritic cells use macropinocytosis and the mannose receptor to concentrate macromolecules in the major histocompatibility complex class II compartment: down regulation by cytokines and bacterial products. J Exp Med 1995;182:389-400. 86. Stahl P, Ezekowitz R. The mannose receptor is a pattern recognition receptor involved in host defense. Curr Opin Immunol 1998;10(1):50-55.
311
87. Jiang W, Swiggard W, Heufler C, Peng M, Mirza A, Steinman R et al. The receptor DEC-205 expressed by dendritic cells and thymic epithelial cells is involved in antigen processing. Science 1995;375:151-154. 88. Engering A, Geijtenbeek T, van vliet S, Wijers M, van Liempt E, Demaurex N et al. The dendritic cells-specific adnesion receptor DC-SIGN internalises antigen for presentation to T cells. J Immunol 2002;168:2118-2126. 89. Geijtenbeek T, Krooshoop D, Bleijs D, van vliet S, van duijnhoven G, Grabovsky V et al. DC-SIGN-ICAM-2 interaction mediates dendritic cells trafficking. Nat Immunol 2000;1:353-357. 90. Osugi Y, Vuckovic S, Hart D. Myeloid blood CD11c+ dendritic cells and monocyte-derived dendritic cells differ in their ability to stimulate T lymphocytes. Blood 2002;100:2858-2866. 91. Geijtenbeek T, van Vliet S, van Duijnhoven G, Adema G, van Kyook Y, Figdor C. Identification of DC-SIGN, a novel dendritic cell-specific ICAM-3 receptor that supports primary immune responses. Cell 2000;100:575-585. 92. van kyook Y, Geijtenbeek T. DC-SIGN: escape mechanism for pathogens. Nat Rev Immunol 2003;3(9):697-709. 93. Dzionek A, Fuchs A, Schmidt P, Cremer S, Zysk M, Miltenyi S et al. BDCA-2, BDCA-3, and BDCA-4: Three markers for distinct subsets of dendritic cells in human peripheral blood. J Immunol 2000;165:6037-6046. 94. Rossi M, Young J. Human dendritic cells: potent antigen-presenting cells at the crossroads of innate and adaptive immunity. J Immunol 2005;175:1373-1381. 95. MacDonald K, Munster D, Clark G, Dzionek A, Schmitz J, Hart D. Characterization of human blood dendritic cell subsets. Blood 2002;100:4512-4520. 96. de Saint-Vis B, Vincent J, Vandenabeele S, Vanbervliet B, Pin J-J, Aït-Yahia S et al. A novel lysosome-associated membrane glycoprotein, DC-LAMP, induced upon DC maturation, is trasiently expressed in MHC class II compartment. Immunity 1998;9:325-336. 97. Mosialos G, Birkenbach M, Ayehunie S, Matsumura F, Pinkus G, Kieff E et al. Circulating human dendritic cells differentially express high levels of a 55-kd actin-bundling protein. . Am J Pathol 1996;148(593-600). 98. Banchereau J, Briere F, Caux C, Davost J, Lebecque S, Lui Y-J et al. Immunobiology of dendritic cells. Ann Rev Immunol 2000;18(767-811). 99. Bunnell S, Hong D, Kardon J, Yamazaki T, McGlade C, Barr V et al. T cell receptor ligation induces the formation of dynamically regulated signaling assemblies. J Cell Biol 2002;158:1263-1275. 100. Huppa J, Davis M. T-cell-antigen recognition and the immunological synapse. Nat Rev Immunol 2003;3(12):973-983. 101. Monks C, Freiberg B, Kupfer H, Sciaky N, Kupfer A. Three-dimensional segregation of supramolecular activation clusters in T cells. Nature 1998;395:82-86. 102. Salomon B, Lenschow D, Rhee L, Ashourian N, Singh B, Sharpe A et al. B7/CD28 costimulation is essential for the homeostasis of the CD4+CD25+ regulatory T cells that control autoimmune diabetes. Immunity 2000;12:431-440. 103. Grohmann U, Orabona C, Fallarino F, Vacca C, Calcinaro F, Falorni A et al. CTLA4-Ig regulates tryptophan catabolism in vivo. Nat Immunol 2002;3:1097-1101.
312
104. Hart DN, Fabre JW. Localisation of MHC antigens in long surviving rat renal allografts: probable implication of passenger leukocytes in graft adaptation. Transplant Proc 1981;9(1):95-99. 105. Larsen C, Morris P, Austyn J. Migration of dendritic leukocytes from cardiac allografts into host spleens. A novel pathway for initiation of rejection. J Exp Med 1990;171:307-314. 106. Sonderbye L, Meehan S, Palsson R, Ahsan N, Ladefoged J, Langhoff E. Immunohistochemical study of actin binding protein (p55) in the human kidney. Transplantation 1998;65:1004-1008. 107. Benichou G, Valujskikh A, Heeger PS. Contributions of direct and indirect T cell alloreactivity during allograft rejection in mice. J Immunol 1999;162:352-358. 108. Jiang S, Herrera O, Lechler R. New spectrum of allorecognition pathways: implications for graft rejection and transplantation tolerance. Curr Opin Immunol 2004;16:550-557. 109. Baker R, Hernandez-Fuentes M, Brookes P, Chaudhry A, Cook H, Lechler R. Loss of direct and maintenance of indirect alloresponses in renal allograft recipients: implications for the pathogenesis of chronic allograft nephropathy. J Immunol 2001;167:7199-7206. 110. Auchincloss H, Jr., Lee R, Shea S, Markowitz J, Grusby M, Glimcher L. The role of "indirect" recognition in initiating rejection of skin grafts from major histocompatibility complex class II-deficient mice. Proc Natl Acad Sci U S A 1993;90:3373-3377. 111. Smyth L, Afzali B, Tsang J, Lombardi G, Lechler R. Intercellular transfer of MHC and immunological molecules: molecular mechanisms and biological significance. Am J Transplant 2007;7:1442-1449. 112. Rogers N, Matthew T, Kausman J, Kitching A, Coates P. Kidney dendritic cells: their role in homeostasis, inflammation and transplantation. Nephrology 2009;14:625-635. 113. McKenzie J, Beard M, Hart D. The effect of donor pretreatment on interstitial dendritic cell content and rat cardiac allograft survival. Transplantation 1984;38(4):371-376. 114. Faustman D, Steinman R, Gebel H, Hauptfeld V, Davie J, Lacy P. Prevention of rejection of murine islet allografts by pretreatment with anti-dendritic cells antibody. Proc Natl Acad Sci 1984;81(12):3864-3868. 115. Gores P, Sutherland D, Platt J, Bach F. Depletion of donor Ia+ cells before transplantation does not prolong islet allograft survival. J Immunol 1986;137(5):1482-1485. 116. Lechler RI, Batchelor JR. Restoration of immunogenicity to passenger cell depleted kidney allografts by the addition of donor strain dendritic cells. JExpMed 1982;155:31-41. 117. Athanassopoulos P, Vaessen L, Maat A, Balk A, Weimar W, Bogers A. Peripheral blood dendritic cells in human end-stage heart failure and the early post-transplant period: evidence for systemic Th1 immune responses. Eur J Cardiothorac Surg 2004;25(4):619-626. 118. Hackstein H, Renner F, Bohnert A, Nockher A, Frommer T, Bein G et al. Dendritic cell deficiency in the blood of kidney transplant patients on long-term immunosuppression: results of a prospective matched-cohort study. Am J Transplant 2005;5:2945-2953. 119. Athanassopoulos P, Vaessen L, Maat A, Zondervan P, Balk A, Bogers A et al. Preferential depletion of blood myeloid dendritic cells during acute cardiac allograft rejection under controlled immunosuppression. Am J Transplant 2005;5:810-820.

313
120. Rondelli D, Abbasian J, Arpinati M, Panaro F, Porubsky M, Manzelli A et al. Different reconstitution of peripheral blood pymphocytes and dendritic cells in liver and kidney transplant patients. Transplant Proc 2005;37:49-50. 121. Steptoe R, Patel R, Subbotin V, Thomson A. Comparative analysis of dendritic cell density and total number in commonly transplanted organs: morphometric estimation in normal mice. Transpl Immunol 2000;8(1):49-56. 122. Qian S, Lu L, Fu F, Li W, Fan P, Steptoe RJ et al. Donor pretreatment with Flt-3 ligand augments antidonor cytotoxic T lymphocyte, natural killer cell, and lymphokine-activated killer cell activities within liver allografts and alters the pattern of intragraft apoptotic activity. Transplantation 1998;65:1590-1598. 123. Steptoe R, Fu F, Li W, Drakes M, Lu L, Demetris A et al. Augmentation of dendritic cells in murine organ donors by Flt3 ligand alters the balance between transplant tolerance and immunity. J Immunol 1997;159:5483-5491. 124. Woltman A, de Fijter JW, Zuidwijk K, Vlug A, Bajema I, van der Kooij S et al. Quantification of dendritic cell subsets in human renal tissue under normal and pathological conditions. Kid Int 2007;71:1001-1008. 125. Ysebaert D, De Greef K, Vercauteren S, Ghielli M, Verpooten G, Eyskens E et al. Idenitification and kinetics of leukocytes after severe ischaemia/reperfusion injury. Nephrol Dial Transplant 2000;15(10):1562-1574. 126. Penfield J, Wang Y, Li S, Kielar M, Sicher S, Jeyarajah D et al. Transplant surgery injury recruits recipient MHC class II-positive leukocytes into the kidney. Kid Int 1999;56:1759-1769. 127. Schlichting C, Schareck W, Weis M. Renal Ischaemia-Reperfusion Injury: new implications of dendritic cell-endothelial cell interactions. Transplant Proc 2006;38:670-673. 128. Dong X, Swaminathan S, Bachman L, Croatt A, Nath K, Griffin M. Resident dendritic cells are the predominant TNF-secreting cell in early renal ischaemia-reperfusion injury. Kid Int 2007;71:619-628. 129. van Kooten C, Daha M, Van Es L. Tubular epithelial cells: a critical cell type in the regulation of renal inflammatory processes. Exp Nephrol 1999;7:429-437. 130. Shimizu Y, Murata H, Kashii Y, Hirano K, Kunitani H, Higuchi K et al. CC-chemokine receptor 6 and its ligand macrophage inflammatory protein 3alpha might be involved in the amplification of local necroinflammatory response in the liver. Hepatology 2001;34(311-19). 131. Woltman A, de Fijter J, van der Kooij S, Jie K, Massacrier C, Caux C et al. MIP-3�/CCL20 in renal transplantation and its possibel involvement as dendritic cell chemoattractant in allograft rejection. Am J Transplant 2005;5:2114-2125. 132. Huang F, Platt N, Wykes M, Major J, Powell T, Jenkins C et al. A discrete subpopulation of dendritic cells transports apoptotic intestinal epithelial cells to T cell areas of mesenteric lymph nodes. J Exp Med 2000;191(3):435-444. 133. Harshyne L, Watkins S, Gambotto A, Barratt-Boyes S. Dendritice cells acquire antigens from live cells for cross-presentation to CTL. J Immunol 2003;166:3717-3723. 134. Hawiger D, Inaba K, Dorsett Y, Guo M, Mahnke K, Rivera M et al. Dendritic cells induce peripheral T cell unresponsiveness under steady state conditions in vivo. J Exp Med 2001;194(6):769-779. 135. Sauter B, Albert M, Franciso L, Larrson M, Somersan S, Bhardwaj N. Consequences of cell death: exposure to necrotic tumor cells, but not primary tissue cells or

314
apoptotic cells, induces the maturation of immunostimulatory dendritic cells. J Exp Med 2000;191:423-433. 136. Coates PT, Thomson AW. Dendritic cells, tolerance induction and transplant outcome. Am J Transplant 2002;2(4):299-307. 137. Peugh W, Austyn J, Carter N, Wood K, Morris P. Inability of dendritic cells to prevent the blood transfusion effect in a mouse cardiac allograft model. Transplantation 1987;44(5):706-711. 138. Demetris A, Murase N, Starzl T. Donor dendritic cells after liver and heart allotransplantation under short-term immunosuppression. Lancet 1992;339(8809):1610. 139. Lu L, Rudert W, Qian S, McCaslin D, Fu F, Rao A et al. Gowth of donor-derived dendritic cells from the bone marrow of murine liver allograft recipients in response to granulocyte/macrophage colony-stimulating factor. J Exp Med 1995;182(2):379-387. 140. Josien R, Heslan M, Brouard S, Soulillou J, Cuturi M. Critical requirement for graft passenger leukocytes in allograft tolerance induced by donor blood transfusion. Blood 1998;92(12):4539-4544. 141. Gillet M, Liu Y. Generation of human CD8 T regulatory cells by CD40 ligand-activated plasmacytoid dendritic cells. J Exp Med 2002;195:695-704. 142. Moseman E, Liang X, Dawson A, Panoskaltsis-Mortari A, Krieg A, Liu Y et al. Human plasmacytoid dendritic cells activated by CpG oligonucletodies induce the generation of CD4+CD25+ regulatory T cells. J Immunol 2004;173:4433-4442. 143. Sharma M, Baban B, Chandler P, Hou D, Singh N, Yagita H et al. Plasmacytoid dendritic cells from mouse tumor-draining lymph nodes activate mature Tregs via indoleamine 2,3-dioxygenase. J Clin Invest 2007;117:2570-2582. 144. Abe M, Wang Z, de Creus A, Thomson A. Plasmacytoid dendritic cell precursors induce allogeneic T-cell hyporesponsiveness and prolong heart graft survival. Am J Transplant 2005;5:1808-1819. 145. Bjorck P, Coates P, Wang Z, Duncan F, Thomson A. Promotion of long-term heart allograft survival by combination of mobilized donor plasmacytoid dendritic cells and anti-CD154 monoclonal antibody. J Heart Lung Transplant 2005;24:1118-1120. 146. Fu F, Li Y, Qian S, Lu L, Chambers F, Starzl T et al. Costimulatory molecule-deficient dendritic cell progenitors (MHC class II+, CD80dim, CD86-) prolong cardiac allograft survival in nonimmunosuppressed recipients. Transplantation 1996;62(5):659-665. 147. Pêche H, Trinité B, Martinet B, Cuturi M. Prolongation of heart allograft survival by immature dendritic cells generated from recipient type bone marrow progenitors. Am J Transplant 2005;5(2):255-267. 148. Lutz M, Suri R, Niimi M, Ogilvie A, Kukutsch N, Rößner S et al. Immature dendritic cells generated with low doses of GM-CSF in the absence of IL-4 are maturation resistant and prolong allograft survival in vivo. Eur J Immunol 2000;30(7):1813-1822. 149. Beriou G, Peche H, Guillonneau C, Merieau E, Cuturi M. Donor-specific allograft tolerance by administration of recipient-derived immature dendritic cells and suboptimal immunosuppression. Transplantation 2005;79(8):969-972. 150. Albert M, Jegasthesan M, Darnell R. Dendritic cell maturation is required for cross-tolerization of CD8+T cells. Nat Immunol 2001;2:1010-1017. 151. Verhasselt V, Vosters O, Beuneu C, Nicaise C, Stordeur P, Goldman M. Induction of FOXP3-expressing regulatory CD4pos T cells by human mature autologous dendritic cells. Eur J Immunol 2004;34(3):762-772.

315
152. Morelli A, Thomson A. Tolerogenic dendritic cells and the quest for transplant tolerance. Nat Rev Immunol 2007;7:610-621. 153. Lu L, McCaslin D, Starzl T, Thomson A. Bone marrow-derived dendritic cell progenitors (NLDC 145+, MHC class II+, B7-1dim, B7-2-) induce alloantigen-specific hyporesponsiveness in murine T lymphocytes. Transplantation 1995;60:1539-1545. 154. Yamazaki S, Iyoda T, Tarbell K, Olson K, Velinzon K, Inaba K et al. Direct expansion of functional CD25+CD4+ regulatory T cells by antigen-processing dendritic cells. J Exp Med 2003;198(2):235-247. 155. Fu F, Li Y, Qian S, Lu L, Chambers F, Starzl T et al. Costimulatory molecule-deficient dendritic cell progenitors (MHC class II+,CD80dim, CD86-) prolong cardiac allograft survival in nonimmunosuppressed recipients. Transplantation 1996;62:659-665. 156. Peche H, Trinite B, Martinet B, Cuturi M. Prolongation of heart allograft survival by immature dendritic cells generated from recipient type bone marrow progenitors. Am J Transplant 2003;5:255-267. 157. Mennechet F, Uze G. Interferon lambda-treated dendritic cells specifically induce proliferation of FOXP3-expressing suppressor T cells. Blood 2006;107:4417-4423. 158. Chorny A, Gonzalez-Rey E, Fernandez-Martin A, Pozo D, Ganea D, Delgardo M. Vasoactive intestinal peptide induces regulatory dendritic cells with therapeutic effects on autoimmune disorders. Proc Natl Acad Sci 2005;102:13562-13567. 159. Rutella S, Bonanno G, Procoli A, Mariotti A, de Ritis D, Curti A et al. Hepatocyte growth factor favors monocyte differentiation into regulatory interleukin (IL)-10++IL-12low/neg accessory cells with dendritic-cell features. Blood 2006;108:218-227. 160. Brandt K, Bulfone-Paus S, Foster D, Ruckert R. Interleukin-21 inhibits dendritic cell activation and maturation. Blood 2003;102:4090-4098. 161. Lutz M, Girolomoni G, Ricciardi-Castagnoli P. The role of cytokines in functional regulation and differentiation of dendritic cells. Immunobiology 1996;195:431-455. 162. Caux C, Maasacrier C, Vanbervliet B, Barthelemy C, Liu Y, Banchereau J. Interleukin 10 inhibits the primary allogeneic T cell response to human epidermal Langerhans cells. Int Immunol 1994;6:1177-1185. 163. Bonham C, Lu L, Banas R, Fontes P, Rao A, Starzl T et al. TGF-beta 1 pre-treatment impairs the allostimulatory function of human bone marrow-derived antigen-presenting cells for both naive and primed T cells. Transpl Immunol 1996;4:186-191. 164. Steinbrink K, Wölfl M, Jonuleit H, Knop J, Enk A. Induction of tolerance by IL-10-treated dendritic cells. J Immunol 1997;159:4772-4780. 165. Ludewig B, Odermatt B, Landmann S, Hengartner H, Zinkernagel R. Dendritic cells induce autoimmune diabetes and maintain disease via de novo formation of local lymphoid tissue. J Exp Med 1998;188(8):1493-1501. 166. De Smedt T, Van Mechelen M, De Becker G, Urbain J, Leo O, Moser M. Effect of interleukin-10 on dendritic cell maturation and function. Eur J Immunol 1997;27(5):1229-1235. 167. Iwasaki A, Kelsall B. Freshly isolated Peyer's patch, but not spleen, dendritic cells produce interleukin 10 and induce the differentiation of T helper type 2 cells. J Exp Med 1999;190:229-239. 168. Khanna A, Morelli A, Zhong C, Takayama T, Lu L, Thomson A. Effectls of liver-derived dendritic cell progenitors on Th1- and Th2-like cytokine responses in vitro and in vivo. J Immunol 2000;160:1346-1354.
316
169. Macatonia S, Doherty T, Knight S, O'Garra A. Differential effect of IL-10 on Dendritic cell-induced T cell proliferation and IFN-y production. J Immunol 1993;150(9):3755-3765. 170. De Smedt T, van Mechelen M, De Becker G, Urbain J, Leo O, Moser M. Effect of interleukin-10 on dendritic cell maturation and function. Eur J Immunol 1997;27(5):1229-1235. 171. Steinbrink K, Wolfl M, Jonuleit H, Knop J, Enk A. Induction of tolerance by IL-10-treated dencritic cells. J Immunol 1997;159:4772-4780. 172. Asseman C, Mauze S, Leach M, Coffman R, Powrie F. An essential role for interleukin 10 in the function of regulatory T cells that inhibit intestinal inflammation. J Exp Med 1999;190:995-1004. 173. Moore K, de Waal Malefyt R, Coffman R, O'Garra A. Interluekin-10 and the interleukin-10 receptor. Ann Rev Immunol 2001;19:683-765. 174. de Waal Malefyt R, Yssel H, Roncarolo M, Spits H, de Vries J. Interleukin-10. Curr Opin Immunol 1992;4:314-320. 175. Holler E, Roncarolo M, Hintermeier-Knabe R, Eissner G, Ertl B, Schultz U et al. Prognostic significance of increased IL-10 production in patients prior to allogeneic bone marrow transplantation. Bone Marrow Transplant 2000;25:237-241. 176. Hempel L, Korholz D, Nussbaum P, Bonig H, Burdach S, Zintl F. High interleukin-10 serum levels are associated with fatal outcome in patients after bone marrow transplantation. Bone Marrow Transplant 1997;20:365-368. 177. Qian S, Li W, Li Y, Fu F, Lu L, Fung J et al. Systemic administration of cellular interleukin-10 can exacerbate cardiac allograft rejection in mice. Transplantation 1996;62(12):1709-1714. 178. Li W, Fu F, Lu L, Narula S, Fung J, Thomson A et al. Recipient pre-treatment with mammalian IL-10 prolongs mouse cardiac allograft survival by inhibition of anti-donor T cell responses. Transplant Proc 1999;31:115. 179. Yamaguchi Y, Tsumura H, Miwa M, Inaba K. Contrasting effects of TGF-beta 1 and TNF-alpha on the development of dendritic cells from progenitors in mouse bone marrow. Stem Cells 1997;15:144-153. 180. Wallet M, Sen P, Tisch R. Immunoregulation of dendritic cells. CM&R 2005;3:166-175. 181. Fainaru O, Woolf E, Lotem J, Yarnus M, Brenner O, Goldenberg D et al. RunX3 regulates mouse TGF-beta-mediated dendritic cell function and its absence results in airway inflammation. EMBO J 2004;23:969-979. 182. Sun W, Wang Q, Zhang L, Pan J, Zhang M, Lu G et al. TGF-beta(1) gene modified immature dendritic cells exhibit enhanced tolerogenicity but induce allograft fibrosis in vivo. J Mol Med 2002;80:514-523. 183. Matasic R, Dietz A, Vuk-Pavlovic S. Dexamethasone inhibits dendritic cell maturation by redirecting differentiation of a subset of cells. J Leukoc Biol 1999;66:909-914. 184. Piemonti L, Monti P, Allavena P, Sironi M, Soldini L, Leone B et al. Glucocorticoids affect human dendritic cell differentiation and maturation. J Immunol 1999;162:6473-6481. 185. Matyszak M, Citterio S, Rescigno M, Ricciardi-Castagnoli P. Differential effects of corticosteroids during different stages of dendritic cell maturation. Eur J Immunol 2000;30:1233-1242.

317
186. Rea D, van Kooten C, van Mejgaarden K, Ottenhoff T, Melief C, Offringa R. Glucocorticoids transform CD40-triggering of dendritic cells into an alternative activation pathway resulting in antigen-presenting cells that secrete IL-10. Blood 2000;95(10):3162-3167. 187. Hewison M, Freeman L, Hughes S, Evans K, Bland R, Eliopoulos A et al. Differential regulation of vitamin D receptor and its ligand in human monocyte-derived dendritic cells. J Immunol 2003;170(11):5382-5390. 188. Griffin M, Lutz W, Phan V, Bachman L, McKean D, Kumar R. Dendritic cell modulation by 1a, 25 dihydroxyvitamin D3 and its analogues: a Vitamin D receptor-dependent pathway that promotes a persistent state of immaturity in vitro and in vivo. Proc Natl Acad Sci U S A 2001;98:6800-6805. 189. Gregori S, Casorati M, Amuchastegui S, Smiroldo S, Davalli A, Adorini L. Regulatory T cells induced by 1�, 25-dihydroxyvitamin D3 and mycophenolate mofetil treatment mediate transplant tolerance. J Immunol 2001;167:1945-1953. 190. Hackstein H, Thomson A. Dendritic cells: emerging pharmacological targets of immunosuppressive drugs. Nature Rev Immunol 2004;4:24-34. 191. Kiani A, Rao A, Aramburu J. Manipulating immune responses with immunosuppressive agents that target NFAT. Immunity 2000;12:359-372. 192. Groettrup M, Soza A, Eggers M, Kuehn L, Dick T, Schild H et al. A role for the proteosome regulator PA28� in antigen presentation. Nature 1996;381:166-168. 193. Hackstein H, Taner T, Logar A, Thomson A. Rapamycin inhibits macropinocytosis and mannose receptor-mediated endocytosis by bone marrow-derived dendritic cells. Blood 2002;100:1084-1087. 194. Tajima K, Amakawa R, Ito T, Miyaji M, Takebayashi M, Furuhara S. Immunomodulatory effects of cyclosporin A on human peripheral blood dendritic cell subsets. Immunology 2003;108:321-328. 195. Duperrier K, Farre A, Bienvenu J, Bleyzac N, Bernard J, Gebuhrer L et al. Cyclosporin A inhibits dendritic cell maturation promoted by TNF� or LPS but not by double-stranded RNA or CD40L. J Leukoc Biol 2002;72:953-961. 196. Szabo G, Gavala C, Mandrekar P. Tacrolimus and cyclosporine A inhibit allostimulatory capacity and cytokine production of human myeloid dendritic cells. J Investig Med 2001;49:442-449. 197. Hackstein H, Taner T, Zahorchak A, Morelli A, Logar A, Gessner A et al. Rapamycin inhibits IL-4-induced dendritic cell maturation in vitro and dendritic cell mobilization and function in vitro. Blood 2003;101:4457-4463. 198. Turnquist H, Raimondi G, Zahorchak A, Fischer R, Wang Z, Thomson A. Rapapmycin-conditioned dendritic cells are poor stimulators of allogeneic CD4+ T cells, but enrich for antigen-specific FoxP3+ T regulatory cells and promote organ transplant tolerance. J Immunol 2007;178:7018-7031. 199. Li Y, Li X, Zheng X, Wells A, Turka L, Strom T. Blocking both signal 1 and signal 2 of T-cell activation prevents apoptosis of alloreactive T cells and induction of peripheral allograft tolerance. Nat Med 1999;5:1298-1302. 200. Shirasugi N, Aramaki O, Hatano M, Suda H, Tanaka K, Inoue F et al. Synergistic effect of 15-deoxyspergualin associates with donor-specific indirect pathway unresponsiveness. Transplant Proc 2004;36:2446-2447.
318
201. Yang J, Bernier S, Ichim T, Li M, Xia X, Zhou D et al. LF15-0195 generates tolerogenic DC by suppression of NF-�B signaling through inhibition of IKK activity. J Leukoc Biol 2003;74:438-447. 202. Min W, Zhou D, Ichim T, Strejan G, Xia X, Yang J et al. Inhibitory feedback loop between tolerogenic dendritic cells and regulatory T cells in transplant tolerance. J Immunol 2003;170:1304-1312. 203. Martin E, O'Sullivan B, Low P, Thomas R. Antigen-specific suppression of a primed immune response by dendritic cells mediated by regualtory T cells secreting interluekin-10. Immunity 2003;18:155-167. 204. Matasic R, Dietz A, Vuk-Pavlovic S. Cyclooxygenase-independent inhibition of dendritic cell maturation by aspirin. Immunology 2000;101:53-60. 205. Verhasselt V, Vanden Berghe W, Vanderheyde N, Willems F, Haegeman G, Goldman M. N-acetyl-L-cysteine inhibits primary human T-cell responses at the dendritic cell level: association with NF-�B inhibition. J Immunol 1999;162:2569-2574. 206. Steinschulte C, Taner T, Thomson A, Bein G, Hackstein H. Cutting edge: sanglifherin A, a novel cyclophilin-binding immunsuppressant blocks bioactive IL-12 production by human dendritic cells. J Immunol 2003;171:542-546. 207. Mehling A, Garabbe S, Voskort M, Schwarz T, Luger T, Belssert S. Mycophenolate mofetil impairs the maturation and function of murine dendritic cells. J Immunol 2000;165:2374-2381. 208. Thery C, Zitvogel L, Amigorena S. Exosomes: composition, biogenesis and function. Nat Rev Immunol 2002;2:569-579. 209. Thery C, Regnault A, Garin J, Wolfers J, Zitvogel L, Ricciardi-Castagnoli P et al. Molecular characterization of dendritic-cell-derived exosomes. Selective accumulation of the heat-shock protein hsc73. J Cell Biol 1999;147:599-610. 210. Thery C, Boussac M, Veron P, Ricciardi-Castagnoli P, Raposo G, Garin J et al. Proteomic analysis of dendritic-cell-derived exosomes: a secreted subcellular compartment distinct from apoptotic vesicles. J Immunol 2001;166:7309-7318. 211. Morelli A, Larregina A, Shufesky W, Sullivan M, Stolz D, Papworth G et al. Endocytosis, intracellular sorting, and processing of exosomes by dendritic cells. Blood 2004;104:3257-3266. 212. Karlsson M, Lundin S, Dahlgren U, Kahu H, Petersson I, Telemo E. "Tolerosomes" are produced by intestinal epithelial cells. Eur J Immunol 2001;31:2892-2900. 213. Peche H, Renausin K, Beriou G, Merieau E, Amigorena S, Cuturi M. Induction of tolerance by exosomes and short-term immunosuppression in a fully MHC-mismatched rat cardiac allograft model. Am J Transplant 2006;6:1541-1550. 214. Huang F, Platt N, Wykes M, Major J, Powell T, Jenkins C et al. A discrete subpopulation of dendritic cells transports apoptotic intestinal epithelial cells to T cell areas of mesenteric lymph nodes. J Exp Med 2000;191:435-443. 215. Steinman R, Turley S, Mellman I, Inaba K. The induction of tolerance by dendritic cells that have captured apoptotic cells. J Exp Med 2000;191:411-416. 216. Sauter B, Albert M, Francisco L, Larsson M, Somersan S, Bhardwaj N. Consequences of cell death: exposure to necrotic tumor cells, but not primary tissue cells or apoptotic cells, induces the maturation of immunostimulatory dendritic cells. J Exp Med 2000;191:423-433.
319
217. Sen P, Wallet M, Yi Z, Huang Y, Henderson M, Mathews C et al. Apoptotic cells induce Mer tyrosine kinase-dependent blockade of NF-�B activation in dendritic cells. Blood 2007;108:653-660. 218. Morelli A, Larregina A, Shufesky W, Zahorchak A, Logar A, Papworth G et al. Internalization of circluating apoptotic cells by splenic marginal zone dendritic cells: dependence on complement receptors and effect on cytokine production. Blood 2003;101:611-620. 219. De Carvalho Bittencourt M, Perruche S, Contassot E, ******. Intravenous injection of apoptotic leukocytes enhances bone marrow engraftment across major histocompatibility barriers. Blood 2001;98:224-230. 220. Ferguson T, Herndon J, Elzey B, Griffith T, Schoenberger S, Green D. Uptake of apoptotic antigen-coupled cells by lymphoid dendritic cells and cross-priming of CD8�+ T cells produce active immune unresponsiveness. J Immunol 2002;168:5589-5595. 221. Wang Z, Larregina A, Shufesky W, Perone M, Montecalvo A, Zahorchak A et al. Use of the inhibitory effect of apoptotic cells on dendritic cells for graft survival via T-cell deletion and regulatory T cells. Am J Transplant 2006;6:1297-1311. 222. Fu C, Chuang Y, Huang Y, Chiang B. Induction of IL-10 producign CD4+ T cells with regulatory activities by stimulation with IL-10 gene-modified bone marrow derived dendritic cells. Clin Exp Immunol 2008;153:258-268. 223. Coates P, Krishnan R, Kireta S, Johnston J, Russ G. Human myeloid dendritic cells transduced with adenoviral interleukin-10 gene construct inhibit human skin graft rejection in humanized NOD-scid chimeric mice. Gene Ther 2001;8(16):1224-1233. 224. Jago C, Yates J, Camara N, Lechler R, Lombardi G. Differential expression of CTLA-4 among T cell subsets. Clin Exp Immunol 2004;136:463-471. 225. Mellor AL, Baban B, Chandler P, Marshall B, Jhaver K, Hansen A et al. Cutting edge: induced indoleamine 2,3 dioxygenase expression in dendritic cell subsets suppresses T cell clonal expansion. J Immunol 2003;171(4):1652-1655. 226. Tan PH, Yates JB, Xue SA, Chan C, Jordan WJ, Harper JE et al. Creation of tolerogenic human dendritic cells via intracellular CTLA4: a novel strategy with potential in clinical immunosuppression. Blood 2005;106(9):2936-2943. 227. Yang DF, Qiu WH, Zhu HF, Lei P, Wen X, Dai H et al. CTLA4-Ig-modified dendritic cells inhibit lymphocyte-mediated alloimmune responses and prolong the islet graft survival in mice. Transpl Immunol 2008;19(3-4):197-201. 228. Larsen C, Pearson T, Adams A, Tso P, Shirasugi N, Strobert E et al. Rational development of LEA29Y (belatacept), a high-affinity variant of CTLA4-Ig with potent immunosuppressive properties. Am J Transplant 2005;5:443-453. 229. Pfefferkorn E. Interferon-gamma blocks the growth of Toxoplasma gondii in human fibroblasts by inducing the host cell to induce tryptophan. Proc Natl Acad Sci 1984;81:908-912. 230. Yoshida R, Park S, Yasui H, Takikawa O. Tryptophan degradation in transplanted tumor cells undergoing rejection. J Immunol 1988;141:2819-2823. 231. Takikawa O, Habara-Ohkubo A, Yoshida R. IFN-� is the inducer of indoleamine 2,3-dioygenase in allografted tumor cell sundergoing rejection. J Immunol 1990;145:1246-1250. 232. Munn D, Zhou M, Attwood J, Bondarev I, Conway S, Marshall B et al. Prevention of allogeneic fetal rejection by tryptophan catabolism. Science 1998;281:1191-1193.

320
233. Babcock T, Carlin J. Synergistic transcriptional activation of indoleamine 2,3-dioxygenase in interleukin 1 and tumor necrosis factor � in interferon-treated epithelial cells. . Cytokine 2000;12:588-594. 234. Fujigaki S, Saito K, Sekikawa K, Tone S, Takikawa O, Fujii H et al. Lipopolysaccharide induction of indoleamine 2,3-dioxygenase is mediated dominantly by an IFN-� independent mechanism. Eur J Immunol 2001;31:2313-2318. 235. Fallarino F, Vacca C, Orabona C, Belladonna M, Bianchi R, Marshall B et al. Functional expression of indoleamine 2,3-dioxygenase by murine CD8�+ dendritic cells. Int Immunol 2002;14(1):65-68. 236. Grohmann U, Bianchi R, Orabona C, Fallarino F, Vacca C, Micheletti A et al. Functional plasticity of dendritic cell subsets as mediated by CD40 versus B7 activation. J Immunol 2003;171:2581-2587. 237. Yu G, Fang M, Gong M, Liu L, Zhong J, Feng W et al. Steady state dendritic cell with forced IDO expression induce skin allograft tolerance by upregulation of regulatory T cells. Transpl Immunol 2008;13:208-219. 238. Hwu P, Du M, Lapointe R, Do M, Taylor M, Young H. Indoleamine 2,3-dioxygenase production by human dendritic cells results in the inhibition of T cell proliferation. J Immunol 2000;164:3596-3599. 239. Terness P, Chuang J, Bauer T, Jiga L, Opetz G. Regulation of human auto- and alloreactive T cells by indoleamine 2,3-dioxygenase (IDO)-producing dendritic cells: too much ado about IDO. Blood 2005;105(6):2480-2486. 240. Munn D, Sharma M, Lee J, Jhaver K, Johnson T, Keskin D et al. Potential regulatory funtion of human dendritic cells expressing indoleamine 2,3-dioxygenase. Science 2002;297:1867-1870. 241. Andreakos E, Smith C, Monaco C, Brennan F, Foxwell B. Ikappa B kinase 2 but not NF-kappa B-inducing kinase is essential for effective DC antigen presentation in the allogeneic mixed lymphocyte reaction. Blood 2003;101(3):983-991. 242. Bonham C, Peng L, Liang X, Chen W, Wang L, Hackstein H et al. Marked prolongation of cardiac allograft survival by dendritic cells geneticall engineered with NF-kappa B oligodeoxyribonucleotide decoys and adenoviral vectors encoding CTLA4-Ig. J Immunol 2002;169(6):3382-3391. 243. Zahorchak A, Kean L, Tokita D, Turnquist H, Abe M, Finke J et al. Infusion of stably immature monocyte-derived dendritic cell plus CTLA4Ig modulates alloimmune reactivity in rhesus macaques. Transplantation 2007;84(2):196-206. 244. Dhodapkar MV, Steinman RM, Krasovsky J, Munz C, Bhardwaj N. Antigen-specific inhibition of effector T cell function in humans after injection of immature dendritic cells. J Exp Med 2001;193:233-238. 245. Gershon R, Kondo K. Cell interactions in the induction of tolerance - the role of thymic lymphocytes. Immunology 1970;21:723-735. 246. Shevach E. Certified professionals: CD4+CD25+ suppressor T cells. J Exp Med 2001;193:F41-45. 247. Modigliani Y, Coutinho A, Pereira P, Le Douarin N, Thomas-Vaslin V, Burlen-Defranoux O et al. Establishment of tissue-specific tolerance is driven by regulatory T cells selected by thymic epithelium. Eur J Immunol 1996;26:1807-1815. 248. Papiernik M, de Moraes M, Pontoux C, Vassuer F, Penit C. Regulatory CD4 T cells: expression of IL-2R� chain, resistance to clonal deletion and IL-2 dependency. . Int Immunol 1998;10:371-378.

321
249. Wood K, Sakaguchi S. Regulatory T cells in transplantation tolerance. Nat Rev Immunol 2003;3:199-210. 250. Sakaguchi S, Sakaguchi N, Asano M, Itoh M, Toda M. Immunologic self-tolerance maintained by activated T cells expressing IL-2 receptor �-chains (CD25). Breakdown of a single mechanism of self-tolerance causes various autoimmune diseases. J Immunol 1995;155:1151-1164. 251. Stephens L, Mottet C, Mason D, Powrie F. Human CD4+CD25+ thymocytes and peripheral T cells have immune suppression activity. Eur J Immunol 2001;31:1247-1254. 252. Itoh M, Takahashi T, Sakaguchi N. Thymus and autoimmunity: production of CD25+CD4+ naturally anergic and suppressive T cells as a key function of the thymus in maintaining immunologic self-tolerance. J Immunol 1999;162:5317-5326. 253. Thornton A, Shevach E. CD4+CD25+ immunoregulatory T cells suppress polyclonal T cell activation in vitro by inhibiting interleukin 2 production. J Exp Med 1998;188:287-296. 254. Baecher-Allan C, Brown J, Freeman G, Hafler D. CD25+CD4+ high regulatory cells in human peripheral blood. J Immunol 2001;167:1245-1253. 255. Sakaguchi S, Fukuma K, Kuribayashi K. Organ-specific autoimmune disseases induced in mice by elimination of T cell subset. I. Evidence for the active participation of T cells in natural self-tolerance; deficit of a T cell subset as a possible cause of autoimmune disease. J Exp Med 1985;161:72-87. 256. Shimizu J, Yamazaki S, Takahashi T, Ishida Y, Sakaguchi S. Stimulation of CD25+CD4+ regulatory T cells through GITR breaks immunological self-tolerance. Nature Immunol 2002;3:135-142. 257. Lehmann J, Huehn J, de la Rosa M, Maszyna F, Kretschmer U, Krenn V et al. Expression of the integrin �E�7 identifies unique subsets of CD25+ as well as CD25- regulatory T cells. . Proc Natl Acad Sci 2002;99:13031-13036. 258. Davies J, O'Connor E, Hall D, Krahl T, Trotter J, Sarvetnick N. CD4+CD45RBlow density cells from untreated mice prevent acute allograft rejection. J Immunol 1999;163:5353-5357. 259. Takahashi T, Tagami T, Yamazaki S, Uede T, Shimizu J, Sakaguchi N et al. Immunologic self-tolerance maintained by CD25+CD4+ regulatory T cells constitutively express cytotoxic T lymphocyte-associated antigen 4. J Exp Med 2000;192:303-309. 260. Hori S, Nomura T, Sakaguchi S. Control of regulatory T cell development by the transcription factor Foxp3. Science 2003;299(5609):1057-1061. 261. van Maurik A, Wood K, Jones N. Cutting edge: CD4+CD25+ alloantigen-specific immunoregulatory cells that prevent CD8+ T-cell-mediated graft rejection: implications for anti-CD154 immunotherapy. J Immunol 2002;169:5401-5404. 262. Thornton A, Shevach E. Suppressor effector function of CD4+CD25+ immunoregulatory T cells is antigen non-specific. J Immunol 2000;164:183-190. 263. Suri-Payer E, Amar A, Thornton A, Shevach E. CD4+CD25+ T cells inhibit both the induction and effector function of autoreactive T cells and represent a unique lineage of immunoregulatory cells. J Immunol 1998;160:1212-1218. 264. Hall B, Pearce N, Gurley K, Dorsch S. Specific unresponsiveness in rats with prolonged cardiac allograft survival after treatment with cyclosporine. III Further characterisation of the CD4+ suppressor cell and its mechanism of action. J Exp Med 1990;171:141-157.

322
265. Hoffman P, Ermann J, Edinger M, Fathman C, Strober S. Donor-type CD4+CD25+ regulatory T cells suppress lethal acute graft-versus-host disease aftera llogeneic bone marrow transplantation. J Exp Med 2002;196:389-399. 266. Cederbom L, Hall H, Ivers F. CD4+CD25+ regulatory T cells down-regulate co-stimulatory molecules on antigen presenting cells. Eur J Immunol 2000;30:1538-1543. 267. Jonuleit H, Schmitt E, Kakirman H, Stassen M, Knop J, Enk A. Infectious tolerance: human CD25+ regulatory T cells convey suppressor activity to conventional CD4+ T helper cells. J Exp Med 2002;196:255-260. 268. Qin S, Cobbold S, Pope H, Elliott J, Kiossis D, Davies J et al. "Infectious" transplant tolerance. Science 1993;259:974-977. 269. Madsen J, Superina R, Wood K, Morris P. Immunological unresponsiveness induced by recipient cells transfected with donor MHC genes. Nature 1988;332:161-164. 270. Jonuleit H, Schmitt E, Schuler G, Knop J, Enk A. Induction of interleukin-10 producing, nonproliferating CD4+ T cells with regulatory properties by repetitive stimulation with allogeneic immature human dendritic cells. J Exp Med 2000;192(9):1213-1222. 271. Bacchetta R, Bigler M, Touraine J, Parkman R, Tovo P, Abrams J et al. High levels of interleukin 10 production in vivo are associated with tolerance in SCID patients transplanted with HLA mismatched hematopoietic stem cells. J Exp Med 1994;179:493-502. 272. VanBuskirk A, Burlingham W, Jankowska-Gan E, Chin T, Kusaka S, Geissler F et al. Human allograft acceptance is associated with immune regulation. J Clin Invest 2000;106:145-155. 273. Kumanogoh A, Wang X, Lee I, Watanabe C, Kamanaka M, Shi W et al. Increased T cell autoreactivity in the absence of CD40-CD40 ligand interactions: a role of CD40 in regulatory T cell development. J Immunol 2001;166(1):353-360. 274. Salomon B, Lenschow D, Rhee L, Ashourian N, Singh B, Sharpe A et al. B7/CD28 costimulation is essential for the homeostasis of the CD4+CD25+ immunoregulatory T cells that control autoimmune diabetes. Immunity 2000;12(4):431-440. 275. Becker J, Brabletz T, Kirchner T, Conrad C, Bröcker E, Reisfeld R. Negative transcriptional regulation in anergic T cells. Proc Natl Acad Sci 1995;92(6):2375-2378. 276. Beverly B, Kang S, Lenardo M, Schwartz R. Reversal of in vitro T cell clonal anergy by IL-2 stimulation. Int Immunol 1992;4(6):661-671. 277. Groux H, Bigler M, de Vries J, Roncarolo M. Interleukin-10 induces a long-term antigen-specific anergic state in human CD4+ T cells. J Exp Med 1996;184:19-29. 278. Kuwana M, Kaburaki J, Wright T, Kawakami Y, Ikeda Y. Induction of antigen-specific human cd4(+) T cell anergy by peripheral blood DC2 precursors. Eur J Immunol 2001;31(9):2547-2557. 279. Steinbrink K, Jonuleit H, Müller G, Schuler G, Knop J, Enk A. Interleukin-10-treated human dendritic cells induce a melanoma-antigen-specific anergy in CD8(+) T cells resulting in a failure to lyse tumor cells. Blood 1999;93(5):1634-1642. 280. Qian S, Lu L, Fu F, Li Y, Li W, Starzl TE et al. Apoptosis within spontaneously accepted mouse liver allografts:evidence for deletion of cytotoxic T cells and implications for tolerance induction. J Immunol 1997;158:4654-4661. 281. Lu L, Li W, Zhong C, Qian S, Fung JJ, Thomson AW et al. Increased apoptosis of immunoreactive host cells and augmented donor leukocyte chimerism, not sustained inhibition of B7 molecule expression are associated with prolonged cardiac allograft
323
survival in mice preconditioned with immature donor dendritic cells plus anti-CD40L mAb. Transplantation 1999;68:747-757. 282. Takeuchi T, Lowry R, Konieczny B. Heart allografts in urine ayatems. The differential activation of Th2-like effector cells in peripheral tolerance. Transplantation 1992;53:1281-1294. 283. Arpinati M, Green C, Heimfeld S, Heuser J, Anasetti C. Granulocyte-colony stimulating factor mobilizes T helper 2-inducing dendritic cells. Blood 2000;69:221-226. 284. Coates P, Thomson A. Dendritic cells, tolerance induction and transplant outcome. Am J Transplant 2002;2(4):299-307. 285. Yu G, Xu X, Vu M, Kilpatrick E, Li X. NK promote transplant tolerance by killing donor antigen-presenting cells. J Exp Med 2006;203:1851-1858. 286. Jenne L, Schuler G, Steinkasserer A. Viral vectors for dendritic cell-based immunotherapy. Trends Immunol 2001;22(2):102-107. 287. Morelli A, Larregina A, Ganster A, Zahorchak A, Plowey J, Takayama T et al. Recombinant adenovirus induces maturation of dendritic cells via an NF-kappa-beta dependent pathway. J Virol 2000;74:9617-9628. 288. Zhong L, Granelli-Piperno A, Choi Y, Steinman R. Recombinant adenovirus is an efficient and non-perturbing genetic vector for human dendritic cells. Eur J Immunol 1999;29:964-972. 289. Bergleson J, Cunningham J, Droguett G, Kurt-Jones E, Krithivas A, Hong J et al. Isolation of a common receptor for Coxsackie B viruses and adenoviruses 2 and 5. Science 1997;275:1320-1323. 290. Shayakhmetov D, Carlson C, Stecher H, Li Q, Stamatoyannopoulos G, Lieber A. A high-capacity, capsid-modified hybrid adenovirus/adeno-associated virus vector for stabel transduction of human hematopoietic cells. J Virol 2002;76:1135-1143. 291. Coates P, Colvin B, Kaneko K, Taner T, Thomson A. Pharmacologic, biologic and genetic engineering approaches to potentiation of donor-derived dendritic cell tolerogenicity. Transplantation 2003;75(9):S32-36. 292. Bangham A, Standish M, Watkins J. Diffusion of univalent ions across the lamellae of swollen phospholipids. J Mol Biol 1965;13:238-252. 293. Gregoriadis G. The carrier potential of liposomes in biology and medicine (first of two parts). N Engl J Med 1976;295:704-710. 294. Gregoriadis G. The carrier potential of liposomes in biology and medicine (second of two parts). N Engl J Med 1976;295:765-770. 295. Dietz A, Vik-Pavlovic S. High-efficiency adenovirus-mediated gene transfer to human dendritic cells. Blood 1998;91(2):392-398. 296. Tan P, Beutelspacher S, Wang Y, McClure M, Ritter M, Lombardi G et al. Immunolipoplexes: an efficient, noviral alterantive for transfection of human dendritic cells with potential for clinical vaccination. Mol Ther 2005;11(5):790-800. 297. Ulrich A. Biophysical aspects of using liposomes as delivery vehicles. Bioscience Rep 2002;22(2):129-150. 298. Gennis R. BIiomembranes: molecular structure and function. (C Cantor ed) 1989;Springer Verlag. 299. Mouritsen O, Jorgensen K. A new look at lipid-membrane structure in relation to drug research. Pharm Res 1998;15:1507-1519.

324
300. Tielman D, Marrink S, Berendsen H. A computer's perspective of membranes: molecular dynamics studies of lipid bilayer systems. Biochim Biophys Acta 1997;1331:235-270. 301. Konigsberg P, Godtel R, Kissel T, Richer L. The development of IL-2 conjugated liposomes for therapeutic purposes. Biochim Biophys Acta 1998;1370(2):243-251. 302. Goni F, Alonso A. Spectroscopic techniques in the study of membrane solubilization, reconstitution and permeabilisation by detergents. Mol Membr Biol 2000;16:103-109. 303. Jin A, Huster D, Gawrisch K, Nossal R. Light scattering characterization of extruded lipid vesicles. Eur Biophys J 1999;28:187-199. 304. Papahadjopoulos D, Vali W, Jacobson K, Poste G. Cochleate lipid cylinders: formation by fusion of unilamellar lipid vesicles. Biochim Biophys Acta 1975;394:483-491. 305. Mayer L, Hope M, Cullis P, Janoff A. Solute and trapping efficiencies observed in freeze-thawed multilamellar vesicles. Biochim Biophys Acta 1985;817:193-196. 306. Liu D, Hu Q, Song Y. Liposome clearance from blood: different animal species have different mechanisms. Biochim Biophys Acta 1995;1240:277-284. 307. Senior J. Fate and behaviour of liposomes in vivo: a review of controlling factor. Crit Rev Ther Drug Carrier Syst 1987;3:123-193. 308. Papahadjopoulos D, Allen T, Gabzion A, Mayhew E, Matthay K, Huang S et al. Sterically stabilised liposomes: Improvements in pharmacokinetics and antitumor therapeutic efficacy. Proc Natl Acad Sci 1991;88:11460-11464. 309. Moghimi S, Szebeni J. Stealth liposomes and long circulating nanoparticles: critical issues in pharmacokinetics, opsonization and protein-binding properties. Prog Lipid Res 2003;42:463-478. 310. Gabizon A, Papahadjopoulos D. The role of surface charge and hydrophilic group son liposome clearance in vivo. Biochim Biophys Acta 1992;1103:94-100. 311. Needham D, McIntosh T, Lasic D. Repulsive interactions and mechanical stability of polymer-grafted lipid membranes. Biochim Biophys Acta 1992;1108:40-48. 312. Lasic D, Martin F, Gabizon A, Huang S, Papahadjopoulos D. Sterically stabilized liposomes: a hypothesis on the molecular origin of the extended circulation times. Biochim Biophys Acta 1991;1070:187-192. 313. Maruyama K. PEG-Immunoliposome. Bioscience Rep 2002;22(2):251-266. 314. Cheng W, Allen T. The use of single chain Fv as targeting agents for immunoliposomes: an update on immunliposomal drugs for cancer treatment. Expert Opin Drug Deliv 2010;7:461-478. 315. Altin J, Parish C. Liposomal vaccines - targeting the delivery of antigen. Methods 2006;40(1):39-52. 316. Bendas G, Rothe U, Scherphof G, Kamps J. The influence of repeated injections on pharmacokinetics and biodistribution of different types of sterically stabilized immunoliposomes. Biochim Biophys Acta 2003;1609:63-70. 317. Harding J, Engbers C, Newman M, Goldstein N, Zalipsky S. Immunogenicity and pharmacokinetic attributes of poly(ethylene glycol)-grafted immunoliposomes. Biochim Biophys Acta 1997;1327:181-192. 318. Phillips N, Dahman J. Immunogenicity of immunoliposomes: reactivity against species-specific IgG and liposomal phospholipids. Immunol Lett 1995;45:149-152.

325
319. Torchilin V. Antibody-modified liposomes for cancer chemotherapy. Expert Opin Drug Deliv 2008;5:1003-1025. 320. Altin J, Parish C. Liposomal vaccines - targeting the delivery of antigen. Methods 2006;40:39-52. 321. Rejman J, Oberle V, Zuhorn I, Hoekstra D. Size-dependent internalization of particles via the pathways of clarithrin- and caveolin-mediated endocytosis. Biochem J 2004;377:159-169. 322. Johannes L, Lamaze C. Clarithrin-dependent or not: is it still the question? Traffic 2002;3:443-451. 323. Ditto A, Shah P, Yun Y. Non-viral gene delivery using nanoparticles. Expert Opin Drug Deliv 2009;6:1149-1160. 324. Colin M, Maurice M, Trugnan G, Kornprobst M, Harbottle R, Knight A et al. Cell delivery, intracellular trafficking and expression of an integrin-mediated gene transfer vector in trachela epithelial cells. Gene Ther 2000;7:139-152. 325. Kamiya H, Tsuchiya H, Yamazaki J, Harashima H. Intracellular trafficking and transgene expression of viral and non-viral gene vectors. Adv Drug Deliv Rev 2001;52:153-164. 326. Maeda H, Sawa T, Konno T. Mechanism of tumor-targeted delivery of macromolecular drugs, including the EPR effect in solid tumor and clinical overview of the prototype polymeric drug SMANCS. J Control Release 2001;74:47-61. 327. Yuan F, Dellian M, Fukumura D, Leunig M, Berk D, Torchilin V et al. Vascular permeability in a human tumor xenograft: molecular size dependence and cutoof size. Cancer Res 1995;55:3752-3756. 328. Maeda H, Wu J, Sawa T, Martsumura Y, Hori K. Tumor vascular permeability and the EPR effect in macromolecular therapeutics: a review. J Control Release 2000;65:271-284. 329. Torchilin V. Recent advances with liposomes as pharmaceutical carriers. Nat Rev Drug Discov 2005;4:145-160. 330. Gilchrist R, Wicherek M, Heistermann M, Nayudu P, Hodges J. Changes in follicle-stimulating hormone and follicle populations during the ovarian cycle of the common marmoset. Biol Reproduct 2001;64:127-135. 331. 't Hart B, van Meurs M, Brok H, Massacesi L, Bauer J, Boon L et al. A new primate model for multiple sclerosis in the common marmoset. Immunol Today 2000;21:290-297. 332. Genain C, Hauser S. Experimental allergic encephalomyelitis in the New World monkey Callithrix jacchus. Immunol Rev 2001;183:159-172. 333. Wood J, Gulati N, Michel J, Hofbauer K. Two-kidney, one clip renal hypertension in the marmoset. J Hypertens 1986;4:251-254. 334. Soars M, Riley R, Burchell B. Evaluation of the marmoset as a model species for drug glucuronidation. Xenobiotica 2001;31:849-860. 335. Siddal R. The use of marmosets (Callithrix jacchus) in teratological and toxicological research. Prim Med 1978;10:215-224. 336. Bontrop R, dDe Groot N, Doxiadis G. Major histocompatibility complex class II polymorphisms in primates. (Genomic organisation of the MHC: Structure, Origin and Function). Immunol Rev 1999;167:339-350. 337. Kohu K, Yamabe E, Matsuzawa A, Onda D, Suemizu H, Sasaki E et al. Comparison of 30 immunity-related genes from the common marmoset with orthologues from human and mouse. Tohoku J Exp Med 2008;215:167-180.

326
338. Villinger F, Bostik P, Mayne A, King C, Genain C, Weiss W et al. Cloning, sequencing and homology analysis of nonhuman primate Fas/Fas-ligand and co-stimulatory molecules. Immunogenetics 2001;53:315-328. 339. Neubert R, Foerster M, Nogueira A, Helge H. Cross-reactivity of antihuman monoclonal antibodies with cell surface receptors in the common marmoset. Life Sci 1996;58:317-324. 340. Kireta S, Zola H, Gilchrist RB, Coates PTH. Cross-reactivity of anti-human chemokine receptor and anti-TNF family antibodies with Common Marmoset (Callithrix jacchus) leukocytes. Cell Immunol 2005;236:115-122. 341. Brok H, Hornby R, Griffiths G, Scott L, 't Hart B. An extensive monoclonal antibody panel for the phenotyping of leukocyte subsets in the common marmoset and the cotton-top tamarin. Cytometry 2001;45:294-303. 342. Prasad S, Humphreys I, Kireta S, Gilchrist R, Bardy P, Russ G et al. MHC class II DRB genotyping is highly predictive of in-vitro alloreactivity in the common marmoset. J Immunol Methods 2006;314:153-163. 343. Prasad S, Humphreys I, Kireta S, Gilchrist R, Bardy P, Russ G et al. The common marmoset as a novel preclinical transplant model: identification of new MHC class II DRB alleles and prediction of in vitro alloreactivity. Tissue Antigens 2007;69:72-76. 344. Prasad S, Kireta S, Leedham E, Russ G, Coates P. Propagation and characterisation of dendritic cells from G-CSF mobilised peripheral blood monocytes and stem cells in common marmoset monkeys. J Immunol Methods 2010;352:59-70. 345. Lim W, Kireta S, Russ G, Coates P. Human plasmacytoid dendritic cells regulate immune responses to Epstein-Barr virus (EBV) infection via toll-like receptor-9 signalling and delay EBV-related mortality in humanized NOD-SCID mice. Blood 2007;109:1043-1050. 346. Baumgarth N, Roederer M. A practical apporach to multicolor flow cytometry for immunophenotyping. J Immunol Methods 2000;243:77-97. 347. Roederer M. Spectral compensation for flow cytometry: visualization artifacts, limitations, and caveats. Cytometry 2001;45:194-205. 348. Capini C, Jaturanpinyo M, Chang H-I, Mutalik S, McNally A, Street S et al. Antigen-specific suppression of inflammatory arthritis using liposomes. J Immunol 2009;182:3556-3565. 349. Zhang X, Shi L, Shu S, Wang Y, Zhao K, Xu N et al. An improved method of sample preparation on AnchorChip targets for MALDI-MS and MS/MS and its application in the liver proteosome project. Proteomics 2007;7:2340-2349. 350. Chen L. Coinhibitory molecules of the B7-CD28 family in the control of T-cell immunity. Nat Rev Immunol 2004;4:336-347. 351. Greenwald R, Freeman G, Sharpe A. The B7 family revisited. Annu Rev Immunol 2005;23:515-548. 352. Quezada S, Jarvinen L, Lind E, Noelle R. CD40/CD154 interactions at the interface of tolerance and immunity. Annu Rev Immunol 2004;22:307-328. 353. Ohshima Y, Tanaka Y, Tozawa Y, Takahashi Y, Maliszewski C, Delespesse G. Expression and function of OX40 ligand on human dendritic cells. J Immunol 1997;159:3838-3848. 354. Moser M, Murphy K. Dendritic cell regulation of TH1-TH2 development. Nat Immunol 2000;1:199-205.
327
355. Takeda K, Kaisho K, Akira S. Toll-like receptors. Annu Rev Immunol 2003;21:335-376. 356. Barratt-Boyes S, Thomson A. Dendritic cells: tools and targets for transplant tolerance. Am J Transplant 2005;5:2807-2813. 357. Lutz M, Schuler G. Immature, semi-mature and fully mature dendritic cells: which signals induce tolerance or immunity? Trends Immunol 2002;23(9):445-449. 358. Gilliet M, Liu Y. Generation of human CD8 T regulatory cells by CD40 ligand-activated plasmacytoid dendritic cells. J Exp Med 2002;195:695-704. 359. Moseman E, Liang X, Dawson A, Panoskaltsis-Mortari A, Krieg A, Liu Y et al. Human plasmacytoid dendritic cells activated by CpG oligodeoxynucleotides induce the generation of CD4+CD25+ regulatory T cells. J Immunol 2004;173:4433-4442. 360. Garza K, Chan S, Suri R, Nguyen L, Odermatt B, Schoenberger S et al. Role of antigen-presenting cells in mediating tolerance and autoimmunity. J Exp Med 2000;191:2021-2028. 361. Jonuleit H, Schmitt E, Steinbrink K, Enk A. Dendritic cells as a tool to induce anergic and regulatory T cells. Trends Immunol 2001;22:394-400. 362. Coates P, Thomson A. Dendritic cells, tolerance induction and transplant outcome. Am J Transplant 2002;2:299-307. 363. Arpinati M, Green C, Heimfeld S, Heuser J, Anasetti C. Granulocyte-colony stimulating factor mobilises T helper 2-inducing dendritic cells. Blood 2000;95(8):2484-2490. 364. Hackstein H, Thomson A. Dendritic cells: emerging pharmacological targets of immunosuppressive drugs. Nat Immunol 2004;4:4-34. 365. Fontenot J, Gavin M, Rudensky A. Foxp3 programs the development and function of CD4+CD25+ regulatory T cells. Nat Immunol 2003;4:330. 366. Kang S, Tang Q, Bluestone J. CD4+CD25+ regulatory T cells in transplantation: progress, challenges and prospects. Am J Transplant 2007;7(6):1457-1463. 367. Liu W, Putman A, Xu-Yu A. CD127 expression inversely correlates with FoxP3 and suppressive function of human CD4+ T reg cells. . J Exp Med 2006;203:1701. 368. Takahashi T, Kuniyasu Y, Toda M, Sakaguchi N, Itoh M, Iwata M et al. Immunologic self-tolerance maintained by CD25+CD4+ naturally anergic and suppressive T cells: induction of autoimmune disease by breaking their anergic/suppressive state. Int Immunol 1998;10:1969-1980. 369. Takahashi T, Tagami T, Yamazaki S, Uede T, Shimizu J, Sakaguchi N et al. Immunologic self-tolerance maintained by CD25+CD4+ regulatory T cells constitutively expressing cytotoxic T lymphocyte-associated antigen 4. J Exp Med 2000;192:303-310. 370. Piemonti L, Monti P, Allavena P, Sironi A, Soldini L, Leone B et al. Glucocorticoids affect human dendritic cell differentiation and maturation. J Immunol 1999;162:6473-6481. 371. Lee J, Ganster R, Geller D, Burckart G, Thomson A, Lu L. Cyclosporine A inhibits the expression of costimulation molecules on in vitro-generated dendritic cells: association with reduced nuclear translocation of nuclear factor kappa B. Transplantation 1999;68(9):1255-1263. 372. Lagaraine C, Hoarau C, Chabot V, Velge-Roussel F, Labranchu Y. Mycophenolic acid-treated human dendritic cells have a mature migratory phenotype and inhibit allogeneic responses via direct and indirect pathways. Int Immunol 2005;17(4):351-363.

328
373. Hackstein H, Taner T, Zahorchak AF, Morelli AE, Logar AJ, Gessner A et al. Rapamycin inhibits IL-4--induced dendritic cell maturation in vitro and dendritic cell mobilization and function in vivo. Blood 2003;101(11):4457-4463. 374. Yang J, Bernier S, Ichim T, Li M, Xia X, Zhou D et al. LF15-0195 generates tolerogenic dendritic cells by suppression of NF-kappaB signalling through inhibition of IKK activity. J Leuk Biol 2003;74(3):438-447. 375. Penna G, Adorini L. 1-alpha,25-dihydroxyvitamin D3 inhibits differentiation, maturation, activation, and survival of dendritic cells leading to impaired alloreactive T cell activation. J Immunol 2000;164(5):2405-2411. 376. Balasubramanyam M, Koteswari A, Kumar R, Monickaraj S, Maheswari J, Mohan V. Curcumin-induced inhibition of cellular reactive oxygen species generation: novel therapeutic implications. J Biosci 2003;28:715-721. 377. Ruby A, Kuttan G, Babu K, Rajasekharan K, Kuttan R. Anti-tumor and antioxidant activity of natural curcuminoids. Cancer Lett 2003;94:79-83. 378. Yadav V, Mishra K, Singh D, Mehrotra S, Singh V. Immunomodulatory effects of curcumin. Immunopharmacol Immunotoxicol 2005;27:485-497. 379. Apisariyakul A, Vanittanakom N, Buddhasukh D. Antifungal activity of turmeric oil extracted from Curcuma longa (Zingiberaceae). J Ethnopharmacol 1995;49:163-169. 380. Mazumder A, Raghavan K, Weinstein J, Kohn K, Pommier Y. Inhibition of human immunodeficiency virus type-1 integrase by curcumin. Biochem Pharmacol 1995;49:1165-1170. 381. Negi P, Jayaprakasha G, Jagan Mohan Rao L, Sakariah K. Antibacterial activity of turmeric oil: a byproduct from curcumin manufacture. J Agric Food Chem 1999;47:4297-4300. 382. Garg A, Buchholz T, Aggarwal B. Chemosensitization and radiosensitization of tumours by plant polyphenols. Antioxid Redox Signal 2005;7:1630-1647. 383. Singh S, Aggarwal B. Activation of transcription factor NF-kB is suppressed by curcumin (diferuloylmethane). J Biol Chem 1995;270:24995-25000. 384. Kim G, Kim K, Lee S, Yoon M, Lee H, Moon D et al. Curcumin inhibits immunostimulatory function of dendritic cells: MAPKs and translocation of NF-kB as potential targets. . J Immunol 2005;174:8116-8124. 385. Cong Y, Wang L, Konrad A, Schoeb T, Elson C. Curcumin induces the tolerogenic dendritic cell that promotes differentiation of intestine-protective regulatory T cells. Eur J Immunol 2009;39:3134-3146. 386. Grumont R, Hochrein H, O'Keeffe M, Gugasyan R, White C, Caminschi I et al. C-Rel regulates interleukin 12 P70 expression in CD8+ dendritic cells by specifically Inducing p35 gene transcription. J Exp Med 2001;194(8):1021-1032. 387. O'Garra A, Murphy K. From IL-10 to IL-12: how pathogens and their products stimulate APCs to induce T(H)1 development. Nat Immunol 2009;10(9):929-932. 388. Shirley S, Monpetit A, Lockey R, Mohapatra S. Curcumin prevents human dendritic cell response to immune stimulants. Biochem Biophys Res Commun 2008;374:431-436. 389. Jakubzick C, Tacke F, Ginhoux F, Wagers A, van Rooijen N, Mack M et al. Blood monocyte subsets differentially give rise to CD103+ and CD103- pulmonary dendritic cell populations. J Immunol 2008;180:3019-3027. 390. Randolph G, Inaba K, Robbiani D, Steinman R, Muller W. Differentiation of phagocytic monocytes into lymph node dendritic cells in vivo. Immunity 1999;11:753-761.

329
391. Caux C, Massacrier C, Vanbervliet B, Dubois B, Van Kooten C, Durand I et al. Activation of dendritic cells through CD40 cross-linking. J Exp Med 1994;180:1263-1272. 392. Morelli A, Zahorchak A, Larregina A, Colvin B, Logar A, Takayama T et al. Cytokine production by mouse myeloid dendritic cells in relation to differentiation and terminal maturation induced by lipopolysaccharide or CD40 ligation. Blood 2001;98:1512-1523. 393. Grohnmann U, Fallarino F, Silla S, Bianchi R, Belladonna M, Vacca C et al. CD40 ligation ablates the tolerogenic potential of lymphoid dendritic cells. J Immunol 2001;166:277-283. 394. Shiroishi M, Tsumoto K, Amano K, Shirakihara Y, Colonna M, Braud V et al. Human inhibitory receptors Ig-like transcript 2 (ILT2) and ILT4 compete with CD8 for MHC class I binding and bind preferentially to HLA-G. Proc Natl Acad Sci 2003;100:8856-8861. 395. Dietrich J, Cella M, Colonna M. Ig-like transcript 2 (ILT2)/leukocyte Ig-like receptor 1 (LIR1) inhibits TCR signaling and actin cytoskeleton reorganization. J Immunol 2001;166:2514-2521. 396. Liang S, Zhang W, Horuzsko A. Human ILT2 receptor associates with murine class I molecules in vivo and impairs T cell function. Eur J Immunol 2006;36:2457-2471. 397. Ranjan D, Siquijor A, Johnston T, Wu G, Nagabhushan M. The effect of curcumin on human B-cell immortalisation by Epstein Barr virus. Am Surg 1998;64:47-51. 398. Ranjan D, Chen C, Johnston T, Jeon H, Nagabhushan M. Curcumin inhibits mitogen stimulated lyphocyte proliferation, NF-kB activation, and IL-2 signalling. J Surg Res 2004;121:171-177. 399. Joe B, Lokesh B. Role of capsaicin, curcumin and dietary �-3 fatty acids in lowering the generation of reactive oxygen species in rat peritoneal macrophages. Biochem Biophys Acta 2000;1224:255-263. 400. O'Sullivan B, MacDonald K, Pettit A, Thomas R. RelB nuclear translocation regulates B cell MHC molecule, CD40 expression and antigen-presenting cell function. Proc Natl Acad Sci 2000;97:11421. 401. Clark G, Gunningham S, Troy A, Vukovic S, Hart D. Expression of the RelB transcription factor correlates with the activation of human dendritic cells. Immunology 1999;98:189-196. 402. Koski G, Lyakh L, Cohen P, Rice N. CD14+ monocytes as dendritic cell precursors: diverse maturation-inducing pathways lead to common activation of NF-kappaB/RelB. Crit Rev Immunol 2001;21:179-189. 403. Giannoukakis N, Bonham C, Qian S, Chen Z, Peng L, Harnaha J et al. Prolongation of cardiac allograft survival using dendritic cells treated with NF-kB decoy oligonucleotides. Mol Ther 2000;1:430-437. 404. Min W, Zhou D, Ichim T, Xia X, Zhang X, Yang J et al. Synergistic tolerance induced by LF15-0195 and anti-CD45RB monoclonal antibody through suppressive dendritic cells. Transplantation 2003;75:1160-1165. 405. Feng G, Gao W, Strom T, Oukka M, Francis R, Wood K et al. Exogenous IFN-gamma ex vivo shapes the alloreactive T-cell repertoire by inhibition of TH17 responses and generation of Foxp3(+) regulatory T cells. Eur J Immunol 2008;38:2521-2527. 406. Feng G, Wood K, Bushell A. Interferon-gamma conditioning ex vivo generates CD25+CD62L+FoxP3+ regulatory T cells that prevent allograft rejection: potential avenues for cellular therapy. Transplantation 2008;86:578-589.

330
407. Wang Z. Role of IFN-gamma in induction of Foxp3 and conversion of CD4+CD25- T cells to CD4+ Tregs. J Clin Invest 2006;116:2434-2441. 408. Kang J, Huddleston S, Fraser J, Khoruts A. De novo induction of antigen-specific CD4+CD25+FoxP3 regaultory T cells in vivo following systemic antigen administration accompanied by blockade of mTOR. J Leuk Biol 2008;83:1230-1239. 409. Munn D, Sharma M, Mellor A. Ligation of B7-1/B7-2 by human CD4+ T cells triggers indoleamine 2,3-dioxygenase activity in dendritic cells. J Immunol 2004;172:4100-4110. 410. Eljaafari A, Li Y-P, Miossec P. IFN�, as secreted during an alloresponse, induces differentiation of monocytes into tolerogenic dendritic cells, resulting in FoxP3+ regulatory T cell promotion. J Immunol 2009;183:2932-2945. 411. Thornton A, Shevach E. Suppressor effector function of CD4+CD25+ immunoregulatory T cells is antigen nonspecific. J Immunol 2000;164:183-190. 412. Roncarolo M, Bacchetta R, Boridgnon C, Narula S, Levings M. Type 1 regulatory T cells. Immunol Rev 2001;182:68-79. 413. Roncarolo M, Gregori S, Battaglia M, Bacchetta R, Fleischauer K, Levings M. Interleukin-10-secreting type 1 regulatory T cells in rodents and humans. Immunol Rev 2006;212:28-50. 414. Weiner H. Induction and mechanism of action of transforming growth factor-�-secreting Th3 regulatory cells. Immunol Rev 2001;182:207-214. 415. Zhou J, Carr R, Liwski R, Stadnyk A, Lee G. Oral exposure to alloantigens generates intragraft CD8+ regulatory T cells. J Immunol 2001;167:107-113. 416. Zhang Z, Yang L, Young K, DuTemple B, Zhang L. Identification of a previously unknown antigen-specific regulatory T cell and its mechanism of suppression. Nature Med 2000;6:782-789. 417. Hayday A, Tigelaar R. Immunoregulation in the tissues by gammadelta T cells. Nat Rev Immunol 2003;3:233-242. 418. Seino K-I. Requirements for natural killer T (NKT) cells in the induction of allograft tolerance. Proc Natl Acad Sci 2001;98:2577-2581. 419. Aggarwal S, Ghilardi N, Xie M, de Sauvage F, Gurney A. Interleukin-23 promotes a distinct CD4 T cell activation state characterised by the production of interluekin-17. J Biol Chem 2003;278:1910-1914. 420. Ivanov I, McKenzie B, Zhou L, Tadokoro C, Lepelley A, Lafaille J et al. The orphan nuclear receptor RORgammat directs the differentiation program of proinflammatory IL-17+ T helper cells. Cell 2006;126:1121-1133. 421. Yang X, Nurieva R, Martinez G, Kang H, Chung Y, Pappu B et al. T helper 17 lineage differentiation is programmed by orphan nuclear receptors ROR� and ROR�. Immunity 2008;28:647-659. 422. Langrish C, Chen Y, Blumenschein W, Mattson J, Basham B, Sedgwick J et al. IL-23 drives a pathogenic T cell population that induces autoimmune inflammation. J Exp Med 2005;201:233-240. 423. Bettelli E, Carrier Y, Gao W, Korn T, Strom T, Oukka M et al. Reciprocal developmental pathways for the generation of pathogenic effector TH17 and regulatory T cells. Nature 2006;441:235-238. 424. Steinman R. The dendritic cell system and its role in immunogenicity. Ann Rev Immunol 1991;9:271-296.

331
425. Tan P, Yates J, Xue S, Chan C, Jordan W, Harper J et al. Creation of tolerogenic human dendritic cells via intracellular CTLA4: a novel strategy with potential in clinical immunosuppression. Blood 2005;106:2936-2943. 426. Kusuhara M, Matsue K, Edelbaum D, Loftus J, Takashima A, Matsue H. Killing of naive T cells by CD95L-transfected dendritic cells (DC): in vivo study using killer DC-DC hybrids and CD4(+) T cells from DO11.10 mice. Eur J Immunol 2002;32:1035-1043. 427. Horibe E, Sacks J, Unadkat J, Solari M, Raimondi G, Wang Z et al. Rapamycin-conditioned, alloantigen-pulsed dendritic cells promote indefinite survival of vascularized skin allografts in association with regulatory T cell expansion. Transpl Immunol 2008;18:307-318. 428. Niimi M, Shirasugi N, Ikeda Y, Kan S, Takami H, Hamano K. Operational tolerance induced by pretreatment with donor dendritic cells under blockade of CD40 pathway. Transplantation 2001;72:1556-1562. 429. O'Connell P, Li W, Wang Z, Specht S, Logar A, Thomson A. Immature and mature CD8alpha+ dendritic cells prolong the survival of vascularized heart allografts. J Immunol 2002;168:143-154. 430. Garrod K, Chang C, Liu F, Brennan T, Foster R, Kang S. Targeted lymphoid homing of dendritic cells is required for prolongation of allograft survival. J Immunol 2006;177:863-868. 431. Garrovillo M, Ali A, Oluwole S. Indirect allorecognition in acquired thymic tolerance: induction of donor-specific tolerance to rat cardiac allografts by allopeptide-pulsed host dendritic cells. Transplantation 1999;68:1827-1834. 432. Coates PT, Duncan FJ, Colvin BL, Wang Z, Zahorchak AF, Shufesky WJ et al. In vivo-mobilized kidney dendritic cells are functionally immature, subvert alloreactive T-cell responses, and prolong organ allograft survival. Transplantation 2004;77(7):1080-1089. 433. Steptoe RJ, Fu F, Li W, Drakes ML, Lu L, Demetris AJ et al. Augmentation of dendritic cells in murine organ donors by Flt3 ligand alters the balance between transplant tolerance and immunity. J Immunol 1997;159(11):5483-5491. 434. Khanna A, Antonysamy M, Subbotin V, Steptoe R, Rudert W, Thomson A. Impact of Flt-3 ligand on donor-derived antigen presenting cells and alloimmune reactivity in heart graft recipients given adjuvant donor bone marrow. Transpl Immunol 1998;6:225-234. 435. Eto M, Hackstein H, Kaneko K, Nomoto K, Thomson A. Promotion of skin graft tolerance across MHC barriers by mobilization of dendritic cells in donor hemopoietic cell infusions. J Immunol 2002;169:2390-2396. 436. Hawiger D, Inaba K, Dorsett Y, Guo M, Mahnke K, Rivera M et al. Dendritic cells induce peripheral T cell unresponsiveness under steady state conditions in vivo. J Exp Med 2001;194:769-779. 437. Sen P, Wallet M, Yi Z, Huang Y, Henderson M, Mathews C et al. Apoptotic cells induce Mer tyrosine kinase-dependent blockade of NF-kappaB activation in dendritic cells. Blood 2007;109:653-660. 438. Wang Z, Larregina A, Shufesky W, Perone M, Montecalvo A, Zahorchak A et al. Use of the inhibitory effect of apoptotic cells on dendritic cells for graft survival via T-cell depletion and regulatory T cells. Am J Transplant 2006;6:1297-1311. 439. van Broekhoven C, Parish C, Demangel C, Britton W, Altin J. Targeting dendritic cells with antigen-containing liposomes: a highly effective procedure for induction of antitumor immunity and for tumor immunotherapy. Cancer Res 2004;64:4357-4365.

332
440. Fiorentino D, Bond M, Mosmann T. Two types of mouse T helper cells. IV. Th2 clones secret a factor that inhibits cytokine production by Th1 clones. J Exp Med 1989;170:2081. 441. Baenjamin D, Knobloch T, Dayton M. Human B-cell interleukin-10: B cell lines dervied from patients with acquired immunodeficiency syndrome and Burkitt's lymphoma constitutively secrete large quantities of interleukin-10. Blood 1992;80:1289. 442. Moore K, O'Garra A, de Malefyt R, Vieira P, Mosmann T. Interleukin-10. Ann Rev Immunol 1993;11:165. 443. Fiorentino D, Zlotnik A, Vieira P, Mosmann T. IL-10 acts on the antigen-presenting cell to inhibit cytokine production by Th1 cells. J Immunol 1991;146:3444. 444. Willems F, Marchant A, Delville D-A, Gerard C, Delvaux A, Velu T et al. Interleukin-10 inhibits B7 and intercellular molecule-1 expression on human monocytes. Eur J Immunol 1994;24:1007. 445. de Malefyt R, Haanen J, Spits H, Roncarolo G, te Velde A, Figdor C et al. Interluekin-10 (IL-10) and viral IL-10 strongly reduce antigen-specific human T cell proliferation by diminishing the antigen-capacity of monocytes via downregulation of class II major histocompatibility complex expression. J Exp Med 1991;174:915. 446. Samad A, Sultana Y, Aqil M. Liposomal drug delivery systems: an update review. Curr Drug Deliv 2007;4:297-305. 447. Jagetia G, Aggarwal B. Spicing up the immune system by curcumin. J Clin Immunol 2007;27:19-35. 448. Madea T, Balakrishnan K, Mehdi S. A simple and rapid method for the preparation of plasma membranes. Biochim Biophys Acta 1983;731:115-120. 449. Immordino M, Dosio F, Cattel L. Stealth liposomes: review of the basic science, rationale, and clinical applications, existing and potential. Int J Nanomedicine 2006;1:297-315. 450. Ranjan D, Johnston T, Wu G, Elliott L, Bondada S, Nagabhushan M. Curcumin blocks cyclosporine A-resistant CD28 costimulatory pathway of human T-cell proliferation. J Surg Res 1998;77:174-178. 451. Wang Y, Pan M, Cheng A, Lin L, Ho Y, Hsieh C et al. Stability of curcumin in buffer solutions and characterization of its degradation products. J Pharm Biomed Anal 1997;15:1867-1876. 452. Ireson C, Jones D, Orr S, Coughtrie M, Boocock D, Williams M et al. Metabolism of the cancer chemopreventive agent curcumin in human and rat intestine. Cancer Epidemiol Biomarkers Prev 2002;11:105-111. 453. Sharma R, Hill K, McLelland H, Ireson C, Euden S, Manson M et al. Pharmacodynamic and pharmacokinetic study of oral curcuma extract in patients with colorectal cancer. Clin Cancer Res 2001;7:1834-1900. 454. Cheng A, Hsu C, Lin J, Hsu M, Ho J, Shen T et al. Phase I clinical trial of curcumin, a chemopreventive agent, in patients with high-risk or pre-malignant lesions. Anticancer Res 2001;21:2895-2900. 455. Scherphof G. Uptake and intracellular processing of targeted and nontargeted liposomes by rat Kupffer cells in vivo and in vitro. Ann N Y Acad Sci 1985;446:368-384. 456. Patel H. Serum opsonins and liposomes: their interaction and opsonophagocytosis. Crit Rev Ther Drug Carrier Syst 1992;9:39-90.

333
457. Falcone D. Fluorescent opsonization assay: binding of plasma fibronectin to fibrinderivatized fluorescent particles does not change their uptake by macrophages. J Leuk Biol 1986;39:1-12. 458. Volanakis J, Narkates A. Interaction of C-reactive protein with artificial phsophatidycholine bilayers and complement. J Immunol 1981;126:1820-1825. 459. Harashima H, Sakata K, Funato K, Kiwada H. Enhanced hepatic uptake of liposomes through complement activation depending on the size of liposomes. Pharm Res 1994;11:402-406. 460. Maruyama K, Kennel S, Huang L. Lipid composition is important for highyl efficient target binding and retention of immunoliposomes. Proc Natl Acad Sci 1990;87:5744-5748. 461. Paphadjopoulos D, Allen T, Gabzion A, Mayhew E, Matthay K, Huang S et al. Sterically stabilised liposomes: improvements in pharmacokinetics and antitumor therapeutic efficacy. Proc Natl Acad Sci 1991;88:11460-11464. 462. Senior J. Is half-life of circulating liposomes determined by changes in their permaebility? FEBS Lett 1982;145:109-114. 463. Chonn A, Cullis P, Devine D. The role of surface charge in the activation of the classical and alterantive pathways of complement by liposomes. J Immunol 1991;146:4234-4241. 464. Preston R, Epstein M. Ischemic renal disease: an emerging cause of chronic renal failure and end-stage renal failure. J Hypertens 1997;15:1365-1377. 465. Halloran P, Homik J, Goes N, Lui S, Urmson J, Ramassar V et al. The "injury response": a concept linking nonspecific injury, acute rejection, and long-term transplant outcomes. Transplant Proc 1997;29:79-81. 466. Shoskes D, Halloran P. Delayed graft function in renal transplantation: etiology, management and long-term significance. J Urol 1996;75:82-87. 467. Hetzel G, Klein B, Brause M, Westhoff A, Willers R, Sandmann W et al. Risk factors for delayed graft function on the long-term outcome of renal transplantation. Transpl Int 2002;15:10-16. 468. Feldman H, Gayner R, Berlin J, Roth D, Silibovsky R, Krushner S et al. Delayed graft function reduces renal allograft survival independent of acute rejection. Nephrol Dial Transplant 1996;11:1306-1313. 469. Donnahoo K, Meldrum D, Shenkar R, Chung C, Abraham E, Harken A. Early renal ischemia, with or without reperfusion, activates NF kappa B and increases TNF-alpha bioactivity in the kidney. J Urol 2000;163:1328-1332. 470. Tsoulfas G, Geller D. NF-�B in transplantation: friend or foe? Transpl Infect Dis 2001;3:212-219. 471. Leemans J, Stokman G, Claessen N, Rouschop K, Teske G, Kirschning C et al. Renal-associated TLR2 mediates ischemia/reperfusion injury in the kidney. J Clin Invest 2005;115:2894-2903. 472. Mukhopadhyay A, Basu N, Ghatak N. Anti-inflammatory and irritant activities of curcumin analogues in rats. Agents Action 1982;12:508-515. 473. Rogers N, Kireta S, Coates P. Curcumin induces maturation-arrested dendritic cells and expands regulatory T-cells in vivo and in vitro. Clin Exp Immunol 2010. 474. Bayrak O, Uz E, Turgut F, Atmaca A, Sahin S, Yıldırım M et al. Curcumin protects against ischemia/reperfusion injury in rat kidneys. World J Urol 2008;26:285-291.

334
475. Shen S, Zhang Y, Xiang J, Xiong C. Protective effect of curcumin against liver warm ischemia/reperfusion injury in rat model is associated with regulation of heat shock protein and antioxidant enzyme. World J Gastroenterol 2007;13:1953-1961. 476. Takedo K, Kaisho T, Akira S. Toll-like receptors. Annu Rev Immunol 2003;21:335-376. 477. Agwarwal B, Kumar A, Bharti A. Anticancer potential of curcumin: preclinical and clinical studies. Anticancer Res 2003;23 (1A):363-398. 478. Choudhuri T, Pal S, Agwarwal M, Das T, Sa G. Curcumin induces apoptosis in human breast cancer cells through p53-dependent Bax induction. FEBS Lett 2002;512:334-340. 479. Wu H, Chen G, Wyburn K, Yin J, Bertolino P, Eris J et al. TLR4 activation mediates kidney ischemia/reperfusion injury. J Clin Invest 2007;117:2847-2859. 480. Srivastava R. Inhibition of neutrophil response by curcumin. Agents Action 1989;28:298-303. 481. Ramsewak R, DeWitt D, Nair M. Cytotoxicity, antioxidant and anti-inflammatory activities of curcumins I-III from Curcuma longa. Phytomedicine 2000;7:303-308. 482. Furuichi W, Wada T, Kaneko S, Murphy P. Roles of chemokines in renal ischemia/reperfusion injury. Front Biosci 2008;13:4021-4028. 483. Jaswal J, Gandhi M, Finegan B, Dyck J, Clanachan A. Inhibition of p38 MAPK and AMPK restores adenosine-induced cardioprotection in heart stressed by antecedent ischemia by altering glucose utilization. Am J Physiol Heart Circ Physiol 2007;293:H1107-1114. 484. Yamawaki H, Berk B. Thioredoxin: a multifunctional antioxidant enzyme in kidney, heart and vessels. Curr Opin Nephrol Hypertens 2005;14:149-153. 485. Junn E, Han S, Im J, Yang Y, Cho E, Um H et al. Vitamin D3 up-regulated protein 1 mediates oxidative stress via suppressing tioredoxin function. J Immunol 2000;164:6287-6295. 486. Advani A, Gilbert R, Thai K, Gow R, Langham R, Christensen P et al. Expression, localization, and function of the thioredoxin system in diabetic nephropathy. J Am Soc Nephrol 2009;20:730-741. 487. Qi W, Chen X, Gilbert R, Zhang Y, Waltham M, Schache M et al. High glucose-induced thioredoxin interacting protein in renal proximal tubule cells is independent of transforming growth factor-�1. Am J Pathol 2007;171(3):744-754. 488. Jamieson R, Friend P. Organ reperfusion and preservation. Front Biosci 2008;13:221-235. 489. Lutz J, Thürmel K, Heeman U. Anti-inflammatory treatment strategies for ischemia/repefusion injury in transplantation. J Inflamm (Lond) 2010;7:27-34. 490. Lutz J, TYao Y, Song E, Antus B, Hamar P, Liu S et al. Inhibition of matrix metalloproteinases during chronic allograft nephropathy in rats. Transplantation 2005;79:655-661. 491. Rusai K, Huang H, Sayed N, Strobl M, Roos M, Schmaderer C et al. Administration of interleukin-1 receptor antagonist ameliorates renal ischemia-reperfusion injury. Transpl Int 2008;21:572-580. 492. Zhou T, Sun G, Zhang M, Chen J, Zhang D, Hu Q et al. Role of adhesion molecules and dendritic cells in rat hepatic/renal ischemia-reperfusion injury and anti-adhesive intervention with anti-P-selectin lectin-EGF domain monoclonal antibody. Gastroenterol 2005;11:1005-1010.
335
493. Zheng X, Feng B, Chen G, Zhang X, Li M, Sun H et al. Preventing renal ischemia-reperfusion injury using small interfering RNA by targeting complement 3 gene. Am J Transplant 2006;6:2099-2108. 494. Zheng X, Zhang X, Feng B, Sun H, Suzuki M, Ichim T et al. Gene silencing of complement C5a receptor using siRNA for preventing ischemia/reperfusion injury. Am J Pathol 2008;173:973-980. 495. Lutz J, Luong IA, Strobl M, Deng M, Huang H, Anton M et al. The A20 gene protects kidneys from ischemia/reperfusion injury by suppressing pro-inflammatory activation. J Mol Med 2008(86). 496. Ulrich A. Biophysical aspects of using liposomes as delivery vehicles. Bioscience Reports 2002;22:129-150. 497. Allen C, Dos Santos N, Gallagher R, Chiu G, Shu Y, Li W et al. Controlling the physical behaviour and biological performance of liposome formulations through the use of surface grafted poly(ethylene glycol). Bioscience Reports 2002;22:225-250. 498. Dong X, Swaminathan S, Bachman L, Croatt A, Nath K, Griffin M. Antigen presentation by dendritic cells in renal lymph nodes is linked to systemic and local injury to the kidney. Kidney Int 2005;68(3):1096-1108. 499. Bradham C, Schemmer P, Stachlewitz R, Thurman R, Brenner D. Activation of nuclear factor-� during orthotopic liver transplantation in rats is protective and does not require Kupffer cells. Liver Transplant Surg 1999;5:282-293. 500. Taylor B, Shao L, Gambotto A, Ganster R, Geller D. Inhibition of cytokine-induced nitric oxide synthase expression by gene transfer of adenoviral I�B�. Surgery 1999;126:142-147. 501. Bach F, Ferran S, Soares M, Wrighton C, Anrather J, Winkler H et al. Modification of vascular responses in xenotransplantation: inflammation and apoptosis. Nat Med 1997;3:944-948. 502. Vos I, Govers R, Gröne H, Kleij L, Schurink M, De Weger R et al. NFkappaB decoy oligodeoxynucleotides reduce monocyte infiltration in renal allografts. FASEB J 2000;14:815-822. 503. Feeley B, Park A, Hoyt E, Robbins R. Sulfasalazine inhibits reperfusion injury and prolongs allograft survival in rat cardiac transplantation. J Heart Lung Transplant 1999;18:1088-1095. 504. Sandur S, Pandey M, Sung B, Ahn K, Murakami A, Sethi G et al. Curcumin, demethoxycurcumin, bisdemethoxycurcumin, tetrahydrocurcumin and tumerones differentially regulate anti-inflammatory and anti-proliferative responses through a ROS-inependent mechanism. Carcinogenesis 2007;28:1765-1773. 505. Jobin C, Bradham C, Russo M, Juma B, Narula A, Brenner D et al. Curcumin blocks cytokine-mediated NF-�B activation and proinflammatory gene expression by inhibiting inhibitory factor I-�B kinase activity. J Immunol 1999;163:3474-3483. 506. Sharma R, Euden S, Platton S, Cooke D, Shafayat A, Hewitt H et al. Phase I clinical trial of oral curcumin: biomarkers of systemic activity and compliance. Clin Cancer Res 2004;10:6847-6854. 507. Li L, Ahmed B, Mehta K, Kurzrock R. Liposomal curcumin with and without oxalipltin: effects on cell growth, apoptosis, and angiogenesis in colorectal cancer. Mol Cancer Ther 2007;6:1276-1282.

336
508. Bestman-Smtih J, Gourde P, Desormeaux A, Tremblay M, Bergeron M. Sterically stabilized liposomes bearing anti-HLA-DR antibodies for targeting the primary cellular reservoirs of HIV-1. Biochim Biophys Acta 2000;1468:161-174. 509. Machy P, Serre K, Leserman L. Class-I restricted presentation of exogenous antigen aacquired by Fcgamma receptor-mediated endocytosis is regulated in dendritic cells. Eur J Immunol 2000;30:848-857. 510. Serre K, Machy P, Grivel J, Jolly G, Brun N, Barbet J et al. Efficient presentation of multivalent antigens targeted to various cell surface molecules of dendriti cells and surface Ig of antigen-specific B cells. J Immunol 1998;161:6059-6067. 511. Soilleux EJ. DC-SIGN (dendritic cell-specific ICAM-grabbing non-integrin) and DC-SIGN-related (DC-SIGNR): friend or foe? Clin Sci (Lond) 2003;104(4):437-446. 512. Geijtenbeek T, Koopman G, van Duijnhoven G, van Vilet S, van Schijndel A, Engering A et al. Rhesus macaque and chimpanzee DC-SIGN act as HIV/SIV gp120 trans-receptors, similar to human DC-SIGN. Immunol Lett 2001;79:101-107. 513. Geijtenbeek T, Kwon D, Torensma R, van Vilet S, van duijnhoven G, Middel J et al. DC-SIGN, a dendritic cell-specific HIV-1-binding protein that enhances trans-infection of T cells. Cell 2000;100:587-597. 514. Kwon D, Gregorio G, Bitton N, Hendrickson W, Littman D. DC-SIGN-mediated internalization of HIV is required for trans-enhancement of T cell infection. Immunity 2002;16:135-144. 515. Wu L, Bashirova A, Martin T, Villamide L, Mehlhop E, Chertov A et al. Rhesus macaque dendritic cells efficiently transmit primate lentiviruses independent of DC-SIGN. Proc Natl Acad Sci 2002;99:1568-1573. 516. Mortara L, Ploquin M, Faye A, Scott-Algara D, Vaslin B, Butor C et al. Phenotype and function of myeloid dendritic cells derived from African green monkey blood monocytes. J Immunol Methods 2006;308:138-155. 517. Ploquin M, Diop O, Sol-Foulon N, Mortara L, Faye A, Soares M et al. DC-SIGN from African green monkeys is expressed in lymph nodes and mediates infection of trans of simian immunodeficiency virus SIVagm. J Virol 2004;78:798-810. 518. Pereira C, Torensma R, Hebeda K, Kretz-Rommel A, Faas S, Figdor C et al. In vivo targeting of DC-SIGN-positive antigen-presenting cells in a nonhuman primate model. J Immunother 2007;30:705-714. 519. Hansen C, Kao G, Moase E, Zalipsky S, Allen T. Attachment of antibodies to sterically stabilized liposomes: evaluation, comparison and optimization of coupling procedures. Biochim Biophys Acta 1995;1239:133-144. 520. van Broekhoven C, Altin J. A novel approach for modifying tumor cell-derived plasma membrane vesicles to contain encapsulated IL-2 and engrafted costimulatory molecules for use in tumor immunotherapy. Int J Cancer 2002;98:63-72. 521. Altin J, White F, Easton C. Synthesis of the chelator lipid nitriloacetic acid ditetradecylamine (NTA-DTDA) and its use with the IAsys biosensor to study receptor-ligand interactions on model membranes. Biochim Biophys Acta 2001;1513:131-148. 522. Hart D. Dendritic cells: unique leukocyte populations which control the primary immune response. Blood 1997;90:3245-3287. 523. Mosialos G, Birkenbach M, Ayehunie S, Matsumura F, Pinkus G, Kieff E et al. Circulating human dendritic cells differentially express high levels of a 55-kd actin-bundling protein. Am J Pathol 1996;148(593-600).

337
524. Ortiz M, Kaesmann H, Zhang K, Bashirova A, Carrington M, Quintana-Murci L et al. The evolutionary history of the CD209 (DC-SIGN) family in humans and non-human primates. Genes Immunity 2008;9:483-492. 525. Soilleux E. DC-SIGN (dendritic cell-specific ICAM-grabbing non-integrin) and DC-SIGN-related )DC-SIGNR): friend or foe? Clin Sci (Lond) 2003;104(4):437-446. 526. Baribaud F, Pohlmann S, Leslie G, Mortari F, Doms R. Quantitative expression and virus transmission analysis of DC-SIGN on monocyte-derived dendritic cells. J Virol 2002;76(18):9135-9142. 527. Schwartz AJ, Alvarez X, Lackner AA. Distribution and immunophenotype of DC-SIGN-expressing cells in SIV-infected and uninfected macaques. AIDS Res Hum Retroviruses 2002;18(14):1021-1029. 528. Jameson B, Baribaud F, Pohlmann S, Ghavimi D, Mortari F, Doms RW et al. Expression of DC-SIGN by dendritic cells of intestinal and genital mucosae in humans and rhesus macaques. J Virol 2002;76(4):1866-1875. 529. Wu L, Bashirova AA, Martin TD, Villamide L, Mehlhop E, Chertov AO et al. Rhesus macaque dendritic cells efficiently transmit primate lentiviruses independently of DC-SIGN. Proc Natl Acad Sci U S A 2002;99(3):1568-1573. 530. Mortara L, Ploquin MJ, Faye A, Scott-Algara D, Vaslin B, Butor C et al. Phenotype and function of myeloid dendritic cells derived from African green monkey blood monocytes. J Immunol Methods 2006;308(1-2):138-155. 531. Ploquin MJ, Diop OM, Sol-Foulon N, Mortara L, Faye A, Soares MA et al. DC-SIGN from African green monkeys is expressed in lymph nodes and mediates infection in trans of simian immunodeficiency virus SIVagm. J Virol 2004;78(2):798-810. 532. Pereira CF, Torensma R, Hebeda K, Kretz-Rommel A, Faas SJ, Figdor CG et al. In vivo targeting of DC-SIGN-positive antigen-presenting cells in a nonhuman primate model. J Immunother 2007;30(7):705-714. 533. Arnold F. Metal-affinity separations: a new dimension in protein processing. Biotechnology 1991;9:151-156. 534. Bashirova A, Wu L, Cheng J, Martin T, Martin M, Benveniste R et al. Novel member of the CD209 (DC-SIGN) gene family in primates. J Virol 2003;77:217-227. 535. Koppel E, van Gisbergen K, Geijtenbeek T, van Kooyk Y. Distinct functions of DC-SIGN and its homologues L-SIGN (DC-SIGNR) and mSIGNR1 in pathogen recognition and immune regulation. Cell Microbiol 2005;7:157-165. 536. Barreiro L, Quintana-Murci L. DC-SIGNR neck-region polymorphisms and HIV-1 susceptibility: from population stratification to a possible advantage of the 7/5 heterozygous genotype. J Infect Dis 2006;194:1184-1185. 537. Martin M, Lederman M, Hutcheson H, Goedert J, Nelson G, van kooyk Y et al. Association of DC-SIGN promoter polymorphismwith increased risk for parenteral, but not mucosal, acquisition of human immunodeficiency virus type 1 infection. J Virol 2004;78:14053-14056. 538. Liu H, Hwangbo Y, Holte S, Lee J, Wang C, Kaupp N et al. Analysis of genetic polymorphisms in CCR5, CCR2, stromal-cell-derived factor-1, RANTES, and dendritic cell-specific intercellular adhesion molecule-3-grabbing nonintegrin in seronegative individuals repeatedly exposed to HIV-1. J Infect Dis 2004;190:1055-1058. 539. van Broekhoven C, Parish C, Vassiliou G, Altin J. Engrafting costimulator molecules onto tumor cell surfaces with chelator lipids: a potentially convenient apporach in cancer vaccine development. J Immunol 2000;164:2433-2443.

338
540. van Broekhoven C, Altin J. A novel system for convenient detection of low-affinity receptor-ligand interactions: chelator-lipid liposomes engrafted with recombinant CD4 bind to cells expressing MHC class II. Immunol Cell Biol 2001;79:274-284. 541. Pullen S, Labadia M, Ingraham R, McWhirter S, Everdeen D, Alber T et al. High-affinity interactions of tumor necrosis factor-associated factors (TRAFs) and CD40 require TRAF trimerization and CD40 multimerization. Biochem 1999;38:10168-10177. 542. van Gool S, Vandenberghe P, de Boer M, Ceuppens J. CD80, CD86 and CD40 provide accessory signal in a multiple-step T-cell activation model. Immunol Rev 1996;153:47-83. 543. Greene J, Leytze G, Emswiler J, Peach R, Bajorath J, Cosand W et al. Covalent dimerisation of CD28/CTLA-4 and oligomerisation of CD80/86 regulate T cell costimulatory interactions. J Biol Chem 1996;271:26762-26771. 544. Ikemizu S, Gilbert R, Fennelly J, Collins A, Harlos K, Jones E et al. Structure and dimerisation of a soluble form of B7.1. Immunity 2000;12:51-60. 545. Lopes de Menezes D, Kirchmeier M, Gagne J-F, ******. Cellular trafficking and cytotoxicity of anti-CD19-targeted liposomal doxorubicin in B cell lymphomas. J Liposome Res 1999;9:199-228. 546. Lee T, Wu H, Tseng Y, Lin C. A novel peptide specifically binding to nasopharyngeal carcinoma for targeted drug delivery. Cancer Res 2004;64:8002-8008. 547. Stephenson S, Low P, Lee R. Folate receptor-mediated targeting of liposomal drugs to cancer cells. Methods Enzymol 2004;387:33-50. 548. Kondo M, Asai T, Katanasaka Y, Sadzuka Y, Tsukada H, Ogino K et al. Anti-neovascular therapy by liposomal drug targeted to membrane type-1 matrix metallproteinase. Int J Cancer 2004;108:301-306. 549. Ishida O, Maruyama K, Tanahashi H, Iwatsuru M, Sasaki K, Eriguchi M et al. Liposomes bearing polyethyleneglycol-coupled transferrin with intracellular targeting property to the solid tumors in vivo. Pharm Res 2001;18:1042-1048. 550. Sapra P, Allen T. Ligand-targeted liposomal anticancer drugs. Prog Lipid Res 2003;42:439-462. 551. Medina O, Zhu Y, Kairemo K. Targeted liposomal drug delivery in cancer. Curr Pharm Des 2004;10:2981-2989. 552. Senior J, Delgado C, Fisher D, Tilcock C, Gregoriadis G. Influence of surface hydrophilicity of liposomes on their interaction with plasma protein and clearance from the circulation: studies with poly(ethylene glycol)-coated vesicles. Biochim Biophys Acta 1991;1062:77-82. 553. Ternant D, Paintaud G. Pharmacokinetics and concentration-effect relationships of therapeutic monoclonal antibodies and fusion proteins. Expert Opin Biol Ther 2005;5:S37-47. 554. Adams G, Weiner L. Monoclonal antibody therapy of cancer. Nat Biotechnol 2005;39:1147-1157. 555. Cheng W, Allen T. Targeted delivery of anti-CD19 liposomal doxorubicin in B-cell lymphoma: a comparison of whole monclonal antibody, Fab' fragments and single chain Fv. J Control Release 2008;126:50-58. 556. Lindner P, Bauer K, Krebber A, Nieba L, Kremmer E, Krebber C et al. Specific detection of his-tagged proteins with recombinant anti-His-tag scFv-phosphatase or scFv-phage fusions. Biotechniques 1997;22:140-149.

339
557. Ruger R, Muller D, Fahr A, Kontermann R. In vitro characterization of binding and stability of single-chain Fv Ni-NTA-liposomes. J Drug Target 2005;14:576-582. 558. Park J, Hong K, Kirpotin D, Colbern G, Shalaby R, Baselga J et al. Anti-HER2 immunoliposomes: Enhanced efficacy attributable to targeted delivery. Clin Cancer Res 2002;8:1172-1181. 559. An F, Drummond D, Wilson S, Kirpotin D, Nishimura S, Braddus V et al. Targeted drug delivery to mesothelioma cells using functionally selected internalizing human single-chain antibodies. Mol Cancer Ther 2008;7:569-578. 560. Noble C, Guo Z, Hayes M, Marks J, Park J, Benz C et al. Characterization of highly stable liposomal and immunoliposomal formulations of vincristine and vinblastine. Cancer Chemother Pharmacol 2009;64:741-751. 561. Brocker T, Riedinger M, Karjalanein K. Targeted expression of major histocompatibility complex (MHC) class II molecules demonstrates that dendritic cells can induce negative but not positive selection of thymocytes in vivo. J Exp Med 1997;185:541-550. 562. Armitage R, Fanslow W, Strockbine L, Sato T, Clifford K, Macduff B et al. Molecular and biological characterization of a murine ligand for CD40. Nature 1992;357:80-82. 563. Ridge J, Di Rosa F, Matzinger P. A conditioned dendritic cell can be a temporal bridge betweena CD4+ T-helper and a T-killer cell. Nature 1998;393:474-478.

340
APPENDIX

Rogers, N.M., Matthews, T.J., Kausman, J.Y., Kitching, R.A. and Coates, P.T.H. (2009) Review article: Kidney dendritic cells: Their role in homeostasis, inflammation and transplantation. Nephrology, v.14 (7), pp. 625-635, October 2009
NOTE: This publication is included in the print copy of the thesis
held in the University of Adelaide Library.
It is also available online to authorised users at:
http://dx.doi.org/10.1111/j.1440-1797.2009.01200.x
Rogers, N.M., Kireta, S. and Coates, P.T.H. (2010) Curcumin induces maturation-arrested dendritic cells that expand regulatory T cells in vitro and in vivo. Clinical and Experimental Immunology, v.162 (3), pp. 460-473, December 2010
NOTE: This publication is included in the print copy of the thesis
held in the University of Adelaide Library.
It is also available online to authorised users at:
http://dx.doi.org/10.1111/j.1365-2249.2010.04232.x

Rogers, N.M., Stephenson, M.D., Kitching, R.A., Horowitz, J.D. and Coates, P.T.H. (2011) Amelioration of renal ischaemia-reperfusion injury by liposomal delivery of curcumin to renal tubular epithelial and antigen presenting cells. Accepted manuscript online: 11 JUL 2011
NOTE: This publication is included in the print copy of the thesis
held in the University of Adelaide Library.
It is also available online to authorised users at:
http://dx.doi.org/10.1111/j.1476-5381.2011.01590.x