modulation of hydroxyl radical reactivity and radical ... · literature, focusing primarily on the...
TRANSCRIPT

Modulation of Hydroxyl Radical Reactivity and Radical Degradation of High Density Polyethylene
Susan M. Mitroka
Dissertation submitted to the faculty of the Virginia Polytechnic Institute and State University in partial fulfillment of the requirements for the degree of
Doctor of Philosophy
In
Chemistry
Dr. James M. Tanko, Chairman
Dr. Paul Carlier
Dr. Andrea Dietrich
Dr. Timothy E. Long
Dr. Diego Troya
June 25, 2010
Blacksburg, Virginia
Keywords: hydroxyl radical, hydrogen atom transfer, polarized transition state, oxidation, auto oxidation, high density polyethylene, accelerated aging
Copyright 2010, S. Mitroka
Modulation of Hydroxyl Radical Reactivity and Radical Degradation of High Density Polyethylene
Susan M. Mitroka
ABSTRACT
Oxidative processes are linked to a number of major disease states as well as the
breakdown of many materials. Of particular importance are reactive oxygen species (ROS), as
they are known to be endogenously produced in biological systems as well as exogenously
produced through a variety of different means. In hopes of better understanding what controls the
behavior of ROS, researchers have studied radical chemistry on a fundamental level.
Fundamental knowledge of what contributes to oxidative processes can be extrapolated to more
complex biological or macromolecular systems.
Fundamental concepts and applied data (i.e. interaction of ROS with polymers,
biomolecules, etc.) are critical to understanding the reactivity of ROS. A detailed review of the
literature, focusing primarily on the hydroxyl radical (HO•) and hydrogen atom (H•) abstraction
reactions, is presented in Chapter 1. Also reviewed herein is the literature concerning high
density polyethylene (HDPE) degradation. Exposure to treated water systems is known to
greatly reduce the lifetime of HDPE pipe. While there is no consensus on what leads to HDPE
breakdown, evidence suggests oxidative processes are at play.
The research which follows in Chapter 2 focuses on the reactivity of the hydroxyl radical
and how it is controlled by its environment. The HO• has been thought to react instantaneously,
approaching the diffusion controlled rate and showing little to no selectivity. Both experimental

iii
and calculational evidence suggest that some of the previous assumptions regarding hydroxyl
radical reactivity are wrong and that it is decidedly less reactive in an aprotic polar solvent than
in aqueous solution. These findings are explained on the basis of a polarized transition state that
can be stabilized via the hydrogen bonding afforded by water. Experimental and calculational
evidence also suggest that the degree of polarization in the transition state will determine the
magnitude of this solvent effect.
Chapter 3 discusses the results of HDPE degradation studies. While HDPE is an
extremely stable polymer, exposure to chlorinated aqueous conditions severely reduces the
lifetime of HDPE pipes. While much research exists detailing the mechanical breakdown and
failure of these pipes under said conditions, a gap still exists in defining the species responsible
or mechanism for this degradation. Experimental evidence put forth in this dissertation suggests
that this is due to an auto-oxidative process initiated by free radicals in the chlorinated aqueous
solution and propagated through singlet oxygen from the environment. A mechanism for HDPE
degradation is proposed and discussed. Additionally two small molecules, 2,3-dichloro-2-
methylbutane and 3-chloro-1,1-di-methylpropanol, have been suggested as HDPE byproducts.
While the mechanism of formation for these products is still elusive, evidence concerning their
identification and production in HDPE and PE oligomers is discussed.
Finally, Chapter 4 deals with concluding remarks of the aforementioned work. Future
work needed to enhance and further the results published herein is also addressed.

iv
Table of Contents
Title Page ………………………………………………..………………………………….…..…i
Abstract…………. ……………………………………….………...……….…………………….ii
Table of Contents........................................................................................................................... iv
List of Schemes............................................................................................................................ xvi
List of Tables .............................................................................................................................. xvii
List of Abbreviations .................................................................................................................... xx
Acknowledgements..................................................................................................................... xxii
Chapter 1 Radical Chemistry: Methods, Reactivities, and Degradation Processes ............... 1
1.1 Introduction .......................................................................................................................... 1
1.2 Photochemistry and Chemical Kinetics--Theory ................................................................. 1
1.3 HO• Reactions: Methods and Rates of Hydrogen Abstraction ............................................ 6
1.4 HO• Additions.................................................................................................................... 15
1.5 Alkoxyl Radical Reactions................................................................................................. 16
1.6 Biological Implications of HO• Oxidation......................................................................... 17
1.7 Accelerated Aging of Polyethylene Potable Water Material ............................................. 20
Chapter 2 How Hydroxyl Radical Reactivity is Modulated by Solvent ................................ 38 Contributions............................................................................................................................ 38
2.1 Introduction ........................................................................................................................ 40
2.2 Results ................................................................................................................................ 43
2.3 Discussion .......................................................................................................................... 49
2.3.1 Identity of the Hydroxyl Radical .................................................................................. 49
2.3.2 Discussion of Polarized Transition State...................................................................... 55
2.4 Conclusions ........................................................................................................................ 64
2.5 Experimental ...................................................................................................................... 65
2.5.1 Materials. ...................................................................................................................... 65
2.5.2 Apparatus...................................................................................................................... 65
2.5.3 Laser Flash Photolysis (LFP). ...................................................................................... 65
2.5.4 Calculations. ................................................................................................................. 67

v
2.5.5 Competition Experiments. ............................................................................................ 67
Chapter 3 Mechanistic Degradation of High Density Polyethylene Potable Water Materials....................................................................................................................................................... 75
Contributions............................................................................................................................ 75
3.1 Introduction ........................................................................................................................ 77
3.2 Experimental Methods ....................................................................................................... 79
3.2.1 Materials and Polymer Preparation. ............................................................................. 79
3.2.2 Water Quality Measurements and Accelerated Aging Methods. ................................. 80
3.2.3 Polymer Characterization ............................................................................................. 81
3.2.4 Oxygen-18 labeled O2 Experiments. ............................................................................ 83
3.3 Results ................................................................................................................................ 84
3.3.1 Accelerated Aging: HDPE Pipe ................................................................................... 84
3.3.2 Accelerated Aging: AO free HDPE resin..................................................................... 87
3.3.3 Accelerated Aging: 18O2 gas......................................................................................... 89
3.3.4 Liquid/Liquid Extraction .............................................................................................. 93
3.4 Discussion .......................................................................................................................... 97
3.5 Conclusions ...................................................................................................................... 103
Chapter 3 Addendum ............................................................................................................... 108 Chapter 4 Summary and Future Work .................................................................................. 109
4.1 Introduction ...................................................................................................................... 109
4.2 Solvent Effect and Polarized Transition state .................................................................. 109
4.3 Auto-oxidation and Chain Reactions. .............................................................................. 111
4.4 Selectivity......................................................................................................................... 112
4.5 Future Work ..................................................................................................................... 114
4.5.1 Oxygen Centered Radicals ......................................................................................... 114
4.5.2 High and Low Density Polyethylenes. ....................................................................... 116
Appendix A: Supporting Material for Chapter 2 How Solvent Modulates Hydroxyl Radical Reactivity in Hydrogen Atom Abstractions ........................................................................... 119 Appendix B: Supporting Material for Chapter 3 Mechanistic Degradation of High Density Polyethylene Potable Water Materials.................................................................................... 194

vi
List of Figures
Figure 1-1. Relative reactivity of HO• towards substituted methanes (CH3—X) ....................... 14
Figure 1-2. Stabilization of transition state in HO• addition reaction.......................................... 15
Figure 1-3. HO• addition products to cresols............................................................................... 16
Figure 1-4. Guanine oxidation products ...................................................................................... 20
Figure 2-1. Isolated products from the reaction of PSH and cyclohexane or 2,3-dimethylbutane
............................................................................................................................................. 49
Figure 2-2. Plot of kobs (x) and signal intensity (☐) vs. [2,3-dimethylbutane]............................ 51
Figure 2-3. Absorptions from radical additions.......................................................................... 54
Figure 2-4. Formation of a polarized transition state for hydrogen atom abstraction from a
hydrocarbon by hydroxyl radical......................................................................................... 57
Figure 2-5. Atomic charges for the reaction of hydroxyl radical with CH4, CH3OH and CHCl3
obtained from natural population analysis of the reactants, transition states, and products at
the MP2(full)/aug-cc-pVQZ//UHF/6-311G* levels ............................................................ 59
Figure 2-6. Hydrogen abstraction from tetramethylbutane by HO• ............................................ 66
Figure 3-1. a) IR of HDPE pipe sample after 90 days (2160 h) of accelerated aging at 500 mg/L
Cl2. ...................................................................................................................................... 86
Figure 3-2. a) IR of AO free HDPE resin sample after 21 days (504 h) of accelerated aging at
250 mg/L aqueous chlorine in the presence of 18O2. ........................................................... 89
Figure 3-3. a) AO free HDPE resin sample with both 16O (1742 cm-1) and 18O (1648 cm-1)
carbonyl bands present. ....................................................................................................... 91
Figure 3-5. Graphs showing the relative abundance of a) DCMB and b) DMCP from new and
extracted HDPE pipes.......................................................................................................... 94
vii
Figure 3-6. Products and GC correction factors for small molecule chlorination study. ........... 96
Figure 3-7. Overlap of day 90 HDPE pipe carbonyl peaks (blue= 500 mg/L Cl2 aging
conditions; red= 50 mg/L Cl2 aging conditions................................................................... 98
Figure 4-1. π- complex stabilization of chlorine radical...........................................................110
Figure 2-7. Transient signal for the buildup of HO-TS• at 392 nm in the presence of 0.0105 M
tetramethylbutane in acetonitrile generated by laser flash photolysis of 0.65 mM PSH... 120
Figure 2-8. Transient signal for the buildup of HO-TS• at 392 nm in the presence of 0.015 M
hexane in acetonitrile generated by laser flash photolysis of 0.65 mM PSH. ................... 121
Figure 2-9. Transient signal for the buildup of HO-TS• at 392 nm in the presence of 0.021 M
heptane in acetonitrile generated by laser flash photolysis of 0.65 mM PSH. .................. 122
Figure 2-10. Transient signal for the buildup of HO-TS• at 392 nm in the presence of 0.100 M
methylcyclohexane in acetonitrile generated by laser flash photolysis of 0.65 mM PSH. 123
Figure 2-11. Transient signal for the buildup of HO-TS• at 392 nm in the presence of 0.030 M
cyclohexane in acetonitrile generated by laser flash photolysis of 0.65 mM PSH. .......... 124
Figure 2-12. Transient signal for the buildup of HO-TS• at 392 nm in the presence of 0.015 M
dimethylbutane in acetonitrile generated by laser flash photolysis of 0.65 mM PSH....... 125
Figure 2-13. Transient signal for the buildup of HO-TS• at 392 nm in the presence of 0.016 M
1-butanol in acetonitrile generated by laser flash photolysis of 0.65 mM PSH. ............... 126
Figure 2-14. Transient signal for the buildup of HO-TS• at 392 nm in the presence of 0.015 M
ethanol in acetonitrile generated by laser flash photolysis of 0.65 mM PSH................... 127
Figure 2-15. Transient signal for the buildup of HO-TS• at 392 nm in the presence of 0.090 M
isopropanol in acetonitrile generated by laser flash photolysis of 0.65 mM PSH............. 128

viii
Figure 2-16. Transient signal for the buildup of HO-TS• at 392 nm in the presence of 0.070 M
methanol in acetonitrile generated by laser flash photolysis of 0.65 mM PSH................. 129
Figure 2-17. Transient signal for the buildup of HO-TS• at 392 nm in the presence of 0.100 M
tert-butanol in acetonitrile generated by laser flash photolysis of 0.65 mM PSH............. 130
Figure 2-18. Transient signal for the buildup of HO-TS• at 392 nm in the presence of 0.015 M
diethyl ether in acetonitrile generated by laser flash photolysis of 0.65 mM PSH. .......... 131
Figure 2-19. Transient signal for the buildup of HO-TS• at 392 nm in the presence of 0.120 M
tert-butyl methyl ether in acetonitrile generated by laser flash photolysis of 0.65 mM PSH.
........................................................................................................................................... 132
Figure 2-20. Transient signal for the buildup of HO-TS• at 392 nm in the presence of 0.070 M
tert-butyl ethyl ether in acetonitrile generated by laser flash photolysis of 0.65 mM PSH.
........................................................................................................................................... 133
Figure 2-21. Transient signal for the buildup of HO-TS• at 392 nm in the presence of 0.100 M
tetrahydrofuran in acetonitrile generated by laser flash photolysis of 0.65 mM PSH...... 134
Figure 2-22. Transient signal for the buildup of HO-TS• at 392 nm in the presence of 0.020 M
methylene chloride in acetonitrile generated by laser flash photolysis of 0.65 mM PSH. 135
Figure 2-23. Transient signal for the buildup of HO-TS• at 392 nm in the presence of 0.050 M
acetone in acetonitrile generated by laser flash photolysis of 0.65 mM PSH. .................. 136
Figure 2-24. Transient signal for the buildup of HO-TS• at 392 nm in the presence of 0.045 M
bromoform in acetonitrile generated by laser flash photolysis of 0.65 mM PSH. ............ 137
Figure 2-25. Transient signal for the buildup of HO-TS• at 392 nm in the presence of 0.045 M
chloroform in acetonitrile generated by laser flash photolysis of 0.65 mM PSH. ............ 138

ix
Figure 2-26. Transient signal for the buildup of HO-TS• at 392 nm in the presence of 0.110 M
chloroacetic acid in acetonitrile generated by laser flash photolysis of 0.65 mM PSH. ... 139
Figure 2-27. Concentration profile for the reaction of HO• with tetramethylbutane in acetonitrile
in the presence of 1.5 mM trans-stilbene as a spectroscopic probe (monitoring the buildup
of the 392 nm transient attributable to HO-TS•)............................................................... 140
Figure 2-28. Concentration profile for the reaction of HO• with hexane in acetonitrile in the
presence of 1.5 mM trans-stilbene as a spectroscopic probe (monitoring the buildup of the
392 nm transient attributable to HO-TS•) ........................................................................ 141
Figure 2-29. Concentration profile for the reaction of HO• with heptane in acetonitrile in the
presence of 1.5 mM trans-stilbene as a spectroscopic probe (monitoring the buildup of the
392 nm transient attributable to HO-TS•) ........................................................................ 142
Figure 2-30. Concentration profile for the reaction of HO• with methylcyclohexane in
acetonitrile in the presence of 1.5 mM trans-stilbene as a spectroscopic probe (monitoring
the buildup of the 392 nm transient attributable to HO-TS•) ........................................... 143
Figure 2-31. Concentration profile for the reaction of HO• with cyclohexane in acetonitrile in
the presence of 1.5 mM trans-stilbene as a spectroscopic probe (monitoring the buildup of
the 392 nm transient attributable to HO-TS•) .................................................................. 144
Figure 2-32. Concentration profile for the reaction of HO• with dimethylbutane in acetonitrile in
the presence of 1.5 mM trans-stilbene as a spectroscopic probe (monitoring the buildup of
the 392 nm transient attributable to HO-TS•) .................................................................. 145
Figure 2-33. Concentration profile for the reaction of HO• with 1-butanol in acetonitrile in the
presence of 1.5 mM trans-stilbene as a spectroscopic probe (monitoring the buildup of the
392 nm transient attributable to HO-TS•) ........................................................................ 146

x
Figure 2-34. Concentration profile for the reaction of HO• with ethanol in acetonitrile in the
presence of 1.5 mM trans-stilbene as a spectroscopic probe (monitoring the buildup of the
392 nm transient attributable to HO-TS•) ........................................................................ 147
Figure 2-35. Concentration profile for the reaction of HO• with isopropanol in acetonitrile in the
presence of 1.5 mM trans-stilbene as a spectroscopic probe (monitoring the buildup of the
392 nm transient attributable to HO-TS•) ........................................................................ 148
Figure 2-36. Concentration profile for the reaction of HO• with methanol in acetonitrile in the
presence of 1.5 mM trans-stilbene as a spectroscopic probe (monitoring the buildup of the
392 nm transient attributable to HO-TS•) ........................................................................ 149
Figure 2-37. Concentration profile for the reaction of HO• with tert-butanol in acetonitrile in the
presence of 1.5 mM trans-stilbene as a spectroscopic probe (monitoring the buildup of the
392 nm transient attributable to HO-TS•) ........................................................................ 150
Figure 2-38. Concentration profile for the reaction of HO• with diethyl ether in acetonitrile in
the presence of 1.5 mM trans-stilbene as a spectroscopic probe (monitoring the buildup of
the 392 nm transient attributable to HO-TS•) .................................................................. 151
Figure 2-39. Concentration profile for the reaction of HO• with tert-butyl methyl ether in
acetonitrile in the presence of 1.5 mM trans-stilbene as a spectroscopic probe (monitoring
the buildup of the 392 nm transient attributable to HO-TS•) ........................................... 152
Figure 2-40. Concentration profile for the reaction of HO• with tert-butyl ethyl ether in
acetonitrile in the presence of 1.5 mM trans-stilbene as a spectroscopic probe (monitoring
the buildup of the 392 nm transient attributable to HO-TS•) ........................................... 153
xi
Figure 2-41. Concentration profile for the reaction of HO• with tetrahydrofuran in acetonitrile
in the presence of 1.5 mM trans-stilbene as a spectroscopic probe (monitoring the buildup
of the 392 nm transient attributable to HO-TS•) .............................................................. 154
Figure 2-42. Concentration profile for the reaction of HO• with methylene chloride in
acetonitrile in the presence of 1.5 mM trans-stilbene as a spectroscopic probe (monitoring
the buildup of the 392 nm transient attributable to HO-TS•) ........................................... 155
Figure 2-43. Concentration profile for the reaction of HO• with acetone in acetonitrile in the
presence of 1.5 mM trans-stilbene as a spectroscopic probe (monitoring the buildup of the
392 nm transient attributable to HO-TS•) ........................................................................ 156
Figure 2-44. Concentration profile for the reaction of HO• with bromoform in acetonitrile in the
presence of 1.5 mM trans-stilbene as a spectroscopic probe (monitoring the buildup of the
392 nm transient attributable to HO-TS•) ........................................................................ 157
Figure 2-45. Concentration profile for the reaction of HO• with chloroform in acetonitrile in the
presence of 1.5 mM trans-stilbene as a spectroscopic probe (monitoring the buildup of the
392 nm transient attributable to HO-TS•) ........................................................................ 158
Figure 2-46. Concentration profile for the reaction of HO• with chloroacetic acid in acetonitrile
in the presence of 1.5 mM trans-stilbene as a spectroscopic probe (monitoring the buildup
of the 392 nm transient attributable to HO-TS•) .............................................................. 159
Figure 2-47. Transient signal for the buildup of HO-TS• at 392 nm in the presence of 0.040 M
hexane in 10% water/ 90% acetonitrile generated by laser flash photolysis of 0.65 mM
PSH.................................................................................................................................... 160

xii
Figure 2-48. Transient signal for the buildup of HO-TS• at 392 nm in the presence of 0.045 M
cyclohexane in 10% water/ 90% acetonitrile generated by laser flash photolysis of 0.65
mM PSH. ........................................................................................................................... 161
Figure 2-49. Transient signal for the buildup of HO-TS• at 392 nm in the presence of 0.045 M
dimethylbutane in 10% water/ 90% acetonitrile generated by laser flash photolysis of 0.65
mM PSH. ........................................................................................................................... 162
Figure 2-50. Transient signal for the buildup of HO-TS• at 392 nm in the presence of 0.045 M
ethanol in 10% water/ 90% acetonitrile generated by laser flash photolysis of 0.65 mM
PSH.................................................................................................................................... 163
Figure 2-51. Transient signal for the buildup of HO-TS• at 392 nm in the presence of 0.045 M
bromoform in 10% water/ 90% acetonitrile generated by laser flash photolysis of 0.65 mM
PSH.................................................................................................................................... 164
Figure 2-52. Transient signal for the buildup of HO-TS• at 392 nm in the presence of 0.040 M
chloroform in 10% water/ 90% acetonitrile generated by laser flash photolysis of 0.65 mM
PSH.................................................................................................................................... 165
Figure 2-53. Concentration profile for the reaction of HO• with hexane in 10% water/90%
acetonitrile in the presence of 1.5 mM trans-stilbene as a spectroscopic probe (monitoring
the buildup of the 392 nm transient attributable to HO-TS•) ........................................... 166
Figure 2-54. Concentration profile for the reaction of HO• with cyclohexane in 10% water/90%
acetonitrile in the presence of 1.5 mM trans-stilbene as a spectroscopic probe (monitoring
the buildup of the 392 nm transient attributable to HO-TS•) ........................................... 167

xiii
Figure 2-55. Concentration profile for the reaction of HO• with dimethylbutane in 10%
water/90% acetonitrile in the presence of 1.5 mM trans-stilbene as a spectroscopic probe
(monitoring the buildup of the 392 nm transient attributable to HO-TS•)....................... 168
Figure 2-56. Concentration profile for the reaction of HO• with ethanol in 10% water/90%
acetonitrile in the presence of 1.5 mM trans-stilbene as a spectroscopic probe (monitoring
the buildup of the 392 nm transient attributable to HO-TS•) ........................................... 169
Figure 2-57. Concentration profile for the reaction of HO• with bromoform in 10% water/90%
acetonitrile in the presence of 1.5 mM trans-stilbene as a spectroscopic probe (monitoring
the buildup of the 392 nm transient attributable to HO-TS•) ........................................... 170
Figure 2-58. Concentration profile for the reaction of HO• with chloroform in 10% water/90%
acetonitrile in the presence of 1.5 mM trans-stilbene as a spectroscopic probe (monitoring
the buildup of the 392 nm transient attributable to HO-TS•) ........................................... 171
Figure 2-59. Transient signal for the buildup of HO-TS• at 412 nm in the presence of 0.030 M
methanol in Freon-113 generated by laser flash photolysis of 0.65 mM PSH.................. 172
Figure 2-60. Transient signal for the buildup of HO-TS• at 412 nm in the presence of 0.045 M
cyclohexane in Freon-113 generated by laser flash photolysis of 0.65 mM PSH............. 173
Figure 2-61. Concentration profile for the reaction of HO• with methanol in Freon-113 in the
presence of 1.5 mM trans-stilbene as a spectroscopic probe (monitoring the buildup of the
412 nm transient attributable to HO-TS•) ........................................................................ 174
Figure 2-62. Concentration profile for the reaction of HO• with cyclohexane in Freon-113 in the
presence of 1.5 mM trans-stilbene as a spectroscopic probe (monitoring the buildup of the
412 nm transient attributable to HO-TS•) ........................................................................ 175
Figure 3-7. IR of HDPE pipe sample prior to initiation of accelerated aging (0 h)................... 195

xiv
Figure 3-8. IR of HDPE pipe sample after 45 days (1080 h) of accelerated aging at 50 mg/L Cl2.
........................................................................................................................................... 196
Figure 3-9. IR of HDPE pipe sample after 90 days (2160 h) of accelerated aging at 50 mg/L Cl2.
........................................................................................................................................... 197
Figure 3-10. IR of HDPE pipe sample after 190 days (4560 h) of accelerated aging at 500 mg/L
Cl2. ..................................................................................................................................... 198
Figure 3-11. IR of HDPE pipe sample after 45 days (1080 h) of accelerated aging at 500 mg/L
Cl2. ..................................................................................................................................... 199
Figure 3-12. IR of HDPE pipe sample after 90 days (2160 h) of accelerated aging at 500 mg/L
Cl2. ..................................................................................................................................... 200
Figure 3-13. IR of HDPE pipe sample after 190 days (4560 h) of accelerated aging at 500 mg/L
Cl2. ..................................................................................................................................... 201
Figure 3-14. IR of HDPE resin sample prior to initiation of accelerated aging (0 h)................ 202
Figure 3-15. IR of HDPE resin sample after 21 days (504 h) of accelerated aging at 50 mg/L Cl2.
........................................................................................................................................... 203
Figure 3-16. IR of HDPE resin sample after 90 days (2160 h) of accelerated aging at 50 mg/L
Cl2. ..................................................................................................................................... 204
Figure 3-17. IR of HDPE resin sample after 160 days (3840 h) of accelerated aging at 50 mg/L
Cl2. ..................................................................................................................................... 205
Figure 3-18. IR of HDPE resin sample after 21 days (504 h) of accelerated aging at 250 mg/L
Cl2. ..................................................................................................................................... 206
Figure 3-19. IR of HDPE resin sample after 90 days (2160 h) of accelerated aging at 250 mg/L
Cl2. ..................................................................................................................................... 207

xv
Figure 3-20. IR of HDPE resin sample after 160 days (3840 h) of accelerated aging at 250 mg/L
Cl2. ..................................................................................................................................... 208
Figure 3-21. IR of HDPE resin sample after 21 days (504 h) of accelerated aging at 250 mg/L
Cl2 in the presence of 18O2 (water not changed). ................................................................ 209
Figure 3-23. IR of HDPE resin sample after 21 days (504 h) of accelerated aging at 250 mg/L.
........................................................................................................................................... 210
xvi
List of Schemes
Scheme 1-1: Probe method........................................................................................................... 4
Scheme 1-2: Reactions occurring upon pulse radiolysis of water.......................................... 10
Scheme 1-3: Reactions occurring in pulse radiolysis of alcohols............................................ 12
Scheme 1-4: HO• trapping by polymer end groups................................................................. 12
Scheme 1-5: HO•/ probe ........................................................................................................ 13
Scheme 1-6: Chain reaction of HO• production...................................................................... 18
Scheme 1-7: Oxidative degradation of protein backbone....................................................... 18
Scheme 1-8: Chlorine speciation................................................................................................ 23
Scheme 1-9: Production of activated oxygen via chlorinated water ...................................... 25
Scheme 1-10: DMPO- hydroxyl radical products.................................................................... 26
Scheme 1-11: Proposed mechanism of PE oxidation in distilled water ................................. 28
Scheme 2-1: Chain reaction of PSH.......................................................................................... 48
Scheme 2-2: Parallel (pseudo) first order kinetics of X• ......................................................... 50
Scheme 2-3: Electron donation from oxygen in alcohols ........................................................ 58
Scheme 3-1: HOCl degradation to HCl and O2........................................................................ 79
Scheme 3-2: Mechanisms of HDPE Autooxidation................................................................ 100
Scheme 3-3: Possible mechanism of formation of DCMB and DMCP during auto-oxidation.
........................................................................................................................................... 102
Scheme 4-1. Hydroxyl induced DNA oxidation..................................................................... 113

xvii
List of Tables
Table 1-1. Summary of literature rate constants for gas phase HO• reactions ............................ 29
Table 2-1. kapp for pyrithiyl radical (PyrS•) disappearance and 2,2-dithiodipyridine (PyrS—SPyr)
formation ............................................................................................................................. 44
Table 2-2. Rate constants for hydrogen abstraction by HO• from various organic substrates in
CH3CN and H2Oa................................................................................................................. 46
Table 2-3. Rate constants for hydrogen abstraction by HO• from various organic substrates in
90% CH3CN:H2O and 100% CH3CN.................................................................................. 47
Table 2-4. Rate constant for hydrogen abstraction by HO• in CH3CN and Freon-113 ............... 52
Table 2-5. Barriers of the HO• + CH4 àààà H2O + CH3• reaction with various levels of solvationa
............................................................................................................................................. 63
Table 3-1. Relative intensities of carbonyl peaks in HDPE pipe accelerated aging studies. %
relative to C—H bend at 1462 cm-1..................................................................................... 86
Table 3-2. Relative intensities of carbonyl peaks in AO free HDPE resin accelerated aging
studies. Numbers reported as a percent of 1462 cm-1 peak (C—H stretch). ..................... 88
Table 4-1. Percent yield of 2-chloro-2,3-dimethylbutane.......................................................... 110
Table 2-7. Absolute energies and optimized geometries for calculated structures: HO•........... 176
Table 2-8. Absolute energies and optimized geometries for calculated structures: Water ........ 176
Table 2-9. Absolute energies and optimized geometries for calculated structures: Methane.... 177
Table 2-10. Absolute energies and optimized geometries for calculated structures: Methane/HO•
transition state.................................................................................................................... 178
Table 2-11. Absolute energies and optimized geometries for calculated structures: Methyl .... 179

xviii
Table 2-12. Absolute energies and optimized geometries for calculated structures: Chloroform
........................................................................................................................................... 180
Table 2-13. Absolute energies and optimized geometries for calculated structures:
Chloroform/HO• transition state........................................................................................ 181
Table 2-14. Absolute energies and optimized geometries for calculated structures: Cl3C•....... 182
Table 2-15. Absolute energies and optimized geometries for calculated structures: Methanol 183
Table 2-16. Absolute energies and optimized geometries for calculated structures:
Methanol/HO• transition state ........................................................................................... 184
Table 2-17. Absolute energies and optimized geometries for calculated structures: HOCH2•.. 185
Table 2-18. Absolute energies and optimized geometries for calculated structures: Methane.. 185
Table 2-19. Absolute energies and optimized geometries for calculated structures: HO•......... 185
Table 2-20. Absolute energies and optimized geometries for calculated structures: HO-CH4
transition state.................................................................................................................... 186
Table 2-21. Absolute energies and optimized geometries for calculated structures: HO•---H2O
(Hydrogen bond donor) ..................................................................................................... 186
Table 2-22. Absolute energies and optimized geometries for calculated structures: CH4-HO•---
H2O (Hydrogen bond donor) transition state..................................................................... 187
Table 2-23. Absolute energies and optimized geometries for calculated structures: HO•---H2O
(Hydrogen bond acceptor) ................................................................................................. 188
Table 2-24. Absolute energies and optimized geometries for calculated structures: CH4-HO•---
H2O (Hydrogen bond acceptor) transition state ................................................................ 188
Table 2-25. Absolute energies and optimized geometries for calculated structures: HO•---(H2O)2
(1 hydrogen bond donor, 1 hydrogen bond acceptor) ....................................................... 189

xix
Table 2-26. Absolute energies and optimized geometries for calculated structures: CH4-HO•---
(H2O)2 (1 hydrogen bond donor, 1 hydrogen bond acceptor) transition state................... 190
Table 2-27. Absolute energies and optimized geometries for calculated structures: HO•---(H2O)2
(2 hydrogen bond donors, 1 hydrogen bond acceptor)...................................................... 191
Table 2-28. Absolute energies and optimized geometries for calculated structures: CH4-HO•---
(H2O)3 (2 hydrogen bond donor, 1 hydrogen bond acceptor) transition state................... 192

xx
List of Abbreviations
23DMB 2,3-dimethylbutane ALS Amyotrophic lateral sclerosis BDE bond dissociation energy C celcius Cl• chlorine radical
Cl2 chlorine ClO• hypochlorite radical cm centimeter
cm-1 wavenumber DCMB 2,3-dichloro-2-methylbutane DMCP 3-chloro-1,1-dimethylpropanol DMPO 5,5-dimethyl-1-pyrroline-N-oxide DMSO dimethylsulfoxide DNA Deoxyribose nucleic acid DOC chlorine dioxide
e- electron ESR electron spin resonance F farenheit
FC correction factor FT-IR Fourier Transform-Infrared GC gas chromatography H enthlapy H-atom hydrogen atom HDPE high density polyethylene HO• hydroxyl Radical HOO• peroxyl radical HRMS high resolution mass spectroscopy I intensity IR infrared JACS J. Am. Chem. Soc. K Kelvin kcal kilocalories KIE kinetic isotope effect l liter LDPE low density polyethylene LFP laser flash photolysis M molarity (moles/liter) MDPE medium density polyethylene

xxi
mg milligram mm millimeter mM millimolar (millimoles/liter) Mol moles MS mass spectroscopy ms millisecond N number of moles
NCH2C• acetonitrile radical nm nanometers NMR nuclear magnetic resonance PE polyethylene ppm parts per million PSH N-hydroxypyridine-2-thione PyrS• pyrithiyl radical (name) PyrS—SPyr pyrithiyldimer (name) R gas constant R• alkyl radical RH alkane RNA Ribonucleic Acid RO• alkoxyl radical ROS reactive oxygen species RSH thiol S entropy T temperature
Tg glass-transition temperature
Tm melting temperature TS trans-stilbene t-SB trans-stilbene US United States UV/Vis ultraviolet/visible V volume XPS X-ray photoelectron spectroscopy

xxii
Acknowledgements
I would like to start by thanking the Lord, not only for His divine intervention in my
decision to come to Virginia Tech, or His strength and guidance in seeing me through this
process, but also for the unending grace that he bestowed upon my advisor and committee in
dealing with me for the last five years.
There are many, many, many people who have contributed love, advice, experience and
sometimes name-calling for the sole purpose of seeing my fulfillment of a PhD. Of specific
importance is my advisor, Dr. Jim Tanko. Dr. Tanko, without your help I never could have
accomplished a graduate degree… And yet, even with your help I still managed to miss virtually
all of my deadlines. I would also like to express my sincerest appreciation to the members of
my committee both past and present; Dr. Paul Carlier for his extensive efforts in teaching me
organic chemistry, as well as encouraging me to “talk to my inner chemist”, Dr. Andrea Dietrich
for not only teaching me the ropes as a water chemist, but also allowing me the pleasure of being
a honorary member of her group, Dr. David Kingston for both his chemical and spiritual
expertise, Dr. Tim Long for sharing his knowledge of polymer chemistry, encouraging me as a
scientist and- most importantly- inspiring me to work hard at the gym, Dr. Craig Thatcher for
serving on my committee during his tenure here- despite multiple and unending responsibilities,
and Dr. Diego Troya for his direct contributions to my work, as well as graciously serving on my
committee in the later stages of my PhD career. I’d like to especially thank Dr. Garth Wilkes for
his very insightful consultations on polymer chemistry and direction in my research project.
Additionally, a very special note of thanks goes out to Dr. Deck, who has been incredibly helpful
in every step of my long and arduous graduating process.
xxiii
Albeit not an “official” member of my committee, an enormous thank you goes out to my
dear friend Andrew Whelton. Andy, I have appreciated your mentorship, advice and knowledge
almost as much as I have appreciated your friendship.
I’d like to also thank the students and staff members who I have had the pleasure of
working with during my time here at Virginia Tech: Michelle Grimm, Jared Spencer, Akiko
Nakamura, Shraddha Patil-Patwardhan, Tyler Horseman, Jun Yin, Liang Chen, Hayati Celik,
Stephanie Zimmeck, Angie Miller, Kay Castagnoli, Claire Santos, Tom Bell, Bill Bebout and all
of Analytical Services for their time and efforts in helping me succeed.
Most importantly are the people for whom I could always count on for emotional support
and guidance- my friends and family. Amber Nicole Hancock, I do not even know which is of
greater value to me, your friendship or my PhD. Fortunately, I get them both. I cannot express
how much your friendship and loyalty has meant to me over the past five years. All I can do is
promise not to wake you up at two in the morning to try to explain how much your friendship
and loyalty has meant to me over the past five years. Barbara Macri (as well as Richard and
Stephen), you have been and continue to be my family and I am ever so lucky to have met you.
Nipa Deora Alvares and Sampada Karkare, I do not know where I would be without you. Had
you two not taken me under your wing and taught me even the very basics of chemistry (i.e.
“What is C2 symmetry?”) I do not know that I would be here today. And to the Tanko group as
a whole, my unending thanks and appreciation for all the help, guidance and education that you
have bestowed upon me.
I also feel the intense need to thank those who have spent the past five years entertaining
me. So John, Paul, Ringo and George- thanks guys. You made working in lab much more

xxiv
enjoyable. And to Jon Stewart and Stephen Colbert, thanks not only for the entertainment, but
also for putting your respective shows in a time slot where I could actually enjoy them.
And to my wonderful family, Mom, Dad, Chris, Jenny, Angie, Damon, Matthew and
Morgan, and of course baby Lilly, I will never be able to fully express how much you all mean to
me, but I will try. You have all been my rock and inspiration throughout the past five years.
When things were rough, I could always look forward to seeing you guys and it would put a
smile on my face (and it always will). Thank you so much for your love and encouragement- I
certainly could not have done this without you.
To all who I have missed, I am greatly sorry… but I will try to do better in the
acknowledgements of my next 200 page document so be watching!
Finally, I would like to once again thank Jim Tanko. Dr. Tanko your encouragement and
faith in me can never be repaid, but please rest assured I will spend the rest of my life being
grateful for it.
Lovingly Dedicated to Felix & Lillian Restuccia and George & Margaret Mitroka

1
Chapter 1 Radical Chemistry: Methods, Reactivities, and Degradation
Processes
1.1 Introduction
It has been well established that oxidative damage is responsible, at least in part, for
many degradative processes. Reactive oxygen species (ROS) are increasingly being explored as
the etiology of many diseases. Conditions such as cancer,1, 2 ALS and Parkinson’s disease3, 4 are
believed to be the result of oxidative stress to the body. ROS are also known to be of great
significance in environmental chemistry and materials science. These highly reactive species are
known to play a major part in the breakdown of many materials. Because of this fact, there is an
increasing interest in exploring the chemistry of reactive oxygen species on a fundamental level.
The hydroxyl radical (HO•) can be formed through a variety of different means that allow it to be
studied in various environments (i.e. gas phase, aqueous solution, etc.) The complexity of the
pathways through which these processes occur requires that the molecular mechanisms be first
examined in a smaller, more controlled environment. Once an understanding of the production
and activity of these radicals has been established, the model of such a mechanism can be
extrapolated to the more complicated systems.
1.2 Photochemistry and Chemical Kinetics--Theory
In pulse radiolysis, a sample is exposed to a high energy pulse of monochromatic light.
This sudden flash of light causes immediate photo-excitation of the sample, which then leads to
the chemical events that are to be monitored.5 The energy provided is sufficiently intense to
create very reactive species, such as radicals. Generally, the pulse should be able to produce a

2
measurable change in the system, typically an amount of product in the range of 10-5 to 10-2 M ,
which is desirable for UV/Vis detection.5
Once the radical of interest has been generated, it can react with its intended substrate.
There are several methods which may be used to monitor the progress of the reaction, the most
common of which is optical absorption. Common optical detectors span wavelengths of
approximately 3-0.2 micrometers.6 The response time of the system is generally very rapid,
usually on the order of a few nanoseconds.6 The absorption of a species is monitored as a
function of time to deduce the rate of the reaction.
The rate of bimolecular reactions is often determined under pseudo-first order conditions.
Given a reaction:
(1-1)
The rate of the reaction can be expressed as ]][[][
BAkdt
Ad =−. If the concentration of species B
were inflated to the point that it stayed approximately constant throughout the reaction (at least
10 times the concentration of A), then the expression could be reduced to ][][
Bkdt
Adobs=−
,
where 0][Bkkobs = , and 0][B represents the initial concentration of B. Combining like terms
and integrating over all time, the expression further reduces to:
[ ] tkt
obseAA −= 0][ (1-2)
nd expressed in term of optical absorbance:
tkAA
AAobs
o
t −=
−−
∞
∞ln (1-3)

3
Once kobs has been established, the absolute rate constant can be determined by varying the
concentration of species B. This determination is also done via linear regression where:
0][Bkkobs = (1-4)
where the absolute rate constant is a slope of the graph of 0][B vs. obsk . In a system involving very reactive species, such as a ROS, more than one reaction may
be taking place. For example, reactive species A may react not only with B but also with one or
more other species in the system (such as the solvent, C):
(1-5)
(1-6) The rate of the reaction v, will be:
][ Akv obs= (1-7)
where kobs is equal to the sum of all of the micro rate constants for reactions that A undergoes.7
Parallel first- or pseudo-first order reactions provide the basis for a technique known as the probe
method. The intermediate is reacted with a substrate that produces an observable product- alone
and in the presence of the substrate of interest. The difference in activity allows a reaction with
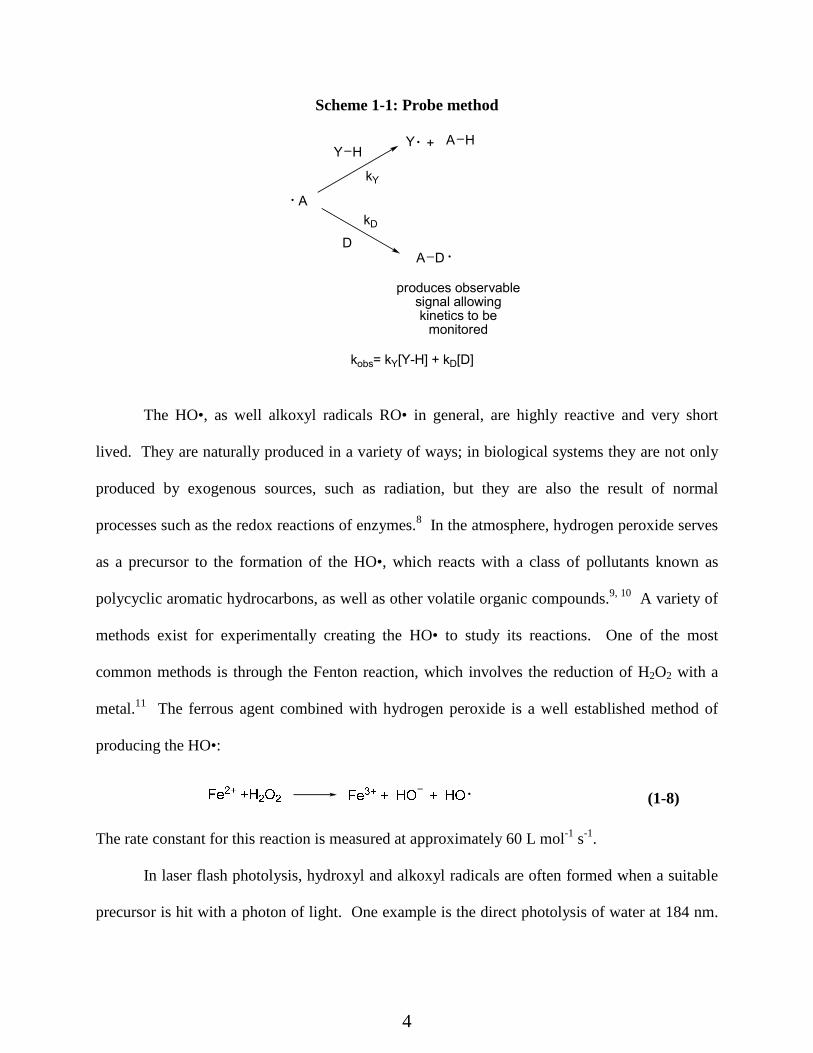
no detectable product or intermediate to be kinetically monitored, as illustrated in Scheme 1-1.
4
Scheme 1-1: Probe method
A
Y H+ A H
A D
produces observablesignal allowingkinetics to bemonitored
kD
kY
kobs= kY[Y-H] + kD[D]
D
Y
The HO•, as well alkoxyl radicals RO• in general, are highly reactive and very short
lived. They are naturally produced in a variety of ways; in biological systems they are not only
produced by exogenous sources, such as radiation, but they are also the result of normal
processes such as the redox reactions of enzymes.8 In the atmosphere, hydrogen peroxide serves
as a precursor to the formation of the HO•, which reacts with a class of pollutants known as
polycyclic aromatic hydrocarbons, as well as other volatile organic compounds.9, 10 A variety of
methods exist for experimentally creating the HO• to study its reactions. One of the most
common methods is through the Fenton reaction, which involves the reduction of H2O2 with a
metal.11 The ferrous agent combined with hydrogen peroxide is a well established method of
producing the HO•:
(1-8)
The rate constant for this reaction is measured at approximately 60 L mol-1 s-1.
In laser flash photolysis, hydroxyl and alkoxyl radicals are often formed when a suitable
precursor is hit with a photon of light. One example is the direct photolysis of water at 184 nm.
5
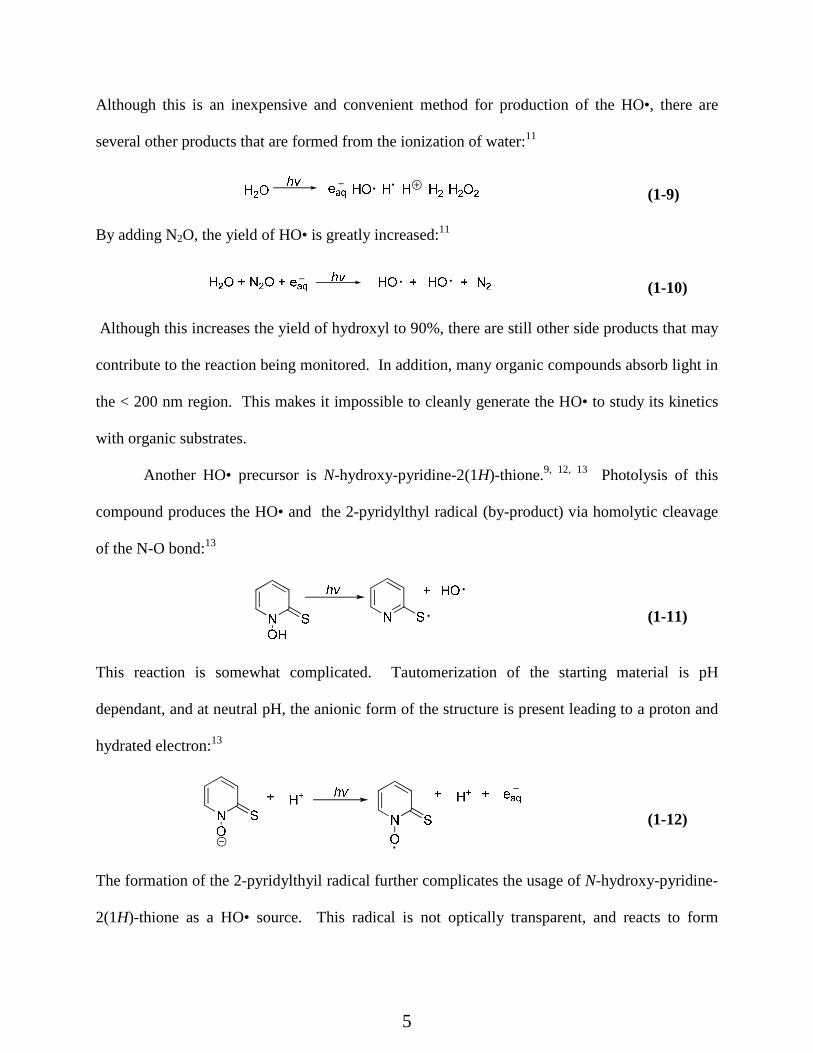
Although this is an inexpensive and convenient method for production of the HO•, there are
several other products that are formed from the ionization of water:11
(1-9)
By adding N2O, the yield of HO• is greatly increased:11
(1-10)
Although this increases the yield of hydroxyl to 90%, there are still other side products that may
contribute to the reaction being monitored. In addition, many organic compounds absorb light in
the < 200 nm region. This makes it impossible to cleanly generate the HO• to study its kinetics
with organic substrates.
Another HO• precursor is N-hydroxy-pyridine-2(1H)-thione.9, 12, 13 Photolysis of this
compound produces the HO• and the 2-pyridylthyl radical (by-product) via homolytic cleavage
of the N-O bond:13
(1-11)
This reaction is somewhat complicated. Tautomerization of the starting material is pH
dependant, and at neutral pH, the anionic form of the structure is present leading to a proton and
hydrated electron:13
(1-12)
The formation of the 2-pyridylthyil radical further complicates the usage of N-hydroxy-pyridine-
2(1H)-thione as a HO• source. This radical is not optically transparent, and reacts to form

6
dimers. Absorption from the resulting dimers may interfere with monitoring the desired
reaction.14
Additional methods for developing a clean source for HO• are currently being
investigated. One such method uses the structurally similar N-hydroxy-2(1H)-pyridone.13 The
HO• is produced similarly through homolytic N-O bond cleavage. However, as opposed to N-
hydroxy-pyridine-2(1H)-thione, in neutral solution the keto tautomer is the dominant species,
leading primarily to the formation of the HO•. The 2-pyridyloxyl radical is also much less
reactive than its sulfur analog. If used in a biological system,13 this would ensure that the
relative rate of reaction is due solely to the actions of the HO•:13
(1-13)
1.3 HO• Reactions: Methods and Rates of Hydrogen Abstraction
The oxidation of alkanes with the HO• play a central role in combustion and atmospheric
chemistry.15, 16 Because of this, many of the reported kinetic have been performed in the gas
phase, using a variety of different conditions and methods. Bayes et al. studied the rates of
hydrogen abstraction from several alkanes and cycloalkanes15 via competition experiments with
ethane, whose rate constant for reaction with HO• is well-established. 15, 16
The method involved measuring the fractional loss of the alkane of interest and the
reference compound (ethane) then determining the rate constant ratio using the mathematical
equation:
reference
reactant
reference
reactant
)ln(
)ln(
DF
DF
k
k= (1-14)

7
where DF is the ratio of the initial concentration of said species to the final concentration. Rate
constants were determined over a temperature range from 230 to 430 K. At 298 K the results
were in good agreement with published data, however at temperatures below 270 K, several
reactants showed little of the curvature previously reported and attributed to nonlinear Arrhenius
behavior. Bayes suggests this detail to a systematic error; while absolute measurements (from
literature) did show non-linear Arrhenius behavior, these results were not replicated when using
relative rate data (as employed by Bayes) at low temperatures. He suggests that what is
occurring is loss of the hydroxyl radical to impurities which would effectively interfere with
absolute measurements, but not relative measurements. Thus, Bayes favors his method of using
relative measurements rather than absolute data for obtaining rate constants at lower
temperatures. He does concede that at temperatures above 270 K, relative and absolute
measurements are essentially the same (within 5%).
Anderson et al. performed similar studies of the HO• reactions with ten different alkanes
over a temperature range of 300 to 400 K.16 These reactions were carried out in the gas phase
using a high pressure flow system. By observing the kinetics of the hydrogen abstraction
reaction over a wide range of temperatures, Anderson was able to determine the Arrhenius
parameters specific to each alkane, by using a modified form of the Arrhenius equation
consistent with transition state theory:16
−
−
=−−
−
T
v
T
v
T
E
eeT
BeTk
a
244.12144.1
11
)( (1-15)
In this equation v1 is the degeneracy of the C-H-O bend, v2 is the H-O-H bend frequency, and B
is the pre-exponential factor. This equation assumes a late transition state in which the
intermediate resembles the products. The C-H-O (hydrogen abstraction from the alkane) axis is

8
almost linear and the H-O-H axis (formation of water from abstraction) is bent, similar to the
structure of the water produced.16
Anderson and coworkers also used a less established technique to determine the same
rate constants. Gas phase techniques, such as those previously employed by the group, show
strong non-Arrhenius behavior at low temperatures when the reaction has a the loose transition
state with no well-defined free energy maximum, such as those typical for these radical
reactions.16, 17 This is due to the plug-flow approximation that is employed in traditional flow
techniques. The flow tube is operated at lower pressures to ensure mixing of the reactants in the
tube via diffusion and to allow reaction distances to be converted into reaction time.18 The
continuity of flow in this method is determined using the equation:
( ) Ckr
C
rr
C
z
CD
z
Crv 12
2
2
2 1 +
∂∂+
∂∂+
∂∂=
∂∂
(1-16)
where r is the radial coordinate, z is the axial coordinate, v(r) is the bulk velocity, D is the
molecular diffusion coefficient, C is the concentration of the limiting reagent and k1 is the first
order rate constant.17 The new high pressure system employed by Anderson does not require
this approximation. Instead radial profile and the radical concentration profiles are used
simultaneously to determine the continuity for a rate constant.17 Anderson used this method to
determine several rate constants, all of which were similar to those previously determined.
Droege and Tully examined the rate constant for reaction of HO• with cyclohexane and
cyclopentane, as well as their deuterated counterparts.19 Experiments were again performed in
the gas phase via laser photolysis, using time resolved HO• profiles to determine the loss of HO•.
The concentration of the HO• was monitored using laser-induced fluorescence near 307 nm. In
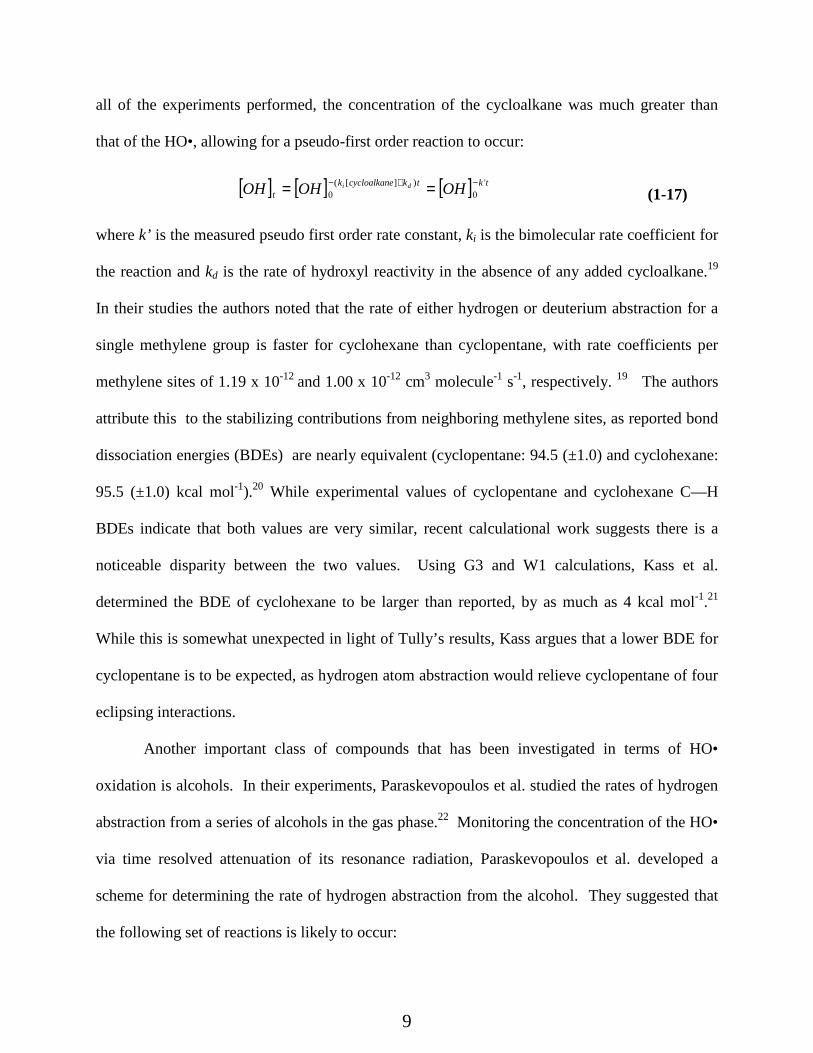
9
all of the experiments performed, the concentration of the cycloalkane was much greater than
that of the HO•, allowing for a pseudo-first order reaction to occur:
[ ] [ ] [ ] tktkecycloalkankt OHOHOH di '
0)][(
0−+− == (1-17)
where k’ is the measured pseudo first order rate constant, ki is the bimolecular rate coefficient for
the reaction and kd is the rate of hydroxyl reactivity in the absence of any added cycloalkane.19
In their studies the authors noted that the rate of either hydrogen or deuterium abstraction for a
single methylene group is faster for cyclohexane than cyclopentane, with rate coefficients per
methylene sites of 1.19 x 10⁻¹² and 1.00 x 10⁻¹² cm3 molecule-1 s-1, respectively. 19 The authors
attribute this to the stabilizing contributions from neighboring methylene sites, as reported bond
dissociation energies (BDEs) are nearly equivalent (cyclopentane: 94.5 (±1.0) and cyclohexane:
95.5 (±1.0) kcal mol-1).20 While experimental values of cyclopentane and cyclohexane C—H
BDEs indicate that both values are very similar, recent calculational work suggests there is a
noticeable disparity between the two values. Using G3 and W1 calculations, Kass et al.
determined the BDE of cyclohexane to be larger than reported, by as much as 4 kcal mol-1.21
While this is somewhat unexpected in light of Tully’s results, Kass argues that a lower BDE for
cyclopentane is to be expected, as hydrogen atom abstraction would relieve cyclopentane of four
eclipsing interactions.
Another important class of compounds that has been investigated in terms of HO•
oxidation is alcohols. In their experiments, Paraskevopoulos et al. studied the rates of hydrogen
abstraction from a series of alcohols in the gas phase.22 Monitoring the concentration of the HO•
via time resolved attenuation of its resonance radiation, Paraskevopoulos et al. developed a
scheme for determining the rate of hydrogen abstraction from the alcohol. They suggested that
the following set of reactions is likely to occur:

10
Scheme 1-2: Reactions occurring upon pulse radiolysis of water
H2O
(1)
(2)
(3)
(4)
HO + H
HO + ROH HOR' + H2O
HO + HOR' products
HO + HO H2O2
HO + H H2O
k2
k1a
k1b
k1c
where HOR’ • is the result of the hydrogen abstraction reaction by the HO•. While the authors
don’t specifically comment on whether abstraction at the OH site of the alcohol take place, they
do comment that the expected product is a carbon-centered radical, indicating the only C—H
abstraction would occur. By setting up a pseudo first order system in which the concentration of
the alcohol is much greater than that of the HO•, the authors were able to establish the rate of
hydrogen abstraction (Equation 2, Scheme 1-2) using a set of two equations22:
[ ] [ ] [ ][ ]OHROHkOHkdt
OHd'21 ••+•=•−
(1-18)
[ ] [ ] [ ][ ]OHROHkOHkdt
OHRd'
'21 ••−•=•−
(1-19)
The authors used these equations as a means of differentiating between HO• loss via hydrogen
atom abstraction and HO• loss via addition to carbon-centered radicals. The term k1 is the
overall rate constant of HO• decay (which is being monitored, and is the sum of k1a, k1b, k1c and k2
in Scheme 1-3). The term k2 is assigned a value of 2 x 1014 cm3 mol-1 s-1 (the collision rate). The
authors then numerically integrated these equations and determined a corrected value for k1,
which was then used to determine the rate constant of the HO• reacting with an alcohol:22

11
[ ]ROHkk αα 11 += (1-20)
Although the authors went through great lengths to correct for any additional loss of hydroxyl
radical (other than reacting with the alcohol), their rate constants showed no significant
difference from previously reported data.
To further probe where the primary site of hydrogen abstraction may be, several studies
involving isotopic labeling have been conducted. Hess and Tully examined the deuterium
isotope effects on the rate of abstraction from methanol over the temperature range of 293-866
K.23 Using a three parameter expression the authors were able to establish the absolute rate
constants:23
CH3OH: molRTcaleTTk
/88365.2201089.5)( −×= (1-21)
CD3OH: molRTcaleTTk
/127565.23482221028.1)( −×= (1-22)
Abstraction is slower for the deuterated form of methanol over the entire temperature range
examined. However the difference in rate between the two varies with increasing temperature.
The authors suggest that the overall abstraction rate is the combination of two processes:
OHCD
CHoverall kkk +=3
3
(1-23)
At lower temperatures, the overall rate is dominated by hydrogen abstraction from the methyl
group, due to the large kinetic isotope effect seen. At higher temperatures, the KIE decreases
indicating the increasing importance of the OH hydrogen abstraction23.

12
While gas phase reactions are imperative to understanding the HO• reactivity in many
environmental processes, equally- if not more important- is the study of the HO• in aqueous
solution. Similar alcohol studies were conducted by Janata et al., who used pulse radiolysis to
monitor reaction of alcohols .24 Like Paraskevopoulos, a series of equations to describe all
possible processes that might occur in the system was derived:
Scheme 1-3: Reactions occurring in pulse radiolysis of alcohols
To determine the rate constant for the desired reaction (Equation 1, Scheme 1-3), computer
simulations (using previously determined rate constants for reactions 2-7) were employed.25 The
values obtained by Janata were congruent with previously obtained values for this set of
reactions.
Another important class of compounds that undergo this type of hydrogen abstraction is
amines. Pramanick and Bhattacharyya have studied the rates of abstraction for several amines
using entrapping mechanisms for polymer end groups.26 Using Fenton chemistry to create the
HO•, the authors studied several different amines via the reactions outlined in Scheme 1-4:26
Scheme 1-4: HO• trapping by polymer end groups

13
where the amine (X) is now trapped as a polymer end group and can be examined via a dye
partitioning technique.26 In this process, polymer samples were taken at different time intervals,
and carefully washed and dried. The rate of abstraction was the slope of the plot of the degree of
polymerization against time. Through this method, the authors were able to establish the rate
constants for hydrogen abstraction (from carbon) for several different amines. In addition they
also examined the rate of reactivity for different classes of amines. The reactivity order revealed
that secondary amines were the most reactive, with tertiary amines being only slightly less
reactive and primary compounds being the least reactive.26 This trend is a combination of both
steric effects and activation of the methylene group from which abstraction is occurring. The
neighboring alkyl substituents increase reactivity for both secondary and tertiary amines.
However the steric bulk of the tertiary amines negates part of this activation, decreasing the rate
of abstraction relative to secondary amines.
Other classes of organic compounds have also been widely studied. Thomas examined
the rate of the HO• with several alcohols, as well as diethyl ether and acetone via competition
kinetics with the iodide ion (I-).27 Scheme 1-5 illustrates the mechanics of this: the OH radical
was generated via pulse radiolysis with the iodide reaction product ( ) used as a probe.
Scheme 1-5: HO•/ probe
HO + I- HO + I
I + I I2
Although the reaction of HO• and diethyl ether is clearly hydrogen abstraction, the author did not
comment on whether the reaction with acetone was hydrogen abstraction or addition to the
carbonyl carbon. However, Walling and co-workers had later reported a significant isotope
effect between acetone and d6-acetone (kH/kD= 3.54), indicating hydrogen abstraction as the
λmax= 400 nm

14
likely pathway.28 Neta et al. used similar methods, gamma radiolysis and competition kinetics,
to determine the HO• reactivity with several compounds, including both chloroform and
acetonitrile.29 Rate constants were found to be remarkably lower for these two compounds than
for other aliphatic compounds examined. The authors determined the relative substituent effects
on a series of substituted methanes (Figure 1-1):
Figure 1-1. Relative reactivity of HO• towards substituted methanes (CH3—X)
wherein presence of a cyano group greatly decreases the reactivity of methane, and presence of
an amine causes a significant increase in reactivity.
The HO• is known to play a role in the oxidation of polymer based pipes, and is also
believed to interact with drinking water contaminants.30, 31 Haag and Yao studied the reaction of
the HO• with 25 potential drinking water contaminants, including dichloromethane, bromoform
and chloroform.31 Several different methods were used to create the HO• in aqueous media,
including the photo Fenton method and ozone decomposition, depending on the light stability of
the compound being examined. All reactions were monitored via competition kinetics using the
equation:
[ ]
[ ]COH
MOH k
CC
MM
k •
∞
∞• ==
][ln
][ln
0
0
(1-24)
Where M is the substrate and C is the reference compound. As seen in Neta’s work, compounds
containing halogen substituents, namely dichloromethane, chloroform and bromoform, all

15
proved to have rate constants significantly lower (1 to 2 orders of magnitude) than reported
values given for hydrocarbons or alcohols.
1.4 HO• Additions
When reacting with conjugated systems, the HO• generally undergoes an addition
reaction preferentially to the hydrogen abstraction reaction. This is of extreme importance in
areas such as environmental science, where polyaromatic systems are commonly produced as
byproducts of burning fuels. Platz et al. studied the reactivity of the HO• with a series of
conjugated hydrocarbons in acetonitrile.9 Using several deuterated compounds, the kinetic
isotope effects were also established. The authors determined that the primary pathway for each
of the aromatic systems studied was, in fact, the addition reaction. The authors also noticed that
the rate constants for addition reaction were smaller in acetonitrile than those that had been
established for the same reaction in water. This was attributed to a stabilization of the transition
state compared to reactants by hydrogen bonding with water (Figure 1-2). 9
Figure 1-2. Stabilization of transition state in HO• addition reaction
Energy
Reaction Coordinate
Transition State
Starting Material
Product
Stabilization f rom hydrogen bonding
OH
OH
HO
H
H
OH
δ−δ+
OH addition in CH3CN
OH addition in H2O

16
In a similar study, Albarran and Schuler examined the effects of substituents on the
addition of the HO• to aromatic rings.32 The strong electrophilic character of the HO• leads it to
add to the most electron rich sites. For the meta substituted cresol, the ortho- and para- products
predicted by the Hamett equation were observed. In the case of para-cresol, only two products
are expected but four were determined to be present. For ortho-cresol, five products are
expected, and seven were determined to be present. The additional products were determined to
be both the ipso product as well as the corresponding para- and ortho- dienones (Figure 3). For
each of these compounds, both the hydroxyl and methyl substituents belonging to cresol effect
the electrophilic addition reaction of the HO•.32 The methyl substitution clearly has a much
more profound effect on the addition to ortho- and para- cresol than when substituted in the
meta- position, as shown in Figure 1-3.
Figure 1-3. HO• addition products to cresols
1.5 Alkoxyl Radical Reactions.
Although the HO• is the most aggressive of the reactive oxygen species, alkoxyl radicals
are also very powerful oxidizing agents. One of the most widely studied alkoxyl radicals is the
tert-butoxyl radical. Tanko et al. have studied the reactivity of this radical oxygen species as a
model for C-H bond cleavage for several enzyme catalyzed reactions.33 This radical shows
similar reactivity to the P-450 enzyme and is a useful model for biological systems.34 The tert-
butoxyl radical shows mild selectivity, as expected for alkanes, however, the trend of increasing
hydrogen atom abstraction rate with decreasing bond strength is not seen in tertiary amines, or

17
for substrates with bond dissociation energies below 92 kcal/mol.35 The fact that this reaction
does not follow the typical structure/reactivity relationships is due to the reaction being entropy
controlled, rather than the more common enthalpy controlled reaction. The tert-butoxyl radical is
so reactive that the rate of hydrogen abstraction is based more upon accessibility of the radical to
the hydrogen, rather than by the strength of the C-H bond. Since the tert-butoxyl radical is rather
sterically bulky, the ability of the radical to properly orient itself in a fashion necessary for
hydrogen abstraction is more difficult than for smaller alkoxyl radicals. This suggests that the
tert-butoxyl radical may not be a representative prototype for the reactivity of oxygen-centered
radicals35.
1.6 Biological Implications of HO• Oxidation
As oxidation reactions are a contributing factor to many degenerative diseases, several studies
have used fundamental organic chemistry to investigate the reactions that are believed to be
involved in the onset of such diseases. Free radicals are formed in biological systems either by
endogenous processes (metabolism of food, exercise) or by exposure to exogenous factors
(smoke, radiation). These extremely reactive free radicals will target many biomolecules,
including DNA, proteins, lipids and carbohydrates. Davies et al. studied the effects of radicals
on proteins.8 Radical attack on proteins can destroy the protein or alter it drastically. Some of
the products formed from the radical attack on proteins, namely hydroperoxides, have oxidizing
properties which, in the presence of metal ions and UV light, decompose to ROS which can
further act as oxidizing agents. The reaction scheme for the formation of hydroperoxides on the
protein backbone and side chain is believed to be (Scheme 1-6):

18
Scheme 1-6: Chain reaction of HO• production
Incubation of hydroperoxide with Fe(II)-EDTA in the presence of 3,6-dimethyl-2,5-
piperazinedione allowed for the identification of the HO• and alkoxyl radical as decomposition
products by EPR spectroscopy:
(1-25)
These series of reactions, which are initiated by hydroxyl and alkoxyl radicals lead to the
fragmentation of the protein backbone (Scheme 1-7):
Scheme 1-7: Oxidative degradation of protein backbone
Saha-Moller et al. investigated the effects of the HO• on mouse lymphoma cells using the N-tert-
butoxypyridine-2-thione HO• precursor.36 The photo-cytotoxicity and photo-genotoxicity of the
mouse lymphoma cell line L5178 was examined and showed a time dependant decrease in
relative cell growth and increase in membrane damaged cells.36 When a radical scavenger was
employed the photo-cytotoxicity of the compound was greatly diminished, indicating that it is
the alkoxyl radical responsible for this type of toxicity, (although the thiyl radical is believed to
induce the genotoxicity).
A similar set of experiments was carried out by this group using super-coiled pBR322
DNA37. The tert-butoxyl, benzoyloxyl and iso-propoxyl radicals were generated from the

19
corresponding N-alkoxypyridine-2-thione in the presence of this DNA which was then analyzed
via gel electropheresis for strand breakage. The alkoxyl radicals all induced strand breakage.
Once again, when a radical scavenger was employed, the amount of open-circular DNA was
greatly reduced.
DNA base damage is what is specifically believed to be responsible for the strand
breakage of the double helix. Of the four bases found in DNA, the purine base deoxyguanine
appears to be the most susceptible to this oxidative attack, although the reasons for this are not
apparent.38 Scheirer et al. did a similar experiment involving the photolysis of a photo-Fenton
reagent which produces the tert-butoxyl radical.39 This radical undergoes beta cleavage to
produce a methyl radical, which may subsequently react with molecular oxygen to form
methylperoxyl radical, CH3OO·. The methyl and methyl-peroxyl radicals cause damage to the
deoxyguanine base of DNA which leads to subsequent strand breakage. Car et. al found that the
specific mechanism of hydroxyl attack on each base is different.38 The use of static and dynamic
ab initio methods was employed in order to elucidate the mechanism of hydroxyl attack on the
thymine and guanine bases found in DNA. For thymine, the HO• reaction of dehydrogenation is
most favorable with the C-5 methyl group, being exothermic to -108.6 kJ/mol in gas phase and -
112.2 kJ/mol in aqueous solution. The second most favorable site is at N1 which gives values of
-86.7/-84.7 kJ/mol. For the hydroxylation reaction the most favorable site is the C-6 position
followed by the C-5 position. These values are in agreement with the experimentally determined
products that arise from the dehydrogenation and hydroxylation reactions.
Singlet oxygen is also a large contributor to DNA base damage seen in cells. Box et al.
studied the specific damage done by singlet oxygen to the guanine base.1 After exposing a
tetramer of DNA composed of each base to UVA light in solution containing methylene blue,

20
HPLC analysis confirmed the presence of three unharmed bases. The only resonance not
accounted for was guanine, which was confirmed to have been oxidized into 8-oxo-7,8-dihydro-
guanine (Figure 1-4, I) and spiroiminodihydantoin(Figure 1-4, II).
Figure 1-4. Guanine oxidation products
HN
NNH2N
HN
O
1
23
HN
NNH2N
HN
O
O
(I)
HN
NH
N
NH
OO
OHN
(II)
The product are the result of an oxidative addition to the N-C3 bond to form product I or to the
C1-C2 double bond, which subsequently breaks to form the two five membered rings in product
II.
1.7 Accelerated Aging of Polyethylene Potable Water Material
Polyethylene (PE) pipes, and specifically high density polyethylene (HDPE) pipes, are
becoming increasingly popular as a means of water transport for industrial and residential
applications. The relative low cost of the material, combined with its projected 50 to 100 year
service life, makes HDPE and ideal material for water distribution. Both medium density
polyethylene (MDPE) and HDPE are currently approved for applications of 25°C or less, and in
2004, PE water pipe comprised a third of the world’s plastic pipe demand.30
HDPE pipes are generally enhanced with additives such as UV stabilizers, antioxidants,
and phosphites that provide the material with a tremendous resistance to oxidative stress.
However, long term exposure to chlorinated water is known to have a deleterious effect on both
mechanical strength, as well as chemical composition of the pipe. Chlorine is used as a
disinfectant in the US, as well as other parts of the world, to help prevent the spread of infectious
disease. In the US, the chlorine content can be very high, reaching greater than 1 part per million

21
in some areas. Repeated exposure of pipes to such high levels of chlorine causes early
deterioration of the material.
While it is widely established and accepted that chlorinated water increases degradation
of PE pipes, the exact circumstances of how this occurs remain somewhat controversial. Several
researchers have reported that the initial stage of PE pipe degradations involves the loss of anti-
oxidants from the material. Dear and Mason looked at the differences between chlorinated water
and unchlorinated water on the properties of MDPE pipe.40 The loss of antioxidant was found to
be much greater for a wall surface of MDPE exposed to chlorinated water than a wall surface
exposed to unchlorinated water. In fact, the authors suggest that the chlorinated water need only
penetrate the first millimeter of wall thickness before superficial environmental stress cracking
starts to occur. This initial stress cracking is the cause of mechanical failure, and is increased
with increasing chlorine content. The authors note that while these PE pipes may have an
expected lifetime of several decades in dry air, exposure to chlorinated water may decrease their
lifetime to less than ten years.
Gedde and coworkers examined the effects of chlorinated water and elevated
temperatures on the degradation of HDPE pipes.41 Using differential scanning calorimetry
(DSC) to measure oxidation induction time (OIT), Gedde measured the amount of effective
antioxidant after chlorine exposure at different temperatures in different areas of the pipe (taking
a cross-section from the inner wall, which was immediately exposed to the chlorinated water, to
the outer wall which was unexposed). Gedde found that approximately 80% of stabilizer was
lost through chemical consumption stemming from exposure to hot chlorinated water. In pipe
exposed simply to hot water, antioxidant consumption was negligible indicating that chlorine in
the water sample is clearly responsible for loss of antioxidants within HDPE. The researchers

22
also found that chlorine exposed pipe produced a highly degraded inner wall. This inner wall
was examined via infrared spectroscopy, which confirmed the presence of a newly formed
absorption band at 1700 cm-1. However, what was extremely fascinating was that the area
immediately beneath this porous layer was completely unoxidized. The oxidized layer also
proved to have significantly higher mass crystallinity content than other cross-sections of the
same pipe. From these conclusions, Gedde suggests that the species responsible for antioxidant
loss is not very reactive with the pipe material; the species responsible for pipe degradation must,
however, be extremely reactive and/or insoluble in the polymer itself, as only the immediate
surface is oxidized.
Insight into the degradation of the PE material itself is helpful to understanding what
might be behind this accelerated aging in chlorinated water solutions. Pinheiro et al. found that,
during processing, oxygen content played a significant role in the degree and content of
degradation of HDPE.42 Macroradicals are formed during processing which can either react with
each other (giving an unsaturated site such as a vinyl group or transvinylene group), or which
can react with dioxygen, forming a peroxyl radical. Hydrogen abstraction by this newly formed
radical and subsequent beta-scission leads to the formation of a carbonyl end group (thus
breaking the chain) and formation of another highly reactive radical, HO•.
Pinheiro focused on two different HDPE resins: Phillips and Ziegler-Natta. Samples of
each resin were processed in a totally filled (TF) chamber, where 100% of the container was
filled with resin, or a partially filled (PF) container containing only 70% resin. Carbonyl content
was increased for both sets of resin in the PF chamber due to the higher volume of oxygen.
Significant differences were seen in the vinyl index; While Zieglar-Natta HDPE resin showed a
minimal amount of vinyl group consumption for both TF and PF chambers, there was a

23
significant difference between vinyl group consumption in the Phillips HDPE resin (with the PF
chamber showing significantly more consumption than the TF chamber). The difference in
behavior among the resins can be attributed to the much greater initial concentration of vinyl
groups found in the Phillips HDPE compared to the Zieglar-Natta. Looking at molecular weight
distribution the trends in reactivity became clear: In the presence of oxygen, both HDPE resins
are likely to react, resulting in the formation of carbonyl groups. Zieglar-Natta HDPE is likely to
undergo chain scission, as molecular weight distribution curves shift towards lower molecular
weights. Phillips HDPE- which contains a much greater amount of initial vinyl groups- is likely
to undergo chain branching, as molecular weight distribution curves shift towards higher
molecular weights.
The most thorough investigation to date regarding the accelerated aging of HDPE pipes
was conducted by Dietrich et al. There has been great variation in techniques, conditions and
reporting of accelerated aging studies. While there are several different viable methods for
conducting such research, variations in pH, chlorine concentration, and alkalinity (used as an
acid neutralizer) can greatly alter the chemistry behind this polymeric breakdown. In their work,
Dietrich and co-workers determined appropriate accelerated aging conditions that minimized
variation in water chemistry as well as water sorption.30 The authors set to identify a set of
conditions that would mimic potable water systems commonly found in the US, as well as
control chlorine speciation (Scheme 1-8):
Scheme 1-8: Chlorine speciation

24
HDPE samples were immersed in one of nine aging solutions with varying chlorine (Cl2) levels
(0, 45, and 250 ppm Cl2) and varying temperature (23°, 37° and 70°C) and stored in the dark.
Samples were rinsed and immersed in a new solution every three days, at which point each
solution was measured for changes in pH, Cl2 and alkalinity levels. Of the six Cl2 solutions
tested, solutions of 45 ppm Cl2 at 23°C and 37°C were found to be the most stable, with no
significant changes to pH, Cl2 concentration or alkalinity over a three day time period. Pipes that
had been aged in the 45 ppm Cl2 at 37°C showed a characteristic carbonyl formation near 1710
and 1730 cm-1. The formation of this functionality was detected as early as 720 h- with
increasing intensity up to 3884 h- well before oxidation induction time levels had gone to zero,
indicating the pipe was oxidized while antioxidants were still present.
Like Dietrich, Bourgine et al. wanted to see the effects of another common disinfectant,
chlorine dioxide (DOC), on the process of accelerated aging.43 Much interest in exists in
examining the effects of DOC on polyethylene pipe, as a massive HDPE breakdown in the south
of France occurred after only a few years of exposure to this disinfectant. Similar to Dietrich,
the authors maintained constant solution conditions, periodically titrating the water samples and
readjusting to initial conditions. The authors tested over a range of 1 to 100 ppm DOC at either
20° or 40°C over a twenty week period. As expected, the authors found that antioxidant
consumption was greatest among single concentrations with increasing time, and increased with
increasing DOC concentration. Again, the formation of carbonyls were seen, however the
authors did note that the presence of these functional groups was superficial, extending only a
few hundred micrometers of the 4.5 mm sample. The authors speculate that a likely mechanism
behind the formation of the carbonyl is breakdown of hydroperoxides, forming an alkoxyl radical

25
that undergoes beta-scission producing a carbonyl, and thus breaking the PE chain. While this
seems highly plausible, the authors did also note that the number of chain scission was not
proportional to the number of carbonyls, in fact there were approximately four times as many
carbonyls than chain scissions, indicating a chemical event that produced a carbonyl without
breaking the PE chain.
Though research has clearly indicated that addition of chlorine to water aids in the
consumption of anti-oxidants as well as the breakdown of the polymer chains, the exact species
involved in these mechanisms are still up for debate. Bradley and co-workers suggest that
chlorine is not in fact that culprit, but rather the addition of chlorine to form hypochlorous acid
leads to the formation of activated oxygen, which is responsible for the oxidation of the carbon
chain (Scheme 1-9):44
Scheme 1-9: Production of activated oxygen via chlorinated water
Bradley suggests that oxidation reduction potential is a better predictor of environmental stress
on polyalkene pipes than chlorine concentration alone. While at every pH the oxidation
reduction potential increased with increasing chlorine concentration, this phenomenon did not
occur in a linear fashion. As such, free chlorine concentration, pH and trace metal concentration
should all be taken into consideration when studying an aqueous solution, rather than simply
chlorine content.
While HDPE oxidation serves as good evidence to suggest that free radicals are present
in chlorinated water, several studies have been conducted on chlorinated water solutions to detect
conclusively for the presence- and identification- of said free radicals. Using the spin trapping
reagent 5,5-Dimethyl-1-pyrroline-N-oxide (DMPO), Hamada et al. was able to detect the

26
presence of free radicals in chlorinated solutions via electron spin resonance (ESR).45 Using
DMPO, highly reactive, unstable radicals can be converted to a more stable radical and
identified.
(1-26)
The authors found that the presence of free radicals in aqueous solution was strongly dependant
on the chlorine concentration. The most abundant free radical that was identified was the
hydroxyl radical, being present in chlorinated solutions as low as 2mg/L chlorine. To further
confirm that the hydroxyl radical was indeed present, dimethyl sulfoxide (DMSO), a known
hydroxyl radical scavenger was added to the chlorinated solutions. The addition of this
scavenger notably decreased the DMPH-OH signal. At higher concentrations, several other
DMPO adducts were detected, all of which the authors suggest the hydroxyl radical contributes
too (Scheme 1-10).
Scheme 1-10: DMPO- hydroxyl radical products
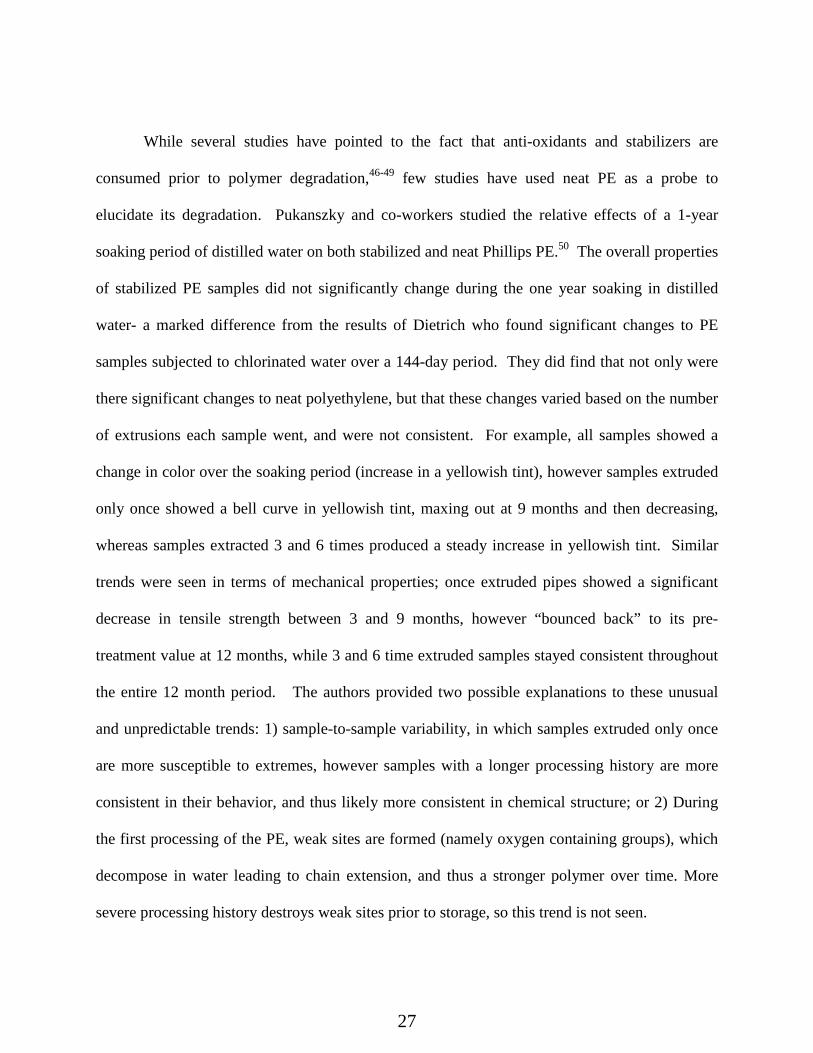
27
While several studies have pointed to the fact that anti-oxidants and stabilizers are
consumed prior to polymer degradation,46-49 few studies have used neat PE as a probe to
elucidate its degradation. Pukanszky and co-workers studied the relative effects of a 1-year
soaking period of distilled water on both stabilized and neat Phillips PE.50 The overall properties
of stabilized PE samples did not significantly change during the one year soaking in distilled
water- a marked difference from the results of Dietrich who found significant changes to PE
samples subjected to chlorinated water over a 144-day period. They did find that not only were
there significant changes to neat polyethylene, but that these changes varied based on the number
of extrusions each sample went, and were not consistent. For example, all samples showed a
change in color over the soaking period (increase in a yellowish tint), however samples extruded
only once showed a bell curve in yellowish tint, maxing out at 9 months and then decreasing,
whereas samples extracted 3 and 6 times produced a steady increase in yellowish tint. Similar
trends were seen in terms of mechanical properties; once extruded pipes showed a significant
decrease in tensile strength between 3 and 9 months, however “bounced back” to its pre-
treatment value at 12 months, while 3 and 6 time extruded samples stayed consistent throughout
the entire 12 month period. The authors provided two possible explanations to these unusual
and unpredictable trends: 1) sample-to-sample variability, in which samples extruded only once
are more susceptible to extremes, however samples with a longer processing history are more
consistent in their behavior, and thus likely more consistent in chemical structure; or 2) During
the first processing of the PE, weak sites are formed (namely oxygen containing groups), which
decompose in water leading to chain extension, and thus a stronger polymer over time. More
severe processing history destroys weak sites prior to storage, so this trend is not seen.

28
While processing clearly plays a significant role in the degradation of any PE sample, the
authors did note that all samples showed a strong correlation in all functional groups formed.
Although no correlation between soaking time and carbonyl content could be seen, there was a
near perfect correlation between vinyl concentration and relative carbonyl concentration
(namely, as vinyl concentration decreases, carbonyl concentration increases), and that the
amount of oxygen in the system determines the direction of the proceeding reactions. While the
authors conclude that these two functionalities are related to each other, exactly how they were
related could not be explained. They suggest a possible mechanism that fits with their results
(decrease in unsaturation, increase in carbonyl content and increase in methyl content), however
admit it is unlikely due to the formation of an unstable epoxy group (Scheme 1-11).
Scheme 1-11: Proposed mechanism of PE oxidation in distilled water
While PE pipe failure is clearly linked to oxidation, a direct mechanism for this failure has yet to
be discovered. Clearly, chlorine disinfectants increase the likelihood and time frame of this
failure, however a clear pathway of how this occurs must be formulated in order to better prevent
against premature PE pipe failure. Systematic accelerated aging studies that address the species,
conditions and mechanisms responsible for this failure are still necessary in order to get a
complete picture of PE pipe degradation.

29
Table 1-1. Summary of literature rate constants for gas phase HO• reactions
Substrate Notes Phase k (L mol-1 s-1) Ref. propane 298K gas 6.68 x10⁹ 15 n-butane 298K gas 1.43 x10¹⁰ 15 n-pentane 298K gas 2.23 x10¹⁰ 15 n-hexane 298K gas 3.12 x10¹⁰ 15 cyclopropane 298K gas 4.60 x10⁸ 15 cyclobutane 298K gas 1.25 x10¹⁰ 15 cyclopentane 298K gas 2.91 x10¹⁰ 15 cyclohexane 298K gas 4.03 x10¹⁰ 15 dimethyl ether 298K gas 1.61 x10¹⁰ 15 ethane 300K gas 1.56 x10⁹ 16 propane 300K gas 5.67 x10⁹ 16 n-butane 300K gas 1.46 x10¹⁰ 16 2-methylpropane 300K gas 1.26 x10¹⁰ 16 n-pentane 300K gas 2.40 x10¹⁰ 16 n-hexane 300K gas 3.28 x10¹⁰ 16 cyclopentane 300K gas 3.55 x10¹⁰ 16 cyclohexane 300K gas 4.61 x10¹⁰ 16 cycloheptane 300K gas 7.23 x10¹⁰ 16 cyclooctane 300K gas 8.03 x10¹⁰ 16 ethane 297K gas 1.43 x10⁹ 17 propane 297K gas 7.29 x10⁹ 17 n-butane 297K gas 1.36 x10¹⁰ 17 n-pentane 297K gas 2.54 x10¹⁰ 17 cyclopentane 295K gas 3.02 x10¹⁰ 19 d10-cyclopentane 292K gas 1.10 x10¹⁰ 19 cyclohexane 295K gas 4.30 x10¹⁰ 19 d12-cyclohexane 292K gas 1.66 x10¹⁰ 19 methanol 294K gas 5.60 x 10⁹ 23 d-methanol 293K gas 2.62 x 10⁹ 23

30
Substrate Notes Phase k (L mol -1 s-1) Ref. methanol 293K aqueous 9.0 x10⁸ 24 ethanol 293K aqueous 2.2 x10⁹ 24 Iso-propanol 293K aqueous 2.0 x10⁹ 24 tert-butanol 293K aqueous 6.2 x10⁸ 24 methanol 293K aqueous 9.7 x10⁸ 25 ethanol 293K aqueous 1.9 x10⁹ 25 iso-propanol 293K aqueous 1.9 x10⁹ 25 1-propanol 293K aqueous 2.8 x10⁹ 25 n-butyl amine 293K aqueous 1.00 × 10¹⁰ 26 n-hexyl amine 293K aqueous 1.31 × 10¹⁰ 26 n-octyl amine 293K aqueous 1.46 × 10¹⁰ 26 di-butyl amine 293K aqueous 1.81 × 10¹⁰ 26 tri-butyl amine 293K aqueous 1.67 × 10¹⁰ 26 diethyl ether 293K aqueous 3.9 x10⁹ 27 acetone 293K aqueous 7.7 x10⁷ 27 methanol 293K aqueous 4.7 x10⁸ 27 ethanol 293K aqueous 7.2 x10⁸ 27 isopropyl alcohol 293K aqueous 1.74 x10⁹ 27 acetone 293, pH=1 aqueous 8.85 x10⁷ 28 d6-acetone 293, pH=1 aqueous 2.50 x10⁷ 28 dimethoxymethane 293K aqueous 8.10 x10⁸ 29 diethoxymethane 293K aqueous 9.20 x10⁸ 29 chloroform 293K aqueous 8.50 x10⁶ 29 acetonitrile 293K aqueous 2.12 x10⁶ 29 methane 293K aqueous 1.43 x10⁸ 29 ethylene 293K aqueous 4.1 x10⁹ 51 propylene 293K aqueous 6.5 x10⁹ 51 1-butene 293K aqueous 6.5 x10⁹ 51 isobutylene 293K aqueous 5.0 x10⁹ 51 butadiene 293K aqueous 6.5 x10⁹ 51

31
References
1. DeFederics, H.-C.; Patrzye, M. J.; Rajecki, E. E.; Budzinski, H. I.; Dawidzik, J. B.;
Evans, M. S.; Grenne, K. F.; Box, H. C., Singlet Oxygen-Induced DNA Damage.
Radiation Research 2006, 165, 445-451.
2. Headlam, H. A.; Davies, M. J., Beta-Scission of Side-Chain Alkoxyl Radicals on
Peptides and Proteins Results in the loss of Side-Chains as Aldehydes and Keytones.
Free Radical Biology and Medicine 2002, 32, (11), 1171-1184.
3. Plato, C. C.; Galasko, D.; Garruto, R. M.; Plato, M.; Gamst, A.; Craig, U. K.; Torres, J.
M.; Wiederholt, W., ALS and PDC of Guam Forty Year Follow-up. Neuruology 2002,
58, 765-773.
4. Suleman, N. K.; Flores, J.; Tanko, J. M.; Isin, E. M.; Castagnoli Jr, N., The Hydrogen
Atom Abstraction Reactions of the Parkinsonian Inducing Proneurotoxin 1-Methyl-4-
phenyl-1,2,3,6-tetrahydropyridine (MPTP) and selected tertairy Amines with tert-Butoxy
Radical. In Virginia Polytechnic and State University: Blacksburg, Va, 2001; pp 1-15.
5. Baxendale, J. H.; Rodgers, M. A. J. Contributions of Pulse Radiolysis to Chemistry;
Manchester University Center for Fast Kinetic Research, University of Texas-Austin
Manchester, England; Austin, Texas, 1976; pp 235-263.
6. Baxendale, J. H.; Bell, C.; Mayer, J., Some solid state photodetectors used in pulse
radiolysis studies; operational details and performance International Journal for
Radiation Physics and Chemistry 1974, 6, (2), 117-128.
7. Espenson, J. H., Chemical Kinetics and Reaction Mechanisms Second Edition. Second
ed.; McGraw Hill: 2002; p 281.
32
8. Davies, M. J., Protein and Peptide Alkoxyl Radicals Can Give Rise to C-Terminal
Decarboxylation and Backbone Cleavage. Archives of Biochemistry and Biophysics 1996,
336, (1), 163-172.
9. Poole, J. S.; Shi, X.; Hadad, C. M.; Platz, M. S., Reaction of Hydroxyl Radical with
Aromatic Hydrocarbons in NonAqueous Solutions: A Laser Flash Photolysis Study in
Acetonitrile. J. Phys. Chem. A 2005, 109, 2547-2551.
10. Vereecken, L.; Peeters, J., H-atom abstraction by OH-radicals from (biogenic)
(poly)alkanes: C-H bonds strengths and abstraction rates. Chemical Physical Letters
2000, 333, 162-168.
11. Theruvathu, J. A.; Aravindakumar, C. T.; Flyunt, R.; von Sonntag, J.; von Sonntag, C.,
Fenton Chemistry of 1,3-Dimethyluracil. J. Am. Chem. Soc. 2001, 123, (37), 9007-9014.
12. Arnone, M.; Hartung, J.; Engels, B., On the Homolytic Cleavage of the N,O Bond in N-
(Methoxy)pyridine-2(1H)-thione and N-(Methoxy)thiazole-2(3H)-thione in Thermally
and Photochemically Induced Reactions: A Theoretical Study. J. Phys. Chem. A 2005,
109, (26), 5943-5950.
13. Aveline, B. M.; Kochevar, I. E.; Redmond, R. W., Photochemistry of N-Hydroxy-2(1H)-
pyridone, a More Selective Source of Hydroxyl Radicals Than N-Hydroxypyridine-
2(1H)-thione. J. Am. Chem. Soc. 1996, 118, 10124-10133.
14. DeMatteo, M. P.; Poole, J. S.; Shi, X.; Sachdeva, R.; Hatcher, P. D.; Hadad, C. M.; Platz,
M. S., On the Electrophilicity of Hydroxyl Radical: A Laser Flash Photolysis and
Computational Study. J. Am. Chem. Soc. 2005, 127, 7094-7109.
15. DeMore, W. B.; Bayes, K. D., Rate Constants for Reactions with Several Alkanes,
Cycloalkanes, and Dimethyl Ether. J. Phys. Chem. A 1999, 103, 2649-2654.

33
16. Donahue, N. M.; Anderson, J. G., New Rate Constants for Ten OH Alkane Reactions
from 300 to 400 K: An Assessment of Accuracy. J. Phys. Chem. A 1998, 102, 3121-3126.
17. Abbatt, J. P. D.; Demerjian, K. L.; Anderson, J. G., A New Approach to Free Radical
Kinetics: Radially and Axially Resolved High-Pressure Discharge Flow with Results for
·OH + (C2H6, C3H8, n-C4H10, n-C5H12)-> Products at 297K. J. Phys. Chem. 1990, 94,
4566-4575.
18. Howard, C. J., J. Phys. Chem., 1979, 83, (3).
19. Droege, A. T.; Tully, F. P., Hydrogen-Atom Abstraction from Alkanes by OH. 6.
Cyclopentane and Cyclohexane. J. Phys. Chem. 1987, 91, (5), 1222-1225.
20. McMillen, D. F.; Golden, D. M., Annu. Rev. Phys. Chem. 1982, 33, 493-532.
21. Tian, Z.; Fattahi, A.; Lis, L.; Kass, S., Cycloalkane and Cycloalkene C-H Bond
Dissociation Energies. J. Am. Chem. Soc. 2006, 128, 17087-17092.
22. Overend, R.; Paraskevopoulos, G., Rates of OH Reactions. 4. Reactions with Methanol,
Ethanol, 1-Propanol and 2-Propanol at 296 K. J. Phys. Chem. 1978, 82, (12), 1329-1333.
23. Hess, W. P.; Tully, F. P., Hydrogen-Atom Abstraction from Methanol by OH. J. Phys.
Chem. 1989, 93, 1944-1947.
24. Alam, M. S.; Rao, B. S. M.; Janata, E., Hydroxyl radical reactions with aliphatic
alcohols:evaluation of kinetics by direct optical absorption measurement. A pulse
radiolysis study. Radiation Physics and Chemistry 2003, 67, (6), 723-728.
25. Buxton, G. V.; Greenstock, C. L.; Helman, W. P.; Ross, A. B., Critical Review of Rate
Constants for reactions of hydrated electrons and hydroxyl radicals in aqueous solution.
J. Phys. Chem. Reference Data 1988, 17, (2).

34
26. Pramanick, D.; Bhattacharyya, R., Studies on Some Radical Transfer Reactions by
Entrapping the Radicals as Polymer End Groups. I. Reaction of Hydroxyl Radicals with
Amines. Journal of Polymer Science: Part A: Polymer Chemistry 1986, 24, 2401-2414.
27. Thomas, J. K., Trans. Faraday Soc. 1965, 61, 702-707.
28. Walling, C.; El-Tailiawi, G. M., Fenton's Reagent. II. Reactions of Carbonyl
Compounds and alpha,beta-Unstaurated Acids. J. Am. Chem. Soc. 1972, 95, (3), 844-847.
29. Anbar, M.; Meyerstein, D.; Neta, P., Reactivity of Aliphatic Compounds towards
Hydroxyl Radicals. Journal of the Chemical Society B: Physical Organic 1966, 742-747.
30. Whelton, A. J.; Dietrich, A., Critical considerations for the accelerated ageing of high-
density polyethylene potable water systems. Polymer Stability and Degradation 2009, 94,
1163-1175.
31. Haag, W. R.; Yao, C. C., Rate constants for reaction of hydroxyl radicals with several
drinking water contaminants. Environ. Sci. Technol. 1992, 26, (5), 1005-1013.
32. Albarran, G.; Schuler, R. H., Concerted Effects of Substituents in the Reaction of
Hydroxyl Radicals with Aromatics: The Cresols. J. Phys. Chem. A 2005, 109, (41), 9363-
9370.
33. Tanko, J. M.; Friedline, R.; Suleman, N. K.; Castagnoli Jr, N., tert-Butoxyl as a Model
for Radicals in Biological Systems: Caveat Emptor J. Am. Chem. Soc. 2001, 123, (24),
5808-5809.
34. Dinnocenzo, J. P.; Karki, S. B.; Jones, J. P., On isotope effects for the cytochrome P-450
oxidation of substituted N,N-dimethylanilines J. Am. Chem. Soc. 1993, 115, (16), 7111-
7116.

35
35. Finn, M.; Friedline, R.; Suleman, N. K.; Wohl, C.; Tanko, J. M., Chemistry of the t-
Butoxy Radical: Evidence that Most Hydrogen Abstraction from Carbon are Entropy-
Controlled. J. Am. Chem. Soc. 2004, 126, (24), 7578-7584.
36. Moller, M.; Adam, W.; Marquardt, S.; Saha-Moller, C.; Stopper, H., Cytotoxicity and
Genotoxicity induced by the photochemical alkoxyl radical source N-tert-butoxypyridine-
2-thione in L5178Y mouse lymphoma cells under UVA radiation. Free Radical Biology
and Medicine 2005, 39, 473-482.
37. Adam, W.; Grimm, G. N.; Saha-Moller, C., DNA Cleavage Induced by Alkoxyl Radicals
Generated in the Photolysis on N-Alkoxypyridinethiones. Free Radical Biology and
Medicine 1998, 24, (2), 234-238.
38. Wu, V.; Mundy, C. J.; Cobin, M. E.; Car, R., On the Mechanism of OH Radical Induced
DNA-Base Damage: A Comparitive Quantum Chemical and Car- Parrinello Molecular
Dynamics Study. J. Phys. Chem. A 2004, 108, 2922-2929.
39. Adam, W.; Marquardt, S.; Kemmer, D.; Saha-Moller, C.; Schreier, P., 2'-
Deoxyguanosine (DG) Oxidation and Strand-Break Formation in DNA by the Radicals
Released in the Photolysis of N-tert-Butoxy-2-pyridone. Are tert-Buroxy or Methyl
Radicals Responsible for the Photooxidative Damage in Aqueous Media. Organic Letters
2001, 4, (2), 225-228.
40. Dear, J. P.; Mason, N. S., The Effects of Chlorine Depletion of Antioxidants in
Polyethylene. Polymers and Polymer Composites 2001, 9, (1), 1-13.
41. Hassinen, J.; Lundback, M.; Ifwarson, M.; Gedde, U. W., Deterioration of polyethylene
pipes exposed to chlorinated water. Polymer Degradation and Stability 2004, 84, 261-
267.

36
42. Canevarolo, S. V.; Chinelatto, M. A.; Pinheiro, L. A., Evaluation of Phillips and Ziegler-
Natta high-density polyethylene degradation during processing in an internal mixer using
the chain scission and branching distribution function analysis. Polymer Degradation and
Stability 2006, 91, 2324-2332.
43. Colin, X.; Audoin, L.; Verdu, J.; Rozental-Evesque, M.; Rabaud, B.; Martin, F.;
Bourgine, F., Aging of Polyethylene Pipes Transporting Drinking Water Disinfected by
Chlorine Dioxide. Part II- Lifetime Prediction. Polymer Engineering and Science 2009,
49, 1642-1652.
44. Gill, T. S.; Knapp, R. J.; Bradley, S. W.; Bradley, W. L., Long term durability of
crosslinked polyethylene tubing used in chlorinated hot water systems. Plastics, Rubber
and Composites 1999, 28, (6), 309-313.
45. Utsumi, H.; Hakoda, M.; Shimbara, S.; Nagaoka, H.; Chung, Y.; Hamada, A., Active
Oxygen Species Generated During Chlorination and Ozonation. Water Science and
Technology 1995, 30, (9), 91-99.
46. Karlsson, K.; Eriksson, P.; Hedenqvist, M.; Ifwarson, M.; Smith, G.; Gedde, U. W.,
Molecular structure, morphology and antioxidant consumption in poly-butene-1 pipes in
hot water applications. Polymer Engineering and Science 1993, 33, (5), 303-310.
47. Smith, G.; Karlsson, K.; Gedde, U. W., Modeling of anti-oxidant loss from polyolefins in
hot water applications. I: model and application of medium-density polyenthylene pipes.
Polymer Engineering and Science 1992, 32, (10), 658-667.
48. Viebke, J.; Gedde, U. W., Anti-oxidant diffussion in polyethylene hot water pipes.
Polymer Engineering and Science 1997, 37, (5), 896-911.
37
49. Viebke, J.; Hedenqvist, M.; Gedde, U. W., Anti-oxidant efficiency and loss by
precipitation and diffussion to surrounding media in polyethylene hot-water pipes.
Polymer Engineering and Science 1996, 36, (24), 2894-2904.
50. Kriston, I.; Foldes, E.; Staniek, P.; Pukanszky, B., Dominating reactions in the
degradation of HDPE during long term aging in water. Polymer Degradation and
Stability 2008, 93, 1715-1722.
51. Thomas, J. K., Pulse radiolysis of aqueous solutions of methyl iodide and methyl
bromide. The reactions of iodine atoms and methyl radicals in water. The J. Phys. Chem.
1967, 71, (6), 1919-1925.

38
Chapter 2 How Hydroxyl Radical Reactivity is Modulated by Solvent
Contributions
This chapter represents a modified version and expansion of a published article centering
on hydroxyl radical reactivity in a non-aqueous solution.1 Contributions from co-authors of the
article are described as follows: Dr. Susan Mitroka, author of this dissertation, performed the
great majority of the experimental work and contributed significantly to the writing and editing
of the manuscript. Selected experiments were either performed or repeated by Ms. Stephanie
Zimmeck. Preparation for publication and selected calculations were done by Dr. James Tanko,
chair of the thesis committee and principal author of the manuscript. Finally Dr. Diego Troya (a
member of the thesis committee) performed a large basis of calculations as described in the text,
and provided significant intellectual contributions for this work.
1. Mitroka, S.; Zimmeck, S.; Troya, D.; Tanko, J. M. How Solvent Modulates Hydroxyl
Radical Reactivity in Hydrogen Atom Abstractions. J. Am. Chem. Soc. 2010, 132, (9), 2907-
2913.

39
Abstract: The hydroxyl radical (HO•) is a highly reactive oxygen-centered radical whose
bimolecular rate constants for reaction with organic compounds (hydrogen atom abstraction)
approach the diffusion-controlled limit in aqueous solution. The results reported herein show that
hydroxyl radical is considerably less reactive in dipolar, aprotic solvents such as acetonitrile.
This diminished reactivity is explained on the basis of a polarized transition state for hydrogen
abstraction, in which the oxygen of the hydroxyl radical becomes highly negative, and can serve
as a hydrogen bond acceptor. Because acetonitrile cannot participate as a hydrogen bond donor,
the transition state cannot be stabilized by hydrogen bonding, and the reaction rate is lower—the
opposite is true when water is the solvent. This hypothesis explains hydroxyl radical reactivity
both in solution and in the gas phase, and may be the basis for a “containment strategy” used by
nature when hydroxyl radical is produced endogenously.

40
2.1 Introduction
The hydroxyl radical (HO•) is recognized as the most reactive of the so-called reactive oxygen
species (ROS). In biology, HO• not only plays a role in disease but is also a vital part of the
body’s natural defense mechanisms. ROS are produced endogenously as a means of destroying
foreign antigens or abnormal cells. It is often stated that in biological systems, HO• reacts with
the first molecule it encounters.
The hydroxyl radical is also important in atmospheric chemistry because of its ability to
oxidize volatile organic pollutants, and has been referred to as the atmosphere’s “detergent.”1
Recently, Vohringer-Martinez et al. examined the role of water in the gas-phase reaction of the
hydroxyl radical with acetaldehyde, reporting that a water concentration of 3% led to an increase
in the rate of hydrogen abstraction (abstraction taking place from the aldehydic hydrogen).2 Their
hypothesis that hydrogen bonding to water in the transition state lowered the reaction barrier,
raises several intriguing questions: Why is hydrogen bonding to water is more important in the
transition state as compared to reactants? Is this stabilization unique to substrates with functional
groups that are capable of hydrogen bonding (such as the carbonyl group in acetalaldehyde)? Is
this stabilization also important for reactions of hydroxyl radical in solution? In short, how
general is this phenomenon, and can we understand it on molecular level?
Solvent polarity can have a huge effect on the kinetics of reactions involving, or forming,
charged species in solution. In contrast, reactions of neutral radicals are much less sensitive to
solvent polarity effects—mainly because charged species are not involved, and there is not a
significant change in dipole moment in the progression from reactants to transition state. Because
of this, other, more subtle solvent properties such as viscosity or internal pressure can influence

41
the rate of certain radical reactions; such solvent effects are much more difficult to detect in polar
reactions because they are masked by the overwhelming effect of solvent polarity.3
For example, solvent viscosity can affect the rate and product distribution when radical
caged-pairs (geminate or diffusive) are involved. Internal pressure can influence rate if there is a
difference in the volume of the reactants compared to the transition state (∆Vact ≠ 0), and can
influence the relative rate of some radical reactions. However, these solvent effects are generally
small, with changes in rate or product distribution not much greater than an order of magnitude.3
Consequently, instances where solvent dramatically affects the rate or selectivity of reactions
involving neutral radicals are rare, and noteworthy.
The classic example of a significant solvent effect in a radical reaction involves free
radical chlorinations of alkanes conducted in benzene solvent. The chain-carrying chlorine atom
forms a complex with benzene, lowering its reactivity and increasing its selectivity (by nearly
two orders of magnitude) in hydrogen atom abstractions.3, 4 A more recent example of a
significant solvent effect was reported by Ingold and co-workers, who found that rate constants
for hydrogen atom abstractions from phenols were reduced in solvents where the phenol was
stabilized by hydrogen bonding.5 In this case, it was the reactivity of the substrate, not the
radical, which was diminished as a result of a solute/solvent interaction.
Until recently, pulse radiolysis was one of a few means of generating HO• in solution for
the determination of absolute reaction rates. Because this technique, by definition, involves the
radiolysis of water, solution phase studies of hydroxyl radical kinetics have largely been
conducted in water.6 As a result, relatively little is known about the reactivity of HO• in other
solvents. Recent developments have made it possible to study HO• in a non-aqueous
environment through the use of photolabile hydroxyl radical precursors. N-hydroxypyridine-2-

42
thione (PSH), developed by Zard et al.,7 is one such precursor that, when photolyzed at 355 nm,
cleanly produces HO•.
(2-1)
Because the radical by-product (pyrithyl radical) is relatively stable, decaying on a
microsecond timescale, this precursor is an ideal candidate for studying the hydroxyl radical
kinetics in solution via laser flash photolysis (LFP).8-10
Platz, et al.9, 10 developed a method for “visualizing” the hydroxyl radical, which does not
have a convenient absorption in the UV-Vis: Hydroxyl radical addition to the ortho and para
positions of trans-stilbene produces an adduct with an absorption at 392 nm, allowing trans-
stilbene to act as a viable spectroscopic probe for monitoring HO• kinetics. These workers also
noted a solvent effect on HO• reactivity: The rate constant for addition to aromatics (trans-
stilbene, benzene) was observed to be lower in acetonitrile compared to water. Continued work
from this group, using trans-stilbene as a probe, gave similar results for a wide variety of
aromatic compounds.10 Molecular orbital calculations supported the notion that this was due to a
polarized transition state, reminiscent of the polar effect introduced by Russell,11 Walling,12 and
others13 for hydrogen atom abstraction reactions (vide infra). Other studies reporting Hammett
parameters for HO• addition reactions to aromatic compounds have given negative ρ+ values,
consistent with the buildup of negative charge on the hydroxyl moiety in the transition state.14, 15
The strong dipole that is formed in the transition state has the ability to be stabilized by the
surrounding solvent.
Very little is known about the kinetics of hydrogen abstractions by HO• in non-aqueous
solvents. The observations reported herein provide answers to all of the questions posed above

43
and a comprehensive understanding of HO• reactivity in solution and the gas phase, correcting
what we now believe to be some of the misconceptions pertaining to the chemistry of HO• in
solution.
2.2 Results
The results of Platz et al. were initially verified in order to assess the validity and
reproducibility of the proposed methods. The rate constant for the reaction of HO• with trans-
stilbene was determined by direct measurement using pseudo-first order kinetics as described in
Chapter 1. The rate constant was determined over a 12-fold concentration range of trans-stilbene
and found to be congruent with the published results. In addition to the trans-stilbene rate
constant, the rate constant for the reaction of the hydroxyl radical with acetonitrile can be
estimated from the intercept of the line. The upper limit of rate constant was approximated by
Platz to be 1.0 x 10⁶ M-1 s-1, indicative of an extremely unreactive solvent.9
For trans-stilbene to be a viable probe, a concentration was needed that yielded a
sufficient signal in a suitable time frame. The observed rate constant is the sum of all the rates
within the system (Chapter 1); Thus a higher concentration of trans-stilbene might produce a
better signal, however adding a substrate (and thus increasing the rate) would bring the reaction
out of the time scale that can be monitored by laser flash photolysis. The concentration of trans-
stilbene that gave optimal results in terms of both signal and rate was determined to be 1.5 mM
and was held constant for all reactions.
Platz noted an interesting phenomenon regarding this system: the signal at 392 nm
increased at the microsecond time scale- a time far too long to be attributable to HO• .
Simultaneously, a transient produced at 470 nm, ostensibly due to formation of the pyrithiyl

44
radical, decreased. Platz attributed the increase in the 392 nm signal to the formation of a
pyrithiyl dimer, a theory initially proposed by Aveline et al.8:
(2-2)
While the production of another species that absorbs at the 392 nm has a great potential
to interfere with the kinetics being monitored, the pyrithiyl radical is a rather stable radical-
unlikely to react anywhere near as rapidly as the hydroxyl radical. However to confirm that the
kinetics of the pyrithiyl radical produced do not interfere with HO• kinetics, an authentic sample
of the commercially available disulfide dimer, 2,2-dithiodipyridine, was used to determine the
apparent rate of decay for the pyrithiyl radical (monitored at 470 nm) as well as the apparent rate
of re-formation of the disulfide dimer (392 nm). Again, the results were consistent with the
previously reported data, with both the apparent rate of decay and rate of dimer formation being
on the microsecond time scale. As expected, the rate of formation of the dimer was identical to
the rate of decay for the pyrithiyl radical. Additionally, the rate of pyrithiyl radical decay was
measured in the presence of trans-stilbene. The rate of decay was analogous the rate of decay
with no trans-stilbene, indicating no observable interaction between trans-stilbene and the
pyrithiyl radical on the monitored time scale (Table 2-1).
Table 2-1. kapp for pyrithiyl radical (PyrS•) disappearance and 2,2-dithiodipyridine (PyrS—
SPyr) formation
kapp × 10-6(no trans-stilbene), s-1
kapp × 10-6 (15 mM trans-stilbene present), s-1
PyrS• decay (470 nm)
3.73 2.10
PyrS—SPyr formation (392 nm)
2.96 N/A

45
Rate constants for the reaction of HO• with a variety of substrates in acetonitrile are
summarized in Table 2. Compared to t-butoxyl radical,16 rate constants for hydrogen abstraction
by hydroxyl radical are generally two to three orders of magnitude greater. The high reactivity of
HO• is accompanied by low selectivity. For aliphatic hydrogens, the per-hydrogen reactivity is
approximately tertiary (13.9 ) > secondary (1.4) > primary (1.0), based upon a multiple
regression analysis of the results (assuming the global rate constant to be the sum of
contributions from each type of hydrogen). For the alcohols, the hydrogen of the hydroxyl group
is about 3x more reactive than a primary, aliphatic hydrogen.
Table 2-2 also summarizes rate constants for reactions of HO• in water obtained from the
literature. In cases where more than one value was available, these were averaged and reported
with 95% confidence limits. For hydrocarbons, the rate constants for hydrogen abstraction by
HO• are nearly two orders of magnitude lower in acetonitrile than in water solvent. When the
substrate possesses an electronegative substituent (halogen, carbonyl, etc.), this difference
diminishes to much less than an order of magnitude. However, the solvent effect is restored—the
rate constants in water are again, about two orders of magnitude greater than in acetonitrile,
when the substrate bears an electron donating group such as alkoxyl or hydroxyl.

46
Table 2-2. Rate constants for hydrogen abstraction by HO• from various
organic substrates in CH3CN and H2Oa
Substrate kH(CH3CN) x 10-
7 (M -1s-1)
kH(H2O) x 10-7 (M -1s-1)
kH(H2O)/ kH(CH3C
N) (CH3)3CC(CH3)3 5.83 (± 0.61) -
CH3(CH2)4CH3 4.48 (± 0.79) 660b 147
CH3(CH2)5CH3 6.24 (± 0.88) 770b 123
c-C6H11-CH3 4.22 (± 0.28) 710b 168
c-C6H12 6.72 (± 0.99) 610b 90
(CH3)2CHCH(CH3)2 12.0 (± 3.90) - -
CH3(CH2)3OH 4.20 (± 0.98) 420 (± 33.4)c-f 100
CH3CH2OH 8.28 (± 3.20) 193(± 10.4)c-e,g-
j,l-p,ee
23
(CH3)2CHOH 7.19 (± 1.72) 200(± 24.0)c-
d,g,I,q-s
28
CH3OH 5.90 (± 0.67) 95(±4.4)c-g,I,k,m-n 16
(CH3)3COH 3.62 (± 0.03) -
(CH3CH2)2O 4.56 (± 1.00) 355(± 127)s-t 78
CH3OC(CH3)3 4.35 (± 0.35) 160t 37
CH3CH2OC(CH3)3 1.78 (± 0.63) 225(±88 )u-v 126
C4H8O (THF) 3.50 (± 0.65) 410t 117
CH2Cl2 7.63 (± 0.89) 8.8(±1.8 )w-y 1.2
(CH3)2CO 3.21 (± 1.16) 11.3(± 2.7) d,f,I,s 3.5
CHBr3 8.41 (± 2.32) 10.5(± 0.97)w,z 1
CHCl3 4.85 (± 0.92) 1.74(± 1.4)w, aa-dd 0.35
ClCH2CO2H 5.09 (± 0.96) 4.3f 0.85

47
aThe rate constants in water were obtained from the Notre Dame Radiation Laboratory database (http://www.rcdc.nd.edu/index.html); these values were verified by consulting the original papers. bReference 17; cReference 18; dReference 19; eReference 20; fReference 21; gReference 22; hReference 23; iReference 24; jReference 25; kReference 26; lReference 27; mReference 28; nReference 29; oReference 30; pReference 31; qReference 32; rReference 33; sReference 34; tReference 35; uReference 36; vReference 37; wReference 38; xReference 39; yReference 40; zReference 41; aaReference 42; bbReference 43; ccReference 44; ddReference 45; eeReference 46.
The results in Table 2-3 extend these observations: In going from neat acetonitrile to a
90% acetonitrile/water co-solvent, the rate constants increase by about a factor of two for the
hydrocarbons, but remain virtually unchanged for substrates with electronegative substituents.
(Higher proportions of water could not be used because of solubility problems).
Table 2-3. Rate constants for hydrogen abstraction by HO• from various
organic substrates in 90% CH3CN:H2O and 100% CH3CN
Substrate kH (CH3CN/H2O) x
10-7 (M -1s-1)
kH(CH3CN) x 10-7
(M -1s-1)
kH (CH3CN/H2O)/
kH(CH3CN) CH3(CH)4CH3 11.3 (± 1.04) 4.48 (± 0.79) 2.5
c-C6H10 15.2 (± 0.68) 6.72 (± 0.99) 2.3
(CH3)2CHCH(C
H3)2
16.8 (± 0.81) 12.0 (± 3.90) 1.4
CH3CH2OH 11.1 (± 0.80) 8.28 (± 3.20) 1.3
CHBr3 8.33 (± 0.84) 8.41 (± 2.32) 1.0
CHCl3 4.26 (± 1.06) 4.85 (± 0.92) 0.9
Preparative-scale experiments were performed in acetonitrile, using cyclohexane and 2,3-
dimethylbutane as substrates. The photo-initiated (350 nm) reaction of PSH with alkanes yields

48
the corresponding sulfides in good yield, presumably via the chain mechanism depicted in
Scheme 2-1.7
Scheme 2-1: Chain reaction of PSH
To ascertain relative reactivities of primary, secondary and tertiary hydrogens,
competition experiments were conducted using 2,3-dimethylbutane as the source for primary and
tertiary hydrogens, and cyclohexane as the source for secondary hydrogens. Rather than being
present in mM concentrations as with the laser flash experiments, the hydrocarbon substrates
were used in equimolar amounts as co-solvents. The derived relative reactivities in acetonitrile,
3o (15.2) > 2o (3.9) > 1o (1.0) compare favorably to the values estimated. The resulting products
from the reaction of PSH with these alkanes included the corresponding sulfides (Figure 2-1: 1 –
3) , as well as the pyrithiyl dimer (Figure 2-1: 4). Percent yields were determined to be 81.5%
and 83.5% for cyclohexane and dimethylbutane, respectively.

49
Laser flash experiments were repeated using a solvent devoid of abstractable hydrogens,
specifically Freon 113 (1,1,2-trichlorotrifluoroethane). In this solvent, the rate constants for
hydrogen abstraction from cyclohexane and methanol were 7.3 (±0.5) x 107 and 9.2 (±1.1) x 107
M-1s-1, respectively, nearly identical to those measured in acetonitrile. Competition experiments
were also run in Freon-113, yielding relative reactivities of 3o (18.9) > 2o (1.9) > 1o (1.0). Again,
these results are consistent with what was attained using acetonitrile as a solvent.
2.3 Discussion
2.3.1 Identity of the Hydroxyl Radical
In the aqueous phase, the hydroxyl radical reacts almost instantaneously with a substrate,
showing little to no selectivity. While such drastic differences in rate constants can and will be
explained in the context of a solvent effect, it is important that we establish that we are
considering the hydroxyl radical in these reactions and not a byproduct, namely either PyrS• or
the resulting radical from solvent hydrogen atom abstraction, NCH2C•. To provide new
evidence that eliminates NCH2C• or PyrS• from consideration as a hydrogen atom abstractors
Figure 2-1. Isolated products from the reaction of PSH and cyclohexane or 2,3-dimethylbutane
N S N S N S N SS
N
1 2 3 4

50
under these conditions, extensive experiments and research were conducted to- as much as
possible- eliminate these species as a possible contenders for hydrogen atom abstraction.
Several arguments based on both experimental and theoretical evidence can be made as to why
the hydroxyl radical must be responsible for this reactivity:
2.3.1.1 The transient generated via photolysis of PSH reacts both with the trans-stilbene
(probe) and added substrates (RH).
Let X• represent the radical produced from PSH. If X• reacts with both t-SB and RH
(Scheme 2), two phenomena should be observed as this is a parallel (pseudo) first order reaction:
a) The observed rate constant (kobs) should increase with increasing [RH] (constant [t-SB]), and
b) the intensity of the absorption arising from X•/t-SB should decrease with increasing [RH]
(because less of it is formed when RH is present). This is illustrated in Scheme 2-2.
Scheme 2-2: Parallel (pseudo) first order kinetics of X•

51
The results for RH = 2,3-dimethylbutane (23DMB) are shown below in Figure 2-2. The value of
kobs increases with increasing [23DMB]; the slope of this line yields kH = 1.2 x 10⁸ M
Figure 2-2. Plot of kobs (x) and signal intensity (☐) vs. [2,3-dimethylbutane]
In addition, the intensity of the absorption at 392 nm decreases with increasing
[23DMB]—as expected. This data can also be used (crudely) to estimate kH because
1
I= 1
Io
kH
kSB[ t − SB][RH] + 1
Io
(2-3)
where I and Io is the intensity of the 392 nm absorption in the presence and absence of RH ([t-
SB] held constant). From the slope and intercept of the I-1 vs. [RH] plot (kSB = 6.1 x 10⁹ M-1s-1,
courtesy of Platz; [t-SB] = 0.0015 M), the derived value of kH is 1.3 x 10⁸ M-1s-1, in nearly
perfect agreement with the value obtained from the variation of kobs.
(Note: Though the data for 23DMB is presented, the observations are similar for every substrate

52
examined: kobs vs. concentration plots are linear; signal intensity decreases as substrate is added.)
2.3.1.2 X• cannot be NCH2C• or PyrS•
a) The same transient is formed (at nearly the same rate) when the solvent is changed to CCl4
(originally reported by Platz, confirmed by us) effectively ruling out NCH2C•. Moreover, it is
highly unlikely that the rate constant for reaction of NCH2C• with t-SB would be 6 x 10⁹ M-1s-1
(The rate constant assigned by Platz for addition of HO• to t-SB).
However, to unambiguously demonstrate that NCH2C• was neither responsible for the
transient signal, nor the active hydrogen atom abstractor when substrates were added, the rate
constants for cyclohexane and methanol were also measured in Freon 113 (1,1,2-
trichlorotrifluoroethane). As observed for CH3CN solvent, kobs increased with increasing
substrate concentration, allowing the rate constant for hydrogen abstraction to be determined
from the slope of kobs vs. [substrate].
Table 2-4. Rate constant for hydrogen abstraction by HO• in
CH3CN and Freon-113
k × 10-7(CH3CN), M-1s-1 k × 10-7(Freon-113), M-1s-1 c-C6H12
6.72 (± 0.99) 7.3 (±0.5)
CH3OH 5.90 (± 0.67) 9.2 (±1.1)
The rate constants obtained in CH3CN and Freon 113 were nearly identical, consistent
with HO• as the (common) hydrogen abstractor. Accordingly, X• cannot be NCH2C•.
b) The reaction between NCH2C• and RH is expected to be too slow to be observed on the
nanosecond time scale, The C-H bond strength in the product (acetonitrile) is 85 kcal/mol, while
for a hydrocarbon it is 96 - 100 kcal/mol (depending on whether the hydrogen is primary,
secondary or tertiary). The energy of activation must be greater than or equal to the difference in
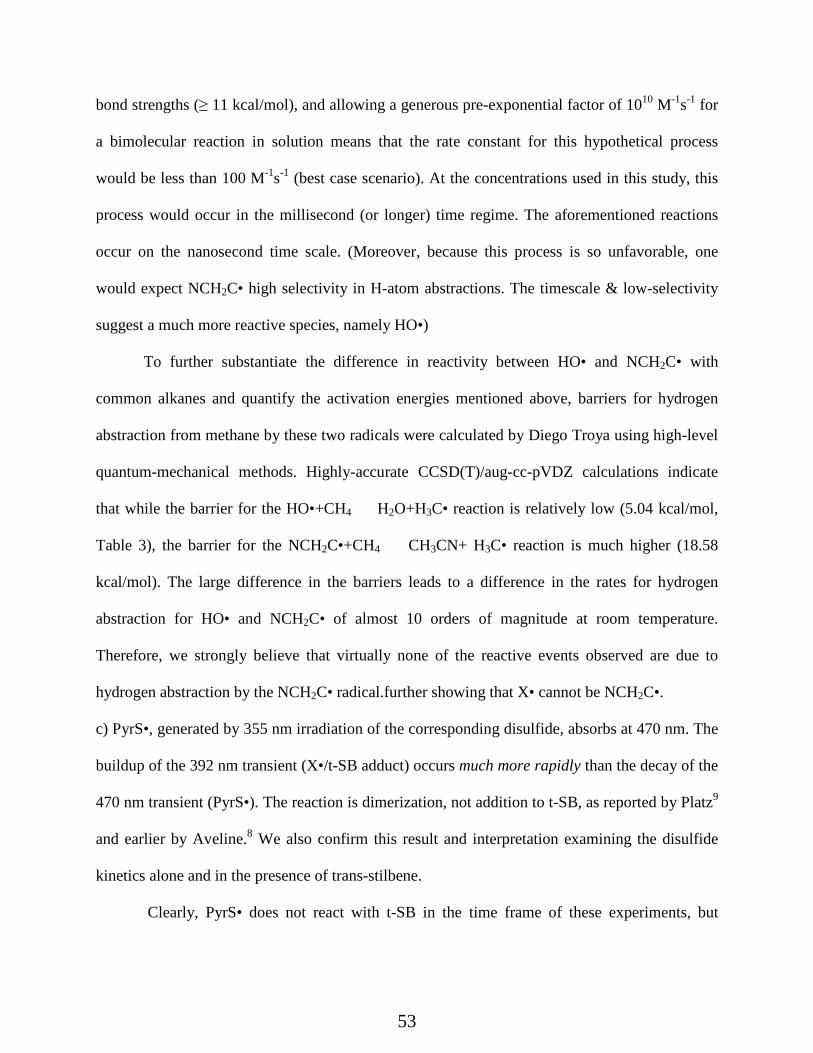
53
bond strengths (≥ 11 kcal/mol), and allowing a generous pre-exponential factor of 1010 M-1s-1 for
a bimolecular reaction in solution means that the rate constant for this hypothetical process
would be less than 100 M-1s-1 (best case scenario). At the concentrations used in this study, this
process would occur in the millisecond (or longer) time regime. The aforementioned reactions
occur on the nanosecond time scale. (Moreover, because this process is so unfavorable, one
would expect NCH2C• high selectivity in H-atom abstractions. The timescale & low-selectivity
suggest a much more reactive species, namely HO•)
To further substantiate the difference in reactivity between HO• and NCH2C• with
common alkanes and quantify the activation energies mentioned above, barriers for hydrogen
abstraction from methane by these two radicals were calculated by Diego Troya using high-level
quantum-mechanical methods. Highly-accurate CCSD(T)/aug-cc-pVDZ calculations indicate
that while the barrier for the HO•+CH4 à H2O+H3C• reaction is relatively low (5.04 kcal/mol,
Table 3), the barrier for the NCH2C•+CH4 à CH3CN+ H3C• reaction is much higher (18.58
kcal/mol). The large difference in the barriers leads to a difference in the rates for hydrogen
abstraction for HO• and NCH2C• of almost 10 orders of magnitude at room temperature.
Therefore, we strongly believe that virtually none of the reactive events observed are due to
hydrogen abstraction by the NCH2C• radical.further showing that X• cannot be NCH2C•.
c) PyrS•, generated by 355 nm irradiation of the corresponding disulfide, absorbs at 470 nm. The
buildup of the 392 nm transient (X•/t-SB adduct) occurs much more rapidly than the decay of the
470 nm transient (PyrS•). The reaction is dimerization, not addition to t-SB, as reported by Platz9
and earlier by Aveline.8 We also confirm this result and interpretation examining the disulfide
kinetics alone and in the presence of trans-stilbene.
Clearly, PyrS• does not react with t-SB in the time frame of these experiments, but

54
rather, undergoes dimerization. Not only does PyrS• not act as a hydrogen atom abstractor, the
reverse reaction is preferred as thiols (RSH) are good hydrogen atom donors to alkyl radicals.
(There are reports that RS• can abstract hydrogen from reactive substrates, e.g., the a-C-H bond
of peptides;47 However, the rate constants are much lower than anything reported herein). X•
cannot be PyrS•.
d) Though addition of NCH2C• or PyrS• to t-SB can in principle occur, most likely addition
occurs to the C=C as opposed to the aromatic ring. The resulting benzyl radical will have λmax =
315 nm, not 392 nm. The only way to explain a 392 nm absorption is the addition of a highly
reactive (presumably HO•) to the aromatic ring (generating a highly conjugated radical), as was
discussed in depth by Platz in his JACS paper (Figure 2-3).
Figure 2-3. Absorptions from radical additions
e) Experiments performed on a preparative scale, under conditions of substantially higher
substrate concentrations indicate an extremely reactive, unselective species. The observed
selectivities (3o > 2o >1o) for H-abstraction from alkanes are very low (suggestive of a highly
reactive oxygen-centered radical) and completely consistent with the values derived from the

55
LFP studies:
Preparative scale (acetonitrile): 3o (15) > 2o (4) > 1o (1.0)
LFP: 3o (14) > 2o (1.4) > 1o (1.0)
This selectivity data suggests that the same intermediate is involved in both the
preparative scale and LFP experiments, namely HO•. When PSH is photolyzed in CH3CN
without added hydrocarbon, no products are detected that can be attributed to any reaction of
NCH2C•. (Presumably this species either dimerizes or disproportionates). Again, the only
detected product is the disulfide, arising from decomposition of PSH.
Unfortunately, these experiments and arguments do not prove that the observed chemistry
is attributable to hydroxyl radical. Rather, they only eliminate other reasonable alternative
explanations. In addition to the aforementioned trans-stilbene adducts with PyrS• and NCH2C•,
Platz and coworkers also considered, and eliminated, triplet stilbene and stilbene radical cation
as species giving rise to the 392 nm transient.
Computational studies provided no evidence for HO•/CH3CN complexes to explain the
diminished reactivity of hydroxyl radical in acetonitrile—our results in Freon 113 add additional
support this conclusion. Based upon the laser flash results and the accompanying product studies,
hydroxyl radical emerges as the most likely explanation for the observed chemistry.
2.3.2 Discussion of Polarized Transition State
Walling,12 Russell,4 and others13 have argued for the importance of a polar transition state
for hydrogen atom abstraction reactions. These results can be explained by taking their ideas one
step further (Figure 2-4): Because oxygen is more electronegative than carbon and hydrogen, in
the transition state for hydrogen abstraction, electron density is pulled towards the oxygen of the

56
hydroxyl radical giving it a partial negative charge, and a partial positive charge on the RH
portion of the transition state. This development of negative charge on the oxygen of the
hydroxyl radical affords the opportunity for the solvent (H2O) to stabilize the transition state
through its polarity and/or ability to participate in hydrogen bonding. Table 2-3 shows that for
hydrocarbons, even 10% addition of water has a significant effect on the rate because the
transition state is so highly polarized. In contrast, when the substrate possesses electronegative
substituents (e.g., halogen, carbonyl), the transition state is less polarized because the substituent
competes for electron density; there is less transfer of negative charge to the oxygen of the
hydroxyl radical—hydrogen bonding interactions are expected to be weaker, thus explaining
why there is little to no rate enhancement in going from acetonitrile to water for these substrates.
It should be noted that the hydrogen on the hydroxyl radical (not involved in the reaction) bears
substantial positive charge in the reactant, transition state, and product. Although this hydrogen
can also participate in hydrogen bonding, this interaction does not affect the relative energies
because the charge on this hydrogen remains constant in the progression from reactant to
transition state to product.

57
For alcohols and ethers, where H-abstraction also occurs at the α-carbon, we hypothesize
that the electron-withdrawing properties of oxygen in the substrate (manifested through an
Figure 2-4. Formation of a polarized transition state for hydrogen atom abstraction from a
hydrocarbon by hydroxyl radical.

58
inductive effect), are offset by the resonance stabilization afforded by the lone pair of electrons
(Scheme 2-3). This resonance effect would thus allow the oxygen of the hydroxyl radical to
become highly negative so that hydrogen bonding interactions would again become important.
Presumably the effect of oxygen diminishes with distance so that the β-hydrogens (and beyond)
are aliphatic in nature, and the solvent effect on their reactivity is similar to the alkanes.
Scheme 2-3: Electron donation from oxygen in alcohols
In order to test these hypotheses, and assess how atomic charges on individual atoms vary
in the progression from reactants à transition state à product, molecular orbital calculations
were performed by James Tanko on the pertinent species for the reactions a) CH4 + HO• à
CH3• + H2O, and b) Cl3CH + HO• à Cl3C• + H2O, and c) HOCH3 + HO• à HOCH2•
+ H2O at various levels of theory.48 In Figure 2-5, the charges obtained from a natural
population analysis at the MP2(full)/aug-cc-pVQZ//UHF/6-311G* levels are reported. It should
be noted that every level of theory (AM1, B3LYP/6-311G*, UHF/6-311G*) employed gave
virtually the same qualitative results. As the reactants approach the transition state, the hydrogen
being transferred becomes substantially more positive, and the oxygen, more negative, consistent
with the notion of a polarized transition state. However, the degree of polarization is far greater
for CH4 and CH3OH compared to CHCl3, as expected based upon the preceding discussion. The

59
negative charge on the oxygen of hydroxyl radical in the transition state means that this oxygen
can be a hydrogen bond acceptor.
Figure 2-5. Atomic charges for the reaction of hydroxyl radical with CH4, CH3OH and CHCl3
obtained from natural population analysis of the reactants, transition states, and products at the
MP2(full)/aug-cc-pVQZ//UHF/6-311G* levels
-0.394
0.394
0.043
0.238
-0.725
0.445
0.010
0.276
-0.723
0.445
-0.193
0.220
-0.473
0.445
-0.923
0.462
0.462

60
As noted, there are in principle, two contributors to the observed solvent effect. In
addition to hydrogen bonding, it is also possible that solvent polarity plays a role in stabilizing
the transition state (relative to the reactants). However, the following analysis strongly suggests
that hydrogen bonding interactions in the transition state, rather than a simple solvent polarity
effect, is the etiology of the effect.
The free energy of solvation of a polar molecule in a polar solvent can be estimated by
the Kirkwood equation, and applied to the reaction between two polar molecules A + B à
transition state (ts) via activated complex theory.49 The magnitude of the solvent effect depends
on the dipole moment (µ) and radius (r) of the transition state relative to reactants, and the
dielectric constant (ε) of the solvent as expressed in Eq. 2-2, where ln(ko) refers to the rate
constant in a solvent of dielectric constant of unity; εo is the permittivity of vacuum, and N, π, R
and T have their usual meanings.
lnk = lnko + 14πεo
N
RT
µts2
rts3 − µA
2
rA3 − µB
2
rB3
ε −12ε +1
(2-4)
Using the dipole moments and radii for CH4, HO•, and (CH4/HO•)≠ obtained from
CCSD(T)/aug-cc-pVDZ calculations based on MP2/aug-cc-pVDZ geometries (vide infra), the
rate is actually predicted to be slightly greater in acetonitrile than water (kCH3CN/kH20 = 1.01).48
This result makes sense because one of the reactants (hydroxyl radical) possesses a significant
dipole moment; the transition state has a slightly lower dipole moment, and a larger radius. The
increased rate in water thus cannot arise simply because it is a more polar solvent than
acetonitrile, but rather because it is able to stabilize the developing negative charge on the
hydroxyl radical in the transition state by acting as a hydrogen bond donor. It should also be
noted that the results obtained in Freon 113 add further support to this hypothesis because a) the

61
rate constants are the same as in acetonitrile, and b) Freon 113 has a substantially lower
dielectric constant than acetonitrile.
To further assess the contribution of dipolar interactions to the observed rate
enhancement in water, electronic-structure calculations of the HO• + CH4 à H2O + CH3•
reaction barrier were performed by Diego Troya using implicit solvation models. CCSD(T)/aug-
cc-pVDZ calculations with the polarized continuum model (PCM) using geometries and
frequencies calculated at the MP2/aug-cc-pVDZ level indicate that the reaction in water should
be slower than in acetonitrile or the gas phase.48 In effect, the barrier for the PCM calculations
using water as a solvent in the PCM model (6.76 kcal/mol) is larger than the barrier when using
acetonitrile as a solvent (5.86 kcal/mol). Both barriers are larger than the gas-phase barrier at that
level (5.03 kcal/mol). These predictions (based upon the PCM model, which does not account for
explicit hydrogen bonding) are in stark contrast with the experimental results in water solvent.
This “disparity” is easily reconciled if the transition state for hydrogen atom abstraction is
stabilized by hydrogen bonding in water solvent.
As a final confirmation of this interpretation, the effect of solvent water molecules on the
minimum-energy reaction path of the HO• + CH4 à H2O + CH3• reaction was calculated.48
Geometry optimizations and frequency calculations were conducted at the MP2/aug-cc-pVDZ
level, and energies were refined at the CCSD(T)/aug-cc-pVDZ level. Qualitatively, when water
molecules were added to the calculations for the HO•/CH4 reaction, the resulting transition state
clearly shows that the water molecules properly align so as to stabilize the developing charges as
hypothesized. Quantitatively, the magnitude of the stabilization is consistent with the magnitude
of the observed kinetic solvent effect.

62
Table 2-5 shows the calculated barriers and calculated relative rate constants for HO• +
CH4 à H2O + CH3• with various water molecules hydrogen bonding to different sites of the
HO•/CH4 system either as donors or acceptors. One water molecule acting as hydrogen-bond
donor to the OH radical reduces the barrier by 1.52 kcal mol-1. On the other hand, if the solvating
water molecule acts as hydrogen-bond acceptor, the barrier increases by 0.32 kcal mol-1. If one
water molecule acts as hydrogen-bond donor and another one as hydrogen-bond acceptor, the
barrier decreases by 1.14 kcal mol-1. This decrease is almost a perfect balance between the 1.52
kcal mol-1 decrease and 0.32 kcal mol-1 increase in the barriers of the transition states with only
one molecule acting as donor or acceptor, respectively, suggesting that the effect of individual
water molecules might be additive. Attempts to study the reaction in which two water molecules
act as hydrogen-bond donors failed to locate the appropriate reagents conformation. In effect,
even though a transition state in which two water molecules are acting as hydrogen-bond donors
was located, optimizations of the OH radical with two water molecules acting as hydrogen-bond
donors always led to the isomer in which one water molecule acts as hydrogen-bond donor and
the other is an acceptor.

63
Table 2-5. Barriers of the HO• + CH4 à H2O + CH3• reaction with various levels of solvationa
# of waters # of HB
acceptors # of HB donors
Barrier (kcal/mol) krel
0 0 0 5.04 1.0
1 0 1 3.48 13.9
1 1 0 5.25 0.7
2 1 1 3.90 6.8
3 1 2 2.37 90.2
aEnergies calculated at the CCSD(T)/aug-cc-pVDZ level using geometries and harmonic
frequencies obtained at the MP2/aug-cc-pVDZ level. The barriers correspond to enthalpies of
activation at 0 K.
Finally, the barrier of the HO• + CH4 à H2O + CH3• reaction with two water molecules
acting as hydrogen bond donors, and one water molecule acting as hydrogen bond acceptor was
calculated.48 The decrease in the barrier for this solvation level with respect to the unsolvated
system is 2.37 kcal/mol-1, with a relative rate enhancement consistent with experimental results.
Various attempts to include additional water molecules that are in direct contact with the OH
radical at the transition state led to solvation of any of the three water molecules forming the first
solvation sphere, as expected.

64
2.4 Conclusions
The hypothesis that the hydroxyl radical reacts through a polar transition state is fully
supported by the experimental and theoretical data obtained in this study. As a consequence of
this polarization, hydrogen bonding to water stabilizes the transition state resulting in larger rate
constants when water is the solvent. This explanation also predicts that the magnitude of the
solvent effect will decrease when electronegative substituents are present on the α-carbon of the
substrate. The solvent effect is also significant when the substrate possesses electron-donating
substituents, presumably because of competing inductive (electron withdrawing) and resonance
(electron donating) effects.
These results extend the observations of Platz, and coworkers,9, 10 who argued for a
highly polarized transition state for the addition of HO• to aromatic substrates to explain a nearly
two order of magnitude diminution in rate in acetonitrile compared to water. For these additions,
calculations suggested that the hydroxyl moiety was nearly anionic in the transition state,
providing a clear opportunity for water stabilization via hydrogen bonding. The effect water has
on modulating HO• reactivity has enormous implications. In biological systems, this means that
HO• may be less reactive in the hydrophobic regions of a cell than previously believed, i.e.,
hydroxyl radical does not necessarily react with the first molecule it encounters. Indeed, Nature
may use this as a containment strategy when hydroxyl radical is produced naturally within cells.
Based upon rate measurements in water, reactions of HO• were generally thought to be
diffusion-controlled. Consequently, it has been assumed that attempts to protect against the
damaging effects of HO• through the use of antioxidants are doomed to failure because a
successful defense strategy requires a degree of selectivity to be demonstrated by the reactive
radical. The radical must react preferentially with antioxidant, rather than the molecule or

65
materials which one is trying to protect, in order for any defense system to be effective. Our
results demonstrate that such selectivity might be attainable in a hydrophobic environment.
Finally, it should be stressed that the ideas presented herein provide a molecular-level
understanding of hydroxyl radical reactivity both in solution and the gas phase.
2.5 Experimental
2.5.1 Materials. All of the solvents and fine chemicals used in this study were obtained from
Sigma-Aldrich. Liquid substrates were distilled and N-hydroxypyridine-2-thione was
recrystallized prior to use.
2.5.2 Apparatus. Steady-state UV-vis spectra were recorded on a Hewlett-Packard diode array
UV-vis spectrophotometer (HP 8452A). Laser flash photolysis experiments were conducted
using an Applied Photophysic LKS.60 spectrometer using the third harmonic of a Continuum
Surelite I-10 Nd:YAG laser (4-6 ns pulse, 355 nm). Transient signals were monitored by a
Hewlett-Packard Infinium digital oscilloscope and analyzed with the Applied Photophysics
SpectraKinetic Workstation software package (v. 4.59).
2.5.3 Laser Flash Photolysis (LFP). Substrates were prepared in acetonitrile, carbon
tetrachloride, Freon-113 or an acetonitrile:water co-solvent, and deoxygenated prior to
photolysis. (Steady-state UV-vis spectra were recorded to verify that N-hydroxypyridine-2-
thione was the only species absorbing at the excitation wavelength). In all LFP experiments, a
fixed concentration of trans-stilbene (0.0015M) was utilized as a spectroscopic probe,
monitoring the signal buildup at 392 nm. Low laser power (ca. 10 – 20 mJ) was used in all
experiments to eliminate any laser power dependency to the observed rate constants thereby,
minimizing the contributions of radical-radical reactions to the observed rate constant. Substrate
concentrations were varied over a factor of at least 10 over five to seven separate experiments.

66
Rate constants were averaged and determined with 95% confidence limits. R-squared values
were ≥0.90 for all concentration profiles. A sample transient and concentration gradient is
demonstrated in Figure 2-6.
Figure 2-6. Hydrogen abstraction from tetramethylbutane by HO•

67
[tetramethylbutane], M kobs(10-7),
s-1 Standard
Deviation(10-7)
0.011 0.96 0.024
0.021 0.99 0.027
0.042 1.14 0.049
0.063 1.23 0.033
0.084 1.39 0.033
0.105 1.50 0.028
2.5.4 Calculations. Electronic structure calculations were performed using either the Spartan
0450 molecular modeling software or Gaussian 03.50
2.5.5 Competition Experiments. Products used in competition experiments were synthesized,
isolated and characterized using NMR, IR, GC/MS and High Resolution GC/MS (HRMS). Equal

68
molar amounts (153 mM) of 2,3 dimethylbutane and cyclohexane were irradiated at 350 nM with
4.7 mM N-hydroxypyridinethione in acetonitrile for 30 minutes.
2.5.5.1 Product Isolation/Characterization. To isolate products from the reaction mixtures,
column chromatography was performed using Sigma-Aldrich neutral aluminum oxide,
Brockmann I, standard grade (~150 mesh, 58 angstrom). TLC analyses were performed on
commercial aluminum sheets. All chemicals were purchased from Aldrich without further
purification unless otherwise noted.
Infrared Spectroscopy was conducted using a Perkin Elmer Spectrum One Fourier
Transform Infrared spectrometer (Waltham, MA) in Attenuated Transform Reflectance (ATR)
mode with a ZnSe crystal at 4 cm–1 resolution. Background was determined using 50 scans from
4000 to 600 cm–1, and 25 scans were conducted for each sample also over this range. 1HNMR
spectra were taken on a Varian Inova 400 MHz spectrometer. All chemical shifts were given in δ
value with tetramethylsilane as an internal standard. Gas chromatographic/mass spectral analyses
were obtained on a HP MSD low-resolution GCMS. High resolution mass spectra were obtained
on an Agilent LC-ESI-TOF under FAB conditions. Gas chromatographic analyses were
performed on a Hewlett-Packard HP 5890 A instrument equipped with an FID detector and an
HP 3393A reporting integrator using a 30 m SE-54 capillary column (0.25 mm diameter).
2-(cyclohexylthio)pyridine (Figure 2-1:1) was prepared following the general procedure. The
compound was isolated using a neutral alumina column with a 1:1 diethyl ether:hexane system.
The compound is a yellow liquid and has previously been synthesized an characterized:51 IR
(CH2Cl2) 2929/2852, 1450/1413, 1338, 1263, 1115 cm-1; 1H NMR (CDCl3) δ 1.2-1.8 (m, 8H),
2.0-2.2 (m, 2H), 3.7-3.9 (m, 1H), 6.9 (m, 1H), 7.1 (m, 1H), 7.4 (m, 1H), 8.4 (m, 1H) MS, m/e

69
(relative intensity): 193 (M+, 27.4), 111 (100); Exact Mass (HRMS): 193.093, Exact Mass
(calculated): 193.093
2-(2,3-dimethylbutylthio)pyridine (Figure 2-1:2) and 2-(2,3-dimethylbutan-2-ylthio)pyridine
(Figure 2-1:3) were prepared following the general procedure. The compounds were isolated
using a neutral alumina column with a 1:3 diethyl ether:hexane system, but could not be
separated from each other. (The ratio of isomers was determined by 1HNMR, and confirmed by
GC). The compounds are a yellow liquid.
IR (CH2Cl2) 2962/2875, 1450/1413, 1377, 1265/1277, 1087 cm-1.; NMR (CDCl3) δ 0.9-1.8
(overlay of several multiplets), 2.10-2.2 (septuplet, 3H), 2.9-3.0 (q, 1H), 3.25-3.35 (q, 1H), 7.1
(m, 1H), 7.4 (m, 4H), 7.7 (m, 4H), 8.3 (m, 4H)
2-(2,3-dimethylbutylthio)pyridine : MS, m/e (relative intensity): 193 (M+, 9.1), 111 (100);
Exact Mass (HRMS): 195.1904, Exact Mass (calculated): 195.1082
2-(2,3-dimethylbutan-2-ylthio)pyridine: MS, m/e (relative intensity): 195 (M+, 0.6), 111
(100), Exact Mass (HRMS): 195.1904, Exact Mass (calculated): 195.1082
Acknowledgements. This work was supported by the National Science Foundation (CHE-
0548129, CHE-0547543) and in part by the Macromolecular Interfaces with Life Sciences
(MILES) Integrative Graduate Education and Research Traineeship (IGERT) of the National
Science Foundation under Agreement No. DGE-0333378 in the form of fellowships to S.M. and
S.Z. D.T. is a Cottrell Scholar of Research Corporation. We thank Profs. T. Daniel Crawford and
Naushadalli K. Suleman for helpful discussions.

70
Supporting Information Available. Representative transient traces, kobs vs. concentration
plots, the absolute energies and optimized geometries of all calculated structures, and the
complete Gaussian 03 citation is available online and in Appendix A of this dissertation.

71
References
1. Li, S.; Matthews, J.; Sinha, A., Science 2008, 319, 1657 - 1660.
2. Vöhringer-Martinez, E.; Hansmann, B.; Hernandez-Soto, H.; Francisco, J. S.; Troe, J.;
Abel, B., Science 2007, 315, 497 - 501.
3. Tanko, J. M.; Suleman, N. K., Solvent Effects in the Reactions of Neutral Free Radicals.
In Energetics of Organic Free Radicals, Simões, J. A. M.; Greenberg, A.; Liebman, J.,
Eds. Chapman & Hall: New York, 1996; pp 224 - 293.
4. Russell, G. A., J. Am. Chem. Soc. 1958, 80, 4987 - 4996.
5. Litwinienko, G.; Ingold, K. U., Acc. Chem. Res. 2007, 40, 222 - 230.
6. Xu, G.; Chance, M. R., Chem. Rev. 2007, 107, (8), 3514 - 3543.
7. Boivin, J.; Crépon, E.; Zard, S. Z., Tetrahedron Lett. 1990, 47, 6869 - 6872.
8. Aveline, B. M.; Kochevar, I. E.; Redmond, R. W., J. Am. Chem. Soc. 1995, 117, 9699 -
9708.
9. DeMatteo, M. P.; Poole, J. S.; Shi, X.; Sachdeva, R.; Hatcher, P. G.; Hadad, C. M.; Platz,
M. S., J. Am. Chem. Soc. 2005, 127, 7094 - 7109.
10. Poole, J. S.; Shi, X.; Hadad, C. M.; Platz, M. S., J. Phys. Chem. A. 2005, 109, 2547 -
2551.
11. Russell, G. A., Reactivity, Selectivity, and Polar Effects in Hydrogen Atom Transfer
Reactions. In Free Radicals, Vol. I, Kochi, J. K., Ed. John Wiley & Sons, Inc.: New York
1973; pp 275 - 331.
12. Walling, C., Free Radicals in Solution. John Wiley & Sons, Inc.: New York, 1957.
13. Roberts, B. P., Chem. Soc. Rev. 1999, 28, 25 - 35.
14. Merga, G.; Rao, B. S. M.; Mohan, H.; Mittal, J. P., J. Phys. Chem 1994, 98, 9158 - 9164.

72
15. Anbar, M.; Meyerstein, D.; Neta, P., J. Phys. Chem 1966, 70, 2660 - 2662.
16. Finn, M.; Friedline, R.; Suleman, N. K.; Wohl, C. J.; Tanko, J. M., J. Am. Chem. Soc.
2004, 126, 7578 – 7584.
17. Rudakov, E. S.; Volkova, L. K.; Tret'yakov, V. P., React. Kinet. Catal. Lett. 1981, 16,
333 - 337.
18. Buxton, G. V.; Greenstock, C. L.; Helman, W. P.; Ross, A. B., J. Phys. Chem. Ref. Data
1988, 17, 513 - 886.
19. Willson, R. L.; Greenstock, C. L.; Adams, G. E.; Wageman, R.; Dorfman, L. M., Int. J.
Radiat. Phys. Chem. 1971, 211 - 220.
20. Adams, G. E.; Boag, J. W.; Michael, B. D., Trans. Faraday Soc. 1965, 61, 1417 - 1424.
21. Adams, G. E.; Boag, J. W.; Currant, J.; Michael, B. D., In Pulse Radiolysis, Ebert, M.;
Keene, J. P.; Swallow, A. J.; Baxendale, J. H., Eds. Academic Press: New York, 1965; pp
131 - 143.
22. Motohashi, N.; Saito, Y., Chem. Pharm. Bull. 1993, 41, 1842 - 1845.
23. Park, H.-R.; Getoff, N., Z. Naturforsch., A. Phys. Sci 1992, 47A, 985 - 991.
24. Wolfenden, B. S.; Willson, R. L., J. Chem. Soc., Perkin Trans. 1982, 805 - 812.
25. Matheson, M. S.; Mamou, A.; Silverman, J.; Rabani, J., J. Phys. Chem. 1973, 77, 2420 -
2424.
26. Elliot, A. J.; McCraken, D. R., Radiat. Phys. Chem 1989, 33, 69 - 74.
27. Buxton, G. V., Trans. Faraday Soc. 1970, 66, 1656 - 1660.
28. Baxendale, J. H.; Khan, A. A., Int. J. Radiat. Phys. Chem. 1969, 1, 11 - 24.
29. Neta, P.; Dorfman, L. M., Adv. Chem. Ser 1968, 81, 222 - 230.
30. Heckel, E.; Henglein, A.; Beck, G., Ber. Bunsenges. Phys. Chem. 1966, 70, 149 - 154.
73
31. Matthews, R. W.; Sangster, D. F., J. Phys. Chem 1965, 69, 1938 - 1946.
32. Elliot, A. J.; Simsons, A. S., Radiat. Phys. Chem 1984, 24, 229 - 231.
33. Greenstock, C. L.; Ng, M.; Hunt, J. W., Adv. Chem. Ser. 1968, 81, 397 - 417.
34. Thomas, J. K., Trans. Faraday Soc. 1965, 61, 702 - 707.
35. Eibenberger, J. Vienna Univ., Vienna, Austria, 1980.
36. Karpel Vel Leitner, N.; Papailhou, A.-L.; Croue, J.-P.; Peyrot, J.; Dore, M., Ozone Sci.
Eng. 1994, 16, 41 - 54.
37. Mezyk, S. P.; Cooper, W. J.; Bartels, D. M.; O'Shea, K. E.; Wu, T., J. Phys. Chem. A
2001, 105, 3521 - 3526.
38. Haag, W. R.; Yao, C. C. D., Environ. Sci. Technol. 1992, 26, 1005 - 1013.
39. Getoff, N., Radiat. Phys. Chem. 1991, 37, 673 - 680.
40. Emmi, S. S.; Beggiato, G.; Casalbore-Miceli, G.; Fuochi, P. G., J. Radioanal. Nucl.
Chem., Lett. 1985, 93, 189 - 197.
41. Lal, M.; Mahal, H. S., Radiat. Phys. Chem. 1992, 40, 23 - 26.
42. Rezansoff, B. J.; McCallum, K. J.; Woods, R. J., Can. J. Chem. 1970, 48, 271 - 276.
43. Anbar, M.; Meyerstein, D.; Neta, P., J. Chem. Soc. B 1966, 742 - 747.
44. Chutny, B., Collect. Czech. Chem. Commun. 1966, 31, 358 - 361.
45. Bednar, J.; Teply, J., Collect. Czech. Chem. Commun. 1960, 25, 842 - 851.
46. Adams, G. E.; Boag, J. W.; Michael, B. D., Trans. Faraday Soc. 1965, 61, 492 - 505.
47. Bobrowski, K.; Hug, G. L.; Pogocki, D.; Marciniak, B.; Schaneich, C., Stabilization of
Sulfide Radical Cations through Complexation with the Peptide Bond: Mechanisms
Relevant to Oxidation of Proteins Containing Multiple Methionine Residues. The J. Phys.
Chem. B 2007, 111, (32), 9608-9620.

74
48. Mitroka, S.; Zimmeck, S.; Troya, D.; Tanko, J. M., How Solvent Modulates Hydroxyl
Radical Reactivity in Hydrogen Atom Abstractions. . Journal of the American Chemical
Society 2010, 132, (9), 2907-2913.
49. Reichardt, C., Solvents and Solvent Effects in Organic Chemistry. 2nd ed.; VCH:
Weinheim, 1990.
50. Frisch, M. J.; Trucks, G. W.; Schlegel, H. B.; Scuseria, G. E.; Robb, M. A.; Cheeseman,
J. R.; Montgomery, J., J. A.; Vreven, T.; Kudin, K. N.; Burant, J. C.; Millam, J. M.;
Iyengar, S. S.; Tomasi, J.; Barone, V.; Mennucci, B.; Cossi, M.; Scalmani, G.; Rega, N.;
Petersson, G. A.; Nakatsuji, H.; Hada, M.; Ehara, M.; Toyota, K.; Fukuda, R.; Hasegawa,
J.; Ishida, M.; Nakajima, T.; Honda, Y.; Kitao, O.; Nakai, H.; Klene, M.; Li, X.; Knox, J.
E.; Hratchian, H. P.; Cross, J. B.; Bakken, V.; Adamo, C.; Jaramillo, J.; Gomperts, R.;
Stratmann, R. E.; Yazyev, O.; Austin, A. J.; Cammi, R.; Pomelli, C.; Ochterski, J. W.;
Ayala, P. Y.; Morokuma, K.; Voth, G. A.; Salvador, P.; Dannenberg, J. J.; Zakrzewski,
V. G.; Dapprich, S.; Daniels, A. D.; Strain, M. C.; Farkas, O.; Malick, D. K.; Rabuck, A.
D.; Raghavachari, K.; Foresman, J. B.; Ortiz, J. V.; Cui, Q.; Baboul, A. G.; Clifford, S.;
Cioslowski, J.; Stefanov, B. B.; Liu, G.; Liashenko, A.; Piskorz, P.; Komaromi, I.;
Martin, R. L.; Fox, D. J.; Keith, T.; Al-Laham, M. A.; Peng, C. Y.; Nanayakkara, A.;
Challacombe, M.; Gill, P. M. W.; Johnson, B.; Chen, W.; Wong, M. W.; Gonzalez, C.;
Pople, J. A. Gaussian 03, Revision C.02, Gaussian, Inc.: Wallingford CT, 2004.
51. Barton, D. H. R. C.-Y., C.; Jaszberenyi, J. C. , Tetrahedron Letters 1992, 33, 5013-5016.

75
Chapter 3 Mechanistic Degradation of High Density Polyethylene Potable
Water Materials
Contributions
This chapter represents an extension and continuation of studies previously performed in
the Dietrich laboratory, with whom this work was a collaborative effort.1 Ms. Susan Mitroka
was primary author of the resulting manuscript and performed the majority of experimental
procedures. Mr. Timothy Smiley performed all pipe extraction and HDPE pipe liquid/liquid
extraction experiments. Dr. Andrew Whelton (former member of the Dietrich lab) contributed
significantly to the experimental design of several aging experiments performed. Dr. James
Tanko and Dr. Andrea Dietrich (member of the thesis committee) contributed significantly to the
experimental design of the project, as well as the intellectual merit of the manuscript.
1. Whelton, A. J.; Dietrich, A., Critical considerations for the accelerated ageing of high-
density polyethylene potable water systems. Polymer Stability and Degradation 2009, 94, 1163-
1175.

76
Abstract: Accelerated aging conditions with chlorinated water solutions that minimize variations in
solution chemistry were used in 160 - 190 day (3840 - 4560 h) immersion studies of high density
polyethylene (HDPE) pipe and anti-oxidant (AO) free HDPE resin. Samples were periodically
characterized for changes in visual appearance and surface chemistry using infrared spectroscopy.
Formation of surface carbonyl bonds were detected for both HDPE pipe and AO free HDPE resin
samples. Isotopic 18O2 gas was then used to assess the source (or one of the sources) of the carbonyl
oxygen. Liquid/liquid extractions from the water of both HDPE pipe and AO free HDPE resin samples
indicated the formation of novel HDPE breakdown products which can leach into water. From this data,
species involved in the breakdown of HDPE pipe have been identified, and a possible mechanism for the
polyalkene breakdown is proposed.
77
3.1 Introduction
Polyethylene (PE) pipes are becoming increasingly popular as a means of water transport
for industrial and residential applications. PE pipes compose a third of the world’s plastic pipe
demand, with their low cost and durability making them an attractive option for transport of
disinfected drinking water.1 Currently, medium density polyethylene (MDPE) and high density
polyethylene (HDPE) resins are commonly used and approved for cold water applications at
about 25 ºC or less, well above their glass-transition temperature (Tg) and comfortably below
their reported melting temperatures (Tm). These pipes are known to have a high degree of
flexibility and unusually tough resistance to stress; HDPE pipes survived a tremendous
earthquake in Kobe Japan, which led to massive destruction and fatalities due to ruptured gas
lines. All damage was reportedly due to steel pipe failure, with no indication of HDPE pipes
failing.2, 3
While these pipes have projected 50 to 100 year service life, chlorinated water exposure
greatly decreases this value,1, 4-7 with studies indicating that the actual usage time under severe
conditions being less than ten years.7 Additives such as phosphate, hindered phenol antioxidants,
carbon black, and UV stabilizers provide a great amount of oxidative resistance, yet over
repeated exposure to chlorinated water, these stabilizers are expended, leaving the polyalkene
open to oxidative attack.4, 5, 8, 9
Long-term exposure to water containing free available chlorine is known to have a
damaging effect on PE pipe mechanical, surface, and morphological characteristics, however the
exact mechanism behind these processes remains a bit of a mystery.1, 4, 5, 9, 10 PE pipe failure
depends on a variety of different factors, including chemical structure of the polymer (e.g., the
presence of reactive unsaturated sites), temperature, water pH, free available chlorine

78
concentration, and exposure time. At low stresses (as is generally the case in water transport) the
failure one of these pipes is due to the slow and consistent growth of a crack,2 generally initiated
at the surface of the pipe exposed to the water.4, 6 It is generally reported that PE oxidation does
not occur until antioxidants have been depleted- at least from the surface of the pipe exposed to
chlorinated water,4, 5, 9 which is then susceptible to oxidative attack. Although many of these
studies were performed under extreme conditions not representative of disinfected drinking
water (such as temperature up to 105°C and aqueous chlorine concentrations exceeding 100,000
mg/L), it would be expected that the same phenomena would occur under drinking water
conditions but over longer periods of time.
The proposed first major stage of PE pressure pipe degradation is chlorinated water
attack on the pipe surface, resulting in characteristic functional groups of oxygen, chlorine,
hydroxyl, and vinyl components that can be detected by FTIR. Previous work from this group
and others have established that when HDPE pipe samples are subjected to constant chlorinated
accelerated aging conditions, the first functionality to appear is a carbonyl stretch at 1715 cm-1.1,
10 These carbonyls on the inner diameter of the pipe are precursors to the formation of
microcracks, eventually evolving into macrocracks, leading to pipe failure.10 While these
components are characteristic of most HDPE accelerated aging studies involving chlorinated
water, there is no consensus of either what species are involved in this process, or what the
mechanism leading to these changes might be. This initial fracturing of the alkane structure is
what eventually leads to microcracks, which propagate through the pipe wall until the water
pressure exceeds the pipe’s mechanical strength, leading to pipe rupture.2, 4
Species involved in chlorine water degradation of HDPE pipe are still evasive, and yet
knowledge of these species is fundamental to understanding the mechanistic breakdown of these

79
pipes. Chorine speciation depends on the pH, which directly affects the degree of polymer
oxidation. For typical drinking waters in the US, where the pH of water is near 7.0, HOCl is the
dominant species. Besides the chlorine radical itself, evidence has been reported that indicates
reactive oxygen species are present in chlorinated aqueous solutions.11 Molecular oxygen has
been linked to the degradation of other polyethylenes and may be a contributing factor. Bradley
reported that chlorinated water oxidation is not a function of direct interactions between the
polymer and chlorine, rather the presence of HOCl results in the formation of activated oxygen,
which is responsible for polyalkene pipe degradation (Scheme 3-1).7
The research goal was to identify the species and mechanism(s) behind the oxidative breakdown
of HDPE under accelerated aging conditions that more closely resemble conditions of potable
drinking water. Our specific objectives were to: (1) differentiate between oxidation of HDPE
pipe (containing additives) and anti-oxidant (AO) free HDPE resin (2) decipher the source of
oxygen leading to the carbonyl peak and deduce any additional HDPE degradation products and
(3) provide a mechanism for HDPE degradation.
3.2 Experimental Methods
3.2.1 Materials and Polymer Preparation.
AO free HDPE resin, CPChem HDPE, was obtained from Chevron-Phillips with a reported
density of 0.955 g/cm3, Mw= 317.48 kg/mol, and Mn= 9.37 kg/mol. AO free HDPE resin was
obtained as a powder and melt pressed under argon into 0.58 mm sheets (5.0 cm x 5.0 cm) at
Scheme 3-1: HOCl degradation to HCl and O2

80
135°C for approximately 3 minutes. HDPE potable water pipe 19 mm in diameter, standard
inner diameter dimension ratio of 9 mm, and reported density of 0.954 g/cm3 was commercially
obtained. Dog-bone shaped samples were cut from both the HDPE pipe and AO free AO free
HDPE resin using a microtensile die Dewes Gumbs Die Company, Inc. (Long Island City, NY).
All samples were then thrice rinsed in distilled water and were dried at room temperature for 48
h. All samples were 2.0 cm in length; AO free HDPE resin samples had a thickness of 0.58 mm
and HDPE pipe samples had a thickness of 2.6 mm.
3.2.2 Water Quality Measurements and Accelerated Aging Methods.
Aging solutions were prepared with reagent water from a Barnstead (Dubuque, IA)
Nanopure® ultrapure water system, 6.5% sodium hypochlorite, and sodium bicarbonate. Water
pH was adjusted with hydrochloric acid, and pH was measured using a bench-top Accumet™ pH
Meter 910 with probe. Alkalinity was measured by titration with 0.025 N sulfuric acid to an end-
point pH of 4.5 in accordance with Standard Method 2320(B).12 Free chlorine concentration was
measured by titrating test solutions with added potassium iodide and glacial acetic acid using
0.025 N sodium thiosulfate according to Standard Method 4500-Cl(B).12
Fifty die-cut dog-bone shaped AO free HDPE resin or HDPE pipe samples were placed
in separate 500 mL glass bottles with polypropylene caps. 500 mL aqueous solution of two
chlorine concentrations were used for each set of samples: for HDPE pipe, 500 mg/L and 50
mg/L aqueous chlorine concentrations were used; for AO free HDPE resin, 250 mg/L and 50
mg/L aqueous chlorine concentrations were used. All solutions initially contained 50 mg/L
alkalinity (added as sodium bicarbonate) at pH 6.5 and the aging solution was changed every 3
days. At each 3 day time point, water pH, free available chlorine, and alkalinity were measured
and samples were rinsed thrice with reagent water before being placed in new aging solutions. A
81
smaller scale experiment was also employed for each set of samples at each chlorine
concentration. This involved taking individual samples, which were initially assessed by Fourier
Transform – Infrared (FT-IR) for any signs of oxidation prior to accelerated aging- and housing
them in smaller, individual glass volatile organic analyses (VOA) vials with approximately 10
mL of the appropriate aqueous solution. These samples were then re-assessed by FT-IR
spectroscopy and visual observation analyses in an effort to detect signs of oxidation/aging. The
aging experiments were stopped at 190 days (4560 hs) for the HDPE pipe samples and 160 days
(3840 hs) for AO free HDPE resin samples. All experiments were conducted in the dark with no
agitation to the system at a constant temperature of 37°C.
Additionally, controls to assess the role of the polymer in the aging solution were
conducted using 50 mg/L, 250 mg/L and 500 mg/L aqueous chlorine solutions devoid of HDPE
samples. Water was evaluated for changes in pH, alkalinity and chlorine concentration as
previously described.
3.2.3 Polymer Characterization
Application of Characterization Techniques.
HDPE pipe and AO free HDPE resin samples from each concentration were periodically
assessed for oxidative damage through visual assessment and FT-IR spectroscopy. HDPE pipe
data is reported for days 45, 90 and 160. AO free HDPE resin data is reported for days 21, 90
and 160.
Surface Characteristics.
Surface chemistry was characterized using a Perkin Elmer Spectrum One Fourier
Transform Infrared spectrometer (Waltham, MA) in Attenuated Transform Reflectance (ATR)
mode with a ZnSe crystal at 4 cm-1 resolution. Background was determined using 100 scans from

82
3500 to 600 cm-1, and 25 scans were conducted for each sample also over this range. Select bond
indices were calculated based on IR data (relative to C—H bend frequency at 1462 cm-1). These
include: carbonyl (σ1715/ σ1462 and σ1742/ σ1462), vinyl (σ908/ σ1462), peroxide (σ1030/ σ1462), and
chlorine (σ660/ σ1462). The peak at 1462 cm-1 is used as a relative internal standard and assumes
that the amount of new bonds formed is small relative to the amount of unreacted C—H bonds.
Although this method does not provide an exact measure of new species formed, it does offer a
valid comparison for overall degradation over time. FT-IR spectra were taken at the surface of
each sample, probing approximately 2-3 microns into the polymer. Samples were also visually
assessed for changes in color.
3.2.3.1 Methylene Chloride Extractions
Liquid/Solid Extraction: Antioxidant Extraction and Aging In order to extract
additives from the HDPE pipe, a Kontes liquid/liquid, heavier than water micro scale apparatus
was used as a micro scale soxhlet extraction apparatus. Twelve samples of pipe were used for
each extraction and the weight was taken to the nearest 0.001 grams. A boiling chip and 75mL
of methylene chloride were placed in a 100 mL, 14/20 round bottom flask. Methylene chloride
was chosen as the solvent for the extraction, as it is able to dissolve many organic compounds
and can be refluxed at a low temperature (boiling point = 40°C) to reduce degradation of
extracted materials. The solvent/HDPE pipe system was refluxed for 12 h at 40°C. The extract
was then concentrated to 5 mL and kept for further evaluation. 50 samples of methylene chloride
extracted HDPE pipe and 50 samples of non-extracted HDPE pipe were separately aged in 500
mL of 250 mg/L aqueous solution previously described. Water was changed and monitored
every three days (Section 2.2).

83
Liquid/Liquid Extraction. Liquid/liquid extractions were performed on three sets of
HDPE aging solutions: AO free HDPE resin, HDPE pipe, and methylene chloride extracted
HDPE pipe.
190 mL of each aging solution (AO free HDPE resin, HDPE pipe and methylene chloride
extracted HDPE pipe) were treated with 20 mL of methylene chloride, mixed, and allowed to
separate. This was performed in triplicate for each sample and methylene chloride was then
concentrated using the method mentioned earlier.
Liquid/liquid extractions were performed at Day 3, 9, 12, 15 and 18 for HDPE pipe and
methylene chloride extracted HDPE pipe aging solutions. Extractions were performed at Day 60
and 66 for AO free HDPE resin aging solutions.
Acetone Rinse. To ensure that antioxidants, antioxidant degradation products, and other
additives in HDPE pipe samples were not interfering with the monitoring of HDPE degradation,
HDPE pipe samples were rinsed with acetone prior to FT-IR calculation of bond indices.
3.2.4 Oxygen-18 labeled O2 Experiments.
Addition of 18O2 gas to Chlorinated Water Samples.
250 mg/L aqueous chlorine solutions were prepared as previously described. Each
experimental set-up consisted of one AO free HDPE resin dogbone sample and 10 mL 250 mg/L
aqueous chlorine solution in a high pressure vacuum tube. The HDPE-aqueous chlorine sample
underwent triplicate freeze- pump- thaw procedures on a high pressure vacuum line (in triplicate)
in order to remove any 16O2 from the water and atmosphere. 18O2 gas was first added to the
vacuum line (at 25 mT pressure), then transferred to the vacuum tube. Approximately 8 to 12
mL of 18O2 gas (0.33 to 0.50 mmol) was added to each sample (the calculated density of 18O2 is
1.47 g/L at 1 atm and 25°C).

84
Four AO free HDPE resin samples were individually contacted with 250 mg/L aqueous
chlorine. These samples were housed in the dark with no agitation to the system at a constant
temperature of 37°C for 3 weeks without water changing. One AO free HDPE resin sample was
kept at these conditions for three weeks, in which every three days the water was changed and
the above procedure was repeated. As a control, one AO free HDPE resin sample underwent the
same freeze, pump, thaw process, but was then exposed to an air environment. The control
sample was housed in the dark with no agitation to the system at a constant temperature of 37°C
for 3 weeks without water changing.
Addition of 18O2: Effect on Surface Characteristics.
Surface chemistry was characterized using a Perkin Elmer Spectrum One Fourier
Transform Infrared as previously described. Select bond indices were calculated based on IR
data. Functional groups detected include: 16O carbonyl (σ1742 and 1715 / σ1462), 18O carbonyl (σ1648/
σ1462), vinyl (σ908/ σ1462), 16O peroxide (σ1115/ σ1462),
18O peroxide (σ1030/ σ1462), and chlorine
(σ660/ σ1462).
3.3 Results
3.3.1 Accelerated Aging: HDPE Pipe
Stability of Oxidant Solution During Aging. During the 190 day exposure period of
HDPE pipe samples with water changes every 72 h (3 days), free available chlorine levels for the
50 mg/L aqueous chlorine solution control and solutions containing HDPE pipe samples stayed
consistent, showing no measurable decrease in chlorine concentration, pH or alkalinity.
Conversely, the 500 mg/L aqueous chlorine solution showed consistent decreases in pH from pH
6.5 to about pH 6.0, decreases in alkalinity from 100 to 70 mg/L as sodium bicarbonate, and
decreases in chlorine concentration from 500 mg/L to 250-300 mg/L in the presence or absence

85
of HDPE pipe samples. All three of these parameters were found to be significantly different
(p<0.05) after the three day period. The changes in both 500 mg/L aqueous chlorine solutions are
attributed to the decomposition of HOCl as outlined in Scheme 1, and the presence of
bicarbonate to provide buffer capacity and resist pH change.
Pipe Surface Chemistry Oxidation During Aging.
HDPE pipe surface oxidation occurred under both aging conditions as indicated by IR
spectroscopy data from Day 0, 45, 90 and 160. Detectable changes in absorbance were found at
each exposure time and both aqueous chlorine concentrations. Primarily, a broad carbonyl band,
likely representing a compilation of both an aldehyde and ketone carbonyl species13 was detected
with a maxima at 1742 and 1715 cm-1 respectively, and gradually increased in intensity under
both aging conditions (Table 3-1).

86
Table 3-1. Relative intensities of carbonyl peaks in HDPE pipe
accelerated aging studies. % relative to C—H bend at 1462 cm-1.
50 mg/L Cl2
500 mg/L Cl2
Time
1715 cm-1 1742 cm-1 1715 cm-1 1742 cm-1 Day 0 0 0 0 0 Day 45 18.1 17.2 22.3 17.6 Day 90 22.3 13.8 23.0 16.0 Day 160 36.5 34.7 40.2 23.5
Despite a ten-fold difference in chlorine concentration, each samples from each time
interval showed similar carbonyl intensities. Another interesting phenomenon was seen at
around day 90, in both the 50 mg/L and 500 mg/L chlorine aging conditions. The intensities of
the carbonyl absorbances were greatly increased, and multiple new bands (3300, 1690, 1298,
1174, 1050 cm-1; Figure 3-1) appeared. However after each sample was washed with acetone,
only characteristic carbonyl bands (1742 and 1715 cm-1) remained. These absorbances are
believed to be due to degraded antioxidants that were present or migrated to the surface, and
which were removed with acetone. Many of the Irganox® antioxidants contain carbonyls which
may have contributed to the activity in the 1550 cm-1 to 1800 cm-1 region.
Figure 3-1. a) IR of HDPE pipe sample after 90 days (2160 h) of accelerated aging at 500 mg/L
Cl2. Multiple bands are present (3300, 1690, 1298,1742, 1715, 1174, 1050 cm-1). b) IR of
sample after 2 minute wash with acetone.

87
3.3.2 Accelerated Aging: AO free HDPE resin
Stability of Oxidant Solution During Aging. During the 160 day exposure period with
water changes every 72 h (3 days), free available chlorine levels for the 50 mg/L aqueous
chlorine solutions (control and solution containing AO free HDPE resin samples) stayed fairly
a
b

88
consistent, showing no measurable decrease in chlorine concentration or alkalinity, however pH
did show a significant increase from 6.5 to about 6.9 (p<0.05). Conversely, the 250 mg/L
aqueous chlorine solutions (control and solution containing AO free HDPE resin samples)
exhibited no change in pH, yet did show a decreases in alkalinity from 100 to 80-90 mg/L as
sodium bicarbonate, and slight decreases in chlorine concentration from 250 mg/L to 200-250
mg/L, both of which were determined to be statistically significant (p<0.05).
Resin Oxidation During Aging.
Both 50 and 250 mg/L aqueous chlorine conditions resulted in AO free HDPE resin
surface oxidation (Table 3-2). Detectable changes in absorbance were found for at each
exposure time. Primarily, a broad carbonyl band, likely representing a compilation of both an
aldehyde and ketone carbonyl species was detected at 1742 and 1715 cm-1 respectively and
gradually increased in intensity for both aging conditions. Again, in spite of significant
differences in aqueous chlorine concentration, each time point sample showed very similar
carbonyl intensities. No bands that had been detected and attributed to antioxidant
decomposition in HDPE pipe samples were present at any time point during the AO free HDPE
resin aging.
Table 3-2. Relative intensities of carbonyl peaks in AO free HDPE
resin accelerated aging studies. Numbers reported as a percent of
1462 cm-1 peak (C—H stretch).
50 mg/L Cl2
250 mg/L Cl2
Time
1715 cm-1 1742 cm-1 1715 cm-1 1742 cm-1 Day 0 0 0 0 0 Day 21 0 10.1 0 18 Day 90 6.0 8.0 12.0 9.4 Day 160 36.6 34.7 24.2 18.7

89
3.3.3 Accelerated Aging: 18O2 gas
Aged samples exposed to 18O2 gas showed the presence of two carbonyl peaks,: one at
1715 cm-1, which would be expected for a typical saturated ketone containing molecular oxygen,
and another peak at 1648 cm-1, which is believed to be the result of a carbonyl with 18O
incorporation (Figures 3-2).
Figure 3-2. a) IR of AO free HDPE resin sample after 21 days (504 h) of accelerated aging at
250 mg/L aqueous chlorine in the presence of 18O2. C16O stretch (ketone): 1715 cm-1 ; C18O
stretch (ketone): 1648 cm-1; Relative intensities (measured to C—H bend at 1462 cm-1): 9.1%
(1742cm-1) and 7.5% (1648 cm-1) b) Comparison of an 18O2 treated HDPE sample (black, 21
days) with normal aging sample (blue, 42 days).
a

90
The shift in carbonyl intensity can be estimated using a variation of Hooke’s law. Using
this approximation, the bond is thought of as two masses (the atoms) joined by a spring (the
bond). The bond between the two atoms is capable of oscillation; the frequency of this
oscillation is related to the force constant of the bond, as well as the masses of both atoms:
(3-1)
In this approximation, Mx is the molecular weight of carbon, My is the molecular weight of
oxygen, f is the force constant of the bond, and c is the speed of light. To determine the shift, the
equation was back calculated using the value of v= 1715 cm-1 for the carbonyl bond containing
molecular oxygen to obtain the value of f. The derived result predicts a carbonyl shift at 1668
cm-1. This shift to a lower frequency would be expected with an atom of higher atomic weight
(18O as opposed to 16O), since the frequency is inversely proportional to the molecular weight of
an atom for a given force constant. The calculated value for the shift is slightly higher than the
measured value (1648 cm-1). However it should be noted that this is a mathematical
b

91
approximation, and some degree of variance is to be expected. The shift in carbonyl peak
appeared in all resin samples exposed to the 18O2 environment, and was absent in all resin
samples not exposed to 18O2.
Nucleophilic Substitution Reaction To assess the other source of carbonyl oxygen from
the 18O2 studies, samples containing both peaks (1715 cm-1 and 1648 cm-1) were immersed in a
slightly acidic aqueous solution to determine whether nucleophilic substitution was occurring,
leading to an exchange of oxygen. Nanopure® water solutions were adjusted to a pH of 6.5 with
sodium bicarbonate and hydrochloric acid. Samples were housed individually in 10 mL of water
at 37°C.
(3-2)
After three weeks of being immersed in the water system, a noticeable shift took place in
the relative intensities of each carbonyl peak (Figure 3-3). The 1742 cm-1 band increased, with a
simultaneous decrease in the intensity of the 1648 cm-1 peak.
Figure 3-3. a) AO free HDPE resin sample with both 16O (1742 cm-1) and 18O (1648 cm-1)
carbonyl bands present. Relative intensities (measured to C—H bend at 1462 cm-1): 9.1%
(1742cm-1) and 7.5% (1648 cm-1). b) Sample after 3 week immersion in slightly acidic aqueous
solution (pH= 6.5). Relative intensities (measured to 1462 cm-1): 18.3% (1742 cm-1) and 6.0%
(1648 cm-1).

92
1742
1648
1742
1648
b
a

93
3.3.4 Liquid/Liquid Extraction
Extracted and Non-Extracted HDPE Pipe GC/MS data was analyzed by dividing the
peak area of interest by the peak area of the internal standard with the closest retention time.
Two unexpected compounds were found, 3-chloro-1,1-di-methylpropanol (DMCP) and 2,3-
dichloro-2-methylbutane (DCMB) (Figure 3-4). Both compounds were identified through
library search matches of the mass spectra; while authentic samples were not available for
comparison, each compound from the liquid/liquid extraction showed a 90% or greater
correlation to the library match spectra.
Figure 3-4: Compounds obtained from liquid/liquid extraction of HDPE pipe
Figure 3-5 shows a summary of the production of these compounds over time. As it can be seen
in these figures, both extracted and new pipe showed an increase in each of the chlorinated
product over time. The extracted pipe showed slightly less of these products at later time points
than new pipe, perhaps due to the removal of small alkane chains during the extraction process.

94
Figure 3-5. Graphs showing the relative abundance of a) DCMB and b) DMCP from new and
extracted HDPE pipes.
a

95
AO free HDPE resin To better ascertain if the two isolated products (DCMP and
DCMB) were derived from an antioxidant or the HDPE polymer, a liquid/liquid extraction was
performed on Day 60 and Day 66 water solutions of the AO free HDPE resin aging experiment.
Both products obtained from the liquid/liquid extraction of the HDPE pipe were also obtained
from the AO free HDPE resin water extraction. The amount of product was related to the
amount of chlorine present in the aging solution, with about 3 to 4 times more products obtained
from the 250 mg/L chlorinated water than the 50 mg/L chlorinated solution.
Competition Experiments Several researchers have indicated that a variety of radicals,
including the hydroxyl radical (HO•), chlorine radical (Cl•), O2 and the hypochlorite radical
(ClO•) may be present in chlorinated aqueous solutions,1, 4, 10, 11 however the chemical
b

96
contributions of these radicals are not expected to be the same. To identify the potential
hydrogen atom abstraction that initiates HDPE degradation, competition experiments were
conducted using 2,3-dimethylbutane as the source for primary and tertiary hydrogens, and
cyclohexane as the source for secondary hydrogens. While extremely reactive radicals, such as
the hydroxyl radical (HO•) or the chlorine radical (Cl•) would be expected to show little to no
selectivity, less reactive radicals (i.e. the peroxyl radical HOO•, hypochlorite radical ClO•, or
singlet O2)14-16 would favor abstraction of tertiary hydrogen, with lesser reactivity towards
secondary and primary hydrogen. Equimolar amounts (92 mmol) of each substrate were added
to 1 L of 250 mg/L aqueous chlorine and mixed in the dark for 6 h at room temperature.
Relative amounts of the chlorinated products were used to determine relative reactivities of the
hydrogen. The relative amounts of product were determined using GC/MS analysis, as discussed
in Chapter 2. 2-chloro-2,3-dimethylbutane and 1-chloro-2,3-dimethylbutane had previously been
synthesized and characterized by the group with correction factors (F) determined to be 0.974
for each product. Chlorocyclohexane was commercially available, with a correction factor
determined to be 0.953 (Figure 3-6)
Figure 3-6. Products and GC correction factors for small molecule chlorination study.
The derived relative reactivities were, 3o (4.5) > 2o (2) > 1o (1.0). These results closely match
the reactivities expected from the chlorine radical. However, this is a rather crude estimate, as
97
we would expect the formation of far more products that simply the chlorinated species.
Clearly, the non-selective behavior indicates a highly reactive specie (or species) involved in the
first step of hydrogen atom abstraction.
3.4 Discussion
Several key findings can be noted from this work. One interesting note can be made about the
amount of chlorine in the accelerated aging study and the subsequent polymer degradation.
While HDPE pipe and AO free HDPE resin samples show an increase in carbonyl intensity over
time, there are not significant differences at any given point between aqueous chlorine
concentrations. As seen in Figure 3-7, the carbonyl bands from the HDPE pipe day 90 samples
overlap nearly perfectly. Despite the distinct loss of chlorine in the 500 mg/L aqueous chlorine
solution, carbonyl formation remains similar to the 50 mg/L Cl2 solution samples.

98
Figure 3-7. Overlap of day 90 HDPE pipe carbonyl peaks (blue= 500 mg/L Cl2 aging
conditions; red= 50 mg/L Cl2 aging conditions.
This chlorine decrease is also seen when no polymer samples are present, indicating that the loss
of chlorine is not due to interaction with the HDPE pipe or antioxidants.
This of course raises the question of what is causing this chlorine depletion, and if/how
this phenomenon affects the degradation of the polymer. The likely reason for the chlorine loss is
degradation into hydrochloric acid and oxygen gas.7 18O2 studies play a significant role in
helping to determine where this carbonyl oxygen is coming from; In the AO free HDPE resin
sample, the presence of 18O2 causes both the appearance of a new carbonyl peak; however the
analogous peak that corresponds to 16O is still present. Several different hypotheses could be
used to explain this: 1) not all molecular oxygen was removed, or molecular oxygen seeped in

99
through a leak in the vacuum system, 2) molecular oxygen from water and/or hypochlorous acid
is involved in this process, or 3) molecular oxygen is produced through another means, namely
HOCl decomposition.7 Changes in aqueous chlorine concentration and alkalinity indicate that
perhaps some molecular oxygen is produced (Scheme 3-1), which may react directly with the
polymer in an auto-oxidative process. However, this instance would have to be relatively minor;
the amount of molecular oxygen produced due to the decomposition of HOCL would be
significantly less than the amount of 18O2 added- at most only about one third (or 0.15 mmol
based on loss of free available chlorine).
Nucleophilic substitution reactions indicate that substitution of the carbonyl 18O is
certainly a plausible explanation for the continued presence of a 1715 cm-1 peak. This is not
surprising given the slightly acidic environment and relative amounts of 18O and 16O atoms
present in the aging conditions. At a maximum, 0.50 mmol of 18O2 was added to a sample-
corresponding to approximately 6.1 x 10²⁰ atoms of 18O, or 3.05 x 10²⁰ molecules of 18O2 capable
of interacting with the polymer. Conversely, there are approximately 3.23 x 10²³ atoms of 16O
present - a 1000-fold excess compared to 18O. The large amount of 16O present would make it
quite probable that some molecular oxygen be incorporated into the polymer, most likely via
both of the aforementioned processes.
All experimental results obtained in this study clearly indicate that O2 is directly involved
in the oxidation of HDPE. From the data obtained we propose the following mechanism for
degradation as highlighted in Scheme 3-2: hydrogen atom abstraction by a highly reactive
radical (eg Cl• or HO•) occurs from the alkane chain, producing a carbon centered radical, that
reacts with aqueous triplet oxygen. This produces a peroxyl on the polyalkane chain. Several
possibilities exist for peroxyl decomposition: 1) beta-cleavage to form an aldehyde or ketone,

100
and a subsequent hydroxyl radical 2) a similar beta-cleavage aided by another radical in the
system18 or 3) breaking of the weak oxygen-oxygen bond leading to a carbon centered radical
and hydroxyl radical. It is believed that all of these mechanisms play a role in ketone/aldehyde
formation on the polyalkane chain.
Scheme 3-2: Mechanisms of HDPE Autooxidation. Several mechanisms are believed to
contribute to the formation of carbonyls: 1) beta-cleavage of the peroxyl 2) beta-cleavage aided
by another radical in the system 3) breaking of the weak oxygen-oxygen bond leading to the
additional formation of a carbon centered radical. The initiating radical (·X) may be one of
several different species.

101
Similar autooxidative processes have been seen in macromolecules such as DNA, proteins and
lipids.18-22 While singlet oxygen is far less reactive (in terms of hydrogen atom abstraction) than
HO• and Cl•, its involvement in reproducing such highly reactive radicals makes it a major
contributor to polymer degradation.
Finally, we detect the presence of two novel HDPE degradation products via liquid/liquid
extraction with water solutions, 3-chloro-1,1-di-methylpropanol and 2,3-dichloro-2-
methylbutane. AO free HDPE resin- containing no antioxidants- showed the formation of both
products after exposure to chlorinated water, indicating formation via decomposition of the
polymer as opposed to an antioxidant. Non-extracted and methylene chloride extracted HDPE
pipe samples also showed formation of these products when exposed to chlorinated water. Of
interest to note, is that upon continued exposure to chlorinated water, new HDPE pipe samples
actually showed greater formation of these products compared to samples from which
antioxidants were extracted. This suggests that antioxidants may not provide significant defense
against the reactive radicals involved in DCMB and DMCP formation.
The mechanism of formation of these products is believed to be directly linked to the auto-
oxidation process previously described (Scheme 3-2). Again, it is the formation of low
molecular weight alkanes that contribute to the production of the two chlorinated species
(Scheme 3-3).

102
Scheme 3-3: Possible mechanism of formation of DCMB and DMCP during auto-oxidation.
R
XR
H+XH
R
HO O R
OO
HH
R
O
OH
H
O
R
HCl
OH+HCl
Cl
Cl
+HCl
Cl
Cl
Cl Cl
Cl ClCl
H3O ClHO
While DCMB has not been thoroughly investigated for toxicological effects, DMCP is
known to be only slightly toxic by ingestion, with an LD 50 in rats of 110 mg/kg (oral exposure),
which is approximately two thirds of the LD 50 for caffeine (192 mg/kg, oral exposure). While
the toxicological effects of these byproducts appear to be minimal, their influence on taste or
odor properties of water may be more substantial.

103
3.5 Conclusions
Carbonyl formation is the first observable step in HDPE degradation. Using AO free
HDPE resin devoid of antioxidants demonstrates that 1) the carbonyl functionality is the first
visible sign (via IR) of degradation and 2) the presence of this species is the direct result of
oxidation to the polymer, and not a decomposed antioxidant. The oxygen found in the carbonyl
is the result of autooxidation to the polymer; While it is likely that there is some nucleophilic
exchange with the aqueous environment, this only occurs after the initial oxidative process
outlined in Scheme 3-2.
Of interest to note is the lack of a detectable carbon chlorine bond present on the
polymer. While there is more than a ten-fold excess of chlorine (250 mg/L aqueous chlorine =
3.5 mmol) in the systems as compared to dissolved oxygen (which, at 37°C is approximately 0.2
mmol),23 no C-Cl bond is detected by IR. This is believed to be due primarily to the fact that a
C-Cl bond is simply more difficult to detect via IR- not that such a bond is absent. It’s clearly
known through the identification of other HDPE degradation products that Cl• can and does
interact with the alkane. Although not detectable, it is believed that chlorine does add to the
carbon centered radicals of the polymer in a similar fashion as the low molecular weight alkanes
shown in Scheme 3-3.
While visual characteristics of HDPE pipe are different between a 50 mg/L and 500 mg/L
Cl2 accelerated aging study, formation of the carbonyl moiety is unaffected by chlorine
concentration. AO free HDPE resin shows similar results, indicating the formation of the
carbonyl band is decidedly due to polymer oxidation, and is not an artifact of antioxidant
decomposition. Only a small amount of aqueous chlorine is necessary to initiate the ensuing
chain reaction, capable of producing more radicals that can react with the polymer surface.

104
We have also discovered two novel HDPE degradation products, 3-chloro-1,1-di-
methylpropanol and 2,3-dichloro-2-methylbutane. Concentration of these products is both
related to chlorine concentration of the aqueous solution. These products are believed to be
formed from the reaction of smaller alkyl chains with chlorine and other reactive species in the
water. Production of these compounds may serve as another means of monitoring HDPE
polymer degradation in accelerated aging studies.
Supporting Information. Representative IR spectra of aged HDPE pipe and AO free HDPE
resin samples are available online and in Appendix B of this dissertation.
Acknowledgements
We gratefully acknowledge funding provided by the AWWA Research Foundation and
USA National Science Foundation (Awards CBET-0755342 and DGE-0333378). Opinions,
findings, conclusions, and recommendations expressed in this material are those of the authors
and do not necessarily reflect the views of either funding agencies. We also thank the following
people at Virginia Tech for their assistance and insights: Dr. Garth L. Wilkes, Dr. Timothy Long,
Dr. Herve’ Marand, Dr. Robert Moore, Dr. Andrew Whelton, Dr. James McGrath, as well as
Jody Smiley, Geno Appodoca, Claudia Brodkin, and Victoria Long.

105
References
1. Whelton, A. J.; Dietrich, A., Critical considerations for the accelerated aging of high-
density polyethylene potable water systems. Polymer Stability and Degradation 2009, 94,
1163-1175.
2. Krishnaswamy, R. K., Analysis of ductile and brittle failures from creep rupture testing
of high-density polyethylene (HDPE) pipes. Polymer 2005, 46, 11664-11672.
3. Nishimura, H., Maeba, H. In Proceedings of the 10th international plastics pipes
conference, Gotenbur, Sweden, 1998; Gotenbur, Sweden, 1998.
4. Hassinen, J.; Lundback, M.; Ifwarson, M.; Gedde, U. W., Deterioration of polyethylene
pipes exposed to chlorinated water. Polymer Degradation and Stability 2004, 84, 261-
267.
5. Viebke, J.; Hedenqvist, M.; Gedde, U. W., Anti-oxidant efficiency and loss by
precipitation and diffussion to surrounding media in polyethylene hot-water pipes.
Polymer Engineering and Science 1996, 36, (24), 2894-2904.
6. Dear, J. P.; Mason, N. S., The Effects of Chlorine Depletion of Antioxidants in
Polyethylene. Polymers and Polymer Composites 2001, 9, (1), 1-13.
7. Gill, T. S.; Knapp, R. J.; Bradley, S. W.; Bradley, W. L., Long term durability of
crosslinked polyethylene tubing used in chlorinated hot water systems. Plastics, Rubber
and Composites 1999, 28, (6), 309-313.
8. Karlsson, K.; Eriksson, P.; Hedenqvist, M.; Ifwarson, M.; Smith, G.; Gedde, U. W.,
Molecular structure, morphology and antioxidant consumption in poly-butene-1 pipes in
hot water applications. Polymer Engineering and Science 1993, 33, (5), 303-310.

106
9. Viebke, J.; Gedde, U. W., Anti-oxidant diffussion in polyethylene hot water pipes.
Polymer Engineering and Science 1997, 37, (5), 896-911.
10. Colin, X.; Audoin, L.; Verdu, J.; Rozental-Evesque, M.; Rabaud, B.; Martin, F.;
Bourgine, F., Aging of Polyethylene Pipes Transporting Drinking Water Disinfected by
Chlorine Dioxide. Part II- Lifetime Prediction. Polymer Engineering and Science 2009,
49, 1642-1652.
11. Utsumi, H.; Hakoda, M.; Shimbara, S.; Nagaoka, H.; Chung, Y.; Hamada, A., Active
Oxygen Species Generated During Chlorination and Ozonation. Water Science and
Technology 1995, 30, (9), 91-99.
12. American Public Health Association (APHA), A. W. W. A. A., Water Environment
Federation (WEF). , Standard Methods for the Examination of Water and Wastewater,
22nd ed. . In 2000.
13. . Silverstein RM, W. F., Kiemle D. , Spectrometric Identification of Organic Compounds.
. John Wiley and Sons, Inc. : New York, NY, 2005.
14. Neta, P.; Mosseri, S.; Alfassi, Z. B., Reactivities of Chlorine Atoms and Peroxyl Radicals
Formed in the Radiolysis of Dichloromethane. J. Phys. Chem 1988, 93, 1380-1385.
15. Jovanovic, S. V. J., I.; Josimovic, L. , J. Am. Chem. Soc. 1992, 114, 9018-9021.
16. Monroe, B. M., J. Phys. Chem 1977, 81, 1861-1864.
17. Smith, G.; Karlsson, K.; Gedde, U. W., Modeling of anti-oxidant loss from polyolefins in
hot water applications. I: model and application of medium-density polyenthylene pipes.
Polymer Engineering and Science 1992, 32, (10), 658-667.
18. Frenette, M.; Scaiano, J., Evidence for Hydroxyl Radical Generation During Lipid
(Linoleate) Peroxidation. J. Am. Chem. Soc. 2008, 130, 9634-9635.

107
19. Davies, M. J., Protein and Peptide Alkoxyl Radicals Can Give Rise to C-Terminal
Decarboxylation and Backbone Cleavage. Archives of Biochemistry and Biophysics 1996,
336, (1), 163-172.
20. Headlam, H. A.; Davies, M. J., Beta-Scission of Side-Chain Alkoxyl Radicals on
Peptides and Proteins Results in the loss of Side-Chains as Aldehydes and Ketones. Free
Radical Biology and Medicine 2002, 32, (11), 1171-1184.
21. Aust, A.; Eveleigh, J., Mechanisms of DNA Oxidation. Pub. Soc. Exp. Bio. and Med.
1999, 222, 246-252.
22. DeFederics, H.-C.; Patrzye, M. J.; Rajecki, E. E.; Budzinski, H. I.; Dawidzik, J. B.;
Evans, M. S.; Grenne, K. F.; Box, H. C., Singlet Oxygen-Induced DNA Damage.
Radiation Research 2006, 165, 445-451.
23. Tromans, D., Modeling Oxygen Solubility in Water and Electrolyte Solutions. Ind. Eng.
Chem. Res. 2000, 39, 805-812.

108
Chapter 3 Addendum
Two novel HDPE degradation products, 3-chloro-1,1-di-methylpropanol and 2,3-dichloro-2-
methylbutane, were identified during accelerated aging studies with AO free HDPE resin. The proposed
mechanism of formation in Chapter 3 (Scheme 3-3) considers a branch point as a necessary component to
create these compounds. However subsequent investigation suggests that this branch point is not
necessary in the creation of either molecule.
Accelerated aging studies using an oligomer of polyethylene containing no tertiary hydrogen
(identified by 1HNMR: ∂0.92 (1H), ∂1.20 (8H)) were carried out in a 50 mg/L aqueous chlorine solution.
After 3 days, a methylene chloride liquid/liquid extraction confirmed the presence of both 3-chloro-1,1-
di-methylpropanol and 2,3-dichloro-2-methylbutane. Production of both compounds suggests that a
tertiary carbon need not be initially present in order to form the tertiary halide or tertiary alcohol.
While the exact mechanism of formation for these products is unknown, some key findings can
be reported from these studies:
1) GC/MS data strongly indicates the products to be a tertiary alcohol (m/z= 59 (100%)) and
tertiary chlorinated compound (m/z= 77 (100%); 79 (31%)). Thus while a tertiary carbon need not be
initially present for product formation, a tertiary structure is formed.
2) While products are consistently present in AO free HDPE resin and HDPE pipe aging
solutions, they are not present in control solutions including: AO free HDPE resin in 0mg/L Cl2 aqueous
solution, 50 mg/L Cl2 solution (no polymer), and CH2Cl2 blank
3) Authentic samples of 3-chloro-1,1-di-methylpropanol and 2,3-dichloro-2-methylbutane are
necessary to confirm identification of each product

109
Chapter 4 Summary and Future Work
4.1 Introduction
Radical chemistry is a foundational component of atmospheric, synthetic, polymer and
biological sciences. While much attention has been paid over the years to how radical reactions
occur, many anomalies have not been fully addressed. Factors such as solvent effect are proving
to have much more of an impact on radical chemistry than previously believed. Additionally, the
high reactivity and low selectivity of radicals can have severe undesired consequences. Both the
hydroxyl radical and the chlorine radical are known to be extremely reactive and unselective
species. This aggressive behavior often has particularly damaging effects, making it important
to understand- and when possible, protect against- undesired aspects of their reactivity. If a
“slowing down” of their reactivity could be achieved, radical trapping (via anti-oxidants) might
pose as a reasonable protection strategy against oxidation.
This preceding research aims to address such questions in order to get a better
understanding of how radicals react. Through direct examination of radical reactions, as well as
radical effects on a polymer, we can further recognize the processes taking place.
4.2 Solvent Effect and Polarized Transition state
One of the most significant contributions to solvent effects on radical chemistry was
established by Russell,1 who found that in the presence of an aromatic solvent, the photo-
initiated chlorination of 2,3-dimethylbutane yielded far different results than the same reaction in
an aliphatic solvent. The chlorine radical shows a marked increase in selectivity when reacting
with 2,3-dimethylbutane, in an aromatic solvent, with yields of the 2-isomer reaching up to 95%
:

110
Simply changing the solvent system from cyclohexane to benzene increases the yield of the 2-
isomer by nearly a factor of two under analogous conditions, and even further selectivity can be
obtained with increasing concentration of aromatic solvent (Table 1):
Table 4-1. Percent yield of 2-chloro-2,3-dimethylbutane
Solvent (55°C)
% Yield
Cyclohexane (4.0 M) 37.5
Benzene (4.0 M) 70.9
Benzene (8.0 M) 84.2
Russell explains this increased selectivity on the basis of a π-complex that is formed between the
free chlorine radical and the π electrons of the aromatic solvent. This complexed radical is less
reactive than the free chlorine radical, and therefore exhibits greater selectivity.
The question of what causes this increased stability can be found by looking at the nature
of the free chlorine radical. Chlorine is an extremely electrophilic radical. Any electron
contribution that the radical can receive from a solvent will provide a degree of stabilization, thus
increasing its selectivity (Figure 4-1):
Figure 4-1. π- complex stabilization of chlorine radical

111
Electrophilic radicals, such as the chlorine radical or bromine radical, are also known to develop
a negative charge in their transition state during hydrogen atom abstraction reactions. Similarly,
the hydroxyl radical, which is also electron deficient, develops a charged transition state relative
to reactants and products. The charge build-up makes solvent a contributing factor to the rate of
the reaction; Similar to how the chlorine radical (reactant) is stabilized by an aromatic solvent,
the transition state- which is polarized- can be stabilized by its environment.
The notion of a polarized transition state is not limited to radical addition or abstraction;
Analogous trends can also be seen in homolysis reactions when there is an electronegativity gap
between the dissociating atoms. Goldberg, et al. reported that during the dissociation of a H3C—
X bond (where X is an atom more electronegative than CH3), ionization occurs, in which there is
an initial charge build-up during which decreases to zero as products are formed.2 Looking at the
homolytic dissociation of the C—OH bond in methanol, the authors calculated an increase in
ionization up to 1.8 angstroms, at which point ionization begins to decrease eventually leading to
neutral products. Ab initio calculations showed a direct correlation between the maximum radius
for ionization and bond dissociation energy; As bond dissociation energy decreases, the
corrected maximum distance for ionization decreases linearly. These radical reactions illustrate
that the transition state, whether early or late, may have characteristics different from both
reactants and products (which remain neutral).2
4.3 Auto-oxidation and Chain Reactions.
The hydroxyl and chlorine radicals are extremely destructive radicals. Additionally, both
have been known to be involved in chain reactions in which the reactive species is reproduced.
Examples of both auto-oxidation and a chain reaction in which the radicals are reproduced are
demonstrated in the degradation of HDPE (Chapter 3, Scheme 3-2 and Scheme 3-3).

112
Many polyethylenes are known to be susceptible to auto-oxidation. Evidence suggests
that low density polyethylene will degrade in an auto-oxidative fashion when exposed to UV
radiation.3 Even cyclohexane, a small molecule of polyethylene, reacts with oxygen to undergo
an auto-oxidative process.4 In fact, auto-oxidation has been linked to the degradation of many
macromolecules. Almost all biological macromolecules are susceptible to oxidative processes
that create new radicals. Lipids, DNA (Chapter 4, Scheme 4-1) and proteins (Chapter 1, Scheme
1-7) all undergo similar auto-oxidative processes. It is the continuous generation of radicals that
contributes to the severity of oxidative disease and macromolecule deterioration.5-7 HDPE
studies show that an aqueous solution containing 50 mg/L Cl2 (9 mM) will start to oxidize HDPE
in simply a matter of weeks. Such powerful oxidants can have devastating effects in very small
doses due to their ability to propagate.
4.4 Selectivity
Clearly, both the hydroxyl and chlorine radicals are extremely aggressive. Their
electrophilic nature and lack of steric hindrance cause the species to exhibit nearly no selectivity.
For biomolecules such as DNA, the hydroxyl radical can extract a hydrogen from any of the five
carbons of the deoxyribose sugar, and will react immediately at the location where it is formed.8
This extreme reactivity leads not only to DNA breakdown, but the formation of additional
radicals:

113
Scheme 4-1: Hydroxyl induced DNA oxidation. Hydroxyl attack on the C-5 carbon of the
dexoyribose sugar leads to strand breakage and the formation of an aldehyde. The hydroxyl
radical is reproduced in a chain reaction under aerobic conditions.
N
NN
N
NH2
O
HO
HHHH
PO
O-
O
O-
OH
HO
H
P O
O
O
H
H
N
NN
N
NH2
O
HO
HHHH
PO
O-
O
O-
P O
O
O
H
O O
N
NN
N
NH2
O
HO
HHHH
PO
O-
O
O-
P O
O
O
H
O
O
RH
N
NN
N
NH2
O
HO
HHHH
PO
O-
O
O-
P O
O
O
H
O
HO R
N
NN
N
NH2
O
HO
HHHH
PO
O-
O
O-
P O
O
O
O
H
OH
A similar lack of selectivity is seen in hyaluronan. The biomolecules, that are found in the
synovial fluid of the joints, are also susceptible to non-selective hydroxyl radical attack.9, 10
Again, under aerobic conditions the polymer degrades in an auto-oxidative type fashion,
reproducing the hydroxyl radical in a chain mechanism.
The chlorine radical’s reactivity is also known to be instantaneous, with relative rates for
hydrogen abstraction of 3.5 to 1 for tertiary and primary hydrogens and reaction rate constants at
near the diffussion-controlled limit.11 As such, both of these radicals have the ability to be

114
extremely destructive. The lack of selectivity exhibited by these radicals makes trapping nearly
impossible. In order to make any kind of anti-oxidant defense useful, a degree of selectivity
must be obtained.
The results of Russell, as well as the results from this work, indicate that obtaining a
certain degree of selectivity might be possible, even for these extremely reactive radicals.
If radicals can be trapped, the results would be quite significant; In addition to reducing the
immediate damage from the radical, the continuous production of these species would be
eliminated.
4.5 Future Work
4.5.1 Oxygen Centered Radicals
While it is likely that the transition state polarization exhibited by the hydroxyl radical
would be a characteristic of all hydrogen atom abstraction reactions from alkoxyl radicals, the
extent to which this would occur may differ. Whether an alkyl group would affect the degree of
transition state polarization is unknown. With the exception of the tert-butoxyl radical, there is
very little kinetic data for the reactivity of alkoxyl radicals in solution. It’s also been recognized
that the tert-butoxyl radical behaves differently from other alkoxyl radicals; The large tert-butyl
group forces substantially increases the entropic factor of these reactions. Rather than hydrogen
cleavage based on enthalpic factors (bond dissociation energies), steric effects play a large role
in controlling relative reactivities of these radicals.12, 13 Smaller alkoxyl radicals (perhaps
methoxyl or ethoxyl) might also be subject to the same stabilization effects as the hydroxyl
experiences.
To assess the degree of polarization of alkoxyl radicals, as well as the relative entropic
effects, several other alkoxyl radicals need to be examined, both experimentally and

115
calculationally. The methoxyl, ethoxyl and isopropoxyl radicals will give insight into both the
degree of polarization across alkoxyl radicals during hydrogen abstraction reactions, as well as a
better understanding of how sterics effect the relative contributions of enthalpy and entropy in
these reactions.
Arrhenius studies to determine the activation energies of these reactions are also needed
to better qualitatively understand the degree of polarization in the transition state. It would be
expected that a hydrogen abstraction reaction in acetonitrile would have a larger activation
energy than the analogous reaction in water, in which the transition state is stabilized. The
degree of this stabilization can be better assessed through comparison of activation energies for
each reaction. Also, variable temperature experiments would enable us to test the hypothesis that
the tert-butoxyl radical is entropy controlled (this hypothesis, which was developed from
previous work in the Tanko lab, is based upon experiments conducted at room temperature). The
experimental evidence at room temperature indicates ∆H‡ < T∆S‡. Since most of the tert-butoxyl
radical is aliphatic bulk, it is thought that the transition state for H-atom abstraction is more
ordered. A smaller radical may have more flexibility in terms of trajectory attack, and thus a
lower ∆S‡
Finally, the issue of hydroxyl radical reactivity with various biomolecules should be
accessed directly. The fact that the hydroxyl radical proceeds through a polarized transition state
indicates that perhaps it is less reactive in hydrophobic regions of the body, in which there would
be no hydrogen bonding stabilization. This would suggest that anti-oxidant defense systems
might be better targeted towards these regions, as the radical might be easier to trap and not
continue with the auto-oxidative process. Directly monitoring a biomolecule in both an aqueous
116
and non-aqueous environment would be an excellent way to establish if- and how -this difference
in reactivity could be used to better halt the propagating radical chain.
4.5.2 High and Low Density Polyethylenes.
Oxygen is a main contributor to the oxidation of many macromolecules, including HDPE.
Though several of the species involved in the mechanistic breakdown of HDPE have been
determined and a mechanism has been proposed, other reactions also occur after the initial
oxidative process, leading to the presence of other functional groups such as vinylic, alcohol and
chlorine sites. These oxidative markers are more difficult to detect through IR spectroscopy; As
such, higher level techniques such as X-ray photoelectron spectroscopy (XPS), which can
provide a better assessment of polymer surface degradation, need to be utilized.
HDPE is not conducive to other spectroscopic techniques (NMR, EPR, etc.) due to its
extremely low solubility. To utilize these techniques, and better assess the complexity of the
auto-oxidative process, low density polyethylene studies need to be conducted under analogous
circumstances. Using a lower molecular weight polymer will allow the use of other techniques
to decipher the presentation of other functionalities that may not be detectable by IR
spectroscopy, and help elucidate functionalities that may be ambiguous.
117
References 1. Russell, G. A., J. Am. Chem. Soc. 1958, 80, 4987 - 4996.
2. Hoz, S.; Basch, H.; Goldberg, M., Charge oscillation in the homolysis of MeX
derivatives. J. Am. Chem. Soc. 1992, 114, (11), 4364-4366.
3. Utsumi, H.; Hakoda, M.; Shimbara, S.; Nagaoka, H.; Chung, Y.; Hamada, A., Active
Oxygen Species Generated During Chlorination and Ozonation. Water Science and
Technology 1995, 30, (9), 91-99.
4. Walling, C., Free Radicals in Solution. In Jon Wiley & Sons, Inc: New York, 1957.
5. Ihara, Y.; Chuda, M.; Kuoda, S.; Hayabara, T., Hydroxyl radical and superoxide
dismutase in blood of patients with Parkinson's disease: relationship to clinical data.
Journal of Neurological Sciences 1999, 170, 90-95.
6. Jenner, P., Oxidative Stress in Parkinson's Disease. Ann Neurol 2003, 53, (3), S26-S38.
7. Li, S. W.; Lin, T.-S.; Minteer, S.; Burke, W., 3,4-Dihydroxyphenylacetaldehyde and
hydrogen peroxide generate a hydroxyl radical: possible role in Parkinson's Disease
pathogenesis. Molecular Brain Research 2001, 93, 1-7.
8. Aust, A.; Eveleigh, J., Mechanisms of DNA Oxidation. Pub. Soc. Exp. Bio. and Med.
1999, 222, 246-252.
9. Kvam, B. J.; Fragonas, E.; Degrassi, A.; Kvam, C.; Matulova, M.; Pollesello, P.; Zanetti,
F.; Vittur, F., Oxygen-Derived Free Radical (ODFR) Action on Hyaluronan (HA), on
Two HA Ester Derivatives, and on the Metabolism of Articular Chondrocytes.
Experimental Cell Research 1995, 218, 79-86.

118
10. Soltes, L.; Mendichi, R.; Kogan, G.; Schiller, J.; Stankovska, M.; Arnhold, J.,
Degredative Action of Reactive Oxygen Species on Hyaluronan. Biomacrocolecules
2005, 7, (3), 659-668.
11. Russel, G. A.; Brown, H. C., The Liquid Phase Photochlorination and Sulfuryl Chloride
Chlorination of Branchedchain Hydrocarbons; the Effect of Structure on the Relative
Reactivities of Tertiary Hydrogen in Free Radical Chlorinations. J. Am. Chem. Soc. 1955,
77, (15), 4031-4035.
12. Finn, M.; Friedline, R.; Suleman, N. K.; Wohl, C.; Tanko, J. M., Chemistry of the t-
Butoxy Radical: Evidence that Most Hydrogen Abstraction from Carbon are Entropy-
Controlled. J. Am. Chem. Soc. 2004, 126, (24), 7578-7584.
13. Tanko, J. M.; Friedline, R.; Suleman, N. K.; Castagnoli Jr, N., tert-Butoxyl as a Model
for Radicals in Biological Systems: Caveat Emptor J. Am. Chem. Soc. 2001, 123, (24),
5808-5809.

119
Appendix A: Supporting Material for Chapter 2 How Solvent Modulates
Hydroxyl Radical Reactivity in Hydrogen Atom Abstractions
The following represents the supporting information for Chapter 2, and includes representative transient
traces for each substrate examined, kobs vs. concentration plots, the absolute energies and optimized
geometries of all calculated structures, and the complete Gaussian 03 citation.

120
Figure 2-7. Transient signal for the buildup of HO-TS• at 392 nm in the presence of 0.0105 M
tetramethylbutane in acetonitrile generated by laser flash photolysis of 0.65 mM PSH.

121
Figure 2-8. Transient signal for the buildup of HO-TS• at 392 nm in the presence of 0.015 M
hexane in acetonitrile generated by laser flash photolysis of 0.65 mM PSH.

122
Figure 2-9. Transient signal for the buildup of HO-TS• at 392 nm in the presence of 0.021 M
heptane in acetonitrile generated by laser flash photolysis of 0.65 mM PSH.

123
Figure 2-10. Transient signal for the buildup of HO-TS• at 392 nm in the presence of 0.100 M
methylcyclohexane in acetonitrile generated by laser flash photolysis of 0.65 mM PSH.

124
Figure 2-11. Transient signal for the buildup of HO-TS• at 392 nm in the presence of 0.030 M
cyclohexane in acetonitrile generated by laser flash photolysis of 0.65 mM PSH.
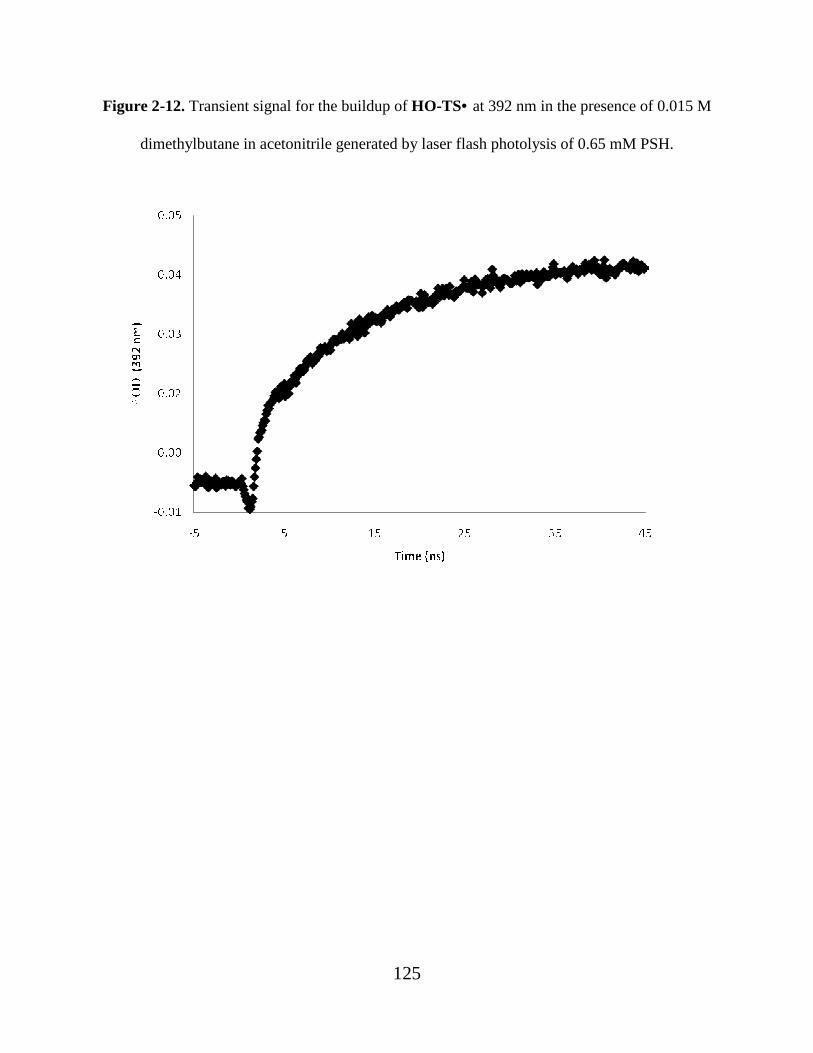
125
Figure 2-12. Transient signal for the buildup of HO-TS• at 392 nm in the presence of 0.015 M
dimethylbutane in acetonitrile generated by laser flash photolysis of 0.65 mM PSH.
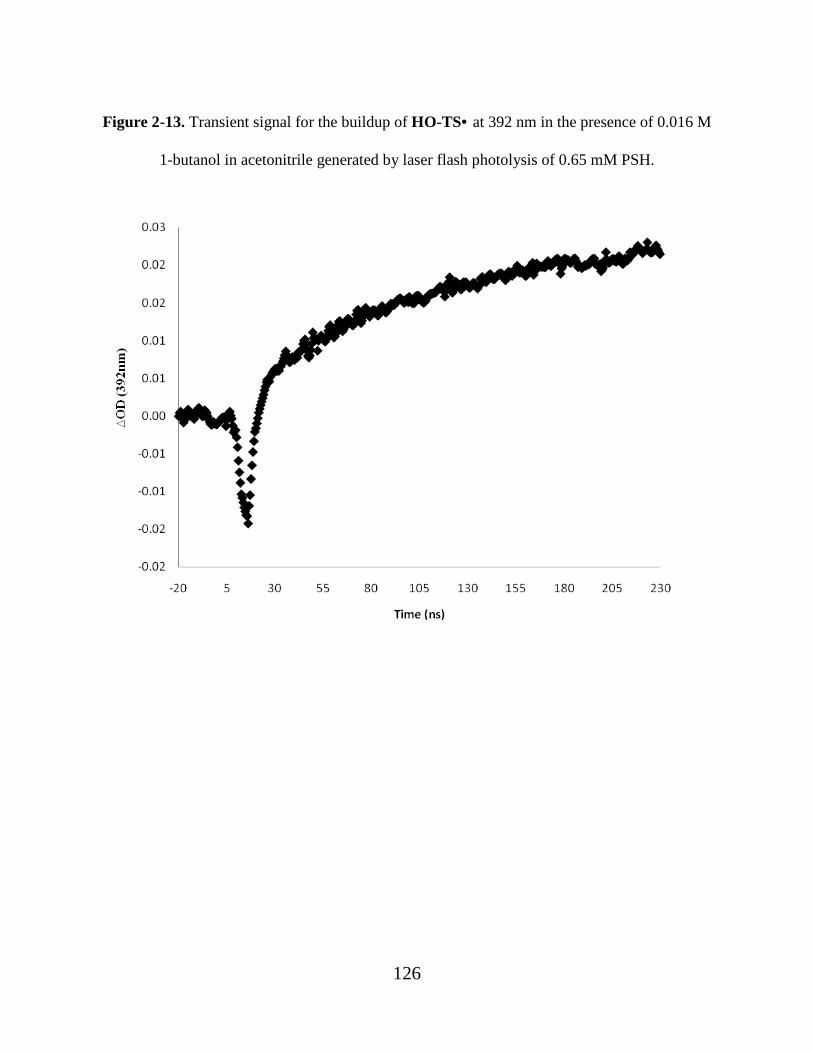
126
Figure 2-13. Transient signal for the buildup of HO-TS• at 392 nm in the presence of 0.016 M
1-butanol in acetonitrile generated by laser flash photolysis of 0.65 mM PSH.

127
Figure 2-14. Transient signal for the buildup of HO-TS• at 392 nm in the presence of 0.015 M
ethanol in acetonitrile generated by laser flash photolysis of 0.65 mM PSH.

128
Figure 2-15. Transient signal for the buildup of HO-TS• at 392 nm in the presence of 0.090 M
isopropanol in acetonitrile generated by laser flash photolysis of 0.65 mM PSH.

129
Figure 2-16. Transient signal for the buildup of HO-TS• at 392 nm in the presence of 0.070 M
methanol in acetonitrile generated by laser flash photolysis of 0.65 mM PSH.

130
Figure 2-17. Transient signal for the buildup of HO-TS• at 392 nm in the presence of 0.100 M
tert-butanol in acetonitrile generated by laser flash photolysis of 0.65 mM PSH.

131
Figure 2-18. Transient signal for the buildup of HO-TS• at 392 nm in the presence of 0.015 M
diethyl ether in acetonitrile generated by laser flash photolysis of 0.65 mM PSH.

132
Figure 2-19. Transient signal for the buildup of HO-TS• at 392 nm in the presence of 0.120 M
tert-butyl methyl ether in acetonitrile generated by laser flash photolysis of 0.65 mM PSH.

133
Figure 2-20. Transient signal for the buildup of HO-TS• at 392 nm in the presence of 0.070 M
tert-butyl ethyl ether in acetonitrile generated by laser flash photolysis of 0.65 mM PSH.

134
Figure 2-21. Transient signal for the buildup of HO-TS• at 392 nm in the presence of 0.100 M
tetrahydrofuran in acetonitrile generated by laser flash photolysis of 0.65 mM PSH.

135
Figure 2-22. Transient signal for the buildup of HO-TS• at 392 nm in the presence of 0.020 M
methylene chloride in acetonitrile generated by laser flash photolysis of 0.65 mM PSH.

136
Figure 2-23. Transient signal for the buildup of HO-TS• at 392 nm in the presence of 0.050 M
acetone in acetonitrile generated by laser flash photolysis of 0.65 mM PSH.
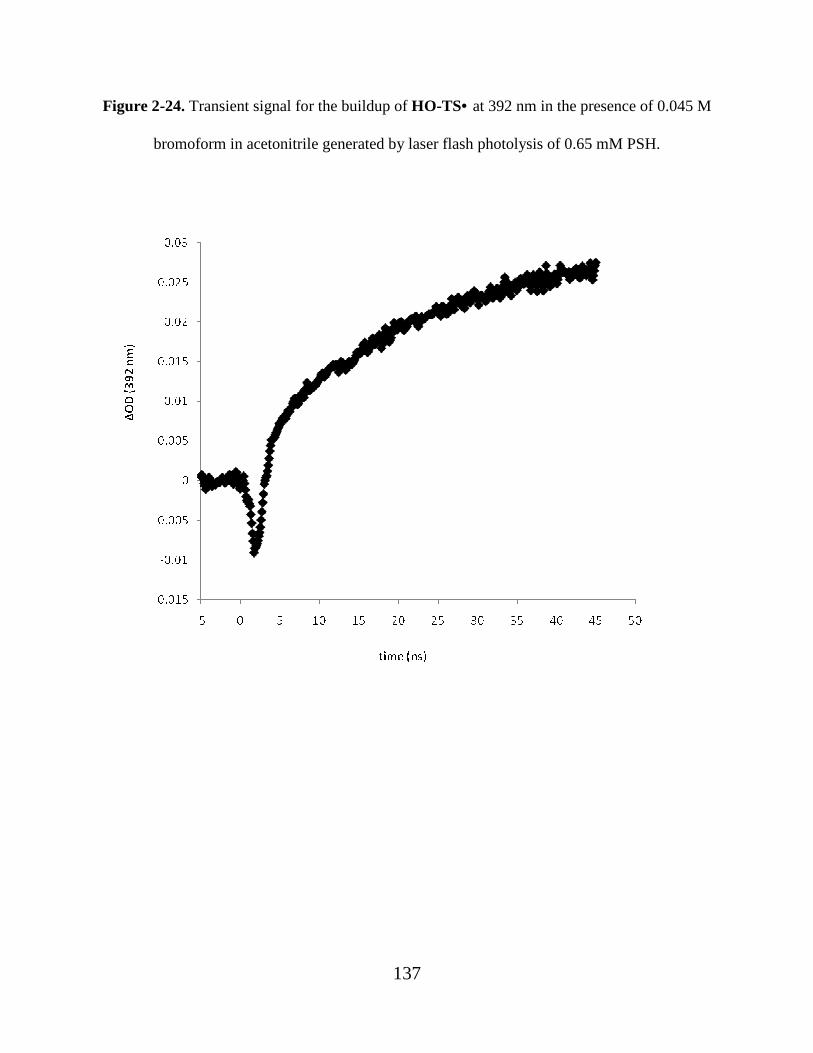
137
Figure 2-24. Transient signal for the buildup of HO-TS• at 392 nm in the presence of 0.045 M
bromoform in acetonitrile generated by laser flash photolysis of 0.65 mM PSH.

138
Figure 2-25. Transient signal for the buildup of HO-TS• at 392 nm in the presence of 0.045 M
chloroform in acetonitrile generated by laser flash photolysis of 0.65 mM PSH.

139
Figure 2-26. Transient signal for the buildup of HO-TS• at 392 nm in the presence of 0.110 M
chloroacetic acid in acetonitrile generated by laser flash photolysis of 0.65 mM PSH.

140
Figure 2-27. Concentration profile for the reaction of HO• with tetramethylbutane in acetonitrile
in the presence of 1.5 mM trans-stilbene as a spectroscopic probe (monitoring the buildup of the
392 nm transient attributable to HO-TS•)
[tetramethylbutane], M
kobs(10-7), s-1
Standard Deviation(10-7)
0.011 0.96 0.024 0.021 0.99 0.027 0.042 1.14 0.049 0.063 1.23 0.033 0.084 1.39 0.033 0.105 1.50 0.028

141
Figure 2-28. Concentration profile for the reaction of HO• with hexane in acetonitrile in the
presence of 1.5 mM trans-stilbene as a spectroscopic probe (monitoring the buildup of the 392
nm transient attributable to HO-TS•)
[hexane], M kobs(10-7), s-1
Standard Deviation
(10-7) 0.015 0.92 0.037 0.045 1.22 0.010 0.075 1.44 0.030 0.150 1.58 0.013 0.200 1.84 0.005 0.250 2.10 0.016

142
Figure 2-29. Concentration profile for the reaction of HO• with heptane in acetonitrile in the
presence of 1.5 mM trans-stilbene as a spectroscopic probe (monitoring the buildup of the 392
nm transient attributable to HO-TS•)
[heptane], M kobs(10-7),
s-1 Standard
Deviation(10-7) 0.007 1.36 0.026 0.021 1.58 0.030 0.035 1.66 0.026 0.070 1.76 0.030 0.084 1.85 0.032 0.112 2.13 0.038

143
Figure 2-30. Concentration profile for the reaction of HO• with methylcyclohexane in
acetonitrile in the presence of 1.5 mM trans-stilbene as a spectroscopic probe (monitoring the
buildup of the 392 nm transient attributable to HO-TS•)
[methylcyclohexane],
M kobs(10-7), s-1 Standard
Deviation (10-7) 0.015 1.03 0.050 0.045 1.34 0.030 0.100 1.42 0.010 0.150 1.64 0.030 0.220 1.98 0.016
\

144
Figure 2-31. Concentration profile for the reaction of HO• with cyclohexane in acetonitrile in
the presence of 1.5 mM trans-stilbene as a spectroscopic probe (monitoring the buildup of the
392 nm transient attributable to HO-TS•)
[cyclohexane], M
kobs(10-7), s-1
Standard Deviation(10-7)
0.015 1.06 0.031 0.021 1.10 0.044 0.030 1.17 0.029 0.045 1.27 0.032 0.060 1.38 0.036 0.075 1.46 0.032

145
Figure 2-32. Concentration profile for the reaction of HO• with dimethylbutane in acetonitrile in
the presence of 1.5 mM trans-stilbene as a spectroscopic probe (monitoring the buildup of the
392 nm transient attributable to HO-TS•)
[dimethylbutane], M kobs(10-7), s-1
Standard Deviation (10-7)
0.006 0.88 0.026 0.009 0.92 0.049 0.015 1.00 0.033 0.030 1.15 0.033 0.045 1.30 0.028 0.060 1.43 0.033 0.075 1.75 0.033

146
Figure 2-33. Concentration profile for the reaction of HO• with 1-butanol in acetonitrile in the
presence of 1.5 mM trans-stilbene as a spectroscopic probe (monitoring the buildup of the 392
nm transient attributable to HO-TS•)
[1-butanol], M kobs(10-7),
s-1 Standard
Deviation(10-7) 0.002 1.16 0.026 0.004 1.35 0.049 0.012 1.60 0.033 0.016 1.75 0.033 0.021 1.97 0.028 0.030 2.42 0.033

147
Figure 2-34. Concentration profile for the reaction of HO• with ethanol in acetonitrile in the
presence of 1.5 mM trans-stilbene as a spectroscopic probe (monitoring the buildup of the 392
nm transient attributable to HO-TS•)
[ethanol], M kobs(10-7), s-1
Standard Deviation
(10-7) 0.002 0.97 0.015 0.005 1.08 0.015 0.015 1.15 0.010 0.022 1.19 0.012 0.030 1.25 0.030 0.040 1.32 0.011
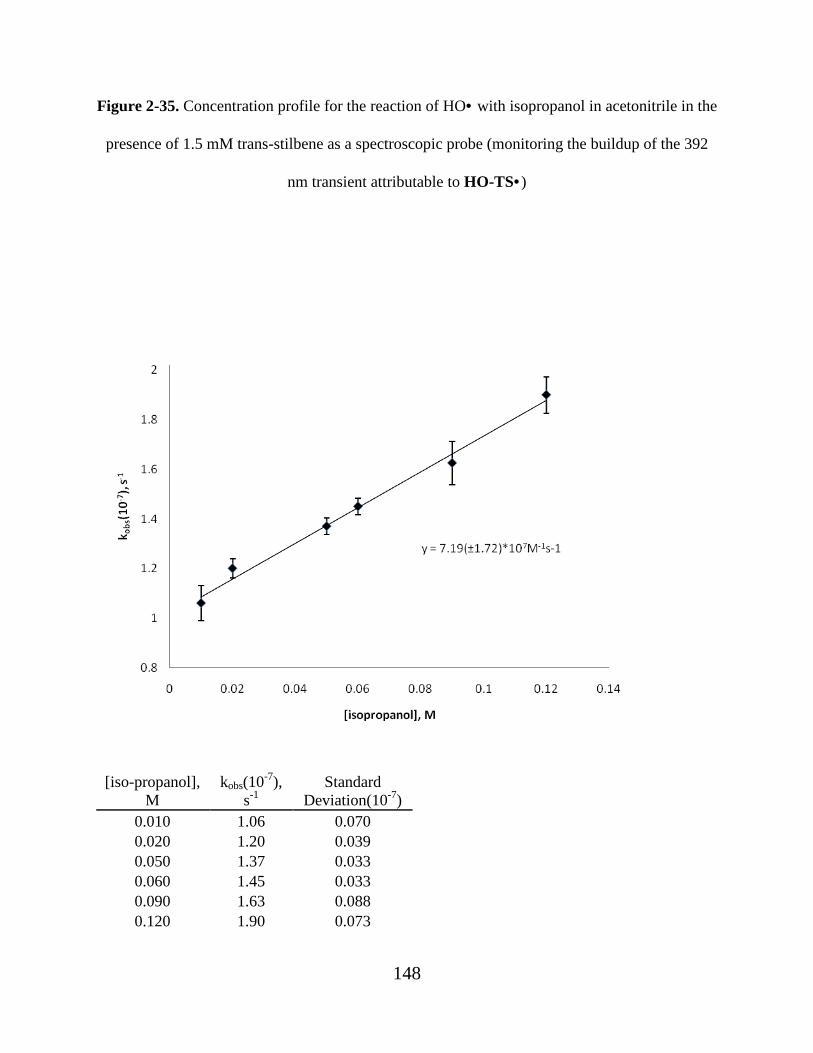
148
Figure 2-35. Concentration profile for the reaction of HO• with isopropanol in acetonitrile in the
presence of 1.5 mM trans-stilbene as a spectroscopic probe (monitoring the buildup of the 392
nm transient attributable to HO-TS•)
[iso-propanol],
M kobs(10-7),
s-1 Standard
Deviation(10-7) 0.010 1.06 0.070 0.020 1.20 0.039 0.050 1.37 0.033 0.060 1.45 0.033 0.090 1.63 0.088 0.120 1.90 0.073

149
Figure 2-36. Concentration profile for the reaction of HO• with methanol in acetonitrile in the
presence of 1.5 mM trans-stilbene as a spectroscopic probe (monitoring the buildup of the 392
nm transient attributable to HO-TS•)
[methanol], M
kobs(10-7), s-1
Standard Deviation(10-7)
0.010 1.15 0.015 0.020 1.30 0.015 0.050 1.45 0.033 0.070 1.59 0.033 0.120 1.85 0.030 0.180 2.19 0.045

150
Figure 2-37. Concentration profile for the reaction of HO• with tert-butanol in acetonitrile in the
presence of 1.5 mM trans-stilbene as a spectroscopic probe (monitoring the buildup of the 392
nm transient attributable to HO-TS•)
[t-butanol],
M kobs(10-7),
s-1 Standard
Deviation(10-7) 0.050 0.95 0.015 0.100 1.05 0.015 0.150 1.29 0.033 0.200 1.47 0.033 0.250 1.66 0.030 0.300 1.81 0.030

151
Figure 2-38. Concentration profile for the reaction of HO• with diethyl ether in acetonitrile in
the presence of 1.5 mM trans-stilbene as a spectroscopic probe (monitoring the buildup of the
392 nm transient attributable to HO-TS•)
[diethyl ether],
M kobs(10-7),
s-1 Standard
Deviation(10-7) 0.015 0.90 0.015 0.030 0.95 0.033 0.045 1.01 0.033 0.060 1.14 0.030 0.100 1.29 0.030 0.150 1.50 0.040

152
Figure 2-39. Concentration profile for the reaction of HO• with tert-butyl methyl ether in
acetonitrile in the presence of 1.5 mM trans-stilbene as a spectroscopic probe (monitoring the
buildup of the 392 nm transient attributable to HO-TS•)
[t-butyl methyl ether], M
kobs(10-7), s-1
Standard Deviation (10-7)
0.070 0.72 0.006 0.120 0.89 0.012 0.180 1.12 0.061 0.240 1.37 0.025 0.300 1.73 0.047

153
Figure 2-40. Concentration profile for the reaction of HO• with tert-butyl ethyl ether in
acetonitrile in the presence of 1.5 mM trans-stilbene as a spectroscopic probe (monitoring the
buildup of the 392 nm transient attributable to HO-TS•)
[t-butyl ethyl ether], M
kobs(10-7), s-1
Standard Deviation
(10-7) 0.010 0.83 0.002 0.040 0.86 0.003 0.070 0.90 0.006 0.140 1.04 0.012 0.210 1.15 0.046 0.250 1.25 0.035

154
Figure 2-41. Concentration profile for the reaction of HO• with tetrahydrofuran in acetonitrile
in the presence of 1.5 mM trans-stilbene as a spectroscopic probe (monitoring the buildup of the
392 nm transient attributable to HO-TS•)
[tetrahydrofuran], M
kobs(10-7), s-1
Standard Deviation (10-7)
0.010 0.87 0.010 0.050 0.95 0.013 0.100 1.08 0.011 0.150 1.21 0.011 0.200 1.48 0.030 0.250 1.71 0.035

155
Figure 2-42. Concentration profile for the reaction of HO• with methylene chloride in
acetonitrile in the presence of 1.5 mM trans-stilbene as a spectroscopic probe (monitoring the
buildup of the 392 nm transient attributable to HO-TS•)
[methylene chloride], M kobs(10-7), s-1
Standard Deviation
(10-7) 0.007 0.95 0.047 0.020 1.11 0.010 0.050 1.40 0.095 0.080 1.64 0.013 0.120 2.06 0.055 0.200 2.40 0.016

156
Figure 2-43. Concentration profile for the reaction of HO• with acetone in acetonitrile in the
presence of 1.5 mM trans-stilbene as a spectroscopic probe (monitoring the buildup of the 392
nm transient attributable to HO-TS•)
[acetone], M kobs(10-7), s-1 Standard
Deviation(10-7) 0.010 1.10 0.087 0.020 1.15 0.040 0.050 1.30 0.015 0.080 1.46 0.087 0.120 1.60 0.040 0.200 1.82 0.047

157
Figure 2-44. Concentration profile for the reaction of HO• with bromoform in acetonitrile in the
presence of 1.5 mM trans-stilbene as a spectroscopic probe (monitoring the buildup of the 392
nm transient attributable to HO-TS•)
[bromoform], M
kobs(10-7), s-1
Standard Deviation(10-7)
0.015 1.14 0.045 0.030 1.42 0.033 0.045 1.57 0.028 0.075 1.72 0.023 0.090 1.87 0.030 0.120 2.10 0.040

158
Figure 2-45. Concentration profile for the reaction of HO• with chloroform in acetonitrile in the
presence of 1.5 mM trans-stilbene as a spectroscopic probe (monitoring the buildup of the 392
nm transient attributable to HO-TS•)
[chloroform], M kobs(10-7),
s-1 Standard
Deviation (10-7) 0.015 1.22 0.035 0.045 1.30 0.013 0.075 1.48 0.031 0.120 1.67 0.029 0.150 1.85 0.010 0.200 2.10 0.015

159
Figure 2-46. Concentration profile for the reaction of HO• with chloroacetic acid in acetonitrile
in the presence of 1.5 mM trans-stilbene as a spectroscopic probe (monitoring the buildup of the
392 nm transient attributable to HO-TS•)
[chloroacetic acid], M kobs(10-7),
s-1 Standard
Deviation(10-7) 0.020 1.26 0.052 0.050 1.50 0.011 0.080 1.65 0.058 0.110 1.80 0.007 0.150 1.93 0.025

160
Figure 2-47. Transient signal for the buildup of HO-TS• at 392 nm in the presence of 0.040 M
hexane in 10% water/ 90% acetonitrile generated by laser flash photolysis of 0.65 mM PSH.

161
Figure 2-48. Transient signal for the buildup of HO-TS• at 392 nm in the presence of 0.045 M
cyclohexane in 10% water/ 90% acetonitrile generated by laser flash photolysis of 0.65 mM
PSH.

162
Figure 2-49. Transient signal for the buildup of HO-TS• at 392 nm in the presence of 0.045 M
dimethylbutane in 10% water/ 90% acetonitrile generated by laser flash photolysis of 0.65 mM
PSH.

163
Figure 2-50. Transient signal for the buildup of HO-TS• at 392 nm in the presence of 0.045 M
ethanol in 10% water/ 90% acetonitrile generated by laser flash photolysis of 0.65 mM PSH.

164
Figure 2-51. Transient signal for the buildup of HO-TS• at 392 nm in the presence of 0.045 M
bromoform in 10% water/ 90% acetonitrile generated by laser flash photolysis of 0.65 mM PSH.
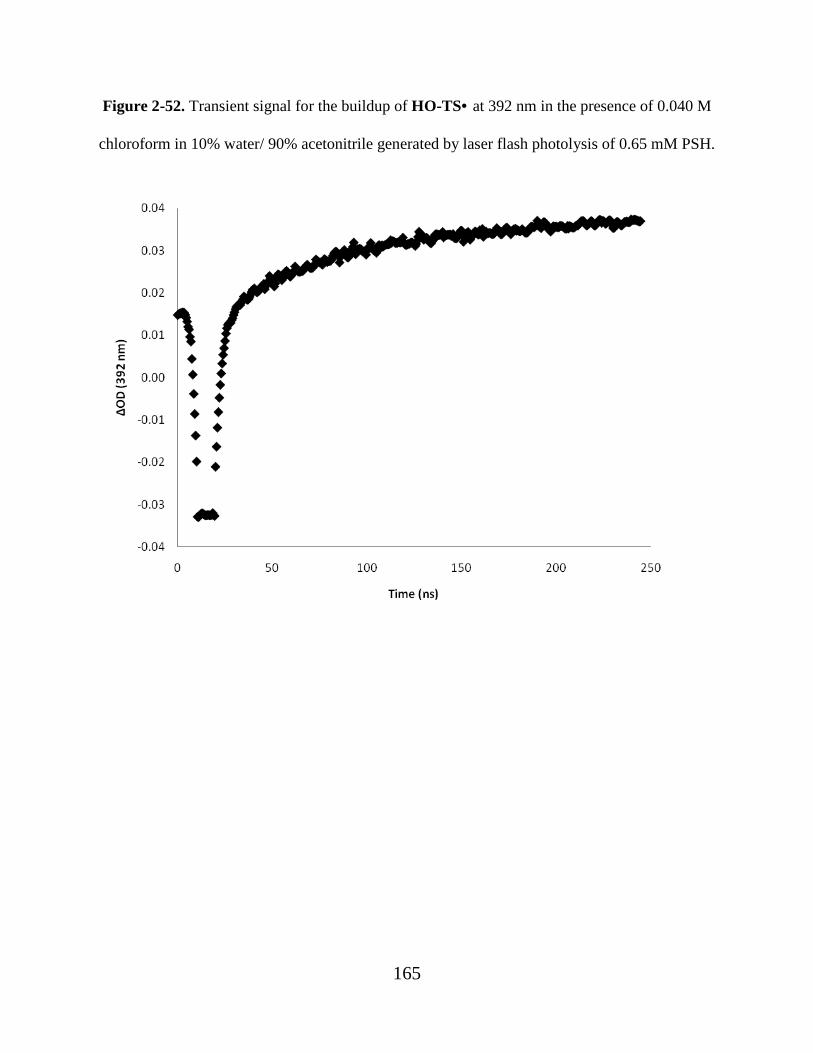
165
Figure 2-52. Transient signal for the buildup of HO-TS• at 392 nm in the presence of 0.040 M
chloroform in 10% water/ 90% acetonitrile generated by laser flash photolysis of 0.65 mM PSH.

166
Figure 2-53. Concentration profile for the reaction of HO• with hexane in 10% water/90%
acetonitrile in the presence of 1.5 mM trans-stilbene as a spectroscopic probe (monitoring the
buildup of the 392 nm transient attributable to HO-TS•)
[hexane], M kobs(10-7),
s-1
Standard Deviation
(10-7) 0.010 0.98 0.065 0.040 1.43 0.025 0.070 1.74 0.060 0.110 2.10 0.100 0.150 2.54 0.046 0.180 2.96 0.052

167
Figure 2-54. Concentration profile for the reaction of HO• with cyclohexane in 10% water/90%
acetonitrile in the presence of 1.5 mM trans-stilbene as a spectroscopic probe (monitoring the
buildup of the 392 nm transient attributable to HO-TS•)
[cyclohexane],
M kobs(10-7),
s-1 Standard
Deviation (10-7) 0.003 1.70 0.045 0.015 1.88 0.068 0.021 2.12 0.087 0.030 2.30 0.013 0.045 2.42 0.021 0.060 2.60 0.019

168
Figure 2-55. Concentration profile for the reaction of HO• with dimethylbutane in 10%
water/90% acetonitrile in the presence of 1.5 mM trans-stilbene as a spectroscopic probe
(monitoring the buildup of the 392 nm transient attributable to HO-TS•)
[dimethylbutane], M kobs(10-7), s-1
Standard Deviation
(10-7) 0.009 1.25 0.05 0.030 1.51 0.08 0.045 1.70 0.10 0.060 1.94 0.06 0.075 2.17 0.08 0.090 2.69 0.08

169
Figure 2-56. Concentration profile for the reaction of HO• with ethanol in 10% water/90%
acetonitrile in the presence of 1.5 mM trans-stilbene as a spectroscopic probe (monitoring the
buildup of the 392 nm transient attributable to HO-TS•)
[ethanol], M kobs(10-7), s-1
Standard Deviation
(10-7) 0.002 1.69 0.045 0.005 1.75 0.007 0.015 2.00 0.009 0.030 2.10 0.013 0.045 2.24 0.019

170
Figure 2-57. Concentration profile for the reaction of HO• with bromoform in 10% water/90%
acetonitrile in the presence of 1.5 mM trans-stilbene as a spectroscopic probe (monitoring the
buildup of the 392 nm transient attributable to HO-TS•)
[bromoform], M kobs(10-7), s-1
Standard Deviation
(10-7) 0.015 1.10 0.041 0.030 1.22 0.041 0.045 1.33 0.040 0.060 1.43 0.035 0.075 1.62 0.048

171
Figure 2-58. Concentration profile for the reaction of HO• with chloroform in 10% water/90%
acetonitrile in the presence of 1.5 mM trans-stilbene as a spectroscopic probe (monitoring the
buildup of the 392 nm transient attributable to HO-TS•)
[chloroform], M kobs(10-7), s-1
Standard Deviation
(10-7) 0.010 1.37 0.032 0.040 1.48 0.006 0.070 1.61 0.025 0.100 1.80 0.012 0.150 2.05 0.021 0.200 2.12 0.052

172
Figure 2-59. Transient signal for the buildup of HO-TS• at 412 nm in the presence of 0.030 M
methanol in Freon-113 generated by laser flash photolysis of 0.65 mM PSH.

173
Figure 2-60. Transient signal for the buildup of HO-TS• at 412 nm in the presence of 0.045 M
cyclohexane in Freon-113 generated by laser flash photolysis of 0.65 mM PSH.

174
Figure 2-61. Concentration profile for the reaction of HO• with methanol in Freon-113 in the
presence of 1.5 mM trans-stilbene as a spectroscopic probe (monitoring the buildup of the 412
nm transient attributable to HO-TS•)
[methanol],
M kobs(10-7),
s-1 Standard Deviation
(10-7) 0.010 1.26 0.049 0.030 1.43 0.071 0.070 1.84 0.089 0.095 2.08 0.074 0.120 2.23 0.099
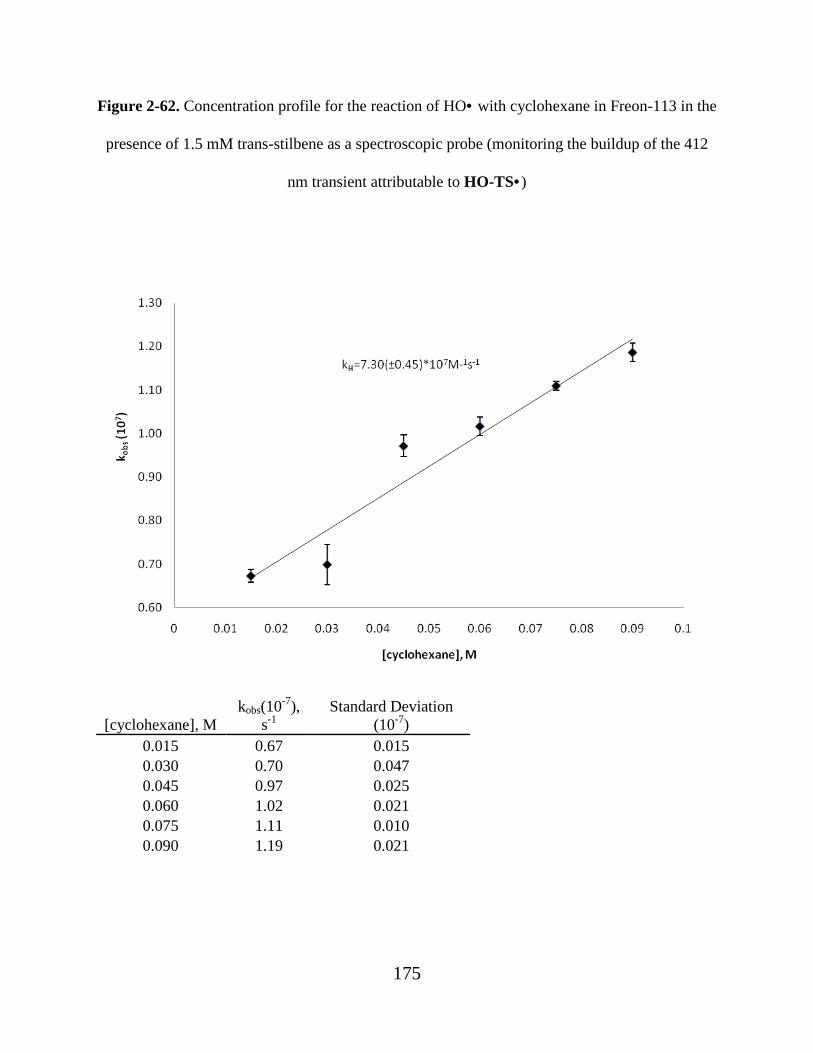
175
Figure 2-62. Concentration profile for the reaction of HO• with cyclohexane in Freon-113 in the
presence of 1.5 mM trans-stilbene as a spectroscopic probe (monitoring the buildup of the 412
nm transient attributable to HO-TS•)
[cyclohexane], M kobs(10-7),
s-1 Standard Deviation
(10-7) 0.015 0.67 0.015 0.030 0.70 0.047 0.045 0.97 0.025 0.060 1.02 0.021 0.075 1.11 0.010 0.090 1.19 0.021
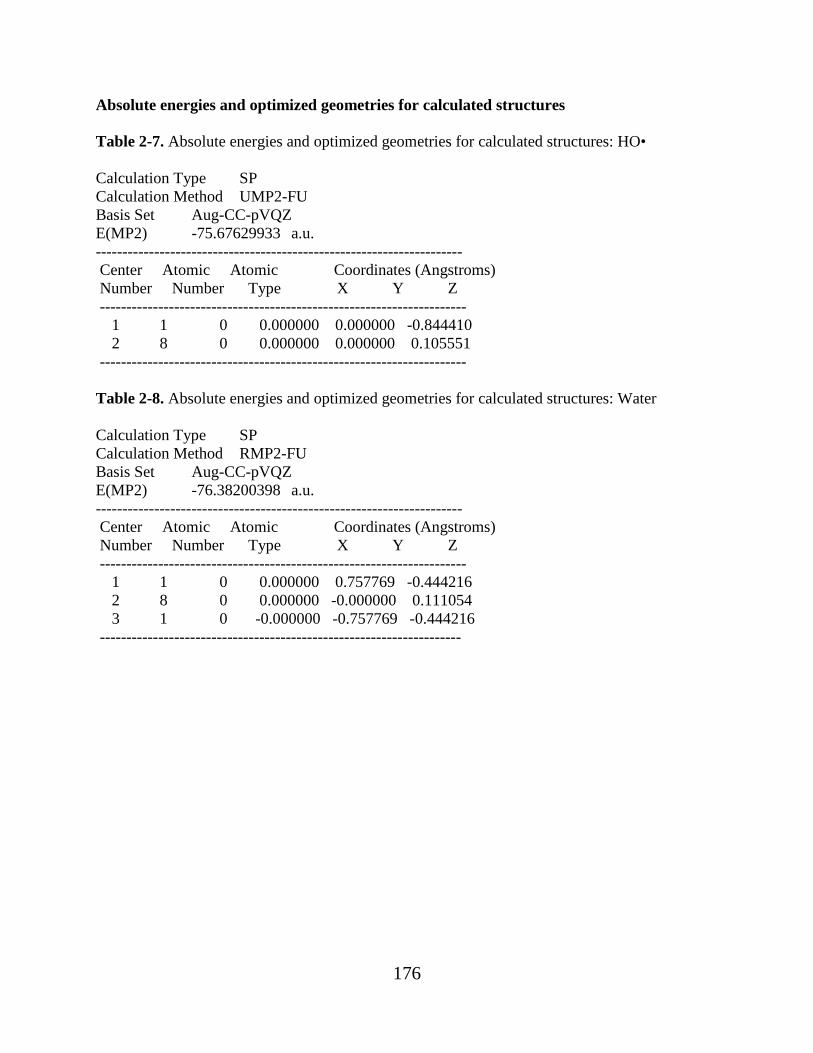
176
Absolute energies and optimized geometries for calculated structures Table 2-7. Absolute energies and optimized geometries for calculated structures: HO•
Calculation Type SP Calculation Method UMP2-FU Basis Set Aug-CC-pVQZ E(MP2) -75.67629933 a.u. --------------------------------------------------------------------- Center Atomic Atomic Coordinates (Angstroms) Number Number Type X Y Z --------------------------------------------------------------------- 1 1 0 0.000000 0.000000 -0.844410 2 8 0 0.000000 0.000000 0.105551 --------------------------------------------------------------------- Table 2-8. Absolute energies and optimized geometries for calculated structures: Water
Calculation Type SP Calculation Method RMP2-FU Basis Set Aug-CC-pVQZ E(MP2) -76.38200398 a.u. --------------------------------------------------------------------- Center Atomic Atomic Coordinates (Angstroms) Number Number Type X Y Z --------------------------------------------------------------------- 1 1 0 0.000000 0.757769 -0.444216 2 8 0 0.000000 -0.000000 0.111054 3 1 0 -0.000000 -0.757769 -0.444216 --------------------------------------------------------------------
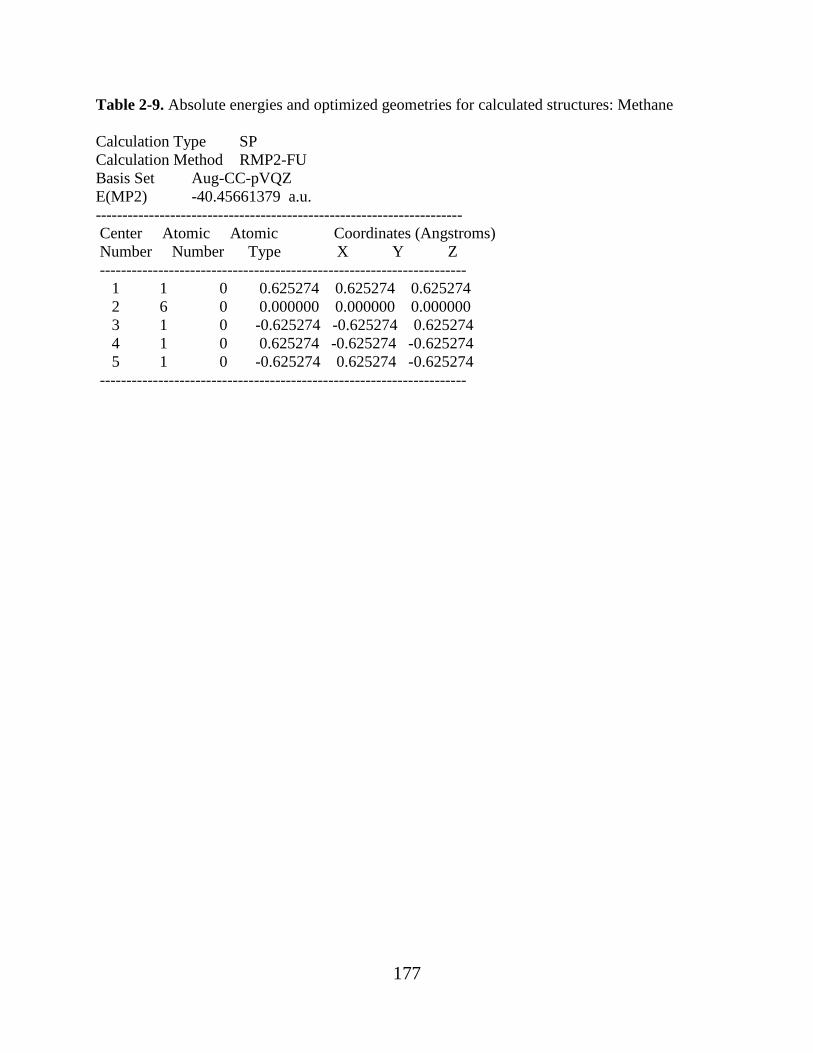
177
Table 2-9. Absolute energies and optimized geometries for calculated structures: Methane
Calculation Type SP Calculation Method RMP2-FU Basis Set Aug-CC-pVQZ E(MP2) -40.45661379 a.u. --------------------------------------------------------------------- Center Atomic Atomic Coordinates (Angstroms) Number Number Type X Y Z --------------------------------------------------------------------- 1 1 0 0.625274 0.625274 0.625274 2 6 0 0.000000 0.000000 0.000000 3 1 0 -0.625274 -0.625274 0.625274 4 1 0 0.625274 -0.625274 -0.625274 5 1 0 -0.625274 0.625274 -0.625274 ---------------------------------------------------------------------

178
Table 2-10. Absolute energies and optimized geometries for calculated structures: Methane/HO•
transition state
Calculation Type SP Calculation Method UMP2-FU Basis Set Aug-CC-pVQZ E(MP2) -116.12748772 a.u. --------------------------------------------------------------------- Center Atomic Atomic Coordinates (Angstroms) Number Number Type X Y Z --------------------------------------------------------------------- 1 1 0 1.459316 -0.823394 0.000000 2 8 0 1.282289 0.106233 0.000000 3 1 0 0.087252 0.119545 0.000090 4 6 0 -1.219303 -0.010955 0.000000 5 1 0 -1.464769 -0.545274 0.904189 6 1 0 -1.464497 -0.547435 -0.902984 7 1 0 -1.559799 1.012419 -0.001289 ---------------------------------------------------------------------

179
Table 2-11. Absolute energies and optimized geometries for calculated structures: Methyl
Calculation Type SP Calculation Method UMP2-FU Basis Set Aug-CC-pVQZ E(MP2) -39.77804050 --------------------------------------------------------------------- Center Atomic Atomic Coordinates (Angstroms) Number Number Type X Y Z --------------------------------------------------------------------- 1 1 0 -0.000000 0.000000 -1.072803 2 6 0 0.000000 -0.000000 0.000011 3 1 0 0.000000 0.929101 0.536370 4 1 0 -0.000000 -0.929101 0.536370 ---------------------------------------------------------------------

180
Table 2-12. Absolute energies and optimized geometries for calculated structures: Chloroform
Calculation Type SP Calculation Method RMP2-FU Basis Set Aug-CC-pVQZ E(MP2) -1418.05187508 a.u. --------------------------------------------------------------------- Center Atomic Atomic Coordinates (Angstroms) Number Number Type X Y Z --------------------------------------------------------------------- 1 17 0 0.970715 1.375629 0.000000 2 6 0 -0.380457 0.241326 0.000000 3 17 0 -0.380457 -0.754356 1.456292 4 17 0 -0.380457 -0.754356 -1.456292 5 1 0 -1.283891 0.814443 0.000000 ---------------------------------------------------------------------

181
Table 2-13. Absolute energies and optimized geometries for calculated structures:
Chloroform/HO• transition state
Calculation Type SP Calculation Method UMP2-FU Basis Set Aug-CC-pVQZ E(MP2) -1493.71826972 a.u. --------------------------------------------------------------------- Center Atomic Atomic Coordinates (Angstroms) Number Number Type X Y Z --------------------------------------------------------------------- 1 17 0 1.080367 -0.068699 -1.373960 2 6 0 -0.013260 0.000306 0.028048 3 17 0 -0.926484 1.511911 0.096877 4 1 0 0.671055 -0.014253 1.017924 5 17 0 -1.044046 -1.429963 0.149408 6 1 0 2.394205 0.031166 1.626187 7 8 0 1.518384 -0.030496 2.044760 ---------------------------------------------------------------------

182
Table 2-14. Absolute energies and optimized geometries for calculated structures: Cl3C•
Calculation Type SP Calculation Method UMP2-FU Basis Set Aug-CC-pVQZ E(MP2) -1417.38943784 a.u. --------------------------------------------------------------------- Center Atomic Atomic Coordinates (Angstroms) Number Number Type X Y Z --------------------------------------------------------------------- 1 17 0 -1.689693 -0.003763 -0.032288 2 6 0 -0.000309 -0.000001 0.274336 3 17 0 0.848161 -1.461250 -0.032268 4 17 0 0.841641 1.465013 -0.032268 ---------------------------------------------------------------------

183
Table 2-15. Absolute energies and optimized geometries for calculated structures: Methanol
Calculation Type SP Calculation Method RMP2-FU Basis Set Aug-CC-pVQZ E(MP2) -115.62223681 --------------------------------------------------------------------- Center Atomic Atomic Coordinates (Angstroms) Number Number Type X Y Z --------------------------------------------------------------------- 1 1 0 -0.440133 1.060518 0.883708 2 6 0 0.045662 0.654014 0.000000 3 1 0 -0.440133 1.060518 -0.883708 4 8 0 0.045662 -0.744180 0.000000 5 1 0 1.077480 0.974056 0.000000 6 1 0 -0.836482 -1.065732 0.000000 ---------------------------------------------------------------------

184
Table 2-16. Absolute energies and optimized geometries for calculated structures:
Methanol/HO• transition state
Calculation Type SP Calculation Method UMP2-FU Basis Set Aug-CC-pVQZ E(MP2) -191.30373941 a.u. --------------------------------------------------------------------- Center Atomic Atomic Coordinates (Angstroms) Number Number Type X Y Z --------------------------------------------------------------------- 1 1 0 0.668647 0.333158 0.058495 2 6 0 -0.583616 0.637501 -0.007364 3 1 0 -0.735284 1.223755 0.890974 4 8 0 -1.338957 -0.501331 -0.086257 5 1 0 -0.696276 1.214671 -0.910020 6 1 0 -1.299824 -0.980835 0.721081 7 1 0 1.785542 -0.677875 -0.679730 8 8 0 1.811318 -0.115903 0.081681 ---------------------------------------------------------------------

185
Table 2-17. Absolute energies and optimized geometries for calculated structures: HOCH2•
Calculation Type SP Calculation Method UMP2-FU Basis Set Aug-CC-pVQZ E(MP2) -114.95730684 a.u. --------------------------------------------------------------------- Center Atomic Atomic Coordinates (Angstroms) Number Number Type X Y Z --------------------------------------------------------------------- 1 1 0 1.014128 1.135778 0.000000 2 6 0 0.049139 0.678000 0.000000 3 1 0 -0.875305 1.219882 0.000000 4 8 0 0.049139 -0.676324 0.000000 5 1 0 -0.826769 -1.013067 0.000000 --------------------------------------------------------------------
Table 2-18. Absolute energies and optimized geometries for calculated structures: Methane
Calculation Type SP Calculation Method CCSD(T) Basis Set aug-cc-pVDZ E(CCSD(T)) -0.40395771144D+02 a.u. --------------------------------------------------------------------- Center Atomic Atomic Coordinates (Angstroms) Number Number Type X Y Z --------------------------------------------------------------------- 1 6 0 -0.000000 0.000025 0.000000 2 1 0 0.754732 -0.797980 -0.000000 3 1 0 -1.003791 -0.445406 -0.000000 4 1 0 0.124530 0.621618 0.896702 5 1 0 0.124530 0.621618 -0.896702 --------------------------------------------------------------------- Table 2-19. Absolute energies and optimized geometries for calculated structures: HO•
Calculation Type SP Calculation Method CCSD(T) Basis Set aug-cc-pVDZ E(CCSD(T)) -0.75584062909D+02 a.u. --------------------------------------------------------------------- Center Atomic Atomic Coordinates (Angstroms) Number Number Type X Y Z --------------------------------------------------------------------- 1 8 0 0.000000 0.000000 0.108367

186
2 1 0 0.000000 0.000000 -0.866934 --------------------------------------------------------------------- Table 2-20. Absolute energies and optimized geometries for calculated structures: HO-CH4
transition state
Calculation Type SP Calculation Method CCSD(T) Basis Set aug-cc-pVDZ E(CCSD(T)) -0.11596953231D+03 a.u. --------------------------------------------------------------------- Center Atomic Atomic Coordinates (Angstroms) Number Number Type X Y Z --------------------------------------------------------------------- 1 6 0 -0.048202 1.214767 0.000000 2 1 0 -0.137616 0.022705 0.000000 3 8 0 -0.048202 -1.313377 0.000000 4 1 0 0.924485 -1.369321 0.000000 5 1 0 -1.087360 1.564585 0.000000 6 1 0 0.487660 1.500222 0.912217 7 1 0 0.487660 1.500222 -0.912217 --------------------------------------------------------------------- Table 2-21. Absolute energies and optimized geometries for calculated structures: HO•---H2O
(Hydrogen bond donor)
Calculation Type SP Calculation Method CCSD(T) Basis Set aug-cc-pVDZ E(CCSD(T)) -0.15186400922D+03 a.u. --------------------------------------------------------------------- Center Atomic Atomic Coordinates (Angstroms) Number Number Type X Y Z --------------------------------------------------------------------- 1 8 0 1.546697 -0.111691 0.000000 2 8 0 -1.412787 0.118597 -0.000002 3 1 0 1.508164 0.864218 0.000013 4 1 0 -0.540363 -0.304132 -0.000035 5 1 0 -2.039079 -0.615331 0.000032 ---------------------------------------------------------------------

187
Table 2-22. Absolute energies and optimized geometries for calculated structures: CH4-HO•---
H2O (Hydrogen bond donor) transition state
Calculation Type SP Calculation Method CCSD(T) Basis Set aug-cc-pVDZ E(CCSD(T)) -0.19225315053D+03 a.u. --------------------------------------------------------------------- Center Atomic Atomic Coordinates (Angstroms) Number Number Type X Y Z --------------------------------------------------------------------- 1 6 0 1.506520 -0.891588 -0.001522 2 1 0 1.052339 0.187686 -0.165910 3 8 0 0.382448 1.396949 -0.104717 4 1 0 0.578867 1.576042 0.833610 5 1 0 1.930025 -1.162740 -0.975994 6 1 0 2.274108 -0.813896 0.777239 7 1 0 0.665721 -1.531456 0.287298 8 1 0 -1.243470 0.245558 -0.095314 9 8 0 -1.831119 -0.516453 0.047927 10 1 0 -2.707340 -0.195631 -0.197484 ---------------------------------------------------------------------

188
Table 2-23. Absolute energies and optimized geometries for calculated structures: HO•---H2O
(Hydrogen bond acceptor)
Calculation Type SP Calculation Method CCSD(T) Basis Set aug-cc-pVDZ E(CCSD(T)) -0.15186732232D+03 a.u. --------------------------------------------------------------------- Center Atomic Atomic Coordinates (Angstroms) Number Number Type X Y Z --------------------------------------------------------------------- 1 8 0 0.036519 1.626401 0.000000 2 1 0 0.075360 0.645236 0.000000 3 8 0 0.036519 -1.272815 -0.000000 4 1 0 -0.329833 -1.736963 0.764176 5 1 0 -0.329833 -1.736963 -0.764176 --------------------------------------------------------------------- Table 2-24. Absolute energies and optimized geometries for calculated structures: CH4-HO•---
H2O (Hydrogen bond acceptor) transition state
Calculation Type SP Calculation Method CCSD(T) Basis Set aug-cc-pVDZ E(CCSD(T)) -0.19225182396D+03a.u. --------------------------------------------------------------------- Center Atomic Atomic Coordinates (Angstroms) Number Number Type X Y Z --------------------------------------------------------------------- 1 8 0 0.976849 0.909976 0.000000 2 1 0 1.239786 -0.381894 0.000000 3 6 0 1.252695 -1.584137 0.000000 4 1 0 -0.000000 0.827479 0.000000 5 1 0 1.787273 -1.873626 0.912267 6 1 0 1.787273 -1.873626 -0.912267 7 1 0 0.210965 -1.924736 0.000000 8 8 0 -1.949138 0.663997 0.000000 9 1 0 -2.381575 1.069723 0.763309 10 1 0 -2.381575 1.069723 -0.763309 ---------------------------------------------------------------------

189
Table 2-25. Absolute energies and optimized geometries for calculated structures: HO•---(H2O)2
(1 hydrogen bond donor, 1 hydrogen bond acceptor)
Calculation Type SP Calculation Method CCSD(T) Basis Set aug-cc-pVDZ E(CCSD(T)) -0.22815656039D+03 a.u. --------------------------------------------------------------------- Center Atomic Atomic Coordinates (Angstroms) Number Number Type X Y Z --------------------------------------------------------------------- 1 8 0 -0.628449 1.630170 0.007521 2 1 0 -1.045389 0.733776 0.006950 3 8 0 -1.070637 -1.126478 -0.099112 4 1 0 -1.422413 -1.756719 0.541362 5 1 0 -0.098780 -1.195632 -0.027534 6 1 0 1.157231 0.601221 -0.005722 7 8 0 1.580136 -0.271661 0.087055 8 1 0 2.360957 -0.238896 -0.478767 ---------------------------------------------------------------------

190
Table 2-26. Absolute energies and optimized geometries for calculated structures: CH4-HO•---
(H2O)2 (1 hydrogen bond donor, 1 hydrogen bond acceptor) transition state
Calculation Type SP Calculation Method CCSD(T) Basis Set aug-cc-pVDZ E(CCSD(T)) -0.26854382925D+03 a.u. --------------------------------------------------------------------- Center Atomic Atomic Coordinates (Angstroms) Number Number Type X Y Z --------------------------------------------------------------------- 1 6 0 2.142525 0.006192 -0.655151 2 8 0 0.585425 -0.254158 1.309713 3 8 0 -1.076793 1.501588 -0.198315 4 8 0 -1.511808 -1.255620 -0.314973 5 1 0 1.514531 -0.204961 0.337661 6 1 0 2.262586 -0.967923 -1.144297 7 1 0 1.560746 0.712245 -1.257910 8 1 0 3.096695 0.425830 -0.316423 9 1 0 0.115931 0.563666 1.023368 10 1 0 -1.822462 2.064625 0.043491 11 1 0 -1.476141 0.646835 -0.454963 12 1 0 -0.721545 -1.231462 0.261587 13 1 0 -1.360080 -1.980486 -0.933014 ---------------------------------------------------------------------

191
Table 2-27. Absolute energies and optimized geometries for calculated structures: HO•---(H2O)2
(2 hydrogen bond donors, 1 hydrogen bond acceptor)
Calculation Type SP Calculation Method CCSD(T) Basis Set aug-cc-pVDZ E(CCSD(T)) -0.30443704440D+03 a.u. --------------------------------------------------------------------- Center Atomic Atomic Coordinates (Angstroms) Number Number Type X Y Z --------------------------------------------------------------------- 1 8 0 0.489581 -0.548456 -0.135892 2 1 0 0.036355 0.335432 -0.108107 3 8 0 -1.275458 1.544101 -0.104271 4 1 0 -1.401671 2.228813 0.564216 5 1 0 -1.993206 0.897141 0.036690 6 1 0 -1.543074 -1.295688 -0.033947 7 8 0 -2.441265 -0.972819 0.149768 8 1 0 -3.027273 -1.551029 -0.353911 9 1 0 2.492122 -0.251041 -0.018195 10 8 0 3.416602 0.030457 0.077467 11 1 0 3.921070 -0.789891 0.016673 ---------------------------------------------------------------------
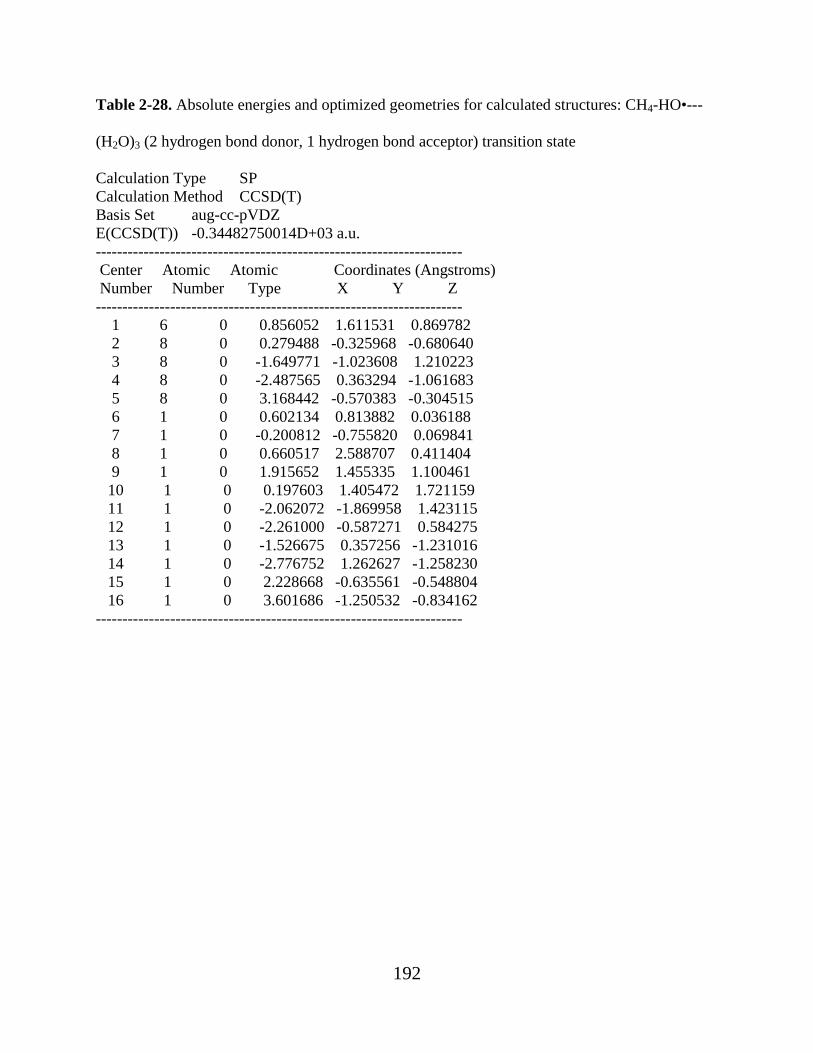
192
Table 2-28. Absolute energies and optimized geometries for calculated structures: CH4-HO•---
(H2O)3 (2 hydrogen bond donor, 1 hydrogen bond acceptor) transition state
Calculation Type SP Calculation Method CCSD(T) Basis Set aug-cc-pVDZ E(CCSD(T)) -0.34482750014D+03 a.u. --------------------------------------------------------------------- Center Atomic Atomic Coordinates (Angstroms) Number Number Type X Y Z --------------------------------------------------------------------- 1 6 0 0.856052 1.611531 0.869782 2 8 0 0.279488 -0.325968 -0.680640 3 8 0 -1.649771 -1.023608 1.210223 4 8 0 -2.487565 0.363294 -1.061683 5 8 0 3.168442 -0.570383 -0.304515 6 1 0 0.602134 0.813882 0.036188 7 1 0 -0.200812 -0.755820 0.069841 8 1 0 0.660517 2.588707 0.411404 9 1 0 1.915652 1.455335 1.100461 10 1 0 0.197603 1.405472 1.721159 11 1 0 -2.062072 -1.869958 1.423115 12 1 0 -2.261000 -0.587271 0.584275 13 1 0 -1.526675 0.357256 -1.231016 14 1 0 -2.776752 1.262627 -1.258230 15 1 0 2.228668 -0.635561 -0.548804 16 1 0 3.601686 -1.250532 -0.834162 ---------------------------------------------------------------------

193
The complete Gaussian ’03 citation: Frisch, M. J.; Trucks, G. W.; Schlegel, H. B.; Scuseria, G. E.; Robb, M. A.; Cheeseman, J. R.; Montgomery, J., J. A.; Vreven, T.; Kudin, K. N.; Burant, J. C.; Millam, J. M.; Iyengar, S. S.; Tomasi, J.; Barone, V.; Mennucci, B.; Cossi, M.; Scalmani, G.; Rega, N.; Petersson, G. A.; Nakatsuji, H.; Hada, M.; Ehara, M.; Toyota, K.; Fukuda, R.; Hasegawa, J.; Ishida, M.; Nakajima, T.; Honda, Y.; Kitao, O.; Nakai, H.; Klene, M.; Li, X.; Knox, J. E.; Hratchian, H. P.; Cross, J. B.; Bakken, V.; Adamo, C.; Jaramillo, J.; Gomperts, R.; Stratmann, R. E.; Yazyev, O.; Austin, A. J.; Cammi, R.; Pomelli, C.; Ochterski, J. W.; Ayala, P. Y.; Morokuma, K.; Voth, G. A.; Salvador, P.; Dannenberg, J. J.; Zakrzewski, V. G.; Dapprich, S.; Daniels, A. D.; Strain, M. C.; Farkas, O.; Malick, D. K.; Rabuck, A. D.; Raghavachari, K.; Foresman, J. B.; Ortiz, J. V.; Cui, Q.; Baboul, A. G.; Clifford, S.; Cioslowski, J.; Stefanov, B. B.; Liu, G.; Liashenko, A.; Piskorz, P.; Komaromi, I.; Martin, R. L.; Fox, D. J.; Keith, T.; Al-Laham, M. A.; Peng, C. Y.; Nanayakkara, A.; Challacombe, M.; Gill, P. M. W.; Johnson, B.; Chen, W.; Wong, M. W.; Gonzalez, C.; Pople, J. A. Gaussian 03, Revision C.02, Gaussian, Inc.: Wallingford CT, 2004.

194
Appendix B: Supporting Material for Chapter 3 Mechanistic Degradation of
High Density Polyethylene Potable Water Materials
The following represents the supporting information for Chapter 3, and includes representative IR spectra
from aged HDPE pipe and aged HDPE resin samples, with reported relative intensities of relevant peaks.

195
Figure 3-7. IR of HDPE pipe sample prior to initiation of accelerated aging (0 h). C—H stretch: 2916 cm-1 ,2848 cm-1 CH2 ; C—H bend: 1473 cm-1, 1462 cm-1; CH2rock: 731 cm-
1, 719 cm-1

196
Figure 3-8. IR of HDPE pipe sample after 45 days (1080 h) of accelerated aging at 50 mg/L Cl2.
CO stretch (aldehyde): 1742 cm-1; CO stretch (keytone): 1715 cm-1; 1742 cm-1:17.2% (relative to 1462 cm-1); 1715 cm-1: 18.1% (relative to 1462 cm-1)

197
Figure 3-9. IR of HDPE pipe sample after 90 days (2160 h) of accelerated aging at 50 mg/L Cl2.
CO stretch (aldehyde): 1742 cm-1; CO stretch (keytone): 1715 cm-1; 1742 cm-1:13.8% (relative to 1462 cm-1); 1715 cm-1: 22.3% (relative to 1462 cm-1)

198
Figure 3-10. IR of HDPE pipe sample after 190 days (4560 h) of accelerated aging at 500 mg/L
Cl2.
CO stretch (aldehyde): 1742 cm-1; CO stretch (keytone): 1715 cm-1; C—O—OH stretch (16O2): 1113 cm-1; 1742 cm-1: 34.7% (relative to 1462 cm-1); 1715 cm-1:36.5% (relative to 1462 cm-1); 1113 cm-1; 25.4% (relative to 1462 cm-1)

199
Figure 3-11. IR of HDPE pipe sample after 45 days (1080 h) of accelerated aging at 500 mg/L
Cl2.
CO stretch (aldehyde): 1742 cm-1; CO stretch (keytone): 1715 cm-1; 1742 cm-1: 17.6% (relative to 1462 cm-1); 1715 cm-1: 22.3% (relative to 1462 cm-1)

200
Figure 3-12. IR of HDPE pipe sample after 90 days (2160 h) of accelerated aging at 500 mg/L
Cl2.
CO stretch (aldehyde): 1742 cm-1; CO stretch (keytone): 1715 cm-1; 1742 cm-1: 16.0% (relative to 1462 cm-1); 1715 cm-1: 23.0% (relative to 1462 cm-1)

201
Figure 3-13. IR of HDPE pipe sample after 190 days (4560 h) of accelerated aging at 500 mg/L
Cl2.
CO stretch (aldehyde): 1742 cm-1; CO stretch (keytone): 1715 cm-1; C—O—OH stretch (16O2): 1113 cm-1; 1742 cm-1: 23.5% (relative to 1462 cm-1); 1715 cm-1:40.2% (relative to 1462 cm-1); 1113 cm-1; 18.1% (relative to 1462 cm-1)
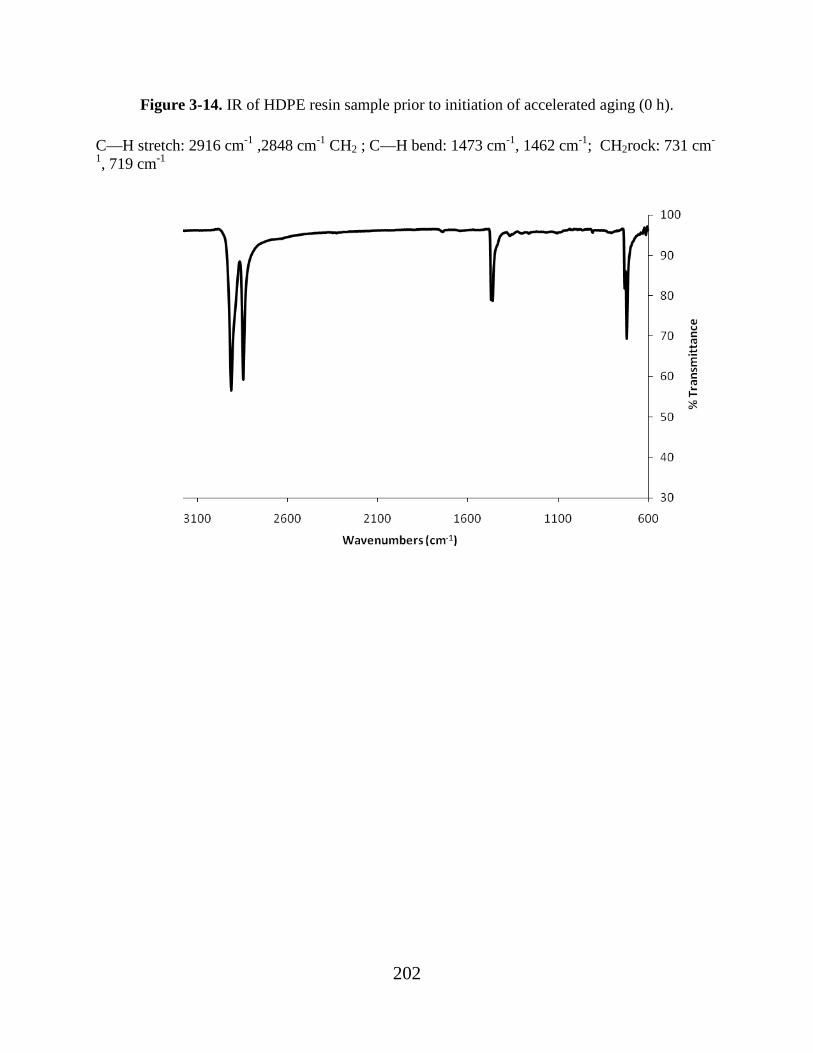
202
Figure 3-14. IR of HDPE resin sample prior to initiation of accelerated aging (0 h).
C—H stretch: 2916 cm-1 ,2848 cm-1 CH2 ; C—H bend: 1473 cm-1, 1462 cm-1; CH2rock: 731 cm-
1, 719 cm-1

203
Figure 3-15. IR of HDPE resin sample after 21 days (504 h) of accelerated aging at 50 mg/L Cl2.
CO stretch (aldehyde): 1742 cm-1; 1742 cm-1:10.1% (relative to 1462 cm-1);

204
Figure 3-16. IR of HDPE resin sample after 90 days (2160 h) of accelerated aging at 50 mg/L
Cl2.
CO stretch (aldehyde): 1742 cm-1; CO stretch (keytone): 1715 cm-1; 1742 cm-1: 8.0% (relative to 1462 cm-1); 1715 cm-1:6.0% (relative to 1462 cm-1);

205
Figure 3-17. IR of HDPE resin sample after 160 days (3840 h) of accelerated aging at 50 mg/L
Cl2.
CO stretch (aldehyde): 1742 cm-1; CO stretch (keytone): 1715 cm-1; C—O—OH stretch (16O2): 1113 cm-1; 1742 cm-1: 34.7% (relative to 1462 cm-1); 1715 cm-1:36.6% (relative to 1462 cm-1); 1113 cm-1; 25.4% (relative to 1462 cm-1)

206
Figure 3-18. IR of HDPE resin sample after 21 days (504 h) of accelerated aging at 250 mg/L
Cl2.
CO stretch (aldehyde): 1742 cm-1 1742 cm-1:18.0% (relative to 1462 cm-1);
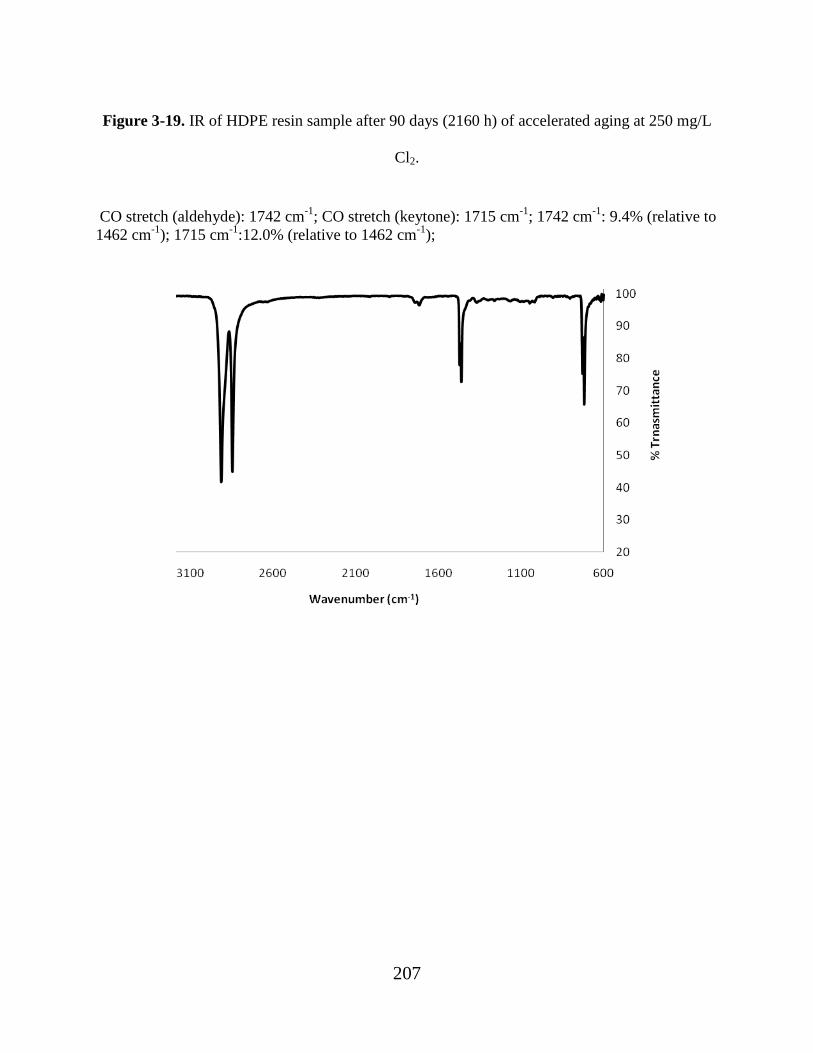
207
Figure 3-19. IR of HDPE resin sample after 90 days (2160 h) of accelerated aging at 250 mg/L
Cl2.
CO stretch (aldehyde): 1742 cm-1; CO stretch (keytone): 1715 cm-1; 1742 cm-1: 9.4% (relative to 1462 cm-1); 1715 cm-1:12.0% (relative to 1462 cm-1);

208
Figure 3-20. IR of HDPE resin sample after 160 days (3840 h) of accelerated aging at 250 mg/L
Cl2.
CO stretch (aldehyde): 1742 cm-1; CO stretch (keytone): 1715 cm-1; C—O—OH stretch (16O2): 1113 cm-1; 1742 cm-1: 18.7% (relative to 1462 cm-1); 1715 cm-1:24.2% (relative to 1462 cm-1); 1113 cm-1; 24.1% (relative to 1462 cm-1)

209
Figure 3-21. IR of HDPE resin sample after 21 days (504 h) of accelerated aging at 250 mg/L
Cl2 in the presence of 18O2 (water not changed).
C16O stretch (keytone): 1715 cm-1; C18O stretch (keytone): 1648 cm-1. C—16O—16OH stretch: 1113 cm-1; C—18O—18OH stretch: 1063 cm-1; 1263 cm-1, 820 cm-1 1715 cm-1: 6.8% (relative to 1462 cm-1); 1648 cm-1: 5.9% (relative to 1462 cm-1)

210
Figure 3-23. IR of HDPE resin sample after 21 days (504 h) of accelerated aging at 250 mg/L.
C—16O—16OH stretch: 1106 cm-1; 1263 cm-1, 820 cm-1