module 1 fundamentals of data-driven decision making · 2017-07-17 · data-driven decision making...
TRANSCRIPT

Module 1 Fundamentals of
Data-Driven Decision Making

Module 1 • Section 1 – Introduction
– Define data-driven decision making – Describe the benefits of using this approach – Define the process for collecting and analyzing data
• Section 2 – Data collection
– Define data – Identify data sources – Determine methods of collecting data
Monday, 17 July 2017 2

End of Module Objective • Recognize the advantages of data-driven
decision making and prioritization • Identify data analysis needs • Decide about the appropriate way of
collecting data in order to apply statistical techniques
Monday, 17 July 2017 3
Section 1
Introduction

Data-driven Decision Making
• Effective and informed decisions are based on the analysis of data and information.
• Using valid and relevant data helps place the “problem” in the right context.
• It allows us to identify risks and opportunities.

Data-driven Decision Making (cont’d) • It mitigates human error. • Relying on data also helps us determine a best-fit
solution. • Data-driven decision making provides credible
evidence to stakeholders and management regarding strengths, weaknesses, opportunities, limitations and risks.

Data-driven Decision Making (cont’d)
• Managers and experts in all fields must base their decisions on the right quantity and quality of information.
• They must also use information that is relevant to their needs.
Benefits of Data-driven Decision Making Decision making based on the right data and information enables managers to focus on strategy and policy issues such as: • changes that can be expected in statutory and regulatory
requirements, emerging technologies, markets or resources which may affect the organization;
• risks that need to be identified, managed or minimized; • various priorities that need to be established and managed,
e.g. strategic, operational, resources;
Benefits of Data-driven Decision Making (cont’d)
• potential changes in the needs and expectations of interested parties in the long term;
• existing services, products and processes that currently provide the most value for interested parties;
• new services, products and processes needed to meet the changing needs and expectations of interested parties;
Benefits of Data-driven Decision Making (cont’d)
• the evolving demands for the organization’s services and products in the long term;
• the impact of emerging technologies on the organization; and
• new competencies that may be needed.

Other Benefits of Data-driven Decision Making
• By using data and facts, we can determine the effectiveness of our past decisions. We can do so by referencing factual records.
• We also become more able to review, evaluate, challenge and change opinions and decisions.

Requirements of Data-driven Decision Making
• Managers and experts who adopt a factual approach to decision making need to:
• ensure that data and information are accurate and reliable;
• make data accessible to those who need it; • analyze data and information using valid methods;
and • balance their decisions with experience and
intuition.

The Process for Collecting and Analyzing Data
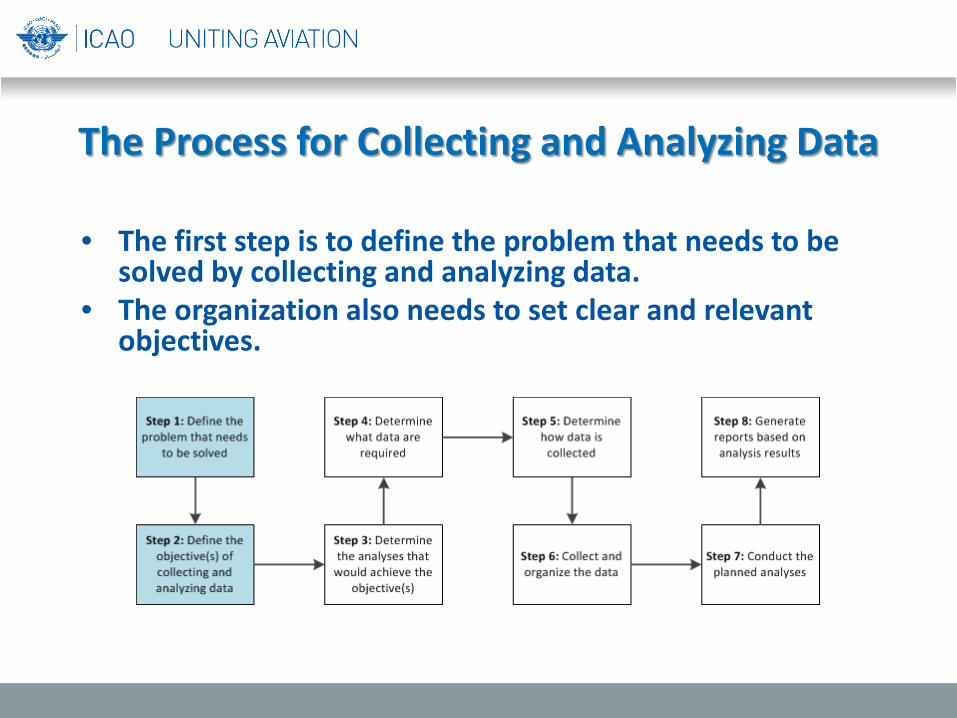
• The diagram below shows the process for collecting and analyzing data.
The Process for Collecting and Analyzing Data
• The first step is to define the problem that needs to be solved by collecting and analyzing data.
• The organization also needs to set clear and relevant objectives.

Defining the Problem • The first step in planning and establishing a data-
driven decision making process is to define what the problem statement is:
• What is the question that needs to be answered? • What decision does management need to make? • What is the objective of collecting and analyzing
data?

Defining the Problem (cont’d) • In the process of defining the problem, management
need to also answer the following questions:
• Does the collection and analysis of data support and relate to the organization’s objectives?
• Is it practical and feasible to collect and analyze the data?
• Are the required data available? Or can they be obtained in a reasonable manner?
• Are the required resources (people, equipment, software, funds) available?
Developing Objectives • In the planning phase, the organization also needs
to define a clear set of objectives, showing: • Why the organization needs to address the
identified problem. • How and where management will use the results of
data collection and analysis.
The Process for Collecting and Analyzing Data
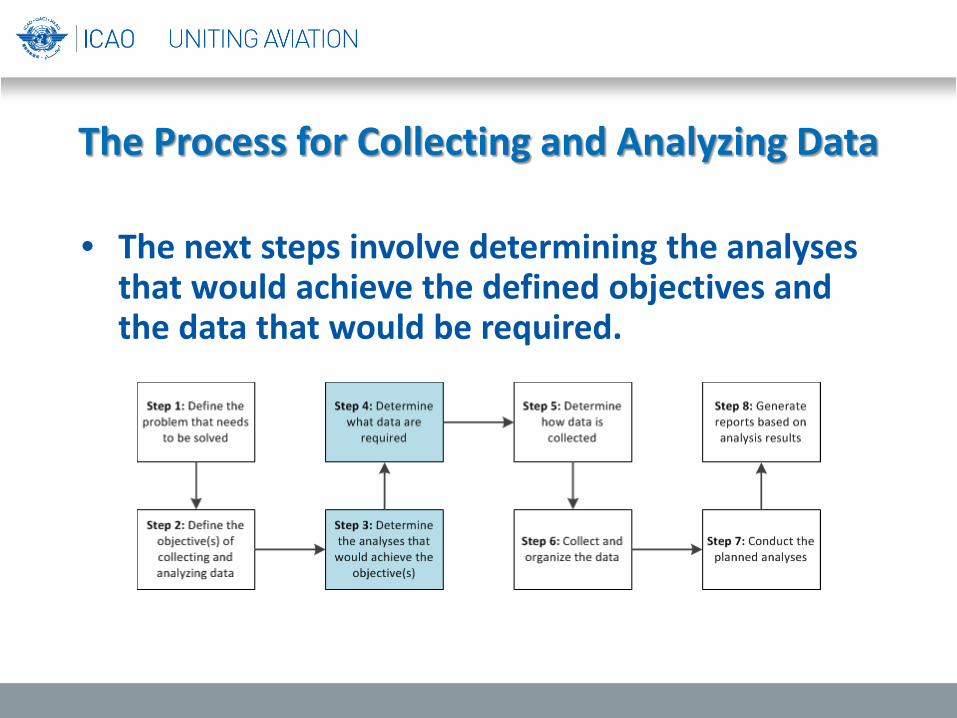
• The next steps involve determining the analyses that would achieve the defined objectives and the data that would be required.

Data Analysis • Data Analysis is the process of applying
statistical or other analytical techniques to check, describe, transform, condense, evaluate and visualize data.
• The goal of data analysis is to discover useful information, suggest conclusions and support decision making.

Data Analysis Analysis of data shows:
• whether the organization, system or process is improving;
• factors that cause change; • connections or “correlations” between or
among various factors.
Determining the Analyses • Analyzing data involves examining it in ways that
reveal the relationships, patterns and trends that can be found within it.
• Statistical techniques can show what kinds of relationships and connections may exist among variables.
• They can also tell you how much you can trust the answers you’re getting.

Determining the Analyses (cont’d) • Through statistical techniques, you can compare
your information to other groups (i.e. a control or comparison group) to help draw conclusions from the data.
• The point is to get an accurate understanding of the overall situation.

The Process for Collecting and Analyzing Data
• In section 2 of this module, we will discuss data collection.
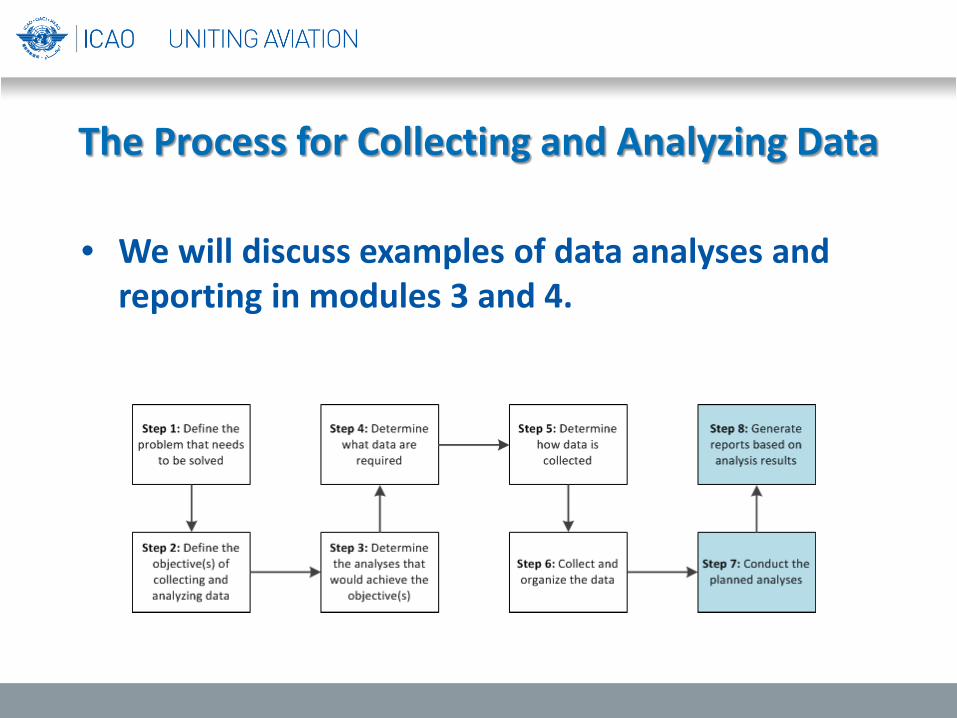
The Process for Collecting and Analyzing Data
• We will discuss examples of data analyses and reporting in modules 3 and 4.
Section 2
Data Collection
What is Data? • Data is a variable piece of information in raw or
unorganized form (such as alphabets, numbers, or symbols) that refers to, or represents, a condition, idea or object.
• Data is limitless and present everywhere in the universe.
• Each piece of data conveys an individual piece of information.
What is Data? • Raw or unprocessed data needs to be “processed”. • Therefore it needs to be collected, measured,
analyzed and reported. • “Processed data” from one stage of a process may
be considered “raw data” for the next.

Types of Data • There are two kinds of data:
• 1) Quantitative data – information that is collected as, or can be translated into, numbers and which can be displayed and analyzed mathematically.
• 2) Qualitative data – collected as descriptions, anecdotes, opinions, interpretations, etc. and generally cannot be reduced to numbers and left as narratives.
• This workshop mainly focuses on quantitative data.

Collecting Data for Decision Making • Our need for information and the quantity of
information available to us are expanding rapidly. • Managers and experts need to collect the right
quantity and quality of information as a basis for sound decision making.

Collecting Data for Decision Making • A sound method for collecting and managing data
needs to be: • objective; • logical; and • a well-planned system.

Collection Process
Monday, 17 July 2017 31
Capture Transform
Form
Load

Where Does Data Come from? • Much of the information that is the basis of
decision making for an organization comes from its routine, everyday operations.
• However, routinely available information is not always enough for important decisions.
• In that case, the organization needs to get the information from other sources or through additional research and observation.
Where Does Data Come from? • To determine the source of data, we need to
identify the “object of interest”: what is it that we are interested in?
• In the world of aviation, the object of interest is related to an “aviation entity” or where aviation activities are conducted.
Aviation Entities • Organizations: airlines, maintenance organizations,
training organizations • People: licensed personnel, qualified inspectors • Physical entities: airports, aircrafts • Virtual entities: airspace

Digitization
Monday, 17 July 2017 35
Event
Airport
Airline
Collect characteristics about entities
Database
Entity records

Collection Methods • Proactive
– Surveys – Audits – Inspections
• Reactive – Reports
• Automated – Data feeds
Monday, 17 July 2017 36
Quality
Cost
Audits and inspections
Surveys
Reporting Data feeds

Data Feeds • Data feed is a mechanism for users to receive
updated data from data sources. • It is commonly used by real-time applications in
point-to-point settings (from a source to a destination), as well as on the World Wide Web. The latter is also called web feed. News feed is a popular form of web feed.

Audits and Inspections • An audit or inspection needs a checklist with
questions. • Each question must be either
“Yes/Satisfactory/Good”, “No/Unsatisfactory/Bad” or “Not Applicable/Not asked”.
• There can only be one finding per question. • A score can be calculated for each audit or inspections
and expressed as a percentage (from 0% to 100%):
Score= ∑ 𝒀𝒀𝒀∑ 𝒀𝒀𝒀+ ∑ 𝑵𝑵
Monday, 17 July 2017 38

Examples • USOAP Protocol Questions • SSP Gap Analysis Questions
Monday, 17 July 2017 39

Data Feed Sources • Accidents and incidents
– Aviation Safety Network – Aviation Herald – ASCEND – iSTARS ADREP
• Traffic – FlightStats – iSTARS State Traffic
• ADS-B Positions – FlightStats
• Flight Schedules – FlightStats
• Airport Information – iSTARS Airports – iSTARS PBN
• Fleet Information – iSTARS Fleet – ASCEND / FlightGlobal
• Terrain Data – NOAA GLOBE
• METARS – NOAA
Monday, 17 July 2017 40

Electronic Forms
Monday, 17 July 2017 41
Build
ing
Diffi
culty
Exploiting Difficulty
WORD
EXCEL
InfoPath
Sharepoint
Online DB
HTML Form
Form =
Form Design Principles • Only ask for data you really need to generate
information. • Avoid multiple value fields (e.g. occurrence
category). • Allow multiple ways to submit (print, email,
online). • Support multiple IT systems (Mac, MS, iPad,
etc.). • Do not ask for subjective information. • Keep the value lists limited (less than 8).
Monday, 17 July 2017 42

The Right Quantity of Data • How much data is the right amount? • The quantity of data can be determined based on
“width” and “depth”. • These depend on the object of interest and the
needs of the organization.

Data Width • The width of the data is the number of information
fields in it. • For example, a person’s data may include: name,
age, gender, place of birth. • The same person’s data collected for another
purpose may include: name, age, gender, place of birth, education, profession, contact information.

Data Depth • The depth of the data is the amount of the
information being collected. • For example, do we need data for 100 people or for
a 1,000 or for 10,000? • Or do we need data for the last 6 months, 5 years or
20 years ?
