module 2: nutrition -...
TRANSCRIPT
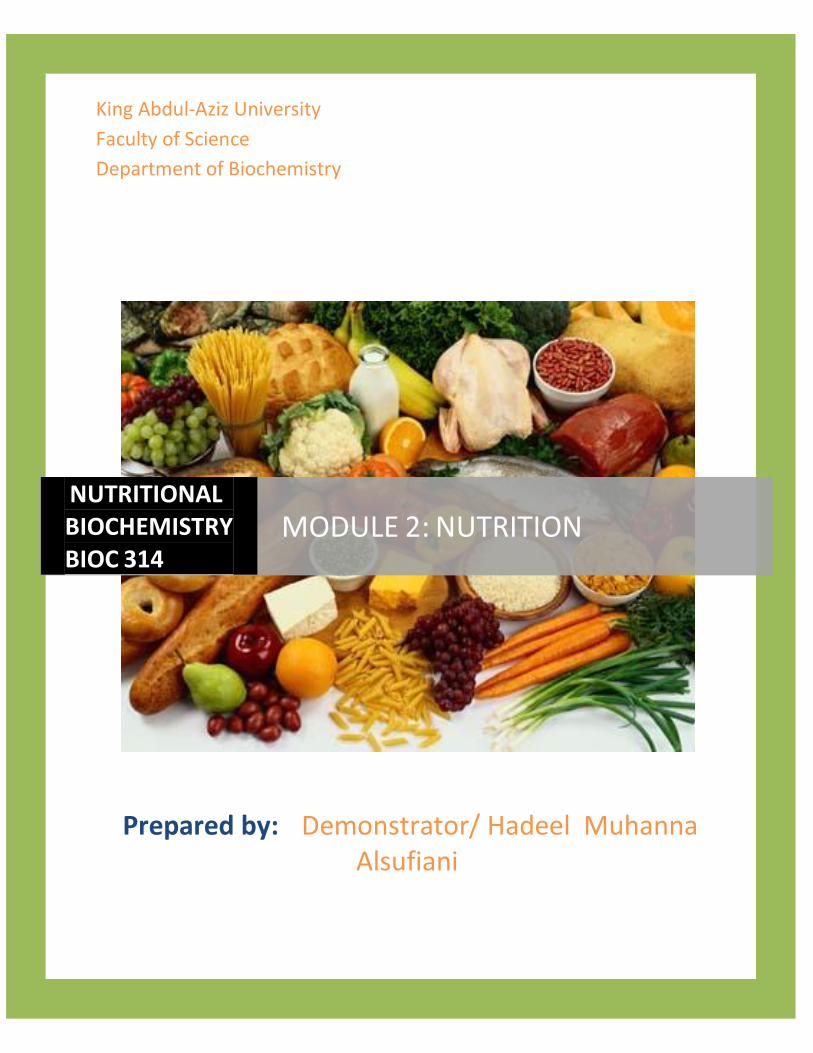
King Abdul-Aziz University
Faculty of Science
Department of Biochemistry
Prepared by: Demonstrator/ Hadeel Muhanna Alsufiani
NUTRITIONAL
BIOCHEMISTRY
BIOC 314 MODULE 2: NUTRITION
2
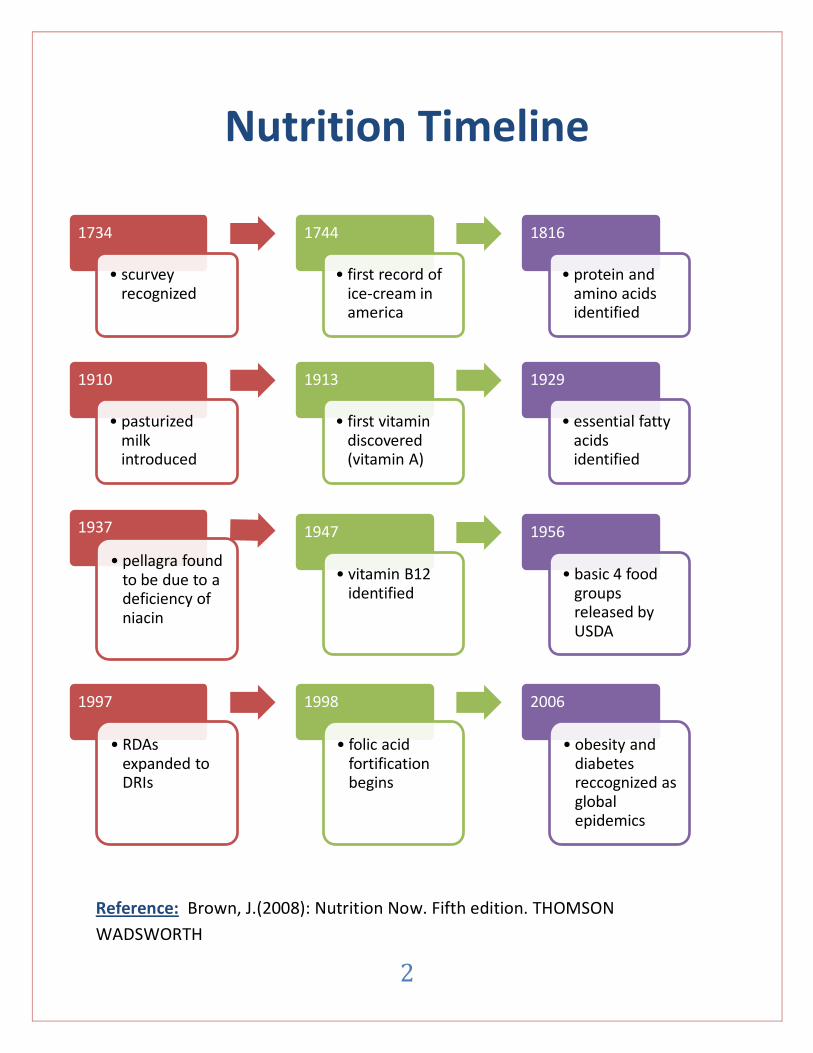
Nutrition Timeline
Reference: Brown, J.(2008): Nutrition Now. Fifth edition. THOMSON
WADSWORTH
1734
• scurvey recognized
1744
• first record of ice-cream in america
1816
• protein and amino acids identified
1910
• pasturized milk introduced
1913
• first vitamin discovered (vitamin A)
1929
• essential fatty acids identified
1937
• pellagra found to be due to a deficiency of niacin
1947
• vitamin B12 identified
1956
• basic 4 food groups released by USDA
1997
• RDAs expanded to DRIs
1998
• folic acid fortification begins
2006
• obesity and diabetes reccognized as global epidemics
3
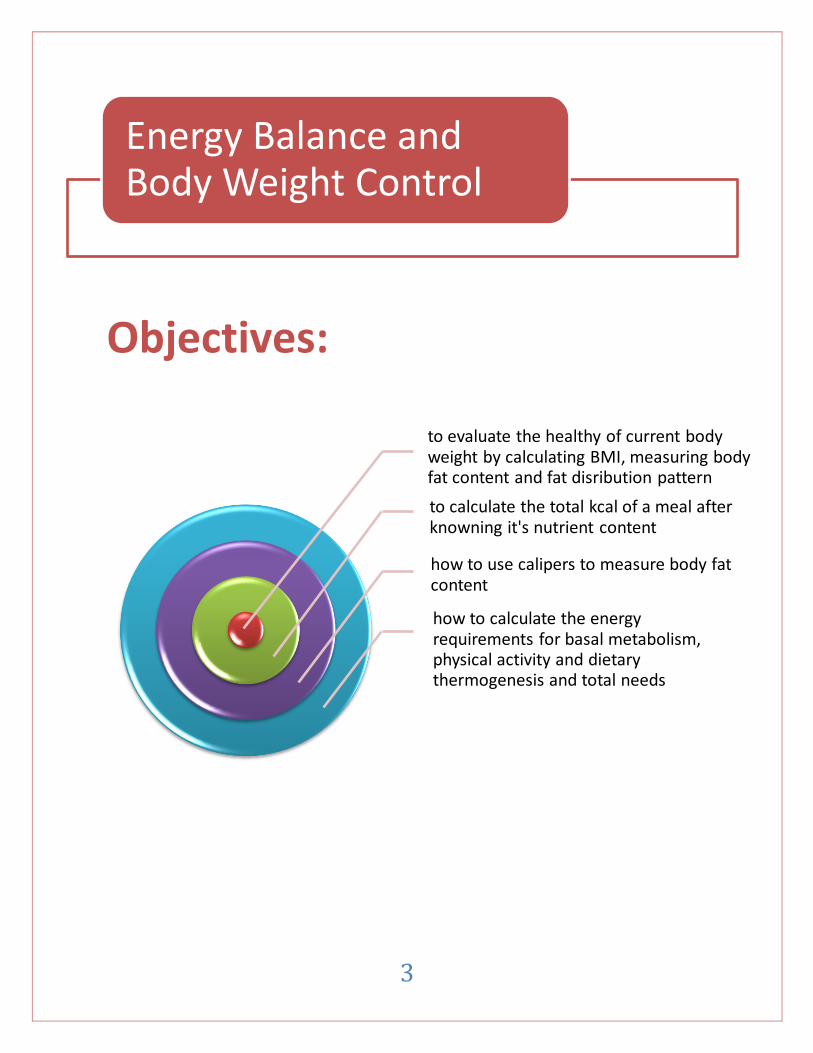
Objectives:
Energy Balance and Body Weight Control
to evaluate the healthy of current body weight by calculating BMI, measuring body fat content and fat disribution pattern
to calculate the total kcal of a meal after knowning it's nutrient content
how to use calipers to measure body fat content
how to calculate the energy requirements for basal metabolism, physical activity and dietary thermogenesis and total needs
4
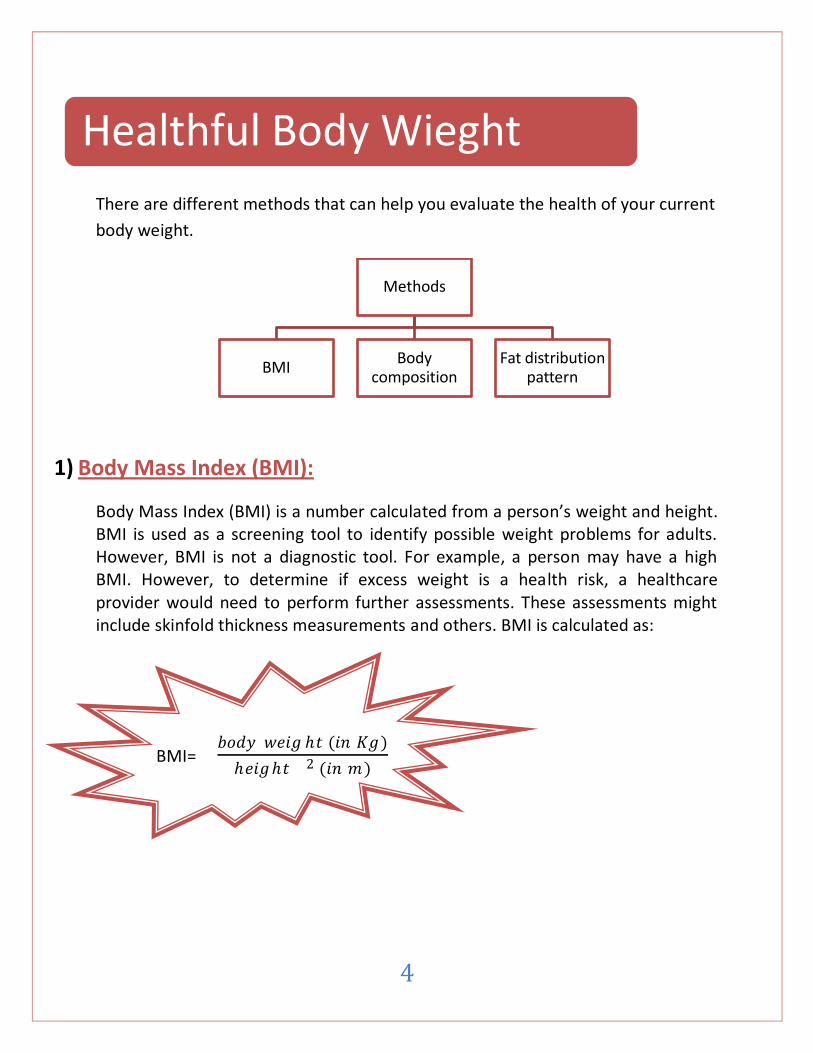
There are different methods that can help you evaluate the health of your current
body weight.
1) Body Mass Index (BMI):
Body Mass Index (BMI) is a number calculated from a person’s weight and height. BMI is used as a screening tool to identify possible weight problems for adults. However, BMI is not a diagnostic tool. For example, a person may have a high BMI. However, to determine if excess weight is a health risk, a healthcare provider would need to perform further assessments. These assessments might include skinfold thickness measurements and others. BMI is calculated as:
BMI= 𝑏𝑜𝑑𝑦 𝑤𝑒𝑖𝑔 ℎ𝑡 (𝑖𝑛 𝐾𝑔)
ℎ𝑒𝑖𝑔ℎ𝑡 2 (𝑖𝑛 𝑚)
Healthful Body Wieght
Methods
BMIBody
compositionFat distribution
pattern

5
BMI for adults are interpreted as follows:
BMI WEIGHT STATUS COMMENTS
< 18.5
Under weight
Associated with increased risk of health problems and death
18.5 to 24.9 Normal Healthy weight-for-height
25 to 29.9 Overweight
30 to 39.9 Obese
Increased health risk
≥40
Morbid obesity
Major health risk
Exercise (1): Calculate your BMI? What your value shows?
Adult BMIs should not be applied to children, still growing adolescents, frail older people, pregnant and lactating women and high muscular individuals. these different age groups have their unique BMI standards
(will be discussed in later)

6
2) Body Composition: Body composition is the proportions of muscle, bone, fat and other tissue that
make up a person’s total body weight. Direct measures of body composition are
impossible in living human beings. Instead, researchers assess body composition
indirectly based on the following assumption: body weight= fat + lean tissue
(including water).
Measuring body fat content is very important because sometimes people who
are classified as normal weight or underweight by BMI standards have too much
body fat because they are physically inactive. On the other hand some people
classified as overweight, but their body fat
content may actually be very low (this is
because of usage of certain medications which
makes people retain fluids)
There are many methods available to assess
the amount of body fat (or adipose tissue). One
of these methods is the skin fold thickness. It is
used to estimate total body fat content by
using calipers to measure the fat layer under
the skin.
For body fat measurement instructions and charts see appendix (B)
Exercise (2): What is your body fat measurement in millimeters? What is your body fat percentage? What your percentage means?

7
3) Fat distribution patterns: To evaluate the health of your body weight, it is also helpful to consider the way
fat is distributed throughout your body. This is because your fat distribution is
known to affect your risk for various diseases. Some people store fat in upper-
body areas whereas others stores fat lower on the body. The picture below shows
two types of fat patterning.
• a person's risk for many chronic diseases.
• also it causes problems with the metabolism of fat and carbohydrate,
leading to unhealthful changes in blood cholesterol, insulin and glucose.
apple-shaped fat paternning
(uper-body obesity)
(the typical male pattern)
• doesn't seem to significantly a person's risk for chronic disease
pear-shaped fat patterning
(lower-body fat)
(the typical female pattern)
8
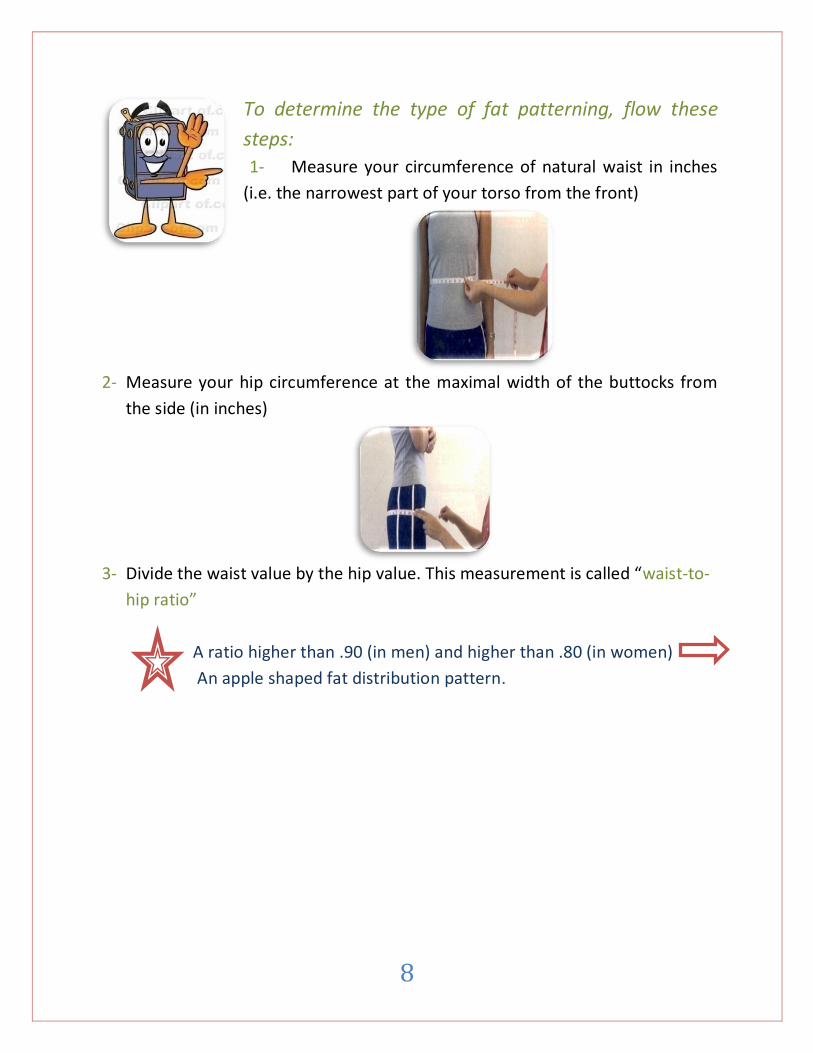
To determine the type of fat patterning, flow these
steps:
1- Measure your circumference of natural waist in inches
(i.e. the narrowest part of your torso from the front)
2- Measure your hip circumference at the maximal width of the buttocks from
the side (in inches)
3- Divide the waist value by the hip value. This measurement is called “waist-to-
hip ratio”
A ratio higher than .90 (in men) and higher than .80 (in women)
An apple shaped fat distribution pattern.

9
In addition, waist circumference alone can indicate the risk for chronic
disease:
Indicates increased risk for chronic disease.
45 years old man, his waist circumference is 50 inches and his hips are 40
inches: calculate his hip-to-waist ratio?
Waist-to-hip ratio= 50
40 = 1.2
What type of fat patterning does he have?
Apple-shaped fat distribution patterning
Is he in risk for chronic disease? Why?
Yes, because he has an apple-shaped fat pattern and also his waist
circumference is above 40 inches.
EXERCISE ( 3):
- Calculate your waist-to-hip ratio?
- What type of fat patterning do you have?
- Are you at risk for chronic disease?
waist circumference > 35 inches (88 cm)
Female waist circumference > 40 inches (102 cm)
Male

10
To achieve or maintain a healthy body weight you must pay more attention to
the important concept of ENERGY BALANCE. When the energy intake (in the
form of food and beverages) equals the energy expended (through basal
metabolism and physical activity) this means energy is balanced.
𝑒𝑛𝑒𝑟𝑔𝑦 𝑖𝑛𝑡𝑎𝑘𝑒 = 𝑒𝑛𝑒𝑟𝑔𝑦 𝑒𝑥𝑝𝑒𝑛𝑑𝑖𝑡𝑢𝑟𝑒
The figure below shows how your weight changes when you change
either side of the equation.
Energy Balance

11
The figure below shows the component of energy intake and
expenditure in details
Energy intake: Energy intake is equal to the amount of energy in the food we eat each day.
This value includes all foods and beverages and expressed as kilocalories
per day (Kcal/day). The energy content of each food is comes from:
Carbohydrates
• provides 4 Kcal/g
Protein
• provides 4 Kcal/g
Fat
• provides 9 Kcal/g
Alcohol
• provides 7 Kcal/g

12
One cup of oatmeal contains 6 gm of protein, 25 gm of carbohydrates and 2 gm
of fat. Calculate the total energy content of this oatmeal?
Kcal from protein= 6×4= 24 kcal
Kcal from carbohydrates= 25×4= 100 kcal
Kcal from fat= 2×9= 18 kcal
Total kcal for 1 cup of oatmeal= 24+100+18= 142 kcal
Exercise (4): Determine the caloric contribution of the fat, carbohydrate and protein content of the following snack foods?
Potato chips pretzels (20 chips contains: 10 g fat, (17 pieces contains: 0 g fat, 15 carbohydrates and 2 g 24 carbohydrates and 3 g Protein) protein)
Which snack is lower in total calorie? .................................. Which snack is lower in fat calories? ……………………………

13
Energy Expenditure: Energy expenditure (also known as energy output) is the energy our body
expends to maintain its basic functions and to perform all levels of
movement and activity. The body uses energy for three general purposes:
basal metabolism, thermic effect of food, energy cost of physical activity
and a fourth minor form of energy output known as thermogenesis.
1) Basal Metabolism: basal metabolic rate is expressed as BMR and it
represents the energy the body expends to maintain its
fundamental physiologic functions at rest. These
functions include respiration, beating of the heart,
maintaining body temperature, synthesis of new cells and
tissues and other functions. The majority of our energy output each day
(about 60-75%) is a result of our BMR.
To estimate the BMR for one hour:
The body weight (kg) × 1 kcal/kg of body weight/hour (in men)
The body weight (kg) × 0.9 kcal/kg of body weight/hour (in women)
To estimate the BMR for one day:
The body weight (kg) × 1 kcal/kg of body weight/hour × 24 (in men)
The body weight (kg) × 0.9 kcal/kg of body weight/hour × 24 (in women)
you can know the number of grams of nutrients and energy content of a given food by using food
composition tabels or computrized dietary analysis programs (will be discussed indetails later)
14
Assume a man weigh 79.5 kg; calculate his BMR for 24 hours?
BMR for the total day= 79.5 kg × 1 kcal/kg of body weight/hour × 24 hour =
1909 kcal/day
Exercise (5): Calculate your BMR per day?
2) The energy cost of physical activity(PA): it is the energy that is expended on
body movement and muscular work above basal levels. It
represents about 15-35% of our total energy output each
day. (i.e. It represents calorie used for total body cell
metabolism above what is needed during rest).
This Table shows the energy expenditure by usual level of activity:
Activity level % of basal metabolism calories
Inactive: sitting most of the day; less than 2 hours of moving about slowely
or standing 30%
Average: sitting most of the day; walking or standing 2 to 4 hours, but no
strenuous activity 50%
Active: physically active 4 or more hours each day; little sitting or standing;
some physically strenuous activites 75%
15
Calculate the energy cost of physical activity for preceding example if you know
that he is inactive?
The total energy cost of physical activity= BMR×30%= 1909×(0.3)= 572.7 kcal
Exersise(6): Calulate your energy cost of physical activity?
3) The Thermic Effect of Food (TEF): (also called dietary thermogenesis) is the
energy we expend as a result of processing the food we eat. A
certain amount of energy is needed to digest, absorb, transport,
metabolize and store the nutrients we eat. TEF is estimated as
10% of the sum of basal metabolic rate and usual physical
activity calories.
4)
Calculate dietary thermogenesis required for the preceding example?
Dietary thermogenesis= 10% × ( BMR + PA)= 0.1×(572.7+1909)= 248.17 kcal
Exercise(7): Calculate your dietary thermogenesis?
16
4) Thermogenesis: some additional energy is spent when a person adapt to
dramatically changed circumstances (adaptive thermogenesis). When the
body has to adapt to physical conditioning, extreme cold, starvation, trauma,
or other types of stress, it has extra work to do, building tissues and
producing the enzymes and hormones necessary to cope with the demand.
Because this component of energy expenditure is so variable and specific to
individuals, it is not included when calculating energy requirements.
There are different equations to estimate total daily need for calories. One of
these is equivalent to the sum of calories used for basal metabolism, physical
activity and dietary thermogenesis.
Calculate the estimated energy requirements for the preceding example?
Exercise(8): Calculate your total energy requirements?
Estimation of Total Energy Requirements
BMR
(1909)
PA
(572.7)
TEF (248.17
)
TOTAL CALORIE
NEED
(2729.87 kcal)

17
1) Thompson, J. and Manore, M. (2009): Nutrition an applied approach.
Second edition. Pearson Benjamin cummings. USA.
2) Wardlaw, G. and Smith, A. (2009): Contemporary Nutrition. Seventh
edition. McGrowHill.USA.
3) Brown, J. (2008): Nutrition Now. Fifth edition. Thomson Wadsworth.
4) Whitney, E. and Rolfes, S.R. (2005): Understanding nutrition. Tenth edition.
Thomson Wadsworth publisher.
Wardlaw, G. and Smith, A. (2009): Contemporary Nutrition. Seventh
edition. McGrowHill.USA. (chapter 7) How the number of calories in a
certain food is determined with a bomb calorimeter instrument
Thompson, J. and Manore, M. (2009): Nutrition an applied approach.
Second edition. Pearson Benjamin cummings. USA.(chapter 11)
various methods for the determination of body composition.
هكتبت العبيكاى. الطبعت األولي. تخطيط الوجباث الغذائيت: (2004)عويضت، عصام بي حسي .
. طزق أخزى لتقذيز إجوالي إحتياجاث الطاقت الكليت (الفصل التاسع)
• substract 500 kcal from your total energy requirementsif you are obese
• add 500 kcal for your total energy requirementsif you are
underweight
Refrences:
Further Reading:

18
Objectives:
Food Composition Tabels and Computerized Dietary Analysis Programms
to collect
data about
dietary intake by
using 24- hour recall
to analyze and calculate total
energy and nutrients of a diet
by using food composition tabels and computer
programms
to compare nutrient intake with standards

19
They are tables that provide information about nutrients and energy content of
foods.
They are based on average values from a number of samples analyzed in the
laboratory
It’s used to estimate the quantity of daily intake of nutrients and energy. To
achieve that; you must follow the following steps:
Food Composition Tabels
1 •Know the type and quantity of foods daily consumed
2 •Estimate of energy and nutrients found in food consumed
3•Compare nutrients intake with standards (recommended
dietary allowance)

20
Step one: There are different methods used to collect data about a person’s dietary intake.
One of the easiest methods is the 24-hour dietary recall. This method requires
individuals to remember the specific foods and drinks consumed, the methods of
preparation and the amount eaten in the past 24 hours.
Below is an example of filled 24-hour recall form for a 25 years old female:
meal Food type and description quantity
breakfast Fried egg
Brown bread (toasted) Fresh Orange juice
2 peaces 2 slices 1 cup
Snack
Apple with peal (2.75 diam)
0.5 peace
lunch
Cooked Rice Spinach Fried breast chicken
.75 cup 0.5 cup 1 peace
snack Chocolate milk shake 1 cup
dinner
Big Mac (from MacDonald’s) French fries
1 peace 20 peaces
snack Low fat yogurt with fruits o.5 cup
Use food models to aid in estimating the quantity of food
consumed
21
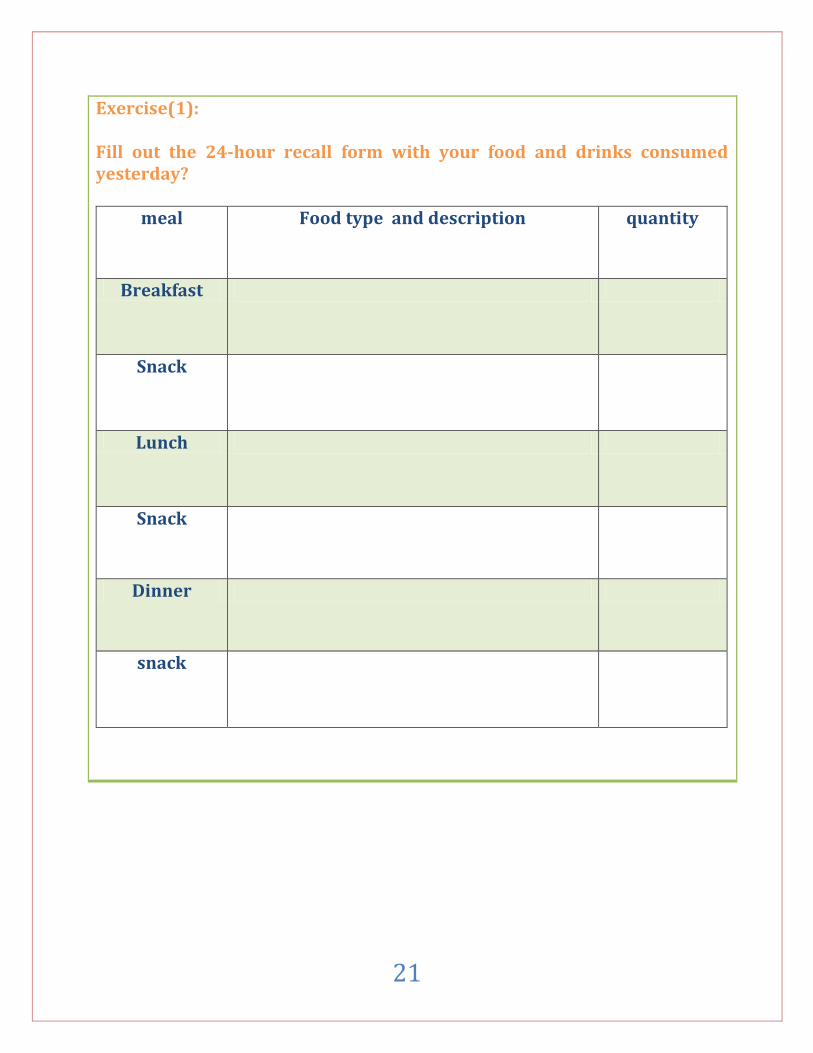
Exercise(1): Fill out the 24-hour recall form with your food and drinks consumed yesterday?
meal Food type and description quantity
Breakfast
Snack
Lunch
Snack
Dinner
snack

22
Step two:
After gathering information about dietary intake it can be analyzed by using food
composition tables to estimate total energy and nutrient intake or computerized
dietary programs.
To analyze the fried eggs consumed by the female(by food composition tables):
1. Look for PAGE KEY in the food composition table (Appendix A) until you
found [A-10= Eggs].
That means go to page A-10 to find where the eggs are analyzed.
(Note: if you did not found fried eggs in that page go to the next page)
2. Under cooked you will find (fried in margarine).
The values are for 1 egg and she consumed 2. Thus, you must multiply all the
values by 2.
3. Record it in the nutrient analysis form.

23
Below is an example for all foods and beverages consumed by the female:
Nutrient Analysis Form
Total
Low
fat
yogu
rt w
/fruit
French
fries
Big M
ac
Ch
oco
latmil
k shake
Fried b
reast ch
icken
Spin
ach
Co
oked
rice
Ap
ple
w/p
eal (2.75d
iam)
Oran
ge juice
(fresh
)
Bro
wn
b
read
toa
sted
Fried eggs
Nam
e
A-10
2001
A-54
5139
A-72
6901
0
A-10
2020
A-36
1505
7
A-56
5147
A-26
38013
A-14
3000
A-18
3090
A-22
42029
A-12
1950
9
Page &
co
mp
ute
r cod
e n
o.
0.5 cup
20 peace
1 peace
1 cup
1 peace
0.5 cup
0.75 cup
o.5
peace
1 cup
2 peaces
2 peaces
Qu
antity
2224.75
125
332
590
211
322
21
153.75
36
112
138
184
Energy
(kcal)
124
5.5
4
24
6
58
3 3
<0.5
2 6
12
Pro
tein
(gm)
245.75
23.5
40
47
34
1 3
33.75
9.5
26
26
<2
Carb
.
(gm)
19.25
0 4 3 3 0 2
5.75
1.5
<1
4 0
Fiber
(gm)
86.75
1.5
18
34
6 8
<1
<0.75
<0.5
<1
2
14
Total fat
(gm)
28.525
0.85
6
11
3.8
2.2
T
0.075
T t
0.6
4
Saturate
d fat
(gm)
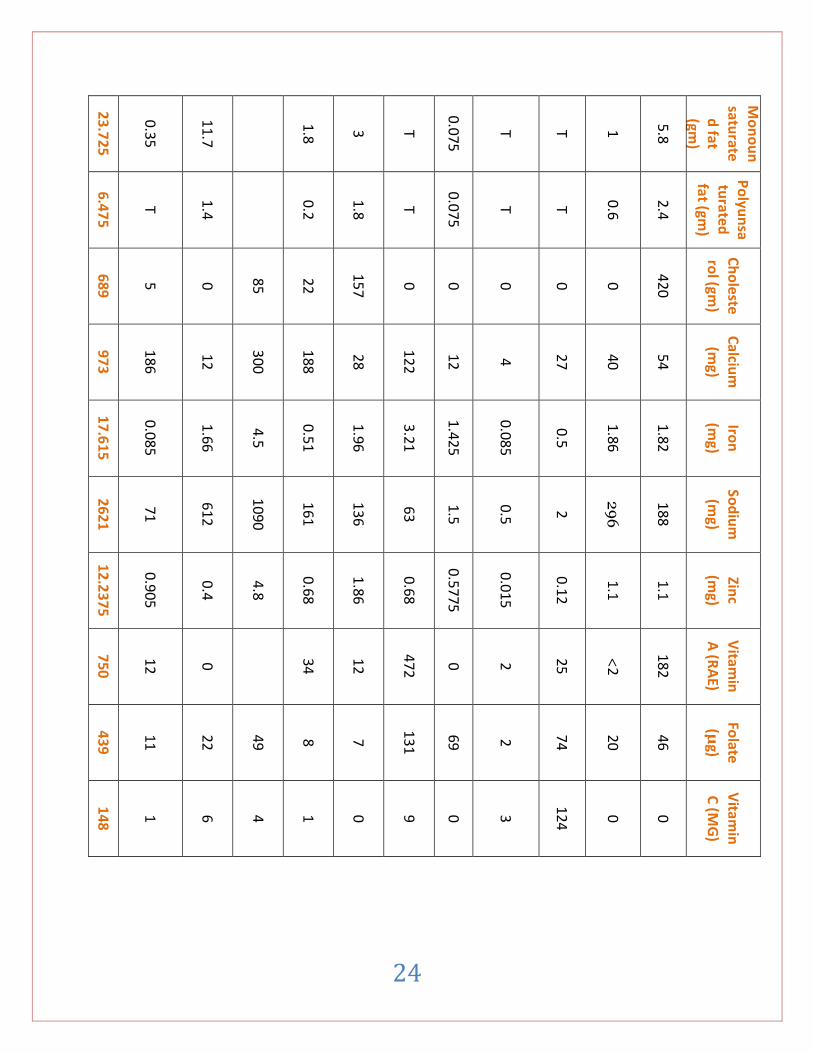
24
23.725
0.35
11.7
1.8
3 T
0.075
T T 1
5.8
Mo
no
un
saturate
d fat
(gm)
6.475
T
1.4
0.2
1.8
T
0.075
T T
0.6
2.4
Po
lyun
satu
rated
fat (gm)
689
5 0
85
22
157
0 0 0 0 0
420
Ch
oleste
rol (gm
)
973
186
12
300
188
28
122
12
4
27
40
54
Calciu
m
(mg)
17.615
0.085
1.66
4.5
0.51
1.96
3.21
1.425
0.085
0.5
1.86
1.82
Iron
(mg)
2621
71
612
1090
161
136
63
1.5
0.5
2
29
6
188
Sod
ium
(mg)
12.2375
0.905
0.4
4.8
0.68
1.86
0.68
0.5775
0.015
0.12
1.1
1.1
Zinc
(mg)
750
12
0 34
12
472
0 2
25
<2
182
Vitam
in
A (R
AE)
439
11
22
49
8 7
131
69
2
74
20
46
Folate
(μg)
148
1 6 4 1 0 9 0 3
124
0 0
Vitam
in
C (M
G)

25
Exercise (2): Analyze your food and drinks consumed yesterday by using food composition tables?
total
Nam
e
Page &
com
pu
ter co
de
no
.
Qu
antity
Energy
(kcal)
Pro
tein
(gm)
Carb
. (gm
)
Fiber
(gm)
Total fat
(gm)
Saturate
d fat
(gm)
Mo
no
un
saturate
d fat
(gm)

26
Po
lyun
satu
rated
fat (gm)
Ch
oleste
rol (gm
)
Calciu
m
(mg)
Iron
(m
g)
Sod
ium
(m
g)
Zinc
(mg)
Vitam
in
A (R
AE)
Folate
(μ
g)
Vitam
in
C (M
G)
Also you can analyze your foods by using computerized dietary analysis
programs.

27
Step Three:
Now compare nutrient intake with standards such as recommended dietary
allowance (RDA) which reflects the average daily amount of nutrient considered
adequate to meet the needs of most healthy people.
If there is insufficient evidence to determine DRA, an adequate intake (AI) is
set. AI are more tentative than RDA, but both may be used as for nutrient
intake.
Appendix C contains recommended Dietary Allowances (RDA) and adequate
intakes tables. These tables are divided according to different age groups.
• if the person intake was from(70-200%) of dtandards
• the person meet the needs for 1 day
• if the intake was < 70% of standards
• there is deficiency of requaired nutrient
• if the intake was > 200% of standards
• there is over consumption of required nutrient

28
Compare the nutrient intake for the preceding example?
energy Pro. Carb. Fibe
r Ca iron Na zinc Vit.A
Folate
Vit.C
Nutrie-nt
intake 2224.7 124 245.7 19.2 973 17.61 2621
12.23
750 439 148
Standa-rds
(RDA OR AI)
2403 46 130 25 1000 18 1500 8 700 400 75
% (
𝒊𝒏𝒕𝒂𝒌𝒆
𝒔𝒕𝒂𝒏𝒅𝒂𝒓𝒅
×100)
92.58%
269.5%
189.0%
77% 97.3
% 98.06
% 174.7
% 152.97%
107.14%
109.75%
197.33%
Evaluat-ion
Adequ-ate
intake
More than requi-red
Adequate intake
Comm-ent
This female should lower her protein intake
Exercise(3): Evaluate your nutrients intake?
energy Pro. Carb. Fiber Ca iron Na zinc Vit.A Folate Vit.C
Nutrie-nt
intake
Standa-rds
(RDA OR AI)
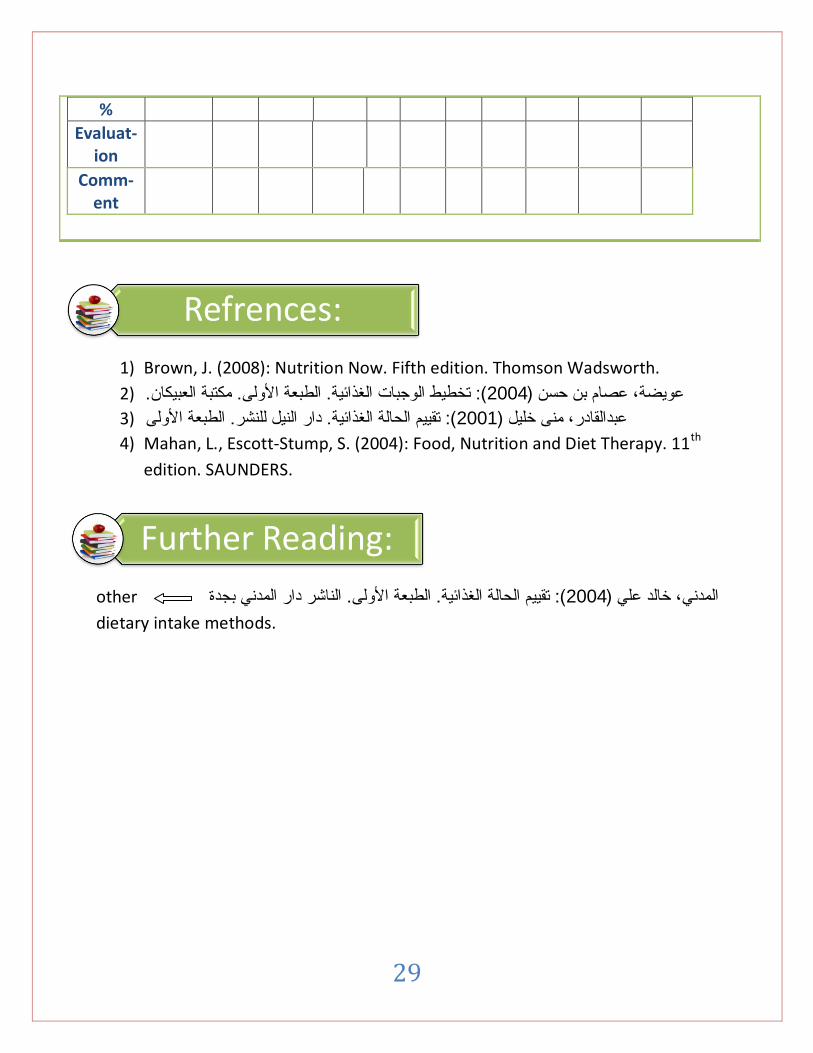
29
%
Evaluat-ion
Comm-ent
1) Brown, J. (2008): Nutrition Now. Fifth edition. Thomson Wadsworth.
.هكتبت العبيكاى. الطبعت األولي. تخطيط الوجباث الغذائيت: (2004)عويضت، عصام بي حسي (2
الطبعت األولي. دار الٌيل للٌشز. تقيين الحالت الغذائيت: (2001)عبذالقادر، هٌي خليل (3
4) Mahan, L., Escott-Stump, S. (2004): Food, Nutrition and Diet Therapy. 11th
edition. SAUNDERS.
otherالٌاشز دار الوذًي بجذة . الطبعت األولي. تقيين الحالت الغذائيت: (2004)الوذًي، خالذ علي
dietary intake methods.
Refrences:
Further Reading:

30
Healthy diet
It is a diet that provides the proper combination of energy and nutrients. It
requires only some simple planning and doesn’t have to mean deprivation and
misery. The BEST PLAN consists of learning the six basic diet-planning principles
and the three tools (dietary guidelines, food labels and My pyramid).
Planning a Healthy Diet
PrinciplesAdequacy
Balance
Energy Control
Nutrient Density
Moderation
Variety
ToolsDietary guidlines
Food labeling
My Pyramide

31

32

33

34
Objectives:
1. Adequacy: Adequate diet means that the diet provides sufficient energy and enough of all the
nutrients to meet the needs of healthy people. Sufficient energy intake will
maintain healthy body weight. For nutrients, sufficiency corresponds to intakes
that are in line with recommended intake levels represented by the RDA or AI.
A diet may be inadequate if for example people eat plenty of breads,
meats, fruits and dairy products but do not eat enough vegetables. Thus, their
intake of many of the important nutrients found in vegetables (such as fiber, beta-
carotene, and potassium) is likely to be inadequate.
2. Balance: Balance diet involves consuming enough- but not too much- of each
type of food. That means not over consuming any single type of
food.
Diet Planning Principles
to know what does each principle mean
1to know how to apply these principles in planning a healthy diet
2to evaluate the nuteient density of foods
3

35
3. Energy control: Means management of food energy intake
Energy density: is a comparison of the calorie (Kcal) content of a food with the
weight of the food.
to balance
your diet
1 way
select foods from the
Each day
• grains
• vegetabels
• fruits
• milk
• meat and beans
5 food groups
balance in the diet helps to ensure adequacy
the key to energy control
is to select foods
low in energy density
ener
gy-d
ense
foo
ds
• high in calories but weighs very little low
en
ergy
-d
ense
fo
od
s
• has few calories but weighs alot
Remember energy balance
36
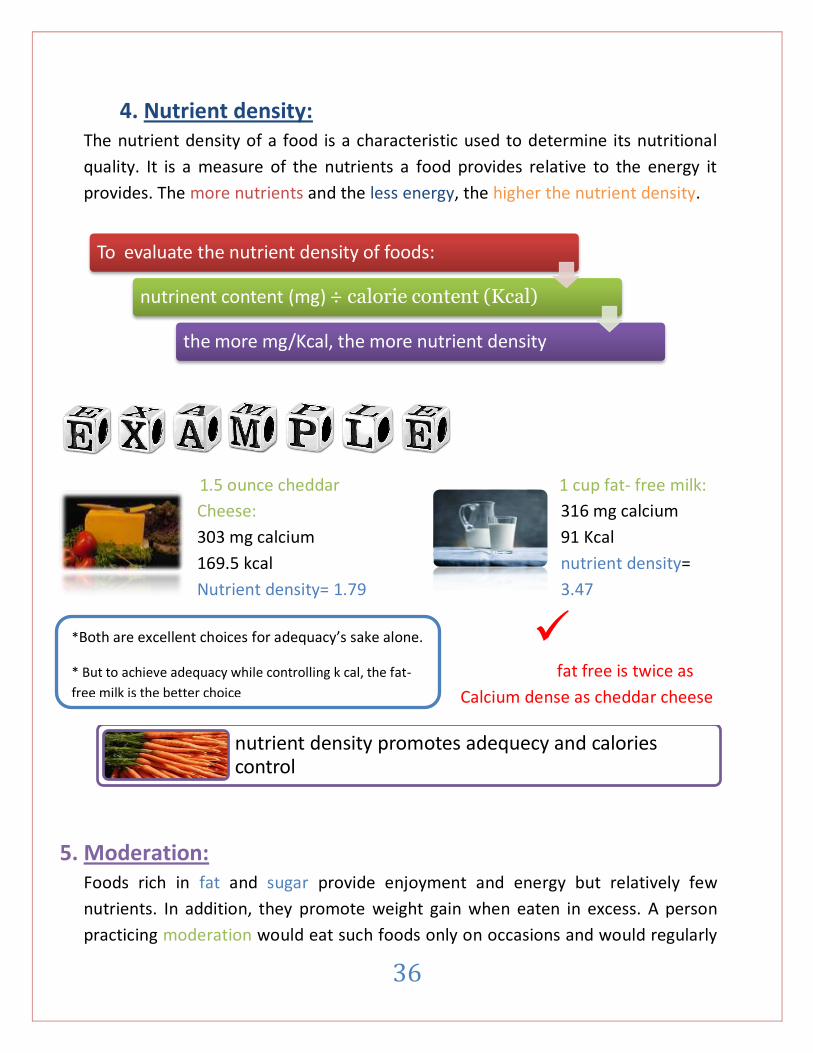
4. Nutrient density: The nutrient density of a food is a characteristic used to determine its nutritional
quality. It is a measure of the nutrients a food provides relative to the energy it
provides. The more nutrients and the less energy, the higher the nutrient density.
1.5 ounce cheddar 1 cup fat- free milk:
Cheese: 316 mg calcium
303 mg calcium 91 Kcal
169.5 kcal nutrient density=
Nutrient density= 1.79 3.47
fat free is twice as
Calcium dense as cheddar cheese
5. Moderation: Foods rich in fat and sugar provide enjoyment and energy but relatively few
nutrients. In addition, they promote weight gain when eaten in excess. A person
practicing moderation would eat such foods only on occasions and would regularly
To evaluate the nutrient density of foods:
nutrinent content (mg) ÷ calorie content (Kcal)
the more mg/Kcal, the more nutrient density
nutrient density promotes adequecy and calories control
*Both are excellent choices for adequacy’s sake alone.
* But to achieve adequacy while controlling k cal, the fat-
free milk is the better choice

37
select foods low in fat and sugar, a practice that automatically improves nutrient
density.
Returning to the previous example of cheddar cheese and fat-free milk, the fat-
free milk not only offers the same amount of calcium for less energy, but it
contains far less fat than the cheese.
6. Variety: Variety in your diet means choosing a number of different foods within any given
food group rather than eating the “same old thing” day after day.
A variety of foods is best because no one food meets all your nutrient needs.
Strawberry and apricots both are from the fruit group but
moderation contributes to adequecy, balance and energy control
• rich in vitamin C • rich in vitamin A

38
A variety makes meals more interesting and help ensure that a diet contains
sufficient nutrients. As the adage goes: variety is the spice of life
1) Thompson, J. and Manore, M. (2009): Nutrition an applied approach. Second
edition. Pearson Benjamin cummings. USA.
2) Wardlaw, G. and Smith, A. (2009): Contemporary Nutrition. Seventh edition.
McGrowHill.USA.
3) Brown, J. (2008): Nutrition Now. Fifth edition. Thomson Wadsworth.
4) Whitney, E. and Rolfes, S.R. (2005): Understanding nutrition. Tenth edition.
Thomson Wadsworth publisher.
Refrences:

39
Dietary Guidelines for Americans 2005: The USDA and U.S. department of health and human
services (DHNS) have published dietary guidelines for
Americans since 1980 to aid diet planning. The latest
version of the dietary guidelines was published in 2005
and it identifies both food choices and physical activity
habits that can help reduce our risk for chronic diseases.
They are grouped into nine group topic.
Adequate nutrients within energy needs
Consume a variety of nutrient-dense foods and beverages within and among the basic food groups; limit intakes of saturated and trans fats, cholesterol, added sugars, salt, and alcohol
Meet recommended intakes within energy needs by adopting a balanced eating pattern
Diatry Guidlines
objectives:
• to know the nine group topic in the guidlines
• to know the how to apply it in planning a healthy diet
40
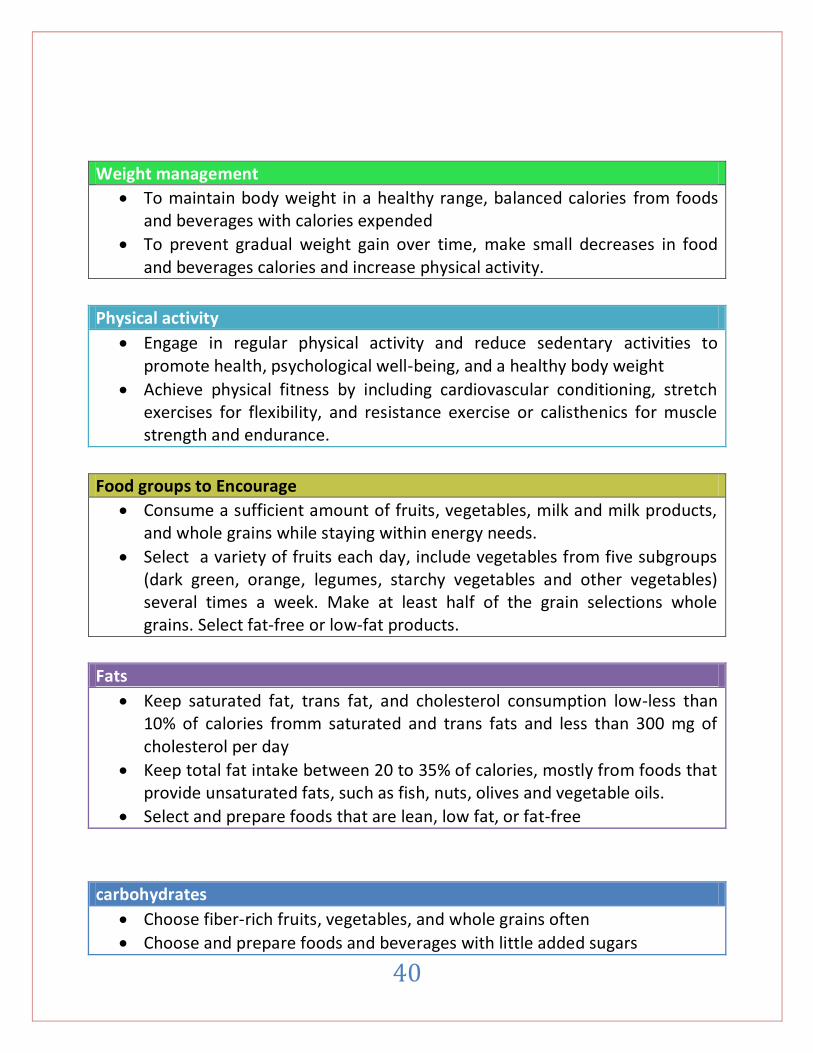
Weight management
To maintain body weight in a healthy range, balanced calories from foods and beverages with calories expended
To prevent gradual weight gain over time, make small decreases in food and beverages calories and increase physical activity.
Physical activity
Engage in regular physical activity and reduce sedentary activities to promote health, psychological well-being, and a healthy body weight
Achieve physical fitness by including cardiovascular conditioning, stretch exercises for flexibility, and resistance exercise or calisthenics for muscle strength and endurance.
Food groups to Encourage
Consume a sufficient amount of fruits, vegetables, milk and milk products, and whole grains while staying within energy needs.
Select a variety of fruits each day, include vegetables from five subgroups (dark green, orange, legumes, starchy vegetables and other vegetables) several times a week. Make at least half of the grain selections whole grains. Select fat-free or low-fat products.
Fats
Keep saturated fat, trans fat, and cholesterol consumption low-less than 10% of calories fromm saturated and trans fats and less than 300 mg of cholesterol per day
Keep total fat intake between 20 to 35% of calories, mostly from foods that provide unsaturated fats, such as fish, nuts, olives and vegetable oils.
Select and prepare foods that are lean, low fat, or fat-free
carbohydrates
Choose fiber-rich fruits, vegetables, and whole grains often
Choose and prepare foods and beverages with little added sugars

41
Reduce the incidence of dental caries by practicing good oral hygiene and consuming sugar- and starch-containing foods and beverages less frequently.
Sodium and potassium
Choose and prepare foods with less salt (less than 2300 mg sodium or approximately 1 tea spoon salt). At the same time, consume potassium-rich foods, such as fruits and vegetabels
Alcoholic beverages
Those who choose to drink alcoholic beverages should do so sensibly and in moderation.
Some individual should not consume alcoholic beverages.
Food safety
To avoid microbial food borne illness, keep foods safe: clean hands, food contact surfaces, and fruits and vegetables; separate raw, cooked, and ready-to-eat foods; cook foods to a safe internal temperature; chill perishable food promptly; and defrost food properly…
These dietary guidelines are not difficult to implement. The table below
shows recommended diet changes based on the dietary guidelines.

42
1. www.cnpp.usda.gov/Publications/DietaryGuidelines/2005/2005DGPolicyDocument.pdf -
2. Wardlaw, G. and Smith, A. (2009): Contemporary Nutrition. Seventh edition.
McGrowHill.USA.
3. Sizer, F., and Whitney, E.(2006): Nutrition Concepts and controversies.10th
edition.THOMSON WADSWORTH
Refrences:
43
Objectives:
An essential step in designing and following a healthful diet is to learn how to
read food label.
Components on food label:
Five primary components of information must be included on food labels (See the
figure below):
1. A statement of identify:
The common name of the product or an appropriate identification of the food
product must be prominently displayed on the label. This information tells us
very clearly what the product is.
2. The net content of the package:
The quantity of the food product in the entire package must accurately describe.
Information may be listed as weight (e.g., grams), value (e.g. fluid ounces), or
numerical count (e.g., 4 each)
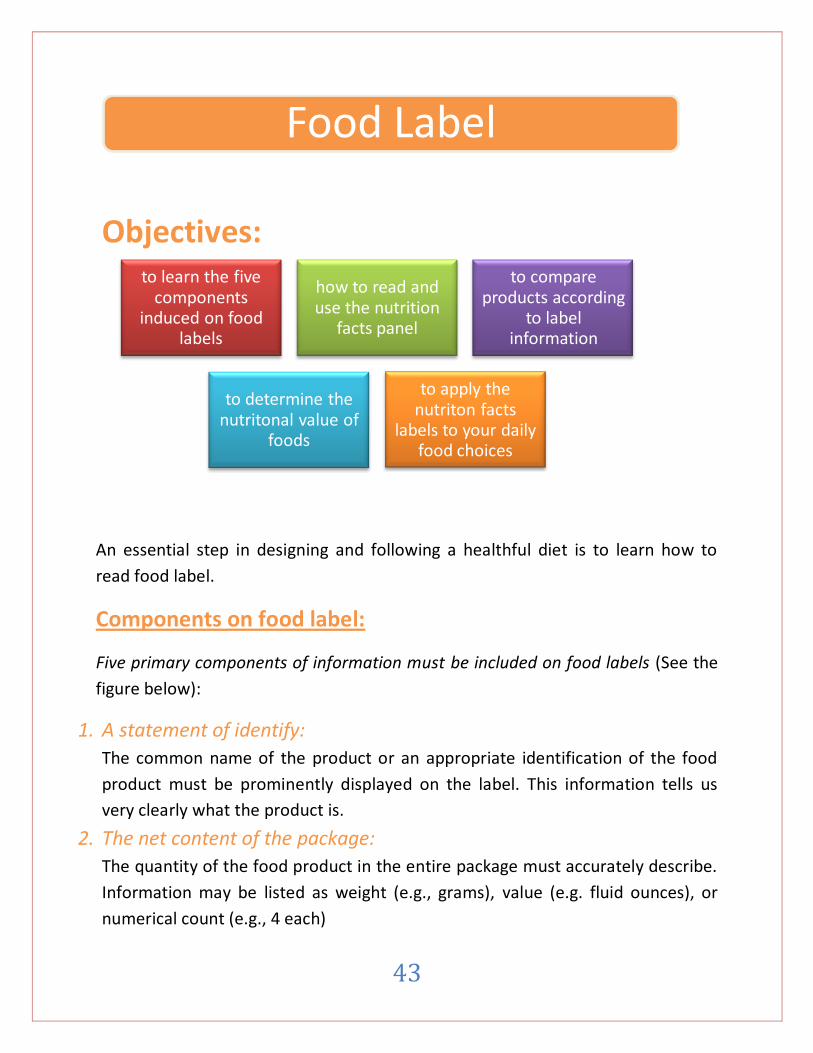
Food Label
to learn the five components
induced on food labels
how to read and use the nutrition
facts panel
to compare products according
to label information
to determine the nutritonal value of
foods
to apply the nutriton facts
labels to your daily food choices

44
3. Ingredient list:
The ingredients must be listed by their common name, in descending order by
weight. This means that the first product listed in the ingredient list is the
predominant in that food.

45
This information can be very useful when you are looking for foods that are
lower in fat or sugars, or when you are attempting to identify foods that
contain whole-grain flour instead of processed wheat flour.
The ingredient list must also clearly state the presence of any of eight
common food allergens, including peanuts, tree nuts, milk, wheat, eggs, soy,
fish and shellfish.
Which of these two products are more nutritious?
Ingredient: “sugar, citric ingredient:”water, tomato
Acid, natural flavors……” concentrate, concentrated
Juices of carrots, celery…”
Ingredient: “sugar, apples, ingredient: “apples, water”
Water”
4. The name and address of the food manufacturer, packager or
distributor:
This information can be used if you want to find out more detailed information
about a food product.
5. Nutrition information:
The nutrition facts panel contains the nutrition information required
by the FDA. This panel is the primary tool to assist you in choosing
more healthful foods.
46
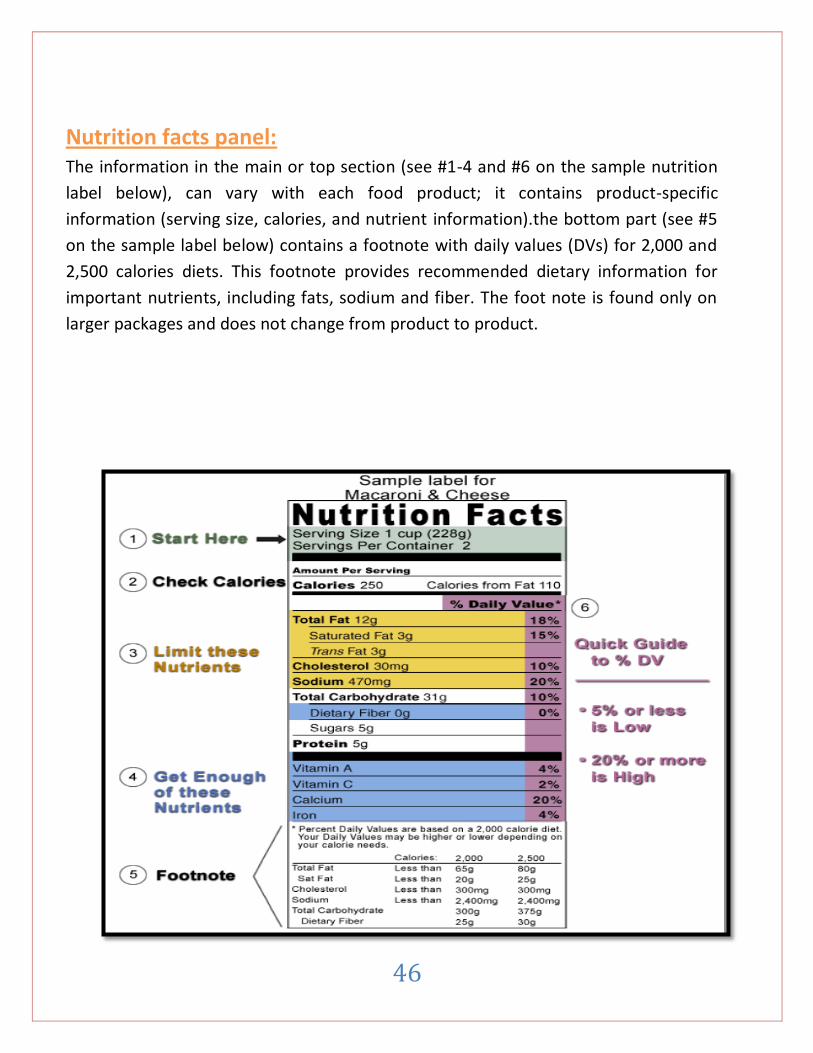
Nutrition facts panel: The information in the main or top section (see #1-4 and #6 on the sample nutrition
label below), can vary with each food product; it contains product-specific
information (serving size, calories, and nutrient information).the bottom part (see #5
on the sample label below) contains a footnote with daily values (DVs) for 2,000 and
2,500 calories diets. This footnote provides recommended dietary information for
important nutrients, including fats, sodium and fiber. The foot note is found only on
larger packages and does not change from product to product.

47
1. The serving size:
The first place to start when you look at the nutrition
Facts Label is the serving size.
Serving sizes are standardizes to make it easier to compare similar foods.
They are provided in familiar units, such as cups or peaces, followed by the metric
amount, e.g., the number of grams.
Pay attention to the serving size, especially how many servings there are in the
food package.
Then, ask your self, “how many servings am I consuming”? (e.g. 0.5 serving, 1
serving or more)
In the sample label, if you consume the whole package that means how many
servings did you consume?
2 servings (228 g ×2= 456 g)
2. Calories ( and calories from fat):
Calories provide a measure of how much
energy you get from a serving of this food.
It can help you manage your weight (i.e. gain, lose or maintain).
In the preceding example, there are 250 calories in 1 serving of the macaroni and
cheese. How many calories you will get if you consume 114 g?
114g = 0.5 serving= 125 calories ( 55 from fat).

48
3 and 4. The nutrients:
It shows you some key nutrients that impact on your health and separates then into
two main groups:
If you consume 0.5 serving how many grams of fat, Trans fat, and cholesterol you will
be provided?
6 Gm fat, 1.5 g saturated fat, 1.5 g is Trans fat and 15 g cholesterol.
5. The percent daily value (%DV):
The daily values reflect dietary recommendations for nutrients and dietary
components that have important relationships with health. The “%Daily Value” column
on a label provides a ballpark estimate of how individual foods contribute to the total
diet. It compares key nutrients in a serving of food with the daily goals of a person
consuming 2000 kcalories.
Even if you do not consume 2000 calories each day, you can still use the %
DV to figure out whether a food is high or low in a given nutrient.
the nutrients
limit these nutrients
eating too much fat, trans fat,
cholesterol, or sodium may
increase your risk of certain chronic
diseases
get enough of these
eating enough of these nutrients
can improve your health and reduce the risk of some
diseases and conditions
< 5% DV of a nutrient
• low in that nutrient
10-19% DV of anutrient
• Good source
> 20%DV of a nutrient
• high in that nutreinet

49
In the preceding example, 12 grams of fat constitutes 18%
of an individual’s total daily recommended of fat intake. (
18%DV means it is not high in fat but 36% means high in fat)
* 470 mg of sodium constitutes…………. Of total daily
recommended of sodium intake.
* 60 mg of cholesterol constitutes………….. Of total daily
recommended of cholesterol intake
6. Food note (or the lower part of panel):
Includes a foot note that must be present on all food
labels. This footnote tells you that the %DV are based on
a 2000 calories diet and that your needs may be higher
or lower based on your caloric needs. The reminder of
the footnote includes a table with values that illustrate
the deference’s in recommendation between a 2000
calorie and 2500 calorie diet.
Someone eating 2000 calories diet should strive to eat less than 65 gm of fat per day,
whereas a person eating 2500 calories should eat less than 80 gm of fat per day.
Nutrient-Claims:
Have you noticed phrases such as “good source
of fiber” on a box of a cereal or “rich in calcium” on a package of cheese?
These and other nutrient claims may be used on labels as long as they meet FDA
definitions. See the table below for these definitions.
Nutrient claim is a statement that
characterize the quantity of a nutrient
in a food
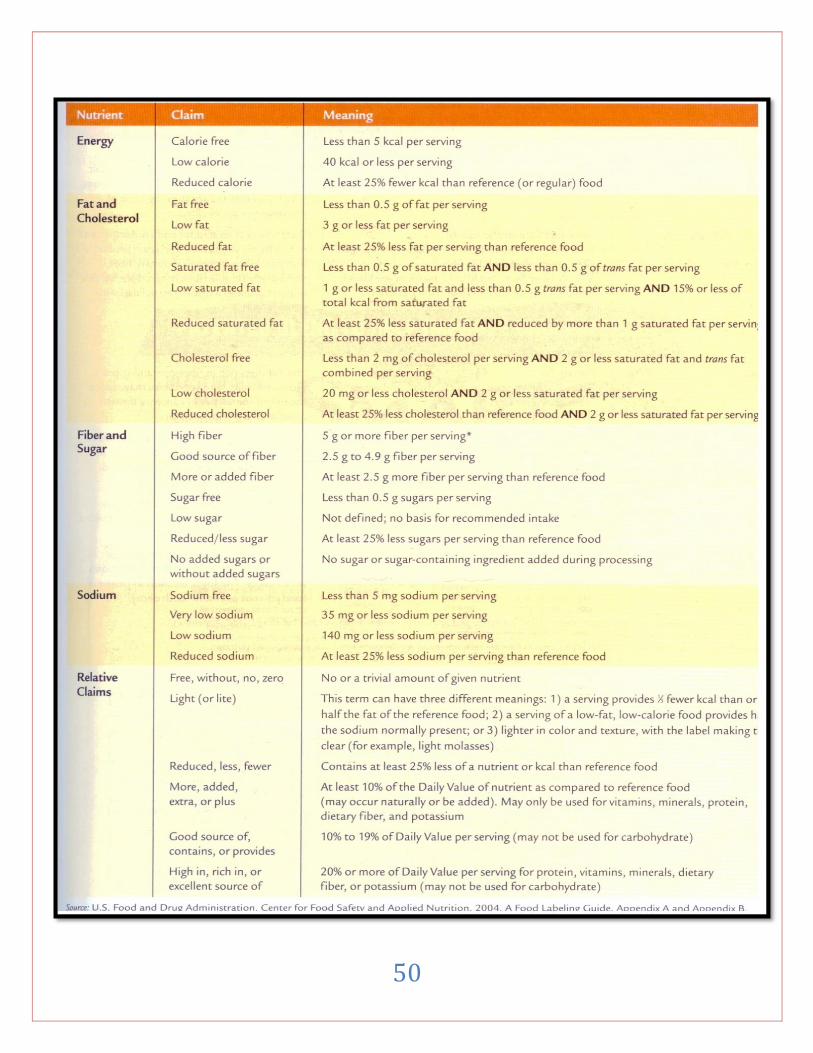
50

51
Health claims:
On approval by FDA, foods or food components with scientifically
Agreed –upon benefits to disease prevention can be labeled with a
Health claims. The table below shows U.S. food and drug
Administration-approved health claims on label.
Health claims are
statements that
characterize the
relationship between
a nutrient or other
substance in a food
and a disease or
health-related
condition

52
Exercise(1): Rate the nutrition value of these 2 cereals by completing the table below using the information from the nutrition facts panel.
Whole-grain cereal Health granola cereal
Provides…………….calories/serving
Contributes……………calories from fat ( or ……..% of the %DV)
Each serving also provides………mg of Na (or ……….% of the %DV), …….gm of dietary fiber ( or ……….% of the %DV), and …… gm of sugars.
Provides…………….calories/serving
Contributes……………calories from fat ( or ……..% of the %DV)
Each serving also provides………mg of Na (or ……….% of the %DV), …….gm of dietary fiber ( or ……….% of the %DV), and …… gm of sugars.
*which cereal provides the better nutritional value?
exercise (2): these pretzels are low in sodium
o True o false

53
Exercise(4): If you love desserts but you’re concerned about your calorie intake; which of these is lower in calories: Half the container of the whole container of low fat Low fat blueberry frozen yogurt cherry yogurt
Exercise(3): Below are two kinds of milk. One is “reduced fat”, the other is “non-fat” milk. Which one has more calcium? Which has more calories and saturated fats?
Reduced fat Non- fat
54
1) Thompson, J. and Manore, M. (2009): Nutrition an applied approach. Second edition.
Pearson Benjamin cummings. USA.
2) www.cfsan.fda.gov
3) Whitney, E. and Rolfes, S.R. (2005): Understanding nutrition. Tenth edition. Thomson
Wadsworth publisher.
To read about:
- Enriched or fortified food labeling - food additives on the label
- Dietary supplements labeling - structure-function claims
- irradiated foods labeling - organic foods labeling
Brown, J. (2008): Nutrition Now. Fifth edition. Thomson Wadsworth : (unit 4)
References:
Further Reading:
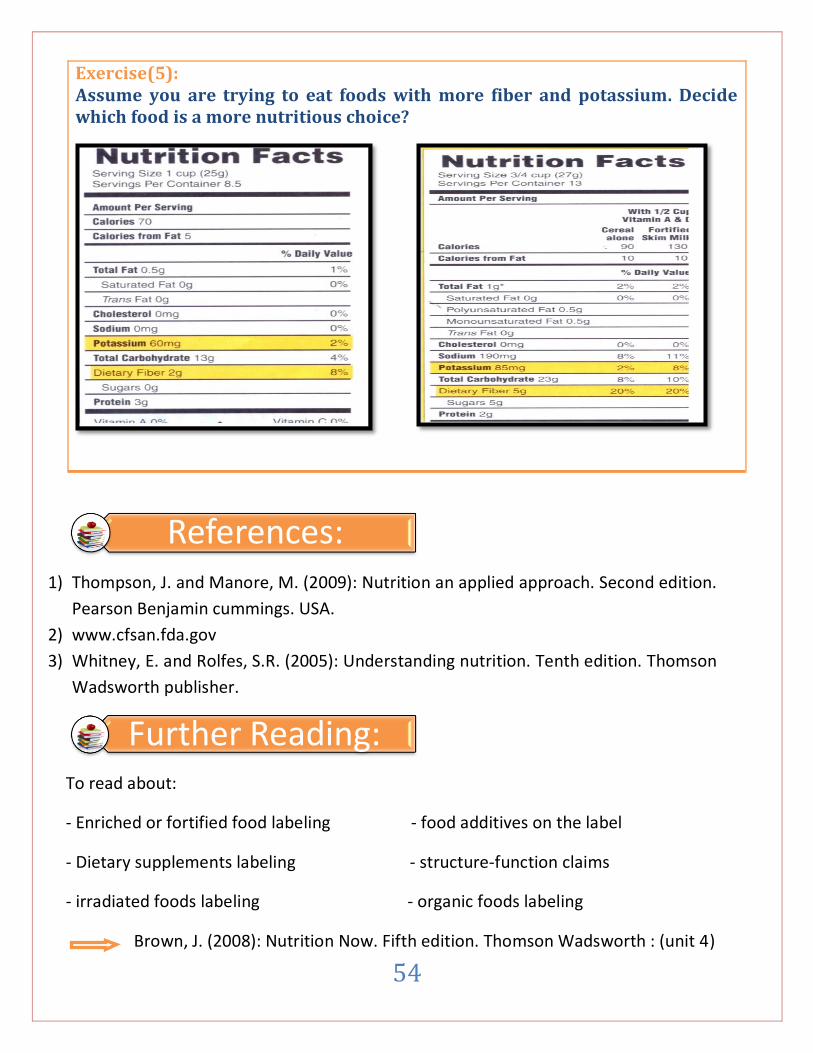
Exercise(5): Assume you are trying to eat foods with more fiber and potassium. Decide which food is a more nutritious choice?

55
Objectives:
The U.S. department of Agriculture (USDA) food guide pyramid is another tool that
can guide you in designing a healthful diet. It was created to provide a conceptual
framework for the types and amounts of foods that make up a healthful diet.
The USDA simplified the nutrition recommendation by the mid-1950 s to a four food
group plan: milk group, meat group, fruit and vegetables group and bread and cereal
group.
In 1992 this plan was illustrated using a pyramid (i.e., food
guide pyramid)
In April 2005, USDA unveiled their latest food guide plan, My
Pyramid. Replaces the food guide pyramid and provides a
more individualized approach to improving diet and lifestyle
than previous food guides.
It goals is to provide advice that will help us live longer,
better, and healthier lives.
My Pyramid
to learn about MyPyramid in
details
to apply MyPyramid in diet planning
to know your recommended no. of servings from each food group according
to your EER
how to translate your recommendations into food
examples
how to distribute food examples into
meals

56
The My Pyramid symbol represents the recommended proportion of foods from each
food group to create a healthy diet. Physical activity is a new element in the pyramid.
My Pyramid is designed to illustrate personalization, gradual improvement, activity,
variety, proportionality, and moderation. These concepts are explained in the figure
below.
The Anatomy of MyPyramid

57
The consumer messages below have been developed by the USDA to help you navigate
My Pyramid and to aid you in your diet planning.
Consumer Messages

58
To put My Pyramid into action:
step one:
You need to estimate your calorie needs (see chapter 1).
Exercise(1): Write your estimated energy requirements
step two:
Now use the table to discover how that calorie allowance corresponds to the
recommended number of servings from each food group.
Putting My Pyramid into Action

59
A 19 years old girl, her calorie needs is 1600 calorie, what are her daily amounts of
food from each group?
calorie fruits vegetables grains Meat & beans
milk oils
1600 1.5
cups 2 cups 5 oz.eq 5 oz.eq 3 cups 5 tsp
Exercise (2): Fill the table with your recommendations
calorie fruits vegetables grains Meat & beans
milk oils
Step Three:
Translate the recommendations into food examples by using the table below
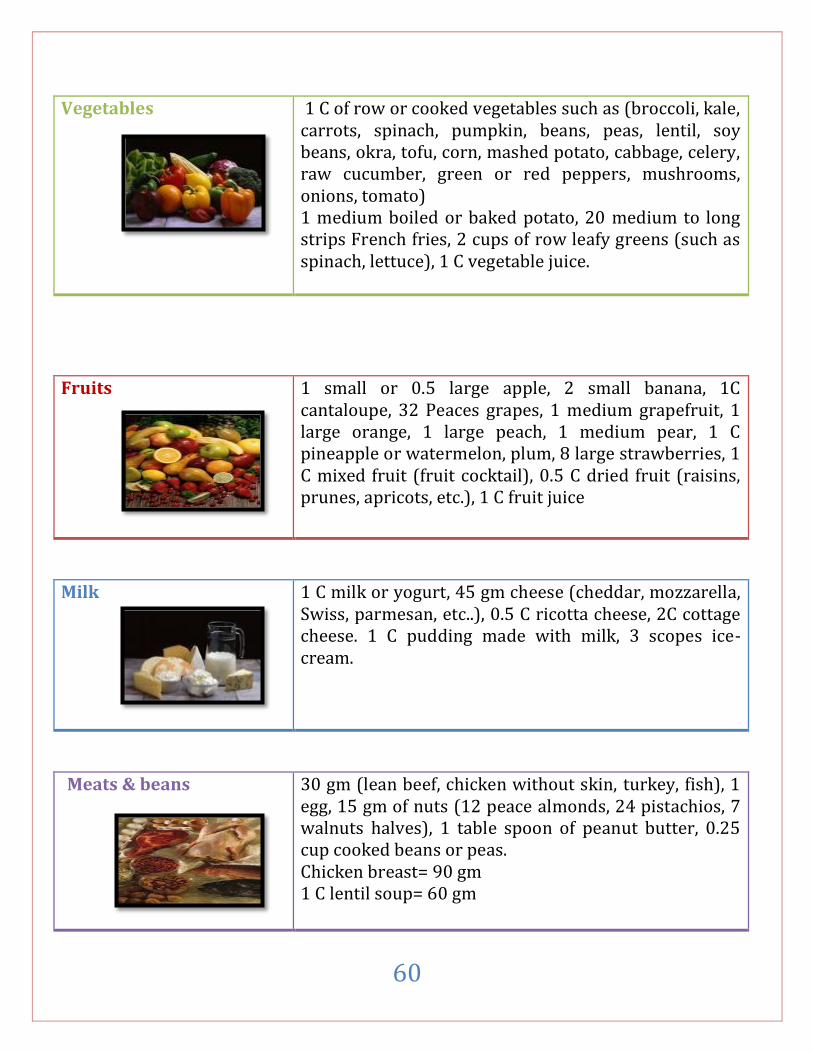
Food group Amount that counts as 1 ounce equivalent or 1 cup
Grains 1 regular slice bread, 0.5 regular hamburger bun, 1 small biscuits, 5 whole wheat or 7 refined grains
crackers, 1 small muffins, 0.5 C cooked oatmeal, 1 large pancake or 2 small, 3 C popcorn, 1 C cornflakes, 0.5 C
cooked rice or pasta, 1 small flour tortilla.
60
Vegetables
1 C of row or cooked vegetables such as (broccoli, kale, carrots, spinach, pumpkin, beans, peas, lentil, soy beans, okra, tofu, corn, mashed potato, cabbage, celery, raw cucumber, green or red peppers, mushrooms, onions, tomato) 1 medium boiled or baked potato, 20 medium to long strips French fries, 2 cups of row leafy greens (such as spinach, lettuce), 1 C vegetable juice.
Fruits
1 small or 0.5 large apple, 2 small banana, 1C cantaloupe, 32 Peaces grapes, 1 medium grapefruit, 1 large orange, 1 large peach, 1 medium pear, 1 C pineapple or watermelon, plum, 8 large strawberries, 1 C mixed fruit (fruit cocktail), 0.5 C dried fruit (raisins, prunes, apricots, etc.), 1 C fruit juice
Milk 1 C milk or yogurt, 45 gm cheese (cheddar, mozzarella, Swiss, parmesan, etc..), 0.5 C ricotta cheese, 2C cottage cheese. 1 C pudding made with milk, 3 scopes ice-cream.
Meats & beans
30 gm (lean beef, chicken without skin, turkey, fish), 1 egg, 15 gm of nuts (12 peace almonds, 24 pistachios, 7 walnuts halves), 1 table spoon of peanut butter, 0.25 cup cooked beans or peas. Chicken breast= 90 gm 1 C lentil soup= 60 gm

61
Oils
1 tsp vegetables oils (such as canola, corn, olive, peanut, soybean and sun flower), mayonnaise, salad dressing
Below are food choices for the preceding example.
Food group Amount of food Amount according
to My Pyramid
grains
2 slices brown toast bread 1 cup whole-bran cornflakes
0.5 cup cooked rice 1 slice of white bread
2 oz. 1 cup 1 cup 1 oz.
vegetables 0.5 cup cooked spinach
0.5 cup carrot juice 0.5 cup lentil soup
0.5 cup 0.5 cup 1 cup
fruits 1 small banana
0.5 cup fruit cocktail 0.5 large orange
0.5 cup 0.5 cup 0.5 cup
milk 1 cup low-fat milk
1 cup low-fat yogurt 1 cup pudding made with milk
1 cup 1 cup 1 cup
Meat &beans 45 gm lean beef
90 gm breast chicken 0.5 table spoon peanut butter
1.5 3
0.5
oils 5 tsp canola oil used during cooking 5 tsp
Beans and peas can be counted either as vegetables or in the meat group.
Generally, individuals who regularly eat meat, would count beans and peas in
the vegetable group. Individuals who seldom eat meat would count some of
the dry beans and peas in the meat group.

62
Exercise (3): Fill the table below with your food choices
Food group Amount of food Amount according
to My Pyramid
grains
vegetables
fruits
milk
Meat &beans
oils
Step Four:
Distribute food examples into meals
63
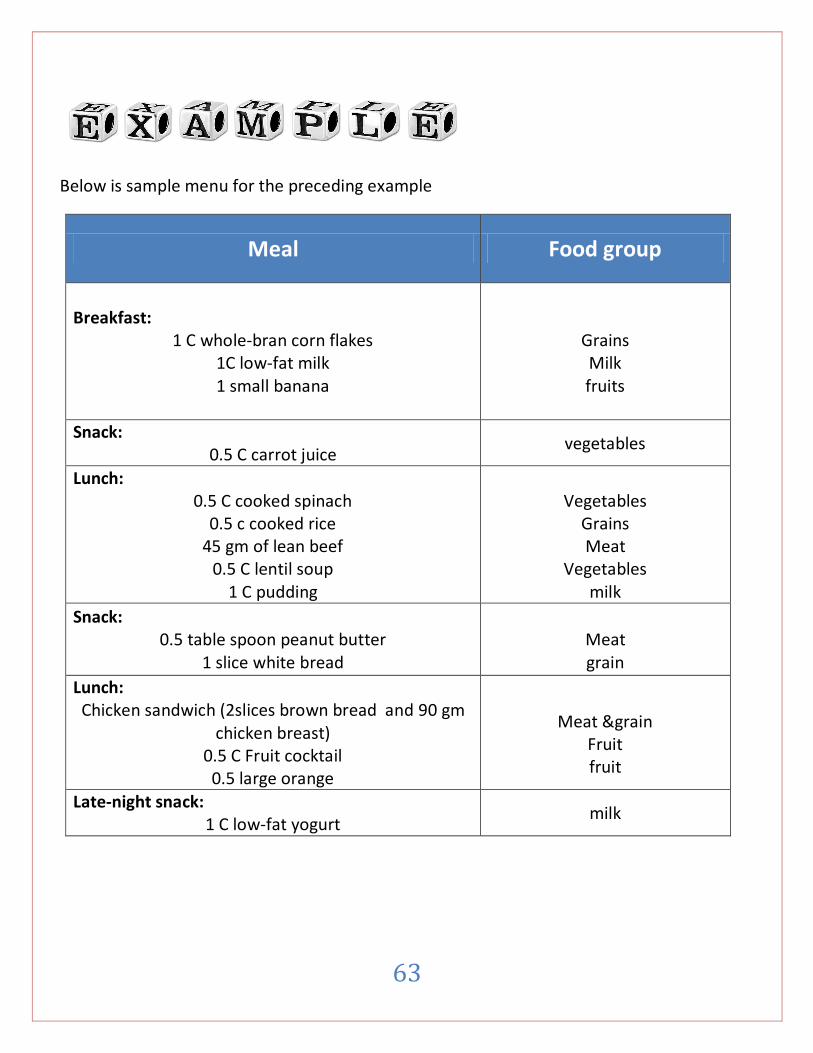
Below is sample menu for the preceding example
Meal Food group
Breakfast: 1 C whole-bran corn flakes
1C low-fat milk 1 small banana
Grains Milk fruits
Snack: 0.5 C carrot juice
vegetables
Lunch: 0.5 C cooked spinach
0.5 c cooked rice 45 gm of lean beef
0.5 C lentil soup 1 C pudding
Vegetables
Grains Meat
Vegetables milk
Snack: 0.5 table spoon peanut butter
1 slice white bread
Meat grain
Lunch: Chicken sandwich (2slices brown bread and 90 gm
chicken breast) 0.5 C Fruit cocktail 0.5 large orange
Meat &grain
Fruit fruit
Late-night snack: 1 C low-fat yogurt
milk

64
Exercise(4): Distribute your food examples into meals?
Meal Food group
Breakfast:
Snack:
Lunch:
Snack:
Lunch:
Late-night snack:
1. www.mypyramid.gov
2. Wardlaw, G. and Smith, A. (2009): Contemporary Nutrition. Seventh edition.
McGrowHill.USA.
References:
تن بحوذ اهلل