module 6 - moving averages
TRANSCRIPT

The Responsible Trader Lessons
The Responsible Trader Lessons
The Responsible Trader’s - POVModule 6 – Moving Averages
The Responsible Trader Lessons
The Responsible Trader Lessons
The Responsible Trader’s - POV• The Responsible Trader's POV (Point of View). • These are my notes, my own additional research and studies on the
Topic that I posted, and my personal observations and opinions that I am sharing to further enhance our knowledge and understanding.• Some of these were previously posted on “The Responsible Trader”
thread, Stock Market Pilipinas (www.stockmarketpilipinas.com). This is the latest version of previous posts I made.• Some of these plus further explanations and discussions will be
appearing in my forthcoming book “The Responsible Trader.”

The Responsible Trader Lessons
The Responsible Trader Lessons
Quick Review: Volume increases in the direction of the trend. Based on this, which of the two below is a a Fake-Out? AR on the left or RWM on the right?
C
Charts courtesy of Amibroker Charting Software

The Responsible Trader Lessons
The Responsible Trader Lessons
Quick Review: Volume increases in the direction of the trend. Based on this, which of the two below is a a Fake-Out? AR on the left or RWM on the right?
C
Charts courtesy of Amibroker Charting Software
Real Breakout
Heavy Volume
Fake Out
Low Volume
AR - Real Breakout - accompanied with High Volume RWM - Fake-out – accompanied with Low Volume

The Responsible Trader Lessons
The Responsible Trader Lessons
Quick Review: What are the main indicators used to measure Volume?
Chart courtesy of Amibroker Charting Software
The indicators used to measure Volume are On-Balance Volume (OBV) and Chaikin

The Responsible Trader Lessons
The Responsible Trader Lessons
Quick Review: A Gap is break between prices on a chart that occurs when the price of a stock makes a sharp move up or down with no trading occurring in between. What are the three types of Gaps?
Chart courtesy of Amibroker Charting Software
The Responsible Trader Lessons
The Responsible Trader Lessons
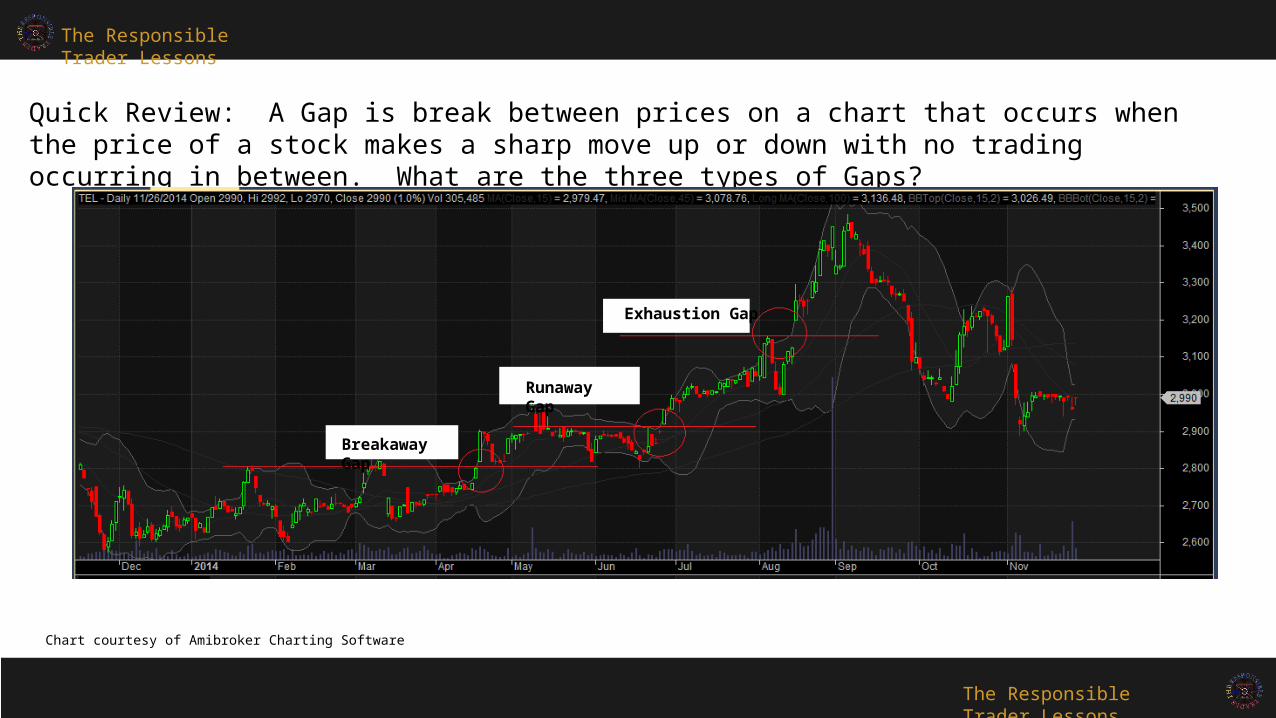
Quick Review: A Gap is break between prices on a chart that occurs when the price of a stock makes a sharp move up or down with no trading occurring in between. What are the three types of Gaps?
Chart courtesy of Amibroker Charting Software
Breakaway Gap
Runaway Gap
Exhaustion Gap

The Responsible Trader Lessons
The Responsible Trader Lessons
Moving averages rank next to volume for being dependable chart tools. However, I seldom see these when I see Charts posted by members of Facebook groups. We will talk about this in complete detail but first let us go back to basics.Do you still remember your college days? How your Professor got your average for your final grade? It works the same way. Let us use the following stock prices closing data of NIKL to illustrate this.
To get the 5 days average from November 26 to December 2, we just add all the prices from the period and divide by 5 days. However, this is not considered moving yet.
To get the moving average we get the next 5 day’s data (this time we drop the oldest date from the series, November 26 and add the latest date December 3 and divide by the same number of days to get the average moving. If you repeat the process over and over again you are going to get a series of plot points and by connecting these plot points you are going to get the Simple Moving average or SMA lines on your Chart.
Moving Averages

The Responsible Trader Lessons
The Responsible Trader Lessons
Using the same formula, we can get whatever Simple Moving Average or SMA we want in a Chart. No need to worry about Manual computations anymore. It is enough for us to understand how the figures are arrived at. All of these are now available in most charting softwares and you can lay them out on your Chart at the click of a mouse. The SMA formula can be applied to a weekly or a monthly set of data so it is just referred to as the period’s SMA.
Simple Moving Averages are simply referred to as SMA and a 20 period Simple Moving Average is usually called a 20-SMA.A longer period SMA is more smooth than a shorter period SMA. Below is a chart of NIKL showing a more smooth 50-SMA than a 20-SMA. Moving forward I will just be using this term when I refer to Simple Moving Averages.
Chart courtesy of Amibroker Charting Software
The Responsible Trader Lessons
The Responsible Trader Lessons
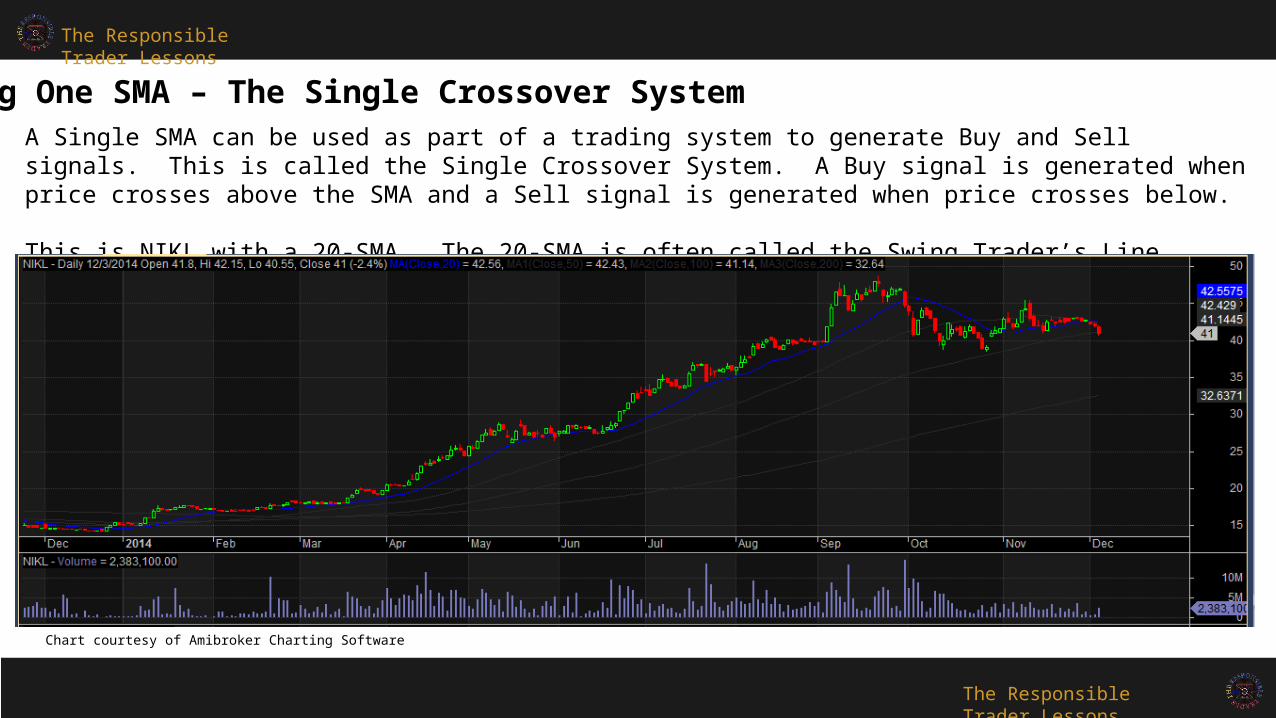
A Single SMA can be used as part of a trading system to generate Buy and Sell signals. This is called the Single Crossover System. A Buy signal is generated when price crosses above the SMA and a Sell signal is generated when price crosses below.
This is NIKL with a 20-SMA. The 20-SMA is often called the Swing Trader’s Line.
Chart courtesy of Amibroker Charting Software
Using One SMA – The Single Crossover System
The Responsible Trader Lessons
The Responsible Trader Lessons
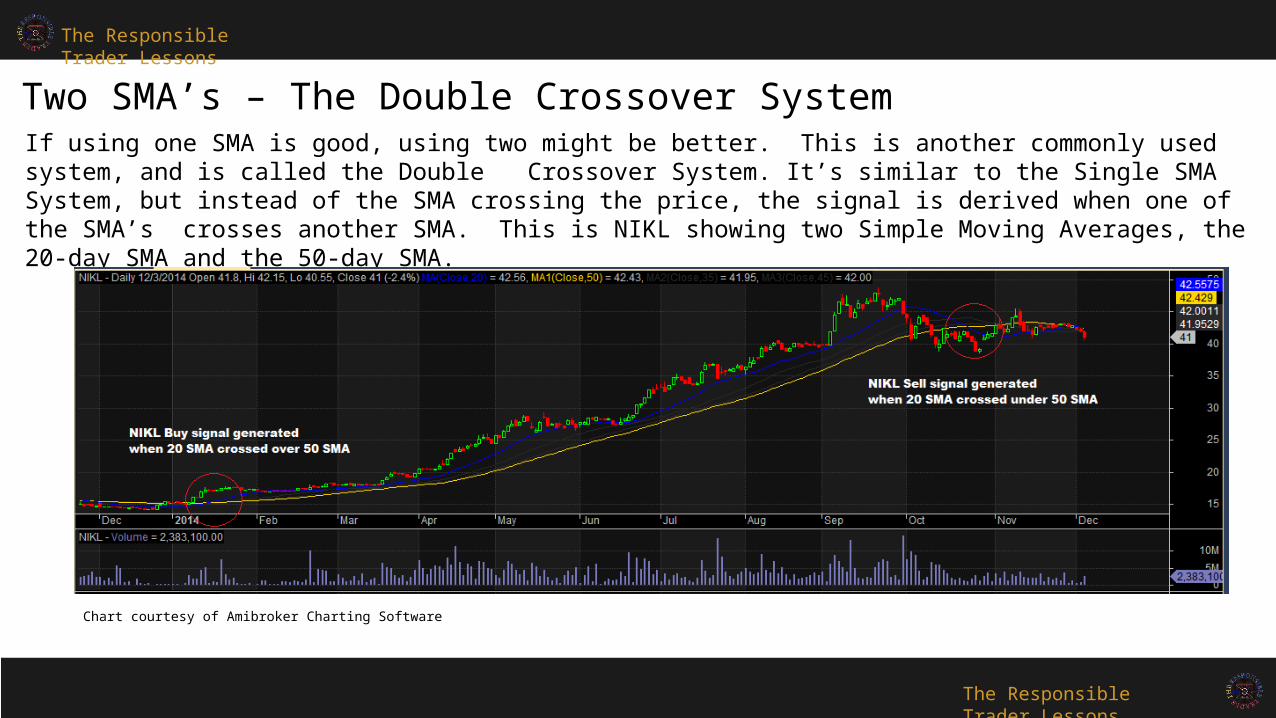
If using one SMA is good, using two might be better. This is another commonly used system, and is called the Double Crossover System. It’s similar to the Single SMA System, but instead of the SMA crossing the price, the signal is derived when one of the SMA’s crosses another SMA. This is NIKL showing two Simple Moving Averages, the 20-day SMA and the 50-day SMA.
Using Two SMA’s – The Double Crossover System
Chart courtesy of Amibroker Charting Software

The Responsible Trader Lessons
The Responsible Trader Lessons
When you are using a Single Moving Average, it can be useful to draw a percentage “envelope” or channel on each side of the moving average. This gives you a pictorial representation of where the price may be overextended. A moving average envelope is simply the drawing of a line each side of the moving average, at a distance that is a fixed percentage away.
Moving Average Envelopes
When you look at this, you can see where the price is touching or passing through the envelope. These mark points of market extremes. But there is a more effective and informative way of drawing limits on the expected price moves than just using a fixed percentage, and that is by using a technique developed by John Bollinger, which is the next topic.
Chart courtesy of Amibroker Charting Software

The Responsible Trader Lessons
The Responsible Trader Lessons
Bollinger BandsBollinger Bands are one of the more widely known technical indicators around but least understood. They are also very dynamic and have many uses. Invented by John Bollinger, they are best described as a way to visually measure volatility.
Bollinger bands are constituted by a middle band with two outer bands. The middle band is a Simple Moving Average, SMA, normally set at 20 periods. The outer bands are normally set 2 standard deviations above and below the middle band. Bandwidth simply measures the difference between the upper band and the lower band.
Chart courtesy of Amibroker Charting Software

The Responsible Trader Lessons
The Responsible Trader Lessons
Summary
1. The Moving Average is one of the most versatile and widely used of all technical indicators. A longer SMA is more smooth than a shorter SMA.
2. A simple application of using the Simple Moving Average is the Single Moving Average, also called the Single Crossover System. Buy signals are generated when price cross over the SMA and Sell signals are generated when price cross under the SMA.
3. Two SMA’s may also be used to generate Buy and Sell Signals, also called the Double Crossover System. When two SMA’s are used, a Buy Signal is generated when a faster SMA crosses over a slower SMA. This is called a Golden Cross. When a faster SMA crosses under a slower SMA a Sell Signal is generated and this is called a Dead Cross.
4. When using a single moving average, it can be useful to draw a percentage “envelope” or channel on each side of the moving average. This gives you a pictorial representation of where the price may be overextended.
5. Instead of Moving Average Envelopes, Bollinger bands are used for a more effective and informative way of drawing limits on the expected price moves than just using a fixed percentage.