module-based breast cancer classification yuji zhang jianhua xuan
TRANSCRIPT

Int. J. Data Mining and Bioinformatics, Vol. x, No. x, xxxx 1
Copyright © 200x Inderscience Enterprises Ltd.
Module-based breast cancer classification
Yuji Zhang Division of Biomedical Statistics and Informatics, Department of Health Sciences Research, Mayo Clinic College of Medicine, Rochester, Minnesota, 55905, USA E-mail: [email protected]
Jianhua Xuan
Department of Electrical and Computer Engineering, Virginia Polytechnic Institute and State University, Arlington, Virginia, 22203, USA E-mail: [email protected]
Robert Clarke and Habtom W. Ressom* Lombardi Comprehensive Cancer Center, Georgetown University Medical Center, Washington, District of Columbia, 20057, USA E-mail: [email protected] E-mail: [email protected] *Corresponding author Abstract: The reliability and reproducibility of gene biomarkers for classification of cancer patients has been challenged due to measurement noise and biological heterogeneity among patients. In this paper, we propose a novel module-based feature selection framework, which integrates biological network information and gene expression data to identify biomarkers not as individual genes but as functional modules. Results from four breast cancer studies demonstrate that the identified module biomarkers • achieve higher classification accuracy in independent validation datasets • are more reproducible than individual gene markers • improve the biological interpretability of results • are enriched in cancer ‘disease drivers’.
Keywords: cancer biomarkers; systems biology; feature selection; disease classification.
Reference to this paper should be made as follows: Zhang, Y., Xuan, J., Clarke, R. and Ressom, H.W. (xxxx) ‘Module-based breast cancer classification’, Int. J. Data Mining and Bioinformatics, Vol. x, No. x, pp.xxx–xxx.
Biographical notes: Yuji Zhang, PhD, is Assistant Professor at the Division of Biomedical Statistics and Informatics, Department of Health Sciences Research, Mayo College of Medicine. Her research interests are in the

2 Y. Zhang et al.
integrative analysis and visualisation of high-throughput biological data, statistical modeling of biological networks, and analysis of massively parallel sequencing data.
Jianhua Xuan, PhD, is Associate Professor of Electrical and Computer Engineering at Virginia Polytechnic Institute and State University. His research interests include computational systems biology, bioinformatics, intelligent computing, information visualisation, advanced image analysis, cellular and molecular imaging, and image guided radiation therapy.
Robert Clarke, PhD, DSc, is Professor of Oncology and Physiology & Biophysics at Georgetown University Medical Center (GUMC), Dean of Research at GUMC, Interim Director of the Biomedical Graduate Research Organization at GUMC, Associate Vice President of GUMC, and Co- Director of the Breast Cancer Program at the Lombardi Comprehensive Cancer Center. Dr. Clarke studies how hormones, growth factors, and other related molecules affect breast cancer, and how breast cancers become resistant to hormonal and cytotoxic chemotherapies. Dr. Clarke has expertise in the fields of estrogens, antiestrogens, aromatase inhibitors, cell signaling, drug resistance, bioinformatics, and signal transduction.
Habtom W. Ressom, PhD, is Associate Professor of Oncology at Georgetown University Medical Center and Director of the Genomics and Epigenomics Shared Resource at the Lombardi Comprehensive Cancer Center. He is interested in cancer biomarker discovery and systems biology research by analysis of omics data.
1 Introduction
Over the last few decades, high-throughput genomic and proteomic techniques have generated a large number of diagnostic, prognostic and predictive molecular signatures related to many diseases (Clarke et al., 2008; van de Vijver et al., 2002; Ramaswamy et al., 2001; Golub et al., 1999; Hastie et al., 2000; Ben-Dor et al., 1999; Duan et al., 2005). Traditional biomarker discovery approaches for disease classification are typically selected by scoring individual genes for how well their expression patterns discriminate between different subclasses of disease or between cases and controls. However, there are several disadvantages to these approaches, including the following:
Lack of adequate biological interpretation: the genes selected by traditional biomarker discovery methods are mainly ‘downstream’ reflectors of the perturbations, defining clinical outcomes through the complex interplay of biological networks. They may not directly account for the activity, perturbations or roles that disease-related cellular networks show (Brynildsen and Collins, 2009).
Oversimplified assumption of gene independence: traditional biomarker discovery approaches make biological and statistical assumptions of between-gene independence, i.e., gene biomarkers are typically selected independently, although proteins are well known to function in coordination within protein complexes, signalling pathways, and higher-order cellular processes. Thus, the resulting classifiers may contain marker genes with redundant information that may lead to decreased classification performance.
Module-based breast cancer classification 3
Low reproducibility/reliability: biomarker sets identified from different labs share very few genes in common. This is well illustrated by two prominent studies of survival prediction in breast cancer. van’t Veer et al. (2002) generated a list of 70 genes from 96 patient samples, which were subsequently tested successfully on a larger cohort of 295 patients (van de Vijver et al., 2002). Wang et al. (2005) analysed the gene expression profiles of 286 patients and reported a gene biomarker set of 76 genes. Each gene set was trained and tested within its own samples and achieved good prediction performance. However, the overlap of these two gene sets was very small: only three genes are in common. As a result, the predictive power of a classifier developed from one study could not be adequately reproduced when testing it on samples of another study, although both studies contain patients with similar phenotypes. Cellular heterogeneity within tissues and genetic heterogeneity across patients in complex diseases (e.g., breast cancer) may weaken the discriminative power of individual genes, even within a clinically homogeneous patient group (Ein-Dor et al., 2005).
Inadequate focus on genes that are ‘disease drivers’: oncogenes and tumour suppressors are disease drivers whose mutations result in a detrimental change of function that leads to cancer. These genes are generally more conserved than other proteins, and tend not to be highly differentially expressed between different clinical groups of patients (Wang et al., 2007). These genes would not be selected by traditional statistical ranking methods, such as TP53 and MYC. However, their expression patterns are more stable in patients of the same clinical subgroups, and more robust across different studies. The search for biomarkers that may represent upstream regulators with potential causal roles in the determination of differential phenotypes may help us define more reliable and reproducible biomarker sets.
The above limitations of traditional biomarker discovery approaches have received great attention from the cancer research community (Ein-Dor et al., 2005; Michiels et al., 2005; Ioannidis, 2005; Lonning et al., 2005). We argue that the fundamental reason for these limitations is that these traditional biomarker identification methods lead to genes whose roles are as mostly ‘passengers’ rather than ‘drivers’ of the phenotypic differences between sample groups (e.g., poor vs. good outcomes). Regulatory networks often act as amplification cascades, where highly differentially expressed genes tend to be further downstream from the somatic or inherited determinants of the clinical outcomes. Since regulatory networks comprise the complex interactions of multiple potential casual factors and sources of biological noise (Azuaje, 2010), these downstream genes are more prone to be most unstable across and within samples. On the other hand, oncogenes and tumour suppressors are generally not the most differentially expressed genes, although they may show an outlier behaviour in some samples (Tomlins et al., 2005). The biomarkers enriched in these disease drivers may represent upstream regulators with potential causal roles in the determination of differential phenotypes, which will improve the reliability and reproducibility of the prediction model in unknown samples. Lim et al. succeeded in detecting candidate biomarkers by identifying ‘upstream regulators’ causally related to phenotypic differences (Lim et al., 2009). Lim et al. (2009) the transcriptional factors were determined if they caused the up/down-regulation of genes linked to poor outcome through patient samples in gene interaction networks inferred by the ARACNe algorithm (Basso et al., 2005). The inferred sets of ‘master regulators’ were shown to be more powerful and robust than the signatures proposed by original investigations based on standard gene-based analyses. Such studies imply

4 Y. Zhang et al.
that systems approaches to biomarker discovery in a biological network context would identify biomarkers more indicative of phenotypic changes.
The availability of large protein-protein interaction, protein-DNA interaction, and signal transduction pathway data enables new opportunities for elucidating modules involved in major diseases and pathologies (Calvano et al., 2005). Several approaches have been demonstrated to extract the relevant functional modules based on coherent expression patterns of their genes (Ideker et al., 2002; Chen and Yuan, 2006). However, these biological interaction networks have been typically analysed separately in previous studies (Ideker et al., 2002; Chen and Yuan, 2006; Lee et al., 2008; Chuang et al., 2007). Such approaches tend to hide the full complexity of the cellular circuitry, since many processes involve combinations of different types of interactions.
In this work, we propose a novel module-based systems biology approach to identifying module biomarkers of diseases by integrating patient gene expression profiles and different types of biological network data, including protein-protein interaction networks, protein-DNA interaction networks and signalling pathway networks. The biomarkers here are not encoded as individual genes or proteins, but as modules of interacting proteins within a large-scale human interaction network. Our experiments on four breast cancer cohorts show that the proposed method has several advantages over previous analyses of differential expression. First, the resulting module biomarkers provide models of the molecular mechanisms underlying disease mechanisms. Second, module-based classification achieves higher accuracy in prediction, which is ascertained by selecting markers from a training set and evaluating them on an independent validation set. Third, the identified module biomarkers are likely to be more reproducible between different disease experiments than individual marker genes selected without network information. Also, our approach provides the capability to detect genes with known disease mutations that are typically not detected through gene-based differential expression analysis. These genes are referred to as ‘disease drivers’ that are causally responsible for the determinations of differential phenotypes.
2 Materials and methods
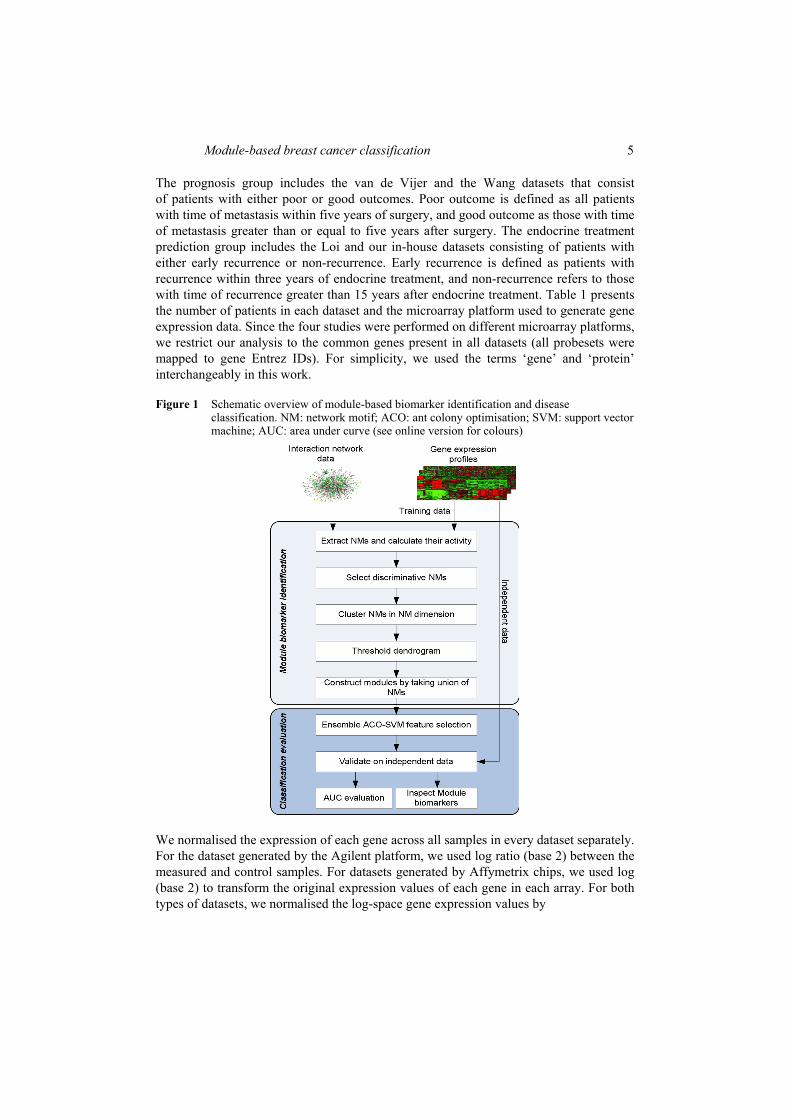
We describe here the data and the methods we used in this study. The data consist of four breast cancer gene expression datasets and human interaction data collected from public databases. Our proposed module-based biomarker discovery approach integrates gene expression profiles and biological network information. Figure 1 illustrates the steps involved in this approach. In the following sections, we briefly describe the data and the analytical steps presented in Figure 1.
2.1 Datasets
Gene expression data: we obtained three mRNA expression datasets from three breast cancer studies (van de Vijver et al., 2002; Wang et al., 2005; Loi et al., 2008) and one in-house dataset. We divided these datasets into two groups:
• prognosis group
• endocrine treatment prediction group.
Module-based breast cancer classification 5
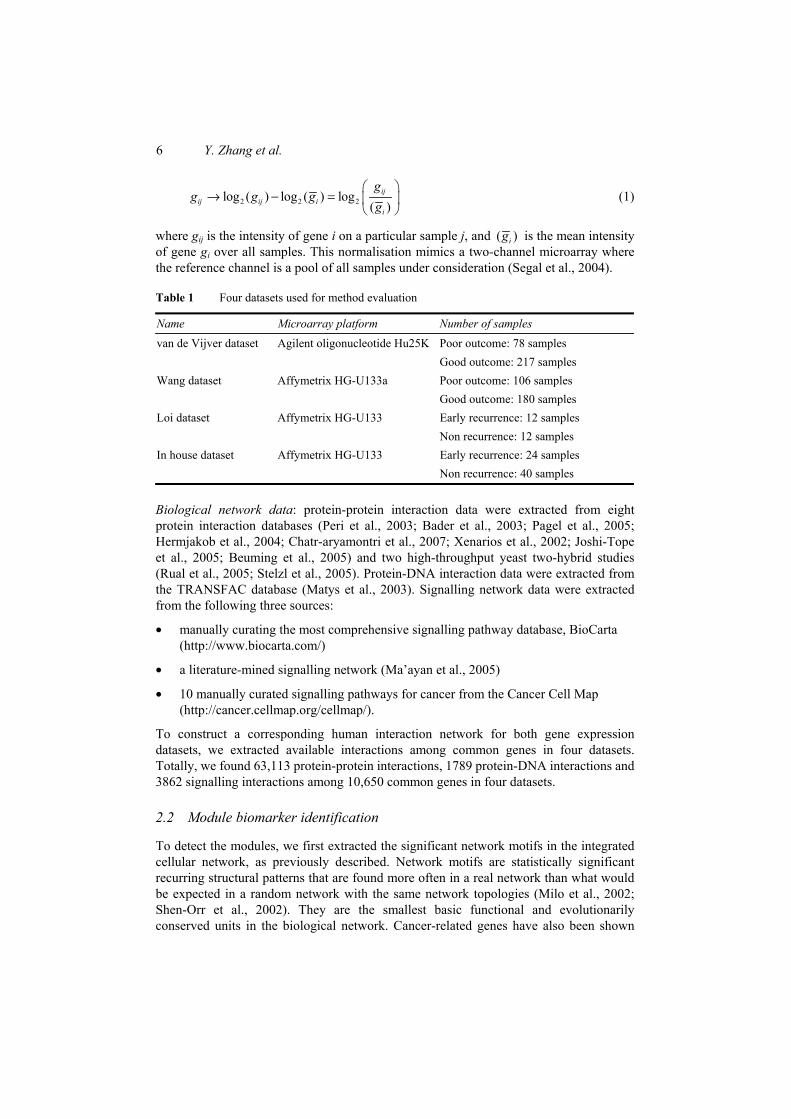
The prognosis group includes the van de Vijer and the Wang datasets that consist of patients with either poor or good outcomes. Poor outcome is defined as all patients with time of metastasis within five years of surgery, and good outcome as those with time of metastasis greater than or equal to five years after surgery. The endocrine treatment prediction group includes the Loi and our in-house datasets consisting of patients with either early recurrence or non-recurrence. Early recurrence is defined as patients with recurrence within three years of endocrine treatment, and non-recurrence refers to those with time of recurrence greater than 15 years after endocrine treatment. Table 1 presents the number of patients in each dataset and the microarray platform used to generate gene expression data. Since the four studies were performed on different microarray platforms, we restrict our analysis to the common genes present in all datasets (all probesets were mapped to gene Entrez IDs). For simplicity, we used the terms ‘gene’ and ‘protein’ interchangeably in this work.
Figure 1 Schematic overview of module-based biomarker identification and disease classification. NM: network motif; ACO: ant colony optimisation; SVM: support vector machine; AUC: area under curve (see online version for colours)
We normalised the expression of each gene across all samples in every dataset separately. For the dataset generated by the Agilent platform, we used log ratio (base 2) between the measured and control samples. For datasets generated by Affymetrix chips, we used log (base 2) to transform the original expression values of each gene in each array. For both types of datasets, we normalised the log-space gene expression values by
6 Y. Zhang et al.
2 2 2log ( ) log ( ) log( )
ijij ij i
i
gg g g
g
→ − =
(1)
where gij is the intensity of gene i on a particular sample j, and ( )ig is the mean intensity of gene gi over all samples. This normalisation mimics a two-channel microarray where the reference channel is a pool of all samples under consideration (Segal et al., 2004).
Table 1 Four datasets used for method evaluation
Name Microarray platform Number of samples
van de Vijver dataset Agilent oligonucleotide Hu25K Poor outcome: 78 samples Good outcome: 217 samples
Wang dataset Affymetrix HG-U133a Poor outcome: 106 samples Good outcome: 180 samples
Loi dataset Affymetrix HG-U133 Early recurrence: 12 samples Non recurrence: 12 samples
In house dataset Affymetrix HG-U133 Early recurrence: 24 samples Non recurrence: 40 samples
Biological network data: protein-protein interaction data were extracted from eight protein interaction databases (Peri et al., 2003; Bader et al., 2003; Pagel et al., 2005; Hermjakob et al., 2004; Chatr-aryamontri et al., 2007; Xenarios et al., 2002; Joshi-Tope et al., 2005; Beuming et al., 2005) and two high-throughput yeast two-hybrid studies (Rual et al., 2005; Stelzl et al., 2005). Protein-DNA interaction data were extracted from the TRANSFAC database (Matys et al., 2003). Signalling network data were extracted from the following three sources:
• manually curating the most comprehensive signalling pathway database, BioCarta (http://www.biocarta.com/)
• a literature-mined signalling network (Ma’ayan et al., 2005)
• 10 manually curated signalling pathways for cancer from the Cancer Cell Map (http://cancer.cellmap.org/cellmap/).
To construct a corresponding human interaction network for both gene expression datasets, we extracted available interactions among common genes in four datasets. Totally, we found 63,113 protein-protein interactions, 1789 protein-DNA interactions and 3862 signalling interactions among 10,650 common genes in four datasets.
2.2 Module biomarker identification
To detect the modules, we first extracted the significant network motifs in the integrated cellular network, as previously described. Network motifs are statistically significant recurring structural patterns that are found more often in a real network than what would be expected in a random network with the same network topologies (Milo et al., 2002; Shen-Orr et al., 2002). They are the smallest basic functional and evolutionarily conserved units in the biological network. Cancer-related genes have also been shown

Module-based breast cancer classification 7
to be more conserved compared to other genes, along with evolution (Awan et al., 2007; Narsing et al., 2009). We assume that network motifs in a biological network are enriched in ‘disease driver’ genes, which are more conserved than other downstream ‘passenger’ genes. These network motifs could form large aggregated modules that perform specific functions by forming collaborations among a large number of network motifs. In this work, we focused on three-node network motifs, since larger size network motifs (number of nodes > 3) are composed of three-node ones in most cases (Yeger-Lotem et al., 2004). All connected sub-networks containing three nodes in the interaction network were collated into isomorphic patterns, and the number of times each pattern occurred was counted. If the number of occurrences was at least five, and statistically significantly higher than random networks, then the pattern was considered as a network motif. The significance test was performed by generating 1000 random networks and computing the fraction of random networks in which the pattern appeared at least as often as in the interaction network. A pattern with P ≤ 0.05 was considered statistically significant.
All the identified network motifs were then examined by calculating their activity scores via gene expression data. Each network motif was considered as a subnetwork. We assume that in a subnetwork A, there are M genes with expression levels across N patient samples:
{ | 1,2,..., , 1,2,..., }.k ijG g i M j N= = = (2)
Given a particular gene i, the expression values gij are normalised to z-transformed scores zij so that the z score vector zi has mean µ = 0 and standard deviation σ = 1 over all samples j. The z score is defined by
ij iij
i
gz
µσ−
=)
) (3)
where iµ is mean expression value of gene i across samples, and iσ) is standard deviation of expression value of gene i across samples.
Let z represent the corresponding vector of class labels (e.g., tumour metastatic or non-metastatic). The discriminative score of gene i is defined as the mutual information MIi(x, y) between the expression levels of gene i and sample labels c:
( , )( ; ) ( , ) log( ) ( )
i
ix z y c
p x yMI x y p x yp x p y∈ ∈
= ∑∑ (4)
where x is the discretised value of zi, and y is the sample labels, p(x, y) is the joint probability density function of zi and c, and p(x) and p(y) are the marginal pdf’s of zi and c. A histogram technique is applied to transform the continuous gene expression values to discrete ones for the calculation of the mutual information (Tourassi et al., 2001).
The activity score of a subnetwork A is then calculated by combining the transformed z scores derived from the expression of its individual genes. The individual zij of each member gene in one subnetwork are combined into the activity of a _A jz by
_2 1
1
1 M
A j i ijMi
ii
z w zw =
=
= ∑∑
(5)

8 Y. Zhang et al.
where wi denotes the weight that is defined as
1
( ; ) .( ; )
ii M
ii
MI x ywMI x y
=
=∑
(6)
The weighted z score is intended to emphasise the hub genes which are surrounded by many highly discriminative genes, although they are not highly differently expressed themselves.
The discriminative score of sub-network A is calculated similarly, as defined in equation (4):
( , )( ; ) ( , ) log( ) ( )
A
Ax z y c
p x yMI x y p x yp x p y∈ ∈
= ∑∑ (7)
where x is the discretised value of zA, and y is the sample labels. We performed two permutation tests to assess the significance of the identified
network motifs. For the first test, we investigated whether the mutual information with the disease class is stronger than that obtained with random assignments of classes to patients (Tian et al., 2005). For the random model, we permuted the sample labels for 100,000 trials, yielding a null distribution of mutual information scores for each trial, and the real score of each network motif was indexed on this null distribution. For the second test, we tested if the mutual information with network interactions was stronger than that obtained with random assignments of gene expression vectors to individual genes. The mutual information for each network motif was calculated over 100,000 random trials in which the expression vectors of individual genes were permuted over the network. The score of each network motif was indexed on the ‘global’ null distribution of all random network motif activity scores. In this study, significant network motifs were selected that have both permutation test P values less than 0.0001.
The network motifs that passed the significance tests were clustered in the network motif dimension using the hierarchical clustering method. This resulted in a tree in which each internal leaf node is associated with a vector representing the average of all of the network motif vectors at its decent leaves. We annotated each interior node with the Pearson correlation between the vectors associated with its two children in the hierarchy. We defined as network motif cluster in which each interior node’s Pearson correlation differed by more than 0.05 from the Pearson correlation of its parent node in the hierarchy. The module was then formed by taking the union of the clustered network motifs.
2.3 Ensemble classification evaluation
After the module biomarkers are identified, their reliability is evaluated across different datasets. An ensemble strategy is proposed to increase the stability of our feature selection algorithm, which is a wrapper approach that combines colony optimisation with support vector machine (ACO-SVM). The following section describes this feature selection method and evaluation of the method on the basis of classification performance.

Module-based breast cancer classification 9
2.3.1 Ant Colony Optimisation
Ant Colony Optimisation (ACO) studies artificial systems that take inspiration from the behaviour of real ant colonies (Dorigo et al., 1999). The basic idea of ACO is that a large number of simple artificial agents are able to build good solutions to solve hard combinatorial optimisation problems via low-level based communications. Real ants cooperate in their search for food by depositing chemical traces (pheromones) on the ground. Artificial ants cooperate by using a common memory that corresponds to the pheromone deposited by real ants. The artificial pheromone is accumulated at runtime through a learning mechanism. Artificial ants are implemented as parallel processes whose role is to build problem solutions using a constructive procedure driven by a combination of artificial pheromone and a heuristic function to evaluate successively constructive steps.
In this paper, we propose to use ACO for feature selection because of its efficiency and capability in identifying a set of interacting variables that are useful for classification. Also, ACO allows the integration of prior information into the algorithm for improved feature selection.
Through the probability function given below, each ant picks n sets of distinct features from L candidate features:
( ( ))( )( ( ))i i
ii i
i
tP tt
α β
α β
τ ητ η
=∑
(8)
where τi(t) is the amount of pheromone trail at time t for the feature represented by index i; ηi represents prior information (e.g., univariate t-statistic) for the feature represented by index i; and α and β are parameters that determine the relative influence of pheromone trail and prior information.
At t = 0, τi(t) is set to a constant for all features. Thus, at the first iteration, each ant chooses n distinct features (a trail) from L features with probabilities proportional to the existing prior knowledge. Let Sj be the jth ant consisting of n distinct features. Depending on the performance of Sj, the amount of pheromone trail for Sj is updated. The performance function is evaluated on the basis of the disease state classification capability of each Sj. We use the features in Sj to build a classifier and estimate the classification accuracy through the Cross-Validation (CV) method. The amount of pheromone trail for each feature in Sj is updated in proportion to the corresponding classification accuracy using
( 1) * ( ) ( )i i it t tτ ρ τ τ+ = + ∆ (9)
where ρ is a constant between 0 and 1, representing the evaporation of pheromone trails; ∆τi(t) is an amount proportional to the classification accuracy of Sj. ∆τi(t) is set to zero if the ith feature fi∉Sj. This update is made for all N ants (S1, S2, …, SN). Note that at t = 0, ∆τi(t) is set to zero for all features. The updating rule allows trails that yield good classification accuracy to have their amount of pheromone trail increased, while others gradually evaporate. As the algorithm progresses, features with larger amounts of pheromone trails and strong prior information influence the probability function to lead the ants towards them.
10 Y. Zhang et al.
Compared to the Particle Swarm Optimisation (PSO) that we previously used in Zhang et al. (2008), which is mostly used for continuous optimisation problems, ACO is more suitable for discrete optimisation problems due to the following reasons:
• ACO is driven by two parameters: heuristic value and pheromone value. Mostly these values are derived from parameters having discrete values.
• PSO is driven by neighbour’s velocity, which is a continuous parameter, as one of the parameters used for deriving velocity is time.
Thus, ACO fits better at graph searching problems while PSO fits better at parameter optimisation in patter recognition algorithms, because parameters used for graph searching are mostly discrete parameters, whereas parameters used for learning/ recognition are continuous parameters.
2.3.2 Support Vector Machines
Support Vector Machines (SVMs) are learning kernel-based systems that use a hypothesis space of linear functions in high-dimensional feature spaces (Boser et al., 1992). In classification problems that involve two classes, linear SVMs search for the optimal hyperplane that maximises the margin of separation between the hyperplane and the closest data points on both sides of the hyperplane. Thus, parameters of SVMs are determined on the basis of structural risk minimisation, not error-risk minimisation. Thus, they have the tendency to overcome the overfitting problem. In high dimensional data classification problems, SVMs have proven themselves as one of the pattern classification algorithms with great generalisation ability. We will use a linear SVM as the reference classifier for feature selection in module space.
2.3.3 ACO-SVM feature selection algorithm
Ant Colony Optimisation-Support Vector Machine (ACO-SVM) combines ACO and SVM to select features that are useful for SVM classification of samples into two groups. ACO starts with a population of N module sets, where each module set consists of a pre-specified number (n) of distinct modules. Each module is selected from a given set of candidate modules (L) based on its probability function, described previously in equation (8). SVM classifiers are then built for each module set and the performance of the module set in distinguishing the two groups is evaluated through the five-fold CV method. Using equation (9), we update the amount of pheromone trail for each module in proportion to the classification accuracy of the module set, in which the module is involved. The goal is to provide those modules that can lead to improved classification accuracy with better probability of being selected in subsequent iterations.
2.3.4 Ensemble feature selection based on ACO-SVM
To select robust module biomarkers for classification in unknown patient samples, we applied an ensemble feature selection technique to select module subsets in training datasets and validate their discriminative power in an independent validation dataset. Similar to ensemble learning for classification, ensemble feature selection techniques use a two-step procedure:

Module-based breast cancer classification 11
• a number of different feature selectors are created
• the outputs of these component feature selectors are aggregated to generate the final ensemble results.
We focused on the analysis of ensemble feature selection techniques using the ACO-SVM feature selection approach we previously developed (Ressom et al., 2007). The ACO-SVM approach was used to select the best features in terms of their ability to distinguish between two patient phenotypes in a validation dataset which were not involved in the feature selection step.
To generate a robust module biomarker set in one dataset, we generated slight variations of the original dataset, and aggregated the outputs of the ACO-SVM feature selection method using these variant samples. The rationale behind this is that for a stable biomarker set, training datasets with small change should generate biomarker sets with high similarities. The biomarkers with high frequencies in these biomarker sets are presumed to be most relevant to sample distinction, and are used to predict the class membership of independent samples. A subsampling approach was proposed to generate training datasets with slight variations: a large number (e.g., 500) of datasets can be generated by stratified subsampling of the original dataset without replacement. As gene expression datasets generally contain only tens of samples, we generated subsamplings containing 90% of the samples of the original dataset, and the remaining 10% of the samples were used as an internal validation dataset to estimate the performance of a classifier, called within-dataset validation. Since we considered typically 500 independent partitions in 90% training and 10% validation, we reduced the risk of overoptimistic results of traditional CV experiments on small sample domains (Braga-Neto and Dougherty, 2004).
The biomarker sets generated from 500 subsampling datasets using the ACO-SVM approach were then evaluated through a frequency plot, where we computed the frequency with which modules were selected and then analysed. The most frequently selected set of modules was then validated by using it to classify an independent validation dataset. This approach is referred to as cross-dataset validation.
The double-validation procedure stated above was designed to provide an unbiased evaluation of generalisation error in independent datasets. Since both prognostic and treatment outcome prediction groups contain two datasets, we evaluated the classification performance of the module biomarker set generated from one dataset on the other dataset in the same group, or vice versa.
3 Results
We report here the experimental evaluations of our methods to search for module biomarkers with discriminative power between different subgroups of breast cancer patients in a biological network context. Four breast cancer datasets were used to identify biomarkers for prognosis purposes. In the following, we present our results and comparison to previously proposed methods applied to the same public datasets.
12 Y. Zhang et al.
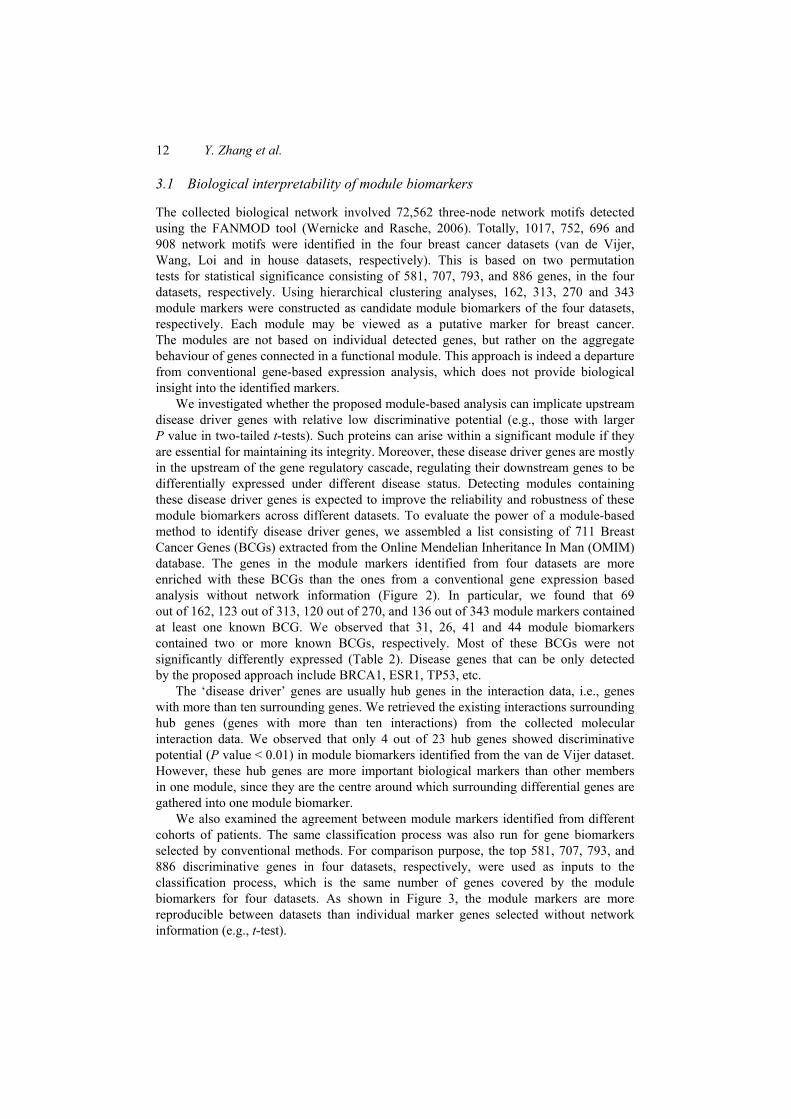
3.1 Biological interpretability of module biomarkers
The collected biological network involved 72,562 three-node network motifs detected using the FANMOD tool (Wernicke and Rasche, 2006). Totally, 1017, 752, 696 and 908 network motifs were identified in the four breast cancer datasets (van de Vijer, Wang, Loi and in house datasets, respectively). This is based on two permutation tests for statistical significance consisting of 581, 707, 793, and 886 genes, in the four datasets, respectively. Using hierarchical clustering analyses, 162, 313, 270 and 343 module markers were constructed as candidate module biomarkers of the four datasets, respectively. Each module may be viewed as a putative marker for breast cancer. The modules are not based on individual detected genes, but rather on the aggregate behaviour of genes connected in a functional module. This approach is indeed a departure from conventional gene-based expression analysis, which does not provide biological insight into the identified markers.
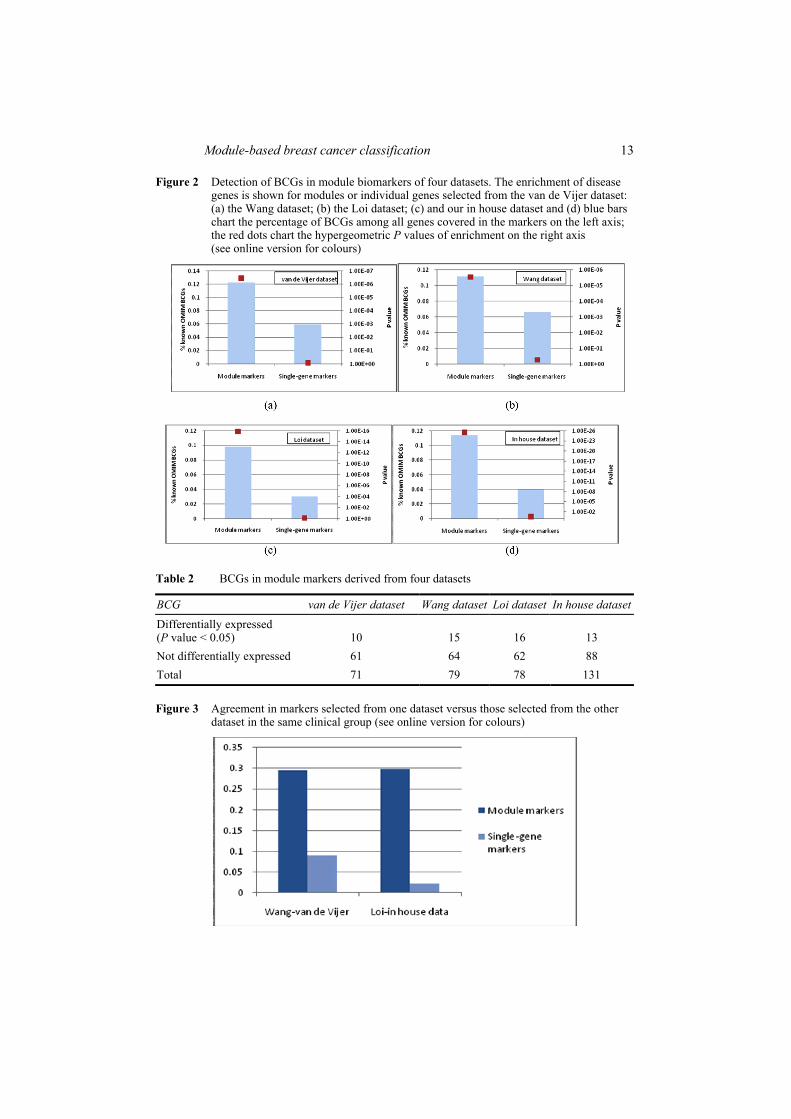
We investigated whether the proposed module-based analysis can implicate upstream disease driver genes with relative low discriminative potential (e.g., those with larger P value in two-tailed t-tests). Such proteins can arise within a significant module if they are essential for maintaining its integrity. Moreover, these disease driver genes are mostly in the upstream of the gene regulatory cascade, regulating their downstream genes to be differentially expressed under different disease status. Detecting modules containing these disease driver genes is expected to improve the reliability and robustness of these module biomarkers across different datasets. To evaluate the power of a module-based method to identify disease driver genes, we assembled a list consisting of 711 Breast Cancer Genes (BCGs) extracted from the Online Mendelian Inheritance In Man (OMIM) database. The genes in the module markers identified from four datasets are more enriched with these BCGs than the ones from a conventional gene expression based analysis without network information (Figure 2). In particular, we found that 69 out of 162, 123 out of 313, 120 out of 270, and 136 out of 343 module markers contained at least one known BCG. We observed that 31, 26, 41 and 44 module biomarkers contained two or more known BCGs, respectively. Most of these BCGs were not significantly differently expressed (Table 2). Disease genes that can be only detected by the proposed approach include BRCA1, ESR1, TP53, etc.
The ‘disease driver’ genes are usually hub genes in the interaction data, i.e., genes with more than ten surrounding genes. We retrieved the existing interactions surrounding hub genes (genes with more than ten interactions) from the collected molecular interaction data. We observed that only 4 out of 23 hub genes showed discriminative potential (P value < 0.01) in module biomarkers identified from the van de Vijer dataset. However, these hub genes are more important biological markers than other members in one module, since they are the centre around which surrounding differential genes are gathered into one module biomarker.
We also examined the agreement between module markers identified from different cohorts of patients. The same classification process was also run for gene biomarkers selected by conventional methods. For comparison purpose, the top 581, 707, 793, and 886 discriminative genes in four datasets, respectively, were used as inputs to the classification process, which is the same number of genes covered by the module biomarkers for four datasets. As shown in Figure 3, the module markers are more reproducible between datasets than individual marker genes selected without network information (e.g., t-test).
Module-based breast cancer classification 13
Figure 2 Detection of BCGs in module biomarkers of four datasets. The enrichment of disease genes is shown for modules or individual genes selected from the van de Vijer dataset: (a) the Wang dataset; (b) the Loi dataset; (c) and our in house dataset and (d) blue bars chart the percentage of BCGs among all genes covered in the markers on the left axis; the red dots chart the hypergeometric P values of enrichment on the right axis (see online version for colours)
Table 2 BCGs in module markers derived from four datasets
BCG van de Vijer dataset Wang dataset Loi dataset In house dataset
Differentially expressed (P value < 0.05) 10 15 16 13 Not differentially expressed 61 64 62 88 Total 71 79 78 131
Figure 3 Agreement in markers selected from one dataset versus those selected from the other dataset in the same clinical group (see online version for colours)
14 Y. Zhang et al.
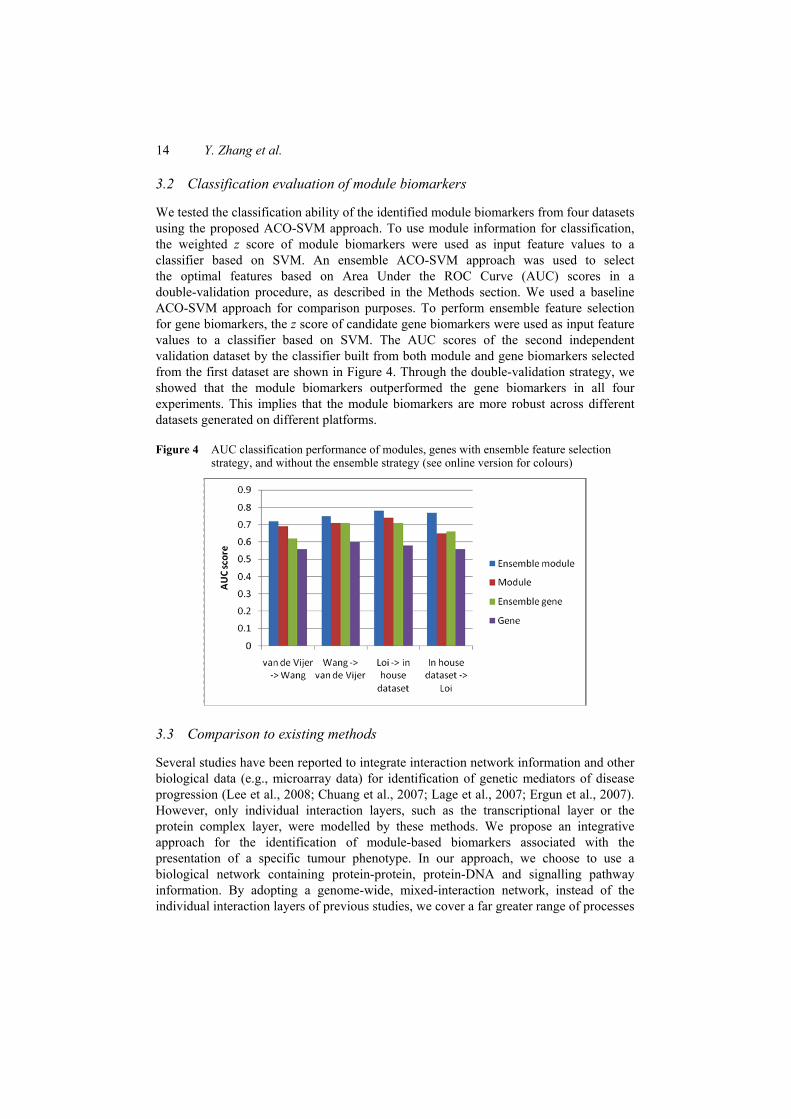
3.2 Classification evaluation of module biomarkers
We tested the classification ability of the identified module biomarkers from four datasets using the proposed ACO-SVM approach. To use module information for classification, the weighted z score of module biomarkers were used as input feature values to a classifier based on SVM. An ensemble ACO-SVM approach was used to select the optimal features based on Area Under the ROC Curve (AUC) scores in a double-validation procedure, as described in the Methods section. We used a baseline ACO-SVM approach for comparison purposes. To perform ensemble feature selection for gene biomarkers, the z score of candidate gene biomarkers were used as input feature values to a classifier based on SVM. The AUC scores of the second independent validation dataset by the classifier built from both module and gene biomarkers selected from the first dataset are shown in Figure 4. Through the double-validation strategy, we showed that the module biomarkers outperformed the gene biomarkers in all four experiments. This implies that the module biomarkers are more robust across different datasets generated on different platforms.
Figure 4 AUC classification performance of modules, genes with ensemble feature selection strategy, and without the ensemble strategy (see online version for colours)
3.3 Comparison to existing methods
Several studies have been reported to integrate interaction network information and other biological data (e.g., microarray data) for identification of genetic mediators of disease progression (Lee et al., 2008; Chuang et al., 2007; Lage et al., 2007; Ergun et al., 2007). However, only individual interaction layers, such as the transcriptional layer or the protein complex layer, were modelled by these methods. We propose an integrative approach for the identification of module-based biomarkers associated with the presentation of a specific tumour phenotype. In our approach, we choose to use a biological network containing protein-protein, protein-DNA and signalling pathway information. By adopting a genome-wide, mixed-interaction network, instead of the individual interaction layers of previous studies, we cover a far greater range of processes

Module-based breast cancer classification 15
within the cell. This integration allows the method to capture several different mechanisms of action associated with cancer progression and metastasis.
Apart from a larger coverage of biological processes in our analysis, our approach utilises an ensemble feature selection method to improve the classification accuracy and reliability of the module biomarkers compared to Chuang et al. (2007) and Lee et al. (2008). Both Chuang et al. and Lee et al. applied five-fold cross validation for one single dataset, which would generate overoptimistic results that do not adequately reproduce in independent datasets. In this work, a strict double validation strategy was used to estimate the classification performance. Such strategy leads to better classification accuracy in applying the resulting module marker set to classify previously unseen samples.
4 Discussions
In this paper, we introduced a module-based feature selection framework to identify module biomarkers with high reproducibility and classification accuracy. This was accomplished by a novel hybrid feature selection approach that identifies groups of associated genes by incorporating biological network information, called module biomarkers. Different from traditional data-driven group feature selection methods, we identified the ‘active subnetworks’ within a biological network context. The motivation is that a disease or clinical response may be viewed as an emergent behaviour of a biological network that is altered by the complex interplay of genetic and environmental stimuli. Individual genes tend to collaborate to carry out some specific biological function, in which these genes are called a functional module. In our study, we decomposed biological networks into network motifs – statistically over-represented subgraphs. Cancer-associated genes have been shown to be enriched in particular network motif types, called hotspots, in the mammalian cellular signalling network (Awan et al., 2007). These hotspots are potentially biomarker clusters or drug target clusters for curing cancer. If a cancer-related gene is mutated in one phenotype, this mutation will influence its surrounding interaction partners at a functional module level. Since the cancer-related genes are usually upstream disease ‘drivers’, they tend not to be highly differentially expressed compared to their downstream ‘passenger’ genes. On the other hand, these disease driver genes are more stable and study-independent than their downstream ‘passenger’ genes across and within patient samples. We hypothesise that these functional modules are expected to have higher stability and reproducibility in unknown samples, since they have disease ‘drivers’ as the hubs, surrounded by their downstream ‘passengers’. Our findings demonstrated that module biomarkers are more enriched with these disease driver genes such as TP53, which could not be identified by gene-based univariate methods (e.g., t statistic). The reliability of the module biomarkers from different dataset were compared to the gene-based approach. The overlaps of module biomarkers from different datasets were largely improved, further confirming that the module biomarkers we identified are likely to be involved in cancer-related mechanisms.
Also, we introduced in this paper a strategy in which a set of ensemble feature selection methods was applied to improve biomarker stability and classification performance. In module space, the ensemble feature selection methods were combined with a double-validation strategy to select the optimal module biomarkers according to

16 Y. Zhang et al.
their classification accuracy on independent datasets. The stability of our ensemble feature selection approach was improved compared to the non-ensemble method (Figure 4). This is particularly convenient, since it corresponds to sizes of practical interest for the design of a diagnosis/predictive model. As high-quality interaction data become available, such hybrid feature selection methods will help us exploit more disease-related information in these and other similar datasets available in human diseases.
Acknowledgements
This research was supported in part by National Institutes of Health Grants (R21CA139246 and R01GM086746) and National Science Foundation Grant (IIS-0812246).
References Awan, A., Bari, H., Yan, F., Moksong, S., Yang, S., Chowdhury, S., Cui, Q., Yu, Z., Purisima, E.O.
and Wang, E. (2007) ‘Regulatory network motifs and hotspots of cancer genes in a mammalian cellular signalling network’, IET Syst. Biol., Vol. 1, No. 5, pp.292–297.
Azuaje, F. (2010) ‘What does systems biology mean for biomarker discovery?’, Expert Opinion on Medical Diagnostics, Vol. 4, No. 1, pp.1–10.
Bader, G.D., Betel, D. and Hogue, C.W. (2003) ‘BIND: the Biomolecular Interaction Network Database’, Nucleic Acids Res., Vol. 31, No. 1, pp.248–250.
Basso, K., Margolin, A.A., Stolovitzky, G., Klein, U., Dalla-Favera, R. and Califano, A. (2005) ‘Reverse engineering of regulatory networks in human B cells’, Nat. Genet., Vol. 37, No. 4, pp.382–390.
Ben-Dor, A., Shamir, R. and Yakhini, Z. (1999) ‘Clustering gene expression patterns’, J. Comput. Biol., Vol. 6, Nos. 3–4, pp.281–297.
Beuming, T., Skrabanek, L., Niv, M.Y., Mukherjee, P. and Weinstein, H. (2005) ‘PDZBase: a protein-protein interaction database for PDZ-domains’, Bioinformatics, Vol. 21, No. 6, pp.827, 828.
Boser, B.E., Guyon, I.M. and Vapnik, V. (1992) ‘A training algorithm for optimal margin classifiers’, Proceedings of the Fifth Annual Workshop on Computational Learning Theory, Pittsburg, pp.144–152.
Braga-Neto, U.M. and Dougherty, E.R. (2004) ‘Is cross-validation valid for small-sample microarray classification?’, Bioinformatics, Vol. 20, No. 3, pp.374–380.
Brynildsen, M.P. and Collins, J.J. (2009) ‘Systems biology makes it personal’, Mol. Cell, Vol. 34, No. 2, pp.137–138.
Calvano, S.E., Xiao, W., Richards, D.R., Felciano, R.M., Baker, H.V., Cho, R.J., Chen, R.O., Brownstein, B.H., Cobb, J.P., Tschoeke, S.K., Miller-Graziano, C., Moldawer, L.L., Mindrinos, M.N., Davis, R.W., Tompkins, R.G. and Lowry, S.F. (2005) ‘A network-based analysis of systemic inflammation in humans’, Nature, Vol. 437, No. 7061, pp.1032–1037.
Chatr-aryamontri, A., Ceol, A., Palazzi, L.M., Nardelli, G., Schneider, M.V., Castagnoli, L. and Cesareni, G. (2007) ‘MINT: the Molecular INTeraction database’, Nucleic Acids Res., Vol. 35, Database issue, pp.D572–D574.
Chen, J. and Yuan, B. (2006) ‘Detecting functional modules in the yeast protein-protein interaction network’, Bioinformatics, Vol. 22, No. 18, pp.2283–2290.
Chuang, H.Y., Lee, E., Liu, Y.T., Lee, D. and Ideker, T. (2007) ‘Network-based classification of breast cancer metastasis’, Mol. Syst. Biol., Vol. 3, p.140.
Module-based breast cancer classification 17
Clarke, R., Ressom, H.W., Wang, A., Xuan, J., Liu, M.C., Gehan, E.A. and Wang, Y. (2008) ‘The properties of high-dimensional data spaces: implications for exploring gene and protein expression data’, Nat Rev Cancer., Vol. 8, No. 1, pp.37–49.
Dorigo, M., Di Caro, G. and Gambardella, L.M. (1999) ‘Ant algorithms for discrete optimization’, Artif. Life, Vol. 5, No. 2, pp.137–172.
Duan, K.B., Rajapakse, J.C., Wang, H. and Azuaje, F. (2005) ‘Multiple SVM-RFE for gene selection in cancer classification with expression data’, IEEE Trans. Nanobioscience, Vol. 4, No. 3, pp.228–234.
Ein-Dor, L., Kela, I., Getz, G., Givol, D. and Domany, E. (2005) ‘Outcome signature genes in breast cancer: is there a unique set?’, Bioinformatics, Vol. 21, No. 2, pp.171–178.
Ergun, A., Lawrence, C.A., Kohanski, M.A., Brennan, T.A., and Collins, J.J. (2007) ‘A network biology approach to prostate cancer’, Mol. Syst. Biol., Vol. 3, p.82.
Golub, T.R., Slonim, D.K., Tamayo, P., Huard, C., Gaasenbeek, M., Mesirov, J.P., Coller, H., Loh, M.L., Downing, J.R., Caligiuri, M.A., Bloomfield, C.D. and Lander, E.S. (1999) ‘Molecular classification of cancer: class discovery and class prediction by gene expression monitoring’, Science, Vol. 286, No.5439, pp.531–537.
Hastie, T., Tibshirani, R., Eisen, M.B., Alizadeh, A., Levy, R., Staudt, L., Chan, W.C., Botstein, D. and Brown, P. (2000) ‘‘Gene shaving’ as a method for identifying distinct sets of genes with similar expression patterns’, Genome Biol., Vol. 1, No. 2, p.RESEARCH0003.
Hermjakob, H., Montecchi-Palazzi, L., Lewington, C., Mudali, S., Kerrien, S., Orchard, S., Vingron, M., Roechert, B., Roepstorff, P., Valencia, A., Margalit, H., Armstrong, J., Bairoch, A., Cesareni, G., Sherman, D. and Apweiler, R. (2004) ‘IntAct: an open source molecular interaction database’, Nucleic Acids Res., Vol. 32, Database issue, pp.D452–D455.
Ideker, T., Ozier, O., Schwikowski, B. and Siegel, A.F. (2002) ‘Discovering regulatory and signalling circuits in molecular interaction networks’, Bioinformatics, Vol. 18, Suppl 1., pp.S233–S240.
Ioannidis, J.P. (2005) ‘Microarrays and molecular research: noise discovery?’, Lancet, Vol. 365, No. 9458, pp.454–455.
Joshi-Tope, G., Gillespie, M., Vastrik, I., D’Eustachio, P., Schmidt, E., de Bono, B., Jassal, B., Gopinath, G.R., Wu, G.R., Matthews, L., Lewis, S., Birney, E. and Stein, L. (2005) ‘Reactome: a knowledgebase of biological pathways’, Nucleic Acids Res., Vol. 33, Database issue, pp.D428–D432.
Lage, K., Karlberg, E.O., Storling, Z.M., Olason, P.I., Pedersen, A.G., Rigina, O., Hinsby, A.M., Tumer, Z., Pociot, F., Tommerup, N., Moreau, Y. and Brunak, S. (2007) ‘A human phenome-interactome network of protein complexes implicated in genetic disorders’, Nat. Biotechnol., Vol. 25, No. 3, pp.309–316.
Lee, E., Chuang, H.Y., Kim, J.W., Ideker, T. and Lee, D. (2008) ‘Inferring pathway activity toward precise disease classification’, PLoS Comput. Biol., Vol. 4, No. 11, p.e1000217.
Lim, W.K., Lyashenko, E. and Califano, A. (2009) ‘Master regulators used as breast cancer metastasis classifier’, Pac. Symp. Biocomput., Vol. 14, pp.504–515.
Loi, S., Haibe-Kains, B., Desmedt, C., Wirapati, P., Lallemand, F., Tutt, A.M., Gillet, C., Ellis, P., Ryder, K., Reid, J.F., Daidone, M.G., Pierotti, M.A., Berns, E.M., Jansen, M.P., Foekens, J.A., Delorenzi, M., Bontempi, G., Piccart, M.J. and Sotiriou, C. (2008) ‘Predicting prognosis using molecular profiling in estrogen receptor-positive breast cancer treated with tamoxifen’, BMC Genomics, Vol. 9, p.239.
Lonning, P.E., Sorlie, T. and Borresen-Dale, A.L. (2005) ‘Genomics in breast cancer-therapeutic implications’, Nat. Clin. Pract. Oncol., Vol. 2, No. 1, pp.26–33.
Ma’ayan, A., Jenkins, S.L., Neves, S., Hasseldine, A., Grace, E., Dubin-Thaler, B., Eungdamrong, N.J., Weng, G., Ram, P.T., Rice, J.J., Kershenbaum, A., Stolovitzky, G.A., Blitzer, R.D. and Iyengar, R. (2005) ‘Formation of regulatory patterns during signal propagation in a mammalian cellular network’, Science, Vol. 309, No. 5737, pp.1078–1083.
18 Y. Zhang et al.
Matys, V., Fricke, E., Geffers, R., Gossling, E., Haubrock, M., Hehl, R., Hornischer, K., Karas, D., Kel, A.E., Kel-Margoulis, O.V., Kloos, D.U., Land, S., Lewicki-Potapov, B., Michael, H., Munch, R., Reuter, I., Rotert, S., Saxel, H., Scheer, M., Thiele, S. and Wingender, E. (2003) ‘TRANSFAC: transcriptional regulation, from patterns to profiles’, Nucleic Acids Res., Vol. 31, No. 1, pp.374–378.
Michiels, S., Koscielny, S. and Hill, C. (2005) ‘Prediction of cancer outcome with microarrays: a multiple random validation strategy’, Lancet, Vol. 365, No. 9458, pp.488–492.
Milo, R., Shen-Orr, S., Itzkovitz, S., Kashtan, N., Chklovskii, D. and Alon, U. (2002) ‘Network motifs: simple building blocks of complex networks’, Science, Vol. 298, No. 5594, pp.824–827.
Narsing, S., Jelsovsky, Z., Mbah, A. and Blanck, G. (2009) ‘Genes that contribute to cancer fusion genes are large and evolutionarily conserved’, Cancer Genet. Cytogenet., Vol. 191, No. 2, pp.78–84.
Pagel, P., Kovac, S., Oesterheld, M., Brauner, B., Dunger-Kaltenbach, I., Frishman, G., Montrone, C., Mark, P., Stumpflen, V., Mewes, H.W., Ruepp, A. and Frishman, D. (2005) ‘The MIPS mammalian protein-protein interaction database’, Bioinformatics, Vol. 21, No. 6, pp.832–834.
Peri, S., Navarro, J.D., Amanchy, R., Kristiansen, T.Z., Jonnalagadda, C.K., Surendranath, V., Niranjan, V., Muthusamy, B., Gandhi, T.K., Gronborg, M., Ibarrola, N., Deshpande, N., Shanker, K., Shivashankar, H.N., Rashmi, B.P., Ramya, M.A., Zhao, Z., Chandrika, K.N., Padma, N., Harsha, H.C., Yatish, A.J., Kavitha, M.P., Menezes, M., Choudhury, D.R., Suresh, S., Ghosh, N., Saravana, R., Chandran, S., Krishna, S., Joy, M., Anand, S.K., Madavan, V., Joseph, A., Wong, G.W., Schiemann, W.P., Constantinescu, S.N., Huang, L., Khosravi-Far, R., Steen, H., Tewari, M., Ghaffari, S., Blobe, G.C., Dang, C.V., Garcia, J.G., Pevsner, J., Jensen, O.N., Roepstorff, P., Deshpande, K.S., Chinnaiyan, A.M., Hamosh, A., Chakravarti, A. and Pandey, A. (2003) ‘Development of human protein reference database as an initial platform for approaching systems biology in humans’, Genome Res., Vol. 13, No. 10, pp.2363–2371.
Ramaswamy, S., Tamayo, P., Rifkin, R., Mukherjee, S., Yeang, C.H., Angelo, M., Ladd, C., Reich, M., Latulippe, E., Mesirov, J.P., Poggio, T., Gerald, W., Loda, M., Lander, E.S. and Golub, T.R. (2001) ‘Multiclass cancer diagnosis using tumor gene expression signatures’, Proc. Natl. Acad. Sci. USA, Vol. 98, No. 26, pp.15149–15154.
Ressom, H.W., Varghese, R.S., Drake, S.K., Hortin, G.L., Abdel-Hamid, M., Loffredo, C.A. and Goldman, R. (2007) ‘Peak selection from MALDI-TOF mass spectra using ant colony optimization’, Bioinformatics, Vol. 23, No. 5, pp.619–626.
Rual, J.F., Venkatesan, K., Hao, T., Hirozane-Kishikawa, T., Dricot, A., Li, N., Berriz, G.F., Gibbons, F.D., Dreze, M., Ayivi-Guedehoussou, N., Klitgord, N., Simon, C., Boxem, M., Milstein, S., Rosenberg, J., Goldberg, D.S., Zhang, L.V., Wong, S.L., Franklin, G., Li, S., Albala, J.S., Lim, J., Fraughton, C., Llamosas, E., Cevik, S., Bex, C., Lamesch, P., Sikorski, R.S., Vandenhaute, J., Zoghbi, H.Y., Smolyar, A., Bosak, S., Sequerra, R., Doucette-Stamm, L., Cusick, M.E., Hill, D.E., Roth, F.P. and Vidal, M. (2005) ‘Towards a proteome-scale map of the human protein-protein interaction network’, Nature, Vol. 437, No. 7062, pp.1173–1178.
Segal, E., Friedman, N., Koller, D. and Regev, A. (2004) ‘A module map showing conditional activity of expression modules in cancer’, Nat. Genet., Vol. 36, No. 10, pp.1090–1098.
Shen-Orr, S.S., Milo, R., Mangan, S. and Alon, U. (2002) ‘Network motifs in the transcriptional regulation network of Escherichia coli’, Nat. Genet., Vol. 31, No. 1, pp.64–68.
Stelzl, U., Worm, U., Lalowski, M., Haenig, C., Brembeck, F.H., Goehler, H., Stroedicke, M., Zenkner, M., Schoenherr, A., Koeppen, S., Timm, J., Mintzlaff, S., Abraham, C., Bock, N., Kietzmann, S., Goedde, A., Toksoz, E., Droege, A., Krobitsch, S., Korn, B., Birchmeier, W., Lehrach, H. and Wanker, E.E. (2005) ‘A human protein-protein interaction network: a resource for annotating the proteome’, Cell, Vol. 122, No. 6, pp.957–968.
Tian, L., Greenberg, S.A., Kong, S.W., Altschuler, J., Kohane, I.S. and Park, P.J. (2005) ‘Discovering statistically significant pathways in expression profiling studies’, Proc. Natl. Acad. Sci. USA., Vol. 102, No. 38, pp.13544–13549.
Module-based breast cancer classification 19
Tomlins, S.A., Rhodes, D.R., Perner, S., Dhanasekaran, S.M., Mehra, R., Sun, X.W., Varambally, S., Cao, X., Tchinda, J., Kuefer, R., Lee, C., Montie, J.E., Shah, R.B., Pienta, K.J., Rubin, M.A. and Chinnaiyan, A.M. (2005) ‘Recurrent fusion of TMPRSS2 and ETS transcription factor genes in prostate cancer’, Science, Vol. 310, No. 5748, pp.644–648.
Tourassi, G.D., Frederick, E.D., Markey, M.K. and Floyd Jr., C.E. (2001) ‘Application of the mutual information criterion for feature selection in computer-aided diagnosis’, Med. Phys., Vol. 28, No. 12, pp.2394–2402.
van de Vijver, M.J., He, Y.D., van’t Veer, L.J., Dai, H., Hart, A.A., Voskuil, D.W., Schreiber, G.J., Peterse, J.L., Roberts, C., Marton, M.J., Parrish, M., Atsma, D., Witteveen, A., Glas, A., Delahaye, L., van der Velde, T., Bartelink, H., Rodenhuis, S., Rutgers, E.T., Friend, S.H. and Bernards, R. (2002) ‘A gene-expression signature as a predictor of survival in breast cancer’, N. Engl. J. Med., Vol. 347, No. 25, pp.1999–2009.
van’t Veer, L.J., Dai, H., van de Vijver, M.J., He, Y.D., Hart, A.A., Mao, M., Peterse, H.L., van der Kooy, K., Marton, M.J., Witteveen, A.T., Schreiber, G.J., Kerkhoven, R.M., Roberts, C., Linsley, P.S., Bernards, R. and Friend, S.H. (2002) ‘Gene expression profiling predicts clinical outcome of breast cancer’, Nature, Vol. 415, No. 6871, pp.530–536.
Wang, E., Lenferink, A. and O’Connor-McCourt, M. (2007) ‘Cancer systems biology: exploring cancer-associated genes on cellular networks’, Cell Mol. Life Sci., Vol. 64, No. 14, pp.1752–1762.
Wang, Y., Klijn, J.G., Zhang, Y., Sieuwerts, A.M., Look, M.P., Yang, F., Talantov, D., Timmermans, M., Meijer-van Gelder, M.E., Yu, J., Jatkoe, T., Berns, E.M., Atkins, D. and Foekens, J.A. (2005) ‘Gene-expression profiles to predict distant metastasis of lymph-node-negative primary breast cancer’, Lancet, Vol. 365, No. 9460, pp.671–679.
Wernicke, S. and Rasche, F. (2006) ‘FANMOD: a tool for fast network motif detection’, Bioinformatics, Vol. 22, No. 9, pp.1152–1153.
Xenarios, I., Salwinski, L., Duan, X.J., Higney, P., Kim, S.M. and Eisenberg, D. (2002) ‘DIP, the database of interacting proteins: a research tool for studying cellular networks of protein interactions’, Nucleic Acids Res., Vol. 30, No. 1, pp.303–305.
Yeger-Lotem, E., Sattath, S., Kashtan, N., Itzkovitz, S., Milo, R., Pinter, R.Y., Alon, U. and Margalit, H. (2004) ‘Network motifs in integrated cellular networks of transcription-regulation and protein-protein interaction’, Proc. Natl. Acad. Sci. USA, Vol. 101, No. 16, pp.5934–5939.
Zhang, Y., Xuan, J., de Los Reyes, B.G., Clarke, R. and Ressom, H.W. (2008) ‘Network motif-based identification of breast cancer susceptibility genes’, Conf. Proc. IEEE Eng. Med. Biol. Soc. (EMBC 2008), Vancouver, British Columbia, Canada.