module: introductions3-us-west-1.amazonaws.com/hcp-inc/report/cdp_2017_response_fi… · module:...
TRANSCRIPT

CDP Climate Change 2017 Information Request HCP Inc.
Module: Introduction
Page: Introduction
CC0.1
Introduction Please give a general description and introduction to your organization. HCP, Inc. (“HCP” or the “Company”), an S&P 500 company, invests primarily in real estate serving the healthcare industry in the United States. We are a Maryland corporation organized in 1985 and qualify as a self-administered real estate investment trust (“REIT”). We are headquartered in Irvine, California, with offices in Nashville and San Francisco. Our diverse portfolio is comprised of investments in the following healthcare segments: (i) senior housing triple-net (“SH NNN”), (ii) senior housing operating portfolio (“SHOP”), (iii) life science and (iv) medical office. For more information regarding HCP, please visit our website at www.hcpi.com.
CC0.2
Reporting Year Please state the start and end date of the year for which you are reporting data. The current reporting year is the latest/most recent 12-month period for which data is reported. Enter the dates of this year first. We request data for more than one reporting period for some emission accounting questions. Please provide data for the three years prior to the current reporting year if you have not provided this information before, or if this is the first time you have answered a CDP information request. (This does not apply if you have been offered and selected the option of answering the shorter questionnaire). If you are going to provide additional years of data, please give the dates of those reporting periods here. Work backwards from the most recent reporting year. Please enter dates in following format: day(DD)/month(MM)/year(YYYY) (i.e. 31/01/2001).

Enter Periods that will be disclosed
Fri 01 Jan 2016 - Sat 31 Dec 2016
CC0.3
Country list configuration Please select the countries for which you will be supplying data. If you are responding to the Electric Utilities module, this selection will be carried forward to assist you in completing your response.
Select country
United States of America
CC0.4
Currency selection Please select the currency in which you would like to submit your response. All financial information contained in the response should be in this currency. USD($)
CC0.6
Modules As part of the request for information on behalf of investors, companies in the electric utility sector, companies in the automobile and auto component manufacturing sector, companies in the oil and gas sector, companies in the information and communications technology sector (ICT) and companies in the food, beverage and tobacco sector (FBT) should complete supplementary questions in addition to the core questionnaire.

If you are in these sector groupings, the corresponding sector modules will not appear among the options of question CC0.6 but will automatically appear in the ORS navigation bar when you save this page. If you want to query your classification, please email [email protected]. If you have not been presented with a sector module that you consider would be appropriate for your company to answer, please select the module below in CC0.6.
Further Information
Module: Management
Page: CC1. Governance
CC1.1
Where is the highest level of direct responsibility for climate change within your organization? Board or individual/sub-set of the Board or other committee appointed by the Board
CC1.1a
Please identify the position of the individual or name of the committee with this responsibility (i) Senior Managing Director, and Chair of the Sustainability Committee. (ii) Direct responsibility for climate change within the Company resides with Thomas M. Klaritch, Senior Managing Director – Medical Office Properties, and Chair of our Sustainability Committee. Mr. Klaritch reports directly to our Executive Chairman, Mike McKee, and our Chief Executive Officer, Tom Herzog, both of which are also members of our Board of Directors ("Board"). As the Sustainability Committee Chair, Mr. Klaritch is directly responsible for the Company’s sustainability efforts including, among other things, increasing performance and efficiency across our properties, tracking energy, water, waste, and greenhouse gas (GHG) data, and publishing the Company’s annual Sustainability Report aligned with the Global Reporting Initiative (GRI) framework. He is also responsible for implementing sustainable best practices and transparency initiatives, including the Company’s responses to the CDP Climate Change Information Request (CDP), the Dow Jones Sustainability Index Assessment (DJSI), and the Global Real Estate Sustainability Benchmark Survey (GRESB). Mr. Klaritch meets periodically with the Sustainability Committee regarding sustainability goals and the performance metrics associated with the Company’s sustainability initiatives, and this information is utilized to formulate our overall climate change strategy. Additionally, Mr. Klaritch serves on the sustainability committee of the National Association of Real Estate Investment Trusts (NAREIT), giving HCP added insight into current sustainability issues and initiatives relative to the healthcare real estate sector.

CC1.2
Do you provide incentives for the management of climate change issues, including the attainment of targets? Yes
CC1.2a
Please provide further details on the incentives provided for the management of climate change issues
Who is entitled to benefit from these incentives?
The type of incentives
Incentivized performance
indicator
Comment
Corporate executive team Recognition (non-monetary)
Emissions reduction project Emissions reduction target Energy reduction project Energy reduction target Efficiency project Efficiency target
To the extent that the Company receives external recognition (e.g. USGBC LEED certification, EPA ENERGY STAR certification, NAREIT’s Leader in the Light Award) for its sustainability efforts, internal acknowledgement of efforts are recognized.
Executive officer Monetary reward
Emissions reduction target Energy reduction target Efficiency target
The Company’s current compensation program is based on three components, which are designed to be consistent with our compensation philosophy: (i) base salaries; (ii) incentive cash bonuses; and (iii) incentive long-term stock awards, including awards of restricted stock units that are subject to both performance-based and time-based vesting requirements. Elements of our compensation program such as annual bonuses and long-term equity incentives are designed to reward performance and provide incentives that seek to create shareholder value. Annual bonuses are primarily intended to incentivize employees to achieve specific strategies and operating objectives. For a given fiscal year, the Compensation Committee and/or our senior executives make incentive compensation decisions retrospectively for both annual and long-term incentives after the end of the year, to

Who is entitled to benefit from these incentives?
The type of incentives
Incentivized performance
indicator
Comment
evaluate performance during that year. That is, bonus payments and long-term incentive compensation awards granted in January 2017 were based in part on an assessment of performance during 2016. The Company’s sustainability performance (which includes climate change performance) is a factor considered in the financial compensation for members of our Sustainability Committee, as well as other employees in the business sectors involved in HCP’s sustainability initiatives. For example, factors such as meeting an annually established emission or energy reduction target and participation in and performance of sustainability surveys and reports (e.g., CDP, GRESB) are considered when calculating incentive awards. Additionally, 2016 sustainability goals for certain executive officers included factors such as meeting 1-2% emission, energy, water, and waste reduction targets as consideration when calculating incentive awards.
Executive officer Recognition (non-monetary)
Emissions reduction project Emissions reduction target Energy reduction project Energy reduction target Efficiency project Efficiency target
To the extent that the Company receives external recognition (e.g. USGBC LEED certification, EPA ENERGY STAR certification, NAREIT’s Leader in the Light Award) for its sustainability efforts, internal acknowledgement of efforts are recognized.
Management group Monetary reward
Emissions reduction target Energy reduction target Efficiency target
The Company’s current compensation program is based on three components, which are designed to be consistent with our compensation philosophy: (i) base salaries; (ii) incentive cash bonuses; and (iii) incentive long-term stock awards, including awards of restricted stock units that are subject to both performance-based and time-based vesting requirements. Elements of our compensation program such as annual bonuses and long-term equity incentives are designed to reward performance and provide incentives that seek to create shareholder value. Annual bonuses are primarily intended to incentivize employees to achieve specific strategies and operating objectives. For a given fiscal year, the Compensation Committee and/or our senior executives make incentive compensation decisions retrospectively for both annual and long-term incentives after the end of the year, to evaluate performance during that year. That is, bonus payments and long-term incentive

Who is entitled to benefit from these incentives?
The type of incentives
Incentivized performance
indicator
Comment
compensation awards granted in January 2017 were based in part on an assessment of performance during 2016. The Company’s sustainability performance (which includes climate change performance) is a factor considered in the financial compensation for members of our Sustainability Committee, as well as other employees in the business sectors involved in HCP’s sustainability initiatives. For example, factors such as meeting an annually established emission or energy reduction target and participation in and performance of sustainability surveys and reports (e.g., CDP, GRESB) are considered when calculating incentive awards. Additionally, 2016 sustainability goals for certain executive officers included factors such as meeting 1-2% emission, energy, water, and waste reduction targets as consideration when calculating incentive awards.
Management group Recognition (non-monetary)
Emissions reduction project Emissions reduction target Energy reduction project Energy reduction target Efficiency project Efficiency target
To the extent that the Company receives external recognition (e.g. USGBC LEED certification, EPA ENERGY STAR certification, NAREIT’s Leader in the Light Award) for its sustainability efforts, internal acknowledgement of efforts are recognized.
Business unit managers Monetary reward
Emissions reduction target Energy reduction target Efficiency target
The Company’s current compensation program is based on three components, which are designed to be consistent with our compensation philosophy: (i) base salaries; (ii) incentive cash bonuses; and (iii) incentive long-term stock awards, including awards of restricted stock units that are subject to both performance-based and time-based vesting requirements. Elements of our compensation program such as annual bonuses and long-term equity incentives are designed to reward performance and provide incentives that seek to create shareholder value. Annual bonuses are primarily intended to incentivize employees to achieve specific strategies and operating objectives. For a given fiscal year, the Compensation Committee and/or our senior executives make incentive compensation decisions retrospectively for both annual and long-term incentives after the end of the year, to evaluate performance during that year. That is, bonus payments and long-term incentive compensation awards granted in January 2017 were based in part on an assessment of

Who is entitled to benefit from these incentives?
The type of incentives
Incentivized performance
indicator
Comment
performance during 2016. The Company’s sustainability performance (which includes climate change performance) is a factor considered in the financial compensation for members of our Sustainability Committee, as well as other employees in the business sectors involved in HCP’s sustainability initiatives. For example, factors such as meeting an annually established emission or energy reduction target and participation in and performance of sustainability surveys and reports (e.g., CDP, GRESB) are considered when calculating incentive awards. Additionally, 2016 sustainability goals for certain executive officers included factors such as meeting 1-2% emission, energy, water, and waste reduction targets as consideration when calculating incentive awards.
Business unit managers Recognition (non-monetary)
Emissions reduction project Emissions reduction target Energy reduction project Energy reduction target Efficiency project Efficiency target
To the extent that the Company receives external recognition (e.g. USGBC LEED certification, EPA ENERGY STAR certification, NAREIT’s Leader in the Light Award) for its sustainability efforts, internal acknowledgement of efforts are recognized.
Environment/Sustainability managers
Monetary reward
Emissions reduction project Emissions reduction target Energy reduction project Energy reduction target Efficiency project Efficiency target
The Company’s current compensation program is based on three components, which are designed to be consistent with our compensation philosophy: (i) base salaries; (ii) incentive cash bonuses; and (iii) incentive long-term stock awards, including awards of restricted stock units that are subject to both performance-based and time-based vesting requirements. Elements of our compensation program such as annual bonuses and long-term equity incentives are designed to reward performance and provide incentives that seek to create shareholder value. Annual bonuses are primarily intended to incentivize employees to achieve specific strategies and operating objectives. For a given fiscal year, the Compensation Committee and/or our senior executives make incentive compensation decisions retrospectively for both annual and long-term incentives after the end of the year, to evaluate performance during that year. That is, bonus payments and long-term incentive compensation awards granted in January 2017 were based in part on an assessment of performance during 2016. The Company’s sustainability performance (which includes climate

Who is entitled to benefit from these incentives?
The type of incentives
Incentivized performance
indicator
Comment
change performance) is a factor considered in the financial compensation for members of our Sustainability Committee, as well as other employees in the business sectors involved in HCP’s sustainability initiatives. For example, factors such as meeting an annually established emission or energy reduction target and participation in and performance of sustainability surveys and reports (e.g., CDP, GRESB) are considered when calculating incentive awards. Accordingly, 2016 sustainability goals for certain executive officers included factors such as meeting 1-2% emission, energy, water, and waste reduction targets as consideration when calculating incentive awards. Additionally, a "spot" bonus may be allocated to a sustainability manager/director for target achievement and/or sustainability reporting performance.
Environment/Sustainability managers
Recognition (non-monetary)
Emissions reduction project Emissions reduction target Energy reduction project Energy reduction target Efficiency project Efficiency target
To the extent that the Company receives external recognition (e.g. USGBC LEED certification, EPA ENERGY STAR certification, NAREIT’s Leader in the Light Award) for its sustainability efforts, internal acknowledgement of efforts are recognized.
Further Information
Page: CC2. Strategy
CC2.1
Please select the option that best describes your risk management procedures with regard to climate change risks and opportunities Integrated into multi-disciplinary company wide risk management processes

CC2.1a
Please provide further details on your risk management procedures with regard to climate change risks and opportunities
Frequency of monitoring
To whom are results
reported?
Geographical areas considered
How far into the future are risks
considered?
Comment
Six-monthly or more frequently
Board or individual/sub-set of the Board or committee appointed by the Board
As of December 31, 2016, we had 802 properties in the United States ("U.S.") and Europe; therefore all U.S. geographical areas are considered within the continental U.S., as well as areas of Europe in which our properties are located.
> 6 years
CC2.1b
Please describe how your risk and opportunity identification processes are applied at both company and asset level Company Level. Risk and opportunity ("R/O") identification processes are applied at the company level by our business segment leaders, including our senior executives, through input received from our Board, as well as through feedback received from our stakeholders. R/Os are also assessed monthly by executive management and reviewed by the Board quarterly (such as regulatory and reputational R/Os, for example). This assessment includes a discussion of potential R/Os, and the potential impact, directional trend, and likelihood, as well as a determination as to whether the R/Os are growing, stable or declining. The R/Os are also measured against the previous assessment and mitigants are reviewed and discussed. Our executive team reviews the prior year’s top R/Os and determines if any should be removed from the current period, and then assesses other potential R/Os that should be added to the universe. Asset Level. Our R/O identification processes are applied at the asset (or property) level by our profit and loss leaders, and other internal groups such as Risk Management and Capital Asset Management. For example, these groups develop strategies for addressing weather-related R/Os in addition to the facilitation and implementation of any necessary course of action to be taken. In the event of severe weather conditions, action plans are implemented and post-storm preparations are put into place locally for our affected properties. Our Capital Asset Management group is frequently in contact with our property managers regarding any issues affecting the local market. Monthly reports are submitted and reviewed regarding the operations at each property, along with any developing R/Os that could affect the property. In addition, our annual budget process includes an assessment identifying strengths, weaknesses and threats applied the asset level.
CC2.1c

How do you prioritize the risks and opportunities identified? Our semi-annual Enterprise Risk Assessment survey is utilized to prioritize risks and opportunities ("R/Os"). The survey provides critical information regarding opportunities and key business risks which could impact our ability to achieve our primary business objectives, including our sustainability initiatives. As part of our R/O identification process, our executive team, as well as all senior vice presidents, review the prior year’s top R/Os and determine if any should be removed from the current period, and assesses other potential R/Os that should be added to the universe. For each of the R/Os identified, the impact, likelihood, and directional trend is assessed. The risks are then assessed based on residual risk, which is the remaining risk after consideration of mitigating controls currently in place. After the survey information is evaluated, a facilitated session is held to discuss the results as well as mitigating activities and the controls in place within the Company. Finally, a summary of the survey results is presented to the Board of Directors for strategic prioritization. Additionally, in 2014, our Sustainability Committee completed a Strategic Sustainability Survey aimed at identifying and prioritizing key areas of focus with respect to sustainability. The core aspects of the Survey were assessed based on our ability to deliver strategy and create long-term value for our stakeholders. In our process of prioritization, we also factored in our level of control over each individual aspect. The results from this Survey were integrated into our reporting strategy for 2015 and 2016, and the survey is being re-assessed for re-deployment in 2017-2018.
CC2.1d
Please explain why you do not have a process in place for assessing and managing risks and opportunities from climate change, and whether you plan to introduce such a process in future
Main reason for not having a process
Do you plan to introduce a process?
Comment
CC2.2
Is climate change integrated into your business strategy? Yes
CC2.2a
Please describe the process of how climate change is integrated into your business strategy and any outcomes of this process

i. Influence on business strategy. The primary element of our business strategy is to invest and manage our real estate portfolio for the long-term to maximize the benefit to our stakeholders. Our strategy has increasingly focused on engaging stakeholders in implementing sustainability measures including those related to climate change. Our internal data collection and reporting processes have directly influenced our strategy, including data from our: a) annual tenant and employee satisfaction surveys; b) investors who incorporate climate change aspects into their investment decisions; and c) internal research regarding how sustainability may generate cost savings and create value including potential increases to returns on investment. The stakeholder data is reported to our business segments to target, develop and implement energy reduction strategies, resulting in the outcomes of the identification of climate change risks and opportunities. We then utilize process outcomes to make necessary strategy adjustments to achieve maximum benefits for our stakeholders. ii. Examples of influence on business strategy. Amending our tenant satisfaction survey to include questions regarding our green initiatives, our Code of Conduct to include a sustainability section, and implementing a Vendor Code of Conduct are prime examples of climate change initiatives have influenced our business strategy. Incorporating such sustainability initiatives into our policies have directly influenced our business strategy to invest for the long-term to maximize stakeholder benefits. iii. Aspects of climate change that have influenced the strategy. Approximately 85% of our carbon footprint is related to electricity usage; therefore, energy management is a primary cost reduction and climate change driver for us. Approximately 10% of our operating costs at the property level are electricity expenses, and a large portion of our GHG emissions are attributable to purchased electricity. Each of these climate change aspects have influenced our business strategy, requiring adaptation. As such, reducing energy usage (and consequently carbon emissions) while ensuring that the quality of our facilities support our tenants' operations, are fundamental strategy components in both the short- and long-term to maximize efficient operating performance and profitability. Furthermore, reduced energy usage aids in mitigating the impacts of projected electricity cost increases. An additional climate change aspect that has influenced our strategy is the potential for efficiency-related regulatory changes, and the need to prepare for such changes in advance of regulatory enactment. Thirdly, reputational risk associated with sustainability performance, as assessed by the investor community, is an important aspect influencing our strategy for acquisitions. iv. Climate change influence on short-term strategy. The most important components of our short-term (0-3 yrs) strategy influenced by climate change include the continued implementation of best practices, such as participation in sustainability reporting initiatives, and to improve efficiency across our properties. For example, efficiency measures at our buildings produce immediate cost savings for our tenants in the form of lower monthly utility bills. Within each of our identified business segments, management conducts monthly reviews of operational results during which progress in key areas, including energy, are reviewed against applicable budgets. This process includes the monthly delivery of reports that benchmark energy data to address issues and implement action, which directly results in the influence to, and adjustment of, our short-term strategy. Further, the monthly review of energy data includes comparisons of energy usage against budgeted and historical usage. To the extent facilities demonstrate significant variances from budget or historical usage, we seek to develop and implement mitigation plans, including but not limited to the implementation of alternative energy (solar) projects, for example. v. Climate change influence on long-term strategy. Attaining our future goals of reducing emissions, energy consumption and maximizing efficiency are important components of our long-term (4+ yrs) strategy influenced by climate change. Such components have led to increased focus on best operating practices, expanded training, the development of long-term energy reduction goals (15% by 2020, from 2011 baseline), and monitoring and reporting of results, each of which has directly resulted in the influence to, and adjustment of, our long-term business (and sustainability) strategy. Furthermore, these long-term initiatives are enhanced by the development of detailed and systematic processes to invest in more energy efficient technologies, which, over the long-term, enhance our portfolio thus maximizing benefits to our stakeholders. vi. Competitive advantages. Our continued implementation of more robust energy, emissions, water and waste saving measures will provide us with an advantage over our competitors not employing these strategies. Passing on cost-savings from our efficiency measures to our tenants makes our properties more desirable and affordable to lease than those of our competitors that have higher leasing rates to cover costs of their inefficient buildings. Additional examples of advantages include obtaining new tenants seeking energy efficient facilities and new investors who prefer to invest in companies that address climate change. vii. Substantial business decisions influenced by climate change driven aspects of strategy. One of our substantial business decisions made in 2016 was to invest in several of our aging buildings through modernization upgrades. Climate change aspects, including but not limited to warmer temperatures and more severe droughts, directly influenced this decision, as we implemented high efficiency HVACs and water-resistant landscaping, instead of a just a fresh coat of paint and more modern furniture. Another substantial business decision made in 2016 was to assess the common areas of several our current and newly acquired properties for renovation needs. We determined to implement a Common Area LED Lighting Retrofit Program, to improve lighting quality for our tenants as well as reduce our GHG emissions, energy consumption and costs. These climate change aspects (reduced consumption thus reducing emissions) directly influenced our decision to

create this program to focus on the benefits of LED lighting for our common areas to enhance the traditional renovations we typically implemented. viii. Paris Agreement influence on business strategy. This agreement does not currently have an influence on our strategy due to the recent (and unfortunate) U.S. political considerations to remove the U.S. from the agreement. ix. Use of forward-looking scenario analyses. We are in the process of developing these at this time.
CC2.2b
Please explain why climate change is not integrated into your business strategy
CC2.2c
Does your company use an internal price on carbon? No, and we currently don't anticipate doing so in the next 2 years
CC2.2d
Please provide details and examples of how your company uses an internal price on carbon
CC2.3
Do you engage in activities that could either directly or indirectly influence public policy on climate change through any of the following? (tick all that apply) Trade associations
CC2.3a

On what issues have you been engaging directly with policy makers?
Focus of legislation
Corporate Position
Details of engagement
Proposed legislative solution
CC2.3b
Are you on the Board of any trade associations or provide funding beyond membership? Yes
CC2.3c
Please enter the details of those trade associations that are likely to take a position on climate change legislation
Trade association
Is your position
on climate change
consistent with
theirs?
Please explain the trade association's position
How have you, or are you attempting to, influence the position?
NAREIT (REITPAC) Consistent
NAREIT (National Association of Real Estate Investment Trusts) is a worldwide representative for REITs and publicly traded real estate companies with an interest in U.S. real estate and capital markets. NAREIT sponsors its own political action committee called REITPAC to address a variety of climate change legislation. REITPAC encourages individual participation in the political process to ensure that the REIT viewpoint on industry issues is heard on Capitol Hill. By pooling the voluntary contributions of NAREIT members nationwide, REITPAC works to educate Members of Congress and their staff on the issues that directly affect our industry and support those candidates who understand the interests of the commercial real estate industry. For example, NAREIT and REITPAC are involved with encouraging modifications to Section 179D of the Internal Revenue Code, which provides deductions for Energy Efficient
HCP supports the position of NAREIT and REITPAC to encourage Congressional leaders to enact comprehensive legislation that benefits the healthcare real estate industry and encourages greater energy efficiency. HCP is an active member of NAREIT and we participate in their conferences and forums throughout the year. Our President and CEO serves on the Board of Governors of NAREIT, and our Sustainability Committee Chair serves on NAREIT’s sustainability committee. Additionally, in 2016, HCP supported NAREIT’s legislative agenda by organizing a voluntary executive fundraising effort for REITPAC that contributed over $20,000.

Trade association
Is your position
on climate change
consistent with
theirs?
Please explain the trade association's position
How have you, or are you attempting to, influence the position?
Commercial Buildings. Additionally, NAREIT and REITPAC support Congressional efforts to enact comprehensive legislation that encourages greater energy efficiency. To the extent that such legislation authorizes grants for activities designed to encourage greater energy efficiency, NAREIT and REITPAC encourage the adoption of clarifying language to ensure that REITs are able to fully participate in such activities.
CC2.3d
Do you publicly disclose a list of all the research organizations that you fund?
CC2.3e
Please provide details of the other engagement activities that you undertake
CC2.3f
What processes do you have in place to ensure that all of your direct and indirect activities that influence policy are consistent with your overall climate change strategy? We have several processes in place to ensure that all of our direct and indirect activities that influence policy are consistent with our overall climate change strategy. Generally, all of our Company’s procedures are governed by our corporate governance policies and principles, such as the Code of Business Conduct and Ethics, Vendor Code of Business Conduct and Ethics, and Corporate Governance Guidelines, each of which provide safeguards against practices that are inconsistent with the Company’s objectives. These policies are reviewed annually and updated accordingly to ensure that our activities that influence policy are consistent with our overall climate change strategy. Additionally, our Company and both of our Codes of Conduct generally support efforts that encourage greater energy efficiency. We

have established an internal Sustainability Committee that seeks to evaluate, improve and report on the Company’s approach to environmental initiatives. These direct and indirect activities help to ensure that our policy directives are consistent with actions to mitigate negative climate change impacts.
CC2.3g
Please explain why you do not engage with policy makers
Further Information
Page: CC3. Targets and Initiatives
CC3.1
Did you have an emissions reduction or renewable energy consumption or production target that was active (ongoing or reached completion) in the reporting year? Absolute target Intensity target
CC3.1a
Please provide details of your absolute target
ID
Scope
% of emissions in
scope
% reduction
from base year
Base year
Base year emissions covered by
target (metric tonnes CO2e)
Target year
Is this a science-based target?
Comment
Abs1 Scope 1+2 (location- 95% 1% 2015 375416 2016 No, but we
anticipate The total emissions calculated for Scope 1 and 2 in 2015 were 373,836 (t Co2e), which covered the 463 properties

ID
Scope
% of emissions in
scope
% reduction
from base year
Base year
Base year emissions covered by
target (metric tonnes CO2e)
Target year
Is this a science-based target?
Comment
based) setting one in the next 2 years
in our boundary. The 2015 total emissions amount was adjusted but not re-assured in 2016 to reflect a rolling base year according to our methodology, as well as acquisitions and dispositions affecting our boundary. Our absolute reduction target for 2016 using our 2015 base year was 1-2%. We achieved a reduction of 4.1%. Emissions not included in the scope are refrigerant from sources other than HVAC, and fuel from non-company owned vehicles used in the course of work.
CC3.1b
Please provide details of your intensity target
ID
Scope
% of emissions in scope
% reduction from base
year
Metric
Base year
Normalized base year emissions covered by
target
Target year
Is this a science-based
target?
Comment
Int1 Scope 1+2 (location-based)
95% 1%
Metric tonnes CO2e per square foot*
2015 0.009445 2016
No, but we anticipate setting one in the next 2 years
We implemented an intensity target for 2016 based on metric tonnes per square foot which we feel is a relevant measurement for real estate properties. Our 2016 intensity reduction target using our 2015 rolling base year was 1-2%.
CC3.1c

Please also indicate what change in absolute emissions this intensity target reflects
ID
Direction of change
anticipated in absolute Scope 1+2 emissions
at target completion?
% change anticipated in absolute Scope 1+2 emissions
Direction of change
anticipated in absolute Scope 3 emissions at
target completion?
% change anticipated in absolute
Scope 3 emissions
Comment
Int1 Decrease 1
Our intensity measurement for Scope 1+2 is based on an equivalent denominator, so we anticipate that the intensity target and absolute target would increase or decrease in the same direction as the percentage change, but not necessarily equate to the percentage change. Our 2016 absolute emissions reduction was 4.1%, which resulted in a decrease in intensity of 3.8%. Our assumptions were that the CO2e emissions in 2016 would decrease from the 2015 rolling base year by 1%, which was estimated to be 3,754 metric tonnes CO2e.
CC3.1d
Please provide details of your renewable energy consumption and/or production target
ID
Energy types
covered by target
Base year
Base year energy for energy type covered
(MWh)
% renewable
energy in base year
Target year
% renewable
energy in target year
Comment
CC3.1e

For all of your targets, please provide details on the progress made in the reporting year
ID
% complete (time)
% complete (emissions or
renewable energy)
Comment
Abs1 100% 100% We achieved a 4.1% reduction in our 2016 absolute emissions reduction against a target of 1-2% for our defined boundary buildings for 2016.
Int1 100% 100%
We achieved a 3.8% reduction in our 2016 emissions intensity against our 2015 target of 1-2% for buildings within our boundary. While the numerator (CO2e) decreased by 4.1%, the denominator (square footage of buildings within our boundary) also decreased by 0.3%, thus causing a net effect 3.8% decrease of the intensity factor.
CC3.1f
Please explain (i) why you do not have a target; and (ii) forecast how your emissions will change over the next five years
CC3.2
Do you classify any of your existing goods and/or services as low carbon products or do they enable a third party to avoid GHG emissions? Yes
CC3.2a
Please provide details of your products and/or services that you classify as low carbon products or that enable a third party to avoid GHG emissions

Level of
aggregation
Description of product/Group
of products
Are you reporting
low carbon product/s or
avoided emissions?
Taxonomy, project or methodology used to classify product/s as
low carbon or to calculate avoided
emissions
% revenue from
low carbon product/s in the reporting year
% R&D in low
carbon product/s in the reporting
year
Comment
CC3.3
Did you have emissions reduction initiatives that were active within the reporting year (this can include those in the planning and/or implementation phases) Yes
CC3.3a
Please identify the total number of projects at each stage of development, and for those in the implementation stages, the estimated CO2e savings
Stage of development
Number of projects
Total estimated annual CO2e savings in metric tonnes CO2e (only for rows marked *)
Under investigation 107 To be implemented* 107 3747 Implementation commenced* 61 1367 Implemented* 363 5782 Not to be implemented 0
CC3.3b

For those initiatives implemented in the reporting year, please provide details in the table below
Activity type
Description of activity
Estimated annual CO2e
savings (metric tonnes CO2e)
Scope
Voluntary/ Mandatory
Annual monetary savings
(unit currency
- as specified in CC0.4)
Investment required
(unit currency -
as specified in
CC0.4)
Payback period
Estimated lifetime of
the initiative
Comment
Energy efficiency: Building services
14 lighting motion and occupancysensor projects. 355 sensors/timerswere installed. This is a voluntary Scope 2 project, with a life of 10 years.
34
Scope 2 (location-based)
Voluntary 11147 13718 1-3
years 6-10 years
Energy efficiency: Building services
3 evening HVAC building setbackprojects were implemented to reduce CO2e and energy. This is a voluntary Scope 2 project, with a life of 15 years.
20
Scope 2 (location-based)
Voluntary 4000 575 <1 year 11-15
years
Energy efficiency: Building services
12 programmable thermostat projects were implemented to reduce CO2e and energy. 29 thermostats wereinstalled. This is a voluntary Scope 1 +2 project with a life of 15 years.
62
Scope 1 Scope 2 (location-based)
Voluntary 5890 2192 <1 year 11-15
years
Energy efficiency: Building services
20 Energy Management System projects were implemented. This is a voluntary Scope 2 project with a life of 15 years.
1277
Scope 2 (location-based)
Voluntary 294450 1502255 4-10
years 11-15 years
Energy efficiency: Building services
118 Lighting retrofit projects were implemented, consisting of both fluorescent and LED lighting. This is a voluntary Scope 2 project with a life of 11-15 years.
2124
Scope 2 (location-based)
Voluntary 413751 2952909 4-10
years 11-15 years
Energy efficiency: Building
13 variable frequency drive projectswere implemented. This is a voluntary Scope 2 project with a life of 10 years.
273 Scope 2 (location-based)
Voluntary 58073 119347 1-3
years 11-15 years

Activity type
Description of activity
Estimated annual CO2e
savings (metric tonnes CO2e)
Scope
Voluntary/ Mandatory
Annual monetary savings
(unit currency
- as specified in CC0.4)
Investment required
(unit currency -
as specified in
CC0.4)
Payback period
Estimated lifetime of
the initiative
Comment
services
Energy efficiency: Building services
128 small Heating Ventilation and AirConditioning (HVAC) equipment replacement projects [(< 10 ton)] were implemented. 328 HVAC units werereplaced. (note: Investment required is the premium cost for a high efficiency replacement over a standard efficiency unit.) This is a voluntary Scope 2 project, with a life of 15 years.
623
Scope 2 (location-based)
Voluntary 124296 300571 1-3
years 11-15 years
Energy efficiency: Building services
19 large Heating Ventilation and AirConditioning (HVAC) equipment replacement projects (>= 10 ton) were implemented. 51 HVAC units were replaced. (note: Investment required is the premium cost for a high efficiency replacement over a standard efficiency unit.) This is a voluntary Scope 2 project, with a life of 20 years.
899
Scope 2 (location-based)
Voluntary 151062 420877 1-3
years 16-20 years
Energy efficiency: Building services
10 boiler replacement projectsimplemented. 12 boilers were replaced.This is a voluntary Scope 1 project with a life of 20 years. Note: Investment required is the premium cost for a high efficiency replacement, over a standard efficiency unit.
196 Scope 1
Voluntary 29334 126930 4-10
years 16-20 years
Energy efficiency: Building fabric
20 white and/or reflective surface roofprojects. There is no premium cost for a white/reflective roof so the investment for energy savings is zero. This is a voluntary Scope 2 project, with
80
Scope 2 (location-based)
Voluntary 23653 0 <1 year 16-20
years

Activity type
Description of activity
Estimated annual CO2e
savings (metric tonnes CO2e)
Scope
Voluntary/ Mandatory
Annual monetary savings
(unit currency
- as specified in CC0.4)
Investment required
(unit currency -
as specified in
CC0.4)
Payback period
Estimated lifetime of
the initiative
Comment
a life of 20 years. Energy efficiency: Building services
6 projects installing window tint on existing windows and sealing windows, This is a voluntary Scope 2 project with a life of 15 years.
194
Scope 2 (location-based)
Voluntary 36347 396699 4-10
years 11-15 years
CC3.3c
What methods do you use to drive investment in emissions reduction activities?
Method
Comment
Dedicated budget for energy efficiency
Our dedicated energy efficiency ("green") budget identifies projects with energy savings opportunities and identifies green initiatives in the capital expenditure annual budget. Based upon the input from our Capital Asset Management team and our third party management companies, projects are identified that are capable of reducing emissions and are added to the green budget. We also employ internal best practices to identify potential efficiency savings that may be incurred at our properties, and assess a comprehensive range of projects and practices that can reduce emissions and water consumption, all of which aid in driving investments in our emissions reduction activities.
Financial optimization calculations
Payback in number of years and Return on Investment (ROI) are key components to any energy saving/emission reduction project and aid in driving investments in our emissions reduction activities.
Internal incentives/recognition programs
Each year, we host an annual conference that allows our staff and third party managers, maintenance personnel and leasing agents to interact, share best practices, and discuss policies, goals and objectives for the year. Achievements are highlighted and recognition awarded for emission reduction activities such as ENERGY STAR certifications, which drives investments in our future emission reduction activities. The feedback received and information at the recognition programs held at our annual conference

Method
Comment
drive energy reduction and best practice initiatives through our third party management companies.
CC3.3d
If you do not have any emissions reduction initiatives, please explain why not
Further Information
Page: CC4. Communication
CC4.1
Have you published information about your organization’s response to climate change and GHG emissions performance for this reporting year in places other than in your CDP response? If so, please attach the publication(s)
Publication
Status
Page/Section reference
Attach the document
Comment
In voluntary communications Complete
Response to climate change: PDF pgs. 5, 10 and 17; GHG emissions performance: PDF pgs. 10-13 (Environmental Report); and pgs. 20-21 (Environmental Data)
https://www.cdp.net/sites/2017/17/23217/Climate Change 2017/Shared Documents/Attachments/CC4.1/HCP 2016 Sustainability Report.pdf
In voluntary communications Complete
Response to climate change: PDF pgs. 12, 19; GHG emissions performance: PDF pgs. 38-40
https://www.cdp.net/sites/2017/17/23217/Climate Change 2017/Shared Documents/Attachments/CC4.1/GRESB 2017 Response - Final (06.30.17) 9.25am PT.pdf
Our 2017 GRESB Response was completed on June 30, 2017 (attached). It will be published to our website on or about July 6, 2017. All GRESB responses for

Publication
Status
Page/Section reference
Attach the document
Comment
previous years are published to our website in the Sustainability section.
In voluntary communications Complete
Screenshot from Sustainability webpage (1 page)
https://www.cdp.net/sites/2017/17/23217/Climate Change 2017/Shared Documents/Attachments/CC4.1/Screenshot of Sustainability Section of HCP website.pdf
Further Information
Module: Risks and Opportunities
Page: CC5. Climate Change Risks
CC5.1
Have you identified any inherent climate change risks that have the potential to generate a substantive change in your business operations, revenue or expenditure? Tick all that apply Risks driven by changes in regulation Risks driven by changes in physical climate parameters Risks driven by changes in other climate-related developments
CC5.1a
Please describe your inherent risks that are driven by changes in regulation

Risk driver
Description
Potential impact
Timeframe
Direct/ Indirect
Likelihood
Magnitude of impact
Estimated financial
implications
Management
method
Cost of
management
Product efficiency regulations and standards
Risks driven by changes related to efficiency regulations and standards include additional legislation mandating the enactment of new building codes governing minimum product performance and the institution of national ratings similar to those used in Australian and European building rating systems. Such risks could affect HCP by exposing us to higher capital costs to purchase and install additional improved-efficiency equipment, in order to comply with such new codes and rating parameters. For example, California's Building Energy Efficiency
Increased capital cost
3 to 6 years Direct
About as likely as not
Low-medium
The estimated financial implications include higher costs to purchase improved-efficiency energy equipment. We estimate the costs to purchase and install such additional equipment could increase incrementally between $400,000 and $600,000 for a new building and $350,000 and $550,000 to retrofit an existing building. We believe these costs could increase annually, as we believe efficiency regulations will be more stringent and apply to an increased number of buildings each year. Such increased costs could have the potential to
Methods we are using to manage these risks include voluntarily and proactively constructing or retrofitting to higher-than-required regulatory standards in advance of any newly mandated legislation and/or building codes. This practice enables us to schedule, implement and complete upgrades in an efficient manner over an extended period of time (in lieu of waiting to upgrade until new standards are enacted), and aids in mitigating the risk of being required to complete those upgrades in the shorter period of time imposed by such newly mandated efficiency
The costs associated with the implementation of 363 efficiency improvement projects in 2016 was approximately $5.8 million. There is no cost ($0.00) associated with utilizing the ENERGY STAR Portfolio Manager tool.

Risk driver
Description
Potential impact
Timeframe
Direct/ Indirect
Likelihood
Magnitude of impact
Estimated financial
implications
Management
method
Cost of
management
Standards are now updated on an approximately three-year cycle, and these requirements impact HCP as an owner of properties in California.
generate a substantive change in our capital expenditures over time if not properly mitigated.
standards. For example, in 2016, we proactively and voluntarily implemented 363 projects to improve the efficiency of our buildings including HVAC upgrades, lighting retrofits and energy management systems resulting in these buildings becoming a more efficient product. Further, we utilize the ENERGY STAR Portfolio Manager tool to track our buildings that do not currently meet ENERGY STAR requirements, and we proactively schedule efficiency upgrades for those buildings. The ENERGY STAR Portfolio Manager is a benchmarking tool that tracks energy consumption and generates an

Risk driver
Description
Potential impact
Timeframe
Direct/ Indirect
Likelihood
Magnitude of impact
Estimated financial
implications
Management
method
Cost of
management
energy rating for each building. Additionally, we believe these proactive actions are likely to reduce our risks associated to changes in efficiency regulations and standards over the next few years, as when and if such regulations are enacted, we will already be adhering to the new standards.
Product labeling regulations and standards
Risks driven by changes related to labeling regulations and standards include governing bodies mandating certifications (i.e., labels) such as ENERGY STAR and LEED. Such risks could affect HCP by exposing us to higher capital costs to meet the requirements of these programs.
Increased capital cost
3 to 6 years Direct
About as likely as not
Low-medium
The estimated financial implications include higher costs to build/retrofit to more stringent building labeling standards. We estimate such costs could increase incrementally between $800,000 and $1.0 million for a new building
Methods we are using to manage these risks include voluntarily and proactively constructing or retrofitting to higher-than-required ENERGY STAR and LEED (labeling) standards in advance of any newly required labeling standards. This practice
The cost associated with the implementation of 5 drought resistant landscape projects and 3 "smart" control irrigation projects in 2016 was approximately $99,000. There is no cost ($0.00) associated with utilizing the ENERGY STAR

Risk driver
Description
Potential impact
Timeframe
Direct/ Indirect
Likelihood
Magnitude of impact
Estimated financial
implications
Management
method
Cost of
management
and $700,000 and $900,000 to retrofit an existing building. We believe these costs could increase annually, as we believe labeling regulations will become more stringent and apply to more buildings each year. Such increased costs could have the potential to generate a substantive change in our capital expenditures over time if not properly mitigated.
enables us to implement upgrades in an efficient manner over an extended period of time (in lieu of waiting to upgrade until new labeling standards are required), and aids in mitigating the risk of being required to complete those upgrades in the shorter period of time imposed by such new labeling standards. For example, in 2016, we proactively and voluntarily installed drought resistant landscaping to reduce water consumption at 5 buildings, and upgraded the irrigation controls to “smart” controls for 3 of our buildings. Further, we utilize the ENERGY STAR Portfolio Manager to track our
Portfolio Manager tool.

Risk driver
Description
Potential impact
Timeframe
Direct/ Indirect
Likelihood
Magnitude of impact
Estimated financial
implications
Management
method
Cost of
management
buildings that already meet ENERGY STAR requirements, and we proactively schedule ENERGY STAR and LEED-specific upgrades for those buildings. The ENERGY STAR Portfolio Manager is a benchmarking tool that tracks energy consumption and generates an energy rating for each building.
CC5.1b
Please describe your inherent risks that are driven by changes in physical climate parameters
Risk driver
Description
Potential impact
Timeframe
Direct/ Indirect
Likelihood
Magnitude of impact
Estimated financial
implications
Management
method
Cost of
management
Change in mean (average)
Risks driven by changes in physical climate
Increased operational cost
3 to 6 years Direct More likely
than not Medium The estimated financial implications
Methods we are using to manage risks driven by
We estimate the costs of proactively

Risk driver
Description
Potential impact
Timeframe
Direct/ Indirect
Likelihood
Magnitude of impact
Estimated financial
implications
Management
method
Cost of
management
temperature parameters include the risk of a higher mean (average) temperature. We have properties located throughout the U.S. including the upper Midwest, Southwest and Southeast. Changes in climate in any of our locations affect our properties and our ability to operate, causing increased cooling and heating expenses and possible interruption of services.
include increased costs from higher cooling and/or heating expenses due to changes in mean (average) temperature. We spent $58.2 million in utility expenses on our boundary properties in 2016. A 1% increase in such expenses due to a change in mean (average) temperature could cost us an additional $582,000 annually as compared to 2015. According to NOAA, the average annual temperature in 2016 was 2.9 degrees Fahrenheit greater than the average temperature for the 20th century. We believe this trend could continue
changes in physical climate parameters such as mean (average) temperature include voluntarily and proactively constructing or retrofitting buildings to more efficient systems and construction standards in advance of any change in climate. For example in 2016 we proactively and voluntarily implemented 363 projects to improve the efficiency of our buildings including HVAC upgrades, lighting retrofits and energy management systems resulting in these buildings becoming a more efficient product. Additionally, to identify properties for potential retrofit, we utilize the ENERGY STAR (ES) Portfolio Manager tool to
constructing or retrofitting buildings to more efficient systems and construction standards in advance of any dramatic change in physical climate parameters as a method of risk management to be between $400,000 and $600,000 per building for new construction, and between $350,000 and $550,000 per building to retrofit existing buildings. There is no cost ($0.00) associated with utilizing the ENERGY STAR Portfolio Manager tool.

Risk driver
Description
Potential impact
Timeframe
Direct/ Indirect
Likelihood
Magnitude of impact
Estimated financial
implications
Management
method
Cost of
management
throughout the 21st century on a global level. Such average annual temperature increases could increase our utility costs by an estimated $320,000 to $580,000.
track our buildings that do not currently meet ES requirements, and we proactively schedule upgrades for those buildings. This enables us to implement energy upgrades in an efficient manner over an extended period of time and begin incurring energy savings in advance of any changes in climate parameters. Adapting such practices now will aid in mitigating the risks of any increased costs now and in the future. The ES Portfolio Manager is a benchmarking tool that models the building based on consumption and generates an energy rating. Additionally, we believe these proactive actions are likely to reduce our risks associated

Risk driver
Description
Potential impact
Timeframe
Direct/ Indirect
Likelihood
Magnitude of impact
Estimated financial
implications
Management
method
Cost of
management
to changes in physical climate parameters over the next few years, because as climate change produces increasingly severe weather, we will already have procedures and equipment in place to mitigate the risks.
Sea level rise
Risks driven by changes in physical climate parameters include the risk of increased incidences of a rise in sea level. Such increased incidents would affect HCP by exposing us to higher operational expenses resulting from higher operational costs resulting from higher insurance costs (premiums) and uninsured repair costs
Increased operational cost
>6 years Direct Unlikely Medium
The estimated financial implications include higher insurance premiums from increased claims due to flood damage. We spent $287,000 in flood insurance premiums in 2016. A 5% to 10% increase in such expenses due to a rise in sea level could cost us an additional $14,350 to $28,700 annually as compared to 2015. We believe
Methods we are using to manage the risks driven by changes in physical climate parameters associated with a rise in sea level include negotiating attaining competitive insurance rates through a bidding process to ensure the lowest rates. Additionally, maintaining and building upon our investment grade corporate financial structure aids in decreasing our insurance rates as a result of
There are no ($0.00) costs associated with negotiating competitive insurance rates through a bidding process as a method of risk management. In 2016, we spent approximately $2 million in costs related to credit ratings, although such costs are factored into and included as a part of our regular business activity.

Risk driver
Description
Potential impact
Timeframe
Direct/ Indirect
Likelihood
Magnitude of impact
Estimated financial
implications
Management
method
Cost of
management
(insurance deductibles) due to increased claims (e.g., from flooding).
physical climate parameter risks such as a rise in sea level could increase and could have the potential to generate a substantive change in our expenditures over time if not properly mitigated.
demonstrating our financial stability. Additionally, we believe these proactive actions are likely to reduce our risks associated to changes in physical climate parameters over the next few years, because as climate change produces increasingly severe weather, we will already have procedures and equipment in place to mitigate the risks.
Tropical cyclones (hurricanes and typhoons)
Changes in physical climate parameters include the risk of more frequent occurrences of tropical cyclones (hurricanes and typhoons). Such increased occurrences would affect HCP by exposing us to higher operational expenses
Increased operational cost
>6 years Direct About as likely as not
Medium
The estimated financial implications include higher insurance premiums from increased claims due to wind damage. We spent $2.4 million in wind insurance premiums in 2016. A 5% to 10% increase in such expenses due to extreme
Methods we are using to manage the risks driven by changes in physical climate parameters associated with cyclones, hurricanes and/or typhoons include (a) negotiating competitive insurance rates through a bidding process to ensure the lowest rates and (b) proactively
There are no ($0.00) costs associated with negotiating competitive insurance rates through a bidding process as a method of risk management. The cost to annually maintain our business continuity plan is approximately $20,000. In 2016

Risk driver
Description
Potential impact
Timeframe
Direct/ Indirect
Likelihood
Magnitude of impact
Estimated financial
implications
Management
method
Cost of
management
resulting from higher insurance costs (premiums) and uninsured repair costs (insurance deductibles) due to increased claims (e.g., from wind damage).
winds could cost us an additional $120,000-$240,000 annually as compared to 2015. We believe physical climate parameter risks such as tropical cyclones could increase and could have the potential to generate a substantive change in our expenditures over time if not properly mitigated.
planning for extreme weather extremes events through the development and implementation of a comprehensive business continuity plan. Our business continuity plan is a comprehensive plan which, in the event of a serious business disruption affecting the operation of our business functions is designed to (i) provide a framework to ensure the continuity of the business; (ii) outline the general procedures to be taken; (ii) incorporate input received from internal business process owners whereby key processes, individuals and necessary tools and equipment are identified; and (iii) ensure the safety of
we spent approximately $2 million in costs related to credit ratings, although such costs are factored into and included as a part of our regular business activity.

Risk driver
Description
Potential impact
Timeframe
Direct/ Indirect
Likelihood
Magnitude of impact
Estimated financial
implications
Management
method
Cost of
management
employees. Additionally, maintaining and building upon our investment grade corporate financial structure aids in decreasing our insurance rates as a result of demonstrating our financial stability. Additionally, we believe these proactive actions are likely to reduce our risks associated to changes in physical climate parameters over the next few years, because as climate change produces increasingly severe weather, we will already have procedures and equipment in place to mitigate the risks.
CC5.1c
Please describe your inherent risks that are driven by changes in other climate-related developments

Risk driver
Description
Potential impact
Timeframe
Direct/ Indirect
Likelihood
Magnitude of impact
Estimated financial
implications
Management
method
Cost of
management
Changing consumer behavior
Changes related to other climate-related developments include the risk of changing consumer behavior, as there are a growing number of tenants who consider sustainability as a key factor in their leasing and leasing renewal decisions. Such a risk would affect HCP by causing a decrease in demand for our buildings, resulting in a decrease in revenues, if we were unable to provide energy efficient space to those tenants and potential tenants that prefer it.
Reduced demand for goods/services
Up to 1 year Direct
About as likely as not
Medium
The estimated financial implications from reduced demand for our buildings resulting in decreased rental revenue from lost tenants and potential tenants that prefer more energy efficient space could be significant. Tenants are increasingly requesting ENERGY STAR and/or LEED certified space. We earned $1.41 billion in rental related revenues within our boundary in 2016. A 1% decrease from lost tenants could cost us $14.1 million in lost revenues annually as compared to 2015. We believe other climate-related risks such as
Methods we are using to manage the risks driven by changes in other climate-related developments such as changed consumer behavior include pursuing LEED and ENERGY STAR (ES) certifications, involving tenants in our sustainable business strategy though our annual tenant satisfaction survey and the promotion of water and energy saving procedures. For example, HCP is the cumulative ES program leader for the MOB category and we are continuing to pursue ES as well as the LEED certifications. In 2016, our tenant satisfaction survey was delivered to 2,327 of our tenants and we achieved a
The costs associated with LEED and ENERGY STAR certified properties can cost anywhere between $400,000 and $600,000 for new construction, and between $350,000 and $550,000 to retrofit an existing building, while there are no costs ($0.00) associated with the promotion of sustainability and internal awareness of water conservation and energy savings to our tenants. The cost of our annual tenant satisfaction survey is approximately $52,500.

Risk driver
Description
Potential impact
Timeframe
Direct/ Indirect
Likelihood
Magnitude of impact
Estimated financial
implications
Management
method
Cost of
management
changing consumer behavior could increase and could have the potential to generate a substantive change in our revenues over time if not properly mitigated.
response rate of 89%. The survey included 18 questions related to Green Initiatives including tenant satisfaction with our commitment to sustainability, their likelihood of participating in programs, how various initiatives would influence their rental decision and the importance of sustainability to their employees and customers. Our water and energy savings procedures communicated to our tenants include reminders, and the implementation of these measures and practices will appeal those tenants who prefer to do business with more sustainable companies. Additionally, we believe these

Risk driver
Description
Potential impact
Timeframe
Direct/ Indirect
Likelihood
Magnitude of impact
Estimated financial
implications
Management
method
Cost of
management
proactive actions are likely to reduce our risks associated with climate-related developments such as changes in consumer behavior over the next few years, as we strive to increase the number of LEED certified buildings in our portfolio and sustainability-related questions in our satisfaction survey each year.
Reputation
Changes related to other climate-related developments include the reputational risk of not being perceived as a sustainable or green-minded company. Such a risk would affect HCP by causing a decrease in demand for our buildings,
Reduced demand for goods/services
Up to 1 year Direct
About as likely as not
Medium
The estimated financial implications from reduced demand for buildings resulting in decreased tenant revenue from a perceived negative sustainability reputation could be significant. We earned $1.41 billion in rental related revenues within
Methods we are using to manage the risks driven by changes in other climate-related developments such as reputation include pursuing LEED and ENERGY STAR certifications, involving our tenants in our sustainable business strategy though the use of our annual tenant
The costs associated with LEED and ENERGY STAR certified properties can cost anywhere between $400,000 and $600,000 for new construction, and between $350,000 and $550,000 to retrofit an existing building, while there are no

Risk driver
Description
Potential impact
Timeframe
Direct/ Indirect
Likelihood
Magnitude of impact
Estimated financial
implications
Management
method
Cost of
management
resulting in a decrease in revenues, if any of our tenants chose to relocate due to our reputation being perceived as an unsustainable company.
our boundary in 2016. A 1% decrease from lost tenants could cost us $14.1M in lost revenues annually as compared to 2015. We believe other climate-related risks such as a perceived negative sustainability reputation could increase and could have the potential to generate a substantive change in our revenues over time if we do not retain our esteemed sustainability reputation.
satisfaction survey and the promotion of water conservation and energy saving procedures. For example, HCP is the cumulative ENERGY STAR program leader for the medical office building category and we are continuing to pursue ENERGY STAR certifications as well as LEED certifications. In 2016, our tenant satisfaction survey was delivered via a web based methodology to 2,327 of our tenants and we achieved a response rate of 89%. The survey included 18 questions related to Green Initiatives including tenant satisfaction with our commitment to sustainability, their likelihood of
costs ($0.00) associated with the promotion of sustainability and internal awareness of water conservation and energy savings to our tenants. The cost of our annual tenant satisfaction survey is approximately $52,500.

Risk driver
Description
Potential impact
Timeframe
Direct/ Indirect
Likelihood
Magnitude of impact
Estimated financial
implications
Management
method
Cost of
management
participating in various programs, how various initiatives would influence their rental decision and the importance of sustainability to their employees and customers. Our water conservation and energy savings procedures communicated to our tenants include reminders for them to and the implementation of these measures and practices will appeal those tenants who prefer to do business with more sustainable companies.
CC5.1d
Please explain why you do not consider your company to be exposed to inherent risks driven by changes in regulation that have the potential to generate a substantive change in your business operations, revenue or expenditure

CC5.1e
Please explain why you do not consider your company to be exposed to inherent risks driven by changes in physical climate parameters that have the potential to generate a substantive change in your business operations, revenue or expenditure
CC5.1f
Please explain why you do not consider your company to be exposed to inherent risks driven by changes in other climate-related developments that have the potential to generate a substantive change in your business operations, revenue or expenditure
Further Information
Page: CC6. Climate Change Opportunities
CC6.1
Have you identified any inherent climate change opportunities that have the potential to generate a substantive change in your business operations, revenue or expenditure? Tick all that apply Opportunities driven by changes in regulation Opportunities driven by changes in physical climate parameters Opportunities driven by changes in other climate-related developments

CC6.1a
Please describe your inherent opportunities that are driven by changes in regulation
Opportunity driver
Description
Potential impact
Timeframe
Direct/Indirect
Likelihood
Magnitude of impact
Estimated financial
implications
Management
method
Cost of
management
Product efficiency regulations and standards
Opportunities driven by changes related to product (i.e., our buildings) efficiency regulations and standards include legislation requiring improved energy efficiency standards for our buildings. Such an opportunity could affect HCP by reducing our operational costs as a result of savings incurred from the energy efficient measures we implement to comply with such standards. For example,
Reduced operational costs
Up to 1 year Direct More likely
than not Medium-high
The estimated financial implications include reduced operational costs resulting from improved-efficiency energy equipment savings. In 2016, we spent $58.2M in utility expenses within our boundary. A 1% decrease in such expenses could save us an additional $582,000 annually as compared to 2015. We believe such savings could increase annually, as we believe opportunities related to
Methods we are using to manage the opportunities associated with regulatory changes related to product efficiency standards include voluntarily and proactively constructing or retrofitting to higher-than-required standards in advance of any newly mandated building codes. In 2016, we implemented 363 projects to improve the efficiency of our buildings including HVAC upgrades, retrofitting lighting to a more efficient product and the
The incremental cost associated with: 1) the implementation of 363 efficiency improvement projects in 2016 was approximately $5.8 million; 2) the implementation of "smart" building technology for 8 buildings in 2016 was approximately $143,000; and 3) the implementation of drought resistant landscaping and upgrades to “smart” irrigation controllers in 2016 was approximately $99,000. There is no cost ($0.00) associated with utilizing the ENERGY STAR

Opportunity driver
Description
Potential impact
Timeframe
Direct/Indirect
Likelihood
Magnitude of impact
Estimated financial
implications
Management
method
Cost of
management
California's Building Energy Efficiency Standards are now updated on an approximately three-year cycle, and these requirements impact HCP as an owner of properties in California and have provided cost-savings opportunities derived from the benefits of implementing the required efficiency measures.
efficiency standards could become more prevalent due to increasing tenant interest in efficiency, and will have the potential to generate a substantive change in our costs over time.
installation of energy management systems. In addition, "smart" building technology was implemented for 8 buildings utilizing real time utility monitoring to enhance energy reduction opportunities. We also installed drought resistant landscaping to reduce water consumption at 5 buildings and we installed upgrades to our irrigation controls for 3 buildings to “smart” controllers. Further, we utilize the ENERGY STAR Portfolio Manager tool to track our buildings that do not currently
Portfolio Manager tool.

Opportunity driver
Description
Potential impact
Timeframe
Direct/Indirect
Likelihood
Magnitude of impact
Estimated financial
implications
Management
method
Cost of
management
meet ENERGY STAR requirements, and we proactively schedule upgrades for those buildings. This practice enables us to implement upgrades sooner than any implemented regulations taking effect thus taking advantage of the opportunities realized by lower operating costs. The ENERGY STAR Portfolio Manager is a benchmarking tool that models the building based on consumption and generates an energy rating. Additionally, we believe these proactive pre-regulatory

Opportunity driver
Description
Potential impact
Timeframe
Direct/Indirect
Likelihood
Magnitude of impact
Estimated financial
implications
Management
method
Cost of
management
actions are likely to increase the opportunities related to efficiency standards over the next few years.
Product labeling regulations and standards
Opportunities driven by changes related to product (i.e., our buildings) labeling regulations and standards include governing bodies mandating certifications (i.e., labels) such as ENERGY STAR and LEED. Such an opportunity could affect HCP by reducing our operating costs as a result of savings incurred from the energy efficient measures we
Reduced operational costs
1 to 3 years Direct More likely
than not Medium
The estimated financial implications include reduced operational costs resulting from savings derived from the improved-efficiency energy equipment installed as required by labeling regulations. In 2016, we spent $58.2M in utility expenses within our boundary. A 1% decrease in such expenses could save us an additional $582,000 annually as
Methods we are using to manage the opportunities associated with regulatory changes related to product labeling standards include voluntarily and proactively constructing or retrofitting to higher-than-required ENERGY STAR and LEED standards in advance of any newly mandated labeling standards. In 2016 for example, we installed drought resistant landscaping to
The incremental cost associated with the implementation of drought resistant landscaping and upgrades to “smart” irrigation controllers in 2016 was approximately $99,000. There is no cost ($0.00) associated with utilizing the ENERGY STAR Portfolio Manager tool.

Opportunity driver
Description
Potential impact
Timeframe
Direct/Indirect
Likelihood
Magnitude of impact
Estimated financial
implications
Management
method
Cost of
management
implement to comply with such labeling standards.
compared to 2015. We believe such savings could increase annually, as we believe opportunities related to efficiency labeling standards could become more prevalent due to increasing tenant interest in efficiency, and will have the potential to generate a substantive change in our costs over time.
reduce water consumption at 5 buildings and made upgrades to our irrigation controls for 3 buildings to "smart" controllers to help meet the requirements of LEED certification although it was not required. Further, we utilize the ENERGY STAR Portfolio Manager to track our buildings that already meet ENERGY STAR requirements, and we proactively schedule ENERGY STAR and LEED-specific upgrades for those buildings. This practice enables us to implement upgrades

Opportunity driver
Description
Potential impact
Timeframe
Direct/Indirect
Likelihood
Magnitude of impact
Estimated financial
implications
Management
method
Cost of
management
sooner than any implemented regulations taking effect thus taking advantage of the opportunities realized by lower operating costs. The Energy Star Portfolio Manager is a benchmarking tool that models the building based on consumption and generates an energy rating.
CC6.1b
Please describe your inherent opportunities that are driven by changes in physical climate parameters
Opportunity driver
Description
Potential impact
Timeframe
Direct/ Indirect
Likelihood
Magnitude of impact
Estimated financial
implications
Management
method
Cost of
management
Change in mean
Adapting to changes in
Premium price
3 to 6 years Direct More likely
than not Medium-high
The estimated financial
Methods we are using to manage
The annual cost to prepare, assure

Opportunity driver
Description
Potential impact
Timeframe
Direct/ Indirect
Likelihood
Magnitude of impact
Estimated financial
implications
Management
method
Cost of
management
(average) temperature
physical climate parameters such as an increase in the mean (average) temperature can present opportunities, such as attracting new tenants. As we install energy efficient equipment to assist in mitigating physical climate parameters, such equipment attracts new tenants who prefer to lease space that utilizes energy efficient equipment and are willing to pay a premium for it. This influx of new efficient-minded tenants could increase our revenues and affect our company significantly.
opportunities implications include increased lease revenue derived from the premium price opportunity. Energy efficient equipment installed to alleviate utility expenses will attract green-minded new tenants that are willing to pay a premium for efficient space. We earned $1.41 billion in rental related revenues within our boundary in 2016. A 1% increase in such revenue could result in an additional $14.1M annually as compared to 2015. We believe such revenue resulting in premium price opportunities could increase
the opportunities associated with a change in mean (average) temperature include making our green initiatives more transparent by publishing an annual Sustainability Report and responding to surveys such as CDP, DJSI, and GRESB to attract green-minded tenants interested in leasing space from sustainable companies. We also implement energy efficient measures as an added attraction for tenants. For example, we implemented 363 projects to improve the efficiency of our buildings including HVAC upgrades, retrofitting lighting
and publish our annual Sustainability Report and to respond to various sustainability surveys is approximately $350,000. Additionally, the incremental costs associated with the implementation of 363 efficiency projects in 2016 was approximately $5.8 million; and the implementation of "smart" building technology for 8 buildings in 2016 was approximately $143,000.

Opportunity driver
Description
Potential impact
Timeframe
Direct/ Indirect
Likelihood
Magnitude of impact
Estimated financial
implications
Management
method
Cost of
management
annually due to increasing tenant interest in energy efficiency, and could have the potential to generate a substantive change in our revenue over time.
to a more efficient product and the installation of energy management systems. We also implemented "smart" building technology for 8 buildings in 2016. Additionally, we believe these actions will likely increase the opportunities derived from changes in physical climate parameters such as an increase in the mean (average) temperature over the next few years.
CC6.1c
Please describe your inherent opportunities that are driven by changes in other climate-related developments

Opportunity driver
Description
Potential impact
Timeframe
Direct/ Indirect
Likelihood
Magnitude of impact
Estimated financial
implications
Management
method
Cost of
management
Reputation
Changes related to other climate-related developments include the reputational opportunity of being perceived as a sustainable or green-minded company. Such an opportunity affects HCP by potentially increasing the demand for our properties, which could increase our rental related revenues, due to the attraction of new tenants who choose to relocate to one of our properties due to our reputation as a sustainable company. Our sustainability reporting efforts have resulted in HCP being recognized as a leader in the healthcare real
Increased demand for existing products/services
1 to 3 years Direct More likely
than not Medium
The estimated financial implications include increased lease revenue derived from the increased demand for our space due to the attraction of new tenants who choose to relocate to one of our properties due to our reputation as a sustainable company. We earned $1.41 billion in rental related revenues within our boundary in 2016. A 1% increase in such revenue due to increased demand could result in an additional $14.1 million annually as compared to 2015. We believe such revenue resulting from
Methods we are using to maximize the opportunities and related potential positive financial implications resulting from other climate-related developments such as reputation include making our green initiatives more transparent by publishing an annual Sustainability Report and responding to surveys such as CDP, DJSI, and GRESB to attract green-minded tenants interested in leasing space from reputable sustainable companies. Additionally, the awards we have received for our sustainability
The annual cost to prepare, assure and publish our annual Sustainability Report and to respond to various sustainability surveys is approximately $350,000. The incremental costs associated with the implementation of 363 efficiency projects in 2016 was approximately $5.8 million; and the implementation of "smart" building technology for 8 buildings in 2016 was approximately $143,000.

Opportunity driver
Description
Potential impact
Timeframe
Direct/ Indirect
Likelihood
Magnitude of impact
Estimated financial
implications
Management
method
Cost of
management
estate sector. Recognition such as this improves our reputation and increases the interests of new potential tenants.
increased demand for our buildings due to increasing tenant interest leasing efficient space from companies with an esteemed sustainability reputation could have the potential to generate a substantive change in our revenue over time.
reporting efforts solidifies our reputation in the eyes of current and potential tenants. We also implement energy efficient measures as an added attraction for tenants, which aids in boosting our sustainability reputation. For example in 2016, we implemented 363 projects to improve the efficiency of our buildings including HVAC upgrades, retrofitting lighting to a more efficient product and the installation of energy management systems. We also implemented "smart" building technology for 8 buildings in

Opportunity driver
Description
Potential impact
Timeframe
Direct/ Indirect
Likelihood
Magnitude of impact
Estimated financial
implications
Management
method
Cost of
management
2016. Additionally, we believe these actions will likely increase reputational-related opportunities over the next few years.
Changing consumer behavior
Changes related to other climate-related developments include opportunities resulting from changes in consumer behavior such as tenants becoming more willing to participate in our energy and water reduction programs that we implement at our buildings. Such an opportunity could affect HCP by reducing operational costs due to the
Reduced operational costs
1 to 3 years Direct More likely
than not Medium
The estimated financial implications include reduced operational costs as a result of increased participation (i.e., changing behavior) by our tenants in our energy and water reduction programs and taking advantage of the energy and water savings tips we provide. We incurred approximately $58.2 million in energy expenses within our boundary in 2016. A 1%
Methods we are using to manage the potential financial implication of opportunities associated with other climate-related developments such as changing consumer behavior include promoting water conservation and energy saving procedures. For example, at our Centennial campus in Nashville, we email tenant newsletters
The annual costs associated with promoting water conservation and energy saving procedures are $0.00, as this is included in our regular business activities.

Opportunity driver
Description
Potential impact
Timeframe
Direct/ Indirect
Likelihood
Magnitude of impact
Estimated financial
implications
Management
method
Cost of
management
savings incurred from the reduced utility bills resulting from the tenants changing behavior to become more involved in energy and water reduction programs.
decrease in such expenses due to energy savings to from increased tenants' changing conservation behavior could save us approximately $582,000 annually as compared to 2015. We believe such decrease in operational expenses resulting from tenants becoming more active in our reduction programs could increase annually due to increasing tenant interest in efficiency and will have the potential to generate a substantive change in our costs over time.
which include energy and water savings tips such as watching for leaky faucets, efficient use of dishwashers, and how to take advantage of window blinds at critical times.

CC6.1d
Please explain why you do not consider your company to be exposed to inherent opportunities driven by changes in regulation that have the potential to generate a substantive change in your business operations, revenue or expenditure
CC6.1e
Please explain why you do not consider your company to be exposed to inherent opportunities driven by changes in physical climate parameters that have the potential to generate a substantive change in your business operations, revenue or expenditure
CC6.1f
Please explain why you do not consider your company to be exposed to inherent opportunities driven by changes in other climate-related developments that have the potential to generate a substantive change in your business operations, revenue or expenditure
Further Information
Module: GHG Emissions Accounting, Energy and Fuel Use, and Trading
Page: CC7. Emissions Methodology
CC7.1

Please provide your base year and base year emissions (Scopes 1 and 2)
Scope
Base year
Base year emissions (metric tonnes CO2e)
Scope 1 Thu 01 Jan 2015 - Thu 31 Dec 2015
54262
Scope 2 (location-based) Thu 01 Jan 2015 - Thu 31 Dec 2015
321154
Scope 2 (market-based) Thu 01 Jan 2015 - Thu 31 Dec 2015
321154
CC7.2
Please give the name of the standard, protocol or methodology you have used to collect activity data and calculate Scope 1 and Scope 2 emissions
Please select the published methodologies that you use
The Greenhouse Gas Protocol: A Corporate Accounting and Reporting Standard (Revised Edition) US EPA Climate Leaders: Direct HFC and PFC Emissions from Use of Refrigeration and Air Conditioning Equipment
CC7.2a
If you have selected "Other" in CC7.2 please provide details of the standard, protocol or methodology you have used to collect activity data and calculate Scope 1 and Scope 2 emissions

CC7.3
Please give the source for the global warming potentials you have used
Gas
Reference
CH4 IPCC Fifth Assessment Report (AR5 - 100 year) N2O IPCC Fifth Assessment Report (AR5 - 100 year) CO2 IPCC Fifth Assessment Report (AR5 - 100 year) HFCs IPCC Fifth Assessment Report (AR5 - 100 year) Other: R404A Other: ASHRAE Standard 34 Other: R410A Other: ASHRAE Standard 34
CC7.4
Please give the emissions factors you have applied and their origin; alternatively, please attach an Excel spreadsheet with this data at the bottom of this page
Fuel/Material/Energy
Emission Factor
Unit
Reference
Natural gas 53.115 Other: kg C02e per million BTU Emission Factors for Greenhouse Gas Investories
Diesel/Gas oil 74.203 Other: kg C02e per million BTU Emission Factors for Greenhouse Gas Investories
Motor gasoline 8.812 Other: kg C02e per gallon Emission Factors for Greenhouse Gas

Fuel/Material/Energy
Emission Factor
Unit
Reference
Investories
Liquefied petroleum gas (LPG) 5.704 Other: kg C02e per gallon Emission Factors for Greenhouse Gas Investories
Electricity lb CO2e per MWh EPA eGRID 2014 v2
Cooling 88.411 Other: kg C02e per million BTU EIA Emissions Factors for Steam and Chilled Hot Water
Steam 52.677 Other: kg C02e per million BTU EIA Emissions Factors for Steam and Chilled Hot Water
Further Information
*CC7.4 Electricity Emission Factor: There is no one factor for electricity usage because we use the eGRID Table.
Page: CC8. Emissions Data - (1 Jan 2016 - 31 Dec 2016)
CC8.1
Please select the boundary you are using for your Scope 1 and 2 greenhouse gas inventory Operational control
CC8.2
Please provide your gross global Scope 1 emissions figures in metric tonnes CO2e 52257

CC8.3
Please describe your approach to reporting Scope 2 emissions
Scope 2, location-based
Scope 2, market-based
Comment
We are reporting a Scope 2, location-based figure We are reporting a Scope 2, market-based figure
CC8.3a
Please provide your gross global Scope 2 emissions figures in metric tonnes CO2e
Scope 2, location-
based
Scope 2, market-based (if
applicable)
Comment
307890 311254 We obtained the required detail from each provider, and were able to prepare and present the market-based figures in 2017 for the 2016 reporting year.
CC8.4
Are there any sources (e.g. facilities, specific GHGs, activities, geographies, etc.) of Scope 1 and Scope 2 emissions that are within your selected reporting boundary which are not included in your disclosure? No
CC8.4a

Please provide details of the sources of Scope 1 and Scope 2 emissions that are within your selected reporting boundary which are not included in your disclosure
Source
Relevance of Scope 1 emissions from this
source
Relevance of location-based Scope 2 emissions from this
source
Relevance of market-based Scope 2
emissions from this source (if applicable)
Explain why the source is excluded
CC8.5
Please estimate the level of uncertainty of the total gross global Scope 1 and 2 emissions figures that you have supplied and specify the sources of uncertainty in your data gathering, handling and calculations
Scope
Uncertainty range
Main sources of
uncertainty
Please expand on the uncertainty in your data
Scope 1 More than 5% but less than or equal to 10%
Assumptions Extrapolation Metering/ Measurement Constraints
Gas at several facilities is allocated between property under our operational control (e.g., MOB) and property not under our control (e.g., the associated hospital) based on estimates of usage. These estimates were originally based on metering. Refrigerant data was collected for HVAC equipment for boundary buildings. Where data was not able to be reported by the third party management companies and operators, a kg per square foot factor was calculated from buildings that had data and this factor was applied to the remaining building square foot. Assumptions were made to estimate R410A refrigerant based on the majority of the buildings that had data. The refrigerant emissions were based on the leakage rate of 5% for HVAC equipment operation based upon the equipment charge level in kg using the EPA calculator. Based on the actual and estimated data for both items mentioned in Scope 1, we chose “more than 5% but less than 10%”.
Scope 2 (location-based)
More than 5% but less than or equal to 10%
Metering/ Measurement Constraints
Electricity at several facilities is allocated between property under our operational control and property not under our control based on estimates of usage. Based on actual and estimated data, we chose “more than 5% but less than 10%”. These estimates were originally based on metering.
Scope 2 (market-based)
More than 5% but less than or equal to 10%
Metering/ Measurement Constraints
Electricity at several facilities is allocated between property under our operational control and property not under our control based on estimates of usage. Based on actual and estimated data, we chose “more than 5% but less than 10%”. These estimates were originally based on metering.

Scope
Uncertainty range
Main sources of
uncertainty
Please expand on the uncertainty in your data
CC8.6
Please indicate the verification/assurance status that applies to your reported Scope 1 emissions Third party verification or assurance process in place
CC8.6a
Please provide further details of the verification/assurance undertaken for your Scope 1 emissions, and attach the relevant statements
Verification
or assurance cycle in
place
Status in
the current
reporting year
Type of verification
or assurance
Attach the statement
Page/section
reference
Relevant standard
Proportion of reported
Scope 1 emissions
verified (%)
Annual process Complete Limited
assurance
https://www.cdp.net/sites/2017/17/23217/Climate Change 2017/Shared Documents/Attachments/CC8.6a/EY Assurance Letter for HCP 2016 ENV Data.pdf
Pages 1-8
Attestation standards established by AICPA (AT101)
100

CC8.6b
Please provide further details of the regulatory regime to which you are complying that specifies the use of Continuous Emission Monitoring Systems (CEMS)
Regulation
% of emissions covered by the system
Compliance period
Evidence of submission
CC8.7
Please indicate the verification/assurance status that applies to at least one of your reported Scope 2 emissions figures Third party verification or assurance process in place
CC8.7a
Please provide further details of the verification/assurance undertaken for your location-based and/or market-based Scope 2 emissions, and attach the relevant statements
Location-based or market-based figure?
Verification
or assurance
cycle in place
Status in
the current
reporting year
Type of verification
or assurance
Attach the statement
Page/Section reference
Relevant standard
Proportion
of reported Scope 2
emissions verified
(%)
Location-based
Annual process Complete Limited
assurance
https://www.cdp.net/sites/2017/17/23217/Climate Change 2017/Shared Documents/Attachments/CC8.7a/EY Assurance Letter for HCP 2016 ENV Data.pdf
Pages 1-8
Attestation standards established by AICPA
100

Location-based or market-based figure?
Verification
or assurance
cycle in place
Status in
the current
reporting year
Type of verification
or assurance
Attach the statement
Page/Section reference
Relevant standard
Proportion
of reported Scope 2
emissions verified
(%)
(AT101)
CC8.8
Please identify if any data points have been verified as part of the third party verification work undertaken, other than the verification of emissions figures reported in CC8.6, CC8.7 and CC14.2
Additional data points verified
Comment
Other: Direct and indirect energy consumption, in addition to other non-energy environmental and labor related metrics.
Direct and indirect energy consumption, in addition to other non-energy environmental and labor related metrics.
CC8.9
Are carbon dioxide emissions from biologically sequestered carbon relevant to your organization? No
CC8.9a
Please provide the emissions from biologically sequestered carbon relevant to your organization in metric tonnes CO2

Further Information
Page: CC9. Scope 1 Emissions Breakdown - (1 Jan 2016 - 31 Dec 2016)
CC9.1
Do you have Scope 1 emissions sources in more than one country? No
CC9.1a
Please break down your total gross global Scope 1 emissions by country/region
Country/Region
Scope 1 metric tonnes CO2e
CC9.2
Please indicate which other Scope 1 emissions breakdowns you are able to provide (tick all that apply) By business division By GHG type

CC9.2a
Please break down your total gross global Scope 1 emissions by business division
Business division
Scope 1 emissions (metric tonnes CO2e)
Medical Office 17824 Life Science 6753 Senior Housing 27680
CC9.2b
Please break down your total gross global Scope 1 emissions by facility
Facility
Scope 1 emissions (metric tonnes CO2e)
Latitude
Longitude
CC9.2c
Please break down your total gross global Scope 1 emissions by GHG type
GHG type
Scope 1 emissions (metric tonnes CO2e)
CO2 49768 CH4 87

GHG type
Scope 1 emissions (metric tonnes CO2e)
N2O 38 HFCs 2364
CC9.2d
Please break down your total gross global Scope 1 emissions by activity
Activity
Scope 1 emissions (metric tonnes CO2e)
Further Information
Page: CC10. Scope 2 Emissions Breakdown - (1 Jan 2016 - 31 Dec 2016)
CC10.1
Do you have Scope 2 emissions sources in more than one country? No
CC10.1a
Please break down your total gross global Scope 2 emissions and energy consumption by country/region
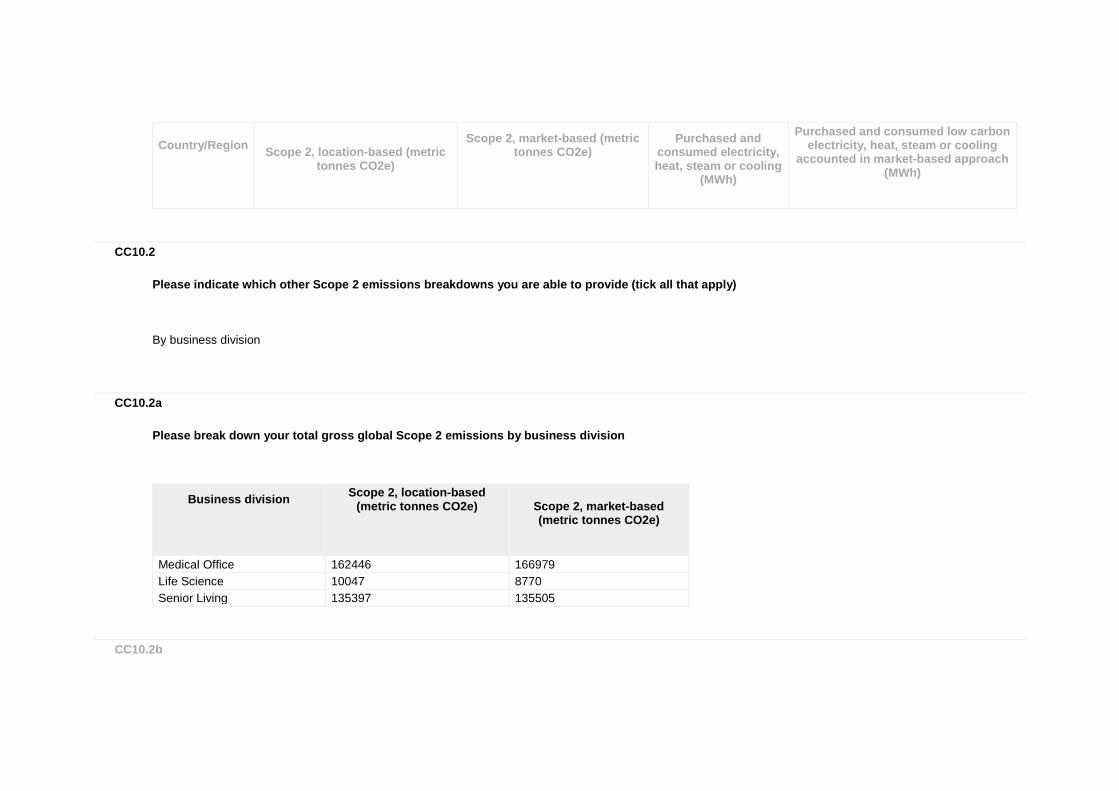
Country/Region
Scope 2, location-based (metric
tonnes CO2e)
Scope 2, market-based (metric tonnes CO2e)
Purchased and consumed electricity, heat, steam or cooling
(MWh)
Purchased and consumed low carbon electricity, heat, steam or cooling
accounted in market-based approach (MWh)
CC10.2
Please indicate which other Scope 2 emissions breakdowns you are able to provide (tick all that apply) By business division
CC10.2a
Please break down your total gross global Scope 2 emissions by business division
Business division
Scope 2, location-based (metric tonnes CO2e)
Scope 2, market-based (metric tonnes CO2e)
Medical Office 162446 166979 Life Science 10047 8770 Senior Living 135397 135505
CC10.2b

Please break down your total gross global Scope 2 emissions by facility
Facility
Scope 2, location-based (metric tonnes CO2e)
Scope 2, market-based (metric tonnes CO2e)
CC10.2c
Please break down your total gross global Scope 2 emissions by activity
Activity
Scope 2, location-based (metric tonnes CO2e)
Scope 2, market-based (metric tonnes CO2e)
Further Information
Page: CC11. Energy
CC11.1
What percentage of your total operational spend in the reporting year was on energy? More than 5% but less than or equal to 10%
CC11.2
Please state how much heat, steam, and cooling in MWh your organization has purchased and consumed during the reporting year

Energy type
MWh
Heat 0 Steam 5039 Cooling 5327
CC11.3
Please state how much fuel in MWh your organization has consumed (for energy purposes) during the reporting year 242164
CC11.3a
Please complete the table by breaking down the total "Fuel" figure entered above by fuel type
Fuels
MWh
Natural gas 226822 Diesel/Gas oil 146 Motor gasoline 10242 Liquefied petroleum gas (LPG) 4954
CC11.4

Please provide details of the electricity, heat, steam or cooling amounts that were accounted at a low carbon emission factor in the market-based Scope 2 figure reported in CC8.3a
Basis for applying a low carbon emission factor
MWh consumed associated with low
carbon electricity, heat, steam or cooling
Emissions factor (in units of metric
tonnes CO2e per MWh)
Comment
No purchases or generation of low carbon electricity, heat, steam or cooling accounted with a low carbon emissions factor 0
CC11.5
Please report how much electricity you produce in MWh, and how much electricity you consume in MWh
Total electricity consumed
(MWh)
Consumed
electricity that is purchased (MWh)
Total electricity produced
(MWh)
Total renewable
electricity produced (MWh)
Consumed renewable
electricity that is produced by company (MWh)
Comment
610002 609526 476 476 476
Further Information
Page: CC12. Emissions Performance
CC12.1
How do your gross global emissions (Scope 1 and 2 combined) for the reporting year compare to the previous year? Decreased

CC12.1a
Please identify the reasons for any change in your gross global emissions (Scope 1 and 2 combined) and for each of them specify how your emissions compare to the previous year
Reason
Emissions value
(percentage)
Direction of change
Please explain and include calculation
Emissions reduction activities 2.6 Decrease
We implemented 695 projects which include 2016 projects and any 2015 projects that impacted 2016.Last year (including those 2015 projects that impacted 2016), 9,910 metric tonnes CO2e were reducedby our emissions reduction activities, and our total Scope 1 and Scope 2 emissions in the previous year (rolling 2015 base year) was 375,416, therefore we arrived at 2.40% using the calculation: (9910/375416) x 100 = 2.60%.
Divestment 0 Acquisitions 0 Mergers 0 Change in output 0 Change in methodology 2.0 Decrease Used updated E-Grid factors for 2016 GHG calculations.
Change in boundary 0 Change in physical operating conditions
0
Unidentified 2.5 Decrease The formula for this item is as follows: -2.6 - 2.0 + 3.0 + X = -4.1 (X = -2.5)
Other 3.0 Increase
Our data shows a GHG intensity (Total Scope 1 and 2 CO2e/yearly sum of degree days) of 0.047 in 2015 and 0.039 in 2016. There was a 12% increase in total degree days between 2015 and 2016, which reflected in a decrease in overall intensity between 2015 and 2016. We use the geolocation of nearby weather stations and the building zip code to get these numbers. Thus weather normalizing for 2016 against the baseline of 2015 shows a Kbtu decrease of 3% which equates to a 3% increase for 2016.
CC12.1b

Is your emissions performance calculations in CC12.1 and CC12.1a based on a location-based Scope 2 emissions figure or a market-based Scope 2 emissions figure? Location-based
CC12.2
Please describe your gross global combined Scope 1 and 2 emissions for the reporting year in metric tonnes CO2e per unit currency total revenue
Intensity figure =
Metric numerator (Gross global combined
Scope 1 and 2 emissions)
Metric denominator:
Unit total revenue
Scope 2 figure used
% change
from previous
year
Direction of change
from previous
year
Reason for change
0.00025435 metric tonnes CO2e 1415949002 Location-based 1.4 Decrease
The primary reason for the decrease in the intensity factor resulted from a 11.2% increase in revenue, due to changes in our boundary building mix in 2016. The secondary reason for the decrease in the intensity factor was a decrease in Scope 1 and 2 emissions by 4.1%, which was due mostly to emission reduction activities.
CC12.3
Please provide any additional intensity (normalized) metrics that are appropriate to your business operations

Intensity figure =
Metric numerator (Gross global combined
Scope 1 and 2 emissions)
Metric denominator
Metric
denominator: Unit total
Scope 2 figure used
% change
from previous
year
Direction of change
from previous
year
Reason for change
1916 metric tonnes CO2e
full time equivalent (FTE) employee
188 Location-based 4.2 Decrease
One reason for the decrease in the intensity factor resulted from a 0.5% increase in total FTEs in 2016. The primary reason for the decrease in the intensity factor was a decrease in Scope 1 and 2 emissions by 4.1%, which was due mostly to emission reduction activities.
Further Information
Page: CC13. Emissions Trading
CC13.1
Do you participate in any emissions trading schemes? No, but we anticipate doing so in the next 2 years
CC13.1a
Please complete the following table for each of the emission trading schemes in which you participate
Scheme name
Period for which data is supplied
Allowances allocated
Allowances purchased
Verified emissions in metric tonnes CO2e
Details of ownership
CC13.1b

What is your strategy for complying with the schemes in which you participate or anticipate participating? We are still in the early discussion stages regarding the possible participation in any emissions trading schemes.
CC13.2
Has your organization originated any project-based carbon credits or purchased any within the reporting period? No
CC13.2a
Please provide details on the project-based carbon credits originated or purchased by your organization in the reporting period
Credit origination
or credit purchase
Project type
Project identification
Verified to which standard
Number of credits (metric
tonnes CO2e)
Number of credits (metric tonnes
CO2e): Risk adjusted volume
Credits canceled
Purpose, e.g. compliance
Further Information
Page: CC14. Scope 3 Emissions
CC14.1
Please account for your organization’s Scope 3 emissions, disclosing and explaining any exclusions

Sources of Scope 3
emissions
Evaluation status
metric tonnes CO2e
Emissions calculation methodology
Percentage of
emissions calculated using data obtained
from suppliers or value chain
partners
Explanation
Purchased goods and services
Relevant, not yet calculated
Capital goods Relevant, not yet calculated
Fuel-and-energy-related activities (not included in Scope 1 or 2)
Relevant, not yet calculated
Upstream transportation and distribution
Not relevant, explanation provided
We are a real estate company and do not produce goods that require transportation or distribution.
Waste generated in operations
Relevant, calculated 13606
Using the waste reduction model (WARM) for landfill waste of 35,560 metric tonnes (39,198 short tons), the Scope 3 emissions were calculated using the mixed solid waste (MSW) category. The Scope 3 emissions were 13,606 metric tonnes CO2e.
Utilized the waste reduction model (WARM), New Model Version 14 updated March 2016 (http//epa.gov/epawaste/conserve/tools/warm)
Business travel Relevant, not yet calculated
Employee commuting
Relevant, calculated 573
HCP’s methodology for calculating its Scope 3 emissions for employee commuting is based on an estimate of annual distance traveled by employees during their commute. HCP estimates that the average distance traveled for a commute for each employee is 16.5 miles (one-way), which

Sources of Scope 3
emissions
Evaluation status
metric tonnes CO2e
Emissions calculation methodology
Percentage of
emissions calculated using data obtained
from suppliers or value chain
partners
Explanation
results in a total commuting distance of 33 miles per day. In addition, HCP estimates that its employees work a total of 47 weeks per year, which assumes a five-day work week and does not include days not worked due to vacation, sick time and holidays. Based on these estimates, HCP calculates that each employee commutes a total of 7,755 miles per year (i.e., 33 miles per day x 5 days per week x 47 weeks). Consequently, to calculate the CO2e emissions based on the annual distance traveled by employees during their commute, HCP utilized the GHG Protocol Emissions from Mobile Sources Tool (World Resources Institute, 2013, GHG Protocol tool for mobile combustion, version 2.5) and inputted 7,755 miles per year and 23 miles per gallon for a passenger car (gasoline powered – Year 2005 to present) resulting in a calculation of 3.05 metric tonnes CO2e per employee (excluding biofuel CO2). Multiplying this result by the number of HCP employees (188) results in total emissions of 573 metric tonnes CO2e. This total likely overestimates HCP’s Scope 3 emissions for employee commuting given that it assumes 100% of employees commute to work via passenger car, and that each employee always commutes alone to work.

Sources of Scope 3
emissions
Evaluation status
metric tonnes CO2e
Emissions calculation methodology
Percentage of
emissions calculated using data obtained
from suppliers or value chain
partners
Explanation
Upstream leased assets
Relevant, not yet calculated
Downstream transportation and distribution
Not relevant, explanation provided
We are a real estate services company and do not produce goods that require transportation or distribution.
Processing of sold products
Not relevant, explanation provided
We are a real estate services company and do not produce goods that are sold.
Use of sold products
Not relevant, explanation provided
We are a real estate services company and do not produce goods that are sold.
End of life treatment of sold products
Not relevant, explanation provided
We are a real estate services company and do not produce goods that are sold.
Downstream leased assets
Relevant, not yet calculated
Franchises Not relevant, explanation provided We are not a franchise and do not own franchises.
Investments Relevant, not yet calculated
Other (upstream) Not relevant, explanation provided None identified.
Other (downstream)
Not relevant, explanation None identified.

Sources of Scope 3
emissions
Evaluation status
metric tonnes CO2e
Emissions calculation methodology
Percentage of
emissions calculated using data obtained
from suppliers or value chain
partners
Explanation
provided
CC14.2
Please indicate the verification/assurance status that applies to your reported Scope 3 emissions No third party verification or assurance
CC14.2a
Please provide further details of the verification/assurance undertaken, and attach the relevant statements
Verification or
assurance cycle in place
Status in the
current reporting year
Type of
verification or assurance
Attach the statement
Page/Section reference
Relevant standard
Proportion of
reported Scope 3 emissions verified (%)
CC14.3

Are you able to compare your Scope 3 emissions for the reporting year with those for the previous year for any sources? Yes
CC14.3a
Please identify the reasons for any change in your Scope 3 emissions and for each of them specify how your emissions compare to the previous year
Sources of
Scope 3 emissions
Reason for
change
Emissions
value (percentage)
Direction of change
Comment
Employee commuting
Change in physical operating conditions
2.5 Increase
Our total number of employees of 187 in 2015 increased to 188 in 2016 which represented at 0.5% increase and the main reason for the increase is the GHG tool factor revision that changed from 2.99 metric tonnes per year per employee in 2015 to 3.05 metric tonnes per year per employee in 2016 which is a 2% increase.
Waste generated in operations
Change in output Increase The increase was due to an increase in landfill waste due to property acquisitions, divestations and shifting in the number and type of our boundary building group resulting in a different property building mix to our boundary.
CC14.4
Do you engage with any of the elements of your value chain on GHG emissions and climate change strategies? (Tick all that apply) Yes, other partners in the value chain
CC14.4a

Please give details of methods of engagement, your strategy for prioritizing engagements and measures of success Our properties are managed by third party property management companies and operators. These groups handle the day to day operations of the facilities. We engage these partners on our GHG emissions and climate change strategies through the sharing of best practice techniques, the sharing of information on capital expenditure projects and tenant improvement projects that will result in the most energy efficient implementation, communications on utility monitoring and reporting, identification and submission emission and energy reduction project opportunities, development of strong business relationships, and providing a focus on sustainability. In addition, we conduct an annual conference with our management companies that includes breakout training sessions targeting energy and emissions reduction and preventive maintenance and best practices. Our 2016 annual conference attracted over 400 participants each of which gained insight regarding achieving environmental targets as well as sustainability management techniques. We also conduct regular visits to our properties and perform property condition assessments (PCAs) with the management companies. We engage our management companies heavily in the ENERGYSTAR program and in the documentation of sustainability efforts throughout the year. Our strategy for prioritizing engagements is based on an assessment of the needs and opportunities of the individual properties. We emphasize daily communication with the management companies as this type of engagement keeps a focus on meeting emission and energy reduction goals. It is this level of communication that can affect a shift in a management company’s organization’s internal policies, focus and priorities regarding sustainability and GHG emissions. We have been successful in our engagement with these partners as they understand the importance of sustainable practices and the benefits that can be achieved on an environmental and business level. We measure our success based on the feedback we receive from the management companies on potential projects that can reduce emission and energy and their understanding of our goals. In addition to reviewing our energy reduction efforts on a building by building basis, we also monitor our success on a management company basis to ensure communications are successful.
CC14.4b
To give a sense of scale of this engagement, please give the number of suppliers with whom you are engaging and the proportion of your total spend that they represent
Type of engagement
Number of suppliers
% of total spend (direct and indirect)
Impact of engagement
CC14.4c
Please explain why you do not engage with any elements of your value chain on GHG emissions and climate change strategies, and any plans you have to develop an engagement strategy in the future
Further Information
Module: Sign Off

Page: CC15. Sign Off
CC15.1
Please provide the following information for the person that has signed off (approved) your CDP climate change response
Name
Job title
Corresponding job category
Mike McKee Executive Chairman Board/Executive board
Further Information
CDP