module overview · module / day 1 assessment: making a claim / argument outline the student thesis...
TRANSCRIPT
1 MODULE / Day 1
MODULE OVERVIEW
HISTORICAL THINKING SKILLS (DAY 1):
Developments and Processes ● Making Connections
Explain how a historical development or process relates to another historical development or process
● Comparison Describe similarities and/or differences between different historical developments or processes.
● Argumentation Make a historically defensible claim.
CONTENT (DAY 1):
This content is designed for any High School Social Studies Class. Day 1 is History-centered while Day 2 and 3 are Geography-centered. AP World History references Key Concept-6.1.III Diseases, as well as medical and scientific developments, had significant
effects on populations around the world. Key Concept-6.III.A Diseases associated with poverty persisted while other diseases emerged as new epidemics and threats to human populations, in some cases leading to social disruption. These outbreaks spurred technological and medical advances. Some diseases occurred at higher incidence merely because of increased longevity.
D
A
Y
1
TO WHAT EXTENT IS THE CORONAVIRUS SIMILAR TO THE SPANISH FLU?
CLASS ACTIVITY: Making a Claim supported by Evidence
Students will investigate primary and secondary sources on the Coronavirus/COVID-19 pandemic of 2020 and the Spanish Influenza pandemic of 1918. Students will identify similarities and differences between government responses, Geographic diffusion, cultural impact, economic impact, public reaction, and the effects of the diseases themselves.
CHECK FOR UNDERSTANDING: Thesis Statement Students will synthesize comparisons between the Coronavirus and Spanish Influenza pandemics into an argumentative claim backed by document evidence.
D
A
Y
2
HOW DO WE SLOW DIFFUSION IN A GLOBALIZED WORLD?
CLASS ACTIVITY: Analyzing Quantitative Data
Students will investigate sources on the diffusion of COVID-19. Students will analyze population pyramids for five countries impacted by COVID-19.
CHECK FOR UNDERSTANDING: Making Predictions Students will predict how the diffusion of information regarding COVID-19 impacts the diffusion of the virus.
D
A
Y
3
WHAT ARE THE ECONOMIC CONSEQUENCES OF A PANDEMIC?
CLASS ACTIVITY: Analyzing Quantitative Data Students will analyze global economic data showing the impact of the spread of COVID-19. Students will analyze the growth of COVID-19 cases in Italy, South Korea, and the United States to identify current trends and to predict future growth as well as comparing how each country has addressed the spread of COVID-19.
CHECK FOR UNDERSTANDING: Global Impact of the COVID-19 Students will analyze changes in GDP forecasts for selected countries to demonstrate their understanding of the economic consequences of COVID-19, identify successful approaches to addressing the growth of COVD-19, and finally to discuss global consequences of pandemics.

2 MODULE / Day 1
MODULE SOURCES
D
A
Y
1
AUTHOR
WHDE Authors WHDE Authors WHDE Authors WHDE Authors WHDE Authors WHDE Authors WHDE Authors
SOURCE
Why was the 1918 Flu so Deadly? The Science Behind the Flu Art and the Spanish Flu Government Measures to Fight the New Plague The Largest Flu Pandemic in History How the Flu Spread Across America Effects of the 1918 Influenza Pandemic
DATE
March 13, 2020 March 13, 2020 March 13, 2020 March 13, 2020 March 13, 2020 March 13, 2020 March 13, 2020
D
A
Y
2
AUTHOR
CDC
UCSUSA
Worldometers
Drew Harris
Wikimedia Commons
CDC
White House
Wikimedia Commons
SOURCE
Map of COVID 19 Cases
Exponential vs Linear Growth Curves
Graph of COVID 19 Cases in Italy
Flatten the Curve
Map of Airline Connections
Social Distancing Tweet from CDC
White House Avoid Eating Out Tweet
World Map of Urbanization Levels
DATE
March 6, 2020
April 9, 2018
March 17, 2020
2020
2009
March 16, 2020
March 16, 2020
2015
D
A
Y
3
AUTHOR
WHDE Authors
WHDE Authors
WHDE Authors
WHDE Authors
WHDE Authors
WHDE Authors
WHDE Authors
WHDE Authors
WHDE Authors
WHDE Authors
WHDE Authors
WHDE Authors
WHDE Authors
SOURCE
Top 5 Markets for Motor Vehicle Parts and
Accessories produced in China (2018)
Estimated Impact of COVID-19 outbreak on global
tech shipments in Q1 2020
Dow Jones Industrial Average, EURO STOXX 50
Average, NIKKEI 225 Average, SSE Composite
Index 2/18/20 -3/12/20
Loss of Revenue for Airlines due to Coronavirus
Impact on United Airlines
Impact on Royal Caribbean Cruises
Total Coronavirus Cases 2/15/20 -3/16/20
New Coronavirus Cases in Italy, United States, and
South Korea 2/15/20 - 3/16/20
South Korea, Italy, and United States Approaches
to addressing the spread of Coronavirus
Organization for Economic Cooperation and
Development (OECD) Changes in GDP Growth
Forecast 2020
DATE
March 15, 2020
March 15,2020
March 15, 2020
March 15, 2020
March 15, 2020
March 15, 2020
March 15, 2020
March 15, 2020
March 16, 2020
March 16, 2020
March 16,2020
March 16, 2020
March 15. 2020

3 MODULE / Day 1
DAY ONE
Based on a 60-minute class
Lesson Question: To what extent is the Coronavirus/COVID-19 similar to the Spanish Flu?
Social Studies Skill: Comparison [History]
OVERVIEW
Students will investigate primary and secondary sources on the Coronavirus/COVID-19 pandemic of 2020 and the Spanish Influenza pandemic of 1918. Students will research one source on the Coronavirus/COVID-19 pandemic and in small groups will work to group similar sources into broader conceptual patterns. Students will then select one Spanish influenza source that is in a comparable broader category and identify similarities and differences between government responses, Geographic diffusion, cultural impact, economic impact, public reaction, and the effects of the diseases themselves. Students will synthesize comparisons between the Coronavirus and Spanish Influenza pandemics into an argumentative claim backed by document evidence.
PLEASE NOTE - there is a eLearning version of this same lesson located here.
Materials needed for:
Homework ● Students will be required to bring ONE article or resource that they find interesting in relation
to the Coronavirus/COVID-19 pandemic. They should have already read the article/resource and be prepared to share and explain it to classmates.
In-Class Activity ● CBS Sunday Morning Spanish Flu Video - “The story of the 1918 flu pandemic” ● Physical Copies of the Spanish Flu Sources and the T-Chart. In lieu of physical copies, teachers
can choose to have students digitally access the sources and the T-chart.
4 MODULE / Day 1
SEQUENCE OF INSTRUCTION
HOMEWORK OVERVIEW
HOMEWORK (30-60 MINUTES): ● Students will complete basic internet research on the Coronavirus/COVID-19. They should be
free to explore an area of interest in relationship to the pandemic. They need to save/access the link to an article or bring a printed copy.
Teacher Notes
The resource needs to be substantial and more than just a quick tweet or video. Point students in the direction of reputable news organizations, government resources or health organizations that can provide accurate information. They need to come to class ready to offer a summary of the resources argument and be able to categorize its main idea with other resources from students.
Teaching Tip
Some students may wish to dive into conspiracy theories or partisan sites that seek to politicize the health emergency. Try to guide students toward categories such as scientific investigations, pop culture, government actions, health, economic impacts, impacts on foreign countries, etc.
CLASS ACTIVITY: WARM-UP/INTRODUCTION
WARM-UP/INTRODUCTION (5 MINUTES):
ACTIVITY 1: Share a general overview of the state of the Coronavirus at this time with your classes. Up to date information can be found at the Centers For Disease Control update website - here.
Teacher Notes
The purpose of this brief activity/overview is to provide students with a common baseline of up to date information before they discuss individual resources that may or may not be up to date or accurate. While we do not want to discount an area of interest that a student has pursued, we do want to create an environment with shared facts to build understanding.
CLASS ACTIVITY PART 1: Student Research Categorization
CLASS ACTIVITY (10-15 MINUTES):
ACTIVITY 1: RESOURCE SHARE-OUT AND CATEGORIZATION
Students will start in pairs or small groups to share their resources. Each student should share what they read and present a basic summary of the major points and evidence cited. Students should explain what they found interesting and at least one new detail, fact, or idea they learned about the Coronavirus/COVID-19 virus or the response to the pandemic. Students will continue to discuss until all group members have shared.
When the share-out is complete, students need to categorize each resource. Ask students to consider if their resource is best categorized as:

5 MODULE / Day 1
● Scientific (origins, pathology, treatment, research, etc.)
● Cultural (artistic responses, pop culture, public reaction, controversies, conspiracy theories, etc.)
● Political (government actions, travel restrictions, quarantine, testing, etc.)
● Demographic (transmission process, survival rates, mortality rates, etc.)
● Geographic (# of cases by country, transmission routes, areas hardest hit, etc.)
● Economic (stock market shocks, travel industry, lost economic output, costs of treatment, etc.)
Students should annotate how their resources fit in the categories. Can they note specific evidence
from the resource that “makes it fit”? This evidence will be useful in later stages of the activity.
Teaching Tip
The goal is for students to look for similarities and differences between their resources and to form a comparative lens with which to view the Spanish Flu in the next part of the activity.
CLASS ACTIVITY PART 2: Video
CLASS ACTIVITY (10 MINUTES):
ACTIVITY 1: SPANISH FLU VIDEO
After students have categorized their sources, teachers should show this overview from CBS Sunday Morning that summarizes the current COVID-19 outbreak in Washington State as of March 8, 2020 and introduces the Spanish Flu of 1918 (The story of the 1918 flu pandemic - length 6:37).
Ask students to note information about the spread, mortality rates, and reactions by government and public health officials to the 1918 pandemic.
OPTIONAL QUESTION: How has the development of the Coronavirus pandemic changed since the information presented in this March 8 news snapshot
CLASS ACTIVITY PART 3: Comparisons
CLASS ACTIVITY (25-30 MINUTES):
ACTIVITY 1: SETTING UP THE COMPARISON
For this last activity, students will be in groups of three. This new small group should contain group members whose Coronavirus/COVID-19 resources are ideally in different categories than each other. The small group will select sources about the Flu pandemic of 1918 that are in the same categories as their individual sources. After reading and sharing information that they learned from each, the group will create a T-chart that compares similarities and differences between the Coronavirus outbreak of 2020 and the Spanish Flu Pandemic of 1918 based upon their collective readings. From this T-Chart, students will create a rough draft of an argument structure that addresses this prompt: To what extent is the Coronavirus outbreak of 2020 similar to the Spanish Flu pandemic of 1918?
6 MODULE / Day 1
ASSESSMENT: Making a Claim / Argument Outline The student thesis should qualify an argument that sets-up a 2 to 1 comparison (2 differences/1 similarity OR 2 similarities/1 difference). The sources and their analysis should guide their argument structure decisions. Here is an example of this type of thesis/argument structure model: Although the outbreaks have similar global reach, they differ in their mortality rates and government responses. Following the thesis, students need to list in bulleted or rough draft format the evidence for their three arguments based upon their sources. This can be finished for homework or perhaps debriefed in a whole class discussion if class time runs short.
Teaching Tip
Depending on the length of the class period, teachers may decide to assign this assessment as homework or at the beginning of the next class period. This lesson is good practice for crafting an argument that could help students with preparation for essays on many history/social studies state exams as well as the Long Essay Question of an AP History exam.

7 MODULE / Day 1
IN-CLASS ACTIVITY MATERIALS
T-CHART -
Comparing Coronavirus/COVID-19 of 2020 to the Spanish Flu of 1918
Identify 3 categories for your resources/articles and then use the chart to organize your evidence about the similarities and differences between the two pandemics.
Coronavirus/COVID-19 Spanish Flu
Category #1
Category #2
Category #3
Categories could be:
➢ Scientific (origins, pathology, treatment, research, etc.)
➢ Cultural (artistic responses, pop culture, public reaction, controversies, conspiracy theories, etc.)
➢ Political (government actions, travel restrictions, quarantine, testing, etc.)
➢ Demographic (transmission process, survival rates, mortality rates, etc.)
➢ Geographic (# of cases by country, transmission routes, areas hardest hit, etc.)
➢ Economic (stock market shocks, travel industry, lost economic output, costs of treatment, etc.)

8 MODULE / Day 1
SPANISH FLU SOURCES These six sources are categorized as scientific, cultural, political, demographic, geographic, and
economic. Students will select the source that corresponds to the same category as their
Coronavirus/COVID-19 source. As students read the source, they should note or annotate similarities
and differences they see between the Spanish Flu Pandemic and the Coronavirus/COVID-19 pandemic.
Source 1 - SCIENTIFIC - Why was the 1918 Flu so Deadly? The Science Behind the Flu1
The 1918 H1N1 flu pandemic killed about 50 million people with 675,000 deaths in the United States.
Unlike other influenza strains, the 1918 “Spanish” Flu was particularly deadly for 15-34 year olds. No flu
before or since has had such a high death rate and researchers have often wondered why.
Researchers have focused their efforts to obtain samples of the virus from the victims of 1918. One
attempt went as far as to visit a small Inuit village in Alaska that saw 72 of 80 adults perished. Because of
the permafrost, researchers believed that they may find traces of the virus in the corpses at the local
cemetery. After initial unsuccessful attempts in 1951, the discovery of lung tissue from a serviceman
who died from the disease at a South Carolina army camp, and a second attempt in 1997 in the Inuit
village, genetic material of the disease was discovered.
From the virus found in preserved lung tissue, researchers found that the 1918 flu was a novel influenza
A (H1N1) that came from humans and pigs and was related to the oldest classical swine influenza strain.
Further research said it also shared traits with avian or bird flus and most likely infected humans between
1900 and 1915. By 2005, the entire genome of the 1918 virus was sequenced and it was now possible to
recreate a live version to attempt to learn what made it so deadly.
The decision to recreate the disease was not undertaken lightly. The US Centers for Disease Control set
strict controls on the project which would be held at the Atlanta CDC headquarters. Some safety
measures included personnel with powered air purifying respirators, double gloves, scrubs, shoe covers
and surgical gowns. All workers had to shower before leaving the lab and all work with the virus or
animals had to be done inside a biosafety cabinet. Airflow in the lab was also self-contained, no other flu
virus work was allowed to take place concurrently, and only one person, microbiologist Dr. Terence
Tumpey, was allowed access because he carried the responsibility of reconstructing the virus.
Dr. Tumpey began in 2005, working alone after hours in order to reduce the risk to other workers and the
public. Dr. Tumpey took daily antiviral drugs and had to live knowing that if he became infected he
would be quarantined. Dr. Tumpey reconstructed the virus and then tested it on lab mice who were also
1 This source is a summarized version of “The Deadliest Flu: The Complete Story of the Discovery and Reconstruction of the 1918 Pandemic Virus” by Douglas Jordan with contributions from Dr. Terrence Tumpey and Barbara Jester. https://www.cdc.gov/flu/pandemic-resources/reconstruction-1918-virus.html, January 2006.

9 MODULE / Day 1
tested with other flu variants to conduct comparison studies. The results were striking. The 1918 virus
reproduced itself 39,000 times more than comparison flu viruses. It also was highly lethal as most mice
died within 3 days and lost 13% of their body weight within 2 days. It was 100 times more lethal than
other types of influenza as well. The virus specifically attacked lung tissue much more so than other
viruses in many cases up to 50 times higher. These factors along with other societal factors led to the
disastrous consequences in 1918-1919.
Even though there have been three other flu pandemics (1957, 1968, and 2009) since 1918, none have
been as deadly due to many factors unique to the times. The 1918 influenza pandemic emerged during
World War I when millions of troops traveled across the world to live in crowded conditions. Health
services and technology were not as advanced as today. No tests existed. No vaccines or antibiotics had
been developed yet. No antiviral medicines were available, nor were intensive care units or mechanical
ventilation. Further complicating treatment was the fact that 30% of US doctors were out of the country
with the troops in Europe. Governments also did not coordinate planning for pandemics at the time. The
banning of public gatherings, school closures, isolation and quarantine orders were left to state and local
officials but little federal planning existed.
The world is quite different now. Are governments and international agencies in 2020 ready to handle
new pandemic threats? That wasn’t the case in 1918.
10 MODULE / Day 1
Source 2 - CULTURAL - Art and the Spanish Flu2
The Influenza pandemic of 1918 was called the Spanish Flu, not because it had Spanish biological origins,
but rather because the press in Spain was not bound by World War I government censors as it was
officially neutral. Spanish press reports of the flu pandemic unfairly attached “Spanish” to the disease.
Reporting on the pandemic in many countries was nearly non-existent, so modern researchers hoping to
learn more about the public response to the disease have turned to art and artists.
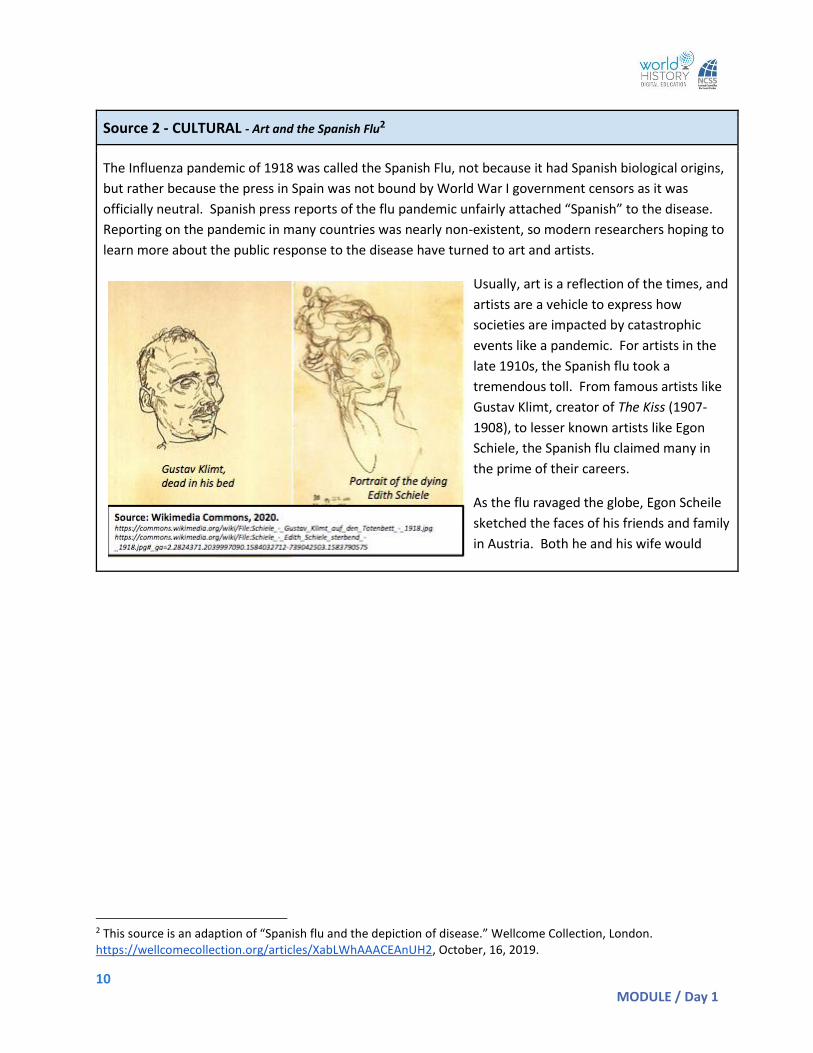
Usually, art is a reflection of the times, and
artists are a vehicle to express how
societies are impacted by catastrophic
events like a pandemic. For artists in the
late 1910s, the Spanish flu took a
tremendous toll. From famous artists like
Gustav Klimt, creator of The Kiss (1907-
1908), to lesser known artists like Egon
Schiele, the Spanish flu claimed many in
the prime of their careers.
As the flu ravaged the globe, Egon Scheile
sketched the faces of his friends and family
in Austria. Both he and his wife would
2 This source is an adaption of “Spanish flu and the depiction of disease.” Wellcome Collection, London. https://wellcomecollection.org/articles/XabLWhAAACEAnUH2, October, 16, 2019.
11 MODULE / Day 1
contract the flu and die in 1918. The examples here above show the disease-worn face of his mentor,
Gustav Klimt, on his deathbed in 1918.
The face is gaunt and haggard from the ravages of the flu. Similarly, Scheile’s portrait of his wife, Edith,
shows a tired patient with well-worn bags under her eyes.
This sketch was made as she lay dying. The artist himself
died three days later.
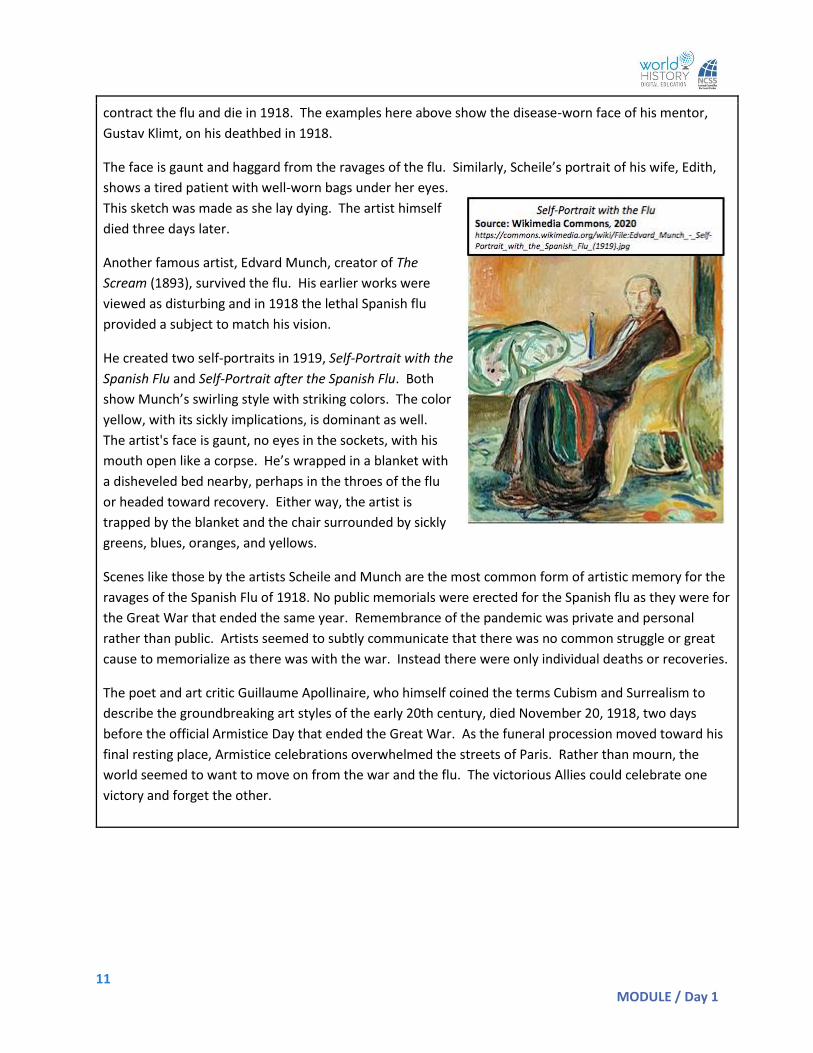
Another famous artist, Edvard Munch, creator of The
Scream (1893), survived the flu. His earlier works were
viewed as disturbing and in 1918 the lethal Spanish flu
provided a subject to match his vision.
He created two self-portraits in 1919, Self-Portrait with the
Spanish Flu and Self-Portrait after the Spanish Flu. Both
show Munch’s swirling style with striking colors. The color
yellow, with its sickly implications, is dominant as well.
The artist's face is gaunt, no eyes in the sockets, with his
mouth open like a corpse. He’s wrapped in a blanket with
a disheveled bed nearby, perhaps in the throes of the flu
or headed toward recovery. Either way, the artist is
trapped by the blanket and the chair surrounded by sickly
greens, blues, oranges, and yellows.
Scenes like those by the artists Scheile and Munch are the most common form of artistic memory for the
ravages of the Spanish Flu of 1918. No public memorials were erected for the Spanish flu as they were for
the Great War that ended the same year. Remembrance of the pandemic was private and personal
rather than public. Artists seemed to subtly communicate that there was no common struggle or great
cause to memorialize as there was with the war. Instead there were only individual deaths or recoveries.
The poet and art critic Guillaume Apollinaire, who himself coined the terms Cubism and Surrealism to
describe the groundbreaking art styles of the early 20th century, died November 20, 1918, two days
before the official Armistice Day that ended the Great War. As the funeral procession moved toward his
final resting place, Armistice celebrations overwhelmed the streets of Paris. Rather than mourn, the
world seemed to want to move on from the war and the flu. The victorious Allies could celebrate one
victory and forget the other.

12 MODULE / Day 1
Source 3 - POLITICAL - Government Measures to Fight the New Plague3
The influenza of 1918 began in an army camp in Kansas in March 1918. Within three weeks over a thousand
soldiers were hospitalized and many thousands more were silently infected. It spread at alarming rates with
the soldiers. By the spring of 1918, seventy-five percent of the French and fifty percent of the British army
were infected. In May, the flu had traveled to North Africa and India; by June it arrived in China and later in
Australia.
This first wave was followed by a much more serious second wave that lasted six weeks beginning in August.
The disease was most likely a mutation of the first wave. It ravaged the Americas and Africa before arriving in
Europe and Asia. By November 5th, 1918 the pandemic was declared over in New York. By December most of
the world was flu-free since most flu-related deaths had already occurred including Spain’s King Alfonso XIII.
A third wave circulated in 1919 emerging from Australia before circling back to the United States and Paris
during the peace negotiations. The pandemic finally ended with one final outburst in Japan at the end of 1919
into early 1920. Altogether at least 50 million died, though it was not possible to fully calculate the global
numbers at the time.
When the pandemic began, health authorities were caught between a rock and hard place. Little was known
about the causes; no cure existed; and the return of soldiers from war, refugee populations, and the movement
of women into the workplace complicated attempts to prevent the spread of the disease. Officials needed to
assess the impact of the disease while not alarming the public further. The first official actions designed to
prevent further spread began in August 1918. Suspected cases were required to be reported while schools
and army barracks were monitored. With few tools available, these actions were seemingly the only effective
means to combat the outbreak.
European authorities tried to strengthen measures by closing public meeting spaces, and church services were
limited in length as no sermon could go longer than five minutes. In both Europe and the US, street cleaning
and disinfectants were used in churches and cinemas. Crowds were banned outside shops and public
transport limited the number of occupants. Sanitation services were organized to remove human waste,
regulate toilets, provide clean water, and to inspect milk and food. Italians banned funeral rituals and set up
public collection points for the dead. Even spitting was forbidden as officials struggled to identify causes and
prevent further cases.
In most countries, the press failed to report on the spread of the flu. Spain was an exception as a neutral
country in World War I because their press lacked the censorship controls of others involved in the war.
Spanish newspapers were free to report on the disease in their country and thus news-starved citizens across
the world wrongly attributed the disease to the Spanish. Beginning with the first wave in 1918, government
officials denied the veracity of reports on the rapid spread of the disease. Newspapers aided this
disinformation campaign by also not reporting on the spread for fear of inciting panic. Local officials refused
to reveal statistics on people affected, numbers dead, and wrongly circulated the notion that the epidemic
would last at most two months.
3 This source is an adaption of “The Spanish Influenza Pandemic: a lesson from history 100 years after 1918.” US National Library of Medicine: National Institutes of Health. https://www.ncbi.nlm.nih.gov/pmc/articles/PMC6477554, March 2019.

13 MODULE / Day 1
In this vacuum of real news, conspiracy theories began to circulate. One blamed the poor quality of food due to
wartime rationing as a contributing factor in the pandemic. Another theory claimed that the disease was germ
warfare used by the desperate Germans. No evidence for either emerged. Instead, silence reigned as the only
news was emergency measures and closures that seemed to emerge too late as people both young and old
died. Unlike plagues of the past, church bells did not toll as sometimes these too were banned in order to
prevent panic and doom.
Source 4 - DEMOGRAPHIC - The Largest Flu Pandemic in History4
Life expectancy has been on the rise since the Industrial Revolution and the rise of modern medicine in the
19th century. In the last century, average life expectancy in the Western World has almost doubled. These
trends were momentarily halted by the Influenza pandemic of 1918-1919. As the graph below shows, period
life expectancy, which measures mortality patterns in one year at a time, shows a sharp drop in 1918.
As the pandemic spread from the Northern Hemisphere and even into the middle of the Pacific, the global
death count grew. Mortality rates peaked in 1918 but didn’t fully recover until 1920, two years later.
The flu in contemporary times is responsible for 294,000-518,000 deaths annually which is around .005% of
the global population. By contrast, the Spanish Flu of 1918, so named because of neutral Spain’s ability to
freely report on the pandemic during the censored era of World War I, had a death rate 182 times higher.
Estimates of total deaths range from 17.4 million deaths to 50 million which translates to .95% - 2.7% of the
4 This source is an adaption of Max Roser’s, “The Spanish flu (1918-20): The global impact of the largest influenza pandemic in history.” University of Oxford. https://ourworldindata.org/spanish-flu-largest-influenza-pandemic-in-history, March 4, 2020.

14 MODULE / Day 1
world’s population at the time. Demographers believe that the years of the Spanish Flu pandemic is the last
time the world’s population declined.
Other influenza pandemics have been deadly. An earlier pandemic called the Russian Flu in 1889-94 was
believed to have killed one million while a later pandemic in 1968-69 named the Hong Kong Flu was believed
to have killed up to four million. None, as illustrated in the graph below, have had the impact of the Spanish
Flu.
Different age groups were affected by the Spanish Flu. While it might intuitively seem that the elderly
population would be impacted more, the inverse is true. Younger people were affected more. As the graph
below shows, people thirty years old and under suffered the most during the prime pandemic years of 1918-
1920. For these age groups, life expectancy from birth declined from 54 to 41 years while older groups' life
expectancy stayed steady with pre-pandemic trends. Some theories speculate that older populations in 1918
were those who had already survived the Russian Flu which provided them some immunity.
The Spanish Flu hit the world in an age when modern treatments were still in their infancy. The majority of
deaths were actually attributed to secondary infections like pneumonia in a time when many populations were
weakened by a global war and large overcrowded urban populations lived in unsanitary environments. A new
pathogen like the Spanish flu when introduced into such an environment led to devastating global effects.

15 MODULE / Day 1
The Spanish Flu hit the world in an age when modern treatments were still in their infancy. The majority of
deaths were actually attributed to secondary infections like pneumonia in a time when many populations were
weakened by a global war and large overcrowded urban populations lived in unsanitary environments. A new
pathogen like the Spanish Flu introduced into such an environment had devastating global effects.
Source 5 - Geographic - How the Flu Spread Across America5
Where did the “Spanish” Flu begin? We can say for certain that it didn’t originate in Spain even though news
coverage of the pandemic mistakenly made Americans believe so. During WWI, censorship of news prohibited
local and national papers from adequately covering the pandemic in the United States, but the Spanish, neutral
in the War and under no such restrictions, freely reported as the flu ravaged the country.
So if it wasn’t Spain, where did it come from? Some researchers have recently claimed that the disease’s
origins were in France in 1916 or in China or Vietnam in 1917. Many researchers, though, point to its origins
in the United States. Two possible starting points emerge and both are in Kansas: Haskell County and Camp
Funston.
5 This source is an adaption of John M. Barry’s “How the Horrific 1918 Flu Spread Across America.” Smithsonian Magazine. https://www.smithsonianmag.com/history/journal-plague-year-180965222/, November 2017.

16 MODULE / Day 1
Reports from January 1918 in local papers mention strange illnesses in Haskell. Most reports mention
pneumonia lethally spreading throughout a local community. Later, some Haskell men reported to Camp
Funston, Kansas. Funston was an Army training complex for soldiers on their way to fight in WWI. By March
1918, the first reported case of the illness emerged at the base. Within two weeks, 1,100 soldiers were in the
hospital and thousands more were sick. Thirty-six soldiers died. From there, the flu spread with soldiers as
they moved to other Army camps on their way to the war front. Twenty-four of the thirty-six largest WWI era
Army camps stateside had reported cases. From these sites across the country, the disease jumped to the
civilian community.
Unlike other seasonal flus, this new flu penetrated deep into the lungs, damaging tissue and leading to
pneumonia. Over the next fifteen months, the flu spread across the United States and then across the world.
Global estimates put the death toll between 50 and 100 million people. In the United States, 670,000 were
killed.
As the flu left the United States, it penetrated the armed forces of Allied and Central Powers alike. The British
Grand Fleet had over ten thousand sailors in the hospital in the months of May and June. These sailors largely
recovered, with only four deaths, but the flu continued to spread. By April, French and German troops were
affected in the trenches of the western front. Some military historians blame the flu in 1918 for severely
weakening the German army enough that it was unable to continue the war, leading to the Armistice in
November of that year. At one French army post over six hundred of the thousand soldiers contracted the flu,
though only 5% died. By June the flu had arrived in Algeria (Africa) and New Zealand (in the Pacific). Though
it spread fast, the death toll in spring 1918 was rather low among the young and healthy populations that were
afflicted.
This all changed with the second wave in the fall. In September, an Army camp in Massachusetts outside
Boston, Camp Devens had the capacity to hold 45,000 soldiers with a hospital that could accommodate 1200
patients. Before the second wave hit, the hospital had eighty-four patients. At the peak of the outbreak, 1543
soldiers were reported ill with influenza in one day. The camp was overwhelmed. Doctors, nurses, workers,
and soldiers were all sick. Those not treated in the hospital died in the barracks. Camp Devens was the first
site of this more deadly second wave of the Spanish Flu. It spread by ship to naval yards in Philadelphia. A
parade was scheduled for September 28th to help a Liberty Loan effort to support the war. Against the advice
of doctors, the largest parade in Philadelphia was held. Over the next two to three days, the incubation period
of this pandemic, reports started to come in from all over the city about an outbreak. Urgent requests for
nurses were posted in papers. A request for 3,100 nurses was met with only 193 as very few were available.
At its height in Philadelphia, 759 people a day died. Schools were closed, public gatherings were banned, but it
was too late. More than 12,000 citizens died in six weeks. The second wave struck and, like the first, moved
on to claim more victims from Alaska to Africa.
The second wave was brutal. Over a four-day period in Arkansas in October, 8,000 patients were admitted to
the hospital at the Army’s Camp Pike. Due to wartime censors, neighboring Little Rock’s newspaper could only
report the benign headline - “Spanish influenza is plain la grippe [Spanish for flu] - same old fever and chills.”
Yet this was nothing like simple flu or even like past outbreaks. In San Antonio, Texas fifty-three percent of the
population was ill. Towns ran out of coffins. Panic ensued and the healthy refused to help the sick. Reports in
Pennsylvania and Connecticut speak of neighbors refusing to go into the homes of the sick to help. The local
Red Cross begged for help distributing food to the sick but were met largely with silences as fear of becoming
infected overwhelmed people’s charitable spirits.
17 MODULE / Day 1
Panic hit the workplace. Shipyards on the east coast reported record absenteeism. Even with the war still
raging, absentee rates from forty-one to fifty-four percent emerged from shipyard after shipyard. City streets
were empty. A man in Wellington, New Zealand reported standing in the middle of the formally busy streets at
2:00 pm to find shops closed, no trains, and no people. The only vehicle was a van with a makeshift red cross
painted on its side serving as a hearse.
The third and final wave came in January of 1919. This wave was not as lethal as the second. At the Paris
Peace Conference, President Woodrow Wilson fell ill with what was reported as a stroke at the time. Medical
historians since have argued that his symptoms instead point to the flu that was ravaging Paris at the time and
had already claimed one of Wilson’s young aides.
When the third wave finally subsided in spring 1919, the world took stock. Though the death toll was great,
overall mortality was around two percent of the population in the developed world. In less developed places,
the mortality rate was even higher. In Mexico, the flu claimed two to four percent of the population. In Russia
and Iran, seven percent died. In the Fiji Islands the number climbed to fourteen percent in sixteen days! One-
third of the population of the Canadian province of Labrador died. In small native settlements from Alaska to
Gambia, whole villages died.
Unlike most pandemics, the young were more likely to die from the Spanish Flu. Healthy immune systems
produced cytokine toxins designed by the body to combat microbes. These cytokines attacked the flu as it
penetrated deep into the lungs, further damaging the organ and inviting secondary infections like bacterial
pneumonia which ultimately killed most patients. Human immune system defenses were actually doing more
harm than good in this pandemic.
While the flu annually afflicts mankind, averaging from 3,000 to 48,000 deaths in the United States a year, no
flu since 1918 has been as lethal in overall fatalities.
Source 6 - ECONOMIC - Effects of the 1918 Influenza Pandemic6
The Influenza Pandemic of 1918 occurred in the same year that the United States sent two million of the four
million men drafted into service after war was declared in April of 1917. As US forces entered combat in
earnest in the summer of 1918, news of outbreaks earlier in the spring were drowned out by wartime
censorship and by news of battles.
Named from reports of the outbreak in censor-free Spanish newspapers, the Spanish Flu killed an estimated
40 million people globally in three different waves. In the United States, mortality rates were highest in
Pennsylvania, Maryland and New Jersey while the states of Michigan, Minnesota, and Wisconsin suffered least.
States with higher concentrations of urban populations suffered more than states with greater rural
populations. This also explains some racial differences in mortality as whites comprised 90 percent of the
urban population in 1918 and were therefore more likely to die from the flu.
How did these facts impact the US Economy? While it may seem obvious that an economy would be negatively
impacted, research has been lacking in this area. Modern researchers have relied on evidence from
6 This source is an adaption of Thomas A. Garrett’s Economic Effects of the 1918 Influenza Pandemic. St. Louis Federal Reserve Bank. https://www.stlouisfed.org/~/media/files/pdfs/community-development/research-reports/pandemic_flu_report.pdf, November 2007.
18 MODULE / Day 1
newspapers that were less likely to be impacted by wartime censorship in smaller towns such as Little Rock
(Arkansas Gazette) and Memphis (The Commercial Appeal). A story from the former, entitled “How Influenza
Affects Business” in October 1918 discussed how local businesses claimed reduced sales from 40 to 70
percent. Grocery retailers noted sales fell by a third. On average, the story claimed that Little Rock businesses
were losing $10,000 a day (which would be over $130,000 in 2006 dollars). The only business seeing
increases in sales were drug stores. The Memphis paper in its story entitled, “Influenza Crippling Memphis
Industries” during the same month claims that industrial plants were running severely under capacity due to
lack of personnel. The local railway reported 124 of 400 employees sick while the telephone company was
missing over a hundred employees necessitating a plea for residents to only make essential calls. Mining
operations decreased as much as fifty percent with some mining camps reporting that only 2 percent were
healthy enough to work.
The Spanish Flu had a direct impact on the wellbeing of workers. In a study of manufacturing in the period
1914-1919, wages rose by 1919. While this sounds positive, the explanation lies purely in supply and demand.
If workers were in short supply and the demand for workers rose (both due to the war and the flu draining
able bodied workers from factories), then wages for workers would rise. While positive in the short run, other
studies have shown that children that were in-utero during the pandemic or born near that time were more
likely to have health problems throughout life. The short term benefit of higher wages was mitigated by higher
healthcare costs and declining quality of life that would affect families for decades after the flu outbreak.
In summary, the loss of life reduced human capital needed in the economy. In the short run, this led to
decreases in production and higher wages for workers due to the lack of labor. Some businesses that
specialized in healthcare products also saw short run gains. Businesses in the service and entertainment
industries suffered double digit losses during the pandemic. The economy would recover much as it had after
earlier disasters.