moej/gec jcm feasibility study (fs) 2015 development of district energy supply...
TRANSCRIPT
1
MOEJ/GEC JCM Feasibility Study (FS) 2015
Development of District Energy Supply Business by Introducing Co-generation
Table of Contents 1. Project background ......................................................................................................................... 2
2. Objective of the FS .......................................................................................................................... 2
3. Project description: ......................................................................................................................... 2
a. Project location............................................................................................................................ 2
b. Indonesian partner(s) .................................................................................................................. 2
c. Description of the technology ..................................................................................................... 2
d. Project details .............................................................................................................................. 3
4. The result of the study .................................................................................................................... 5
a. Current condition in Indonesia .................................................................................................... 5
b. Regulation(s) and policy(ies) related to the project .................................................................... 6
c. Role of each participants ............................................................................................................. 7
d. Reference scenario setting .......................................................................................................... 7
e. Monitoring methods.................................................................................................................... 8
f. Quantification of GHG emissions and their reductions ............................................................... 9
g. MRV methods ............................................................................................................................ 10
h. Scale of investment & financial viability .................................................................................... 11
i. Contribution to Indonesian Sustainable Development ............................................................. 11
j. Proposed implementation schedule ......................................................................................... 11
k. Capacity building to the host country ....................................................................................... 11
5. Conclusion and Next Steps ............................................................................................................ 12
List of Abbreviations
AMDAL Analisis Mengenai Dampak Lingkungan
BCP Business Continuity Planning
BKPM Badan Koordinasi Penanaman Modal
CO2 Carbon Dioxide
COP Coefficient of Performance
ESDM Kementerian Energi dan Sumber Daya Mineral
IMB Izin Mendirikan Bangunan
IP Izin Prinsip
IUKS Izin Usaha Ketenagalistrikan untuk Kepentingan Sendiri
IUKU Izin Usaha Ketenagalistrikan untuk Kepentingan Umum
JCM Joint Crediting Mechanism
PALYJA PAM Lyonnaise Jaya
PGN Perusahaan Gas Negara
PLN Perusahaan Listrik Negara
SIPPT Surat Izain Penunjukan Penggunaan Tanah
SLO Sertifikat Laik Operasi
WU Wilayah Usaha
2
1. Project background
A local real estate developer plans to develop complex buildings consisting of office, apartment
and hotel in central Jakarta. JGC plans to introduce a co-generation system into the buildings.
The advantages of co-generation system are as follows
Highly-efficient operation by utilization of waste heat in the presence of heat consumer in
nearby area.
Cost-competitive system compared with grid electricity by utilization of city gas whose price
is lower than that
Contribution to environmental friendliness (CO2 emission reduction)
Stable energy supply
Contribution to BCP (Business Continuity Planning)
2. Objective of the FS
The objective of this project is to introduce highly-efficient city gas fuelled cogeneration system
into complex buildings consisting of office, apartment and hotel in central Jakarta, and to develop
a model of district energy supply that contributes to CO2 emission reduction and stable energy
supply.
In order to meet this objective, the feasibility study (FS) focused upon the following points.
Current situation of the co-generation system or gas engines in Jakarta
Perspective of stakeholders (central government, local government, PLN and PGN) on
co-generation system
Energy price Trend
Regulation and licences
Business scheme
Condition for the Feasibility study
Feasible co-generation system
Economic Performance
CO2 emission reductions
3. Project description:
a. Project location Central Jakarta
b. Indonesian partner(s) A local real estate developer (A company)
c. Description of the technology
The co-generation system applied in this project is indicated in the following figure.
This system consists of;
2 gas engines (2,000 kW × 2 = 4,000 kW)
2 absorption chillers that utilized waste heat from engines (1,884 kW × 2 = 3,768 kW)
1 gas fired absorption chillers (3,869 kW)

3
The system supplies;
35 GWh/yr of electricity
27 GWh/yr of cold heat for air-conditioning
Figure 1 Co-generation System Flow
d. Project details
The scope of the project is illustrated below.
Figure 2 Scope of the Project
Gas Engine
Gas Engine
Absorption Chiller
Absorption Chiller
City Gas Cooling Tower
Cooling Tower
Gas fired AbsorptionChiller
Cooling Tower
Water
ComplexBuildings
Electricity: 35 GWh/yr
Cold water: 27 GWh/yr(Difference between Supply and Return)
Electricity
Cold Water (Supply)
Cold Water (Return)
Clean Water
City Gas
Grid Electricity
Complex Buildings(Office, Apartment, Hotel)
Meter
Project Scope
Electricity (PLN)
Gas(PGN) Gas
Meter
PIP, DB
FCUFCU
FCU
Chiller
ChillerGas Engine ColdWater
Facility Building
FCU
Hot Water
Header
PFPDB
PFPDB
Elec.
DB
Elec.Meter
Water(PALYJA) Water
Meter
Elec.
FCU: Fan Coil UnitDB: Distribution BoardPFP: Power Feeder PanelPIP: Power Incoming Panel
DB
DB
DB
DB
DB
Meter Meter Meter
4
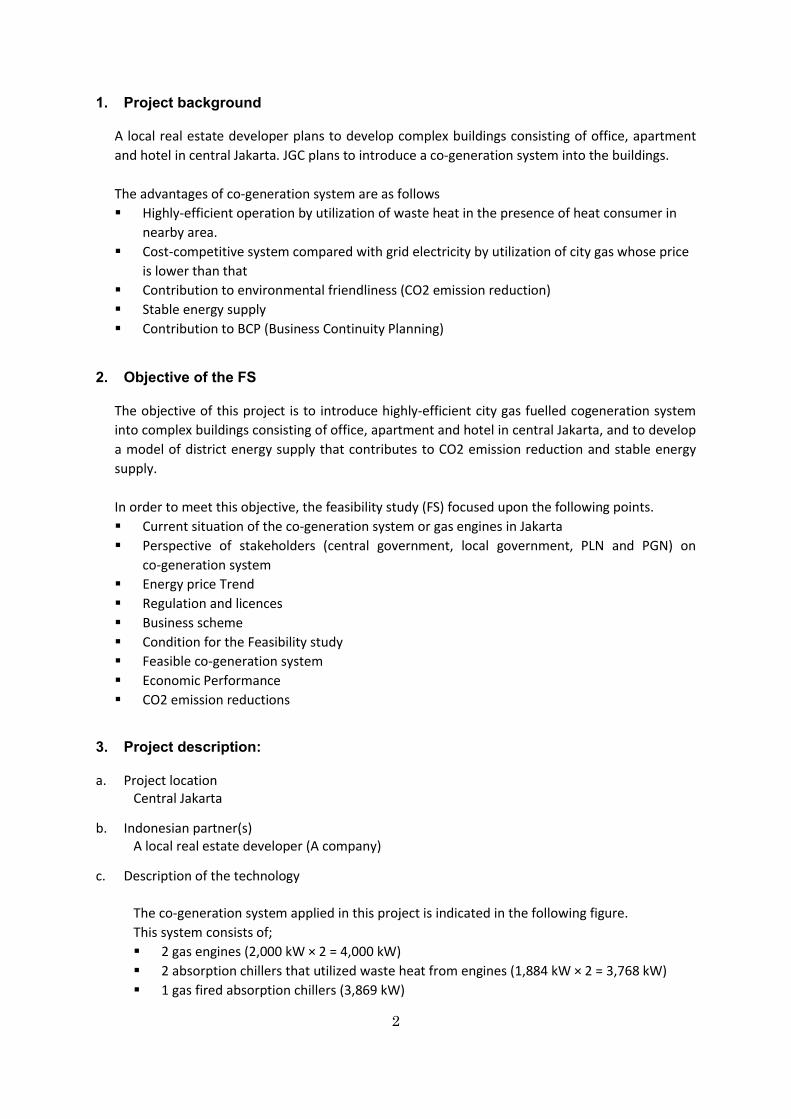
The electricity demand was estimated from floor area of the complex buildings. As an example,
the hourly electricity demand for weekday is shown below.
Figure 3 Hourly Electricity Demand (Weekday)
The cold heat demand estimated from building plan is shown below.
Table 1 Cold Heat Demand
Building/Facility Floor Area
[m2] Annual Demand
[TJ/year]
Office 26,464 33
Sky Bridge 7,110 16
Hotel 11,880 11
Apartment 37,584 37
Total 83,038 98
The input and output condition for this co-generation system is shown in the following table.
Table 2 Input and Output Condition
INPUT
Electricity Consumption 6.5 [GWh/year]
Gas Consumption 6.9×10⁶ [m3/year] ( 73 [GWh/year] )
Water Consumption 1.4×10⁵ [m3/year]
OUTPUT Electricity Sale 35 [GWh/year]
Cold Heat Sale 98 [TJ/year] ( 27 [GWh] )
0
500
1,000
1,500
2,000
2,500
3,000
3,500
4,000
4,500
5,000
5,500
6,000
0:00 1:00 2:00 3:00 4:00 5:00 6:00 7:00 8:00 9:00 10:00 11:00 12:00 13:00 14:00 15:00 16:00 17:00 18:00 19:00 20:00 21:00 22:00 23:00
[kV
A]
Office
Skybridge
Hotel
Apartment
Parking
Total
Hourly Electricity Demand (weekday)

5
4. The result of the study
a. Current condition in Indonesia
Co-generation system is still unpopular in Jakarta especially commercial market. Spread of
energy saving system also contributes to sustainable society in parallel l to power plant
expansion.
The following figure shows the past trend of electricity tariff. After the tariff increased with
government subsidy cut by around 2014, the tariff fluctuated due to tariff adjustment based
on ICP(Indonesian Crude Price), exchange rate and inflation.
Figure 4 Trend of Electricity Tariff (PLN)
400
600
800
1000
1200
1400
1600
07
/20
10
02
/20
11
09
/20
11
04
/20
12
12
/20
12
07
/20
13
02
/20
14
09
/20
14
05
/20
15
12
/20
15
PLN
's E
lect
rici
ty T
arif
f[R
p./
kWh
]
Month/Year
Household(R-1, 2200VA)
Household(R-2, 3.5-5.5kVA)
Household(R-3, 6.6kVA)
Business(B-2, 6.6-200 kVA)
Business(B-3, 200 kVA超)
6
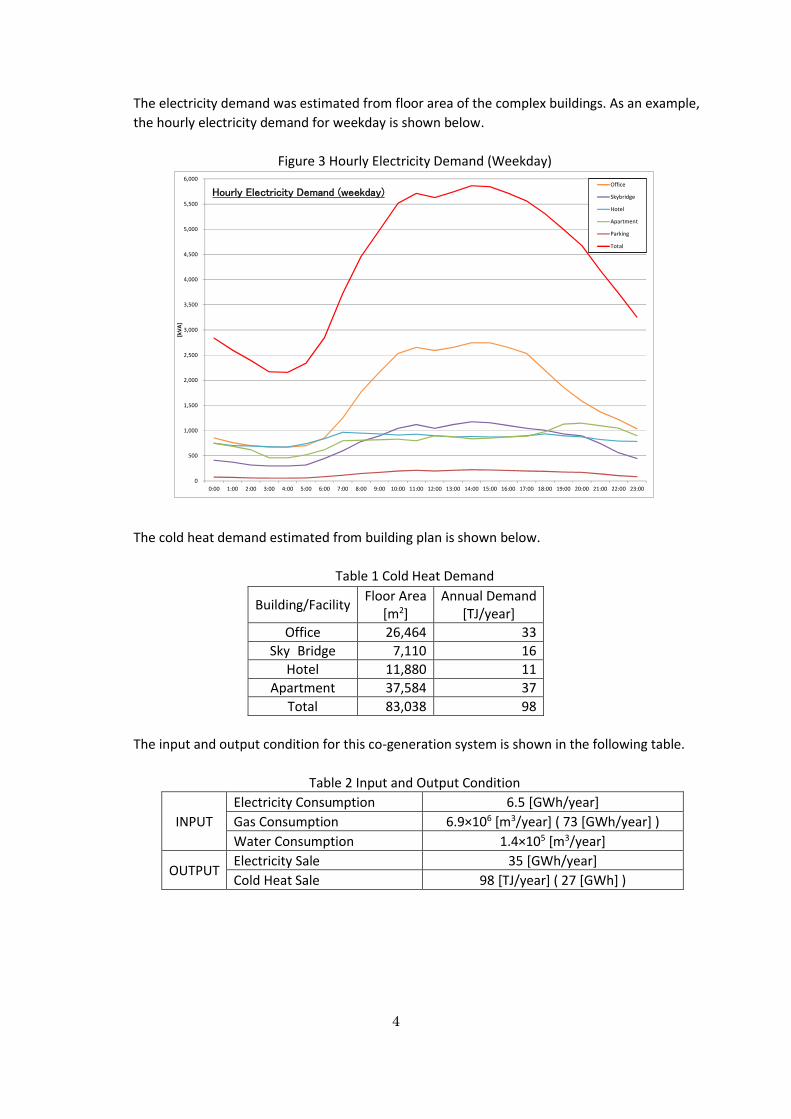
To understand stakeholders’ perspectives, our study conducted interview with central
government, local government, PLN and PGN. Each stakeholder’s perspective is shown below.
Table 4 Stakeholders’ Perspectives
ESDM
ESDM anticipates private sector's investment on electricity business as the electricity generation capacity is not sufficient in Indonesia. Basically one electricity Company shall be in one business area for public electricity supply under the current electricity regulation. If current electricity company's supply is not enough, other company is able to obtain business area.
PLN PLN supposes the electricity capacity is sufficient in Jakarta. Business area may be given to private company where it is difficult for PLN to supply.
PGN PGN is supportive for installing co-generation system.
b. Regulation(s) and policy(ies) related to the project
Indonesia Government announced the plan to increase the electricity supply capacity by 35
GW during 2015-2019. Japanese Prime Minister agreed on cooperation of this plan in March
2015. Corresponding to this plan, ESDM promote policy to stimulate private sector’s
investment.
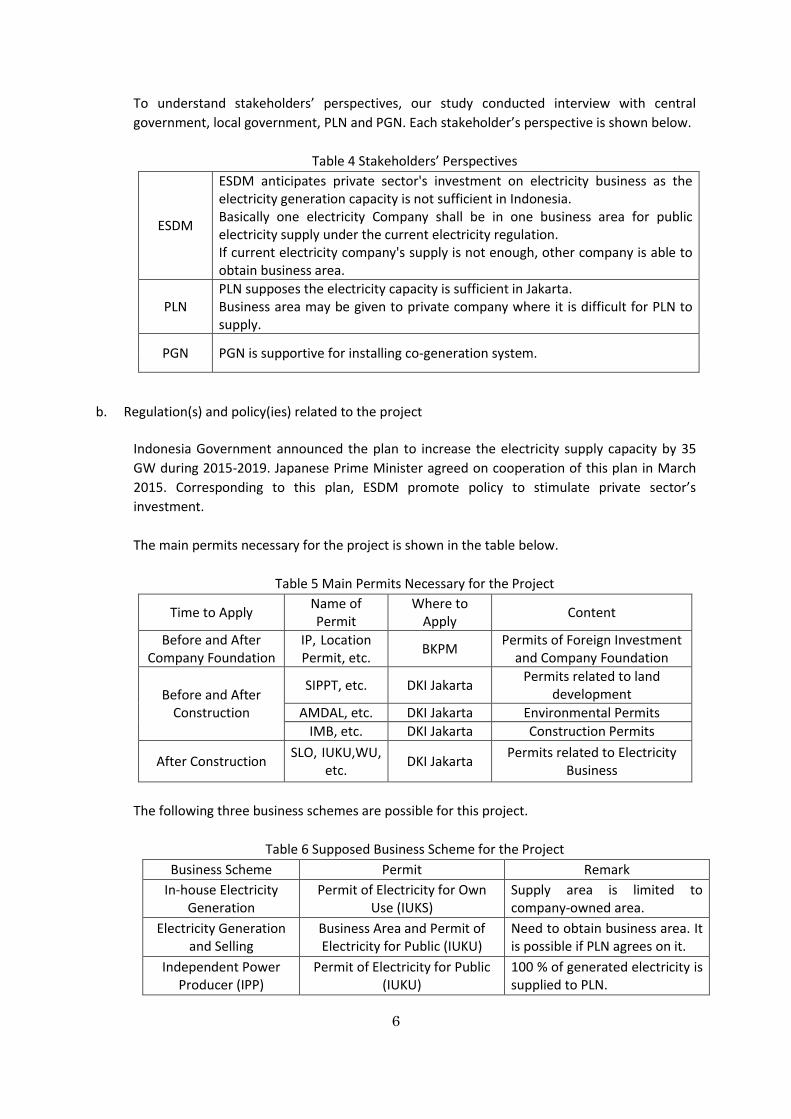
The main permits necessary for the project is shown in the table below.
Table 5 Main Permits Necessary for the Project
Time to Apply Name of Permit
Where to Apply
Content
Before and After Company Foundation
IP, Location Permit, etc.
BKPM Permits of Foreign Investment
and Company Foundation
Before and After Construction
SIPPT, etc. DKI Jakarta Permits related to land
development
AMDAL, etc. DKI Jakarta Environmental Permits
IMB, etc. DKI Jakarta Construction Permits
After Construction SLO, IUKU,WU,
etc. DKI Jakarta
Permits related to Electricity Business
The following three business schemes are possible for this project.
Table 6 Supposed Business Scheme for the Project
Business Scheme Permit Remark
In-house Electricity Generation
Permit of Electricity for Own Use (IUKS)
Supply area is limited to company-owned area.
Electricity Generation and Selling
Business Area and Permit of Electricity for Public (IUKU)
Need to obtain business area. It is possible if PLN agrees on it.
Independent Power Producer (IPP)
Permit of Electricity for Public (IUKU)
100 % of generated electricity is supplied to PLN.
7
Since IPP scheme can supply only to PLN, it does not meet the project’s purpose. Although the
scheme of In-house Electricity Generation is easier to obtain permits, the supply area is
limited to the area owned by the company. In this feasibility study, the scheme of Electricity
Generation and Selling is selected under the assumption that business area is obtained from
PLN.
If the business area license were open to private company, more business opportunity born
and energy efficient technology could be adopted.
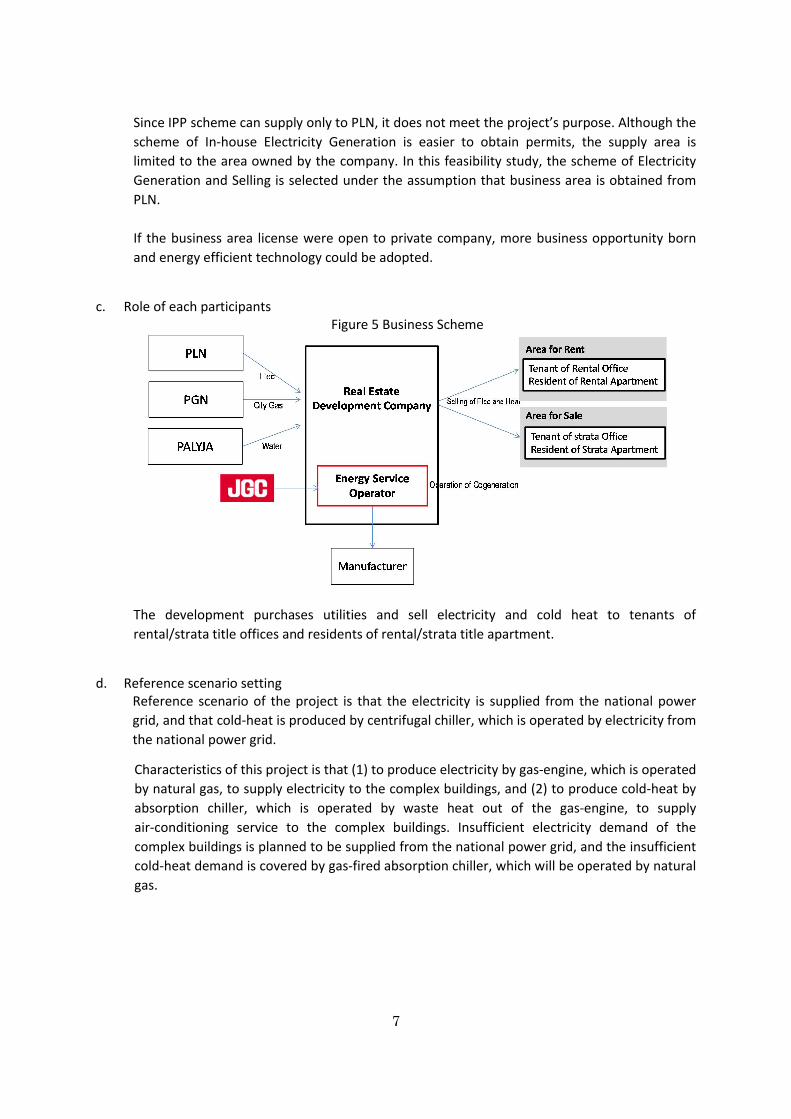
c. Role of each participants Figure 5 Business Scheme
The development purchases utilities and sell electricity and cold heat to tenants of
rental/strata title offices and residents of rental/strata title apartment.
d. Reference scenario setting Reference scenario of the project is that the electricity is supplied from the national power
grid, and that cold-heat is produced by centrifugal chiller, which is operated by electricity from
the national power grid.
Characteristics of this project is that (1) to produce electricity by gas-engine, which is operated
by natural gas, to supply electricity to the complex buildings, and (2) to produce cold-heat by
absorption chiller, which is operated by waste heat out of the gas-engine, to supply
air-conditioning service to the complex buildings. Insufficient electricity demand of the
complex buildings is planned to be supplied from the national power grid, and the insufficient
cold-heat demand is covered by gas-fired absorption chiller, which will be operated by natural
gas.

8
The figure below shows the project scheme and reference scenario with energy balance.
Figure 6 Project Scheme and Reference Scenario
e. Monitoring methods Parameters required to be monitored in the project are such as following: the amount of
natural gas purchased by the project in a year; the amount of grid electricity purchased by the
project in a year; and CO2 emission factor for the regional grids and natural gas.
In terms of monitoring methods, natural gas and electricity amount are to be monitored by
the meters, crosschecked by the invoices. Monitoring devices shall be calibrated based on
national or international standards. In addition, the project operator shall check the latest
value of the relevant CO2 emission factor.
Table 7 Monitoring Methods
Electricity Demand
Cold-heat Demand
35 GWh/yearNatural gas
68 GWh/year
Natural gas6 GWh/year
Gas Engine
Absorption Chiller
Gas-fired Chiller
Grid Electricity6.5 GWh/year
Complex Buildings
Electric Chiller
Project Scheme
Reference Scenario
27 GWh/year
Grid Electricity35 GWh/year
Grid Electricity4 GWh/year
Electricity Demand
Cold-heat Demand
35 GWh/year
27 GWh/year
Complex Buildings
Category Check ItemTechnical
manager・Staff
Financial manager
Calibration Staff
Reference
Natural Gas Supply status / Amount
〇 - 〇(International
standards)
Gas meterInvoices
Price / Amount - 〇 - Invoices
Electricity Supply status / Amount
〇 - 〇(International
standards)
Electricity meter
Price/ Amount - 〇 - Invoices
CO2 Emission 〇 〇 - MRV report
Maintenance Cost 〇(Operation cost)
〇(maintenance
cost)
- Invoices Working records
Feasibility check - 〇 - Reference electricity price check

9
f. Quantification of GHG emissions and their reductions Reference emissions are calculated based on the following conditions;
Table 8 Condition for Calculation of Reference Emissions
ITEMS VALUE SOURCE
CO2 emission factor for JAMALI 0.843 t CO2/MWh The latest value released by Indonesian Government
COP of Centrifugal Chiller 5.94 ID_AM002 “Energy Saving by Introduction of High Efficiency Centrifugal Chiller”
Electricity Demand of the complex Buildings
35 GWh/year FS Study Team
Cold-heat Demand of the complex Buildings
98 TJ/year FS Study Team
Reference emissions calculation:
Electricity; 35 x 103 MWh/year × 0.843 t CO2/MWh ≈ 29,466 t CO2/year
Cold-heat; 98TJ/year / 5.94 ≈ 16TJ/year 16 TJ/year × 0.278 kWh/MJ ≈ 4.6 GWh/year 4.6 x 10³ MWh/year × 0.843 t CO2/MWh ≈ 3,847 t CO2/year
TOTAL; 29,466 t CO2/year + 3,847 t CO2/year = 33,313 t CO2/year
Project emissions are calculated based on the following conditions;
Table 9 Condition for Calculation of Project Emissions
ITEMS VALUE SOURCE
Electricity received from the national power grid
6.5 GWh/year FS Study Team
Consumption amount of natural gas for gas-engine
6.4 x 10⁶ m3/year FS Study Team
Consumption amount of natural gas for gas-fired absorption chiller
0.6 x 10⁶ m3/year FS Study Team
Calorific value 38.2 MJ/m3 Calculated by FS Study Team based on information received from PLN
CO2 emission factor for JAMALI 0.843 t
CO2/MWh The latest value released by Indonesian Government
CO2 emission factor for natural gas 56.1 t CO2/TJ 2006 IPCC Guidelines for National Greenhouse Gas Inventories Volume 2 Energy
Project emissions calculation:
Electricity; 6.5 x 10³ MWh/year × 0.843 t CO2/MWh ≈ 5,490 t CO2/year
Cold-heat; (6.4 x 10⁶ m3/year + 0.6 x 10⁶ m3/year) × 38.2 MJ/m3 ≈ 264 TJ/year
264 TJ/year × 56.1 t CO2/TJ ≈ 14,831 t CO2/year
TOTAL; 5,490 t CO2/year + 14,831 t CO2/year = 20,321 t CO2/year
Therefore, the reduction of GHG (CO2) emissions by this project is reference emissions minus
project emissions. The calculation formula is as below;
10
33,313 t CO2/year - 20,321 t CO2/year = 12,992 t CO2/year
hence, the annual reduction amount of GHG (CO2) emissions by implementing this project is
12,992 t CO2.
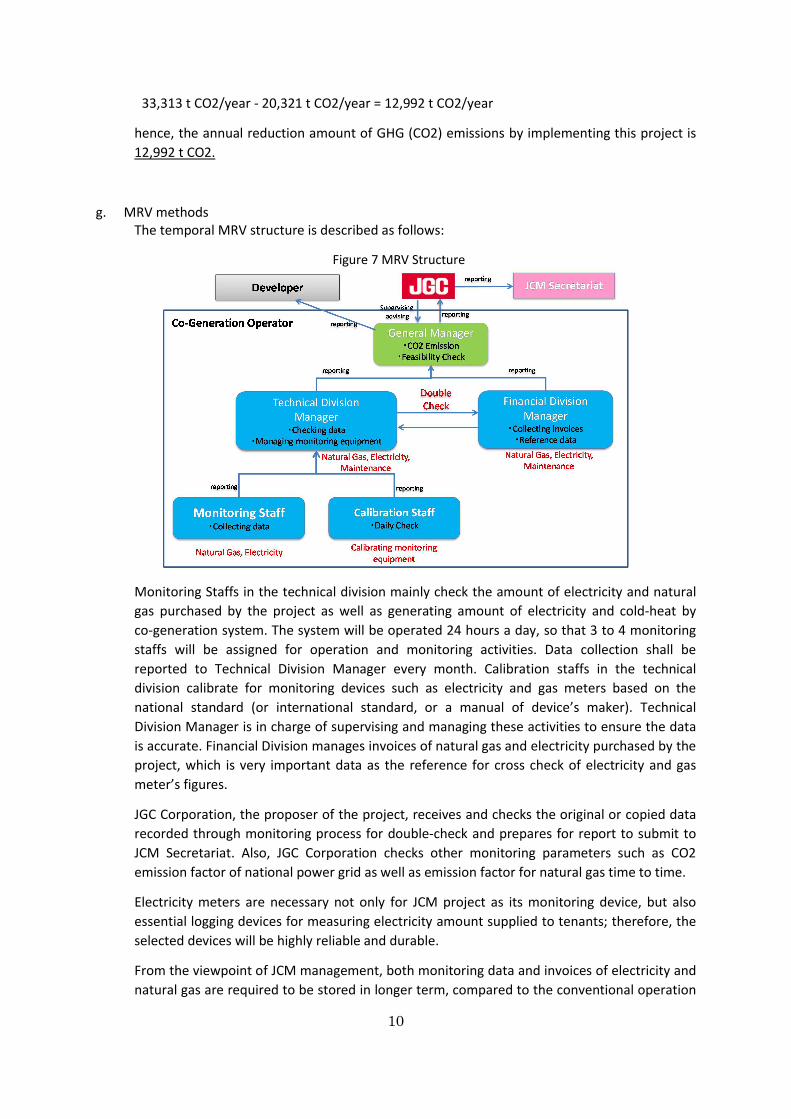
g. MRV methods The temporal MRV structure is described as follows:
Figure 7 MRV Structure
Monitoring Staffs in the technical division mainly check the amount of electricity and natural
gas purchased by the project as well as generating amount of electricity and cold-heat by
co-generation system. The system will be operated 24 hours a day, so that 3 to 4 monitoring
staffs will be assigned for operation and monitoring activities. Data collection shall be
reported to Technical Division Manager every month. Calibration staffs in the technical
division calibrate for monitoring devices such as electricity and gas meters based on the
national standard (or international standard, or a manual of device’s maker). Technical
Division Manager is in charge of supervising and managing these activities to ensure the data
is accurate. Financial Division manages invoices of natural gas and electricity purchased by the
project, which is very important data as the reference for cross check of electricity and gas
meter’s figures.
JGC Corporation, the proposer of the project, receives and checks the original or copied data
recorded through monitoring process for double-check and prepares for report to submit to
JCM Secretariat. Also, JGC Corporation checks other monitoring parameters such as CO2
emission factor of national power grid as well as emission factor for natural gas time to time.
Electricity meters are necessary not only for JCM project as its monitoring device, but also
essential logging devices for measuring electricity amount supplied to tenants; therefore, the
selected devices will be highly reliable and durable.
From the viewpoint of JCM management, both monitoring data and invoices of electricity and
natural gas are required to be stored in longer term, compared to the conventional operation
11
of power stations. JCM Manager and staffs need to take a special care to handle and store
those data. Therefore, the data handling and storage manual are planned to be prepared. In
addition, an educational program for these monitoring activities and management method
will be held once a year or after staff re-assignment.
h. Scale of investment & financial viability
The conditions and results for the feasibility study are indicated below.
<Investment>
Equipment [billion Rp] 64
Building [billion Rp] 5
Total [billion Rp] 69
<Other Conditions>
Corporate income tax 25%
Depreciation Period Buildings: 20 years (straight-line) Facilities: 16 years (strait-line)
Exchange Rate UDR-USD: 13,333 IDR/USD (average of year 2015) IDR-JPY: 110 IDR/JPY (average of year 2015)
Business Period Construction: 2 years Operation: 15 years
<Result of Economic Analysis>
Pay Back Period : 11 years
i. Contribution to Indonesian Sustainable Development Since this co-generation operate with higher efficiency than mono-generation including large
scale fossil fuel fired power plant, it contributes to energy saving and CO2 emission reduction.
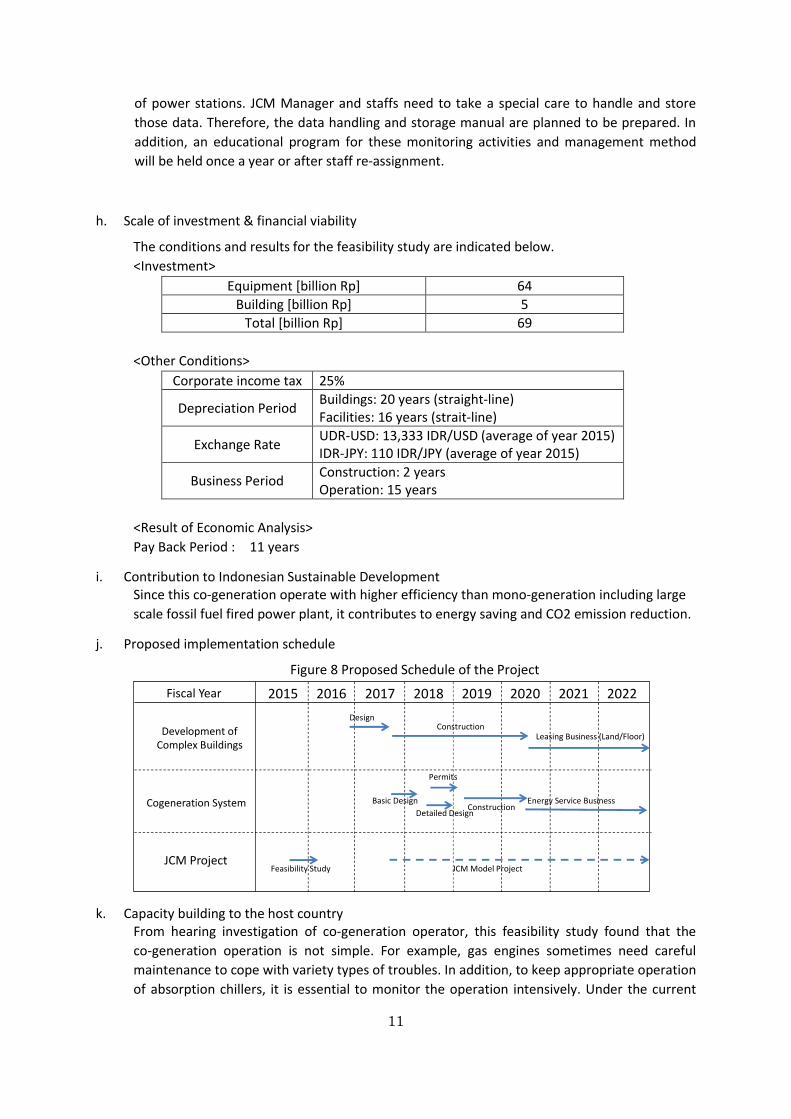
j. Proposed implementation schedule
Figure 8 Proposed Schedule of the Project
k. Capacity building to the host country From hearing investigation of co-generation operator, this feasibility study found that the
co-generation operation is not simple. For example, gas engines sometimes need careful
maintenance to cope with variety types of troubles. In addition, to keep appropriate operation
of absorption chillers, it is essential to monitor the operation intensively. Under the current
2015 2016 2017 2018 2019 2020 2021 2022
Cogeneration System
Development ofComplex Buildings
ConstructionBasic Design Energy Service Business
Construction
Permits
Leasing Business (Land/Floor)
Design
JCM ProjectJCM Model ProjectFeasibility Study
Detailed Design
Fiscal Year

12
situation where there exist only a few examples of co-generation system for commercial
buildings, human resource for the operation is not enough.
In the project, one of possible capacity building plan is to train operators of co-generation
system and to transfer conduct capacity building program by technical know-how of
co-generation operation in order to cope with the above-mentioned issue.
5. Conclusion and Next Steps
This feasibility study found that the co-generation system proposed in the study could archive
following points.
Energy Cost reduction
40% of Carbon dioxide emission reduction
However, since there a few example of co-generation system installed in Jakarta, the benefit of
co-generation is sometimes hardly understood. Once the business circumstances prepared, we
propose this system to the local real estate company then move on to the next step.