moe.stats.2012
DESCRIPTION
Singapore educational statisticsTRANSCRIPT

Moulding The Future of Our Nation


PRIMARY, SECONDARY AND PRE-UNIVERSITY EDUCATION, 2011 Summary Statistics
1 Number of Schools by Level and Type …………………………………………… 3
2 Students, Education Officers and EP in Schools by Level ……………………… 3
3 Summary Statistics on Education Officers ………………………………………. 4 Enrolment Statistics
4 Enrolment, Number of Classes and Class Size by Level ……………………….. 5
5 Primary Enrolment by Age and Level …………….……………………………….. 7
6 Secondary Enrolment by Age, Level and Course ……………………….………. 9
7 Junior College / Centralised Institute Enrolment by Age and Level ……….…… 11
8 Number of Schools by Level and Electoral Constituency ……….……………… 12
9 Enrolment by Level and Electoral Constituency ………………………………… 13 Education Officers’ Statistics
10 Teachers’ Academic Qualification, Length of Service and Age by Level……… 15
11 Vice-Principals’ Academic Qualification, Length of Service and Age by Level.. 16
12 Principals’ Academic Qualification, Length of Service and Age by Level …….. 17 Private Schools
13 Statistics on Private Education Institutions …..…………………………………… 18 ITE, LASALLE, NAFA, POLYTECHNIC AND UNIVERSITY EDUCATION, 2011
14 Intake, Enrolment and Graduates of ITE by Course ……………………………. 21
15 Intake, Enrolment and Graduates of LASALLE and NAFA by Course ………... 22
16 Intake, Enrolment and Graduates of Polytechnics by Course …………………. 23
17 Intake, Enrolment and Graduates of Universities by Course …………………… 24
CONTENTS
Preface …………………………………………………………………………………..……. iii
Overview of the Education System .………………………………………………………... vii
Key Educational Indicators …………………………………………………………………. xiii

STATISTICAL SERIES
18 Number of Schools by Level and Type …………………………………………… 27
19 Enrolment by Level and School Type ... …………………………………………. 29
20 Primary Enrolment by Level and Stream ……..………………………………….. 30
21.1 Secondary Enrolment by Level and Course …..…………………………………. 31
21.2 Secondary Enrolment by Level and Course ………….………………………….. 32
22 Pre-University Enrolment by Level ………………………………………………... 33
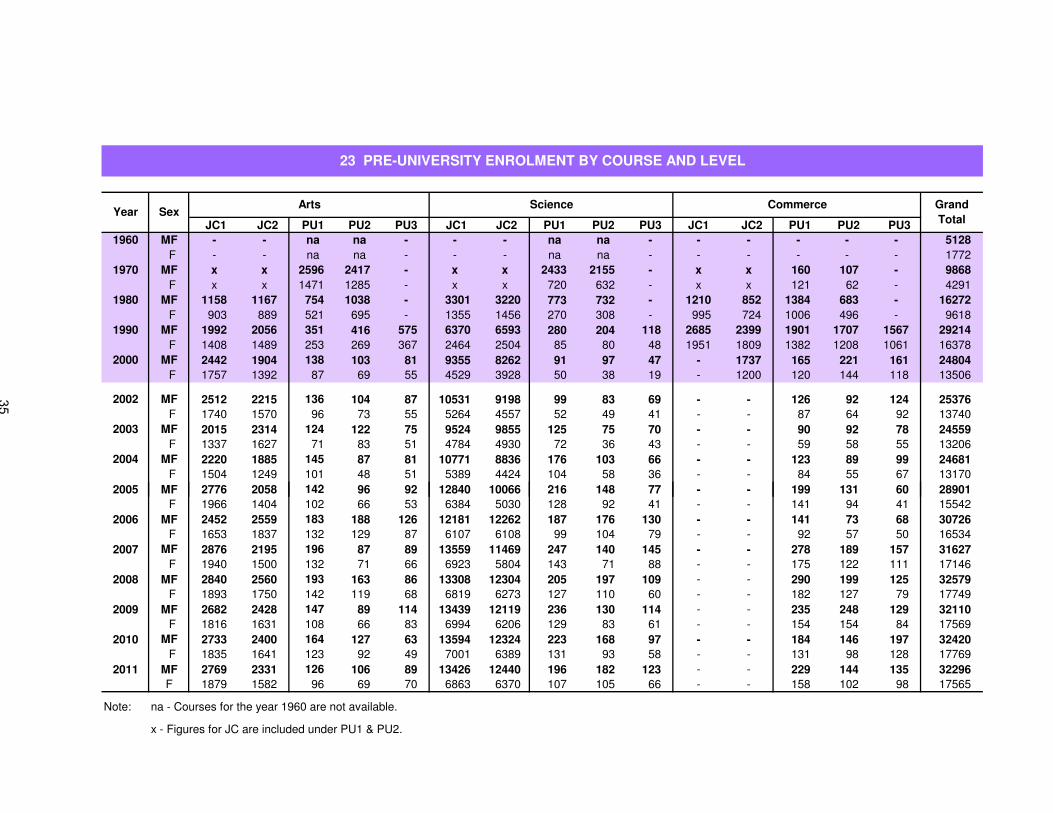
23 Pre-University Enrolment by Course and Level .………………………………… 35
24 Number of Teachers by Level and School Type ……………………………….. 37
25 Intake: Universities, Polytechnics, LASALLE, NAFA and ITE …………………. 39
26 Enrolment: Universities, Polytechnics, LASALLE, NAFA and ITE ……………. 41
27 Graduates: Universities, Polytechnics, LASALLE, NAFA and ITE ……….…… 43
28 Government Development Expenditure on Education …………........................ 45
29 Government Recurrent Expenditure on Education ……………………………… 47
30 Government Recurrent Expenditure on Education Per Student ....................... 49
31 Percentage of Pupils who Passed PSLE by Ethnic Group …………….………. 50
32 Percentage of Pupils with at Least 5 ‘O’ Level Passes by Ethnic Group …….. 51
33 Percentage of Pupils with at Least 3 ‘A’ / ‘H2’ Passes & Pass in GP / K&I by Ethnic Group ..………………………………………………………………………. 52
34 Percentage of P1 Cohort admitted to Post-Secondary Education Institutions by Ethnic Group ..…………………………………………………………………… 53
APPENDICES
Milestones in the Education System ……………………………….……………… 56
Classification of Courses in Universities, Polytechnics, LASALLE, NAFA and ITE …………………………………………………………………...……………….. 59

PREFACE
The purpose of the Education Statistics Digest, is to provide basic statistical information on education in Singapore. The statistical information includes data on schools, enrolment, teachers, educational outcomes and finances. The statistics presented here are divided into three sections. The first section contains the statistics on primary, secondary and pre-university education for 2011. The second section covers the Institute of Technical Education (ITE), LASALLE College of the Arts, Nanyang Academy of Fine Arts (NAFA), polytechnics and universities. To give the reader a historical perspective of the developments in education over the years as well as the trend, time series on major education indicators are provided in the third section. MANAGEMENT INFORMATION AND RESEARCH BRANCH PLANNING DIVISION MINISTRY OF EDUCATION SINGAPORE AUGUST 2012
iii

POSTSECONDARY
3-4 years 20-23 years old
13-16 years old 4-5 yearsTERTIARY
PRIMARY7-12 years old 6 years
1-3 years 17-19 years old
SECONDARYPRIMARY
SECONDARY
POST SECONDARY
WORK
1-6 years
17-22 years old
7-12 years old
6 years13-16 years old
4-5 years
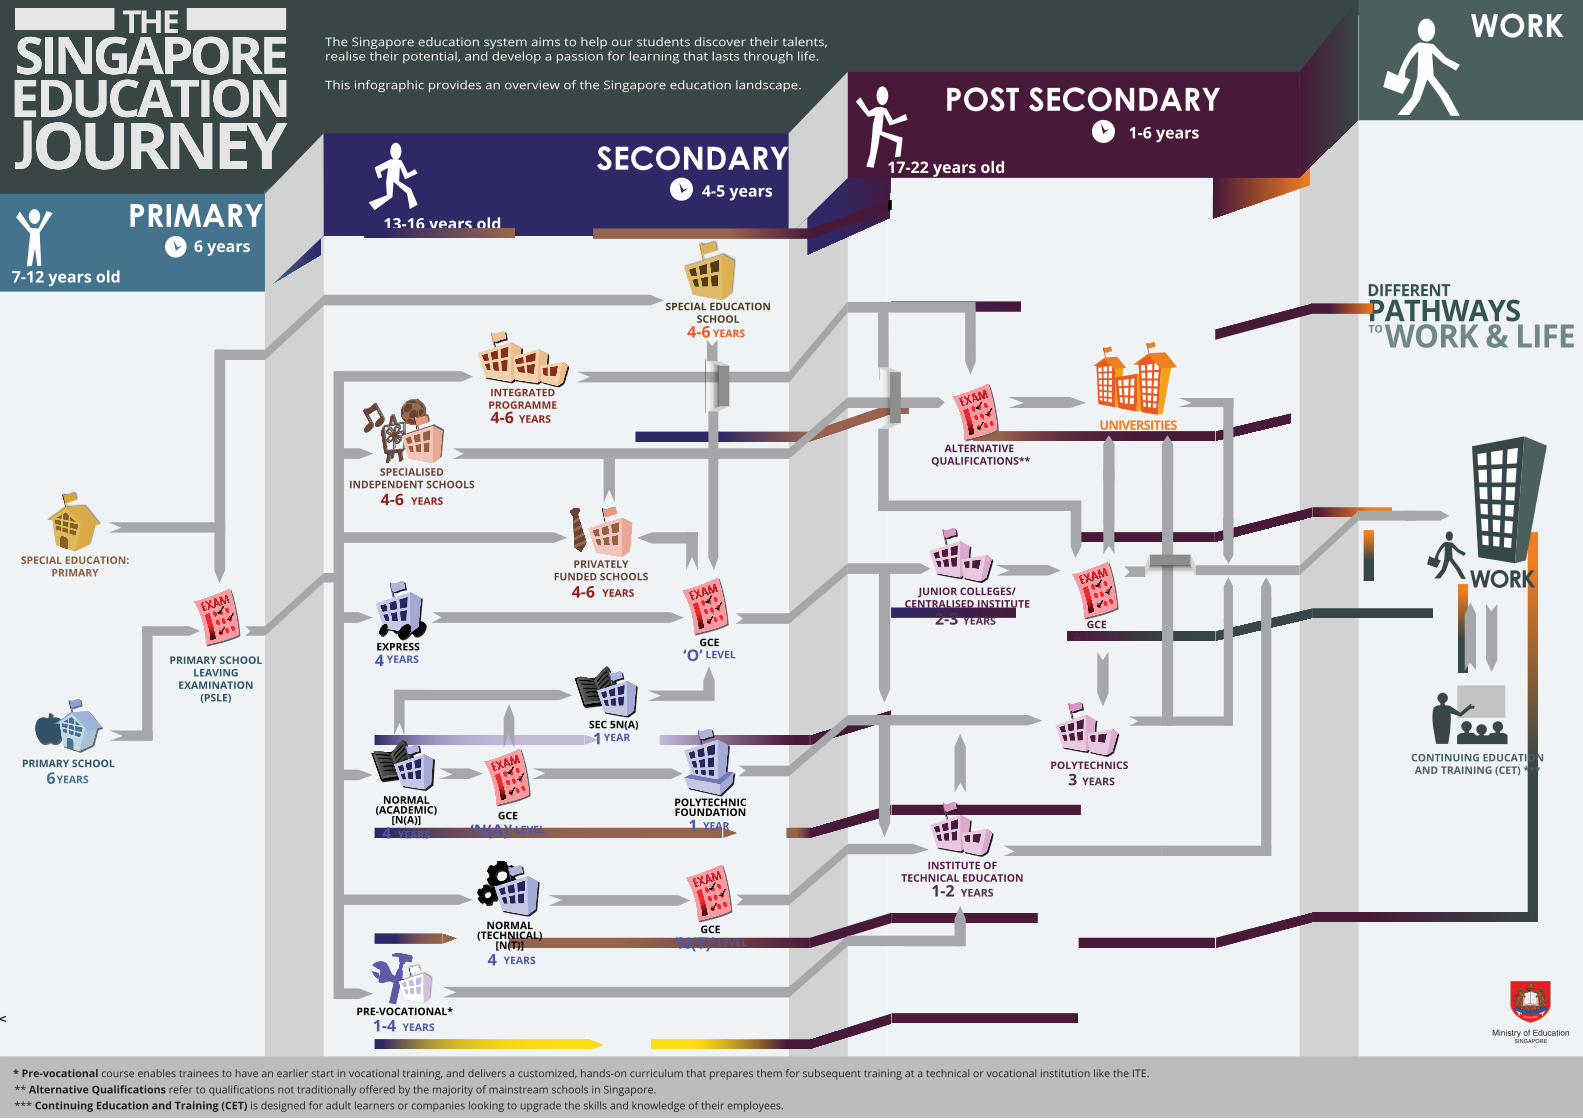
The Singapore education system aims to help our students discover their talents, realise their potential, and develop a passion for learning that lasts through life.
This infographic provides an overview of the Singapore education landscape.
A
DIFFERENTPATHWAYSTOWORK & LIFE
** Alternative Qualifications refer to qualifications not traditionally offered by the majority of mainstream schools in Singapore.*** Continuing Education and Training (CET) is designed for adult learners or companies looking to upgrade the skills and knowledge of their employees.
* Pre-vocational course enables trainees to have an earlier start in vocational training, and delivers a customized, hands-on curriculum that prepares them for subsequent training at a technical or vocational institution like the ITE.
JUNIOR COLLEGES GCE‘A’ LEVELS
GCE
GCE‘N(A)’ LEVEL
GCE‘O’ LEVEL
EMPLOYMENT
UNIVERSITY
ALTERNATIVE QUALIFICATIONS
ALTERNATIVE QUALIFICATIONS
INTEGRATEDPROGRAMME4-6 YEARS
EXPRESS4 YEARS
NORMAL (ACADEMIC)
[N(A)]4 YEARS
SEC 5N(A)1YEAR
POLYTECHNICFOUNDATION
1YEAR
NORMAL(TECHNICAL)
[N(T)]4 YEARS
‘N(T)’ LEVEL
2-3 YEARS
PRIVATELYFUNDED SCHOOLS
4-6 YEARS
POLYTECHNICS3 YEARS
INSTITUTE OFTECHNICAL EDUCATION
1-2 YEARS
PRIVATELYFUNDED SCHOOLS
4-6 YEARS
SPECIALISEDCOURSES
4-6 YEARS
SPECIAL EDUCATIONSCHOOL
4-6 YEARS
PRE-VOCATIONAL1-4 YEARS
UNIVERSITIES
EXPRESS4 YEARS
4
SEC 5N(A)1YEAR
POLYTECHNICFOUNDATION
YEAR1
NORMAL(TECHNICAL)
[N(T)]4 YEARS
2-3 YEARS
JUNIOR COLLEGES/CENTRALISED INSTITUTE
POLYTECHNICS3 YEARS
INSTITUTE OFTECHNICAL EDUCATION
1-2 YEARS
SPECIAL EDUCATIONSCHOOL
4-6 YEARS
PRE-VOCATIONAL*1-4 YEARS
WORKPRIVATELY
FUNDED SCHOOLS4-6 YEARS
NORMAL (ACADEMIC)
[N(A)]YEARS
INTEGRATEDPROGRAMME4-6 YEARS
CONTINUING EDUCATION AND TRAINING (CET) ***PRIMARY SCHOOL
SPECIAL EDUCATION:PRIMARY
6YEARS
PRIMARY SCHOOL LEAVING
EXAMINATION(PSLE)
ALTERNATIVE QUALIFICATIONS**
GCE‘A’ LEVELS
‘N(T)’ LEVELGCE
GCE‘N(A)’ LEVEL
SPECIALISEDINDEPENDENT SCHOOLS
4-6 YEARS
GCE‘O’ LEVEL
v


OVERVIEW OF THE EDUCATION SYSTEM
Singapore's education system aims to nurture every child and help all students discover their talents, realise their full potential, and develop a passion for life-long learning. We want to nurture in our young the willingness to think in new ways, solve problems and create new opportunities for the future. Equally important, we want to help our young acquire sound values and develop the strength of character to deal with future challenges. National Education aims to foster strong bonds among students and develop in them a deep sense of belonging and commitment to family, community and country.
Thinking Schools, Learning Nation (TSLN)—adopted in 1997 as our vision in
education—describes a nation of thinking and committed citizens, and an education system capable of meeting the challenges of the 21st century. Since 2003, we have also focused on nurturing a spirit of Innovation and Enterprise (I&E) among our students and staff. Teach Less, Learn More (TLLM), a call made by PM Lee Hsien Loong in his inaugural National Day Rally speech in 2004, was a call for our schools and teachers to teach better, improve the quality of interaction between teachers and students, and equip students with the knowledge, skills and values that prepare them for life. Teaching will be focused on developing understanding, critical thinking and the ability to ask questions and seek solutions.
A cornerstone of Singapore’s education system is the bilingual policy which allows each child to learn English and his Mother Tongue to the best of his abilities. Being proficient in English allows them to plug into a globalised world. Being proficient in MTL provides a link to their heritage and Asian roots, and provides them with a competitive edge with the rise of China and India, and integration of ASEAN.
There are opportunities for every child in Singapore to undergo at least ten years
of general education. The school system features a national curriculum, with national examinations at the end of the primary, secondary and junior college years. In recent years, we have also moved towards a more flexible and diverse education system, aimed at providing students with greater flexibility and choice. Upon completion of their primary education, students can choose from a range of education institutions and programmes that cater to different strengths and interests. To allow a greater range of student achievements and talents to be recognised, selected secondary schools, junior colleges, polytechnics and universities have the flexibility to admit a percentage of their intake using school-based criteria in the direct or discretionary admission exercises. PRIMARY EDUCATION
At the primary level, students go through a six-year course aimed at giving students a good grasp of English, Mother Tongue and Mathematics. In addition, students will learn Science, Social Studies, Civics & Moral Education, Music, Art & Crafts, Health Education and Physical Education. They are also encouraged to participate in Co-Curricular Activities (CCAs) and Community Involvement Programme (CIP).
Starting from the 2008 Primary 5 cohort, primary schools have introduced Subject-based Banding to replace the EM3 stream. With Subject-based Banding, students can offer a mix of Standard or Foundation subjects depending on their aptitude in each subject. Previously, at Primary 5 and Primary 6, students in the EM3 stream offer all
vii

academic subjects at the Foundation level, while students in the merged stream1 offer all academic subjects at the Standard level. At the end of Primary 6, students take the Primary School Leaving Examination (PSLE), which assesses their suitability for secondary education and places them in the appropriate secondary school course that will match their learning pace, ability and inclinations. SECONDARY EDUCATION At the secondary level, students undergo one of three courses designed to match their learning abilities and interests: • Express Course2. This is a four-year course leading to the Singapore-Cambridge
General Certificate of Education (GCE) ‘O’ Level Examination. In this course, students learn English and Mother Tongue3, as well as Mathematics, the Sciences and the Humanities.
• Normal (Academic) Course. This is a four-year course leading to the GCE ‘N’ Level Examination. Students who do well at the ‘N’ levels will qualify for an additional year to prepare for the GCE ‘O’ Level Examination, or progress to Higher Nitec courses at the ITE (starting from 2007). Selected students may offer ‘O’ level subjects at Secondary 4, or, bypass the ‘N’ levels and progress directly to Secondary 5 to take the ‘O’ levels. In the Normal (Academic) course, students learn a range of subjects similar to those in the Express courses. Starting from 2013, students who do very well at the ‘N’ levels will have two new “through-train” pathways to the polytechnics: (i) a new one-year Polytechnic Foundation Programme (PFP) and (ii) a two-year Higher Nitec pathway. The latter builds on the existing ITE Direct Entry Scheme (DES).
• Normal (Technical) Course. This is a four-year course leading to the GCE ‘N’ Level
Examination. In this course, students learn English, Mother Tongue, Mathematics and subjects with technical or practical emphases. Since 2005, schools have also been offering Elective Modules, which cover a wide range of subjects including nursing, hospitality, digital animation and precision engineering. To enhance experiential and practice-oriented learning, a revised Normal (Technical) curriculum has been implemented in all schools from 2007.
Since 2006, secondary schools have also been offering Advanced Elective Modules in collaboration with polytechnics, to allow students to experience and benefit from practice-oriented learning in fields as diverse as digital media and entrepreneurship. Upper secondary students in participating schools are eligible to offer these modules. SPECIALISED SCHOOLS To better cater to students who can benefit from a more customised and vocational curriculum, NorthLight School was established. The school, which began operation in 2007, offers a 3 or 4-year enhanced vocational programme. Graduates of the 1 From 2004, the distinction between the EM1 and EM2 streams was removed, and schools were given the autonomy to band their pupils by ability, in ways that add the most educational value. 2 Starting from the Secondary 1 students in 2008, the Special and Express Courses will be merged into the “Express Course”. 3 Students can opt to study Mother Tongue at either the standard, higher or Syllabus B levels depending on their ability and eligibility.
viii
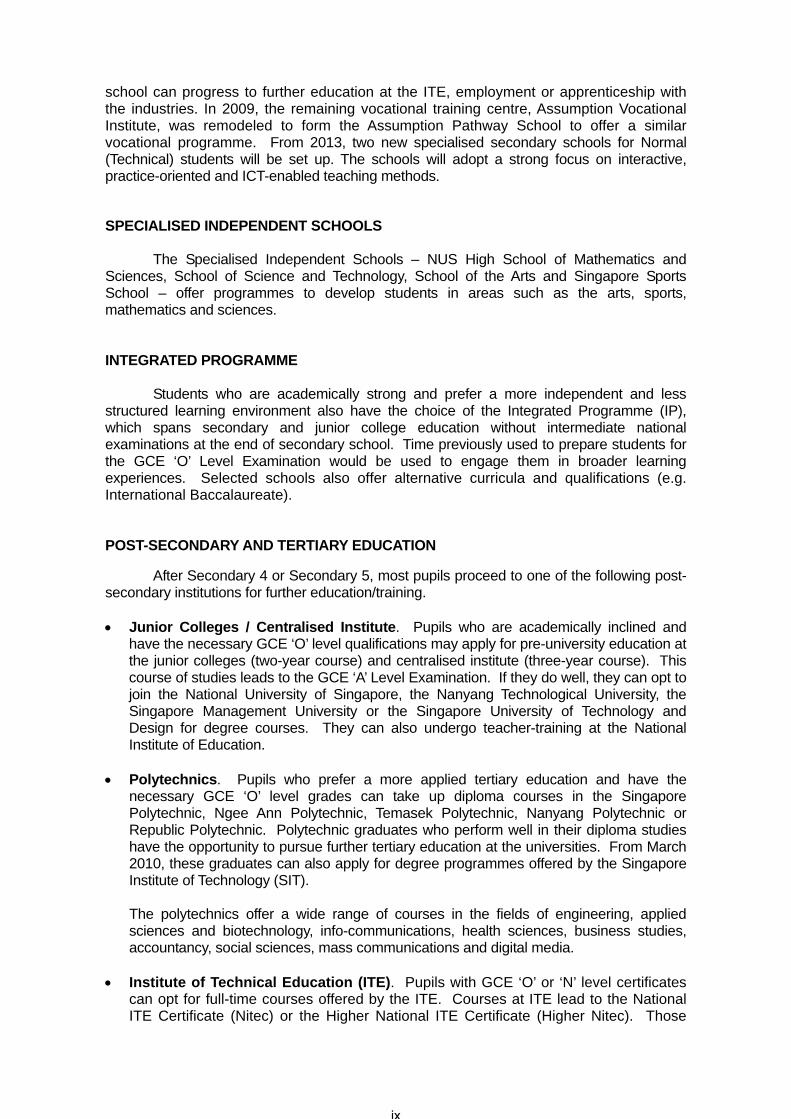
school can progress to further education at the ITE, employment or apprenticeship with the industries. In 2009, the remaining vocational training centre, Assumption Vocational Institute, was remodeled to form the Assumption Pathway School to offer a similar vocational programme. From 2013, two new specialised secondary schools for Normal (Technical) students will be set up. The schools will adopt a strong focus on interactive, practice-oriented and ICT-enabled teaching methods.
SPECIALISED INDEPENDENT SCHOOLS The Specialised Independent Schools – NUS High School of Mathematics and Sciences, School of Science and Technology, School of the Arts and Singapore Sports School – offer programmes to develop students in areas such as the arts, sports, mathematics and sciences. INTEGRATED PROGRAMME
Students who are academically strong and prefer a more independent and less structured learning environment also have the choice of the Integrated Programme (IP), which spans secondary and junior college education without intermediate national examinations at the end of secondary school. Time previously used to prepare students for the GCE ‘O’ Level Examination would be used to engage them in broader learning experiences. Selected schools also offer alternative curricula and qualifications (e.g. International Baccalaureate). POST-SECONDARY AND TERTIARY EDUCATION After Secondary 4 or Secondary 5, most pupils proceed to one of the following post-secondary institutions for further education/training. • Junior Colleges / Centralised Institute. Pupils who are academically inclined and
have the necessary GCE ‘O’ level qualifications may apply for pre-university education at the junior colleges (two-year course) and centralised institute (three-year course). This course of studies leads to the GCE ‘A’ Level Examination. If they do well, they can opt to join the National University of Singapore, the Nanyang Technological University, the Singapore Management University or the Singapore University of Technology and Design for degree courses. They can also undergo teacher-training at the National Institute of Education.
• Polytechnics. Pupils who prefer a more applied tertiary education and have the
necessary GCE ‘O’ level grades can take up diploma courses in the Singapore Polytechnic, Ngee Ann Polytechnic, Temasek Polytechnic, Nanyang Polytechnic or Republic Polytechnic. Polytechnic graduates who perform well in their diploma studies have the opportunity to pursue further tertiary education at the universities. From March 2010, these graduates can also apply for degree programmes offered by the Singapore Institute of Technology (SIT).
The polytechnics offer a wide range of courses in the fields of engineering, applied
sciences and biotechnology, info-communications, health sciences, business studies, accountancy, social sciences, mass communications and digital media.
• Institute of Technical Education (ITE). Pupils with GCE ‘O’ or ‘N’ level certificates
can opt for full-time courses offered by the ITE. Courses at ITE lead to the National ITE Certificate (Nitec) or the Higher National ITE Certificate (Higher Nitec). Those
ix

who do well in these courses can proceed to the polytechnics to pursue diploma studies. Apart from full-time institutional training, students can also acquire skills certification through traineeship programmes conducted jointly by companies and ITE.
• Arts Institutions. Pupils interested in the creative arts can choose to enrol in the
LASALLE College of the Arts or the Nanyang Academy of Fine Arts (NAFA) which offer diploma programmes in visual and performing arts such as music, theatre, dance, interior design and fashion design. Funded degree programmes at LASALLE and NAFA are also available since 2011.
Singapore Institute of Technology (SIT)
The Singapore Institute of Technology has commenced offering of degree programmes from AY2010. These are offered together with reputable overseas universities in areas such as Applied Sciences and Engineering, Digital Media, Hospitality, Health Sciences and Design.
SIT will become another “peak of excellence” in the increasingly diverse higher
education landscape. With the five polytechnics as its strategic partners, SIT programmes will build on the training that our polytechnic graduates receive today, and will be mostly conducted in the polytechnic campuses. It welcomes not only fresh polytechnic graduates, but also values those with some working experience as it brings a fresh perspective to the classroom. Universities Singapore’s university education aspires to prepare students not only for today’s economy but also for a future one where there will be jobs that have yet to be invented and challenges not yet foreseen. Today, there are four publicly-funded universities in our higher education landscape. • The National University of Singapore (NUS) is a research-intensive, comprehensive
university with 14 faculties and schools. Both undergraduate and graduate programmes are offered at the Faculty of Arts and Social Sciences, NUS Business School, School of Computing, Faculty of Dentistry, School of Design and Environment, Faculty of Engineering, Faculty of Law, Yong Loo Lin School of Medicine, Yong Siew Toh Conservatory of Music and Faculty of Science. More graduate programmes are provided through the NUS Graduate School for Integrative Sciences and Engineering and the Lee Kuan Yew School of Public Policy, and the Duke-NUS Graduate Medical School offers a graduate entry model programme for students to obtain the Doctor of Medicine (MD) degree. Finally, the University Scholars Programme offers an inter-disciplinary academic experience for undergraduates.
NUS also has many collaborative university partners that help to enrich the student’s educational experience and student life – offering dual degree or joint programmes, research opportunities and student exchange programmes.
• Nanyang Technological University (NTU) is a comprehensive research-intensive
university organised into four Colleges, with Engineering as one of its key strengths. It is organised into four Colleges and four Autonomous Institutes (AIs). Schools under the four Colleges offer undergraduate and postgraduate programmes including Chemical and Biomedical Engineering, Civil and Environmental Engineering, Computer Engineering, Electrical and Electronic Engineering, Materials Science and Engineering, Mechanical and Aerospace Engineering, Business, Biological Sciences, Physical and Mathematical Sciences, Art, Design and Media, Humanities and Social Sciences, and
x

Communication and Information. The four AIs are the Earth Observatory of Singapore, National Institute of Education, S. Rajaratnam School of International Studies and Singapore Centre on Environmental Life Sciences Engineering. The National Institute of Education (NIE) conducts professional training for teachers while the the S Rajaratnam School of International Studies (RSIS) offers postgraduate degrees in international and strategic studies. NTU is collaborating with Imperial College London to establish the Lee Kong Chian School of Medicine. The medical school is expected to admit its first batch of students in AY2013.
NTU has many collaborations with overseas institutions such as the Massachusetts Institute of Technology and Imperial College London, offering dual degree or joint programmes, research opportunities and student exchange programmes.
• Singapore Management University (SMU) is styled after an American university and
has Business and Social Sciences programmes at its core. It has six schools—the School of Accountancy, the School of Business, the School of Economics, the School of Social Sciences, the School of Information Systems and the School of Law. In addition to offering single degree programmes with a second major, SMU also allows its undergraduates to combine a double degree from any of its six schools.
SMU offers undergraduate and post-graduate programmes in Business and Management-related areas, ranging from Professional Accounting, Economics, Finance, Wealth Management, and Information Systems. SMU also hosts a wide range of research activities focusing on the social sciences including Research Institutes such as the Behavioural Sciences Institute.
• Singapore University of Technology & Design (SUTD) is the youngest player on the
higher education landscape, and is established in collaboration with the Massachusetts Institute of Technology and Zhejiang University. SUTD will matriculate its first cohort of undergraduates in AY2012 and offer undergraduate programmes in the following four areas - Architecture and Sustainable Design, Engineering Product Development, Engineering Systems and Design, and Information Systems Technology and Design. The university will also house an International Design Centre (IDC) that will conduct world-class research on technologically intensive design. The IDC has identified three Design Grand Challenges, that of Sustainable Built Environment, Design with the Developing World and ICT-enabled Devices for Better Living. IDC faculty, staff and students will work together to design devices, systems and services that address strategic needs of Singapore, the region and the global community.
CONTINUING EDUCATION AND TRAINING IN POST-SECONDARY AND TERTIARY INSTITUTIONS
The post-secondary and tertiary institutions offer courses that provide working adults opportunities for continuing education and training (CET), so that they can keep their skills and knowledge abreast with the rapid shifts in the economic landscape.
The polytechnics and ITE offer part-time diplomas and Nitec / Higher Nitec courses respectively. These programmes are equivalents of full-time qualifications, but are designed to be modularised, more compact, and for part-time study, so as to be more flexible and accessible for adult learners. The courses offered cover fields such as Engineering, Energy, Chemical Processes, Electronics, Construction, Aerospace, Marine and Offshore, Logistics, Business, Security, Infocomm Technology and Digital Media, Early Childhood Education, Retail and Tourism.
xi
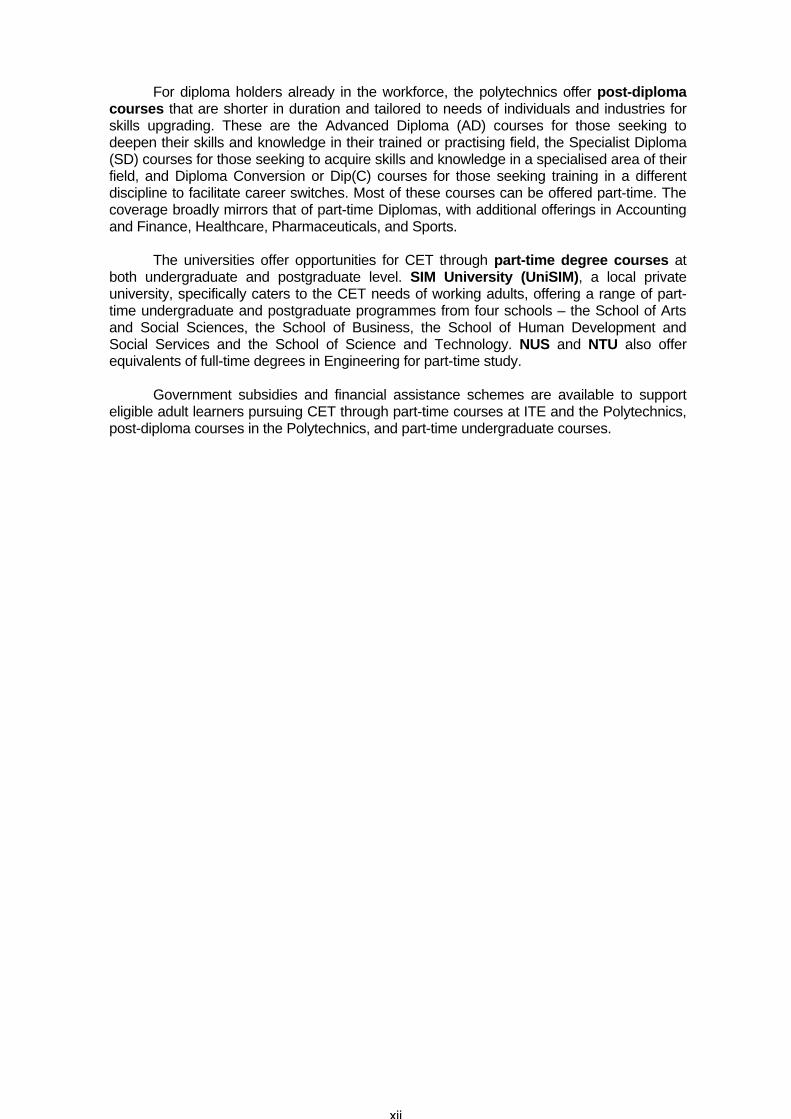
For diploma holders already in the workforce, the polytechnics offer post-diploma courses that are shorter in duration and tailored to needs of individuals and industries for skills upgrading. These are the Advanced Diploma (AD) courses for those seeking to deepen their skills and knowledge in their trained or practising field, the Specialist Diploma (SD) courses for those seeking to acquire skills and knowledge in a specialised area of their field, and Diploma Conversion or Dip(C) courses for those seeking training in a different discipline to facilitate career switches. Most of these courses can be offered part-time. The coverage broadly mirrors that of part-time Diplomas, with additional offerings in Accounting and Finance, Healthcare, Pharmaceuticals, and Sports.
The universities offer opportunities for CET through part-time degree courses at both undergraduate and postgraduate level. SIM University (UniSIM), a local private university, specifically caters to the CET needs of working adults, offering a range of part-time undergraduate and postgraduate programmes from four schools – the School of Arts and Social Sciences, the School of Business, the School of Human Development and Social Services and the School of Science and Technology. NUS and NTU also offer equivalents of full-time degrees in Engineering for part-time study.
Government subsidies and financial assistance schemes are available to support
eligible adult learners pursuing CET through part-time courses at ITE and the Polytechnics, post-diploma courses in the Polytechnics, and part-time undergraduate courses.
xii

KEY EDUCATIONAL INDICATORS
Notes:
1. The P1 cohorts represented in each year are different across the indicators, as
different cohorts reach the target levels in each year. Figures are preliminary.
2. Figure for 2006 is for at least 3 ‘A’ Level passes including GP.
3. Students who enrol in one type of institution may later progress to another, and will
hence be counted under both rows.
4. Include students and teachers in Government, Govt-Aided, Independent, Specialised
Independent, Specialised schools.
Percentage of P1 cohort1 who 2006 2007 2008 2009 2010 2011
Sat for
PSLE and passed 98.3 98.2 97.9 98.1 98.0 98.2
GCE ‘N’ or ‘O’ Level Examinations and
had at least 5 ‘N’ level passes or 3 ‘O’
level passes
86.8 86.8 86.9 87.6 87.9 88.9
GCE ‘A’ Level Examinations and had at
least 3 H2 passes and a pass in GP or
KI2
25.2 25.0 25.5 25.6 26.0 25.9
Admitted into3
Institute of Technical Education 21.9 20.9 20.9 21.2 21.2 22.0
Polytechnics 40.0 42.2 43.4 43.4 43.9 44.4
Junior Colleges / Centralised
Institutes 28.2 28.5 28.0 27.8 27.5 27.0
Universities (NUS, NTU, SMU, SIT) 25.7 25.6 25.5 25.4 25.4 26.0
Ratio of Students to Teaching Staff
Primary 22.6 22.1 21.4 19.6 19.3 18.6
Secondary4 18.4 18.3 17.9 16.4 16.1 14.8
xiii


PRIMARY, SECONDARY AND PRE-UNIVERSITY
EDUCATION, 2011

Type of School
Total
Government
Govt-Aided
IndependentSpecialised IndependentSpecialised
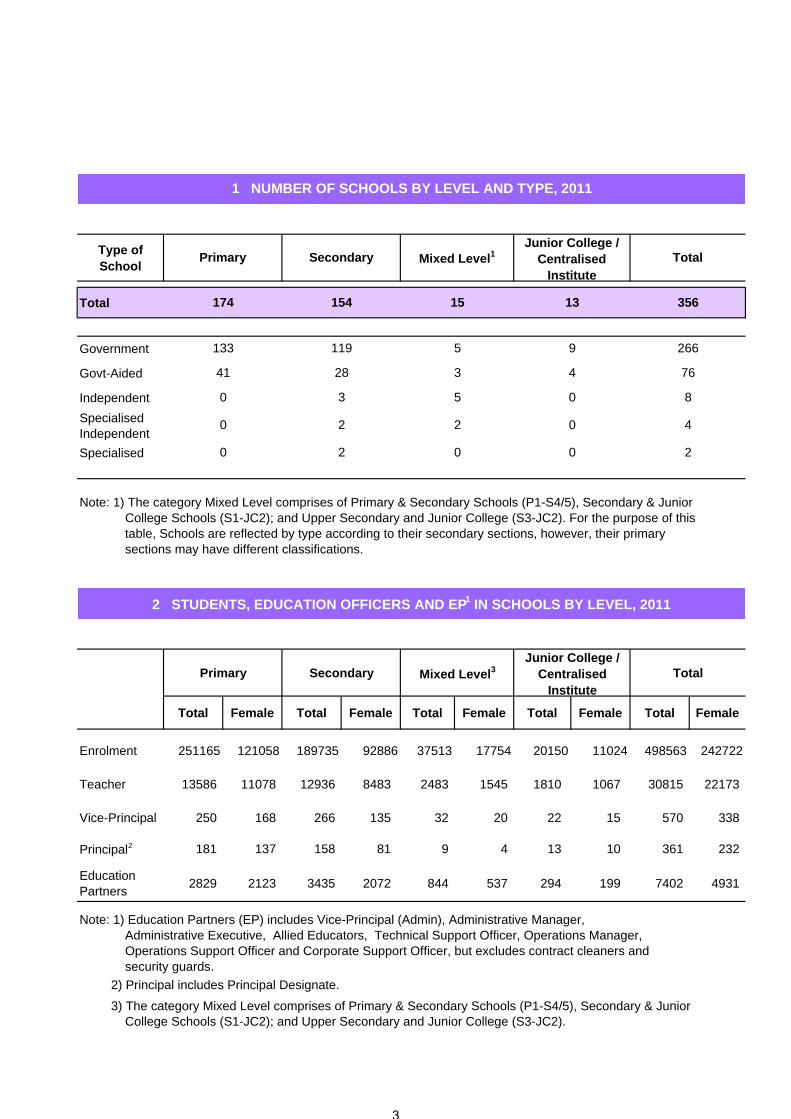
Note: 1) The category Mixed Level comprises of Primary & Secondary Schools (P1-S4/5), Secondary & Junior College Schools (S1-JC2); and Upper Secondary and Junior College (S3-JC2). For the purpose of this table, Schools are reflected by type according to their secondary sections, however, their primary sections may have different classifications.
Primary Secondary Mixed Level3Junior College /
Centralised Institute
Total
Total Female Total Female Total Female Total Female Total Female
Enrolment 251165 121058 189735 92886 37513 17754 20150 11024 498563 242722
Teacher 13586 11078 12936 8483 2483 1545 1810 1067 30815 22173
Vice-Principal 250 168 266 135 32 20 22 15 570 338
Principal2 181 137 158 81 9 4 13 10 361 232
Education Partners 2829 2123 3435 2072 844 537 294 199 7402 4931
Note: 1) Education Partners (EP) includes Vice-Principal (Admin), Administrative Manager, Administrative Executive, Allied Educators, Technical Support Officer, Operations Manager, Operations Support Officer and Corporate Support Officer, but excludes contract cleaners and security guards. 2) Principal includes Principal Designate.
3) The category Mixed Level comprises of Primary & Secondary Schools (P1-S4/5), Secondary & Junior College Schools (S1-JC2); and Upper Secondary and Junior College (S3-JC2).
2
174 154 15 13 356
266
76
8
4
0
9
4
0
0
0
5
3
5
20
0
119
28
3
2
2
1 NUMBER OF SCHOOLS BY LEVEL AND TYPE, 2011
133
41
2 STUDENTS, EDUCATION OFFICERS AND EP1 IN SCHOOLS BY LEVEL, 2011
Primary Secondary Mixed Level1Junior College /
Centralised Institute
Total
0
3

QualificationTeacher Vice-Principal Principal All
Total Female Total Female Total Female Total Female
Graduate 24955 17453 551 326 349 221 25855 18000
Non-grad 5860 4720 19 12 12 11 5891 4743
Graduate 8959 7304 238 162 169 126 9366 7592
Non-grad 4944 4048 18 12 12 11 4974 4071
Graduate 6274 5059 176 117 129 98 6579 5274
Non-grad 3662 2952 12 7 10 10 3684 2969
Graduate 2685 2245 62 45 40 28 2787 2318
Non-grad 1282 1096 6 5 2 1 1290 1102
Graduate 13137 8504 280 145 160 82 13577 8731
Non-grad 906 669 1 0 0 0 907 669
Graduate 9206 5924 200 94 122 62 9528 6080
Non-grad 653 505 0 0 0 0 653 505
Graduate 2551 1702 55 34 32 16 2638 1752
Non-grad 165 134 1 0 0 0 166 134
Independent Graduate 1049 693 23 16 6 4 1078 713
Non-grad 15 8 0 0 0 0 15 8
Graduate 252 148 1 0 0 0 253 148
Govt-Aided
Specialised
Government
Govt-Aided
Secondary
Government
3 SUMMARY STATISTICS ON EDUCATION OFFICERS, 2011
Level / Type
of School
Total
Primary
Graduate 252 148 1 0 0 0 253 148
Non-grad 7 5 0 0 0 0 7 5
Specialised Graduate 79 37 1 1 0 0 80 38
Non-grad 66 17 0 0 0 0 66 17
Graduate 2859 1645 33 19 20 13 2912 1677
Non-grad 10 3 0 0 0 0 10 3
Government Graduate 1725 1003 21 11 14 9 1760 1023
Non-grad 5 2 0 0 0 0 5 2
Graduate 614 354 7 5 4 3 625 362
Non-grad 2 1 0 0 0 0 2 1
Graduate 520 288 5 3 2 1 527 292
Non-grad 3 0 0 0 0 0 3 0
Note: 1) The above excludes 916 (Female 622) officers in HQ, 988 (Females 883) on various leave,
285 (Females 185) on secondment to other institutions and 281 (Females 222) studying at NIE.
2) Officers in Mixed Level schools are classified based on their teaching subjects in the schools.
Govt-Aided
Independent
Specialised
Independent
Junior College /
Centralised
Institute
4

Level Enrolment No. of Classes Average Class
Size
Total 498563 14659 34.0
Primary 258293 7522 34.3
Pri 1 39295 1324 29.7
Pri 2 39492 1337 29.5
Pri 3 42542 1134 37.5
Pri 4 43165 1161 37.2
Pri 5 48281 1301 37.1
Pri 6 45518 1265 36.0
Secondary 207974 5734 36.3
Sec 1 45213 1227 36.8
Sec 2 49356 1321 37.4
Sec 3 52961 1455 36.4
Sec 4 51263 1447 35.4
Sec 5 9181 284 32.3
Junior College / Centralised
Institute32296 1403 23.0
JC 1 / PU 1 16746 700 23.9
JC 2 / PU 2 15203 691 22.0
PU 3 347 12 28.9
4 ENROLMENT, NUMBER OF CLASSES AND CLASS SIZE BY LEVEL, 2011
5

0
10000
20000
30000
40000
50000
60000
Pri 1 Pri 2 Pri 3 Pri 4 Pri 5 Pri 6
PRIMARY ENROLMENT BY LEVEL, 2011
PRIMARY ENROLMENT BY AGE, 2011
0
10000
20000
30000
40000
50000
60000
6 & Below 7 8 9 10 11 12 13 & Above
Male Female
6
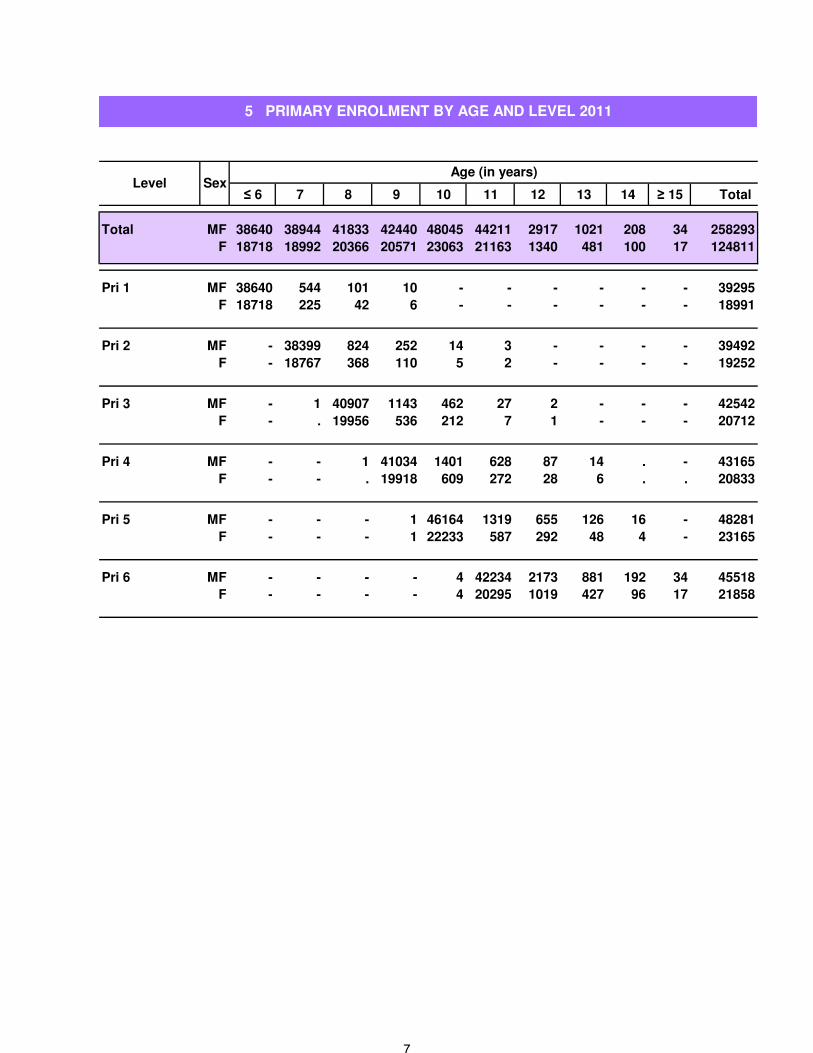
≤ 6 7 8 9 10 11 12 13 14 ≥ 15 Total
Total MF 38640 38944 41833 42440 48045 44211 2917 1021 208 34 258293
F 18718 18992 20366 20571 23063 21163 1340 481 100 17 124811
Pri 1 MF 38640 544 101 10 - - - - - - 39295
F 18718 225 42 6 - - - - - - 18991
Pri 2 MF - 38399 824 252 14 3 - - - - 39492
F - 18767 368 110 5 2 - - - - 19252
Pri 3 MF - 1 40907 1143 462 27 2 - - - 42542
F - . 19956 536 212 7 1 - - - 20712
Pri 4 MF - - 1 41034 1401 628 87 14 . - 43165
F - - . 19918 609 272 28 6 . . 20833
Pri 5 MF - - - 1 46164 1319 655 126 16 - 48281
F - - - 1 22233 587 292 48 4 - 23165
Pri 6 MF - - - - 4 42234 2173 881 192 34 45518
5 PRIMARY ENROLMENT BY AGE AND LEVEL 2011
Level SexAge (in years)
F - - - - 4 20295 1019 427 96 17 21858
7

0
10000
20000
30000
40000
50000
60000
Sec 1 Sec 2 Sec 3 Sec 4 Sec 5
SECONDARY ENROLMENT BY LEVEL AND COURSE, 2011
Express Normal(A) Normal(T)
SECONDARY ENROLMENT BY AGE, 2011
0
10000
20000
30000
40000
50000
60000
12 & Below 13 14 15 16 17 18 & Above
Age
SECONDARY ENROLMENT BY AGE, 2011
Male Female
8

≤ 11 12 13 14 15 16 17 18 19 ≥ 20 Total
MF 8 41321 47236 49819 50711 14681 3210 776 191 21 207974
F 5 20085 22823 24115 24477 6978 1433 344 80 6 100346
Secondary 1 MF 8 41314 2483 1069 276 62 1 - - - 45213
F 5 20083 1132 514 128 24 1 - - - 21887
Express MF 7 25778 1044 705 169 29 - - - - 27732
F 4 13266 528 354 79 9 - - - - 14240
Normal(A) MF 1 10519 597 237 66 16 - - - - 11436
F 1 5057 276 103 33 5 - - - - 5475
Normal(T) MF - 5017 842 127 41 17 1 - - - 6045
F - 1760 328 57 16 10 1 - - - 2172
Secondary 2 MF - 7 44740 2883 1314 349 60 3 - - 49356
F - 2 21685 1362 635 169 23 - - - 23876
Express MF - 7 28085 1177 757 183 17 - - - 30226
F - 2 14623 624 393 99 5 - - - 15746
Normal(A) MF - - 11555 834 373 97 23 - - - 12882
F - - 5361 402 168 43 10 - - - 5984
Normal(T) MF - - 5100 872 184 69 20 3 - - 6248
F - - 1701 336 74 27 8 . - - 2146
Secondary 3 MF - - 13 45855 4576 1990 428 86 13 - 52961
F - - 6 22229 2019 960 176 36 9 - 25435
Express MF - - 12 29079 2388 1158 205 26 1 - 32869
Total
6 SECONDARY ENROLMENT BY AGE, LEVEL AND COURSE, 2011
Level & Course SexAge (in years)
Express MF - - 12 29079 2388 1158 205 26 1 - 32869
F - - 5 15166 1165 627 91 15 - - 17069
Normal(A) MF - - 1 11421 1371 587 163 34 2 - 13579
F - - 1 5268 551 252 66 12 1 - 6151
Normal(T) MF - - - 5355 817 245 60 26 10 - 6513
F - - - 1795 303 81 19 9 8 - 2215
Secondary 4 MF - - - 12 44543 4456 1707 436 104 5 51263
F - - - 10 21694 2015 785 195 35 2 24736
Express MF - - - 12 28345 2363 1009 222 31 2 31984
F - - - 10 14914 1193 518 113 11 1 16760
Normal(A) MF - - - . 11146 1424 527 153 55 2 13307
F - - - . 5162 565 207 62 19 1 6016
Normal(T) MF - - - . 5052 669 171 61 18 1 5972
F - - - . 1618 257 60 20 5 . 1960
Secondary 5* MF - - - - 2 7824 1014 251 74 16 9181
F - - - - 1 3810 448 113 36 4 4412
* All Secondary 5 students are in the Normal (Academic) course.
9

0
2000
4000
6000
8000
10000
12000
14000
16000
18000
JC 1/ PU 1 JC 2 / PU2 PU 3
JUNIOR COLLEGE / CENTRALISED INSTITUTE ENROLMENT BY LEVEL,
2011
14000
16000
JUNIOR COLLEGE / CENTRALISED INSTITUTE ENROLMENT BY AGE,
2011
0
2000
4000
6000
8000
10000
12000
14000
16000
16 & Below 17 18 19 20 & Above
2011
Male Female
10
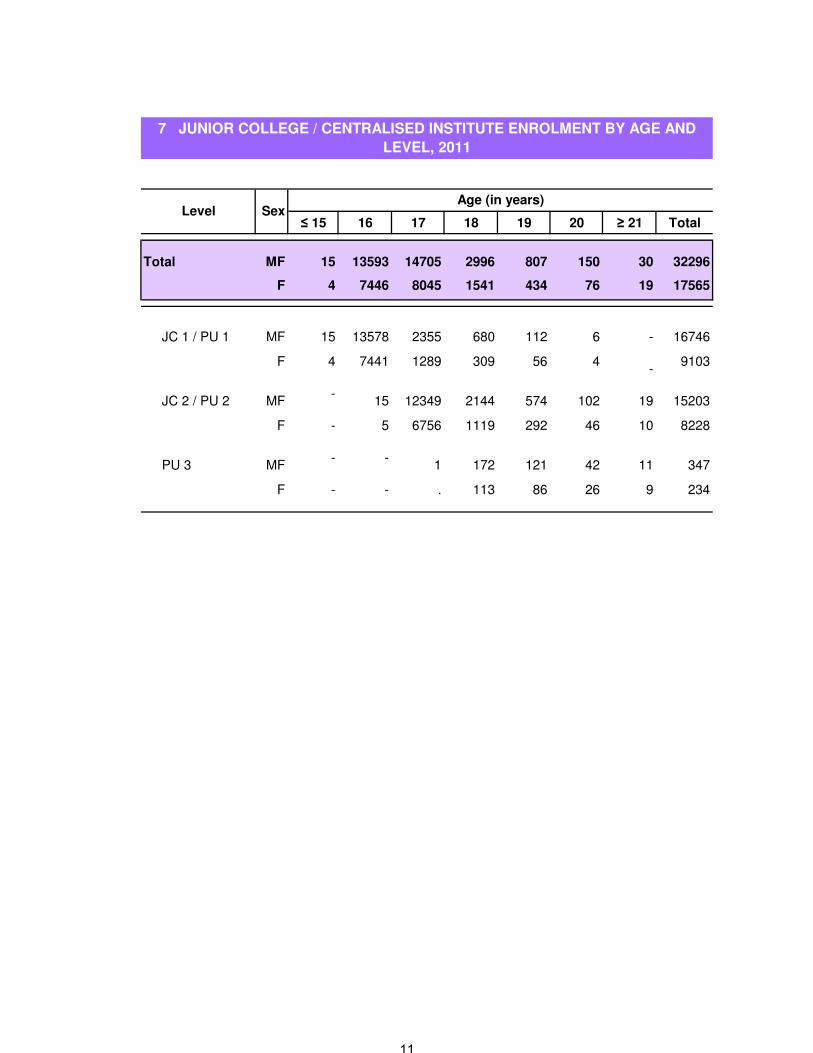
≤ 15 16 17 18 19 20 ≥ 21 Total
Total MF 15 13593 14705 2996 807 150 30 32296
F 4 7446 8045 1541 434 76 19 17565
JC 1 / PU 1 MF 15 13578 2355 680 112 6 - 16746
F 4 7441 1289 309 56 4-
9103
JC 2 / PU 2 MF-
15 12349 2144 574 102 19 15203
F - 5 6756 1119 292 46 10 8228
PU 3 MF- -
1 172 121 42 11 347
F - - . 113 86 26 9 234
7 JUNIOR COLLEGE / CENTRALISED INSTITUTE ENROLMENT BY AGE AND
LEVEL, 2011
Level SexAge (in years)
11

Electoral Constituency Primary Secondary Mixed Level1
Junior College /
Centralised
Institute
Total
Group Representation
Constituency
Aljunied 10 9 0 0 19
Ang Mo Kio 10 10 1 1 22
Bishan-Toa Payoh 7 8 2 0 17
Chua Chu Kang 13 9 0 1 23
East Coast 6 7 1 0 14
Holland-Bukit Timah 9 8 2 0 19
Jurong 7 10 0 1 18
Marine Parade 11 8 1 1 21
Moulmein-Kallang 7 5 2 1 15
Nee Soon 13 11 0 1 25
Pasir Ris-Punggol 17 12 0 1 30
Sembawang 12 11 0 1 24
Tampines 12 9 0 1 22
Tanjong Pagar 7 7 1 0 15
West Coast 7 10 3 1 21
Single-Seat Constituency
Bukit Panjang 1 0 0 0 1
Hong Kah North 4 3 0 1 8
Hougang 1 1 0 1 3
Joo Chiat 3 2 1 0 6
Mountbatten 2 5 1 0 8
Pioneer 1 1 0 0 2
Potong Pasir 3 2 0 1 6
Punggol East 2 1 0 0 3
Radin Mas 3 2 0 0 5
Sengkang West 3 2 0 0 5
Whampoa 1 0 0 0 1
Yuhua 2 1 0 0 3
Note : 1) The category Mixed-Level comprises of Primary & Secondary Schools (P1-S4/5), Secondary & Junior
Colleges (S1-JC2) and Upper Secondary and Junior College (S3-JC2).
8 NUMBER OF SCHOOLS BY LEVEL AND ELECTORAL CONSTITUENCY, 2011
12

Electoral Constituency Primary SecondaryJunior College /
Centralised InstituteTotal
Group Representation
Constituency
Aljunied 12896 11788 2103 26787
Ang Mo Kio 16785 13720 2127 32632
Bishan-Toa Payoh 10920 9405 2084 22409
Chua Chu Kang 22225 19856 2929 45010
East Coast 12471 10522 1899 24892
Holland-Bukit Timah 11111 7997 1771 20879
Jurong 14741 11602 1709 28052
Marine Parade 14802 11766 1989 28557
Moulmein-Kallang 7729 6124 1219 15072
Nee Soon 17790 13305 1640 32735
Pasir Ris-Punggol 23503 18511 2419 44433
Sembawang 22581 18378 1714 42673
Tampines 14281 13190 1543 29014
Tanjong Pagar 10755 7818 1380 19953
West Coast 12371 9097 1602 23070
Single-Seat Constituency
Bukit Panjang 3269 2985 379 6633
Hong Kah North 3491 2609 337 6437
Hougang 2494 2021 321 4836
Joo Chiat 2228 1997 720 4945
Mountbatten 2351 1817 526 4694
Pioneer 3236 2147 244 5627
Potong Pasir 1453 1115 233 2801
Punggol East 4258 3221 310 7789
Radin Mas 2183 1587 217 3987
Sengkang West 3819 1823 180 5822
Whampoa 1761 1404 332 3497
Yuhua 2177 1787 310 4274
32237 32237
9 ENROLMENT BY LEVEL AND ELECTORAL CONSTITUENCY, 2011
13

0
2000
4000
6000
8000
10000
12000
14000
Total Male Female
TEACHERS BY ACADEMIC QUALIFICATION, 2011
GCE 'O' GCE 'A' Pass Degree Honours Degree Postgraduate
2000
4000
6000
8000
10000
12000
TEACHERS BY LENGTH OF SERVICE, 2011
0-4 5-9 10-14 15-19 20-24 25-29 30 & Above
0
2000
4000
6000
Total Male Female
0
2000
4000
6000
8000
Total Male Female
TEACHERS BY AGE, 2011
24 & Below 25-29 30-34 35-39 40-44 45-49 50-54 55 & Above
14

Primary SecondaryJunior College /
Centralised InstituteTotal
Total Female Total Female Total Female Total Female
Total 13903 11352 14043 9173 2869 1648 30815 22173
Academic Qualification
GCE 'O' Level 561 485 125 80 1 0 687 565
GCE 'A' Level 4383 3563 781 589 9 3 5173 4155
Pass Degree 5664 4801 7004 4945 556 345 13224 10091
Honours Degree 2363 1796 4333 2519 1704 999 8400 5314
Masters Degree 925 703 1762 1017 561 286 3248 2006
Ph D 7 4 38 23 38 15 83 42
.
Length of Service
0 - 4 3808 2824 5131 3194 1024 580 9963 6598
5 - 9 4261 3508 3823 2502 795 454 8879 6464
10 - 14 2666 2191 2074 1253 396 190 5136 3634
10 TEACHERS' ACADEMIC QUALIFICATION, LENGTH OF SERVICE AND AGE BY LEVEL, 2011
10 - 14 2666 2191 2074 1253 396 190 5136 3634
15 - 19 1375 1191 1063 730 196 108 2634 2029
20 - 24 666 604 573 432 156 92 1395 1128
25 - 29 447 401 671 519 164 120 1282 1040
30 & Above 680 633 708 543 138 104 1526 1280
Age
24 & Below 493 469 573 556 50 47 1116 1072
25 - 29 2464 2036 3116 2336 712 473 6292 4845
30 - 34 3200 2566 3186 1946 762 409 7148 4921
35 - 39 2979 2346 2558 1447 470 226 6007 4019
40 - 44 2012 1630 1654 946 281 124 3947 2700
45 - 49 1062 865 1059 680 191 108 2312 1653
50 - 54 834 719 960 675 198 138 1992 1532
55 & Above 859 721 937 587 205 123 2001 1431
15

Primary Secondary Total
Total Female Total Female Total Female Total Female
Total 256 174 281 145 33 19 570 338
Academic Qualification
GCE 'A '/ 'O' Level 18 12 1 0 0 0 19 12
Pass Degree 103 74 81 47 5 5 189 126
Honours Degree 46 29 89 44 9 6 144 79
Masters Degree 89 59 106 52 19 8 214 119
Ph D 0 0 4 2 0 0 4 2
Length of Service
0 - 9 10 3 29 11 8 3 47 17
10 - 14 78 47 75 20 8 3 161 70
15 - 19 70 44 67 34 6 5 143 83
20 - 24 37 32 40 27 5 3 82 62
25 - 29 38 28 42 30 4 3 84 61
30 & Above 23 20 28 23 2 2 53 45
Age
29 & Below 0 0 0 0 0 0 0 0
30 - 34 6 4 11 5 6 3 23 12
35 - 39 75 44 72 25 9 6 156 75
40 - 44 73 45 77 36 7 3 157 84
45 - 49 48 39 45 27 5 2 98 68
50 - 54 45 35 54 36 4 3 103 74
55 & Above 9 7 22 16 2 2 33 25
11 VICE-PRINCIPALS' ACADEMIC QUALIFICATION, LENGTH OF SERVICE AND AGE BY LEVEL,
2011
Junior College /
Centralised Institute
16

Primary Secondary Junior College / Centralised Institute Total
Total Female Total Female Total Female Total Female
Total 181 137 160 82 20 13 361 231
Academic Qualification
GCE 'A' / 'O' Level 12 11 0 0 0 0 12 11
Pass Degree 61 48 36 21 2 0 99 69
Honours Degree 19 12 39 20 2 1 60 33
Masters Degree 88 65 84 41 15 12 187 118
Ph D 1 1 1 0 1 0 3 1
Length of Service
0 - 9 2 1 4 1 0 0 6 0
10 - 14 14 7 30 8 0 0 44 15
15 - 19 44 30 30 13 1 0 75 43
20 - 24 36 28 24 16 0 0 60 44
25 - 29 41 30 39 25 8 5 88 60
30 & Above 44 41 33 19 11 8 88 68
Age
29 & Below 0 0 0 0 0 0 0 0
30 - 34 0 0 0 0 0 0 0 0
35 - 39 13 9 23 9 0 0 36 18
40 - 44 51 36 37 14 1 0 89 50
45 - 49 32 25 25 15 2 2 59 42
50 - 54 57 41 49 32 8 4 114 77
55 & Above 28 26 26 12 9 7 63 45
1) Prinicpal includes Principal Designate.
12 PRINCIPALS' ACADEMIC QUALIFICATION, LENGTH OF SERVICE AND AGE BY LEVEL, 2011
17

Number Enrolment
Type of Institution of Full-Time Part-Time Total
Institutions Total Female Total Female Total Female
Total 524 78819 38422 0 0 78819 38422
Islamic Religious School 6 3883 2497 - - 3883 2497
Private Kindergarten 495 67466 33352 - - 67466 33352
Privately Funded School 3 1999 823 - - 1999 823
Special Education School 20 5471 1750 - - 5471 1750
Number Teaching Staff
Type of Institution of Full-Time Part-Time Total
Institutions Total Female Total Female Total Female
Total 524 5483 5155 31 26 5514 5181
Islamic Religious School 6 246 174 - - 246 174
Private Kindergarten 495 4138 4114 - - 4138 4114
Privately Funded School 3 171 91 25 21 196 112
Special Education School 20 928 776 6 5 934 781
Note : 1) The figures include only private education institutions registered with the Ministry of Education.
13 STATISTICS1 ON PRIVATE EDUCATION INSTITUTIONS, 2011
18

ITE, LASALLE, NAFA, POLYTECHNIC AND
UNIVERSITY EDUCATION, 2011

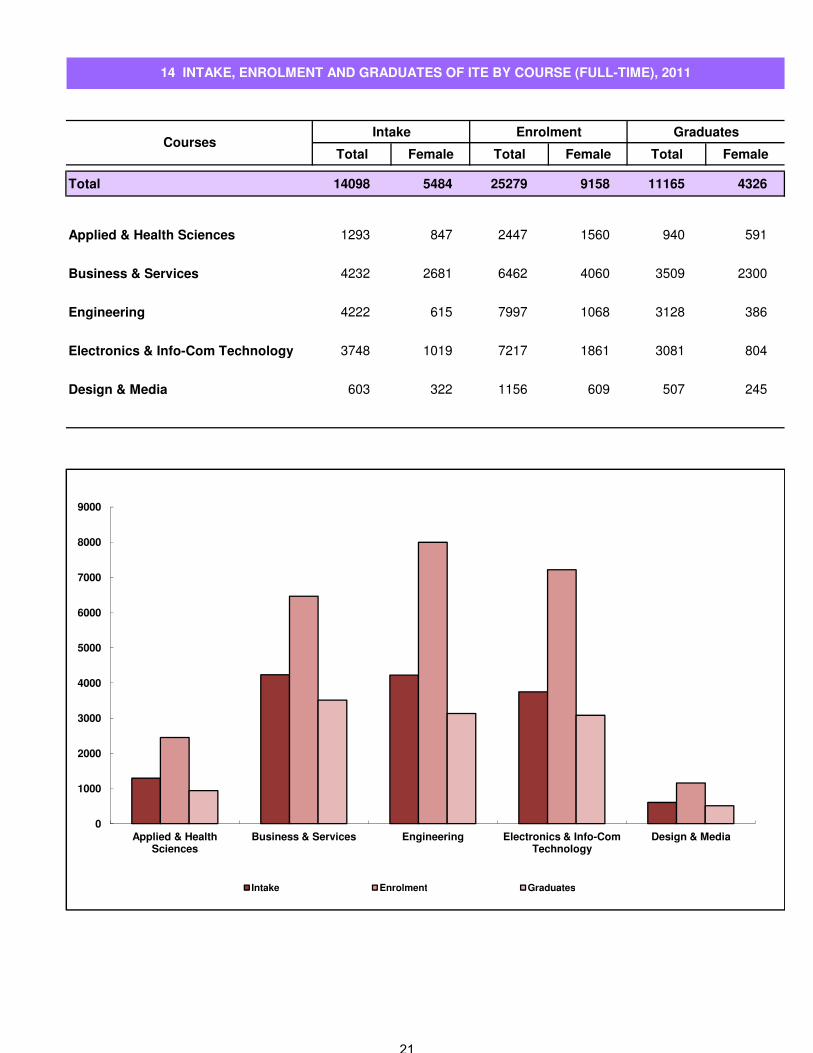
Intake Enrolment Graduates
Total Female Total Female Total Female
Total 14098 5484 25279 9158 11165 4326
Applied & Health Sciences 1293 847 2447 1560 940 591
Business & Services 4232 2681 6462 4060 3509 2300
Engineering 4222 615 7997 1068 3128 386
Electronics & Info-Com Technology 3748 1019 7217 1861 3081 804
Design & Media 603 322 1156 609 507 245
14 INTAKE, ENROLMENT AND GRADUATES OF ITE BY COURSE (FULL-TIME), 2011
Courses
8000
9000
0
1000
2000
3000
4000
5000
6000
7000
Applied & Health
Sciences
Business & Services Engineering Electronics & Info-Com
Technology
Design & Media
Intake Enrolment Graduates
21
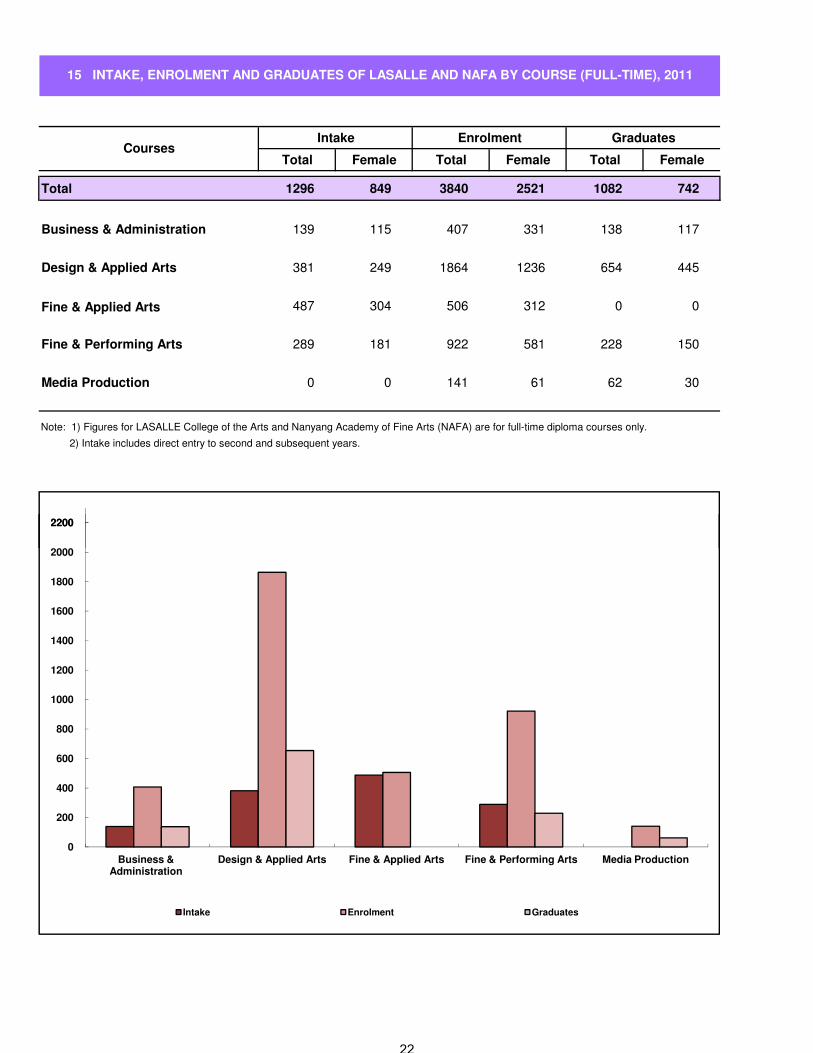
Intake Enrolment Graduates
Total Female Total Female Total Female
Total 1296 849 3840 2521 1082 742
Business & Administration 139 115 407 331 138 117
Design & Applied Arts 381 249 1864 1236 654 445
Fine & Applied Arts 487 304 506 312 0 0
Fine & Performing Arts 289 181 922 581 228 150
Media Production 0 0 141 61 62 30
Note: 1) Figures for LASALLE College of the Arts and Nanyang Academy of Fine Arts (NAFA) are for full-time diploma courses only.
2) Intake includes direct entry to second and subsequent years.
15 INTAKE, ENROLMENT AND GRADUATES OF LASALLE AND NAFA BY COURSE (FULL-TIME), 2011
Courses
2000
2200
0
200
400
600
800
1000
1200
1400
1600
1800
2000
2200
Business &
Administration
Design & Applied Arts Fine & Applied Arts Fine & Performing Arts Media Production
Intake Enrolment Graduates
22

Intake Enrolment Graduates
Total Female Total Female Total Female
Total 26737 12801 78443 37678 22918 11106
Applied Arts 1990 1130 5607 3104 1343 770
Architecture & Building 775 459 1880 1063 565 297
Business & Administration 5789 3510 17215 10571 5306 3271
Education 276 255 736 687 183 178
Engineering Sciences 7946 1837 23873 5550 7186 1814
Health Sciences 2537 1906 7747 5879 2158 1661
Humanities & Social Sciences 770 422 1952 1109 429 278
Information Technology 3942 1626 11689 4939 3732 1607
Legal Studies 141 77 404 235 95 53
Mass Communication & Information Science 587 418 1806 1283 511 348
Science & Related Technologies 1587 984 4620 2846 1178 732
Services 397 177 914 412 232 97
Note: 1) Intake, Enrolment and Graduate figures refer to diploma courses only.
2) Intake includes direct entry to second year.
16 INTAKE, ENROLMENT AND GRADUATES OF POLYTECHNICS BY COURSE (FULL-TIME), 2011
Courses
Intake Enrolment Graduates
23

Intake Enrolment Graduates
Total Female Total Female Total Female
Total 15530 7909 56349 28417 13325 7185
Accountancy 1100 618 3871 2244 839 507
Architecture & Building 475 315 1857 1163 368 247
Business & Administration 1637 910 5780 3237 1577 944
Dentistry 48 29 190 111 42 26
Education 397 293 1752 1301 406 303
Engineering Sciences 4251 1243 15519 4566 3891 1119
Fine & Applied Arts 434 193 1200 625 216 132
Health Sciences 347 264 1139 820 255 213
Humanities & Social Sciences 2453 1660 9689 6447 2480 1772
Information Technology 972 352 3505 1164 583 195
Law 364 172 1448 742 329 208
Mass Communication 174 135 673 490 174 133
Medicine 280 148 1328 647 255 119
Natural, Physical & Mathematical Sciences 2252 1335 7822 4482 1836 1217
Services 346 242 576 378 74 50
Note: 1) Intake, Enrolment and Graduates figures refer to 1st degree only.
17 INTAKE, ENROLMENT AND GRADUATES OF UNIVERSITIES BY COURSE (FULL-TIME), 2011
Courses
Note: 1) Intake, Enrolment and Graduates figures refer to 1st degree only.
2) Intake includes direct entry to second and subsequent years.
0
2000
4000
6000
8000
10000
12000
14000
16000
Intake Enrolment Graduates
24

STATISTICAL SERIES

NUMBER OF SCHOOLS BY LEVEL
Primary
80
100
120
140
160
180
200
Primary
Secondary
Secondary
0
20
40
60
80
2002 2003 2004 2005 2006 2007 2008 2009 2010 2011
Pre-University
Mixed Level
26

Spec Spec Junior College2
Indep Indep Govt Aided Indep
1960 165 248 413 27 21 - - - 48 1 31 - - 32 - - - - - 493
1970 198 190 388 68 17 - - - 85 - 30 - - 30 1 - - - 1 504
1980 199 114 313 84 23 - - - 107 - 23 - - 23 2 5 - - 7 (19) 450
1990 157 43 200 102 27 4 - - 133 - 7 2 - 9 9 5 - 4 18 (25) 360
2000 155 40 195 123 28 6 - - 157 - 4 2 - 6 10 5 - 2 17 375
2002 137 41 178 127 28 6 - - 161 - 3 2 - 5 10 5 - 2 17 361
2003 132 41 173 126 28 6 - - 160 - 3 2 - 5 11 5 - 2 18 356
2004 131 41 172 123 28 5 1 - 157 1 3 3 - 7 10 4 1 1 16 352
2005 132 41 173 123 28 4 1 - 156 4 3 4 1 12 8 4 1 1 14 355
2006 131 41 172 122 28 4 1 - 155 5 3 4 1 13 8 4 1 1 14 354
2007 129 41 170 120 28 4 1 1 154 5 3 4 1 13 8 4 1 1 14 351
Aided Indep TotalIndep Spec'd Total GovtCentralised
Institute3
Aided Total Govt Aided
18 NUMBER OF SCHOOLS BY LEVEL AND TYPE
Year
Primary Secondary Mixed Level1 Pre-University
Grand
TotalTotal4
Govt
2008 133 41 174 120 28 4 1 1 154 5 3 4 2 14 8 4 1 1 14 356
2009 131 41 172 120 28 3 1 2 154 5 3 5 2 15 8 4 - 1 13 354
2010 132 41 173 120 28 3 2 2 155 5 3 5 2 15 8 4 - 1 13 356
2011 133 41 174 119 28 3 2 2 154 5 3 5 2 15 8 4 - 1 13 356
Note:
Schools (S1-JC2); and Upper Secondary and Junior College (S3-JC2). Figures prior to 2004 refer only to Primary and Secondary Schools and are
classified by type according to their secondary sections.
1) The category Mixed Level, which caters to schools with multiple levels, encompasses Primary & Secondary Schools (P1-S4/5), Secondary & Junior College
2) The first junior college (National Junior College) for pre-university studies was opened in 1969.
3) Centralised Institutes, which provide a 3-year pre-university course leading to GCE A-level certification, were introduced in 1987.
4) Figures exclude the number of Pre-U Centres, which are indicated in parenthesis. Introduced in 1979, Pre-U Centres are secondary
schools that also offer a 3-year pre-university course leading to GCE A-level certification.
5) "Spec Indep" refers to "Specialised Independent" and "Spec'd" refers to "Specialised".
27
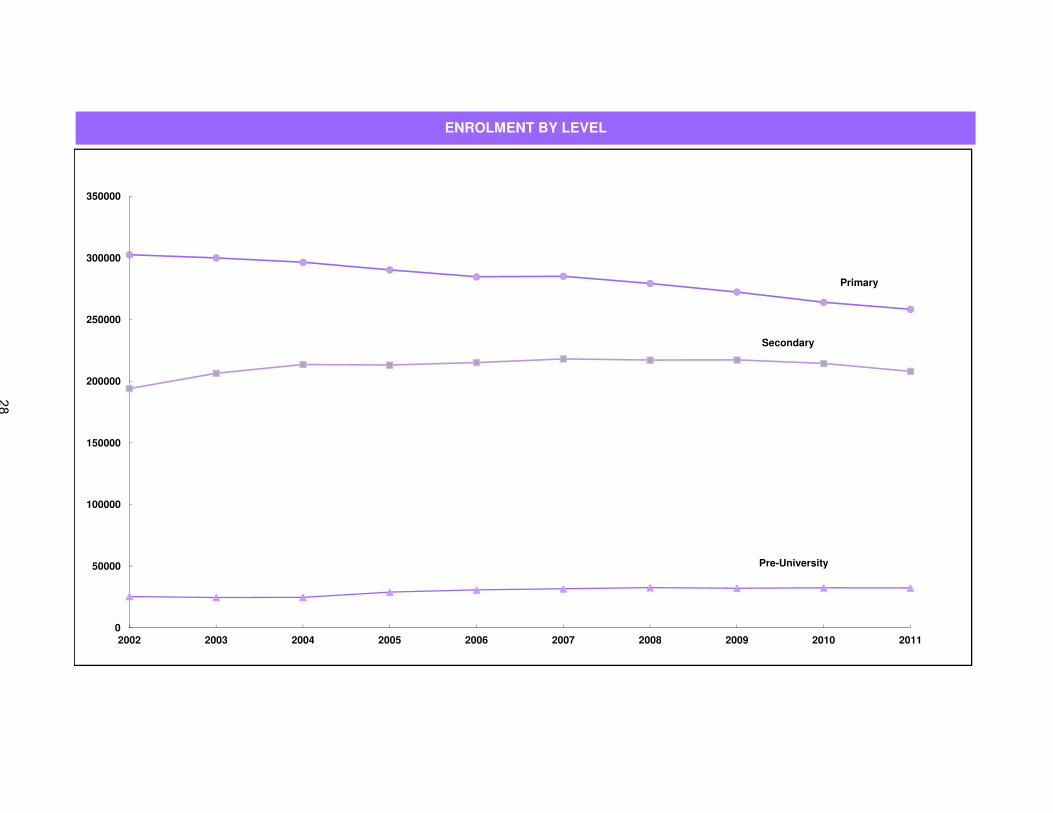
ENROLMENT BY LEVEL
150000
200000
250000
300000
350000
Primary
Secondary
0
50000
100000
2002 2003 2004 2005 2006 2007 2008 2009 2010 2011
Pre-University
28

Govt Aided Total Govt Aided Auto Indep Total Govt Aided Auto Indep Total
1960 MF 139932 143104 283036 26300 24623 - - 50923 1298 3830 - - 5128 339087
F 61636 63430 125066 8484 11607 - - 20091 330 1442 - - 1772 146929
1970 MF 233692 129150 362842 97997 35408 - - 133405 5877 3991 - - 9868 506115
F 108947 60472 169419 46472 18830 - - 65302 2664 1627 - - 4291 239012
1980 MF 214187 77323 291510 115185 40348 - - 155533 9826 6446 - - 16272 463315
F 101232 37971 139203 57734 21034 - - 78768 5799 3819 - - 9618 227589
1990 MF 195994 61763 257757 116693 35589 - 8260 160542 21107 8107 - - 29214 447513
F 91747 30437 122184 56741 20036 - 1654 78431 12110 4268 - - 16378 216993
2000 MF 223272 82433 305705 110154 27902 25262 12087 175405 16452 8352 - - 24804 505914
F 106443 40964 147407 50805 13659 14075 5315 83854 9141 4365 - - 13506 244767
2002 MF 220777 81724 302501 123681 25977 31747 12597 194002 17186 8190 - - 25376 521879
F 105544 40482 146026 57474 11579 18594 5632 93279 9451 4289 - - 13740 253045
2003 MF 219378 80561 299939 133363 26582 33709 12772 206426 16821 7738 - - 24559 530924
F 104741 39965 144706 62049 11347 20293 5679 99368 9151 4055 - - 13206 257280
2004 MF 216261 80158 296419 138591 26336 35513 13094 213534 17040 5929 - 1712 24681 534634
F 103011 39925 142936 64585 11416 21378 5757 103136 9110 3143 - 917 13170 259242
2005 MF 210836 79425 290261 136118 26875 36677 13393 213063 18160 6883 - 3858 28901 532225
F 100211 39716 139927 63470 11587 21938 5820 102815 9872 3706 - 1964 15542 258284
Pre-UniversityGrand Total
19 ENROLMENT BY LEVEL AND SCHOOL TYPE
Year SexPrimary Secondary
F 100211 39716 139927 63470 11587 21938 5820 102815 9872 3706 - 1964 15542 258284
2006 MF 206123 78477 284600 136047 27240 38053 13757 215097 18933 7067 - 4726 30726 530423
F 97689 39273 136962 63348 11762 22915 5941 103966 10428 3794 - 2312 16534 257462
2007 MF 206678 78370 285048 137626 27471 38270 14695 218062 19095 6949 128 5455 31627 534737
F 97710 39299 137009 64094 11765 23005 6270 105134 10608 3888 93 2557 17146 259289
Govt Aided Total Govt Aided Indep Spec Spec'd Total Govt Aided Indep Spec Total
Indep Indep
2008 MF 202547 76725 279272 158328 43490 13225 1367 671 217081 19845 6947 5611 176 32579 528932
F 95763 38643 134406 76170 21856 5796 631 212 104665 11162 3864 2639 84 17749 256820
2009 MF 196830 75424 272254 157904 43367 13309 1567 1083 217230 19478 6712 5657 263 32110 521594
F 93145 38181 131326 75849 21814 5850 752 361 104626 11152 3653 2668 96 17569 253521
2010 MF 189999 73907 263906 155033 42934 13260 1953 1208 214388 19440 6877 5717 386 32420 510714
F 90030 37507 127537 74437 21661 5824 945 412 103279 11100 3816 2717 136 17769 248585
2011 MF 185451 72842 258293 148912 42412 13118 2212 1320 207974 19138 6821 5824 513 32296 498563
F 87858 36953 124811 71537 21546 5789 1024 450 100346 10802 3742 2782 239 17565 242722
Note: 1) From 1996 onwards, data are as of October. Prior to 1996, data are as of June.
2) Enrolment in Pre-University Course include enrolment in Junior Colleges, Centralised Institutes and Pre-U Centres.
29

Norm Extd Mono Norm Extd Mono Norm Extd Mono
1960 MF 60049 59052 51087 43395 - - 38241 - - 31212 - - 283036
F 28100 26679 22424 18594 - - 16484 - - 12785 - - 125066
1970 MF 55557 55070 57585 59440 - - 60272 - - 74918 - - 362842
F 26856 26533 27307 27970 - - 28408 - - 32345 - - 169419
1980 MF 46377 49655 47495 45994 4670 2189 45374 - - 49756 - - 291510
F 22460 23800 22595 22015 1657 650 22011 - - 24015 - - 139203
1990 MF 39317 41582 41254 36086 2620 1695 33444 5155 1643 32508 3981 2066 257757 2
F 18803 19789 19787 17773 1001 563 16384 2178 584 16324 1689 726 122184
EM1 EM2 EM3 EM1 EM2 EM3
2000 MF 50204 49844 50019 52116 - - 10238 34369 4142 9239 36959 8575 305705
F 24215 24144 24254 25156 - - 5639 16238 1558 5170 17757 3276 147407
2002 MF 49006 49799 50383 49982 - - 10398 36459 3310 9591 37821 5752 302501
F 23567 24070 24389 24189 - - 5936 17201 1204 5519 18014 1937 146026
2003 MF 49044 49027 49933 50452 - - 10798 36134 3179 8888 36330 6154 299939
F 23557 23575 24140 24393 - - 6228 16932 1121 5226 17333 2201 144706
EM3 EM3
2004 MF 47256 48905 49035 49929 - - 3189 5493 296419
F 22778 23514 23579 24160 - - 1140 1910 142936
2005 MF 43492 47348 49070 49217 - - 3485 5457 290261
F 21009 22848 23604 23646 - - 1250 1909 139927
2006 MF 43914 43652 47697 49368 - - 3116 5555 284600
F 21016 21080 23017 23751 - - 1112 1974 136962
2007 MF 47964 44370 44502 48345 - - 3166 5249 285048
F 23018 21250 21492 23326 - - 1072 1845 137009
2008 MF 42880 47994 45019 44926 - - - 5390 279272
F 20678 23022 21597 21716 - - - 1893 134406
2009 MF 42489 42765 48218 45200 - - - - 272254
F 20659 20662 23111 21692 - - - - 131326
2010 MF 39595 42405 43022 48418 - - - - 263906
F 19274 20635 20798 23224 - - - - 127537
2011 MF 39295 39492 42542 43165 - - - - 258293
F 18991 19252 20712 20833 - - - - 124811
Note: 1) The channelling of Primary 3 pupils into Primary 4 Normal, Extended and Monolingual streams was last implemented in 1989/90, and was
replaced in 1991/92 by Channelling at Primary 4 into Primary 5 EM1, EM2 and EM3 streams.
2) Total primary enrolment includes Primary 7 and Primary 8 students from the Extended and Monolingual streams.
3) From 2004, the distinction between the EM1 and EM2 streams was removed and schools were given the autonomy to decide on how best
to band their pupils by ability, in ways that add the most educational value.
From 2008, subject-based Banding was introduced in Primary 5 cohort to replace the EM3 stream.
23259 22596
46525 45667
22579 22433
22950 22711
46198 45100
21685 23517
45141
21680
45325
21926
44834
22140
48307
23307
44789 48793
Merged stream 3
Merged stream 3
Primary 4 Primary 5 Primary 6Total
45518
21858
48281
23165
47210 45402
44756
22193
46618
22866
20 PRIMARY ENROLMENT BY LEVEL AND STREAM
Year Sex Pri 1 Pri 2 Pri 3
30

Special Express1 Normal
(Acad)
Normal
(Tech)Total Special Express
1 Normal
(Acad)
Normal
(Tech)Total Special Express
Normal
(Acad)
Normal
(Tech)Total
1960 MF - 20842 - - 20842 - 13048 - - 13048 - 9333 - - 9333
F - 8040 - - 8040 - 5597 - - 5597 - 3710 - - 3710
1970 MF - 38200 - - 38200 - 36970 - - 36970 - 30485 - - 30485
F - 18886 - - 18886 - 17701 - - 17701 - 15071 - - 15071
1980 MF 1511 45489 - - 47000 1737 39068 - - 40805 - 34803 - - 34803
F 800 22509 - - 23309 978 19765 - - 20743 - 17860 - - 17860
1990 MF 2354 20113 13292 - 35759 2278 22336 13167 - 37781 2228 21503 12623 - 36354
F 1133 10027 6279 - 17439 1134 11114 6093 - 18341 1092 10790 5897 - 17779
2000 MF 4182 22585 9855 7795 44417 3766 19939 9472 5808 38985 4329 22573 10609 5975 43486
F 2239 11301 4687 3160 21387 1997 10126 4270 2359 18752 2262 11353 4738 2386 20739
2002 MF 4469 26354 10992 7466 49281 5071 27628 12729 7783 53211 4229 23156 11242 6902 45529
F 2362 13249 5173 2823 23607 2681 14262 5812 2980 25735 2300 11654 5109 2743 21806
2003 MF 4565 28286 12534 6599 51984 4408 26029 11747 7151 49335 5137 28325 13572 7574 54608
F 2473 14450 5814 2311 25048 2372 13223 5447 2661 23703 2769 14578 6000 2905 26252
2004 MF 4696 26856 11596 7310 50458 4541 28001 13257 6325 52124 4638 26538 12941 6893 51010
F 2699 13695 5269 2801 24464 2491 14486 6008 2195 25180 2512 13492 5779 2559 24342
2005 MF 4379 26514 12468 6869 50230 4745 26768 12357 6986 50856 4995 28493 14329 6093 53910
F 2479 13500 5836 2494 24309 2749 13754 5554 2637 24694 2733 14779 6359 2097 25968
21.1 SECONDARY ENROLMENT BY LEVEL AND COURSE
Year Sex
Secondary 1 Secondary 2 Secondary 3
F 2479 13500 5836 2494 24309 2749 13754 5554 2637 24694 2733 14779 6359 2097 25968
2006 MF 4262 26973 12419 7118 50772 4316 26747 13191 6553 50807 5155 27541 13557 6774 53027
F 2324 13850 5746 2619 24539 2475 13707 6043 2365 24590 2934 14121 5956 2519 25530
2007 MF 4238 27396 11981 7072 50687 4277 27473 13282 6994 52026 4818 27856 14386 6600 53660
F 2380 13892 5640 2593 24505 2346 14201 6059 2530 25136 2698 14281 6386 2364 25729
2008 MF - 30873 12811 6530 50214 4156 27781 12879 7014 51830 4751 28456 14481 6869 54557
F - 15958 5956 2210 24124 2349 14251 5976 2518 25094 2574 14743 6373 2478 26168
2009 MF - 30808 12489 6786 50083 - 31159 13445 6439 51043 4626 28959 13932 6923 54440
F - 15882 5811 2384 24077 - 16222 6143 2172 24537 2572 14919 6214 2461 26166
2010 MF - 29785 12394 6491 48670 - 31296 12978 6661 50935 - 32933 14048 6197 53178
F - 15417 5832 2260 23509 - 16230 6023 2285 24538 - 17140 6287 2047 25474
2011 MF - 27732 11436 6045 45213 - 30226 12882 6248 49356 - 32869 13579 6513 52961
F - 14240 5475 2172 21887 - 15746 5984 2146 23876 - 17069 6151 2215 25435
Continued next page
Note: 1) Special and Express streams were merged starting from Secondary 1, 2008.
31

Sec 5
Special ExpressNormal
(Acad)
Normal
(Tech)Total
Normal
(Acad)Special Express
Normal
(Acad)
Normal
(Tech)
1960 MF - 7700 - - 7700 - - 50923 - - 50923
F - 2744 - - 2744 - - 20091 - - 20091
1970 MF - 27750 - - 27750 - - 133405 - - 133405
F - 13644 - - 13644 - - 65302 - - 65302
1980 MF - 32925 - - 32925 - 3248 152285 - - 155533
F - 16856 - - 16856 - 1778 76990 - - 78768
1990 MF 2167 23733 13197 - 39097 11551 9027 87685 63830 - 160542
F 1071 11890 6249 - 19210 5662 4430 43821 30180 - 78431
2000 MF 4100 21299 10058 5654 41111 7406 16377 86396 47400 25232 175405
F 2239 10797 4457 2110 19603 3373 8737 43577 21525 10015 83854
2002 MF 3614 19308 9624 5303 37849 8132 17383 96446 52719 27454 194002
F 2015 9849 4253 2152 18269 3862 9358 49014 24209 10698 93279
2003 MF 3955 22140 10610 6502 43207 7292 18065 104780 55755 27826 206426
F 2241 11232 4890 2591 20954 3411 9855 53483 25562 10468 99368
2004 MF 4688 27285 12636 7239 51848 8094 18563 108680 58524 27767 213534
F 2613 14170 5665 2760 25208 3942 10315 55843 26663 10315 103136
2005 MF 4370 25542 12014 6536 48462 9605 18489 107317 60773 26484 213063
F 2433 13031 5412 2433 23309 4535 10394 55064 27696 9661 102815
2006 MF 4764 27503 13377 5819 51463 9028 18497 108764 61572 26264 215097
F 2670 14358 5992 1998 25018 4289 10403 56036 28026 9501 103966
2007 MF 4894 26771 13072 6788 51525 10164 18227 109496 62885 27454 218062
F 2821 13840 5819 2503 24983 4781 10245 56214 28685 9990 105134
2008 MF 4629 26648 13333 6309 50919 9561 13536 113758 63065 26722 217081
F 2647 13795 5994 2239 24675 4604 7570 58747 28903 9445 104665
2009 MF 4535 27488 13479 6684 52186 9478 9161 118414 62823 26832 217230
F 2468 14378 6052 2410 25308 4538 5040 61401 28758 9427 104626
2010 MF 4053 28356 13003 6661 52073 9532 4053 122370 61955 26010 214388
F 2498 14509 5931 2353 25291 4467 2498 63296 28540 8945 103279
2011 MF - 31984 13307 5972 51263 9181 - 122811 60385 24778 207974
F - 16760 6016 1960 24736 4412 - 63815 28038 8493 100346
21.2 SECONDARY ENROLMENT BY LEVEL AND COURSE
Year Sex
Secondary 4 Total
Grand Total
32

JC1 JC2 Total PU1 PU2 PU3 Total PU1 PU2 PU3 Total
1960 MF - - - - - - - 2809 2319 - 5128 5128
F - - - - - - - 934 838 - 1772 1772
1970 MF 454 564 1018 - - - - 4735 4115 - 8850 9868
F 221 276 497 - - - - 2091 1703 - 3794 4291
1980 MF 5669 5239 10908 - - - - 2911 2453 - 5364 16272
F 3253 3069 6322 - - - - 1797 1499 - 3296 9618
1990 MF 11047 11048 22095 1509 1067 626 3202 1023 1260 1634 3917 29214
F 5823 5802 11625 1052 752 427 2231 668 805 1049 2522 16378
2000 MF 11797 11903 23700 394 421 289 1104 - - - - 24804
F 6286 6520 12806 257 251 192 700 - - - - 13506
2002 MF 13043 11413 24456 361 279 280 920 - - - - 25376
F 7004 6127 13131 235 186 188 609 - - - - 13740
2003 MF 11539 12169 23708 339 289 223 851 - - - - 24559
F 6121 6557 12678 202 177 149 528 - - - - 13206
2004 MF 12991 10721 23712 444 279 246 969 - - - - 24681
F 6893 5673 12566 289 161 154 604 - - - - 13170
2005 MF 15616 12124 27740 557 375 229 1161 - - - - 28901
F 8350 6434 14784 371 252 135 758 - - - - 15542
2006 MF 14633 14821 29454 511 437 324 1272 - - - - 30726
F 7760 7945 15705 323 290 216 829 - - - - 16534
2007 MF 16435 13664 30099 721 416 391 1528 - - - - 31627
F 8863 7304 16167 450 264 265 979 - - - - 17146
2008 MF 16148 14864 31012 688 559 320 1567 - - - - 32579
F 8712 8023 16735 451 356 207 1014 - - - - 17749
2009 MF 16121 14547 30668 618 467 357 1442 - - - - 32110
F 8810 7837 16647 391 303 228 922 - - - - 17569
2010 MF 16327 14724 31051 571 441 357 1369 - - - - 32420
F 8836 8030 16866 385 283 235 903 - - - - 17769
2011 MF 16195 14771 30966 551 432 347 1330 - - - - 32296
F 8742 7952 16694 361 276 234 871 - - - - 17565
22 PRE-UNIVERSITY ENROLMENT BY LEVEL
Year SexJunior College Centralised Institute Pre-U Centre Grand
Total
33

PRE-UNIVERSITY ENROLMENT BY COURSE
10000
15000
20000
25000
30000
Science
0
5000
2002 2003 2004 2005 2006 2007 2008 2009 2010 2011
Arts
Commerce
34
JC1 JC2 PU1 PU2 PU3 JC1 JC2 PU1 PU2 PU3 JC1 JC2 PU1 PU2 PU3
1960 MF - - na na - - - na na - - - - - - 5128
F - - na na - - - na na - - - - - - 1772
1970 MF x x 2596 2417 - x x 2433 2155 - x x 160 107 - 9868
F x x 1471 1285 - x x 720 632 - x x 121 62 - 4291
1980 MF 1158 1167 754 1038 - 3301 3220 773 732 - 1210 852 1384 683 - 16272
F 903 889 521 695 - 1355 1456 270 308 - 995 724 1006 496 - 9618
1990 MF 1992 2056 351 416 575 6370 6593 280 204 118 2685 2399 1901 1707 1567 29214
F 1408 1489 253 269 367 2464 2504 85 80 48 1951 1809 1382 1208 1061 16378
2000 MF 2442 1904 138 103 81 9355 8262 91 97 47 - 1737 165 221 161 24804
F 1757 1392 87 69 55 4529 3928 50 38 19 - 1200 120 144 118 13506
2002 MF 2512 2215 136 104 87 10531 9198 99 83 69 - - 126 92 124 25376
F 1740 1570 96 73 55 5264 4557 52 49 41 - - 87 64 92 13740
2003 MF 2015 2314 124 122 75 9524 9855 125 75 70 - - 90 92 78 24559
F 1337 1627 71 83 51 4784 4930 72 36 43 - - 59 58 55 13206
2004 MF 2220 1885 145 87 81 10771 8836 176 103 66 - - 123 89 99 24681
F 1504 1249 101 48 51 5389 4424 104 58 36 - - 84 55 67 13170
2005 MF 2776 2058 142 96 92 12840 10066 216 148 77 - - 199 131 60 28901
23 PRE-UNIVERSITY ENROLMENT BY COURSE AND LEVEL
Year SexArts Science Commerce Grand
Total
2005 MF 2776 2058 142 96 92 12840 10066 216 148 77 - - 199 131 60 28901
F 1966 1404 102 66 53 6384 5030 128 92 41 - - 141 94 41 15542
2006 MF 2452 2559 183 188 126 12181 12262 187 176 130 - - 141 73 68 30726
F 1653 1837 132 129 87 6107 6108 99 104 79 - - 92 57 50 16534
2007 MF 2876 2195 196 87 89 13559 11469 247 140 145 - - 278 189 157 31627
F 1940 1500 132 71 66 6923 5804 143 71 88 - - 175 122 111 17146
2008 MF 2840 2560 193 163 86 13308 12304 205 197 109 - - 290 199 125 32579
F 1893 1750 142 119 68 6819 6273 127 110 60 - - 182 127 79 17749
2009 MF 2682 2428 147 89 114 13439 12119 236 130 114 - - 235 248 129 32110
F 1816 1631 108 66 83 6994 6206 129 83 61 - - 154 154 84 17569
2010 MF 2733 2400 164 127 63 13594 12324 223 168 97 - - 184 146 197 32420
F 1835 1641 123 92 49 7001 6389 131 93 58 - - 131 98 128 17769
2011 MF 2769 2331 126 106 89 13426 12440 196 182 123 - - 229 144 135 32296
F 1879 1582 96 69 70 6863 6370 107 105 66 - - 158 102 98 17565
Note: na - Courses for the year 1960 are not available.
x - Figures for JC are included under PU1 & PU2.
35
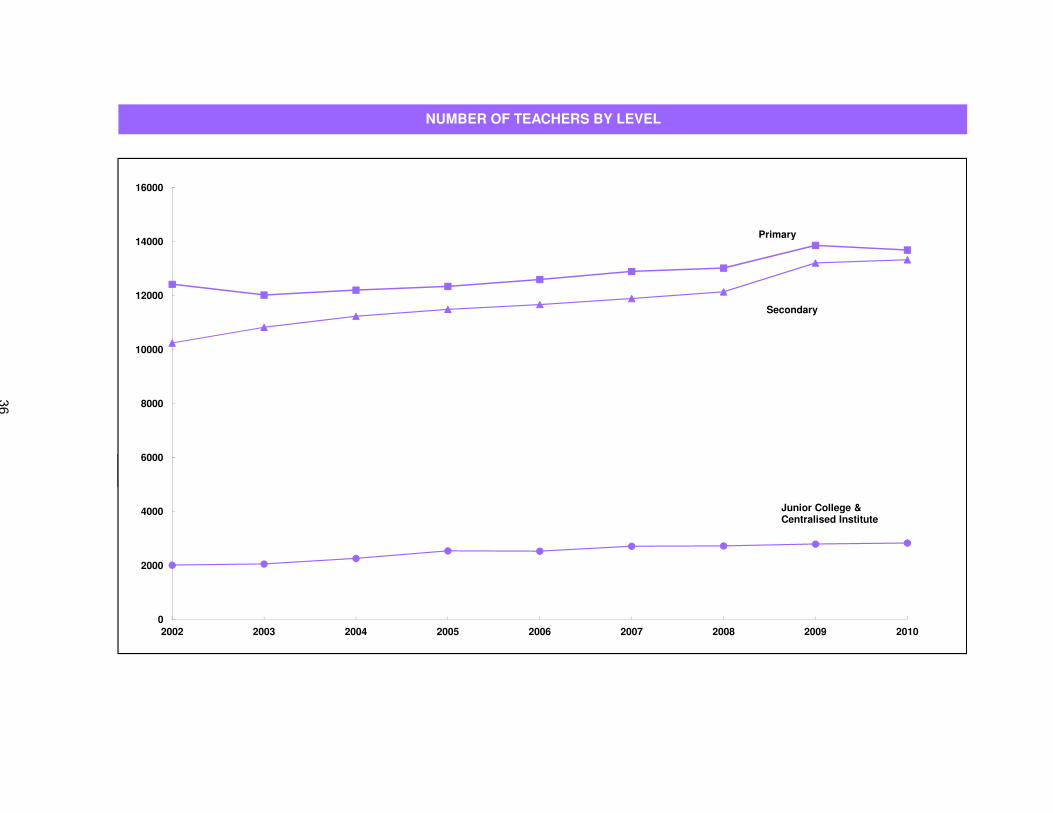
NUMBER OF TEACHERS BY LEVEL
6000
8000
10000
12000
14000
16000
Primary
Secondary
0
2000
4000
6000
2002 2003 2004 2005 2006 2007 2008 2009 2010
Junior College &
Centralised Institute
36

Govt Aided Total Govt Aided Auto Indep Total Govt Aided Auto Indep Total
1960 MF 4283 4316 8599 979 1025 - - 2004 - - - - - 10603
F 1944 2377 4321 248 426 - - 674 - - - - - 4995
1970 MF 8044 4172 12216 4847 1598 - - 6445 x x - - - 18661
F 5485 2569 8054 2155 776 - - 2931 x x - - - 10985
1980 MF 7244 2837 10081 5605 2234 - - 7839 x x - - - 17920
F 4834 1908 6742 3013 1304 - - 4317 x x - - - 11059
1990 MF 7848 2158 10006 5660 1533 - 393 7586 1038 502 - - 1540 19132
F 5560 1673 7233 3395 1047 - 269 4711 661 323 - - 984 12928
2000 MF 8659 3264 11923 5791 1559 1026 756 9132 1245 640 - - 1885 22940
F 6822 2767 9589 3650 1068 722 545 5985 730 376 - - 1106 16680
2002 MF 9082 3341 12423 6525 1516 1368 837 10246 1370 646 - - 2016 24685
F 7315 2860 10175 4193 992 965 602 6752 773 382 - - 1155 18082
2003 MF 8757 3268 12025 6935 1368 1676 851 10830 1414 645 - - 2059 24914
F 7147 2804 9951 4517 902 1167 600 7186 798 382 - - 1180 18317
2004 MF 8884 3325 12209 7123 1332 1860 925 11240 1602 535 - 130 2267 25716
F 7292 2859 10151 4651 873 1326 636 7486 923 329 - 77 1329 18966
2005 MF 8959 3384 12343 7238 1376 1905 976 11495 1644 581 - 319 2544 26382
F 7349 2894 10243 4744 892 1366 665 7667 947 344 - 178 1469 19379
2006 MF 9080 3517 12597 7220 1425 2042 985 11672 1593 586 4 352 2535 26804
24 NUMBER OF TEACHERS BY LEVEL AND SCHOOL TYPE
Year SexPrimary Secondary Pre-University Grand
Total
2006 MF 9080 3517 12597 7220 1425 2042 985 11672 1593 586 4 352 2535 26804
F 7446 2997 10443 4750 923 1461 653 7787 923 349 3 202 1477 19707
2007 MF 9284 3613 12897 7239 1473 2154 1026 11892 1665 576 x 475 2716 27505
F 7589 3061 10650 4744 955 1504 672 7875 963 349 x 248 1560 20085
Govt Aided Total Govt Aided Indep Spec Spec'd Total Govt Aided Total
Indep
2008 MF 9434 3589 13023 8586 2404 1009 105 39 12143 1658 564 2728 27894
F 7694 3011 10705 5628 1641 673 58 15 8015 962 330 1564 20284
2009 MF 10066 3798 13864 9378 2561 1080 140 55 13214 1707 570 2797 29875
F 8200 3205 11405 6200 1735 712 80 22 8749 1002 331 1619 21773
2010 MF 9892 3801 13693 9496 2515 1078 185 58 13332 1714 600 2837 29862
F 8012 3219 11231 6219 1722 699 109 23 8772 995 348 1627 21630
2011 MF 9936 3967 13903 9859 2716 1064 259 145 14043 1730 616 2869 30815
F 8011 3341 11352 6429 1836 701 153 54 9173 1005 355 1648 22173
Note: 1) From 1996 onwards, data are as of 31 December. Prior to 1996, data are as of June.
2) "x" - figures for JC section are included under Secondary.
3) From 2008, the classification for Autonomous schools (Auto) has been grouped under Government and Government-Aided schools.
272
520
286
523
284
523
288
Indep
506
37

INTAKE: UNIVERSITIES, POLYTECHNICS, LASALLE, NAFA AND ITE (FULL-TIME)
10000
15000
20000
25000
30000
Polytechnic
University
ITE
0
5000
10000
2002 2003 2004 2005 2006 2007 2008 2009 2010 2011
NIE
NAFA
LASALLE
38

National
University of
Singapore
Nanyang
University
Nanyang
Technological
University
Singapore
Management
University
Singapore
Institute of
Technology
Total S'pore Ngee Ann Temasek Nanyang Republic Total
1960 MF 532 651 - - - 1183 890 874 - - - - 874 - - -
F 189 137 - - - 326 433 51 - - - - 51 - - -
1970 MF 1390 685 - - - 2075 1293 1617 302 - - - 1919 - - 3348
F 530 366 - - - 896 986 109 74 - - - 183 - - 246
1980 MF 3002 - - - - 3002 875 3479 1112 - - - 4591 - - 3145
F 1524 - - - - 1524 748 736 379 - - - 1115 - - 230
1990 MF 5053 - 1875 - - 6928 1185 4336 4453 735 - - 9524 - - 9221
F 2430 - 1046 - - 3476 895 1553 1902 552 - - 4007 - - 3352
2000 MF 6421 - 4506 305 - 11232 2186 4446 4673 4519 3881 - 17519 - - 9772
F 3437 - 2113 212 - 5762 1564 1843 2236 2244 1985 - 8308 - - 3248
2002 MF 6019 - 4411 607 - 11037 2352 4883 4527 4183 4641 - 18234 - - 10628
F 3252 - 2066 408 - 5726 1664 1921 2232 2156 2538 - 8847 - - 3617
2003 MF 6245 - 4350 824 - 11419 1692 4347 4358 3878 4590 821 17994 - - 10566
F 3413 - 1854 512 - 5779 1171 1678 2109 1936 2594 377 8694 - - 3732
2004 MF 5722 - 5377 1095 - 12194 1583 4410 4443 4140 5020 1134 19147 - - 11650
F 2955 - 2555 712 - 6222 1085 1676 2057 2043 2811 517 9104 - - 4222
2005 MF 6095 - 5206 1207 - 12508 2208 4545 4801 4775 4993 1792 20906 678 826 13705
F 3122 - 2663 586 - 6371 1492 1725 2363 2510 2590 948 10136 400 534 5139
25 INTAKE: UNIVERSITIES, POLYTECHNICS, LASALLE, NAFA AND ITE (FULL-TIME)
Polytechnics3
LASALLE4
NAFA5
Institute of
Technical
Education6
Year Sex
Universities1
National
Institute of
Education2
F 3122 - 2663 586 - 6371 1492 1725 2363 2510 2590 948 10136 400 534 5139
2006 MF 6631 - 5746 1356 - 13733 1884 4746 4949 5009 4952 2620 22276 1008 773 13645
F 3618 - 2735 610 - 6963 1292 1719 2336 2448 2511 1380 10394 603 509 5035
2007 MF 6554 - 6196 1603 - 14353 1852 5006 4817 4833 4965 3741 23362 790 713 13967
F 3710 - 3201 896 - 7807 1292 1804 2355 2399 2683 1947 11188 540 495 5064
2008 MF 6432 - 6033 1670 - 14135 1702 5193 5278 5023 5279 4065 24838 728 852 14205
F 3389 - 3039 952 - 7380 1158 2069 2578 2489 2700 2117 11953 460 578 5318
2009 MF 6775 - 6719 1770 - 15264 2003 5289 5300 5080 5338 4617 25624 727 797 13705
F 3426 - 3379 889 - 7694 1390 2152 2572 2545 2782 2447 12498 455 538 5314
2010 MF 6568 - 6132 1686 406 14792 1939 5429 5387 5067 5482 4342 25707 795 835 13886
F 3405 - 2951 823 206 7385 1327 2260 2573 2604 2933 2292 12662 530 559 5248
2011 MF 6724 - 6177 1729 900 15530 1827 5348 5466 5377 5538 5008 26737 580 716 14098
F 3566 - 3026 869 448 7909 1258 2115 2643 2666 2797 2580 12801 341 508 5484
Note: 1) University figures are for 1st degree only.
2) National Institute of Education figures are for Diplomas and Post-graduate Diplomas in education-related subjects. BA / BSc (Education) figures are included under Nanyang Technological University.
3) Figures for Polytechnics are for full-time diploma courses only.
4) Figures for LASALLE College of the Arts are for full-time diploma courses only.
5) Figures for Nanyang Academy of Fine Arts are for full-time diploma courses only.
6) Institute of Technical Education (ITE) was established in 1992 to replace the former Vocational & Industrial Training Board. ITE figures exclude apprentices.
7) Intake figures include direct entry to second and subsequent years.
39

ENROLMENT: UNIVERSITIES, POLYTECHNICS, LASALLE, NAFA AND ITE (FULL-TIME)
30000
40000
50000
60000
70000
80000
Polytechnic
University
ITE
0
10000
20000
2002 2003 2004 2005 2006 2007 2008 2009 2010
ITE
NIE
NAFA LASALLE
40

National
University of
Singapore
Nanyang
University
Nanyang
Technological
University
Singapore
Management
University
Singapore
Institute of
Technology
Total Singapore Ngee Ann Temasek Nanyang Republic Total
1960 MF 1641 1861 - - - 3502 2327 2332 - - - - 2332 - - -
F 426 378 - - - 804 1202 55 - - - - 55 - - -
1970 MF 4751 2310 - - - 7061 2001 2185 609 - - - 2794 - - 4727
F 1531 918 - - - 2449 1390 155 163 - - - 318 - - 326
1980 MF 8634 - - - - 8634 2328 5004 2831 - - - 7835 - - 12543
F 3926 - - - - 3926 1977 1036 782 - - - 1818 - - 2414
1990 MF 15193 - 6812 - - 22005 1577 11348 11995 735 - - 24078 - - 15919
F 8107 - 2689 - - 10796 1212 3878 4817 552 - - 9247 - - 5304
2000 MF 21233 - 14583 305 - 36121 3072 13459 14378 12733 11463 - 52033 - - 15974
F 11341 - 6223 212 - 17776 2247 5408 6419 6446 5989 - 24262 - - 4343
2002 MF 22169 - 15598 1389 - 39156 3368 14271 13989 13324 13105 - 54689 - - 17468
F 11653 - 6822 974 - 19449 2455 5670 6626 6579 6892 - 25767 - - 5138
2003 MF 22149 - 15764 2182 - 40095 2953 14371 13690 13117 13754 821 55753 - - 17941
F 11036 - 6830 1469 - 19335 2080 5562 6534 6462 7456 377 26391 - - 5615
2004 MF 21781 - 16837 3010 - 41628 2282 13709 13417 12782 14233 1907 56048 - - 19207
F 11372 - 7469 1991 - 20832 1550 5233 6347 6302 7875 865 26622 - - 6076
2005 MF 22105 - 17777 3781 - 43663 2881 13353 13715 13582 14643 3587 58880 1505 1933 21603
F 11326 - 8094 2239 - 21659 1940 5019 6500 6776 8010 1759 28064 906 1236 7315
26 ENROLMENT: UNIVERSITIES, POLYTECHNICS, LASALLE, NAFA AND ITE (FULL-TIME)
Polytechnics3
LASALLE4
NAFA5
Institute of
Technical
Education6
Year Sex
National
Institute of
Education2
Universities1
F 11326 - 8094 2239 - 21659 1940 5019 6500 6776 8010 1759 28064 906 1236 7315
2006 MF 22836 - 19114 4529 - 46479 2938 13656 14258 14568 15001 5479 62962 1904 2083 23636
F 11766 - 8797 2429 - 22992 1998 5084 6719 7236 7913 2790 29742 1139 1352 8052
2007 MF 23578 - 20206 5178 - 48962 2725 14399 14687 15243 14874 8087 67290 1948 2114 24370
F 12396 - 9769 2758 - 24923 1878 5249 7007 7541 7732 4205 31734 1228 1396 8235
2008 MF 24086 - 21097 5721 - 50904 2581 14986 15123 15615 15225 10188 71137 1887 2190 24593
F 12663 - 10409 2993 - 26065 1758 5605 7214 7587 7866 5257 33529 1202 1475 8479
2009 MF 24798 - 22450 6331 - 53579 2804 15523 15417 15791 15656 12179 74566 1771 2144 24846
F 12944 - 11105 3295 - 27344 1896 6034 7436 7676 8150 6304 35600 1143 1460 8844
2010 MF 25189 - 22862 6721 406 55178 2816 15928 15942 15933 16183 13003 76989 1754 2269 24789
F 13067 - 11389 3525 206 28187 1886 6453 7655 7804 8387 6729 37028 1137 1532 8856
2011 MF 25513 - 23040 6853 943 56349 2579 15949 16139 16020 16408 13927 78443 1623 2217 25279
F 13066 - 11354 3523 474 28417 1759 6432 7703 7894 8440 7209 37678 1011 1510 9158
Note: 1) University figures are for 1st degree only.
2) National Institute of Education figures are for Diplomas and Post-graduate Diplomas in education-related subjects. BA / BSc (Education) figures are included under Nanyang Technological University.
3) Figures for Polytechnics are for full-time diploma courses only.
4) Figures for LASALLE College of the Arts are for full-time diploma courses only.
5) Figures for Nanyang Academy of Fine Arts are for full-time diploma courses only.
6) Institute of Technical Education (ITE) was established in 1992 to replace the former Vocational & Industrial Training Board. ITE figures exclude apprentices.
41

GRADUATES: UNIVERSITIES, POLYTECHNICS, LASALLE, NAFA AND ITE (FULL-TIME)
Junior College
Polytechni
ITE
NIE
10000
15000
20000
25000
Polytechnic
University
ITE
0
5000
2002 2003 2004 2005 2006 2007 2008 2009 2010 2011
NIE
NAFA
LASALLE
42

National
University of
Singapore
Nanyang
University
Nanyang
Technological
University
Singapore
Management
University
Total Singapore Ngee Ann Temasek Nanyang Republic Total
1960 MF 593 437 - - 1030 734 - - - - - - - - -
F 196 95 - - 291 358 - - - - - - - - -
1970 MF 1220 556 - - 1776 1202 436 * - - - 436 - - 1426
F 378 168 - - 546 820 7 * - - - 7 - - 134
1980 MF 2187 687 - - 2874 616 1969 584 - - - 2553 - - 7862
F 1070 250 - - 1320 504 378 136 - - - 514 - - 1145
1990 MF 4001 - 1333 - 5334 929 3112 3087 - - - 6199 - - 7469
F 2307 - 510 - 2817 694 1011 1233 - - - 2244 - - 2889
2000 MF 5631 - 3613 - 9244 2445 3974 4187 3336 2562 - 14059 - - 7650
F 3270 - 1583 - 4853 1681 1619 1844 1776 1471 - 6710 - - 2429
2002 MF 6277 - 3646 - 9923 2186 3955 4399 3690 3537 - 15581 - - 7084
F 3613 - 1701 - 5314 1570 1604 2069 1930 1874 - 7477 - - 2499
2003 MF 5960 - 4042 8 10010 2772 3981 4210 3837 3376 - 15404 - - 7741
F 3238 - 1808 4 5050 1965 1653 2056 1971 1775 - 7455 - - 2778
2004 MF 5858 - 4067 240 10165 1989 4504 4289 4102 3939 - 16834 - - 8127
F 3161 - 1843 167 5171 1430 1871 2069 2072 2104 - 8116 - - 3057
2005 MF 5575 - 4048 408 10031 2020 4537 4143 3633 4202 - 16515 369 345 9059
F 3051 - 1964 315 5330 1341 1821 2068 1921 2303 - 8113 213 200 3492
27 GRADUATES: UNIVERSITIES, POLYTECHNICS, LASALLE, NAFA AND ITE (FULL-TIME)
Year Sex
Universities1
National
Institute of
Education2
Polytechnics3
LASALLE4
NAFA5
Institute of
Technical
Education6
2006 MF 5621 - 4241 565 10427 2096 4103 4084 3718 4114 619 16638 370 464 10056
F 3055 - 1974 399 5428 1416 1574 1990 1860 2385 291 8100 227 295 3724
2007 MF 5500 - 4845 826 11171 2348 3953 4013 3928 4591 928 17413 438 441 10479
F 2943 - 2127 500 5570 1590 1532 1911 2003 2645 435 8526 268 293 4019
2008 MF 5601 - 4808 1063 11472 2188 4250 4504 4565 4447 1551 19317 481 610 10600
F 2982 - 2286 686 5954 1486 1644 2247 2399 2391 815 9496 296 409 4059
2009 MF 5779 - 5058 1110 11947 2179 4334 4581 4815 4388 2106 20224 566 559 10999
F 3012 - 2570 562 6144 1492 1610 2186 2396 2279 1119 9590 351 389 4311
2010 MF 5833 - 5412 1206 12451 2416 4627 4534 4848 4483 2953 21445 578 518 11334
F 3124 - 2544 546 6214 1622 1700 2237 2429 2502 1594 10462 371 365 4488
2011 MF 6088 - 5733 1504 13325 2415 4921 4857 5020 4829 3291 22918 499 583 11165
F 3403 - 2951 831 7185 1626 1982 2437 2429 2536 1722 11106 333 409 4326
Note: 1) University figures are for 1st degree only.
2) National Institute of Education figures are for Diplomas and Post-graduate Diplomas in education-related subjects. BA / BSc (Education) figures are included under Nanyang Technological University.
3) Figures for Polytechnics are for full-time diploma courses only.
4) Figures for LASALLE College of the Arts are for full-time diploma courses only.
5) Figures for Nanyang Academy of Fine Arts are for full-time diploma courses only.
6) Institute of Technical Education (ITE) was established in 1992 to replace the former Vocational & Industrial Training Board. ITE figures exclude apprentices. Figures for 2001 and earlier include ITE
students who completed their programmes without receiving certificates.
43

GOVERNMENT DEVELOPMENT EXPENDITURE ON EDUCATION ('000 SGD)
150000
200000
250000
300000
350000
400000
450000
500000
Primary
University
ITE
0
50000
100000
150000
2002/03 2003/04 2004/05 2005/06 2006/07 2007/08 2008/09 2009/10 2010/11 2011/12*
University
Polytechnic
Secondary
JC/CI
44

1997/98 205675 117978 228079 13967 42912 305286 1010 165004 7679 14389 1101979
1998/99 454953 211942 352908 6114 42332 275051 111 315054 7078 20152 1685695
1999/00 421409 237624 315929 75722 34453 146463 2168 340949 2303 23594 1600614
2000/01 279507 383822 249509 73891 52334 169183 11318 329625 3657 37765 1590611
2001/02 173612 444755 232211 66530 60049 129383 11286 331992 2158 21015 1472991
2002/03 182329 368489 272914 89749 120861 308888 7699 384117 2414 36100 1773560
2003/04 43497 195005 284099 41513 130530 146433 200 302293 6270 67803 1217643
2004/05 42304 125777 233314 64569 103168 183424 2890 453944 6367 23640 1239397
2005/06 44835 72258 131273 46232 37596 262858 0 247374 1240 23312 866978
2006/07 42425 78447 104640 14811 70167 152823 0 137496 2035 4725 607569
2007/08 58358 214637 157152 7793 5960 116371 0 153564 20495 7713 742043
2008/09 69595 267672 212062 3161 7666 42076 958 118307 29204 2472 753173
2009/10 74776 214235 275916 4020 11510 62297 9417 163371 27721 3884 847147
2010/11 104467 151204 153719 12910 142006 71379 1298 224661 14048 1044 876736
2011/12* 90311 369213 120953 5049 255679 19715 0 166711 17742 390 1045763 .
* Preliminary figures
Primary Secondary
Junior College
/ Centralised
Institute
Institute of
Technical
Education
Others Total
28 GOVERNMENT DEVELOPMENT EXPENDITURE ON EDUCATION ('000 SGD)
Polytechnic University Special
Education
Financial
Year
National
Institute of
Education
MOE HQ
45

GOVERNMENT RECURRENT EXPENDITURE ON EDUCATION ('000 SGD)
Universi
ITE
Primar
Seconda
Junior
Polyt
1500000
2000000
2500000
3000000
3500000
Primary
Secondary
University
Polytechnic
0
500000
1000000
2002/03 2003/04 2004/05 2005/06 2006/07 2007/08 2008/09 2009/10 2010/11 2011/12*
JC/CI
Polytechnic
ITE
NIE
46

1997/98 208659 829887 861245 157964 124332 429234 48131 656619 17196 14508 3347775
1998/99 209535 818646 823460 149616 120441 419673 53862 537450 19351 15391 3167425
1999/00 244407 820842 842658 157821 126371 387239 61697 569971 19790 26078 3256874
2000/01 403148 995279 976553 190274 148416 524055 83753 898505 26825 30088 4276896
2001/02 435146 1044461 1059846 202456 162648 592733 87000 1114554 28025 39715 4766584
2002/03 441017 1095536 1171377 226187 169499 578551 94791 973779 36358 37300 4824395
2003/04 428997 1066364 1205693 223490 171067 714264 80766 1034804 33450 37896 4996791
2004/05 405524 1071327 1276481 226569 191135 594446 73256 1029869 38884 67233 4974724
2005/06 433675 1125876 1328287 238115 203973 622933 84722 1058239 50124 69355 5215299
2006/07 298582 1290409 1561500 271046 249154 728741 100147 1719156 53196 79786 6351717
2007/08 347946 1496718 1780889 340681 253506 816913 102243 1491382 68874 86473 6785625
2008/09 439480 1553535 1859599 316184 281262 946113 110378 1808987 73594 87389 7476521
2009/10 503277 1573321 1924142 311770 262509 944810 112474 2014807 95937 94862 7837909
2010/11 517043 1839190 2220430 348039 328067 1124873 123625 2305921 84943 106578 8998709
2011/12* 560580 1853250 2195548 334111 347338 1179125 118558 2944796 96552 114119 9743977
* Preliminary figures
29 GOVERNMENT RECURRENT EXPENDITURE ON EDUCATION ('000 SGD)
Financial
YearMOE HQ Primary Secondary
Junior College
/ Centralised
Institute
Institute of
Technical
Education
Polytechnic Total
National
Institute of
Education
University Special
EducationOthers
47

GOVERNMENT RECURRENT EXPENDITURE ON EDUCATON PER STUDENT (SGD)
15000
20000
University
ITE
JC/CI
Polytechnic
0
5000
10000
2002/03 2003/04 2004/05 2005/06 2006/07 2007/08 2008/09 2009/10 2010/11 2011/12*
Primary
Secondary
48

Financial Year Primary Secondary1 Junior College /
Centralised Institute
Institute of Technical
EducationPolytechnic University
2
1997/98 2960 4469 7052 10586 9018 15125
1998/99 2808 4472 6346 7020 8144 12580
1999/00 2612 4409 6325 6452 8032 14112
2000/01 3137 5104 7304 8076 9546 15384
2001/02 3363 5304 7879 7829 9668 15262
2002/03 3535 5614 8497 8056 9793 14287
30 GOVERNMENT RECURRENT EXPENDITURE ON EDUCATION PER STUDENT (SGD)
2002/03 3535 5614 8497 8056 9793 14287
2003/04 3508 5437 8791 8367 10197 17477
2004/05 3575 5746 8850 9399 10695 17609
2005/06 3820 5793 9445 9249 10843 17793
2006/07 4243 6246 10161 10209 11903 18472
2007/08 5026 7230 12386 10543 12482 19011
2008/09 5397 7551 11094 11106 13479 19664
2009/10 5537 7736 10772 10129 12598 18868
2010/11 6624 9008 12331 11839 14552 20630
2011/12* 6850 9095 12309 11914 14608 20805
Note: 1) Figures exclude Independent Schools.
* Preliminary figures
2) Figures include National University of Singapore, Nanyang Technological University, Singapore Management University and Singapore Institute of
Technology (from FY2010).
49

31 PERCENTAGE OF PUPILS WHO PASSED PSLE BY ETHNIC GROUP
%
50
60
70
80
90
100
2001 2002 2003 2004 2005 2006 2007 2008 2009 2010
Chinese
Total
Indian
Malay
Race 2001 2002 2003 2004 2005 2006 2007 2008 2009 2010
Malay % Passed 92.0 90.5 92.9 93.5 94.4 93.5 93.0 91.2 91.2 92.5
Chinese % Passed 98.4 98.2 98.6 98.7 98.9 99.0 99.0 98.8 98.8 98.8
Indian % Passed 93.7 93.2 95.0 95.5 96.1 95.9 96.2 95.5 95.0 95.3
Others % Passed 96.8 96.7 97.4 97.2 97.7 98.4 98.1 98.2 97.9 98.6
All % Passed 96.7 96.3 97.2 97.4 97.8 97.7 97.7 97.1 97.1 97.3
Note: 1) % Passed refers to school candidates who are eligible for Secondary School (Express/Normal course).
2) The first batch of students under Subject-based Banding sat for PSLE in 2009.
50

s
32 PERCENTAGE OF PUPILS WITH AT LEAST 5 'O' LEVEL PASSES BY ETHNIC GROUP
30
40
50
60
70
80
90
100
2001 2002 2003 2004 2005 2006 2007 2008 2009 2010
Total
Chinese
Malay%
Indian
Race 2001 2002 2003 2004 2005 2006 2007 2008 2009 2010
Malay % Passed 56.5 58.0 59.0 59.3 63.2 60.3 59.4 59.3 62.9 62.1
Chinese % Passed 84.3 84.6 85.9 86.5 84.8 86.3 85.4 86.2 86.0 86.5
Indian % Passed 70.3 71.3 73.5 73.7 72.9 75.0 72.6 73.0 73.0 72.3
Others % Passed 74.7 76.6 80.9 77.2 78.6 76.5 81.3 79.7 81.2 81.2
All % Passed 80.0 80.0 81.6 82.7 81.1 82.0 80.8 81.3 81.9 82.1
Note: 1) % Passed refers to school candidates with at least 5 'O' level passes.
2) Figures from 2005 onwards exclude IP students.
3) Figures are based only on graduating S4E and S5N O-level school candidates.
51

33 PERCENTAGE OF PUPILS WITH AT LEAST 3 'A' / 'H2' PASSES & PASS IN GP / K&I BY ETHNIC GROUP
100
70
80
90
100
Malay
IndianTotal
Chinese
40
50
60
70
%
30
40
2001 2002 2003 2004 2005 2006 2007 2008 2009 2010
Race 2001 2002 2003 2004 2005 2006 2007 2008 2009 2010
Malay % Passed 71.8 70.7 74.3 73.3 71.6 72.1 76.4 75.1 75.0 82.9
Chinese % Passed 85.4 86.2 87.9 89.7 88.1 88.2 88.1 88.8 88.8 91.5
Indian % Passed 85.8 81.1 87.3 86.6 84.2 81.6 82.2 82.7 85.4 88.3
Others % Passed 91.9 87.7 87.5 95.0 94.0 86.9 86.1 83.7 86.8 89.8 Others % Passed 91.9 87.7 87.5 95.0 94.0 86.9 86.1 83.7 86.8 89.8
All % Passed 84.8 85.2 87.2 88.6 87.2 87.0 87.1 87.6 87.8 90.8
Note: 1) % Passed refers to school candidates with at least 3 'A' / 'H2' passes & pass in General Paper (GP) or Knowledge & Inquiry (K&I).
2) Figures for 2007 and 2008 include students taking either the new or old syllabus.
52
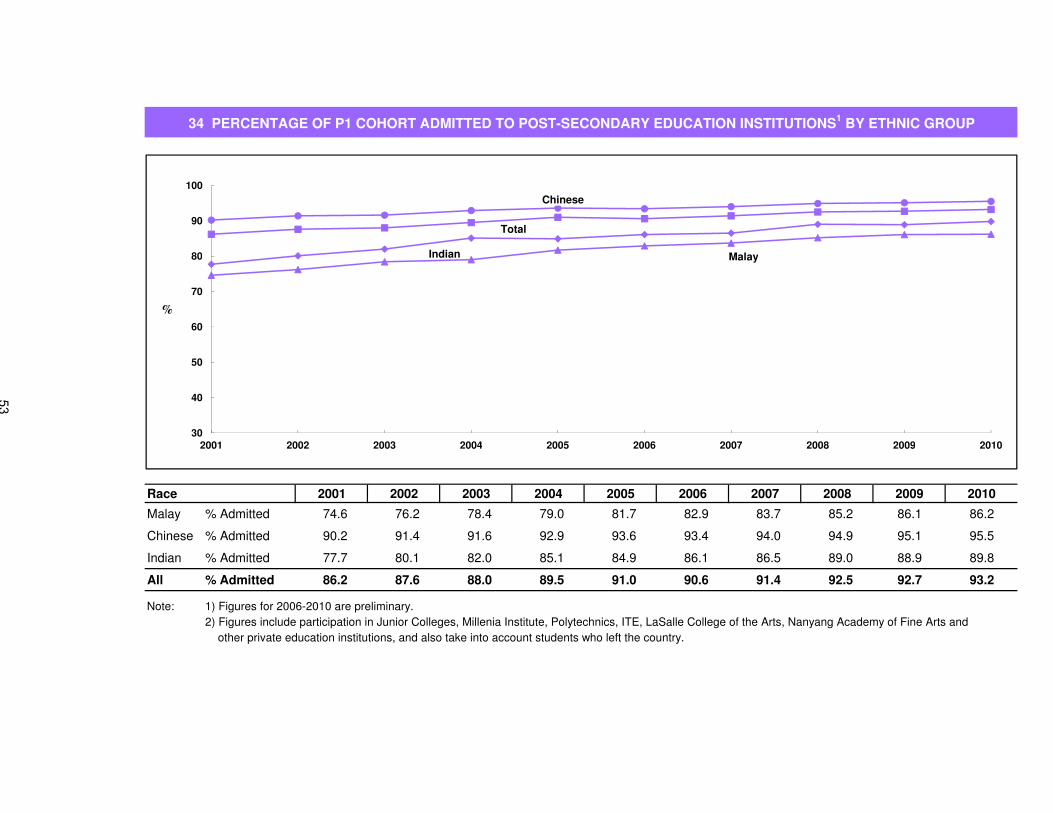
34 PERCENTAGE OF P1 COHORT ADMITTED TO POST-SECONDARY EDUCATION INSTITUTIONS1 BY ETHNIC GROUP
80
90
100
Total
Chinese
Indian Malay
60
70
80 Indian Malay
%
30
40
50
2001 2002 2003 2004 2005 2006 2007 2008 2009 2010
Race 2001 2002 2003 2004 2005 2006 2007 2008 2009 2010
Malay % Admitted 74.6 76.2 78.4 79.0 81.7 82.9 83.7 85.2 86.1 86.2
Chinese % Admitted 90.2 91.4 91.6 92.9 93.6 93.4 94.0 94.9 95.1 95.5
2001 2002 2003 2004 2005 2006 2007 2008 2009 2010
Chinese % Admitted 90.2 91.4 91.6 92.9 93.6 93.4 94.0 94.9 95.1 95.5
Indian % Admitted 77.7 80.1 82.0 85.1 84.9 86.1 86.5 89.0 88.9 89.8
All % Admitted 86.2 87.6 88.0 89.5 91.0 90.6 91.4 92.5 92.7 93.2
Note: 1) Figures for 2006-2010 are preliminary.
2) Figures include participation in Junior Colleges, Millenia Institute, Polytechnics, ITE, LaSalle College of the Arts, Nanyang Academy of Fine Arts and
other private education institutions, and also take into account students who left the country. other private education institutions, and also take into account students who left the country.
53


APPENDICES

Milestones in the Education System
Pre-Primary Education
1993 Discontinuation of Preparatory Year programme in Schools
Primary Education
1979 Introduction of primary streaming beginning with the 1979 P3 cohort - The Goh Report recommended that pupils be channelled to the Normal, Extended and Monolingual streams
1991 Introduction of Streaming at end of P4 (EM1, EM2 and EM3) and removal of P3
streaming
Phasing in of Education System (1991)
1993 Last batch of P8 Extended and P8 Monolingual pupils
2004 Refinements to Streaming (merger of EM1 and EM2, EM3 remains) 2008 Introduction of Subject-based Banding beginning with the 2008 P5 cohort to
replace the EM3 stream
Secondary Education
1980 Introduction of streaming at Sec 1 (NES Guidelines, Secondary) 1988 First independent schools - ACS, SJI, & TCH established. SCGS & MGS became
independent in 1989; RI in 1990; and RGS & Nanyang Girls’ in 1993. 1994 Implementation of Sec 1 Normal (Technical) course Establishment of Autonomous Schools 2004 Revised Progression Structure for Normal (Technical) Course
Singapore Sports School admits its first batch of students in 2004 2005 NUS High School of Mathematics and Science admits its first batch of students in
2005 2007 Establishment of NorthLight School (Specialised School)
56
2008 Refinements to Streaming (merger of Secondary 1 Special and Express streams) School of The Arts (SOTA) admits its first batch of students in 2008
2009 Assumption Vocational Institute remodeled to form the Assumption Pathway
School (Specialised School)
2010 School of Science and Technology (SST) admits its first batch of students in 2010
Post-Secondary Education
Pre-University
1969 Introduction of junior college education 1979 Introduction of three-year Pre-University course 1987 Introduction of Centralised Institutes 1995 Phasing out of Pre-U Centres 2000 Phasing out of A-Level commerce course in Junior Colleges 2004 Introduction of Integrated Programme (IP)
Polytechnic
1954 Establishment of Singapore Polytechnic 1963 Ngee Ann College inaugurated.
Became Ngee Ann Technical College in 1968 and Ngee Ann Polytechnic in 1981
1990 Temasek Polytechnic established 1992 Nanyang Polytechnic established
2002 Republic Polytechnic established and admits its first batch of students in 2003
Institute of Technical Education
1958 Adult Education Board (AEB) established 1973 Industrial Training Board (ITB) established 1979 VITB established with the merger of AEB & ITB
57

1992 Institute of Technical Education (ITE) established as post-secondary educational
institution
University Education
1956 Nanyang University (Nantah) admitted its first batch of students 1962 University of Singapore (SU) set up after split from University of Malaya 1980 Establishment of National University of Singapore (NUS) with the merger of SU
and NU 1981 Nanyang Technological Institute (NTI) established and admits its first batch of
students in 1982 1991 Upgrading of NTI to Nanyang Technological University (NTU) 2000 Singapore Management University (SMU) incorporated
2005 Greater autonomy given to NUS, NTU and SMU 2009 Singapore Institute of Technology (SIT) established and admits its first batch of
students in 2010 2009 Singapore University of Technology and Design (SUTD) incorporated and admits
its first batch of students in 2012
58

CLASSIFICATION OF COURSES (UNIVERSITY)
1.
ACCOUNTANCY
Accountancy
2.
ARCHITECTURE &
BUILDING
Architecture Project & Facilities Management Real Estate
3.
BUSINESS &
ADMINISTRATION
Business Business Administration Business Management
4.
DENTISTRY
Dentistry
5.
EDUCATION
BA Education B.Sc. Education
6.
ENGINEERING SCIENCES
Aerospace Engineering Bioengineering Chemical & Biomolecular Engineering Chemical Engineering Civil Engineering Computer Engineering Electrical & Electronics Engineering Electrical Engineering Engineering Engineering Science Programme Environmental Engineering Industrial & Systems Engineering Materials Engineering Materials Science & Engineering Mechanical Design & Manufacturing Engineering Mechanical Engineering Renaissance Engineering
7.
FINE & APPLIED ARTS
Art, Design and Media Industrial Design Music
8.
HEALTH SCIENCES
Biomedical Sciences Nursing Pharmacy
9.
HUMANITIES & SOCIAL
SCIENCES
Arts Arts & Social Science Chinese Economics English Humanities & Social Sciences
59
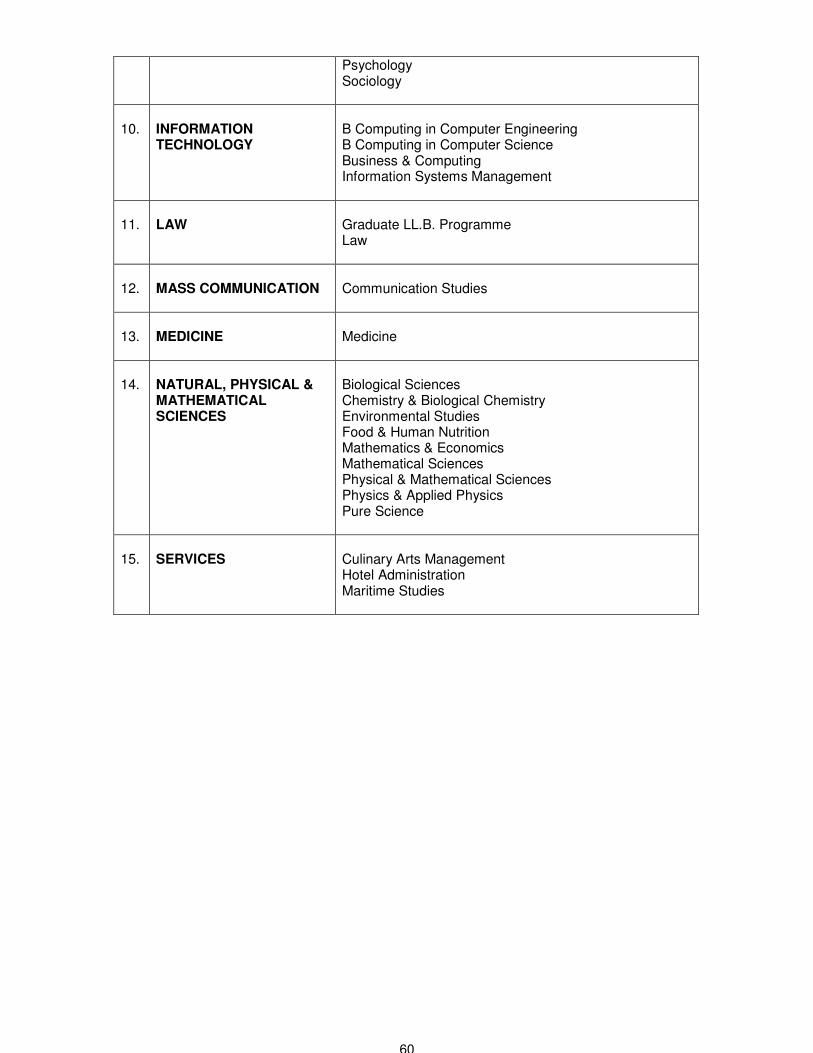
Psychology Sociology
10.
INFORMATION
TECHNOLOGY
B Computing in Computer Engineering B Computing in Computer Science Business & Computing Information Systems Management
11.
LAW
Graduate LL.B. Programme Law
12.
MASS COMMUNICATION
Communication Studies
13.
MEDICINE
Medicine
14.
NATURAL, PHYSICAL &
MATHEMATICAL
SCIENCES
Biological Sciences Chemistry & Biological Chemistry Environmental Studies Food & Human Nutrition Mathematics & Economics Mathematical Sciences Physical & Mathematical Sciences Physics & Applied Physics Pure Science
15.
SERVICES
Culinary Arts Management Hotel Administration Maritime Studies
60

CLASSIFICATION OF COURSES (POLYTECHNIC)
1.
APPLIED ARTS
Animation & 3D Arts Apparel Design & Merchandising Creative Media Design Digital Animation Digital Media Design Film, Sound & Video Games Design & Development Industrial Design Interactive Media Design Interior Architecture & Design Moving Images Music & Audio Technology New Media Product and Industrial Design Product Design & Innovation Sonic Arts Space & Interior Design Technology & Arts Management Visual Communication Visual Communication & Media Design Visual Effects & Motion Graphics
2.
ARCHITECTURE &
BUILDING
Architecture Building & Real Estate Management Building & Property Management Facilities Management for Business Hotel & Leisure Facilities Management Integrated Facility Management Integrated Facility Design & Management Landscape Architecture Landscape Design & Horticulture Property Development & Facilities Management Real Estate Business Sustainable Urban Design & Engineering
3.
BUSINESS &
ADMINISTRATION
Accountancy Accountancy & Finance Arts Business Management Banking & Financial Services Business Administration Business Management Business Studies Business/Logistics & Operations Management/Marketing Financial Services Healthcare Administration Hospitality & Tourism Integrated Events Management Leisure & Resort Management Logistic Engineering & Management Logistic Management Mass Media Management Marketing Retail Management
61

Sport & Wellness Management Sports & Leisure Management Tourism & Resort Management Wellness, Lifestyle and Spa Management
4.
EDUCATION
Early Childhood Education Early Childhood Studies
5.
ENGINEERING
SCIENCES
Aerospace Avionics Aerospace Electronics Aeronautical Engineering Aerospace Technology Aviation Management & Services Bioelectronics Biomedical Engineering Biomedical Electronics Biomedical Informatics & Engineering Business Process & Systems Engineering Chemical Engineering Chemical & Biomolecular Engineering Chemical Process Technology Chemical Technology and Instrumentation Civil & Environmental Engineering Civil & Structural Engineering Civil Aviation Civil Engineering with Business Common Engineering Programme Communications & Automation Electronics Computer & Network Technology Electronics/Telecommunications/Computer Engineering/ Microelectronics Electronic & Computer Engineering Electronics, Computer & Communication Engineering Electronics & Telecommunication Engineering Electrical Engineering Electrical & Computer Control Engineering Electrical & Electronic Engineering Engineering with Business Management Engineering Science Industrial & Operations Management Information Communication Technology Intelligent Building Technology Manufacturing Engineering Marine Engineering Marine & Offshore Technology Mechanical Engineering Automation & Mechatronic Systems (formerly known as Mechatronic Engineering) Mechatronics & Robotics Microelectronics Product Engineering Quality Management & Engineering Renewable Energy Engineering Supply Chain Management Telecommunication
62

6.
HEALTH SCIENCES
Biomedical Laboratory Technology Biomedical Science Dental Hygiene & Therapy Dental Therapy Diagnostic Radiography Health Sciences (Nursing) Medical Technology (Cardiac Technology) Nursing Occupational Therapy Optometry Pharmacy Physiotherapy Radiation Therapy Veterinary Bioscience
7.
HUMANITIES AND
SOCIAL SCIENCES
Applied Drama & Psychology Chinese Studies Gerontological Management Studies Health Management & Promotion Psychology & Community Services Psychology Studies Social Sciences (Social Work) Sports & Exercise Sciences Perfumery & Cosmetic Science
8.
INFORMATION
TECHNOLOGY
Business Applications Business Computing Business Informatics Business Information Technology Cyber & Digital Security Digital Entertainment Technology Digital Forensics Digital Media Engineering Informatics Financial Business Informatics Game & Entertainment Technology Infocomm & Network Engineering Infocomm Security Management Information Technology Information Technology Service Management Internet & Multimedia Development Internet Computing Internetworking & Communications Mobile & Network Services Mobile & Wireless Computing Multimedia & Animation Multimedia & InfoComm Technology Multimedia Computing Multimedia Software Engineering Multimedia Technology
9.
LEGAL STUDIES
Law & Management Legal Studies
63

10.
MASS
COMMUNICATION &
INFORMATION
SCIENCE
Advertising & Public Relations Chinese Media & Communication Communications & Media Management Information Management Mass Communication Media & Communication Media Studies & Management
11.
SCIENCE & RELATED
TECHNOLOGIES
Applied Chemistry with Pharmaceutical Science Applied Food Science & Nutrition Biotechnology Biotechnology/ Biomedical Science Chemical & Pharmaceutical Technology Consumer Science & Technology Food Science Food Science & Nutrition Horticulture and Landscape Management Materials Science Medicinal Chemistry Molecular Biotechnology
12.
SERVICES
Culinary & Catering Management Food & Beverage Business Maritime Business Maritime Transportation Management Nautical Studies Restaurant and Culinary Operations
64
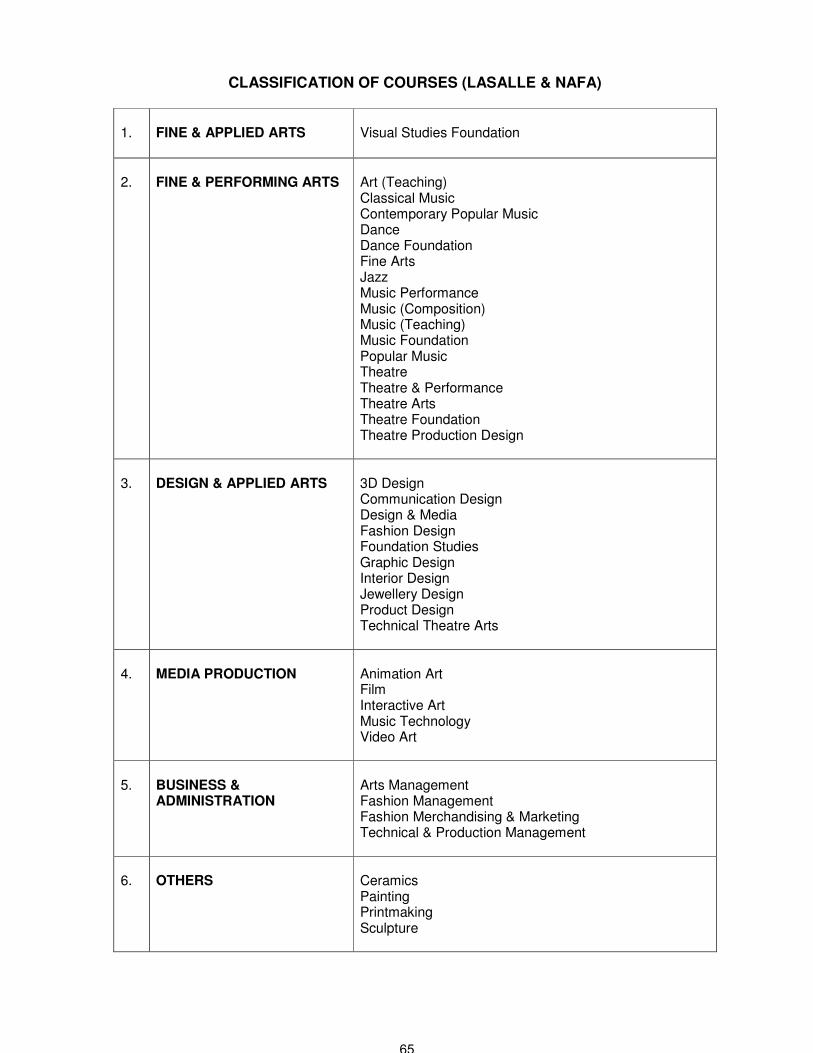
CLASSIFICATION OF COURSES (LASALLE & NAFA)
1.
FINE & APPLIED ARTS
Visual Studies Foundation
2.
FINE & PERFORMING ARTS
Art (Teaching) Classical Music Contemporary Popular Music Dance Dance Foundation Fine Arts Jazz Music Performance Music (Composition) Music (Teaching) Music Foundation Popular Music Theatre Theatre & Performance Theatre Arts Theatre Foundation Theatre Production Design
3.
DESIGN & APPLIED ARTS
3D Design Communication Design Design & Media Fashion Design Foundation Studies Graphic Design Interior Design Jewellery Design Product Design Technical Theatre Arts
4.
MEDIA PRODUCTION
Animation Art Film Interactive Art Music Technology Video Art
5.
BUSINESS &
ADMINISTRATION
Arts Management Fashion Management Fashion Merchandising & Marketing Technical & Production Management
6.
OTHERS
Ceramics Painting Printmaking Sculpture
65

CLASSIFICATION OF COURSES (ITE)
CLASSIFICATION OF DIPLOMA AND HIGHER NATIONAL ITE CERTIFICATE
(HIGHER NITEC) PROGRAMMES
1.
ENGINEERING
Technical Engineer Diploma in Machine Technology Technical Engineering Diploma in Automotive Engineering Higher Nitec in Civil & Structural Engineering Design Higher Nitec in Electrical Engineering Higher Nitec in Facility Systems Design/Process Plant Design/Offshore & Marine Engineering Design Higher Nitec in Mechatronics Engineering Higher Nitec in Mechanical & Electrical Engineering Design Higher Nitec in Mechanical Engineering Higher Nitec in Marine Offshore Engineering
2.
ELECTRONICS &
INFO-COMMUNICATIONS
TECHNOLOGY
Higher Nitec in Business Information Systems Higher Nitec in Electronics Engineering Higher Nitec in Games Design & Development Higher Nitec in Information Technology Higher Nitec in Information Systems Quality Higher Nitec in Mobile Unified Communications Higher Nitec in Network Security Technology Higher Nitec in Security System Integration Higher Nitec in Wireless Technology
3.
BUSINESS & SERVICES
Technical Diploma in Culinary Arts Higher Nitec in Accounting Higher Nitec in Business-Information Technology Higher Nitec in Banking Services Higher Nitec in Business Studies Higher Nitec in Early Childhood Education Higher Nitec in Hospitality Operations Higher Nitec in Integrated Logistics Management Higher Nitec in Leisure & Travel Operations Higher Nitec in Retail Merchandising
4.
APPLIED & HEALTH
SCIENCES
Higher Nitec in Paramedic & Emergency Care and Nursing (Dual Certification) Higher Nitec in Biochemical Technology Higher Nitec in Biotechnology Higher Nitec in Chemical Technology Higher Nitec in Paramedic & Emergency Care
5. DESIGN & MEDIA Higher Nitec in Visual Merchandising
66

CLASSIFICATION OF NATIONAL ITE CERTIFICATE (NITEC) PROGRAMMES
1.
ENGINEERING
Nitec in Aerospace Avionics Nitec in Aerospace Technology Nitec in Aerospace Machining Technology Nitec in Aerospace Machining Technology / Medical Manufacturing Technology Nitec in Automotive Technology Nitec in Building Drafting Nitec in Electrical Technology Nitec in Facility Technology Nitec in Laser & Tooling Technology Nitec in Machine Building Technology Nitec in Machine Technology / Laser Tooling Technology Nitec in Mechatronics Nitec in Medical Building Technology Nitec in Mechanical Technology Nitec in Precision Engineering Nitec in Rapid Transit Technology Nitec in Semiconductor Tooling Technology
2.
ELECTRONICS &
INFO-COMMUNICATIONS
TECHNOLOGY
Nitec in Communication Technology Nitec in Digital Audio & Video Production Nitec in Electronics Nitec in Info-Communications Technology Nitec in Multimedia Technology Nitec in Mobile Systems & Services Nitec in Security Technology
3.
DESIGN & MEDIA
Nitec in Digital Animation Nitec in Digital Media Design Nitec in Interactive Media Design Nitec in Product Design Nitec in Space Design Nitec in Visual Effect Nitec in Visual Communication
4.
BUSINESS & SERVICES
Nitec in Beauty Therapy Nitec in Community Care & Social Services Nitec in Culinary Skills (Western) Nitec in Fitness Training Nitec in Food & Beverage Operations Nitec in Hair Fashion & Design Nitec in Hair Services Nitec in Hospitality Operations Nitec in Pastry & Baking Nitec in Service Skills
67

5.
APPLIED & HEALTH
SCIENCE
Nitec in Applied Food Science Nitec in Chemical Process Technology Nitec in Nursing Nitec in Opticianry
68

Produced by Planning Division
Ministry of Education
Singapore
August 2012
ISSN 0218-1134