moisture determination of concrete panel using sar imaging
TRANSCRIPT

Construction and Building Materials 184 (2018) 351–360
Contents lists available at ScienceDirect
Construction and Building Materials
journal homepage: www.elsevier .com/locate /conbui ldmat
Moisture determination of concrete panel using SAR imagingand the K-R-I transform
https://doi.org/10.1016/j.conbuildmat.2018.06.2090950-0618/� 2018 Elsevier Ltd. All rights reserved.
⇑ Corresponding author.E-mail addresses: [email protected] (A. Alzeyadi), Tzuyang_yu
@uml.edu (T. Yu).
Ahmed Alzeyadi, Tzuyang Yu ⇑Department of Civil and Environmental Engineering, University of Massachusetts Lowell, One University Avenue, Lowell, MA 01854, USA
h i g h l i g h t s
� Preparing concrete specimens atdifferent levels of moisture content.
� Imaging concrete specimens withsynthetic aperture radar usingmicrowave.
� Tests include air-drying and ovenheating of Portland cement concretespecimen.
� Analyzing radar images to extractlocal and global features forsubsurface moisture determination inconcrete.
� Developing quantitative models fromradar images for predicting moisturecontent inside concrete.
g r a p h i c a l a b s t r a c t
a r t i c l e i n f o
Article history:Received 31 January 2018Received in revised form 6 June 2018Accepted 26 June 2018
Keywords:Moisture contentConcreteImaging radarSynthetic aperture radarAir-drying
a b s t r a c t
Moisture content inside concrete affects the properties and behaviors of Portland cement concrete. It alsoindicates the likelihood of structural damages (e.g., steel corrosion) in reinforced and prestressed concretestructures. While several laboratory techniques are available for moisture determination, it is a challeng-ing task to estimate the moisture content of concrete in the field without using embedded moisture sen-sors. In this paper, synthetic aperture radar (SAR) imaging and the K-R-I (curvature-area-amplitude)transform were applied to a concrete panel specimen (water-to-cement ratio = 0.45) for moisturedetermination. A 10.5 GHz center frequency radar systemwas used to generate SAR images of the concretepanel at various moisture levels from 0% to 3.85% (by mass). Quantitative analysis of SAR images wascarried out by the K-R-I transform to understand the simultaneous change of SAR amplitude and shapeat different moisture levels. It was found that integrated SAR amplitude and average maximum SARamplitude both increase nonlinearly with the increase of moisture content in the concrete panel.Spatial distribution of SAR amplitudes can be used to indicate subsurface moisture distribution in con-crete. The area-amplitude (R-I) curve of SAR images quantifies the relationship between moisture contentand its distribution.
� 2018 Elsevier Ltd. All rights reserved.
1. Introduction
Moisture content inside Portland cement concrete is instrumen-tal to predicting the short-term strength development (cementhydration) and long-term durability performance of concrete(reinforced and prestressed) structures, as well as to detecting
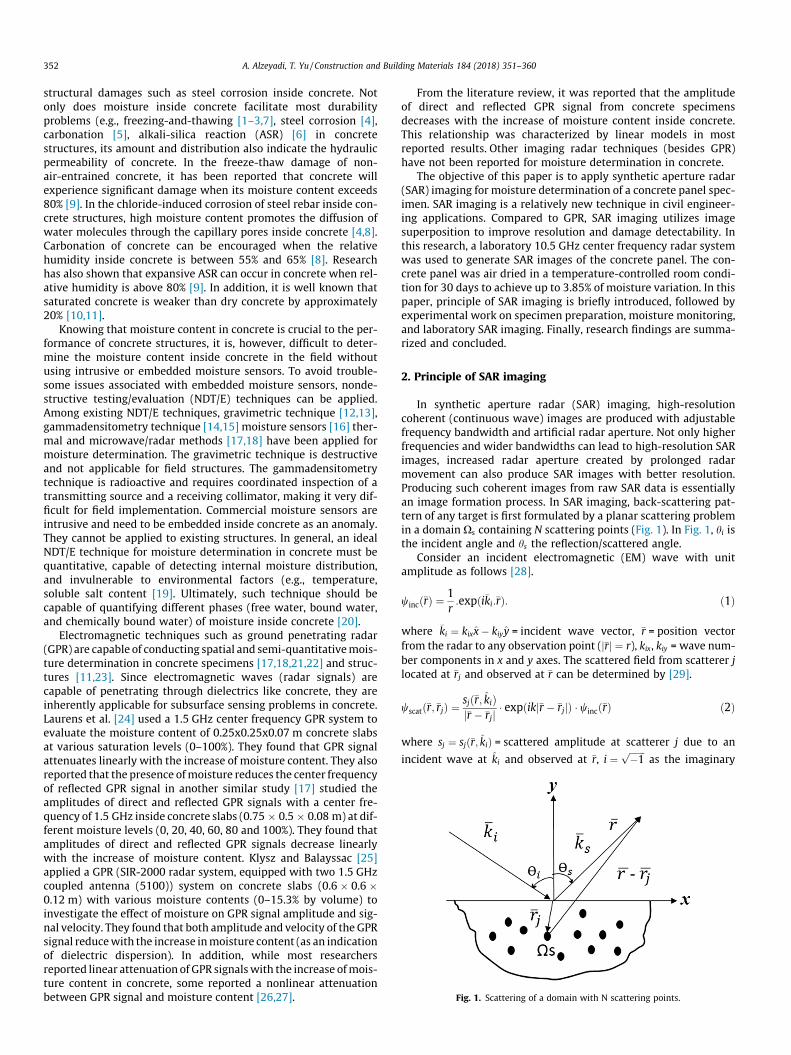
Fig. 1. Scattering of a domain with N scattering points.
352 A. Alzeyadi, T. Yu / Construction and Building Materials 184 (2018) 351–360
structural damages such as steel corrosion inside concrete. Notonly does moisture inside concrete facilitate most durabilityproblems (e.g., freezing-and-thawing [1–3,7], steel corrosion [4],carbonation [5], alkali-silica reaction (ASR) [6] in concretestructures, its amount and distribution also indicate the hydraulicpermeability of concrete. In the freeze-thaw damage of non-air-entrained concrete, it has been reported that concrete willexperience significant damage when its moisture content exceeds80% [9]. In the chloride-induced corrosion of steel rebar inside con-crete structures, high moisture content promotes the diffusion ofwater molecules through the capillary pores inside concrete [4,8].Carbonation of concrete can be encouraged when the relativehumidity inside concrete is between 55% and 65% [8]. Researchhas also shown that expansive ASR can occur in concrete when rel-ative humidity is above 80% [9]. In addition, it is well known thatsaturated concrete is weaker than dry concrete by approximately20% [10,11].
Knowing that moisture content in concrete is crucial to the per-formance of concrete structures, it is, however, difficult to deter-mine the moisture content inside concrete in the field withoutusing intrusive or embedded moisture sensors. To avoid trouble-some issues associated with embedded moisture sensors, nonde-structive testing/evaluation (NDT/E) techniques can be applied.Among existing NDT/E techniques, gravimetric technique [12,13],gammadensitometry technique [14,15] moisture sensors [16] ther-mal and microwave/radar methods [17,18] have been applied formoisture determination. The gravimetric technique is destructiveand not applicable for field structures. The gammadensitometrytechnique is radioactive and requires coordinated inspection of atransmitting source and a receiving collimator, making it very dif-ficult for field implementation. Commercial moisture sensors areintrusive and need to be embedded inside concrete as an anomaly.They cannot be applied to existing structures. In general, an idealNDT/E technique for moisture determination in concrete must bequantitative, capable of detecting internal moisture distribution,and invulnerable to environmental factors (e.g., temperature,soluble salt content [19]. Ultimately, such technique should becapable of quantifying different phases (free water, bound water,and chemically bound water) of moisture inside concrete [20].
Electromagnetic techniques such as ground penetrating radar(GPR) are capable of conducting spatial and semi-quantitativemois-ture determination in concrete specimens [17,18,21,22] and struc-tures [11,23]. Since electromagnetic waves (radar signals) arecapable of penetrating through dielectrics like concrete, they areinherently applicable for subsurface sensing problems in concrete.Laurens et al. [24] used a 1.5 GHz center frequency GPR system toevaluate the moisture content of 0.25x0.25x0.07 m concrete slabsat various saturation levels (0–100%). They found that GPR signalattenuates linearly with the increase of moisture content. They alsoreported that the presence ofmoisture reduces the center frequencyof reflected GPR signal in another similar study [17] studied theamplitudes of direct and reflected GPR signals with a center fre-quency of 1.5 GHz inside concrete slabs (0.75 � 0.5 � 0.08 m) at dif-ferent moisture levels (0, 20, 40, 60, 80 and 100%). They found thatamplitudes of direct and reflected GPR signals decrease linearlywith the increase of moisture content. Klysz and Balayssac [25]applied a GPR (SIR-2000 radar system, equipped with two 1.5 GHzcoupled antenna (5100)) system on concrete slabs (0.6 � 0.6 �0.12 m) with various moisture contents (0–15.3% by volume) toinvestigate the effect of moisture on GPR signal amplitude and sig-nal velocity. They found that both amplitude and velocity of the GPRsignal reducewith the increase inmoisture content (as an indicationof dielectric dispersion). In addition, while most researchersreported linear attenuation of GPR signalswith the increase ofmois-ture content in concrete, some reported a nonlinear attenuationbetween GPR signal and moisture content [26,27].
From the literature review, it was reported that the amplitudeof direct and reflected GPR signal from concrete specimensdecreases with the increase of moisture content inside concrete.This relationship was characterized by linear models in mostreported results. Other imaging radar techniques (besides GPR)have not been reported for moisture determination in concrete.
The objective of this paper is to apply synthetic aperture radar(SAR) imaging for moisture determination of a concrete panel spec-imen. SAR imaging is a relatively new technique in civil engineer-ing applications. Compared to GPR, SAR imaging utilizes imagesuperposition to improve resolution and damage detectability. Inthis research, a laboratory 10.5 GHz center frequency radar systemwas used to generate SAR images of the concrete panel. The con-crete panel was air dried in a temperature-controlled room condi-tion for 30 days to achieve up to 3.85% of moisture variation. In thispaper, principle of SAR imaging is briefly introduced, followed byexperimental work on specimen preparation, moisture monitoring,and laboratory SAR imaging. Finally, research findings are summa-rized and concluded.
2. Principle of SAR imaging
In synthetic aperture radar (SAR) imaging, high-resolutioncoherent (continuous wave) images are produced with adjustablefrequency bandwidth and artificial radar aperture. Not only higherfrequencies and wider bandwidths can lead to high-resolution SARimages, increased radar aperture created by prolonged radarmovement can also produce SAR images with better resolution.Producing such coherent images from raw SAR data is essentiallyan image formation process. In SAR imaging, back-scattering pat-tern of any target is first formulated by a planar scattering problemin a domain Xs containing N scattering points (Fig. 1). In Fig. 1, hi isthe incident angle and hs the reflection/scattered angle.
Consider an incident electromagnetic (EM) wave with unitamplitude as follows [28].
wincð�rÞ ¼1r:expði�ki:�rÞ: ð1Þ
where �ki ¼ kixx� kiyy = incident wave vector, �r = position vectorfrom the radar to any observation point (j�rj ¼ r), kix, kiy = wave num-ber components in x and y axes. The scattered field from scatterer jlocated at �rj and observed at �r can be determined by [29].
wscatð�r;�rjÞ ¼sjð�r; kiÞj�r � �rjj � expðikj
�r � �rjjÞ � wincð�rÞ ð2Þ
where sj ¼ sjð�r; kiÞ = scattered amplitude at scatterer j due to an
incident wave at ki and observed at �r, i ¼ffiffiffiffiffiffiffi�1
pas the imaginary

Fig. 2. Backprojection algorithm processing steps.
A. Alzeyadi, T. Yu / Construction and Building Materials 184 (2018) 351–360 353
number, k ¼ x=c as the wave number, x = incident frequency, andc ffi 2:998� 108 = speed of EM waves (c ffi 2:998� 108 m/s in freespace). Should we neglect the higher order scattering (scatteredfields due to multiple reflections) among scatterers in this formula-tion, the total scattered field from N scatterers observed at �r is thesummation of all the scattered fields as
wscatð�rÞ ¼XNj¼1
sjð�r; kiÞj�r � �rjj � expðikj
�r � �rjjÞ � wincð�rÞ ð3Þ
where �ks ¼ ksxxþ ksyy = scattering direction vector, and �ks ¼ ��kiwhen the radar operates in monostatic mode. Considering the caseof a single scattererwithout losing generality, Eq. (3) can bewritten as
wscatðx; hÞ ¼ wscatðk;�rsÞ ¼shr2
:exp ircxð1þ cos2 h� sin2 hÞ
h ið4Þ
where h ¼ hi ¼ tan�1ðkiy=kixÞ. Eq. (4) is obtained by taking a slice ofthe two-dimensional (2-D) Fourier transform (FT) of domain Xs. Inbackprojection algorithms, 1-D IFT is first performed to generatesub-images, following by image superposition to result in a finalSAR image. A frequency modulation operator (or time-domain con-volution operator) is applied to ensure that the center in backpro-jection images coincides with the center of the target. Afrequency domain shifting-back step is carried out in backprojec-tion algorithms by applying a ramp filter in which frequency xn
is shifted back by a carrier frequency xc.
Pðm; hÞ ¼Z xmax
xmin
dx:wscatðx�xc; hÞjx�xcj:expð�ixmÞ
¼ shr2
:
Z xmax
xmin
dx:jx
�xcj:exp ircðx�xcÞ � ð1þ cos2 h� sin2 hÞ � ixm
h ið5Þ
where m = spatial variable of the 1-D IFT projection. Translating local1-D IFT coordinates ½m; Pðm; hsÞ� to global polar coordinates ðr;/Þindicates that
m ¼ rcosð/� hsÞ ð6ÞIn this coordinate transformation, upsampling is commonly
required to ensure the quality of backprojection images. In otherwords, P½rcosð/� hÞ; h� is obtained by interpolating Pðm; hÞ. In thepolar coordinate system, a backprojection image is finally obtainedby integrating sub-images at various azimuth angles over theentire inspection range (synthetic aperture).
Iðr;/Þ¼Z hint=2
�hint=2
dh:Pðrcosð/�hÞ;hÞ
¼ shr2:
Z hint=2
�hint=2
dhZ xmax
xmin
dx:jx
�xcj:exp ircðx�xcÞð1þcos2 h�sin2 hÞ� ixrcosð/�hsÞ
h i:
ð7Þ
where the polar coordinates ðr;/Þ are related to the Cartesian coor-dinates ðx; yÞ by
x ¼ rcos/: ð8Þ
Table 1Mix design of concrete.
Cement (kg/m3) Sand (kg/m3) Aggregate (kg/m3) Water (kg/m3)
300 600 1200 135
y ¼ rsin/: ð9ÞBy doing so, the image plane Iðx; yÞ ¼ Iðrcos/; rsin/Þ can be
reconstructed. Fig. 2 illustrates the key processing step of the back-projection algorithm adopted in this research.
3. Experimental work
3.1. Specimen preparation
A concrete panel specimen (0.3 � 0.3 � 0.05 m) was manufac-tured for characterizing moisture variation in concrete. Type I/IIPortland cement was used. The mix design ratio of concrete panelwas 0.45:1:2:4 (by weight) for water: cement: sand: aggregate.The concrete panel was moist cured for 28 days before it was leftin a room condition environment (temperature = 25.8 ± 1.07 �C,relative humidity = 16.5 ± 6.08%) for air-drying. After approxi-mately five months of air-drying, the concrete panel was ovenheated at 80 �C for thirty days. Table 1 shows the mix design pro-portions of concrete. Fig. 3 provides a picture of the concrete paneland its dimensions.
3.2. Moisture monitoring
In this research, change of moisture content in concrete overtime was measured by monitoring the mass of concrete panel atdifferent stages of air-drying. An electronic scale (Model: V11P15by Ohaus Corp.) with ±1 gm accuracy was used for measuringthe mass of concrete panel for approximately five months. Themoisture content of concrete panel was calculated by the followingequation.
wðtÞ ¼ mwðtÞ �md
md
� �� 100% ð10Þ
where wðtÞ = moisture content at time t (%), mwðtÞ = mass of con-crete panel at a given air-drying time t (g), and md = oven-heatedmass of concrete panel (g). The concrete panel was oven-heatedat 80 �C for thirty days until the mas stabilized in the end of themoisture measuring period. An electronic oven (Model: BLUE Mby Electric Company) in Geotechnical Laboratory in Departmentof Civil and Environmental Engineering at UMass Lowell was usedto produce the oven-heated concrete panel. The reason for choosinga relatively low temperature (80 �C) was to avoid concrete crackingdue to excessive internal thermal stress. The oven-heated mass md
was assumed to be the zero-moisture mass of concrete, for onlycapillary and pore water was considered for moisture determina-tion in this research.
3.3. Synthetic aperture radar imaging
Synthetic aperture radar (SAR) imaging of the concrete panel atdifferent moisture contents was performed by using a 10.5 GHzcenter frequency continuous wave imaging radar (CWIR) system
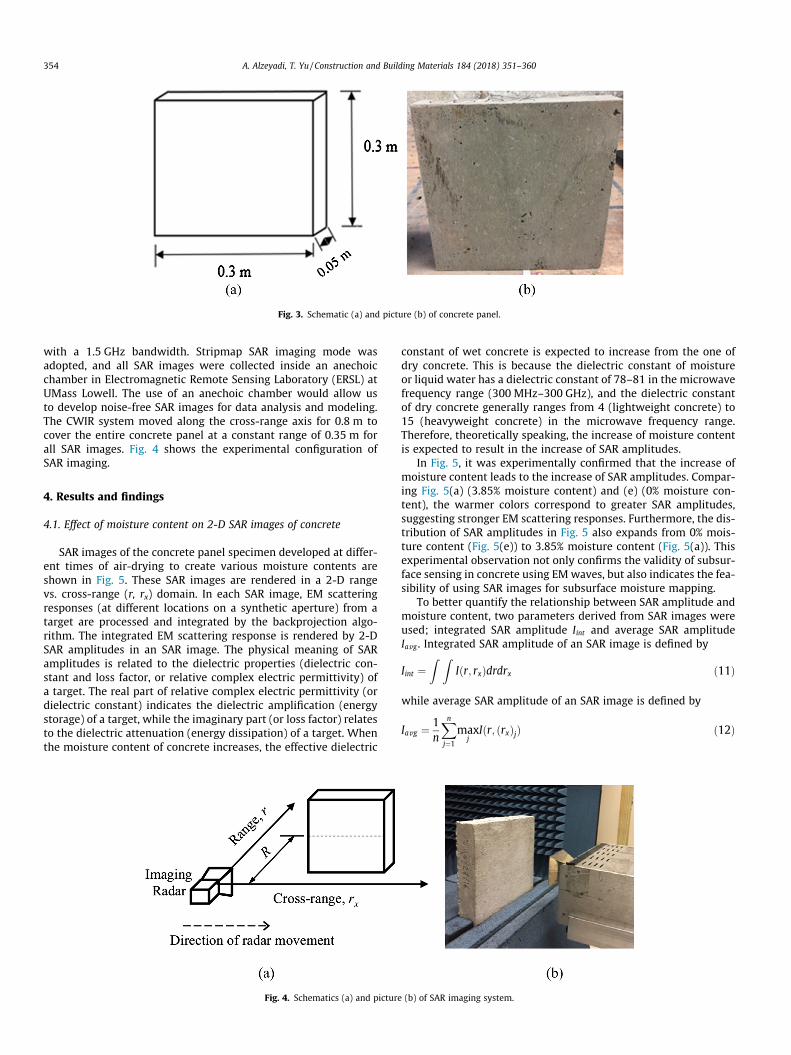
Fig. 3. Schematic (a) and picture (b) of concrete panel.
354 A. Alzeyadi, T. Yu / Construction and Building Materials 184 (2018) 351–360
with a 1.5 GHz bandwidth. Stripmap SAR imaging mode wasadopted, and all SAR images were collected inside an anechoicchamber in Electromagnetic Remote Sensing Laboratory (ERSL) atUMass Lowell. The use of an anechoic chamber would allow usto develop noise-free SAR images for data analysis and modeling.The CWIR system moved along the cross-range axis for 0.8 m tocover the entire concrete panel at a constant range of 0.35 m forall SAR images. Fig. 4 shows the experimental configuration ofSAR imaging.
4. Results and findings
4.1. Effect of moisture content on 2-D SAR images of concrete
SAR images of the concrete panel specimen developed at differ-ent times of air-drying to create various moisture contents areshown in Fig. 5. These SAR images are rendered in a 2-D rangevs. cross-range (r, rx) domain. In each SAR image, EM scatteringresponses (at different locations on a synthetic aperture) from atarget are processed and integrated by the backprojection algo-rithm. The integrated EM scattering response is rendered by 2-DSAR amplitudes in an SAR image. The physical meaning of SARamplitudes is related to the dielectric properties (dielectric con-stant and loss factor, or relative complex electric permittivity) ofa target. The real part of relative complex electric permittivity (ordielectric constant) indicates the dielectric amplification (energystorage) of a target, while the imaginary part (or loss factor) relatesto the dielectric attenuation (energy dissipation) of a target. Whenthe moisture content of concrete increases, the effective dielectric
Fig. 4. Schematics (a) and picture
constant of wet concrete is expected to increase from the one ofdry concrete. This is because the dielectric constant of moistureor liquid water has a dielectric constant of 78–81 in the microwavefrequency range (300 MHz–300 GHz), and the dielectric constantof dry concrete generally ranges from 4 (lightweight concrete) to15 (heavyweight concrete) in the microwave frequency range.Therefore, theoretically speaking, the increase of moisture contentis expected to result in the increase of SAR amplitudes.
In Fig. 5, it was experimentally confirmed that the increase ofmoisture content leads to the increase of SAR amplitudes. Compar-ing Fig. 5(a) (3.85% moisture content) and (e) (0% moisture con-tent), the warmer colors correspond to greater SAR amplitudes,suggesting stronger EM scattering responses. Furthermore, the dis-tribution of SAR amplitudes in Fig. 5 also expands from 0% mois-ture content (Fig. 5(e)) to 3.85% moisture content (Fig. 5(a)). Thisexperimental observation not only confirms the validity of subsur-face sensing in concrete using EMwaves, but also indicates the fea-sibility of using SAR images for subsurface moisture mapping.
To better quantify the relationship between SAR amplitude andmoisture content, two parameters derived from SAR images wereused; integrated SAR amplitude Iint and average SAR amplitudeIavg . Integrated SAR amplitude of an SAR image is defined by
Iint ¼Z Z
Iðr; rxÞdrdrx ð11Þ
while average SAR amplitude of an SAR image is defined by
Iavg ¼ 1n
Xnj¼1
maxj
Iðr; ðrxÞjÞ ð12Þ
(b) of SAR imaging system.

Fig. 6. Integrated SAR amplitude vs. moisture content.
Fig. 7. Average maximum SAR amplitude vs. moisture content.
Fig. 5. SAR images of concrete panel at different moisture contents (w = moisture content).
A. Alzeyadi, T. Yu / Construction and Building Materials 184 (2018) 351–360 355
where n = number of cross-range values for averaging local maxi-mum SAR amplitudes. With Eqs. (11) and (12), Iint and Iavg valuesof SAR images of concrete with different moisture contents werecalculated as shown in Figs. 6 and 7.
In Figs. 6 and 7, it was found that the increase of moisture con-tent of concrete leads to a nonlinear increase of both Iint and Iavg .
Consequently, predictive models were developed from Figs. 6 and7, as shown in the following.
IintðwÞ ¼ a1eb1w þ c1 ð13Þ
where IintðwÞ = integrated SAR amplitude with moisturecontent w, w = moisture content (%), a1, b1, and c1 = model constants

356 A. Alzeyadi, T. Yu / Construction and Building Materials 184 (2018) 351–360
(a1 = 1.525e5, b1 = 0.5585, c1 = 9.303e5). The R2 value of the modelin Fig. 6 was 0.986.
IavgðwÞ ¼ a2eb2w þ c2 ð14Þwhere IavgðwÞ = average maximum SAR amplitude with moisturecontent w, a2, b2, and c2 = constants (a2 = 67.85, b2 = 0.5289, c2 =692.3). The R2value of the model in Fig. 7 was 0.985. Since ourobjective was to determine moisture content w, Eqs. (13) and (14)were converted into Eqs. (15) and (16), respectively.
westðIintÞ ¼1b1
logIint � c1
a1
� �ð15Þ
westðIavgÞ ¼1b2
logIavg � c2
a2
� �ð16Þ
where westðIintÞ = estimated moisture content (%) using integratedSAR amplitude Iint , and wðIavgÞ = estimated moisture content (%)using average maximum SAR amplitude Iavg . Eqs. (15) and (16)represent two models for estimating moisture content inside aconcrete panel.
(a) 2-D SAR image
Fig. 8. 2-D SAR image and 1-D SA
(a) 2-D SAR imageFig. 9. 2-D SAR image and 1-D SAR
4.2. Effect of moisture content on subsurface SAR amplitudes
Since the nature of 2-D SAR images enables researchers toexplore the subsurface condition of a target, it is important to knowhow SAR amplitudes attenuate in the subsurface region of a target.To achieve the goal, 1-D SAR curves were extracted from the SARimages in this paper for better analysis. Figs. 8 and 9 provide twoexamples of extracting 1-D SAR curves from their 2-D images.
In Fig. 8(b), the maximum SAR amplitude (the first peak) indi-cates the backprojected location of the front side of concrete panelat w = 0% moisture content. This maximum SAR amplitude locatesat 35 cm range. A second peak is found at 47.5 cm range, indicatingthe subsurface reflection from the backside of concrete panel.
When moisture content was increased from w = 0% to w = 3.85%,the second peak disappeared (Fig. 9(b). This result was expectedbecause the presence of moisture not only can enhance the dielec-tric significance (real part or dielectric constant) but also canamplify the dielectric attenuation (imaginary part or loss factor)of concrete (wet concrete is more lossy or conductive than dryconcrete). As a result, no subsurface SAR amplitude representingthe backside reflection can be found in Fig. 9(b), due to signal
(b) 1-D SAR curve at A-A
R curve of concrete at w = 0%.
(b) 1-D SAR curve at B-Bcurve of concrete at w = 3.85%.
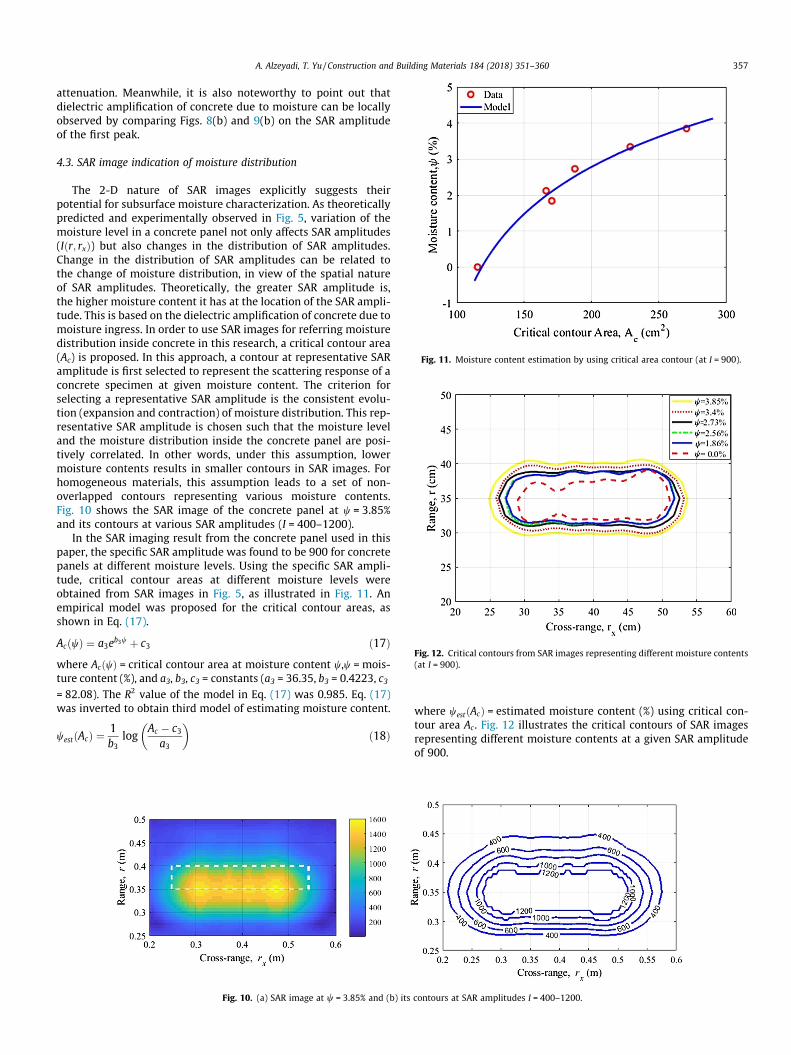
Fig. 11. Moisture content estimation by using critical area contour (at I = 900).
Fig. 12. Critical contours from SAR images representing different moisture contents(at I = 900).
A. Alzeyadi, T. Yu / Construction and Building Materials 184 (2018) 351–360 357
attenuation. Meanwhile, it is also noteworthy to point out thatdielectric amplification of concrete due to moisture can be locallyobserved by comparing Figs. 8(b) and 9(b) on the SAR amplitudeof the first peak.
4.3. SAR image indication of moisture distribution
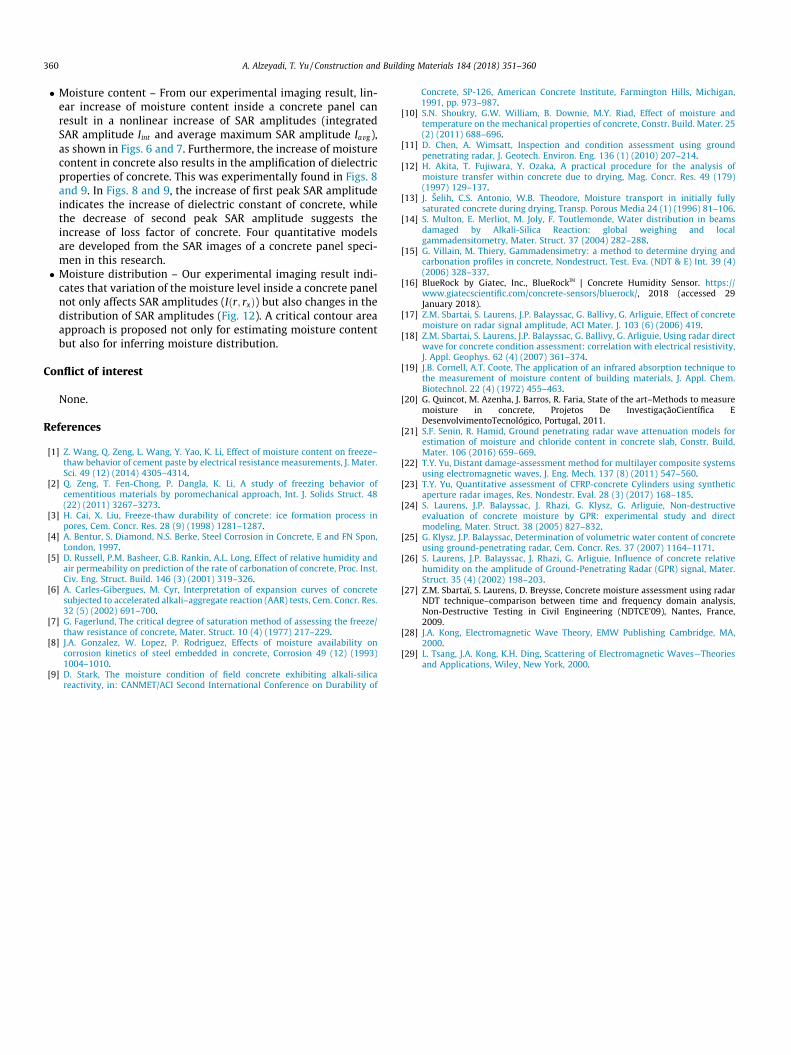
The 2-D nature of SAR images explicitly suggests theirpotential for subsurface moisture characterization. As theoreticallypredicted and experimentally observed in Fig. 5, variation of themoisture level in a concrete panel not only affects SAR amplitudes(Iðr; rxÞ) but also changes in the distribution of SAR amplitudes.Change in the distribution of SAR amplitudes can be related tothe change of moisture distribution, in view of the spatial natureof SAR amplitudes. Theoretically, the greater SAR amplitude is,the higher moisture content it has at the location of the SAR ampli-tude. This is based on the dielectric amplification of concrete due tomoisture ingress. In order to use SAR images for referring moisturedistribution inside concrete in this research, a critical contour area(Ac) is proposed. In this approach, a contour at representative SARamplitude is first selected to represent the scattering response of aconcrete specimen at given moisture content. The criterion forselecting a representative SAR amplitude is the consistent evolu-tion (expansion and contraction) of moisture distribution. This rep-resentative SAR amplitude is chosen such that the moisture leveland the moisture distribution inside the concrete panel are posi-tively correlated. In other words, under this assumption, lowermoisture contents results in smaller contours in SAR images. Forhomogeneous materials, this assumption leads to a set of non-overlapped contours representing various moisture contents.Fig. 10 shows the SAR image of the concrete panel at w = 3.85%and its contours at various SAR amplitudes (I = 400–1200).
In the SAR imaging result from the concrete panel used in thispaper, the specific SAR amplitude was found to be 900 for concretepanels at different moisture levels. Using the specific SAR ampli-tude, critical contour areas at different moisture levels wereobtained from SAR images in Fig. 5, as illustrated in Fig. 11. Anempirical model was proposed for the critical contour areas, asshown in Eq. (17).
AcðwÞ ¼ a3eb3w þ c3 ð17Þwhere AcðwÞ = critical contour area at moisture content w,w = mois-ture content (%), and a3, b3, c3 = constants (a3 = 36.35, b3 = 0.4223, c3= 82.08). The R2 value of the model in Eq. (17) was 0.985. Eq. (17)was inverted to obtain third model of estimating moisture content.
westðAcÞ ¼ 1b3
logAc � c3
a3
� �ð18Þ
Fig. 10. (a) SAR image at w = 3.85% and (b) its
where westðAcÞ = estimated moisture content (%) using critical con-tour area Ac . Fig. 12 illustrates the critical contours of SAR imagesrepresenting different moisture contents at a given SAR amplitudeof 900.
contours at SAR amplitudes I = 400–1200.

Table 2Four models for estimating moisture content inside concrete.
SAR para Model Coefficients R2
Iint wðIintÞ ¼ 1b1log Iint�c1
a1
� �a1 = 1.525e+05 b1 = 0.5585 c1 = 9.303e+05 0.986
Iavg wðIavgÞ ¼ 1b2þ
log Iavg�ca
� �a2 = 67.85 b2 = 0.5289 c2 = 692.3 0.985
Ac wðAcÞ ¼ 1b log
Ac�ca
� �a3 = 36.35 b3 = 0.4223 c3 = 82.08 0.985
ð dIdRA
Þ w dIdRA
� �¼ p1
dIdRA
þ p2p1 = 0.003311 p2 = �0.4738. 0.989
358 A. Alzeyadi, T. Yu / Construction and Building Materials 184 (2018) 351–360
4.4. K-R-I curves of SAR images
In addition to three models in Table 2, another approach appliedto analyze SAR images in this paper is the K-R-I transform. The con-cept of the K-R-I transform is to simultaneously investigate curva-ture (K), area ratio (R), and amplitude (I) of a SAR image in order tobetter reveal the features of SAR images. The use of curvature K(average Gaussian curvature) to analyze SAR images is to quantifythe shape change of contours. Area ratio R is computed for eachcontour in order to quantify both specimen size and scatteringeffect (materials with higher dielectric constants produce greatercontours). Amplitude I is used as a reference index to register eachset of curvature and area ratio or (K, R). Furthermore, the K-R-Itransform eliminates the requirements (e.g., orientation, resolu-tion) in the direct comparison of two SAR images, enabling us toanalyze SAR images beyond the limitation of baseline approachfor condition assessment. Detail information about the K-R-I trans-form can be found in [23]. Figs. 13 and 14 show two K-R-I curvesand their corresponding SAR images of a concrete panel with twodifferent moisture contents.
While the K-R-I curves in Figs. 13(b) and 14(b) could be quan-titatively compared by coefficient of correlation for moisture con-tent difference, the curvature feature of SAR images did notdemonstrate distinctive variation from 0.0% moisture content to
Fig. 13. K-R-I curve of a SAR image of co
3.8% moisture content. This was because the contour shapes ofSAR images representing different moisture contents are similaras shown in Fig. 12. In order to develop quantitative models forpredicting moisture content of concrete, R-I curves of SAR imageswere used for modeling. Fig. 15 compares R-I curves of SAR imagesrepresenting a concrete panel with different moisture contentsfrom 0% to 3.85%.
In Fig. 15, it was found that the slope of R-I curves of a SARimage representing higher moisture contents is greater than theone of R-I curves of a SAR image representing lower moisture con-tents. This pattern held true for all moisture contents except for w= 1.84%. Slopes of R-I curves in Fig. 15 were calculated, as shown inFig. 16. The moisture content prediction model using the slope ofR-I curves was proposed in Eq. (19).
westdIdRA
� �¼ p1
dIdRA
þ p2 ð19Þ
where westð dIdRA
Þ = estimated moisture content (%), dIdRA
= slope of R-I
curves at different moisture contents, p1 = 0.003311, and p2 =�0.4738. The R2 of the model (Eq. (19)) was 0.989.
In Fig. 16, it was found that the slopes of R-I curves representingmoisture contents 2.12%, 2.73%, 3.4% and 3.85% follow a linear
ncrete – moisture content w = 3.85%.

Fig. 14. K-R-I curve of a SAR image of concrete – moisture content w = 0%.
Fig. 15. R-I curves of SAR images – w = 0%–3.85%Fig. 16. Slopes of R-I curves representing different moisture contents (w = 0%–3.85%).
A. Alzeyadi, T. Yu / Construction and Building Materials 184 (2018) 351–360 359
pattern, except the one of 0% moisture content. This was becausethe 0% moisture content of concrete was achieved by oven-heating, while all other moisture contents were achieved by air-drying. The oven-heated state (w = 0%) of the concrete panel wascreated by introducing an internal high pore pressure (due to ther-mal expansion) inside concrete, in which the rheological profile ofsome gel pores (micropores) and capillary pores (large mesopores)has been changed. On the other hand, air-drying of the concretepanel was driven by moisture diffusion in which the rheologicalprofile of all pores (gel and capillary) remains unchanged. This dif-ference explained why the oven-heating point does not follow thetrend of other air-drying points in Fig. 16. Eq. (19) represents thefourth model for moisture content estimation of concrete. All threemodels for estimating moisture content are summarized in Table 2.
5. Conclusion
This paper presents an approach to quantitatively analyze SARimages of concrete for moisture characterization, by investigatingthe use of SAR (synthetic aperture radar) imaging for moisture con-tent inside a concrete panel specimen. A 10.5 GHz continuouswave imaging radar system with 1.5 GHz bandwidth was appliedin this research. The SAR images generated in stripmap imagingmode from a concrete panel with moisture content ranging from0% to 3.85% were used in developing quantitative models forinternal moisture characterization. Major research findings areconcluded in the following.
360 A. Alzeyadi, T. Yu / Construction and Building Materials 184 (2018) 351–360
� Moisture content – From our experimental imaging result, lin-ear increase of moisture content inside a concrete panel canresult in a nonlinear increase of SAR amplitudes (integratedSAR amplitude Iint and average maximum SAR amplitude Iavg),as shown in Figs. 6 and 7. Furthermore, the increase of moisturecontent in concrete also results in the amplification of dielectricproperties of concrete. This was experimentally found in Figs. 8and 9. In Figs. 8 and 9, the increase of first peak SAR amplitudeindicates the increase of dielectric constant of concrete, whilethe decrease of second peak SAR amplitude suggests theincrease of loss factor of concrete. Four quantitative modelsare developed from the SAR images of a concrete panel speci-men in this research.
� Moisture distribution – Our experimental imaging result indi-cates that variation of the moisture level inside a concrete panelnot only affects SAR amplitudes (Iðr; rxÞ) but also changes in thedistribution of SAR amplitudes (Fig. 12). A critical contour areaapproach is proposed not only for estimating moisture contentbut also for inferring moisture distribution.
Conflict of interest
None.
References
[1] Z. Wang, Q. Zeng, L. Wang, Y. Yao, K. Li, Effect of moisture content on freeze–thaw behavior of cement paste by electrical resistance measurements, J. Mater.Sci. 49 (12) (2014) 4305–4314.
[2] Q. Zeng, T. Fen-Chong, P. Dangla, K. Li, A study of freezing behavior ofcementitious materials by poromechanical approach, Int. J. Solids Struct. 48(22) (2011) 3267–3273.
[3] H. Cai, X. Liu, Freeze-thaw durability of concrete: ice formation process inpores, Cem. Concr. Res. 28 (9) (1998) 1281–1287.
[4] A. Bentur, S. Diamond, N.S. Berke, Steel Corrosion in Concrete, E and FN Spon,London, 1997.
[5] D. Russell, P.M. Basheer, G.B. Rankin, A.L. Long, Effect of relative humidity andair permeability on prediction of the rate of carbonation of concrete, Proc. Inst.Civ. Eng. Struct. Build. 146 (3) (2001) 319–326.
[6] A. Carles-Gibergues, M. Cyr, Interpretation of expansion curves of concretesubjected to accelerated alkali–aggregate reaction (AAR) tests, Cem. Concr. Res.32 (5) (2002) 691–700.
[7] G. Fagerlund, The critical degree of saturation method of assessing the freeze/thaw resistance of concrete, Mater. Struct. 10 (4) (1977) 217–229.
[8] J.A. Gonzalez, W. Lopez, P. Rodriguez, Effects of moisture availability oncorrosion kinetics of steel embedded in concrete, Corrosion 49 (12) (1993)1004–1010.
[9] D. Stark, The moisture condition of field concrete exhibiting alkali-silicareactivity, in: CANMET/ACI Second International Conference on Durability of
Concrete, SP-126, American Concrete Institute, Farmington Hills, Michigan,1991, pp. 973–987.
[10] S.N. Shoukry, G.W. William, B. Downie, M.Y. Riad, Effect of moisture andtemperature on the mechanical properties of concrete, Constr. Build. Mater. 25(2) (2011) 688–696.
[11] D. Chen, A. Wimsatt, Inspection and condition assessment using groundpenetrating radar, J. Geotech. Environ. Eng. 136 (1) (2010) 207–214.
[12] H. Akita, T. Fujiwara, Y. Ozaka, A practical procedure for the analysis ofmoisture transfer within concrete due to drying, Mag. Concr. Res. 49 (179)(1997) 129–137.
[13] J. Šelih, C.S. Antonio, W.B. Theodore, Moisture transport in initially fullysaturated concrete during drying, Transp. Porous Media 24 (1) (1996) 81–106.
[14] S. Multon, E. Merliot, M. Joly, F. Toutlemonde, Water distribution in beamsdamaged by Alkali-Silica Reaction: global weighing and localgammadensitometry, Mater. Struct. 37 (2004) 282–288.
[15] G. Villain, M. Thiery, Gammadensimetry: a method to determine drying andcarbonation profiles in concrete, Nondestruct. Test. Eva. (NDT & E) Int. 39 (4)(2006) 328–337.
[16] BlueRock by Giatec, Inc., BlueRockTM | Concrete Humidity Sensor. https://www.giatecscientific.com/concrete-sensors/bluerock/, 2018 (accessed 29January 2018).
[17] Z.M. Sbartai, S. Laurens, J.P. Balayssac, G. Ballivy, G. Arliguie, Effect of concretemoisture on radar signal amplitude, ACI Mater. J. 103 (6) (2006) 419.
[18] Z.M. Sbartai, S. Laurens, J.P. Balayssac, G. Ballivy, G. Arliguie, Using radar directwave for concrete condition assessment: correlation with electrical resistivity,J. Appl. Geophys. 62 (4) (2007) 361–374.
[19] J.B. Cornell, A.T. Coote, The application of an infrared absorption technique tothe measurement of moisture content of building materials, J. Appl. Chem.Biotechnol. 22 (4) (1972) 455–463.
[20] G. Quincot, M. Azenha, J. Barros, R. Faria, State of the art–Methods to measuremoisture in concrete, Projetos De InvestigaçãoCientífica EDesenvolvimentoTecnológico, Portugal, 2011.
[21] S.F. Senin, R. Hamid, Ground penetrating radar wave attenuation models forestimation of moisture and chloride content in concrete slab, Constr. Build.Mater. 106 (2016) 659–669.
[22] T.Y. Yu, Distant damage-assessment method for multilayer composite systemsusing electromagnetic waves, J. Eng. Mech. 137 (8) (2011) 547–560.
[23] T.Y. Yu, Quantitative assessment of CFRP-concrete Cylinders using syntheticaperture radar images, Res. Nondestr. Eval. 28 (3) (2017) 168–185.
[24] S. Laurens, J.P. Balayssac, J. Rhazi, G. Klysz, G. Arliguie, Non-destructiveevaluation of concrete moisture by GPR: experimental study and directmodeling, Mater. Struct. 38 (2005) 827–832.
[25] G. Klysz, J.P. Balayssac, Determination of volumetric water content of concreteusing ground-penetrating radar, Cem. Concr. Res. 37 (2007) 1164–1171.
[26] S. Laurens, J.P. Balayssac, J. Rhazi, G. Arliguie, Influence of concrete relativehumidity on the amplitude of Ground-Penetrating Radar (GPR) signal, Mater.Struct. 35 (4) (2002) 198–203.
[27] Z.M. Sbartaï, S. Laurens, D. Breysse, Concrete moisture assessment using radarNDT technique–comparison between time and frequency domain analysis,Non-Destructive Testing in Civil Engineering (NDTCE’09), Nantes, France,2009.
[28] J.A. Kong, Electromagnetic Wave Theory, EMW Publishing Cambridge, MA,2000.
[29] L. Tsang, J.A. Kong, K.H. Ding, Scattering of Electromagnetic Waves—Theoriesand Applications, Wiley, New York, 2000.