molecular characterization and clinical relevance
TRANSCRIPT

Resource
Molecular Characterizatio
n and Clinical RelevanceofMetabolic Expression Subtypes in HumanCancersGraphical Abstract
Highlights
d Classification of metabolic expression subtypes in 33 TCGA
cancer types
d Metabolic expression subtypes show consistent prognostic
patterns across cancer types
d Analysis of master regulators of metabolic subtypes
suggesting therapeutic targets
d Metabolic expression subtypes associated with sensitivity to
drugs in clinical use
Peng et al., 2018, Cell Reports 23, 255–273April 3, 2018 ª 2018 The Author(s).https://doi.org/10.1016/j.celrep.2018.03.077
Authors
Xinxin Peng, Zhongyuan Chen,
Farshad Farshidfar, ..., The Cancer
Genome Atlas Research Network,
Oliver F. Bathe, Han Liang
[email protected] (O.F.B.),[email protected] (H.L.)
In Brief
Peng et al. analyze a cohort of 9,125
TCGA samples across 33 cancer types to
characterize tumor subtypes based on
the expression of seven metabolic
pathways. They find metabolic
expression subtypes are associated with
patient survivals and suggest the
therapeutic and predictive relevance of
subtype-related master regulators.

Cell Reports
Resource
Molecular Characterization and Clinical Relevanceof Metabolic Expression Subtypes in Human CancersXinxin Peng,1,18 Zhongyuan Chen,1,2,18 Farshad Farshidfar,3,4,18 Xiaoyan Xu,5,1 Philip L. Lorenzi,1,6 Yumeng Wang,7,1
Feixiong Cheng,8,9 Lin Tan,1,6 Kamalika Mojumdar,1 Di Du,1 Zhongqi Ge,1 Jun Li,1 George V. Thomas,10 Kivanc Birsoy,11
Lingxiang Liu,12 Huiwen Zhang,13 Zhongming Zhao,14,15 Calena Marchand,16 John N. Weinstein,1,17 The Cancer GenomeAtlas Research Network, Oliver F. Bathe,3,* and Han Liang1,17,7,19,*1Department of Bioinformatics and Computational Biology, The University of Texas MD Anderson Cancer Center, Houston, TX 77030, USA2Department of Statistics, Rice University, Houston, TX 77005, USA3Departments of Surgery and Oncology, University of Calgary, Calgary, T2N 4N2 Alberta, Canada4Arnie Charbonneau Cancer Institute, University of Calgary, Calgary, T2N 4N1 Alberta, Canada5Department of Pathophysiology, College of Basic Medicine Science, China Medical University, Shenyang, Liaoning Province 110122, China6The Proteomics and Metabolomics Core Facility, The University of Texas MD Anderson Cancer Center, Houston, TX 77030, USA7Graduate Program in in Quantitative and Computational Biosciences, Baylor College of Medicine, Houston, TX 77030, USA8Center for Cancer Systems Biology and Department of Cancer Biology, Dana-Farber Cancer Institute, Boston, MA 02215, USA9Center for Complex Networks Research and Department of Physics, Northeastern University, Boston, MA 02115, USA10Department of Pathology and Laboratory Medicine, Oregon Health & Science University Knight Cancer Institute, Portland, OR 97239, USA11Laboratory of Metabolic Regulation and Genetics, The Rockefeller University, New York, NY 10065, USA12Department of Oncology, First Affiliated Hospital of Nanjing Medical University, Nanjing, Jiangsu 210029, China13Department of Biochemistry and Molecular Biology, The University of Texas Health Science Center at Houston McGovern Medical School,Houston, TX 77030, USA14Center for Precision Health, School of Biomedical Informatics, The University of Texas Health Science Center at Houston, Houston,
TX 77030, USA15Human Genetics Center, School of Public Health, The University of Texas Health Science Center at Houston, Houston, TX 77030, USA16Faculty of Engineering, University of Waterloo, Waterloo, Ontario N2L 3G1, Canada17Department of Systems Biology, The University of Texas MD Anderson Cancer Center, Houston, TX 77030, USA18These authors contributed equally19Lead Contact
*Correspondence: [email protected] (O.F.B.), [email protected] (H.L.)
https://doi.org/10.1016/j.celrep.2018.03.077
SUMMARY
Metabolic reprogramming provides critical informa-tion for clinical oncology. Using molecular data of9,125 patient samples from The Cancer GenomeAtlas, we identified tumor subtypes in 33 cancertypes based on mRNA expression patterns of sevenmajor metabolic processes and assessed their clin-ical relevance. Our metabolic expression subtypescorrelated extensively with clinical outcome: sub-types with upregulated carbohydrate, nucleotide,and vitamin/cofactor metabolism most consistentlycorrelated with worse prognosis, whereas subtypeswith upregulated lipid metabolism showed the oppo-site. Metabolic subtypes correlated with diverse so-matic drivers but exhibited effects convergent oncancer hallmark pathways and were modulated byhighly recurrent master regulators across cancertypes. As a proof-of-concept example, we demon-strated that knockdown of SNAI1 orRUNX1—masterregulators of carbohydrate metabolic subtypes—modulates metabolic activity and drug sensitivity.Our study provides a system-level view of metabolicheterogeneity within and across cancer types and
This is an open access article under the CC BY-N
identifies pathway cross-talk, suggesting relatedprognostic, therapeutic, and predictive utility.
INTRODUCTION
Teleologically, cancer cells must modify their metabolic pro-
grams to adapt to the energy and macronutrient requirements
that support rapid proliferation. Indeed, metabolic reprogram-
ming is a well-established hallmark of cancer (Hanahan and
Weinberg, 2011). For example, alterations in carbohydrate meta-
bolism epitomized by the Warburg effect have been recognized
for decades (Vander Heiden et al., 2009). Although different
metabolic functions are known to be perturbed in cancer, studies
of cancer metabolism usually focus on a specific perturbation
and investigate it in isolation for a specific tumor type. However,
metabolic reprogramming in tumor cells is complex, frequently
consisting of alterations in several metabolic functions that syn-
ergize to promote tumorigenesis and cancer cell proliferation.
Elucidating the full spectrum of metabolic reprogramming that
occurs in human cancers will provide key insights into an essen-
tial aspect of tumor development and will also build a basis for
the rational design of cancer treatments that target metabolism.
During carcinogenesis, somatic alterations in oncogenes
and tumor suppressors transform cells by inducing broad
gene expression changes that subsequently cause metabolic
Cell Reports 23, 255–269, April 3, 2018 ª 2018 The Author(s). 255C-ND license (http://creativecommons.org/licenses/by-nc-nd/4.0/).

0 1 2 3 4 5 60
1
2
3
4
5
6
Other genes [−log (p value)] 10
Path
way
gen
es [−
log
(p v
alue
)]10
Pat
hway
gen
es[-l
og(p
val
ue)]
10
Terunuma et al.
other genes
{C
A
B
Other genes [-log (p value)]10
D
Spearmn’s rank test
Expression level of gene j
Met
abol
ite i
Spearmn’s rank test
Expression level of gene j
Met
abol
ite i
Spearmn’s rank test
Expression level of gene j
Met
abol
ite i
Spearmn’s rank test
Expression level of gene j
Met
abol
ite i
Spearmn’s rank test
Expression level of gene j
Met
abol
ite i
Spearmn’s rank test
Expression level of gene j
Met
abol
ite i
pathway genes
296
met
abol
ites
~20,
000
gene
s
0 1 2 3 4 5 60
2
4
6
8
Other genes [−log (p value)] 10
Pat
hway
gen
es [−
log
(p v
alue
)]10
0 1 2 3 4 5 60
2
4
6
8
5,6−dihydrouracil(Nucleotide)
Other genes [−log (p value)] 10P
athw
ay g
enes
[−lo
g(p
val
ue)]
10
0 1 2 3 4 5 60
2
4
6
8
Other genes [−log (p value)] 10
Pat
hway
gen
es [−
log
(p v
alue
)]10
phen
olsu
lfate
sarc
osin
e5−
met
hylth
ioad
enos
ine
isob
utyr
ylca
rniti
ne2−
hydr
oxyb
utyr
ate
opht
halm
ate
3−m
ethy
lhis
tidin
e2−
met
hylb
utyr
oylc
arni
tine
p−cr
esol
sulfa
tehy
drox
yiso
vale
royl
carn
itine
3−m
ethy
l−2−
oxov
aler
ate
glut
amin
eth
reon
ine
N−a
cety
lisol
euci
ne2−
amin
obut
yrat
ehi
stam
ine
kynu
reni
neN
−ace
tylm
ethi
onin
e4−
hydr
oxyp
heny
lpyr
uvat
eS
−ade
nosy
lhom
ocys
tein
ehi
stid
ine
4−m
ethy
l−2−
oxop
enta
noat
eN
−ace
tylm
anno
sam
ine
lact
ate
ribos
e3−
phos
phog
lyce
rate
Isob
arrib
ulos
e5−p
hosp
hate
xylu
lose
5−ph
osph
ate
N−a
cety
lneu
ram
inat
eN
−ace
tylg
luco
sam
ine6
−pho
spha
tefru
ctos
e−6−
phos
phat
eer
ythr
onat
efu
cose
gluc
uron
ate
man
nose
−6−p
hosp
hate
N−a
cety
lglu
cosa
min
efru
ctos
erib
itol
gluc
ose−
6−ph
osph
ate
Isob
arfru
ctos
e16−
diph
osph
ateg
luco
se16
−dip
hosp
hate
sedo
hept
ulos
e−7−
phos
phat
em
anno
serib
ulos
eso
rbito
lxy
litol
pyro
phos
phat
eph
osph
ate
buty
rylc
arni
tine
glyc
erol
3−ph
osph
ate
2−de
oxyg
uano
sine
56−d
ihyd
rour
acil
N1−
met
hyla
deno
sine
urac
ilad
enin
ehy
poxa
nthi
neth
ymin
eps
eudo
urid
ine
aden
osin
e3−m
onop
hosp
hate
aden
osin
e5−m
onop
hosp
hate
urid
ine
guan
ine
aden
osin
e2−m
onop
hosp
hate
guan
osin
exa
ntho
sine
2−de
oxyi
nosi
necy
tidin
e5−m
onop
hosp
hate
inos
ine
N1−
met
hylg
uano
sine
2−O
−met
hylg
uano
sine
aden
osin
eni
cotin
amid
eade
nine
dinu
cleo
tide
flavi
nade
nine
dinu
cleo
tide
asco
rbat
epa
ntot
hena
te
Vitamin cofactorNucleotide
LipidEnergy
CarbohydrateAmino acid
0 5 10 15 20 25
0.0
0.1
0.2
0.3
0.4
0.5
0.6
Number of significant hits
Den
sity
0 5 10 15 20 25
0.0
0.5
1.0
1.5
Carbohyrate
Number of significant hits
Den
sity
0.0 0.5 1.0 1.5 2.0 2.5
0.00.5
1.01.52.02.53.03.5
Number of significant hits
Den
sity
0 1 2 3 4 5 6
0.0
0.5
1.0
1.5
2.0
Lipid
Den
sity
0 5 10 15 20 25
0.0
0.2
0.4
0.6
0.8
Nucleotide
Number of significant hits
Den
sity
0 1 2 3 4
0.00.51.01.52.02.53.03.5
Vitamin cofactor
Number of significant hits
Den
sity
Number of significant hits
( p = 0.014 ) ( p = 0.001 ) ( p = 0.05 )
( p = 0.047 ) ( p = 0.006 ) ( p = 0.021 )
Figure 1. The Expression Patterns of Metabolic Pathway Genes Reflect Metabolite Levels in Cancer Patient Samples
(A) The analytic pipeline for assessing whether the expression levels of metabolic pathway genes are correlated with the concentration of a given
metabolite.
(legend continued on next page)
256 Cell Reports 23, 255–269, April 3, 2018

reprograming (Vander Heiden and DeBerardinis, 2017). Thus,
gene expression represents a molecular dimension of particular
interest in studying cancer metabolism since it bridges between
oncogenic drivers and metabolic phenotypes. Some pioneering
studies have analyzed large-scale gene expression data across
multiple cancer types (Haider et al., 2016; Hu et al., 2013; Nilsson
et al., 2014; Reznik and Sander, 2015). Focusing on comparisons
of tumor and adjacent normal tissue, those studies show
widespread transcriptional dysregulation of metabolic genes.
Although such studies have provided significant insight into
alteredmetabolic pathways of cancer cells, the clinical relevance
of the results may be limited since tumor and normal tissues
usually contain very different cell compositions (e.g., fraction of
epithelial cells). Gaude and Frezza (2016) took a more pertinent,
pathway-focused approach to the analysis of data from clinical
samples and identified several differentially expressedmetabolic
pathways that distinguish patients by clinical outcomes. Those
and many other studies have revealed considerable metabolic
heterogeneity, both within and among cancer types, underscor-
ing the importance of patient stratification in a context-specific
manner. However, it remains unclear how to stratify cancer
patients most effectively into different subtypes (groups) based
on the expression patterns of metabolic genes. More impor-
tantly, the utility of such tumor subtypes in guiding clinical
practice and therapeutic development remains a major ques-
tion. Here, using the comprehensive molecular data recently
compiled in The Cancer Genome Atlas (TCGA) (Weinstein
et al., 2013), we focused on seven metabolic super-pathways
and characterized metabolic expression subtypes in 33 TCGA
cancer types (9,125 samples; Table S1) to address those ques-
tions in a systematic way.
RESULTS
Expression Patterns of Metabolic Genes ReflectMetabolic Activities in Cancer PatientsTo gain an incisive view of metabolic heterogeneity in cancer, we
curated the gene sets of sevenmetabolic super-pathways based
on the latest Reactome annotations (Fabregat et al., 2016).
Included were amino acid metabolism (348 genes), carbohy-
drate metabolism (286 genes), integration of energy (110 genes),
lipid metabolism (766 genes), nucleotide metabolism (90 genes),
tricarboxylic acid cycle (TCA cycle, 148 genes) and vitamin &
cofactor metabolism (168 genes) (Table S2). Those gene sets
are largely independent of each other, with only a few genes of
overlap, and they collectively represent major metabolic
processes.
One key question is whether the expression patterns of meta-
bolic pathway genes reflect actual metabolic activities in pa-
tients. Since data on the metabolites themselves are not avail-
(B) Representative quantile-quantile (QQ) plots showing p values (log transformed
compared to other genes. Sarcosine for amino acid metabolism; N-acetylmanno
bolism; nicotinamide adenine dinucleotide for vitamin & cofactor metabolism.
(C) Heatmap showing all metabolites whose intracellular concentrations significa
(FDR < 0.15).
(D) The statistical significance of the numbers of metabolites correlated with the p
sets. The red lines indicate the true numbers.
able for TCGA samples, we obtained a published dataset that
contains parallel metabolite profiling and gene expression data
on 60 breast cancer patient samples (Terunuma et al., 2014)
and focused on the 296 metabolites that had been annotated
to 6 out of the 7 metabolic super-pathways that we surveyed.
For each metabolite, we calculated the correlation of its abun-
dance with gene expression levels in the corresponding meta-
bolic pathway, then compared the resultant p value distribution
with the background distribution calculated from other genes
(Figure 1A). In total, we detected 73metabolites that significantly
correlated with the expression of corresponding metabolic
pathway genes (false discovery rate [FDR] < 0.15), including
22 metabolites involved in amino acid metabolism, 22 in carbo-
hydrate metabolism, 21 in nucleotide metabolism, 4 in vitamin &
cofactor metabolism, 2 in integration of energy, and 2 in lipid
metabolism (Figure 1B shows four representative cases from
different pathways; Figure 1C provides the full list of significant
metabolites). To assess the statistical significance of the number
of significant hits detected, we performed a simulation analysis
to compare the number of metabolites with significant signals
from each pathway with those based on random gene sets of
the same size. Strikingly, all six metabolic pathways showed
higher numbers of significant metabolites than expected by
chance (p < 0.05, Figure 1D). For example, the number of signif-
icant carbohydrate metabolites for the real pathway gene set
was 22, whereas the expected number for a random gene set
was only 0.3 (p < 0.001). These results indicate that the expres-
sion patterns of metabolic pathway genes do reflect metabolic
activities.
Classification of Metabolic Expression Subtypes andTheir Overall SimilarityWe next aimed to characterize metabolic heterogeneity within
cancer types based on the expression patterns of metabolic
pathway genes. For that purpose, we developed a computa-
tional method to classify tumor samples into ‘‘directional’’ meta-
bolic subtypes in two independent steps (Figure 2A). In the first
step, within each cancer type, we normalized gene expression
across samples by Z score to obtain a rank value for each
gene (�18,000 coding genes) within each sample. Then, given
the gene set of a specific metabolic pathway, we conducted
gene set enrichment analysis (GSEA) (Subramanian et al.,
2005) on the resulting rank values to classify tumors into three
subtypes: (1) ‘‘upregulated subtype’’ for the samples in which
metabolic pathway genes showed enrichment with high Z scores
(FDR < 0.25); (2) ‘‘downregulated subtype’’ for samples showing
the opposite pattern (FDR < 0.25); and (3) ‘‘neutral subtype’’ for
samples showing no significant enrichment pattern. Note that
the concept of ‘‘upregulated’’ or ‘‘downregulated’’ here is relative
to other tumors within the same cancer type, rather than relative
) from themetabolite-gene Spearman correlation coefficients of pathway genes
samine for carbohydrate metabolism; 5, 6-dihydrouracil for nucleotide meta-
ntly correlate with the expression levels of the corresponding pathway genes
athway gene expression based on the background distribution of random gene
Cell Reports 23, 255–269, April 3, 2018 257

.
TCA cycle
cycle
cyc
le
cyc
le
ACCBLCA
BRCACESC
..... UVM
ACCBLCA
BRCA
CESCCHOL
COADDLBC
ESCA
GBMHNSCKICH
KIRCKIRP
LAML
LGG
LIHC
LUAD
LUSCMESO
OVPAAD
PCPGPRAD
READ SARCSKCMSTAD
TGCT
THCA
THYM
UCEC
UCSUVM
cycle
gene
gene
A
B
C D E
Figure 2. Classification of Metabolic Expression Subtypes Based on Pathway Gene Expression
(A) The computational method to classify tumor samples into three metabolic expression subtypes: upregulated, downregulated, and neutral. Bar charts
represent the numbers of genes for metabolic pathways surveyed.
(B) Distributions of three metabolic subtypes for each metabolic pathway in 33 cancer types. Only tumor subtype classifications passing the two-step statistical
criteria in (A) are shown.
(legend continued on next page)
258 Cell Reports 23, 255–269, April 3, 2018

to normal tissues. In the second step, we assessed whether the
metabolic genes overall showed differential expression patterns
(FDR < 0.05) among the tumor subtypes defined in the first step,
given thatmetabolic expression subtypeswere expected to cap-
ture the variation in metabolic pathway gene expression. Among
231 cases assessed (7 pathways 3 33 cancer types), 93.9% of
the cases (217) met that criterion and were kept for subsequent
analyses.
Using the method described above for each metabolic
pathway, we classified 9,125 samples into the three subtypes.
Figure 2B shows the relative proportions of those subtypes
across and within cancer types. Figure S1 shows metabolic
genes with the most consistent changes among the subtypes
across cancer types. Based on the subtype information, we
further examined the co-occurrence of expression subtypes of
different metabolic pathways and found that many subtype
combinations occurred at a much higher frequency than ex-
pected by chance (Figure 2C). For example, the most common
subtype combination was those with upregulated amino acid
metabolism, nucleotide metabolism, and TCA cycle. They
showed >10-fold more frequently than expected by chance (Fig-
ure 2D). We compared the similarity of different metabolic sub-
type classifications based on sample-level labels and found
that amino acid metabolism, TCA cycle, and nucleotide meta-
bolism formed one tight cluster, whereas integration of energy,
carbohydrate metabolism, lipid metabolism, and vitamin &
cofactor metabolism formed another distinct cluster (Figure 2E).
These results provide a global view of the similarity of different
metabolic pathways and may reflect crosstalk among them.
Metabolic Expression Subtypes Show ExtensiveClinically Relevant PatternsTo assess the clinical relevance of themetabolic expression sub-
types identified above, we next determined correlations with pa-
tient overall survival, since survival represents a key clinical index
of tumor aggressiveness. Figure 3A is a summary of 33 signifi-
cant survival associations for the metabolic subtypes in 27 can-
cer types that included sufficient sample size and follow-up time
(log-rank test, FDR < 0.2, 28 associations remained significant
after adjusting for tumor purity). Notably, upregulated subtypes
of carbohydrate, nucleotide, and vitamin & cofactor metabolism
were consistently associated with poor prognosis (Figure 3B),
compatible with the hypothesis that cancer cells have increased
demands for glucose uptake and nucleotide synthesis (Pavlova
and Thompson, 2016; Vander Heiden and DeBerardinis, 2017).
Unexpectedly, upregulated TCA cycle and lipid metabolic sub-
types were associated with better prognosis (Figure 3C). Amino
acidmetabolism and energy integration subtypes showedmixed
patterns. We obtained similar results using univariate Cox
regressionmodels (Figure S2). The consistent association of sur-
vival patterns with certain metabolic subtypes (e.g., carbohy-
(C) Frequency distribution of a specific metabolic subtype combination. The red
assuming that each metabolic pathway is perturbed independently in a tumor sa
(D) The top 10 most frequently observed metabolic subtype combinations. Red, u
The right panel indicates the observed and expected frequencies of a specific sub
(E) Clustering pattern of the seven metabolic subtypes based on the similarity of
See also Table S1, Table S2, and Figure S1.
drate metabolism) across cancer types suggests that metabolic
subtyping has potential prognostic value.
Among the cancer types surveyed, low-grade glioma (LGG)
exhibited the most extensive survival correlations (5 out of
the 7 metabolic pathways; Figure S3). For LGG, poor prognosis
was significantly associated with downregulated subtypes of
amino acid metabolism, energy integration, and TCA cycle but
with upregulated subtypes of carbohydrate and vitamin &
cofactor metabolism. LGGs have mutations of isocitrate dehy-
drogenase 1 (IDH1) in >70% of cases and mutations of IDH2 in
a minority of cases. IDH1 and IDH2 mutations are activating for
production of high levels of the oncometabolite 2-hydroxygluta-
rate (2HG) from alpha-ketoglutarate (Claus et al., 2015; Dang
et al., 2009;Ward et al., 2010). The extensive prognostic patterns
observed support the notion of glioma as a disease influenced by
metabolism.
Genomic profiling studies, especially recent TCGA studies,
have characterized a number of tumor subtypes that capture
major patterns of within-disease heterogeneity. Those tumor
subtypes are informative about cancer pathophysiology and, in
some cases, for clinical decisionmaking.We therefore examined
the correlations between metabolic expression subtypes and
previously established molecular tumor subtypes and detected
many significant correlations (Figure S4). For example, in breast
invasive carcinoma (BRCA), we found that the vast majority of
cases in which nucleotide metabolism was downregulated
belonged to the luminal A (lumA) subtype (Sørlie et al., 2001);
in esophageal carcinoma (ESCA), cases with upregulated lipid
and vitamin & cofactor metabolismwere enriched in the chromo-
somal instability subtype (CIN) (Cancer Genome Atlas Research
Network, 2017); in glioblastoma multiforme (GBM), cases of
downregulated lipid metabolism were enriched in the IDHmut-
non-codel subtype (Eckel-Passow et al., 2015); in head-neck
squamous cell carcinoma (HNSC), cases with downregulated
carbohydrate metabolism were enriched in the HPV� subtype
(Figure 3C). These results highlight the clinical relevance of
metabolic expression subtypes presented here and provide an
informative metric for defining tumor heterogeneity.
Metabolic Expression Subtypes Are Associated withDiverse Somatic Drivers but Convergent PathwayFunctional EffectsMetabolic reprogramming can be largely viewed as a conse-
quence of oncogenic driver events (DeBerardinis and Chandel,
2016). For example, mutated TP53 and MYC amplification
have been extensively linked to anabolic or catabolic activities,
including glycolysis and redox balance in cancer (Kruiswijk
et al., 2015; Stine et al., 2015). To identify somatic alterations
that potentially drive metabolic expression subtypes, we per-
formed a correlation analysis of metabolic expression subtypes
with mutation driver genes. For each cancer type, we identified
line is for the observed distribution; black lines are for the random expectation
mple.
pregulated subtype; gray, neutral subtype; and blue, downregulated subtype.
type combination. Data are represented as mean ± SD. *p < 0.05, ***p < 0.001.
subtype labels across 9,125 samples.
Cell Reports 23, 255–269, April 3, 2018 259

Carbohydrate
Nucleotide
Lipid
Nucleotide
Lipid
Vitamin cofactor
Vitamin cofactorLipid
Carbohydrate Carbohydrate
Energy
-37(p=1.9x10 )
-35(p=3.0x10 )
-4(p=7.8x10 )
-3(p=4.6x10 )
-8(p=3.0x10 )
-5(p=4.3x10 )
-3(p=2.8x10 )
-6(p=5.5x10 )
-5(p=6.2x10 )
-40(p=5.0x10 )
-11(p=1.8x10 )
C
D
-21.0x10-41.0x10-61.0x10
Upregulated NotSig Downregulated
B
Vitamin cofactor
TCA cycle
Nucleotide
Lipid
Energy
Carbohydrate
Amino acid AC
C
BLC
A
BRC
A
CES
C
CO
AD
ESC
A
GBM
HN
SC
KIC
H
KIR
C
KIR
P
LAM
L
LGG
LIH
C
LUAD
LUSC
MES
O
PAAD
REA
D
SAR
C
SKC
M
STAD
THC
A
UC
EC
UC
S
UVMO
V
COADBRCA ESCA
IDHmut-
non-c
odel
IDHwt
HNSC
HPV-VVHPV+
IDHmut-
code
l
IDHmut-
non-c
odel
IDHwt
FDR<0.2
Basal
Her2 LumA
LumB
Normal_
like
CIN GS HM-inde
l
CIN ESCC
0 50 100 150 200
0.0
0.2
0.4
0.6
0.8
1.0
HNSC_Carbohydrate (p=1.4x10⁻³)
Months
Sur
viva
l pro
babi
lity
Up (105)Neutral (273)Down (109)
0 50 100 150 2000.0
0.2
0.4
0.6
0.8
1.0
LGG_Carbohydrate (p=2.7x10⁻⁸)
Sur
viva
l pro
babi
lity
Up (88)Neutral (282)Down (135)
0 50 100 150 200 250
0.0
0.2
0.4
0.6
0.8
1.0
LUAD_Carbohydrate (p=4.5x10⁻³)
Sur
viva
l pro
babi
lity
Up (85)Neutral (306)Down (102)
0 50 100 150
0.0
0.2
0.4
0.6
0.8
1.0
SARC_Carbohydrate (p=2.0x10⁻²)
Months
Sur
viva
l pro
babi
lity
Up (39)Neutral (130)Down (60)
0 50 100 150
0.0
0.2
0.4
0.6
0.8
1.0
ACC_Lipid (p=3.2x10⁻²)
Months
Sur
viva
l pro
babi
lity
Up (20)Neutral (37)Down (19)
0 50 100 150
0.0
0.2
0.4
0.6
0.8
1.0
-2COAD_Lipid (p=2.7x10 )
Months
Sur
viva
l pro
babi
lity
Up (80)Neutral (180)Down (79)
0 50 100 150
0.0
0.2
0.4
0.6
0.8
1.0
KIRC_Lipid (p=1.3x10⁻²)
Months
Sur
viva
l pro
babi
lity
Up (84)Neutral (178)Down (90)
0 20 40 60 80 100 120
0.0
0.2
0.4
0.6
0.8
1.0
LIHC_Lipid (p=3.7x10⁻²)
Months
Sur
viva
l pro
babi
lity
Up (101)Neutral (167)Down (79)
A
(legend on next page)
260 Cell Reports 23, 255–269, April 3, 2018
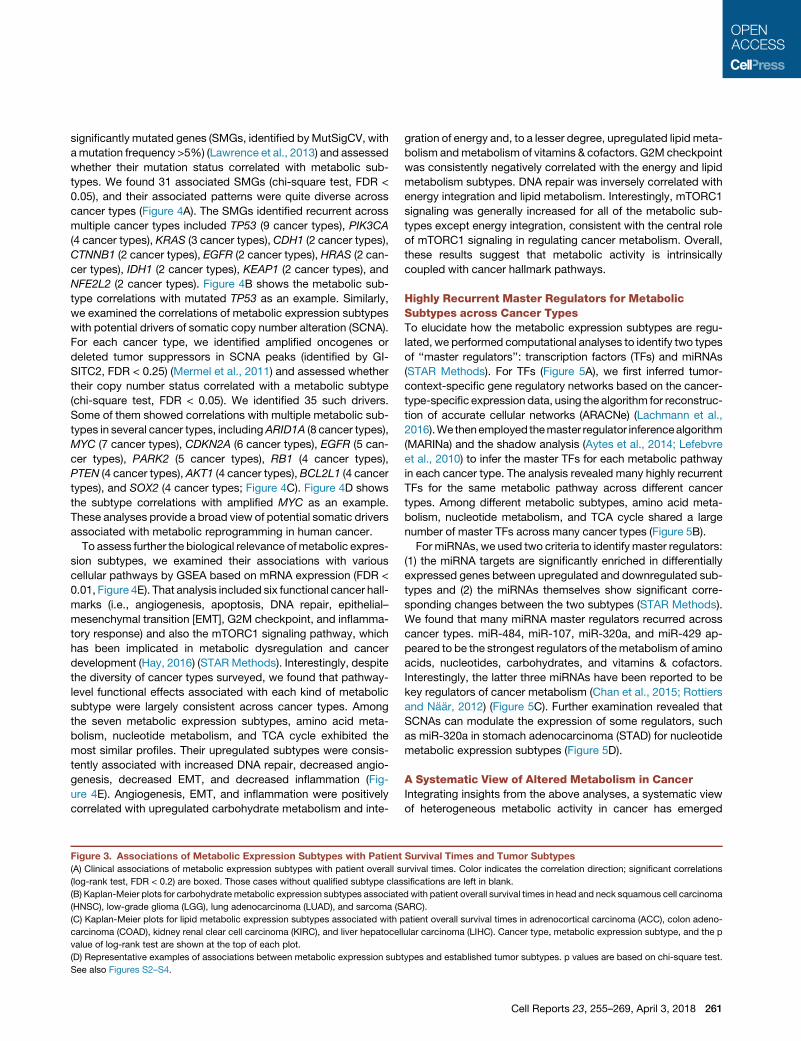
significantly mutated genes (SMGs, identified byMutSigCV, with
amutation frequency >5%) (Lawrence et al., 2013) and assessed
whether their mutation status correlated with metabolic sub-
types. We found 31 associated SMGs (chi-square test, FDR <
0.05), and their associated patterns were quite diverse across
cancer types (Figure 4A). The SMGs identified recurrent across
multiple cancer types included TP53 (9 cancer types), PIK3CA
(4 cancer types), KRAS (3 cancer types), CDH1 (2 cancer types),
CTNNB1 (2 cancer types), EGFR (2 cancer types), HRAS (2 can-
cer types), IDH1 (2 cancer types), KEAP1 (2 cancer types), and
NFE2L2 (2 cancer types). Figure 4B shows the metabolic sub-
type correlations with mutated TP53 as an example. Similarly,
we examined the correlations of metabolic expression subtypes
with potential drivers of somatic copy number alteration (SCNA).
For each cancer type, we identified amplified oncogenes or
deleted tumor suppressors in SCNA peaks (identified by GI-
SITC2, FDR < 0.25) (Mermel et al., 2011) and assessed whether
their copy number status correlated with a metabolic subtype
(chi-square test, FDR < 0.05). We identified 35 such drivers.
Some of them showed correlations with multiple metabolic sub-
types in several cancer types, includingARID1A (8 cancer types),
MYC (7 cancer types), CDKN2A (6 cancer types), EGFR (5 can-
cer types), PARK2 (5 cancer types), RB1 (4 cancer types),
PTEN (4 cancer types), AKT1 (4 cancer types), BCL2L1 (4 cancer
types), and SOX2 (4 cancer types; Figure 4C). Figure 4D shows
the subtype correlations with amplified MYC as an example.
These analyses provide a broad view of potential somatic drivers
associated with metabolic reprogramming in human cancer.
To assess further the biological relevance ofmetabolic expres-
sion subtypes, we examined their associations with various
cellular pathways by GSEA based on mRNA expression (FDR <
0.01, Figure 4E). That analysis included six functional cancer hall-
marks (i.e., angiogenesis, apoptosis, DNA repair, epithelial–
mesenchymal transition [EMT], G2M checkpoint, and inflamma-
tory response) and also the mTORC1 signaling pathway, which
has been implicated in metabolic dysregulation and cancer
development (Hay, 2016) (STARMethods). Interestingly, despite
the diversity of cancer types surveyed, we found that pathway-
level functional effects associated with each kind of metabolic
subtype were largely consistent across cancer types. Among
the seven metabolic expression subtypes, amino acid meta-
bolism, nucleotide metabolism, and TCA cycle exhibited the
most similar profiles. Their upregulated subtypes were consis-
tently associated with increased DNA repair, decreased angio-
genesis, decreased EMT, and decreased inflammation (Fig-
ure 4E). Angiogenesis, EMT, and inflammation were positively
correlated with upregulated carbohydrate metabolism and inte-
Figure 3. Associations of Metabolic Expression Subtypes with Patient
(A) Clinical associations of metabolic expression subtypes with patient overall s
(log-rank test, FDR < 0.2) are boxed. Those cases without qualified subtype clas
(B) Kaplan-Meier plots for carbohydrate metabolic expression subtypes associate
(HNSC), low-grade glioma (LGG), lung adenocarcinoma (LUAD), and sarcoma (S
(C) Kaplan-Meier plots for lipid metabolic expression subtypes associated with p
carcinoma (COAD), kidney renal clear cell carcinoma (KIRC), and liver hepatocel
value of log-rank test are shown at the top of each plot.
(D) Representative examples of associations between metabolic expression sub
See also Figures S2–S4.
gration of energy and, to a lesser degree, upregulated lipid meta-
bolism andmetabolism of vitamins & cofactors. G2M checkpoint
was consistently negatively correlated with the energy and lipid
metabolism subtypes. DNA repair was inversely correlated with
energy integration and lipid metabolism. Interestingly, mTORC1
signaling was generally increased for all of the metabolic sub-
types except energy integration, consistent with the central role
of mTORC1 signaling in regulating cancer metabolism. Overall,
these results suggest that metabolic activity is intrinsically
coupled with cancer hallmark pathways.
Highly Recurrent Master Regulators for MetabolicSubtypes across Cancer TypesTo elucidate how the metabolic expression subtypes are regu-
lated, we performed computational analyses to identify two types
of ‘‘master regulators’’: transcription factors (TFs) and miRNAs
(STAR Methods). For TFs (Figure 5A), we first inferred tumor-
context-specific gene regulatory networks based on the cancer-
type-specific expression data, using the algorithm for reconstruc-
tion of accurate cellular networks (ARACNe) (Lachmann et al.,
2016).We thenemployed themaster regulator inferencealgorithm
(MARINa) and the shadow analysis (Aytes et al., 2014; Lefebvre
et al., 2010) to infer the master TFs for each metabolic pathway
in each cancer type. The analysis revealed many highly recurrent
TFs for the same metabolic pathway across different cancer
types. Among different metabolic subtypes, amino acid meta-
bolism, nucleotide metabolism, and TCA cycle shared a large
number of master TFs across many cancer types (Figure 5B).
For miRNAs, we used two criteria to identify master regulators:
(1) the miRNA targets are significantly enriched in differentially
expressed genes between upregulated and downregulated sub-
types and (2) the miRNAs themselves show significant corre-
sponding changes between the two subtypes (STAR Methods).
We found that many miRNA master regulators recurred across
cancer types. miR-484, miR-107, miR-320a, and miR-429 ap-
peared to be the strongest regulators of themetabolism of amino
acids, nucleotides, carbohydrates, and vitamins & cofactors.
Interestingly, the latter three miRNAs have been reported to be
key regulators of cancer metabolism (Chan et al., 2015; Rottiers
and Naar, 2012) (Figure 5C). Further examination revealed that
SCNAs can modulate the expression of some regulators, such
as miR-320a in stomach adenocarcinoma (STAD) for nucleotide
metabolic expression subtypes (Figure 5D).
A Systematic View of Altered Metabolism in CancerIntegrating insights from the above analyses, a systematic view
of heterogeneous metabolic activity in cancer has emerged
Survival Times and Tumor Subtypes
urvival times. Color indicates the correlation direction; significant correlations
sifications are left in blank.
d with patient overall survival times in head and neck squamous cell carcinoma
ARC).
atient overall survival times in adrenocortical carcinoma (ACC), colon adeno-
lular carcinoma (LIHC). Cancer type, metabolic expression subtype, and the p
types and established tumor subtypes. p values are based on chi-square test.
Cell Reports 23, 255–269, April 3, 2018 261

A
C
B
D
E
(legend on next page)
262 Cell Reports 23, 255–269, April 3, 2018

(Figure 6A). Metabolic reprogramming may result from diverse
somatic driver alterations in different tumor contexts, but it ap-
pears to converge on common pathway-level functional effects
through modulation of highly recurrent master regulators across
cancer types, ultimately leading to consistent survival patterns.
According to this model, the master TFs identified here are key
nodes with the greatest influence on systems-level metabolic
activities. Therefore, those TFs may represent a class of thera-
peutic targets whose inhibition could potentially yield clinical
benefits.
To test that hypothesis, we focused on carbohydrate meta-
bolism, since its upregulated subtypes showed the most consis-
tently poor prognostic patterns across cancer types (Figures 3A
and 3B). To be an ideal target, a master TF should bemore highly
expressed in the subtype with worse prognosis so that inhibition
and subsequent downregulation of the target could confer
enhancedsurvival. Among the8cancer typeswhoseupregulated
carbohydrate subtypes had significantly worse survival rates,
fourmaster TFs,SNAI1,RUNX1,RUNX2, and FOSL1, were iden-
tified in at least three cancer types (Figure 6B).Wechose twoTFs,
SNAI1 and RUNX1, to perform experimental perturbation. Fig-
ures 6Cand6Dshowhigher expression levels of those twogenes
in the upregulated subtypes in lung adenocarcinoma (LUAD) and
sarcoma (SARC), respectively. Using shRNAs,we knockeddown
the expression ofSNAI1 in a lung cancer cell line, NCIH1975, and
RUNX1 in a sarcoma cell line, U2OS (Figure S5, Table S3). We
then measured the relative abundance of intracellular glucose
(amodel carbohydrate) using high-resolutionmass spectrometry
at time points of 0 h, 6 h, and 24 h. The concentrations of intracel-
lular glucose were significantly decreased in the knockdown cell
lines (Figure 6 E and F, paired t test, p < 0.05), suggesting that
SNAI1 and RUNX1 indeed positively modulate carbohydrate
metabolism. Further studies with more robust controls will be
required to validate the proposed effects in terms of whether
the knockdown affects glucose transporter expression and
whether the knockdown has predicted effects on carbohydrate
metabolic gene expression.
Metabolic Expression Subtypes Are Informative AboutDrug SensitivityTo explore further the potential clinical utility of carbohydrate
metabolic expression subtypes, we used expression and drug
sensitivity data from Cancer Cell Line Encyclopedia (CCLE) (Bar-
Figure 4. Somatic Drivers and Biological Pathways Associated with M(A) Somatic mutation drivers associated with metabolic expression subtypes.
(identified by MutSigCV, with a mutation frequency > 5%) were assessed based
kinds of metabolic expression subtypes.
(B) Correlations of metabolic expression subtypes with TP53mutation status. The
wide-type); external bands indicate the subtype information of a specific metabo
(C) Somatic copy number alteration drivers associated with metabolic expression
or tumor suppressors residing in a significant amplification for deletion peak (ide
(D) Correlations of metabolic expression subtypes with MYC amplification status
amplification; light red, low-level amplification); external bands indicate the subty
and blue, downregulated). In (A) and (C), only associations with FDR < 0.05 are s
(E) Correlations of metabolic expression subtypes with six cancer hallmarks and
MSigDB). Those cases without qualified subtype classifications are left in blank
analysis, differentially expressed genes were identified between the upregulated
set in genes highly expressed in the upregulated metabolic expression subtype;
retina et al., 2012; Iorio et al., 2016). We focused on 181 lung
cancer cell lines because of the sufficient sample size for sub-
type classification. Using the same bioinformatic methods as
describedabove,weclassified34, 33, and114cell linesasdown-
regulated, upregulated, and neutral subtypes, respectively. We
next compared themolecular characteristics associatedwith up-
regulated subtypes of patient samples and cell lines. EGFR—the
most important therapeutic target in lung cancer—was identified
as a SCNA driver associated with carbohydrate metabolic
expression subtypes of patient samples. It showed significantly
higher copy-number and mRNA expression levels in the upregu-
lated carbohydrate subtype than in the downregulated subtype
(Figure S6A). Concordantly, the carbohydrate expression sub-
types of lung cancer cell lines adhered to that pattern (Fig-
ure S6B). Furthermore, the cell lines in the upregulated subtype
had higher proliferation rates than those from the downregulated
subtype (Figure S6C), consistent with the observation that LUAD
patients in the upregulated carbohydrate metabolic subtype
exhibited worse prognosis (Figure 3B) (Haverty et al., 2016).
These results independently validate the patterns observed in
TCGA patient samples, suggesting that the analyses are robust.
Given the three carbohydrate expression subtypes of lung
cancer cell lines, we found that 12 drugs showed significantly
different sensitivities (Figure 7A, FDR < 0.05). Among those
drugs, docetaxel is a chemotherapy drug currently used for pa-
tients with lung cancer. Cell lines in the carbohydrate-upregu-
lated subtype were more sensitive to docetaxel than cell lines
in other subtypes (Figure 7B). To test further the effect of carbo-
hydrate metabolism on drug sensitivity, we assessed the sensi-
tivity of lung cancer cell line NCIH1975 (classified as upregulated
subtype) to knockdown of SNAI1, since that perturbation has
been found to modulate carbohydrate metabolism negatively.
Indeed, compared with the negative control (scrambled shRNA),
the SNAI1-KD cell line was more resistant to docetaxel, and
that pattern was consistently observed at both 16 hr and 24 hr
after treatment (Figures 7C and 7D). The results suggest that
LUAD patients with high carbohydrate metabolic activities may
be more likely to benefit from docetaxel treatment.
DISCUSSION
Metabolic reprogramming is considered one of the hallmarks
of cancer (Hanahan and Weinberg, 2011; Ward and Thompson,
etabolic Expression SubtypesFor each cancer type, the mutational status of significantly mutated genes
on chi-square test. Colors in each circle indicate the correlations with different
inner band indicates the mutation status of TP53 (dark red, mutated; light red,
lic pathway (red, upregulated; gray, neutral; and blue, downregulated).
subtypes. For each cancer type, the copy number status of known oncogenes
ntified by GISTIC2) were assessed based on chi-square test.
. The inner band indicates the amplification status of MYC (dark red, high-level
pe information of a specific metabolic pathway (red, upregulated; gray, neutral;
hown; color indicates the specific associated metabolic pathway.
mTOR signaling pathway based on GSEA (the related gene sets are based on
, and significant enrichments (FDR < 0.01) are colored in red or blue. For the
and downregulated subtypes. Red indicates the enrichment of a hallmark gene
blue indicates the opposite pattern.
Cell Reports 23, 255–269, April 3, 2018 263

A
B
C D
(legend on next page)
264 Cell Reports 23, 255–269, April 3, 2018

2012). Because metabolism is so complex, there is a need
for systematic characterization. Several previous studies have
demonstrated considerable heterogeneity in the expression of
genes involved in various metabolic functional pathways (Gaude
and Frezza, 2016; Haider et al., 2016; Hu et al., 2013; Nilsson
et al., 2014; Reznik and Sander, 2015). Based on a breast cancer
patient cohort with parallel metabolite and transcriptomic
profiling data (Terunuma et al., 2014), we demonstrated that
the expression patterns of metabolic pathways indeed reflect
metabolic activities. Metabolite profiling has recently become
an informative approach to elucidate tumor heterogeneity
(Hakimi et al., 2016). Similar analyses should extend to more
patient cohorts to further validate our findings when such data
are available.
The expression patterns analyzed in previous studies ranged
from global to discrete (i.e., affecting particular metabolic path-
ways). Here, we have focused on effective stratification of can-
cers based on the expression heterogeneity of metabolic genes
within cancer types. One central aim is to define meaningful
metabolic expression subtypes. Our computational method,
which combines GSEA and self-contained gene set analysis,
has two advantages: (1) it allows consistent classification of tu-
mor subtypes, facilitating comparison and contrast across a
broad range of cancer types and (2) it classifies tumor samples
according to ‘‘functional state’’ of a specific metabolic process
(upregulated, neutral, or downregulated), facilitating interpreta-
tion of downstream analyses. Through that systematic classifi-
cation, we found that metabolic expression subtypes frequently
correlate with each other. In particular, metabolic perturbations
of amino acids, nucleotides, and TCA cycle are strongly coupled,
as demonstrated by high correlations of their subtype assign-
ment, similar pathway-level associations, and shared master
regulators. That global perspective has not been presented
previously. Another feature of the present study is that, by
integrating TCGA multidimensional molecular data on the
same sample cohorts, we have identified potential drivers and
master regulators associated with the metabolic derangements
observed in our global analysis. While the driver roles of some
alterations identified in affecting metabolism such as TP53
mutation andMYC amplification have been documented, further
efforts will be required to validate the causal relationships of
others.
The metabolic expression subtypes defined here have poten-
tial clinical implications. First, we demonstrate the extensive cor-
relations of metabolic expression subtypes with prognosis
across cancer types, suggesting that the subtypes reflect essen-
tial aspects of tumor development. Notably, different metabolic
expression subtypes showed distinct patterns. The upregulated
Figure 5. Master Regulators Associated with Metabolic Expression Su
(A) Overview of computational algorithms used to identify master transcription fa
(B) Network view of ‘‘master’’ transcription factors associated with metabolic expr
the connection was identified. Only the connections identified in R3 cancer type
(C) Network view of ‘‘master’’ miRNA regulators.
(D) MiRNA hsa-miR-320a identified as a master regulator for expression subtype
SCNAs of hsa-miR-320a lead to a lower expression in the samples of downre
expressed in the downregulated subtype. The middle line in the box is the media
whiskers extend to 1.53 interquartile range of the lower quartile and the upper q
subtypes of carbohydrates, nucleotides, and vitamins & cofac-
tors were associated with worse prognosis, whereas lipid meta-
bolism showed the opposite association. Regardless of underly-
ing reasons, that observation suggests a more complex
relationship betweenmetabolic reprogramming and cell prolifer-
ation than usually assumed. Second, using CCLE data, we
demonstrate that the metabolic subtypes correlate with sensi-
tivity to drugs used in the clinic, highlighting the possibility that
metabolic status will sometimes be important to consider in se-
lection of a treatment regime. Overall, the results here support
the potential utility of metabolic expression subtypes as prog-
nostic and predictive markers.
Since metabolic reprogramming is an essential aspect of
tumorigenesis and cancer cell proliferation, inhibition of meta-
bolic functions may inhibit tumor progression. Current strate-
gies for considering the effect of metabolism on therapy focus
on functionally important metabolic isoenzymes that show
cancer-specific somatic or expression changes. There have
been a number of studies along those lines (Vander Heiden
and DeBerardinis, 2017), but targeting of metabolic genes for
therapy has had only very limited success (Vander Heiden
and DeBerardinis, 2017). Our systems-biological analysis sug-
gests a generic therapeutic strategy. For upregulated meta-
bolic subtypes that are consistently associated with worse
patient prognosis, tumors may be vulnerable to a therapy, or
component of combination therapy, that targets their master
regulatory factors. Inhibiting responsible master regulators
has the potential to convert the upregulated subtype to
the downregulated subtype, thereby conferring a survival
benefit. Our functional validation results provide preliminary
but exciting evidence supporting that hypothesis, and further
studies will be required.
STAR+METHODS
Detailed methods are provided in the online version of this paper
and include the following:
d KEY RESOURCES TABLE
d CONTACT FOR REAGENT AND RESOURCE SHARING
d EXPERIMENTAL MODEL AND SUBJECT DETAILS
d METHOD DETAILS
btypes
ctors.
ession s
s are sh
s of the
gulated
n, and
uartile,
B Analysis of metabolic pathway genes and metabolite
profiling data in breast cancer samples
B Metabolic expression subtype classification
B Clinical relevance analysis of metabolic expression
subtypes
B Somatic driver association analysis
ubtype. The line thickness indicates the number of cancer types where
own.
nucleotide metabolism pathway in stomach adenocarcinoma (STAD).
subtype. Its target genes are significantly enriched in genes highly
the bottom and top of the box are the first and third quartiles, and the
respectively.
Cell Reports 23, 255–269, April 3, 2018 265

A B
C D
E F
Figure 6. Effects of Master Regulators on Carbohydrate Metabolism
(A) Systematic view of metabolic reprogramming across cancer types.
(B) The network shows that master TFs for carbohydrate metabolism identified in R3 cancer types whose upregulated subtypes showed significant worse
prognosis, and these master regulators have R150 target genes and higher expression levels in the upregulated subtypes.
(C and D) Master regulator expression level in three carbohydrate metabolic expression subtypes: SNAI1 in lung adenocarcinoma (LUAD) (C) and RUNX1
in sarcoma (SARC) (D). The middle line in the box is the median, and the bottom and top of the box are the first and third quartiles, and the whiskers extend to
1.53 interquartile range of the lower quartile and the upper quartile, respectively.
(E and F) Relative abundance of intracellular glucose in the NCIH1975 cell line (control) and the cell line with shRNA-mediated SNAI1 knockdown (E) and in the
U2OS cell line (control) and the cell line with shRNA-mediated RUNX1 knockdown (F) at three time points (0 hr, 6 hr, and 24 hr). p value was based on paired t test.
See also Figure S5 and Table S3.
266 C
B Biological pathway association analysis
B Master regulator analysis
B Analysis of CCLE data
B Generation of stable cell lines
B RNA isolation and quantitative real-time PCR
B Glucose measurement by IC-HRMS
B Drug sensitivity assays
ell Reports 23, 255–269, April 3, 2018
d QUANTIFICATION AND STATISTICAL ANALYSIS
d DATA AND SOFTWARE AVAILABILITY
SUPPLEMENTAL INFORMATION
Supplemental Information includes six figures and three tables and can be
found with this article online at https://doi.org/10.1016/j.celrep.2018.03.077.

A
−8
−6
−4
−2
Docetaxel
IC50
(log
10)
Downre
gulat
ed
Neutra
l
Upregu
lated
B
0.0
0.5
1.0
1.5
Docetaxel (16 hr)
Concentration (μM)
* * * * *
Control
shSNAI1
*
0.0
0.5
1.0
1.5
Docetaxel (24 hr)
Concentration (μM)
Control
shSNAI1
* * * * *
C
Downregulated subtype Upregulated subtype
D
Neutral subtype
-5QL.XII.61 (p=4.6x10 )-6FK866 (p=1.1x10 )-4ABT.263 (p=5.3x10 )-3X17.AAG (p=1.4x10 )-5Trametinib (p=3.7x10 )-5RDEA119 (p=4.1x10 )
-4FH535 (p=2.0X10 )-3Embelin (p=1.2x10 )-3Docetaxel (p=2.1x10 )-4AS601245 (p=8.3x10 )-4AKT.inhibitor.VIII (p=3.3x10 )
−2 −1 0 1 2
0.000
0.003
0.008
0.025
0.074
0.222
0.667
2.000
Rel
ativ
e co
nflue
nce
0.000
0.003
0.008
0.025
0.074
0.222
0.667
2.000
-4HG.6.64.1 (p=4.2x10 )
CA
L12T
CO
RL8
8D
MS
79LX
F289
NC
IH10
92N
CIH
1105
NC
IH14
36N
CIH
146
NC
IH16
93N
CIH
1694
NC
IH17
03N
CIH
1836
NC
IH18
76N
CIH
1915
NC
IH19
63N
CIH
2029
NC
IH20
81N
CIH
209
NC
IH23
NC
IH52
4N
CIH
69N
CIH
810
NC
IH83
8A
549
AB
C1
BE
NC
ALU
3C
HAG
OK
1C
OLO
668
CO
RL2
3C
OR
L279
CO
RL9
5D
MS
114
DM
S53
EB
C1
EP
LC27
2HH
AR
AH
CC
33H
CC
366
HC
C44
HC
C78
IALM
KN
S62
LCLC
103H
LCLC
97TM
1LK
2LO
UN
H91
LU65
NC
IH10
48N
CIH
1155
NC
IH12
99N
CIH
1355
NC
IH13
95N
CIH
1435
NC
IH14
37N
CIH
1568
NC
IH15
73N
CIH
1581
NC
IH16
23N
CIH
1648
NC
IH16
50N
CIH
1651
NC
IH16
66N
CIH
1734
NC
IH17
81N
CIH
1838
NC
IH18
69N
CIH
1944
NC
IH19
6N
CIH
2066
NC
IH20
85N
CIH
211
NC
IH21
10N
CIH
2170
NC
IH21
71N
CIH
2172
NC
IH21
96N
CIH
2227
NC
IH22
28N
CIH
226
NC
IH22
91N
CIH
2347
NC
IH24
05N
CIH
2444
NC
IH29
2N
CIH
358
NC
IH44
1N
CIH
446
NC
IH52
0N
CIH
522
NC
IH52
6N
CIH
647
NC
IH65
0N
CIH
727
NC
IH82
NC
IH84
1P
C14
RE
RFL
CK
JR
ER
FLC
SQ
1S
BC
5S
HP
77S
KLU
1S
W12
71S
W15
73S
W90
0C
ALU
6C
OR
L105
DM
S27
3E
KV
XH
CC
15H
CC
827
HO
P62
HO
P92
NC
IH13
41N
CIH
1563
NC
IH17
55N
CIH
1792
NC
IH17
93N
CIH
1975
NC
IH20
09N
CIH
2023
NC
IH20
30N
CIH
2087
NC
IH21
22N
CIH
2342
NC
IH46
0N
CIH
596
NC
IH66
1R
ER
FLC
MS
SK
ME
S1
(NCIH1975) (NCIH1975)
Z scores of log transformed IC50 values
Rel
ativ
e co
nflue
nce
Figure 7. Carbohydrate Expression Subtypes Are Informative about Drug Sensitivity
(A) Heatmap showing drug sensitivity variation across lung cancer cell lines. Those lung cancer cell lines were classified into downregulated, neutral, and
upregulated carbohydrate metabolic subtypes using the same method as for TCGA patient samples. All the drugs with a significant difference of IC50 (log-
transformed) among the three subtypes (FDR < 0.05) are shown.
(B) The distributions showing the log-transformed IC50 values of docetaxel in the carbohydrate metabolic expression subtypes.
(C and D) The effect of SNAI1 knockdown in NCIH1975 cells on drug response of docetaxel at 16 hr (C) and 24 hr (D). Data are represented as mean ± SE.
Compared to negative control (scrambled shRNA), *p < 0.05.
See also Figure S6.
ACKNOWLEDGMENTS
This study was supported by grants from the U.S. National Institutes of Health
(R01CA175486 and U24CA209851 to H.L., U54HG003273, U54HG003067,
U54HG003079, U24CA143799, U24CA143835, U24CA143840, U24CA143843,
U24CA143845, U24CA143848, U24CA143858, U24CA143866, U24CA143867,
U24CA143882, U24CA143883, U24CA144025, P30CA016672); grants from the
Cancer Prevention and Research Institute of Texas (RP140462 to H.L. and
RP130397 that supports the Metabolomics Core Facility); and a University of
Texas System STARS award (to H.L.). We thank the MD Anderson high-perfor-
mance computing core facility for computing, Dr. Zahid H. Siddik for providing
NCIH1975 cell line, and LeeAnn Chastain for editorial assistance.
AUTHOR CONTRIBUTIONS
O.F.B. and H.L. conceived and designed the study. X.P., Z.C., F.F., Y.W., F.C.,
D.D., Z.G., J.L., G.V.T., K.B., H.Z., Z.Z., C.M., J.N.W., O.F.B., and H.L. per-
formed data analysis. X.X., P.L., L.T., and K.M. performed experiments.
X.P., Z.C., F.F., F.C., O.F.B., and H.L. wrote the manuscript with inputs from
other authors. H.L. supervised the whole project.
DECLARATION OF INTERESTS
Michael Seiler, Peter G. Smith, Ping Zhu, Silvia Buonamici, and Lihua Yu are
employees of H3 Biomedicine, Inc. Parts of this work are the subject of a pat-
ent application: WO2017040526 titled ‘‘Splice variants associated with neo-
morphic sf3b1 mutants.’’ Shouyoung Peng, Anant A. Agrawal, James Pala-
cino, and Teng Teng are employees of H3 Biomedicine, Inc. Andrew D.
Cherniack, Ashton C. Berger, and Galen F. Gao receive research support
from Bayer Pharmaceuticals. Gordon B. Mills serves on the External Scientific
Review Board of Astrazeneca. Anil Sood is on the Scientific Advisory Board for
Kiyatec and is a shareholder in BioPath. Jonathan S. Serody receives funding
from Merck, Inc. Kyle R. Covington is an employee of Castle Biosciences, Inc.
Preethi H. Gunaratne is founder, CSO, and shareholder of NextmiRNA Thera-
peutics. Christina Yau is a part-time employee/consultant at NantOmics. Franz
X. Schaub is an employee and shareholder of SEngine PrecisionMedicine, Inc.
Carla Grandori is an employee, founder, and shareholder of SEngine Precision
Medicine, Inc. Robert N. Eisenman is a member of the Scientific Advisory
Boards and shareholder of Shenogen Pharma and Kronos Bio. Daniel J. Wei-
senberger is a consultant for Zymo Research Corporation. Joshua M. Stuart is
the founder of Five3 Genomics and shareholder of NantOmics. Marc T.
Goodman receives research support from Merck, Inc. Andrew J. Gentles is
a consultant for Cibermed. Charles M. Perou is an equity stock holder, consul-
tant, and Board of Directors member of BioClassifier and GeneCentric Diag-
nostics and is also listed as an inventor on patent applications on the Breast
PAM50 and Lung Cancer Subtyping assays. Matthew Meyerson receives
research support from Bayer Pharmaceuticals; is an equity holder in, consul-
tant for, and Scientific Advisory Board chair for OrigiMed; and is an inventor of
a patent for EGFR mutation diagnosis in lung cancer, licensed to LabCorp.
Eduard Porta-Pardo is an inventor of a patent for domainXplorer. Han Liang
Cell Reports 23, 255–269, April 3, 2018 267

is a shareholder and scientific advisor of Precision Scientific and Eagle Nebula.
Da Yang is an inventor on a pending patent application describing the use of
antisense oligonucleotides against specific lncRNA sequence as diagnostic
and therapeutic tools. Yonghong Xiao was an employee and shareholder of
TESARO, Inc. Bin Feng is an employee and shareholder of TESARO, Inc.
Carter Van Waes received research funding for the study of IAP inhibitor
ASTX660 through a Cooperative Agreement between NIDCD, NIH, and Astex
Pharmaceuticals. Raunaq Malhotra is an employee and shareholder of Seven
Bridges, Inc. Peter W. Laird serves on the Scientific Advisory Board for
AnchorDx. Joel Tepper is a consultant at EMD Serono. Kenneth Wang serves
on the Advisory Board for Boston Scientific, Microtech, and Olympus. Andrea
Califano is a founder, shareholder, and advisory board member of
DarwinHealth, Inc. and a shareholder and advisory board member of Tempus,
Inc. Toni K. Choueiri serves as needed on advisory boards for Bristol-Myers
Squibb, Merck, and Roche. Lawrence Kwong receives research support
from Array BioPharma. Sharon E. Plon is a member of the Scientific Advisory
Board for Baylor Genetics Laboratory. Beth Y. Karlan serves on the Advisory
Board of Invitae.
Received: July 17, 2017
Revised: January 20, 2018
Accepted: March 19, 2018
Published: April 3, 2018
REFERENCES
Aytes, A., Mitrofanova, A., Lefebvre, C., Alvarez, M.J., Castillo-Martin, M.,
Zheng, T., Eastham, J.A., Gopalan, A., Pienta, K.J., Shen, M.M., et al.
(2014). Cross-species regulatory network analysis identifies a synergistic inter-
action between FOXM1 and CENPF that drives prostate cancer malignancy.
Cancer Cell 25, 638–651.
Barretina, J., Caponigro, G., Stransky, N., Venkatesan, K., Margolin, A.A., Kim,
S., Wilson, C.J., Lehar, J., Kryukov, G.V., Sonkin, D., et al. (2012). The Cancer
Cell Line Encyclopedia enables predictive modelling of anticancer drug sensi-
tivity. Nature 483, 603–607.
Cancer Genome Atlas Research Network; Analysis Working Group: Asan Uni-
versity; BC Cancer Agency; Brigham and Women’s Hospital; Broad Institute;
Brown University; Case Western Reserve University; Dana-Farber Cancer
Institute; Duke University; et al (2017). Integrated genomic characterization
of oesophageal carcinoma. Nature 541, 169–175.
Chan, B., Manley, J., Lee, J., and Singh, S.R. (2015). The emerging roles of mi-
croRNAs in cancer metabolism. Cancer Lett. 356 (2 Pt A), 301–308.
Claus, E.B., Walsh, K.M., Wiencke, J.K., Molinaro, A.M., Wiemels, J.L.,
Schildkraut, J.M., Bondy, M.L., Berger, M., Jenkins, R., and Wrensch, M.
(2015). Survival and low-grade glioma: the emergence of genetic information.
Neurosurg. Focus 38, E6.
Dang, L., White, D.W., Gross, S., Bennett, B.D., Bittinger, M.A., Driggers, E.M.,
Fantin, V.R., Jang, H.G., Jin, S., Keenan,M.C., et al. (2009). Cancer-associated
IDH1 mutations produce 2-hydroxyglutarate. Nature 462, 739–744.
DeBerardinis, R.J., and Chandel, N.S. (2016). Fundamentals of cancer meta-
bolism. Sci. Adv. 2, e1600200.
Eckel-Passow, J.E., Lachance, D.H., Molinaro, A.M., Walsh, K.M., Decker,
P.A., Sicotte, H., Pekmezci, M., Rice, T., Kosel, M.L., Smirnov, I.V., et al.
(2015). Glioma Groups Based on 1p/19q, IDH, and TERT Promoter Mutations
in Tumors. N. Engl. J. Med. 372, 2499–2508.
Fabregat, A., Sidiropoulos, K., Garapati, P., Gillespie, M., Hausmann, K., Haw,
R., Jassal, B., Jupe, S., Korninger, F., McKay, S., et al. (2016). The Reactome
pathway Knowledgebase. Nucleic Acids Res. 44 (D1), D481–D487.
Gaude, E., and Frezza, C. (2016). Tissue-specific and convergent metabolic
transformation of cancer correlates with metastatic potential and patient sur-
vival. Nat. Commun. 7, 13041.
Haider, S., McIntyre, A., van Stiphout, R.G., Winchester, L.M., Wigfield, S.,
Harris, A.L., and Buffa, F.M. (2016). Genomic alterations underlie a pan-cancer
metabolic shift associated with tumour hypoxia. Genome Biol. 17, 140.
268 Cell Reports 23, 255–269, April 3, 2018
Hakimi, A.A., Reznik, E., Lee, C.H., Creighton, C.J., Brannon, A.R., Luna, A.,
Aksoy, B.A., Liu, E.M., Shen, R., Lee, W., et al. (2016). An integrated metabolic
atlas of clear cell renal cell carcinoma. Cancer Cell 29, 104–116.
Hanahan, D., and Weinberg, R.A. (2011). Hallmarks of cancer: the next gener-
ation. Cell 144, 646–674.
Haverty, P.M., Lin, E., Tan, J., Yu, Y., Lam, B., Lianoglou, S., Neve, R.M.,
Martin, S., Settleman, J., Yauch, R.L., and Bourgon, R. (2016). Reproducible
pharmacogenomic profiling of cancer cell line panels. Nature 533, 333–337.
Hay, N. (2016). Reprogramming glucose metabolism in cancer: can it be ex-
ploited for cancer therapy? Nat. Rev. Cancer 16, 635–649.
Hu, J., Locasale, J.W., Bielas, J.H., O’Sullivan, J., Sheahan, K., Cantley, L.C.,
Vander Heiden, M.G., and Vitkup, D. (2013). Heterogeneity of tumor-induced
gene expression changes in the human metabolic network. Nat. Biotechnol.
31, 522–529.
Iorio, F., Knijnenburg, T.A., Vis, D.J., Bignell, G.R., Menden, M.P., Schubert,
M., Aben, N., Goncalves, E., Barthorpe, S., Lightfoot, H., et al. (2016). A Land-
scape of Pharmacogenomic Interactions in Cancer. Cell 166, 740–754.
Kruiswijk, F., Labuschagne, C.F., and Vousden, K.H. (2015). p53 in survival,
death and metabolic health: a lifeguard with a licence to kill. Nat. Rev. Mol.
Cell Biol. 16, 393–405.
Lachmann, A., Giorgi, F.M., Lopez, G., and Califano, A. (2016). ARACNe-AP:
gene network reverse engineering through adaptive partitioning inference of
mutual information. Bioinformatics 32, 2233–2235.
Lawrence, M.S., Stojanov, P., Polak, P., Kryukov, G.V., Cibulskis, K.,
Sivachenko, A., Carter, S.L., Stewart, C., Mermel, C.H., Roberts, S.A., et al.
(2013). Mutational heterogeneity in cancer and the search for new cancer-
associated genes. Nature 499, 214–218.
Lefebvre, C., Rajbhandari, P., Alvarez, M.J., Bandaru, P., Lim, W.K., Sato, M.,
Wang, K., Sumazin, P., Kustagi, M., Bisikirska, B.C., et al. (2010). A human
B-cell interactome identifies MYB and FOXM1 as master regulators of prolifer-
ation in germinal centers. Mol. Syst. Biol. 6, 377.
Mermel, C.H., Schumacher, S.E., Hill, B., Meyerson, M.L., Beroukhim, R., and
Getz, G. (2011). GISTIC2.0 facilitates sensitive and confident localization of the
targets of focal somatic copy-number alteration in human cancers. Genome
Biol. 12, R41.
Mootha, V.K., Lindgren, C.M., Eriksson, K.-F., Subramanian, A., Sihag, S.,
Lehar, J., Puigserver, P., Carlsson, E., Ridderstrale, M., Laurila, E., et al.
(2003). PGC-1a-responsive genes involved in oxidative phosphorylation are
coordinately downregulated in human diabetes. Nat. Genet. 34, 267–273.
Nilsson, R., Jain, M., Madhusudhan, N., Sheppard, N.G., Strittmatter, L.,
Kampf, C., Huang, J., Asplund, A., andMootha, V.K. (2014). Metabolic enzyme
expression highlights a key role for MTHFD2 and the mitochondrial folate
pathway in cancer. Nat. Commun. 5, 3128.
Pavlova, N.N., and Thompson, C.B. (2016). The Emerging Hallmarks of Cancer
Metabolism. Cell Metab. 23, 27–47.
Reznik, E., and Sander, C. (2015). Extensive decoupling of metabolic genes in
cancer. PLoS Comput. Biol. 11, e1004176.
Rottiers, V., and Naar, A.M. (2012). MicroRNAs in metabolism and metabolic
disorders. Nat. Rev. Mol. Cell Biol. 13, 239–250.
Shannon, P., Markiel, A., Ozier, O., Baliga, N.S.,Wang, J.T., Ramage, D., Amin,
N., Schwikowski, B., and Ideker, T. (2003). Cytoscape: a software environment
for integrated models of biomolecular interaction networks. Genome Res. 13,
2498–2504.
Sørlie, T., Perou, C.M., Tibshirani, R., Aas, T., Geisler, S., Johnsen, H., Hastie,
T., Eisen, M.B., van de Rijn, M., Jeffrey, S.S., et al. (2001). Gene expression
patterns of breast carcinomas distinguish tumor subclasses with clinical impli-
cations. Proc. Natl. Acad. Sci. USA 98, 10869–10874.
Stine, Z.E., Walton, Z.E., Altman, B.J., Hsieh, A.L., and Dang, C.V. (2015).
MYC, Metabolism, and Cancer. Cancer Discov. 5, 1024–1039.
Subramanian, A., Tamayo, P., Mootha, V.K., Mukherjee, S., Ebert, B.L.,
Gillette, M.A., Paulovich, A., Pomeroy, S.L., Golub, T.R., Lander, E.S., andMe-
sirov, J.P. (2005). Gene set enrichment analysis: a knowledge-based approach

for interpreting genome-wide expression profiles. Proc. Natl. Acad. Sci. USA
102, 15545–15550.
Terunuma, A., Putluri, N., Mishra, P., Mathe, E.A., Dorsey, T.H., Yi, M.,Wallace,
T.A., Issaq, H.J., Zhou, M., Killian, J.K., et al. (2014). MYC-driven accumulation
of 2-hydroxyglutarate is associated with breast cancer prognosis. J. Clin.
Invest. 124, 398–412.
Vander Heiden, M.G., and DeBerardinis, R.J. (2017). Understanding the Inter-
sections between Metabolism and Cancer Biology. Cell 168, 657–669.
Vander Heiden, M.G., Cantley, L.C., and Thompson, C.B. (2009). Understand-
ing the Warburg effect: the metabolic requirements of cell proliferation. Sci-
ence 324, 1029–1033.
Vaquerizas, J.M., Kummerfeld, S.K., Teichmann, S.A., and Luscombe, N.M.
(2009). A census of human transcription factors: function, expression and evo-
lution. Nat. Rev. Genet. 10, 252–263.
Ward, P.S., Patel, J., Wise, D.R., Abdel-Wahab, O., Bennett, B.D., Coller, H.A.,
Cross, J.R., Fantin, V.R., Hedvat, C.V., Perl, A.E., et al. (2010). The common
feature of leukemia-associated IDH1 and IDH2 mutations is a neomorphic
enzyme activity converting alpha-ketoglutarate to 2-hydroxyglutarate. Cancer
Cell 17, 225–234.
Ward, P.S., and Thompson, C.B. (2012). Metabolic reprogramming: a cancer
hallmark even warburg did not anticipate. Cancer Cell 21, 297–308.
Weinstein, J.N., Collisson, E.A., Mills, G.B., Shaw, K.R., Ozenberger, B.A., Ell-
rott, K., Shmulevich, I., Sander, C., and Stuart, J.M.; Cancer Genome Atlas
Research Network (2013). The Cancer Genome Atlas Pan-Cancer analysis
project. Nat. Genet. 45, 1113–1120.
Zack, T.I., Schumacher, S.E., Carter, S.L., Cherniack, A.D., Saksena, G.,
Tabak, B., Lawrence, M.S., Zhsng, C.Z., Wala, J., Mermel, C.H., et al.
(2013). Pan-cancer patterns of somatic copy number alteration. Nat. Genet.
45, 1134–1140.
Cell Reports 23, 255–269, April 3, 2018 269

STAR+METHODS
KEY RESOURCES TABLE
REAGENT or RESOURCE SOURCE IDENTIFIER
Chemical, Peptides, and Recombinant Proteins
RPMI 1640 Corning, NY, USA Cat#10-040-CV
Fetal bovine serum GIBCO Cat#16140-071
DMEM with 4.5 g/L glucose,
L-glutamine, & sodium pyruvate
Corning, NY, USA Cat#10-013-CV
Puromycin GIBCO Cat#A1113803; CAS:58-58-2
Docetaxel ENZO, New York, USA Cat#BML-T129; CAS: 114977-28-5
DMSO MP Biomedicals LLC, France Cat#02196055; CAS: 67-68-5
Formic acid VWR EM-FX0440-5
Acetonitrile Fisher Scientific A955-4
Methanol Fisher Scientific A456-4
Acetic acid Fisher Scientific A38-212
Chemical Commercial Assays
High-Capacity cDNA Reverse Transcription Kit Applied Biosystems, CA, USA Cat#4374967
RNeasy Plus Mini Kit QIAGEN, Hilden, Germany Cat#74136
SYBR(R) Select Master Mix Life technologies, CA, USA Applied Biosystems, CA, USA Cat#4472908
Deposited Data
TCGA gene expression data Genomic Data Commons https://gdc.cancer.gov/about-data/
publications/pancanatlas
TCGA somatic mutation data Genomic Data Commons https://gdc.cancer.gov/about-data/
publications/pancanatlas
TCGA somatic copy number alteration data Genomic Data Commons https://gdc.cancer.gov/about-data/
publications/pancanatlas
TCGA miRNA-seq data Genomic Data Commons https://gdc.cancer.gov/about-data/
publications/pancanatlas
TCGA patient clinic data and purity data Genomic Data Commons https://gdc.cancer.gov/about-data/
publications/pancanatlas
Experimental Models: Cell lines
Human: NCIH1975 cells Laboratory of Dr. Zahid H. Siddik,
MD Anderson Cancer Center, TX, USA
N/A
Human: U2OS cells MD Anderson Characterized Cell Line
Core Facility, TX, USA
N/A
Human: HEK293LTX MD Anderson Characterized Cell Line
Core Facility, TX, USA
N/A
Oligonucleotides
shRNA targeting RUNX1 and SNAI1 Table S3, this paper N/A
Primers for quantitative PCR Table S4, this paper N/A
Recombinant DNA
MISSION� TRC2 pLKO.5-puro Non-Mammalian
shRNA Control Plasmid DNA
Sigma-Aldrich, MO, USA Cat#SHC202
pLKO-puro shRNA constructs Sigma-Aldrich, MO, USA Refer to Table S3
Lentiviral Packaging Mix psPAX2 and pMD2.G Addgene, MA, USA Plasmid# 12260 and 12259
Software and Algorithms
Gene Set Enrichment Analysis (GSEA) (Mootha et al., 2003; Subramanian
et al., 2005)
http://software.broadinstitute.org/
gsea/index.jsp
ARACNe (Lachmann et al., 2016) https://sourceforge.net/projects/
aracne-ap/
(Continued on next page)
e1 Cell Reports 23, 255–269.e1–e4, April 3, 2018

Continued
REAGENT or RESOURCE SOURCE IDENTIFIER
ssmarina (Aytes et al., 2014; Lefebvre et al., 2010) https://figshare.com/articles/
ssmarina_R_system_package/785718
Thermo TraceFinder ThermoFisher Scientific https://www.thermofisher.com/
order/catalog/product/OPTON-30491
CONTACT FOR REAGENT AND RESOURCE SHARING
Further information and requests for resources and reagents should be directed to andwill be fulfilled by the LeadContact, Han Liang
EXPERIMENTAL MODEL AND SUBJECT DETAILS
The NCIH1975 cell line was a generous gift from Dr. Zahid H. Siddik’s laboratory at MD Anderson Cancer Center. HEK293LTX and
U2OS cell lines were obtained fromMD Anderson Characterized Cell Line Core Facility. All cell lines were confirmed by short tandem
repeat (STR) analysis and were negative for mycoplasma contamination prior to use. NCIH1975 cells were cultured in RPMI 1640
medium supplemented with 10% fetal bovine serum. U2OS cells were maintained in DMEM with L-glutamine, 4.5 g/L glucose,
sodium pyruvate and 10% fetal bovine serum.
METHOD DETAILS
Analysis of metabolic pathway genes and metabolite profiling data in breast cancer samplesWe obtained metabolite profiling data and mRNA expression data on 60 breast cancer patients (Terunuma et al., 2014). We focused
the 296 metabolites that had been annotated to the 6 metabolic super pathways including 88 in amino acid, 38 in carbohydrate,
9 in integration of energy, 116 in lipid metabolism, 26 in nucleotide, and 19 in vitamin & cofactor metabolism. For each metabolite,
we calculated the Spearman rank correlations between its abundance and the expression levels of the genes in the corresponding
pathway. Then we compared the empirical cumulative distributions of p values from pathway genes versus other genes using
Kolmogorov-Smirnov test. One-tailed test was used to test whether the p values of the pathway gene set were more significant
than those of other genes at FDR < 0.15. To evaluate whether pathway genes are more informative about metabolic activities
than other gene sets, we performed a simulation analysis. We randomly selected a gene set with the same size of a metabolic
pathway and identified the number of metabolites significantly correlated with the expression of the gene set in the same way as
the metabolic pathway genes. We repeated this analysis for 1,000 times to generate the background distribution of significant
hits from which we assessed the observed numbers were statistically higher than random expectation.
Metabolic expression subtype classificationConsidering the heterogeneity of the metabolic pathway dysregulation in tumors, we developed an algorithm to classify individual
tumors given the gene set of each metabolic pathway. For a specific patient, the classification was based on the deviation extent
of the expression level of genes in a metabolic functional pathway from the average values of the cohort relative to other genes.
For each of the 33 cancer types, Z-normalization was performed per gene across samples. Then, the genes were ranked by Z scores
per sample. GSEA pre-ranked analysis was used to determine whether the genes from ametabolic pathway were enriched at the top
or bottom of the pre-ranked gene list for each sample. For a specific pathway, a tumor sample was classified into one of three distinct
groups at FDR < 0.25: ‘‘upregulated,’’ ‘‘downregulated,’’ or ‘‘neutral.’’ Then we performed self-contained gene analysis to confirm
each subtype classification. Given themetabolic expression subtypes, we first evaluated expression differentiation of protein-coding
genes using ANOVA and then used the Kolmogorov-Smirnov test to determine whether the p values of the pathway genes were
lower than those from other genes (FDR < 0.05). Through this systematic analysis, each tumor sample was labeled with seven kinds
of metabolic expression subtypes. To determine the mutual dependence among those seven classifications, mutual information was
calculated using the R package ‘‘entropy.’’ After normalizing the mutual information by dividing the maximum value for each row, the
mutual information distance was calculated as 1- mutual information.
Clinical relevance analysis of metabolic expression subtypesWe evaluated the correlations of metabolic expression subtypes with two clinical features respectively: the patients’ overall survival
time and established molecular subtype. The R package ‘‘survival’’ was used to perform the overall survival analysis and produce
Kaplan-Meier survival plots. A log-rank test was used to assess the significance (FDR < 0.2). For significant survival associations,
we further assessed whether the subtypes correlated with tumor purity using ANOVA or whether the survival correlations remained
significant after including tumor purity as covariate in Coxmodel. As formolecular subtype analysis, chi-square test was performed to
Cell Reports 23, 255–269.e1–e4, April 3, 2018 e2
access the correlation between tumor subtypes and metabolic expression subtypes (assigned to one of three values, �1, 0, or 1,
FDR < 0.05).
Somatic driver association analysisTo identify oncogenic events that potentially drive metabolic reprogramming, we analyzed the associations of mutation drivers and
SCNA drivers with metabolic expression subtypes in each cancer type. For the mutation analysis, we first excluded 314 hypermu-
tated samples, and only focused on the significantly mutated genes (identified by MutSigCV 1.4, FDR < 0.25) (Lawrence et al., 2013)
with a mutation frequency > 5% for each cancer type. We performed chi-square test to determine the association between the
metabolic expression subtypes and a specific mutated gene status, and reported the significance at FDR < 0.05. For the SCNA anal-
ysis, we assessed the copy number status of known oncogenes or tumor suppressors (Zack et al., 2013) residing in a significant
amplification or deletion peak identified by GISTIC2 (Mermel et al., 2011) in each cancer type by chi-square test (FDR < 0.05).
Biological pathway association analysisTo explore the biological processes responsible for the metabolic reprogramming, we analyzed the correlations between metabolic
expression subtypes with cancer hallmark pathways in each cancer type. The log2 transformed RNA-seq data were used. The seven
selected cancer hallmark pathways were angiogenesis, apoptosis, DNA repair, EMT, G2M checkpoint, inflammatory response and
mTORC1 signaling, and the related gene sets were obtained from MSigDB (http://software.broadinstitute.org/gsea/msigdb). We
used Student’s t tests between upregulated and downregulated subtypes to generate ranked gene lists for each cancer type.
Then, pre-ranked GSEA analysis were used to determine the pathway enrichment or depletion (FDR < 0.01).
Master regulator analysisTo identify TF master regulators, we first inferred the tumor-context-specific GRNs with the expression data (Z score transformed)
from all tumor samples using ARACNe-AP, which is a new Java implementation of the ARACNe (Lachmann et al., 2016). Our analysis
used the list of transcription factors as previously described (Vaquerizas et al., 2009). Then, given the inferred networks, we used the
MARINa (R package ssmarina) to infer master regulators based on the comparison of expression between upregulated and down-
regulated samples for each metabolic expression subtype in each cancer type and performed the shadow analysis to all master reg-
ulators identified with p < 0.05 (Aytes et al., 2014; Lefebvre et al., 2010). We identified master TFs as those passing the shadow anal-
ysis (FDR < 0.1) and havingR 150 target genes. To identify miRNAmaster regulators, we used two criteria: (1) the expression level of
themicroRNA itself showed a significant difference between the two groups (fold-change > 1.2 and p value < 0.01); and (2) themiRNA
target genes that showed differential expression between upregulation and downregulation subtypes were prone to being commonly
regulated by a specific microRNA (FDR < 0.1). GSEA (including annotated miRNA target gene sets) was employed for this analysis
(Subramanian et al., 2005); and the differential direction of the microRNA should be opposite to the expression of the corresponding
target gene set. The network of master regulators andmetabolic subtypes were analyzed by Cytoscape (Shannon et al., 2003). In the
TF networks, each link represented a specific TF identified in at least 3 cancer types. As for miRNA, a link represented a specific
microRNA identified in at least one cancer type.
Analysis of CCLE dataWe downloaded RNaseq-based expression data and gene-level copy number from Cancer Cell Line Encyclopedia (CCLE; https://
portals.broadinstitute.org/ccle) and focused on 181 lung cancer cell lines with gene expression data. Using the same classification
pipeline, we classified them into downregulated, neutral, and upregulated subtypes based on the expression levels from the
carbohydrate pathway. We obtained the drug screening data from Iorio et al. (2016). We performed ANNOVA analysis to determine
whether (log-transformed) IC50 values showed significant difference among the three carbohydrate expression subtypes of cell lines
(FDR < 0.05). We obtained the doubling time data of cancer cell lines from Haverty et al. (2016). We used Wilcoxon rank sum test to
assess whether the doubling time showed a significant difference between carbohydrate downregulated and upregulated subtypes.
Generation of stable cell linesLentiviruses were produced by co-transfection HEK293LTX cells with the MISSION� TRC2 pLKO.5-puro Non-Mammalian shRNA
Control Plasmid DNA orwith the pLKO-puro shRNA constructs (Sigma, shRNA sequences are available in Table S3) and the Lentiviral
Packaging Mix (psPAX2 and pMD2.G). U2OS and NCIH1975 cells were transduced by the lentivirus, and cells with stable knock-
downs were selected using puromycin (2 mg/ml for U2OS and 1 mg/ml for NCIH1975). The knockdown of RUNX1 and SNAI1 in stable
cell lines was confirmed by quantitative real-time PCR.
RNA isolation and quantitative real-time PCRTo examine the effect of the knockdown on potential target genes, total RNA was isolated using the RNeasy Plus Mini Kit (QIAGEN,
Hilden, Germany) and transcribed into cDNA using the High-Capacity cDNA Reverse Transcription Kit (Applied Biosystems, CA,
USA). Reactionswere performed in triplicates using the SYBR�SelectMasterMix (Applied Biosystems) and specific primers (Sigma,
e3 Cell Reports 23, 255–269.e1–e4, April 3, 2018

sequences are available in Table S3). RT-qPCR was performed on an Applied Biosystems 7900HT Fast Real-Time PCR
system (Applied Biosystems). The gene expression levels were normalized to b-actin, and relative expression was calculated by
the 2(–DDCt) method.
Glucose measurement by IC-HRMSWe measured the intracellular abundance of glucose in cell samples using high-resolution mass spectrometry (HRMS) as follows.
Cells were seeded in 10 cm dishes and incubated in fresh medium (DMEM or RPMI-1640 containing 10% or 5% FBS, respectively)
for 0 hr, 6 hr, and 24 hr. Before conducting cell extraction, media samples were collected, flash frozen using liquid nitrogen, and trans-
ferred to�80�C freezer until analysis. Cells were then quickly washed with ice-cold PBS flowed byMilli-Q water to remove extra salt/
medium components. Metabolites were then extracted by adding 500 mL 1% formic acid in 90/10 (v/v) acetonitrile/water. Cell and
medium extracts were then centrifuged at 17,000 g for 5min at 4�C, and supernatants were transferred to clean tubes. Samples were
evaporated to dryness using a SpeedVac. Samples were reconstituted in deionized water, then 10 mL was injected into a Thermo
Scientific Dionex ICS-5000+ capillary ion chromatography (IC) system containing a Thermo IonPac AS11 2503 2 mmwith 4 mmpar-
ticle size. IC flow rate was 300 ml/min (at 30�C) and the gradient conditions were as follows: initial 1 mM KOH, increased to 35 mM
at 25 min, then to 99 mM at 39 min, held 99 mM for 10 min. The total run time was 50 min. Methanol containing 2 mM acetic acid
was delivered by an external pump and mixed with the eluent. Data were acquired using a Thermo Orbitrap Fusion Tribrid Mass
Spectrometer under ESI negative mode. Thermo Trace Finder software was used for metabolite identification and area integration.
The abundance of glucose was normalized by dividing the area of each metabolite by the total signal (summed areas of all
metabolites) for each sample.
Drug sensitivity assaysTo assess changes in drug sensitivity following SNAI1 knockdown, stable cells (1,500 per well) were seeded in 96-well plates in the
complete medium a day before treatment. A 2 mM stock solution of docetaxel (ENZO, New York, USA) was prepared in DMSO and
was further diluted in complete medium to obtain eight serial dilutions such that the final treatment concentrations ranged from
0–2 mM. SNAIL-KD cells and the negative control (scrambled shRNA) cells were treated with DMSO or the various docetaxel dilutions
and cell viability was determined using live imaging (Incucyte Zoom, Essen Biosciences). Phase contrast images (4x objective) were
recorded at 0 hr, 16 hr and 24 hr after treatment initiation and the percentage confluence (a measure of cell viability) was assessed
using the associated software as per manufacturer’s instructions. Relative viability was normalized to the confluence value treated
with DSMO. Docetaxel treatment was repeated independently to ensure reproducibility of the results. The Student’s t test was used
to analyze differences, and p < 0.05 was considered statistically significant.
QUANTIFICATION AND STATISTICAL ANALYSIS
All the analyses were based on 9,125 tumor samples except for miRNA (7,939) due to limited data availability. Definition of signifi-
cance of various statistical tests were described and referenced in their respective Method Details sections.
DATA AND SOFTWARE AVAILABILITY
The raw data, processed data and clinical data can be found at the legacy archive of the GDC (https://portal.gdc.cancer.gov/
legacy-archive/search/f) and the PancanAtlas publication page (https://gdc.cancer.gov/about-data/publications/pancanatlas).
The mutation data can be found here (https://gdc.cancer.gov/about-data/publications/mc3-2017). TCGA data can also be explored
through the Broad Institute FireBrowse portal (http://gdac.broadinstitute.org) and the Memorial Sloan Kettering Cancer Center
cBioPortal (http://www.cbioportal.org). Details for software availability are in the Key Resource Tables.
Cell Reports 23, 255–269.e1–e4, April 3, 2018 e4