molecular characterization and genetic diversity analysis
TRANSCRIPT
Sapota (Achras zapota L.) is one of the delicious fruitof humid tropical and subtropical regions, belongingto the family Sapotaceae. It is also called by other
names, such as chikku, sapota plum, sapodilla or prickly pear.Sapota is a hardy crop and fairly less susceptible to pest
and disease which may be due to the presence of endogenousphenolics substances (Lakshminarayana and Subramanyam,1966). India is a leading producer of sapota with an area andproduction of 1, 58,000 ha and 13, 46,000 metric tonnes,respectively (Anonymous, 2010).
Since, sapota is an open pollinated crop, a great deal ofvariability was thrown up in the population. A few of thecultivars have been selected based on local preferences fordifferent fruit characteristics and later cultivated by farmersthrough vegetative propagation. Therefore, the high geneticvariability in Indian sapota cultivars might have originatedthrough seedling segregation, inter crossing among cultivars
Members of the Research Forum
Associated Authors:1K.R.C. College of Horticulture,Arabhavi, BELGAUM (KARNATAKA)INIDIA
HIND AGRICULTURAL RESEARCH AND TRAINING INSTITUTE
or because of a large number of cultivars or genotypes wereintroduced. Despite its wide cultivation throughout the world,the genetic diversity of the crop has not been studied usingmolecular markers. In sapota, most of the work on variabilityhas been carried out using morphological characteristics suchas tree shape, structure, leaf colour, shape, fruit size and shape(oval and round).
This study appears to be very arbitrary becausemorphological characteristics are influenced by agro-climatic conditions. So far, no studies were carried out toestimate the extent of genetic variability in sapota cultivarsusing either isozymes or DNA markers.
RAPD (pronounced “rapid”) stands for RandomAmplification of Polymorphic DNA. RAPD markers areattractive, because of their simplicity, versatility, modest costand ability to detect even the relatively small amount ofvariation (Ragot and Hoisington, 1993).
Molecular characterization and genetic diversityanalysis of sapota genotypes by RAPD markers
SUHASINI JALAWAADI, R.C. JAGADEESHA1, D. KIRANSHANKAR1,KULAPATI HIPPARAGI1, G. PRABHULING1 AND H.R. BASAVARAJAPPA1
Article history :Received : 08.06.2013Revised : 17.09.2013Accepted : 30.09.2013
Author for correspondence :SUHASINI JALAWAADIK.R.C. College of Horticulture,Arabhavi, BELGAUM (KARNATAKA)
INIDIA
Email : [email protected]
ABSTRACT : To study the molecular characterization of 31 accessions of sapota comprising 19 cultivars,6 land races and 6 hybrids of sapota using PCR based Random Amplified Polymorphic DNA (RAPD)markers. DNA isolated by CTAB method was used for amplification of 48 markers by using 7 RAPDprimers. All 48 polymorphic fragments were used to generate the similarity matrix and construct adendrogram. In this matrix highest genetic similarity of 100 per cent was observed between the ‘DHS-1’and ‘DHS-2’, while least (23 %) was between ‘PKM-3’ and ‘Culcutta Round’. UPGMA (UnweightedPair Group Method with Arithmetical averages) cluster analysis using Jaccard’s co-efficient of similarityof 31 genotypes showed medium to high diversity, which are distributed between the ranges of 35-100 percent. For the 19 cultivars, the maximum similarity of 91 units was found between ‘Murabba’ and ‘Oval’.‘Pala’ and ‘Virudhnagar’ were closely placed due to 71 per cent oval shaped fruits. Among landraces theround shaped fruit bearing landraces were grouped in cluster-I, and ‘Cricket Ball (Udupi)’, ‘Cricket Ball(Sirsi)’ were closely associated with each other as they are having distinctively round shaped fruits andthey are 78 per cent similar. Among hybrids ‘DHS-1’, ‘DHS-2’, ‘PKM-2’, CO-1’ and ‘CO-3’ which aregrouped together because of their oval and round shaped fruits with spreading and single bearing habit.
KEY WORDS : RAPD, Molecular characterization, Jaccard’s co-efficient
HOW TO CITE THIS ARTICLE : Jalawaadi, Suhasini, Jagadeesha, R.C., Kiranshankar, D., Hipparagi, Kulapati,Prabhuling, G. and Basavarajappa, H.R. (2013). Molecular characterization and genetic diversity analysis of sapotagenotypes by RAPD markers. Asian J. Hort., 8(2) : 526-533.
Research Paper
THEASIAN JOURNAL OF HORTICULTURE
Volume 8 | Issue 2 | December, 2013 | 526-533
Hind Agricultural Research and Training InstituteAsian J. Hort., 8(2) Dec., 2013 : 527
RESEARCH METHODSPlant material :
Leaf samples of the 31 sapota genotypes studied in thisresearch were obtained from All India Co-ordinated ResearchProject on Tropical Fruits, K.R.C. College of Horticulture,Arabhavi (Karnataka).
Sample preparation:The leaf samples for DNA extraction were prepared
according to Tai and Tanksley (1990) with somemodifications. The recently matured leaves that were freefrom damage caused by pests and diseases and availablethroughout the year were used for isolation of DNA.Approximately 150- 200 mg of leaf samples were groundedin effendorf tube by micro pestle for 5 – 10 minutes usingextraction buffer.
DNA extraction:Isolation of total genomic DNA of sapota was carried
out according to Porebski et al. (1997), using CTAB withsome modifications. 200 mg leaf samples were groundedwith 750 ml extraction buffer (2 % CTAB, 100 mm Tris pH8.0, 25 mm EDTA pH 8.0, 2m Nacl, 2% PVP and 2% -marcaptoethonal) was incubated at 65 oC for 1 hour, themixture was cooled to room temperature and 200 µl ofchloroform: isoamyl alcohol (24:1 v/v) was added and themixture was gently vortexed and spun at 6000 rpm at 100 Cfor 15 minutes and the supernatant was decanted and 500 µlchloroform: isoamyl alcohol (24:1 v/v) was added andcontents were mixed and spun at 6000 rpm at 10 oC for 15minutes. The supernatant was carefully decanted. This stepwas again repeated for one more time. To supernatantsolution 0.6 (300 ml) volume of isopropanal was added, thattubes were incubated at -200 C for one hour. The contents ofthe tube were centrifuged at 6000 rpm at 100C for 10 minutes,the supernatant was discarded and the pellet was washed twicewith 70 per cent ethanol. The DNA pellet was dried at 370 Cfor 30 minutes the dried DNA pellet was dissolved in 125 µlof Tris EDTA (pH 8.00) buffer containing RNase (20 µg)and incubated at 370 C for one hour. Later DNA sample wastreated with to remove RNA. The amount of DNA of all thesamples was measured by spectrophotometer. Thetransmitance or absorbance red at A
260/A
280. The quantity of
DNA was calculated by using formula :
200Dilution1000
factordilution50Amg/mlDNA 26
DNA amplification:The basic protocol reported by Williams et al. (1990)
for PCR was followed with slight modifications. The PCRreaction was carried out in 20 µl reaction mixture containing
40 ng template DNA, 0.3 µM primer, 0.3 units of Taqpolymerase and 100 mM each dNTPs. Amplification wasperformed in a thermal cycler (Thermo Electro Corporation)for 38 cycle after on initial denaturtion at 940 C for 5 minutes.In each cycle, denaturation for one minute at 940 C, annealingfor one minute at 380 C and extension step at 720 C for 1.5minutes after the 38th cycle with final extension step of tenminutes at 720 C and 40 C hold.
DNA electrophoresis:Amplified DNA fragments were separated out on 0.8
per cent agarose gel stained with ethidium bromide (10 mg/ml). Running buffer containing Tris- base, boric acid andEDTA (pH 8.0) was used for electrophoresis and forpreparing gels. Wells were loaded with 20 µl of reactionvolume and 5 µ l of bromophenol blue together.Electrophoresis was conducted at 80-90 volts for 3-4 hoursand gel was photographed under UV light by using a gel docksystem (Bio-Vis).
DNA analysis:The presence of a RAPD band in each position was
recorded as 1 and its absence as 0. RAPD bands for eachprimer were scored separately. ‘NTSYS’ Ver 2.0i package(Rohlf, 1993) a computer application was used to generateJaccard’s co-effecient of similarity matrix, which was laterused to construct a dendrograme of UPGMA (UnweightedPair Group Method with Arithimetical averages). Co-efficient of Jaccard’s (SJ) = n
AB/n
A+n
B= n
AB is the number
of bands common for samples A and B, nA is the total number
of bands in sample A and nB is the total number of bands in
sample B.
RESEARCH FINDINGS AND DISCUSSIONRecently matured leaf samples of different sapota
genotypes which are available throughout the year werecollected. The DNA obtained was amplifiable and of highquality. Spectrophotometer reading of 1.8-1.9 (260 nm per280 nm) confirmed the good quality DNA. DNA isolatedfrom 200 mg leaf using 750 µl of extraction buffer yielded
Table 1 : Synthetic deoxyribonuclotide 10-mer random primersused for genetic analysis of sapota
Primers Nucleotide sequence (5’ to 3’) Number of fragmentsamplified
OPA 04
OPB 03
OPB 06
OPB 08
OPC 02
OPC 08
OPC 05
AATCGGGCTC
CATCCCCCTG
TGCTCTGCCC
GTCCACACGG
GTGAGGCGTC
TGGACCGGTG
GATGACCGCC
04
05
05
07
06
12
09
Total 48
SUHASINI JALAWAADI, R.C. JAGADEESHA, D. KIRANSHANKAR, KULAPATI HIPPARAGI, G. PRABHULING AND H.R. BASAVARAJAPPA
526-535
Hind Agricultural Research and Training InstituteAsian J. Hort., 8(2) Dec., 2013 : 528
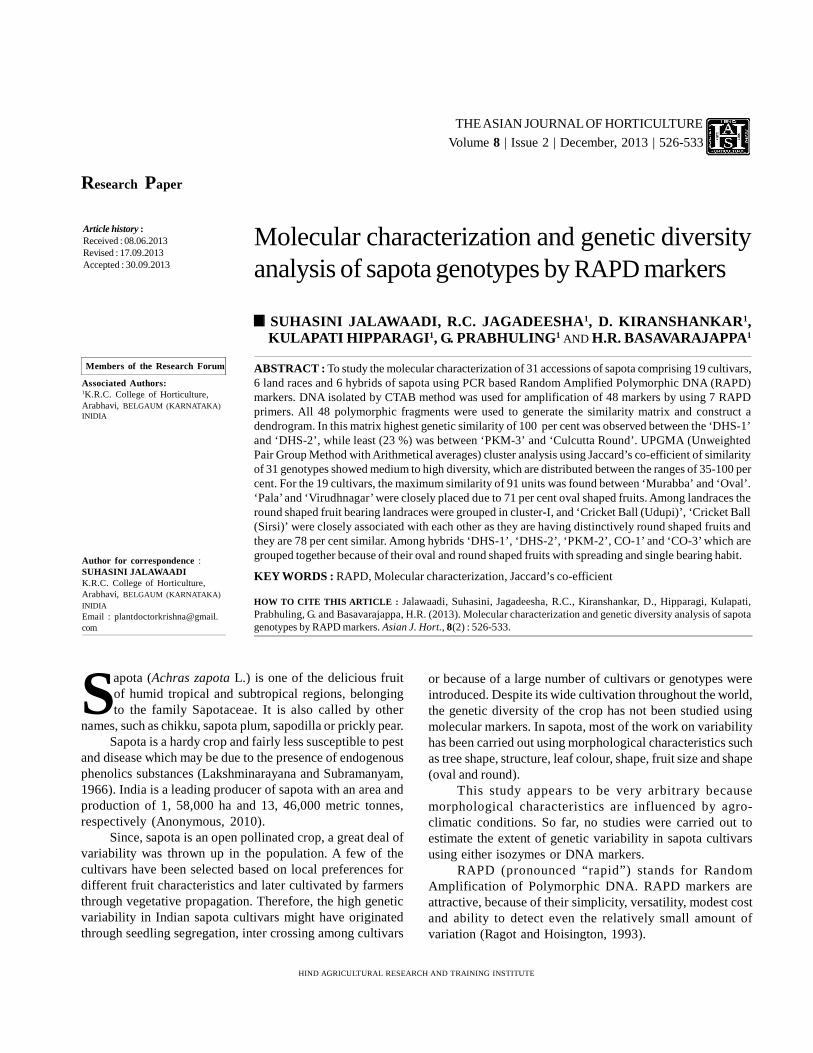
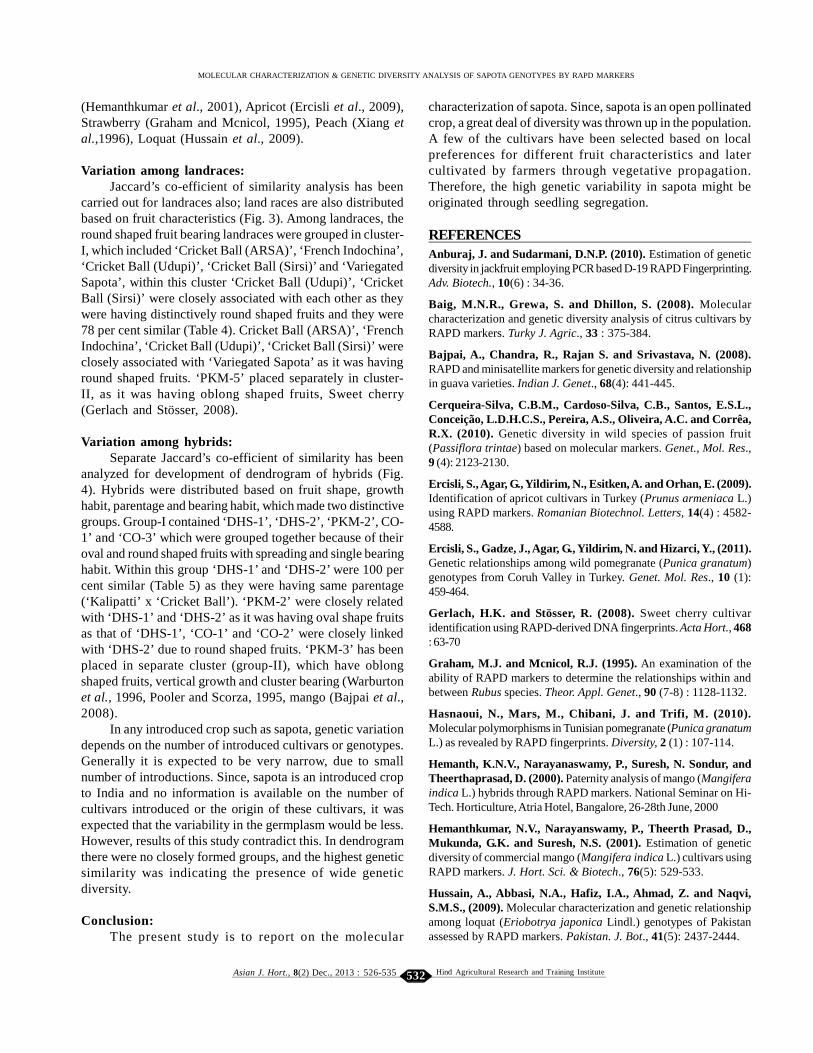
Fig. 1 : Dendrogram of different sapota genotypes (31) according toJaccard’s co-efficient
good quality.In this study, 20 Operon random ten-base long, single
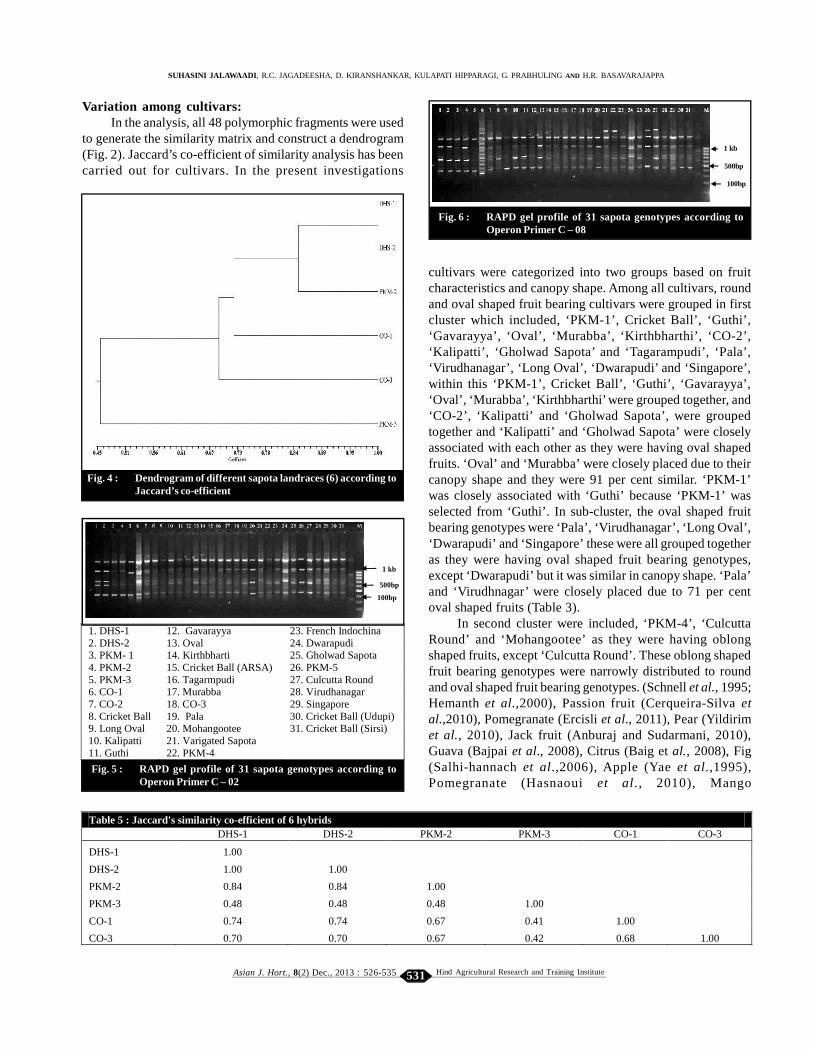
stranded primers (OPA to OPG) were screened among theseseven selected primers amplified unambiguous, readable andreproducible polymorphic bands. A total of 48 amplificationproducts were produced from the selected 7 primers andthe number of bands varied from 5-12 with an average of 7.5bands per primer and the size ranged from 0.1 to 1 kb. Thebands which were more than 100 bp are selected for scoring.The details are presented in Table 1. Each and every individualcould be identified using the gel profiles (Fig. 5 and 6).
In the analysis, all 48 polymorphic fragments were usedto generate the similarity matrix and construct a dendrogram.In this matrix highest genetic similarity of 100 per cent wasobserved between the ‘DHS-1’ and ‘DHS-2’, while least (23%) was between ‘PKM-3’ and ‘Culcutta Round’ (Table 2).UPGMA (Unweighted Pair Group Method with Arithmeticalaverages) cluster analysis using Jaccard’s co-efficient ofsimilarity of 31 genotypes showed medium to high diversity,which are distributed between the ranges of 35-100 per cent(Fig. 1). Genotypes were categorized into two distinctivegroups based on fruit characteristics (shape) and canopyshape. Where oval and round shaped fruit bearing genotypeswere grouped in first cluster and oblong fruit bearinggenotypes are grouped in second cluster. Among oval andround shape fruit bearing genotypes, the round shape fruitbearing genotypes have been grouped in separate sub clusterswhich includes, ‘DHS-1’, ‘DHS-2’, ‘Cricket Ball’, ‘PKM-
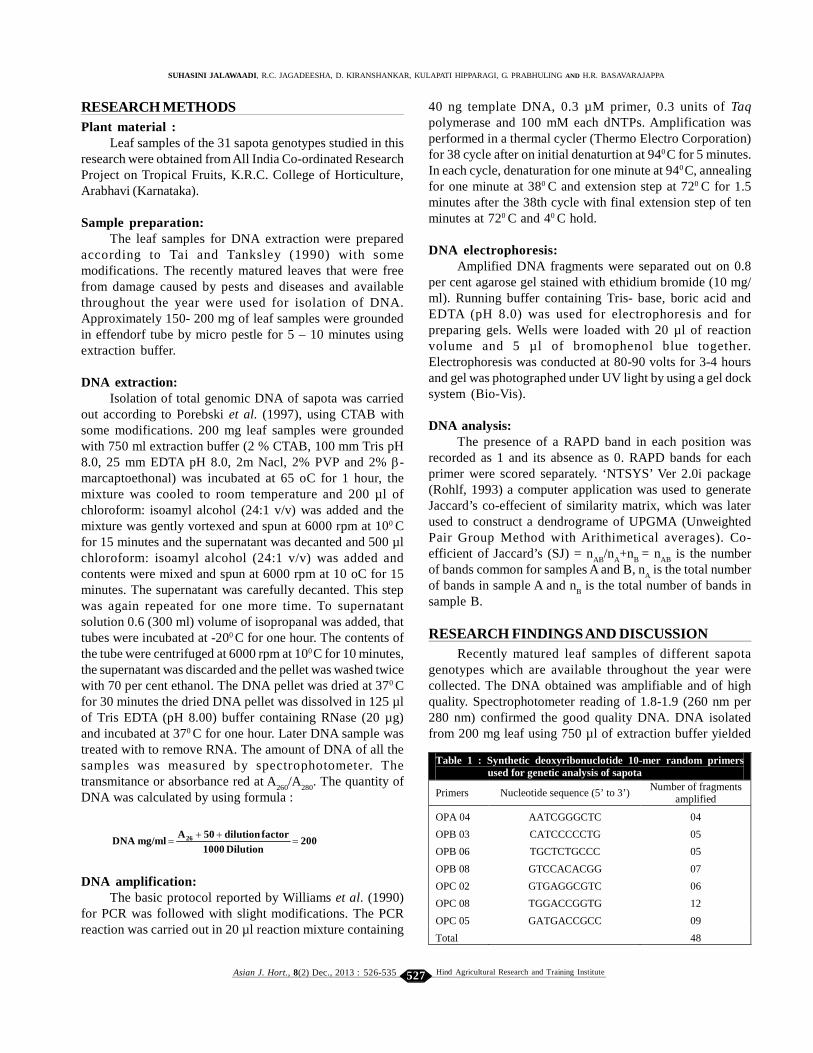
Fig. 2 : Dendrogram of different sapota cultivars (19) according toJaccard’s co-efficient
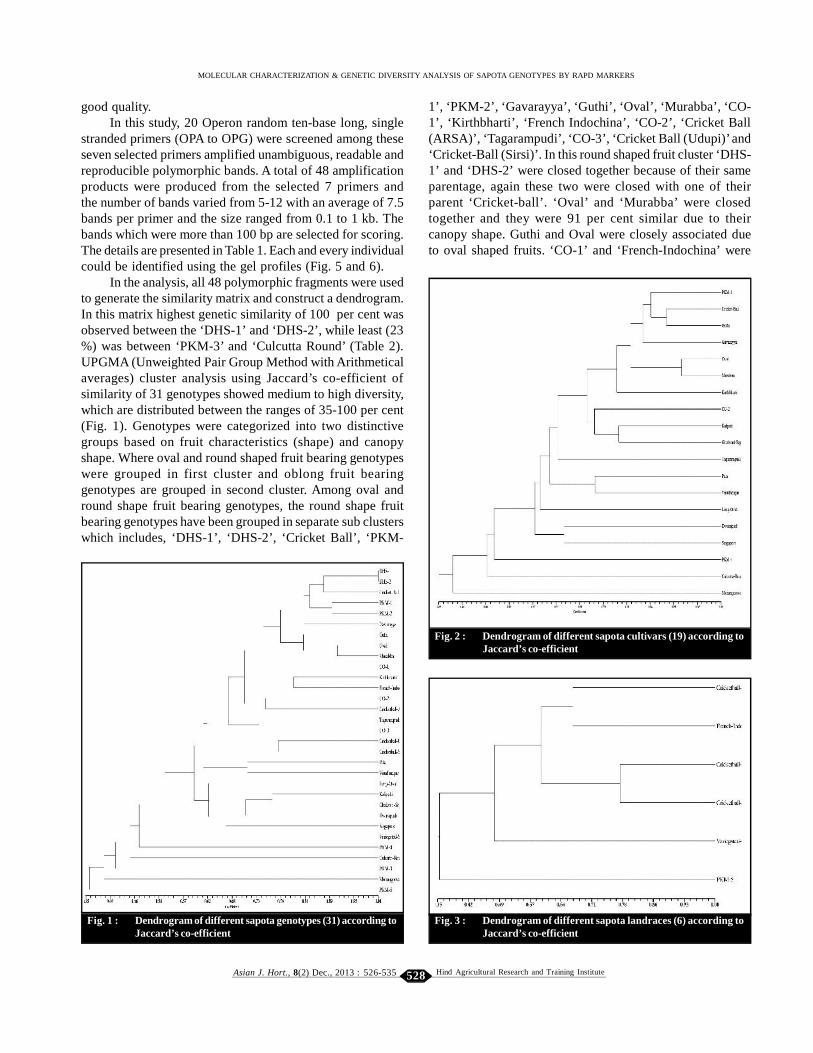
Fig. 3 : Dendrogram of different sapota landraces (6) according toJaccard’s co-efficient
1’, ‘PKM-2’, ‘Gavarayya’, ‘Guthi’, ‘Oval’, ‘Murabba’, ‘CO-1’, ‘Kirthbharti’, ‘French Indochina’, ‘CO-2’, ‘Cricket Ball(ARSA)’, ‘Tagarampudi’, ‘CO-3’, ‘Cricket Ball (Udupi)’ and‘Cricket-Ball (Sirsi)’. In this round shaped fruit cluster ‘DHS-1’ and ‘DHS-2’ were closed together because of their sameparentage, again these two were closed with one of theirparent ‘Cricket-ball’. ‘Oval’ and ‘Murabba’ were closedtogether and they were 91 per cent similar due to theircanopy shape. Guthi and Oval were closely associated dueto oval shaped fruits. ‘CO-1’ and ‘French-Indochina’ were
MOLECULAR CHARACTERIZATION & GENETIC DIVERSITY ANALYSIS OF SAPOTA GENOTYPES BY RAPD MARKERS
526-535
Hind Agricultural Research and Training InstituteAsian J. Hort., 8(2) Dec., 2013 : 529
SUHASINI JALAWAADI, R.C. JAGADEESHA, D. KIRANSHANKAR, KULAPATI HIPPARAGI, G. PRABHULING AND H.R. BASAVARAJAPPA
526-535
Hind Agricultural Research and Training InstituteAsian J. Hort., 8(2) Dec., 2013 : 530
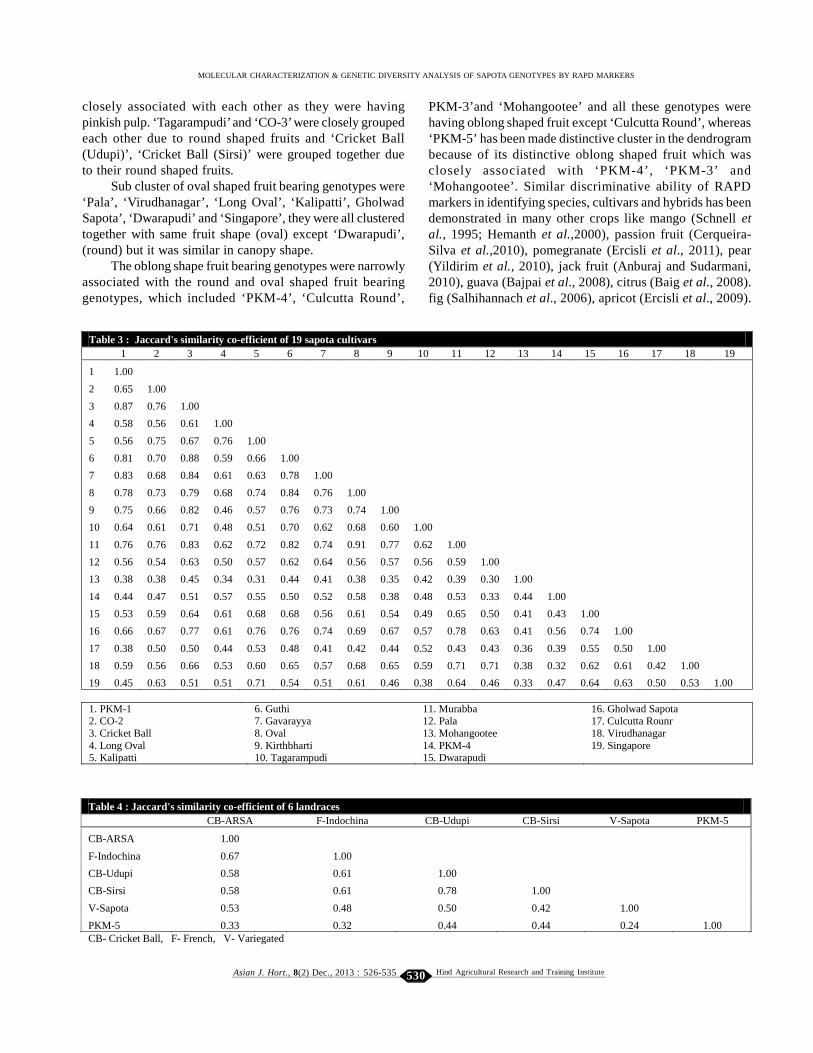
Table 3 : Jaccard's similarity co-efficient of 19 sapota cultivars1 2 3 4 5 6 7 8 9 10 11 12 13 14 15 16 17 18 19
1 1.00
2 0.65 1.00
3 0.87 0.76 1.00
4 0.58 0.56 0.61 1.00
5 0.56 0.75 0.67 0.76 1.00
6 0.81 0.70 0.88 0.59 0.66 1.00
7 0.83 0.68 0.84 0.61 0.63 0.78 1.00
8 0.78 0.73 0.79 0.68 0.74 0.84 0.76 1.00
9 0.75 0.66 0.82 0.46 0.57 0.76 0.73 0.74 1.00
10 0.64 0.61 0.71 0.48 0.51 0.70 0.62 0.68 0.60 1.00
11 0.76 0.76 0.83 0.62 0.72 0.82 0.74 0.91 0.77 0.62 1.00
12 0.56 0.54 0.63 0.50 0.57 0.62 0.64 0.56 0.57 0.56 0.59 1.00
13 0.38 0.38 0.45 0.34 0.31 0.44 0.41 0.38 0.35 0.42 0.39 0.30 1.00
14 0.44 0.47 0.51 0.57 0.55 0.50 0.52 0.58 0.38 0.48 0.53 0.33 0.44 1.00
15 0.53 0.59 0.64 0.61 0.68 0.68 0.56 0.61 0.54 0.49 0.65 0.50 0.41 0.43 1.00
16 0.66 0.67 0.77 0.61 0.76 0.76 0.74 0.69 0.67 0.57 0.78 0.63 0.41 0.56 0.74 1.00
17 0.38 0.50 0.50 0.44 0.53 0.48 0.41 0.42 0.44 0.52 0.43 0.43 0.36 0.39 0.55 0.50 1.00
18 0.59 0.56 0.66 0.53 0.60 0.65 0.57 0.68 0.65 0.59 0.71 0.71 0.38 0.32 0.62 0.61 0.42 1.00
19 0.45 0.63 0.51 0.51 0.71 0.54 0.51 0.61 0.46 0.38 0.64 0.46 0.33 0.47 0.64 0.63 0.50 0.53 1.00
1. PKM-1 6. Guthi 11. Murabba 16. Gholwad Sapota2. CO-2 7. Gavarayya 12. Pala 17. Culcutta Rounr3. Cricket Ball 8. Oval 13. Mohangootee 18. Virudhanagar4. Long Oval 9. Kirthbharti 14. PKM-4 19. Singapore5. Kalipatti 10. Tagarampudi 15. Dwarapudi
Table 4 : Jaccard's similarity co-efficient of 6 landracesCB-ARSA F-Indochina CB-Udupi CB-Sirsi V-Sapota PKM-5
CB-ARSA 1.00
F-Indochina 0.67 1.00
CB-Udupi 0.58 0.61 1.00
CB-Sirsi 0.58 0.61 0.78 1.00
V-Sapota 0.53 0.48 0.50 0.42 1.00
PKM-5 0.33 0.32 0.44 0.44 0.24 1.00CB- Cricket Ball, F- French, V- Variegated
closely associated with each other as they were havingpinkish pulp. ‘Tagarampudi’ and ‘CO-3’ were closely groupedeach other due to round shaped fruits and ‘Cricket Ball(Udupi)’, ‘Cricket Ball (Sirsi)’ were grouped together dueto their round shaped fruits.
Sub cluster of oval shaped fruit bearing genotypes were‘Pala’, ‘Virudhanagar’, ‘Long Oval’, ‘Kalipatti’, GholwadSapota’, ‘Dwarapudi’ and ‘Singapore’, they were all clusteredtogether with same fruit shape (oval) except ‘Dwarapudi’,(round) but it was similar in canopy shape.
The oblong shape fruit bearing genotypes were narrowlyassociated with the round and oval shaped fruit bearinggenotypes, which included ‘PKM-4’, ‘Culcutta Round’,
PKM-3’and ‘Mohangootee’ and all these genotypes werehaving oblong shaped fruit except ‘Culcutta Round’, whereas‘PKM-5’ has been made distinctive cluster in the dendrogrambecause of its distinctive oblong shaped fruit which wasclosely associated with ‘PKM-4’, ‘PKM-3’ and‘Mohangootee’. Similar discriminative ability of RAPDmarkers in identifying species, cultivars and hybrids has beendemonstrated in many other crops like mango (Schnell etal., 1995; Hemanth et al.,2000), passion fruit (Cerqueira-Silva et al.,2010), pomegranate (Ercisli et al., 2011), pear(Yildirim et al., 2010), jack fruit (Anburaj and Sudarmani,2010), guava (Bajpai et al., 2008), citrus (Baig et al., 2008).fig (Salhihannach et al., 2006), apricot (Ercisli et al., 2009).
MOLECULAR CHARACTERIZATION & GENETIC DIVERSITY ANALYSIS OF SAPOTA GENOTYPES BY RAPD MARKERS
526-535
Hind Agricultural Research and Training InstituteAsian J. Hort., 8(2) Dec., 2013 : 531
Fig. 4 : Dendrogram of different sapota landraces (6) according toJaccard’s co-efficient
1 kb
500bp
100bp
Fig. 5 : RAPD gel profile of 31 sapota genotypes according toOperon Primer C – 02
1 kb
500bp
100bp
Fig. 6 : RAPD gel profile of 31 sapota genotypes according toOperon Primer C – 08
cultivars were categorized into two groups based on fruitcharacteristics and canopy shape. Among all cultivars, roundand oval shaped fruit bearing cultivars were grouped in firstcluster which included, ‘PKM-1’, Cricket Ball’, ‘Guthi’,‘Gavarayya’, ‘Oval’, ‘Murabba’, ‘Kirthbharthi’, ‘CO-2’,‘Kalipatti’, ‘Gholwad Sapota’ and ‘Tagarampudi’, ‘Pala’,‘Virudhanagar’, ‘Long Oval’, ‘Dwarapudi’ and ‘Singapore’,within this ‘PKM-1’, Cricket Ball’, ‘Guthi’, ‘Gavarayya’,‘Oval’, ‘Murabba’, ‘Kirthbharthi’ were grouped together, and‘CO-2’, ‘Kalipatti’ and ‘Gholwad Sapota’, were groupedtogether and ‘Kalipatti’ and ‘Gholwad Sapota’ were closelyassociated with each other as they were having oval shapedfruits. ‘Oval’ and ‘Murabba’ were closely placed due to theircanopy shape and they were 91 per cent similar. ‘PKM-1’was closely associated with ‘Guthi’ because ‘PKM-1’ wasselected from ‘Guthi’. In sub-cluster, the oval shaped fruitbearing genotypes were ‘Pala’, ‘Virudhanagar’, ‘Long Oval’,‘Dwarapudi’ and ‘Singapore’ these were all grouped togetheras they were having oval shaped fruit bearing genotypes,except ‘Dwarapudi’ but it was similar in canopy shape. ‘Pala’and ‘Virudhnagar’ were closely placed due to 71 per centoval shaped fruits (Table 3).
In second cluster were included, ‘PKM-4’, ‘CulcuttaRound’ and ‘Mohangootee’ as they were having oblongshaped fruits, except ‘Culcutta Round’. These oblong shapedfruit bearing genotypes were narrowly distributed to roundand oval shaped fruit bearing genotypes. (Schnell et al., 1995;Hemanth et al.,2000), Passion fruit (Cerqueira-Silva etal.,2010), Pomegranate (Ercisli et al., 2011), Pear (Yildirimet al., 2010), Jack fruit (Anburaj and Sudarmani, 2010),Guava (Bajpai et al., 2008), Citrus (Baig et al., 2008), Fig(Salhi-hannach et al.,2006), Apple (Yae et al.,1995),Pomegranate (Hasnaoui et al., 2010), Mango
Table 5 : Jaccard's similarity co-efficient of 6 hybridsDHS-1 DHS-2 PKM-2 PKM-3 CO-1 CO-3
DHS-1 1.00
DHS-2 1.00 1.00
PKM-2 0.84 0.84 1.00
PKM-3 0.48 0.48 0.48 1.00
CO-1 0.74 0.74 0.67 0.41 1.00
CO-3 0.70 0.70 0.67 0.42 0.68 1.00
SUHASINI JALAWAADI, R.C. JAGADEESHA, D. KIRANSHANKAR, KULAPATI HIPPARAGI, G. PRABHULING AND H.R. BASAVARAJAPPA
1. DHS-1 12. Gavarayya 23. French Indochina2. DHS-2 13. Oval 24. Dwarapudi3. PKM- 1 14. Kirthbharti 25. Gholwad Sapota4. PKM-2 15. Cricket Ball (ARSA) 26. PKM-55. PKM-3 16. Tagarmpudi 27. Culcutta Round6. CO-1 17. Murabba 28. Virudhanagar7. CO-2 18. CO-3 29. Singapore8. Cricket Ball 19. Pala 30. Cricket Ball (Udupi)9. Long Oval 20. Mohangootee 31. Cricket Ball (Sirsi)10. Kalipatti 21. Varigated Sapota11. Guthi 22. PKM-4
Variation among cultivars:In the analysis, all 48 polymorphic fragments were used
to generate the similarity matrix and construct a dendrogram(Fig. 2). Jaccard’s co-efficient of similarity analysis has beencarried out for cultivars. In the present investigations
526-535
Hind Agricultural Research and Training InstituteAsian J. Hort., 8(2) Dec., 2013 : 532
(Hemanthkumar et al., 2001), Apricot (Ercisli et al., 2009),Strawberry (Graham and Mcnicol, 1995), Peach (Xiang etal.,1996), Loquat (Hussain et al., 2009).
Variation among landraces:Jaccard’s co-efficient of similarity analysis has been
carried out for landraces also; land races are also distributedbased on fruit characteristics (Fig. 3). Among landraces, theround shaped fruit bearing landraces were grouped in cluster-I, which included ‘Cricket Ball (ARSA)’, ‘French Indochina’,‘Cricket Ball (Udupi)’, ‘Cricket Ball (Sirsi)’ and ‘VariegatedSapota’, within this cluster ‘Cricket Ball (Udupi)’, ‘CricketBall (Sirsi)’ were closely associated with each other as theywere having distinctively round shaped fruits and they were78 per cent similar (Table 4). Cricket Ball (ARSA)’, ‘FrenchIndochina’, ‘Cricket Ball (Udupi)’, ‘Cricket Ball (Sirsi)’ wereclosely associated with ‘Variegated Sapota’ as it was havinground shaped fruits. ‘PKM-5’ placed separately in cluster-II, as it was having oblong shaped fruits, Sweet cherry(Gerlach and Stösser, 2008).
Variation among hybrids:Separate Jaccard’s co-efficient of similarity has been
analyzed for development of dendrogram of hybrids (Fig.4). Hybrids were distributed based on fruit shape, growthhabit, parentage and bearing habit, which made two distinctivegroups. Group-I contained ‘DHS-1’, ‘DHS-2’, ‘PKM-2’, CO-1’ and ‘CO-3’ which were grouped together because of theiroval and round shaped fruits with spreading and single bearinghabit. Within this group ‘DHS-1’ and ‘DHS-2’ were 100 percent similar (Table 5) as they were having same parentage(‘Kalipatti’ x ‘Cricket Ball’). ‘PKM-2’ were closely relatedwith ‘DHS-1’ and ‘DHS-2’ as it was having oval shape fruitsas that of ‘DHS-1’, ‘CO-1’ and ‘CO-2’ were closely linkedwith ‘DHS-2’ due to round shaped fruits. ‘PKM-3’ has beenplaced in separate cluster (group-II), which have oblongshaped fruits, vertical growth and cluster bearing (Warburtonet al., 1996, Pooler and Scorza, 1995, mango (Bajpai et al.,2008).
In any introduced crop such as sapota, genetic variationdepends on the number of introduced cultivars or genotypes.Generally it is expected to be very narrow, due to smallnumber of introductions. Since, sapota is an introduced cropto India and no information is available on the number ofcultivars introduced or the origin of these cultivars, it wasexpected that the variability in the germplasm would be less.However, results of this study contradict this. In dendrogramthere were no closely formed groups, and the highest geneticsimilarity was indicating the presence of wide geneticdiversity.
Conclusion:The present study is to report on the molecular
characterization of sapota. Since, sapota is an open pollinatedcrop, a great deal of diversity was thrown up in the population.A few of the cultivars have been selected based on localpreferences for different fruit characteristics and latercultivated by farmers through vegetative propagation.Therefore, the high genetic variability in sapota might beoriginated through seedling segregation.
REFERENCESAnburaj, J. and Sudarmani, D.N.P. (2010). Estimation of geneticdiversity in jackfruit employing PCR based D-19 RAPD Fingerprinting.Adv. Biotech., 10(6) : 34-36.
Baig, M.N.R., Grewa, S. and Dhillon, S. (2008). Molecularcharacterization and genetic diversity analysis of citrus cultivars byRAPD markers. Turky J. Agric., 33 : 375-384.
Bajpai, A., Chandra, R., Rajan S. and Srivastava, N. (2008).RAPD and minisatellite markers for genetic diversity and relationshipin guava varieties. Indian J. Genet., 68(4): 441-445.
Cerqueira-Silva, C.B.M., Cardoso-Silva, C.B., Santos, E.S.L.,Conceição, L.D.H.C.S., Pereira, A.S., Oliveira, A.C. and Corrêa,R.X. (2010). Genetic diversity in wild species of passion fruit(Passiflora trintae) based on molecular markers. Genet., Mol. Res.,9 (4): 2123-2130.
Ercisli, S., Agar, G., Yildirim, N., Esitken, A. and Orhan, E. (2009).Identification of apricot cultivars in Turkey (Prunus armeniaca L.)using RAPD markers. Romanian Biotechnol. Letters, 14(4) : 4582-4588.
Ercisli, S., Gadze, J., Agar, G., Yildirim, N. and Hizarci, Y., (2011).Genetic relationships among wild pomegranate (Punica granatum)genotypes from Coruh Valley in Turkey. Genet. Mol. Res., 10 (1):459-464.
Gerlach, H.K. and Stösser, R. (2008). Sweet cherry cultivaridentification using RAPD-derived DNA fingerprints. Acta Hort., 468: 63-70
Graham, M.J. and Mcnicol, R.J. (1995). An examination of theability of RAPD markers to determine the relationships within andbetween Rubus species. Theor. Appl. Genet., 90 (7-8) : 1128-1132.
Hasnaoui, N., Mars, M., Chibani, J. and Trifi, M. (2010).Molecular polymorphisms in Tunisian pomegranate (Punica granatumL.) as revealed by RAPD fingerprints. Diversity, 2 (1) : 107-114.
Hemanth, K.N.V., Narayanaswamy, P., Suresh, N. Sondur, andTheerthaprasad, D. (2000). Paternity analysis of mango (Mangiferaindica L.) hybrids through RAPD markers. National Seminar on Hi-Tech. Horticulture, Atria Hotel, Bangalore, 26-28th June, 2000
Hemanthkumar, N.V., Narayanswamy, P., Theerth Prasad, D.,Mukunda, G.K. and Suresh, N.S. (2001). Estimation of geneticdiversity of commercial mango (Mangifera indica L.) cultivars usingRAPD markers. J. Hort. Sci. & Biotech., 76(5): 529-533.
Hussain, A., Abbasi, N.A., Hafiz, I.A., Ahmad, Z. and Naqvi,S.M.S., (2009). Molecular characterization and genetic relationshipamong loquat (Eriobotrya japonica Lindl.) genotypes of Pakistanassessed by RAPD markers. Pakistan. J. Bot., 41(5): 2437-2444.
MOLECULAR CHARACTERIZATION & GENETIC DIVERSITY ANALYSIS OF SAPOTA GENOTYPES BY RAPD MARKERS
526-535
Hind Agricultural Research and Training InstituteAsian J. Hort., 8(2) Dec., 2013 : 533
Lakshminarayana, S. and Subramanyam, H. (1966). Physical,chemical and physiological changes in sapota fruit (Achras sapota L.)family Sapotaceae, during development and ripening. J. Food Sci.,Tech., 3 (4) : 151-154.
Pooler, M.R and Scorza, R. (1995). Aberrant transmission of RAPDmarkers in haploids, doubled haploids, and F1 hybrids of peach:observations and speculation on causes. Scientia Hort., 64 (4): 233-241.
Porebeski, S., Bailey, G. and Baum, B.R. (1997). Modification ofa CTAB DNA extraction protocol for plants containing highpolysaccharide and polyphenol components. Plant Mol. Biol. Rep.,15(1): 8-15.
Ragot, M. and Hoisington, D.A. (1993). Molecular markers forplant breeding comaparisons of RFLP and RAPD genotyping cost.Theor. Appl. Genet., 86 (8) : 975-984
Rohlf, F.J. (1993). NTSYS-pc Numerical taxonomy and multivariatesystem, version 2.0. Appl. Biostatistics. New York, USA.
Salhi-hannach, A., Chatti, K., Saddoud, O., Mars, M., Rhouma,A., Marrakchi, M. and Trifi, M. (2006). Genetic diversity of differentTunisian fig (Ficus carica L.) collections revealed by RAPDfingerprints. Hereditas, 143: 15-22.
Schnell, R.J., Ronning, C.M. and Knight, J.Jr. (1995).Identification of cultivars and validation of genetic relationships inMangifera indica L. using RAPD markers. Theor. Appl. Genet., 90
(2): 269-274.
Tai, H.T. and Tanksley, D.S. (1990). A rapid and inexpensive methodfor isolation of total DNA from dehydrated plant tissue. Plant Mol.Bio. Rep., 8(4): 297-303.
Warburton, M.L., Bercrra, V.V.L., Goffreda, J.C. and Bliss, F.A.(1996). Utility of RAPD markers in identifying genetic linkages togenes of economic interest in peach. Theor. Appl. Genet., 93 (5-6) :920-925.
Williams, J.G.K., Kubelik, A.R., Livak, K.J., Rafalski J.A. andTingey, S.V. (1990). DNA polymorphisms amplified by arbitraryprimers are useful as genetic markers. Nucleic Acids Res., 18 (22) :6531-6535.
Xiang, L.Z., Reighard, G.L., Baird, W.V., Abobott, A.G.,Rajapakse, S. and Lu, Z.X. (1996). Identification of peach rootstockcultivars by RAPD markers. Hort Sci., 31 (1) : 127-129.
Yae, B., Ko, K., Yae, B.W. and Ko, K.C. (1995a). Classification ofMalus domestica cultivars by random amplified polymorphic DNAmarkers. J. Korean Soc. Hort. Sci., 36(6): 824-828.
Yildirim, N., Ercisli, S., Agar, G., Orhan, E. and Hizarci, Y. (2010).Genetic variation among date plum (Diospyros lotus) genotypes inTurkey. Genet, Mol Res., 9 (2): 981-986.
WEBLIOGRAPHYAnonymous (2010). www. nhb.gov.in/statics/area-production-statistics.htm/.
SUHASINI JALAWAADI, R.C. JAGADEESHA, D. KIRANSHANKAR, KULAPATI HIPPARAGI, G. PRABHULING AND H.R. BASAVARAJAPPA
526-535
8th
of ExcellenceYear