molecular detection of plaice remains in the stomachs of ... · portant role in fine-tuning...
TRANSCRIPT
MARINE ECOLOGY PROGRESS SERIESMar Ecol Prog Ser
Vol. 444: 223–238, 2012doi: 10.3354/meps09439
Published January 10
INTRODUCTION
Although year-class strength in plaice Pleuro nec -tes platessa is thought to be largely determined dur-ing the planktonic stages (Bannister et al. 1974, Bev-erton & Iles 1992, Ellis & Nash 1997, van der Veer etal. 2009), post-settlement processes also play an im -portant role in fine-tuning eventual recruitment suc-cess (Iles & Beverton 2000, Nash & Geffen 2000). Pre-dation by brown shrimp Crangon crangon is thought
to be a particularly important source of mortality onrecently settled plaice (van der Veer & Bergman1987, Burrows et al. 2001, Amara & Paul 2003). As thefish grow they become less vulnerable to shrimp pre-dation (Gibson et al. 1995), and as an implication,shore crabs Carcinus maenas (van der Veer &Bergman 1987, Amara & Paul 2003), other fish (Ellis& Gibson 1995, Gibson & Robb 1996) and birds(Leopold et al. 1998) are thought to become increas-ingly important sources of mortality.
© Inter-Research 2012 · www.int-res.com*Email: [email protected]
Molecular detection of plaice remains in the stomachs of potential predators on a flatfish
nursery ground
Aitor Albaina1,3,*, Martin I. Taylor1, Clive J. Fox2
1Molecular Ecology and Fisheries Genetics Laboratory, School of Biological Sciences, ECW Building, Bangor University, Bangor LL57 2UW, UK
2Scottish Association for Marine Science, Scottish Marine Institute, Oban, Argyll PA37 1QA, UK
3Present address: Laboratory of Genetics, Department of Genetics, Physical Anthropology & Animal Physiology, University of the Basque Country, Leioa 48940, Spain
ABSTRACT: Stomach contents of potential predators from a flatfish nursery ground on the Scot-tish west coast were examined visually and probed using a TaqMan real-time PCR based assaydesigned to detect plaice Pleuronectes platessa DNA. Stomachs from 1137 brown shrimp Crangoncrangon, along with a lesser number of shore crab Carcinus maenas, grey gurnard Eutriglagurnardus and Gobiidae were analysed. Overall 45% of shrimp tested positive for plaice DNA, aproportion considerably higher than in stomachs containing visually identifiable flatfish remains.When scaled to the population level, predation by shrimp generated an estimated mortality of~9% d–1, which compares with a decline in plaice abundance from mid-May to mid-June of ~4.4%d−1. The discrepancy between mortality estimates based on molecular and catch-curve analysismight be due to sampling being conducted at low water between dusk and dawn, which wouldconcentrate predators and prey at times coincident with peaks of shrimp feeding. In addition, thesensitivity of the TaqMan assay could have led to some over-estimation because non-fatal interac-tions may also have been detected, e.g. shrimp are known to nibble the fins of flatfish, that mightresult in a positive TaqMan result but not necessarily in mortality for the fish. The percentage ofshrimp testing positive for presence of plaice DNA in their stomachs was also related to plaicedensity in a positive, linear manner. For less abundant predators, stomachs of 6% of shore crabs,40% of gurnards and 11% of large gobies also tested positive.
KEY WORDS: Stomach contents · TaqMan real-time PCR assay · Pleuronectes platessa · Crangoncrangon · Carcinus maenas · Predator−prey interactions · Nursery ground · Tralee Beach
Resale or republication not permitted without written consent of the publisher

Mar Ecol Prog Ser 444: 223–238, 2012
Most studies on predation of fish have been basedon visual identification of prey remains in predatorstomachs, but identifying partially digested prey canbe difficult (Gibson & Robb 1996, Ansell et al. 1999).Oh et al. (2001), for example, grouped all fish re -mains together whilst Gibson & Robb (1996) andAnsell et al. (1999) were unable to identify juvenileflatfish remains below family level. Bony parts, suchas fin-rays and otoliths, are more resistant to diges-tion and can often be recovered from the stomachs ofpredators, and this method has been widely appliedto diet studies of marine mammals (Labansen et al.2007) and seabirds (Hamer et al. 2007). Otoliths fromolder fish can often be identified to species on thebasis of their unique shapes (Granadeiro & Silva2000), but assigning otoliths from very young fish tothe species level is usually impossible. For example,van der Veer & Bergman (1987) assigned fin-rays andotoliths in shrimp and crab stomachs as plaice, butonly because there were no other juvenile flatfishspecies present in the area. At other locations, suchas Tralee Beach on the Scottish west coast, juvenileplaice, flounder and dab co-occur (Gibson et al.1996). Although there is some differentiation in tim-ing of settlement and depth preference betweenthese species (Burrows et al. 1994), overlap in thediets of predators is likely.
Modern molecular methods offer an alternativeapproach to the identification of prey remains that ispotentially more rapid and species specific thanvisual identification (Symondson 2002, King et al.2008). Several molecular studies of predator stomachcontents have employed immunoassays (Bailey et al.1993, Taylor 2004, 2005a,b) but these are expensiveto develop so most studies have used DNA-basedmethods. Using standard PCR, Asahida et al. (1997)were able to detect stone flounder Kareius bicol-oratus DNA in shrimp Crangon affinis stomachs,whilst Saitoh et al. (2003) studied the range of preda-tors consuming hatchery-reared Japanese flounderParalichthys olivaceus in the wild. Positive resultswere obtained from a range of organisms including acephalopod Sepioteuthis lessoniana not previouslyrecognised as a predator on juvenile flounder. Otherapplications of molecular methods to study marinediets include work on copepods (Nejstgaard et al.2003), appendicularians (Troedsson et al. 2007),squid (Braley et al. 2010), fish (Rosel & Kocher 2002,Smith et al. 2005, Barnett et al. 2010) and seals (Dea-gle et al. 2009, Marshall et al. 2010).
The aims of the present study were to use a newlydeveloped TaqMan real-time Polymerase ChainReaction (PCR) based assay to evaluate the levels of
predation experienced by recently settled plaice atTralee Beach. Although the range of predators capa-ble of taking post-settlement flatfish at this site iswell known (Gibson et al. 1993, 1998, Gibson & Robb1996, Ansell et al. 1999), there remains considerableuncertainty about the total impacts of differentpredators on the flatfish (Burrows et al. 2001). Thestudy also compared results from the molecularanalysis with those from previous studies based onvisual stomach-content analysis.
MATERIALS AND METHODS
Study area and sample collection
Tralee Beach is situated in Ardmucknish Bay onthe west coast of Scotland (56.48° N, 5.42° W). Thebeach is well known as a flatfish nursery and has pro-vided the location for several ecological studies (e.g.Gibson et al. 1993, 1996, 2002, Burrows et al. 1994,Gibson & Robb 1996, Ansell et al. 1999).
Pilot sampling was undertaken during spring 2008(data not shown) and confirmed that stomach fullnessof brown shrimp tended to peak shortly after dusk anddawn and stomach fullness of shore crabs peakedaround midnight, in accordance with previous litera-ture reports (Pihl & Rosenberg 1984, Ansell & Gibson1993, del Norte-Campos & Temming 1994, Ansell etal. 1999). Since brown shrimp are thought to be themain source of predation on recently settled plaice,the main sampling program was designed withregard to this predator. Samples in 2009 were col-lected at low water in depths <1 m within 2 h of dusk,midnight or dawn. Sampling took place approximatelyevery 5 d during May and early June (Table 1).Fishing was conducted using a 1.5 m beam trawlfitted with a single spiked tickler chain and a doublenet (outer net 10 mm stretched diamond mesh; inner4 mm circular mesh). The trawl was towed manuallyfor ~10 min tow−1 with a minimum of 3 tows per sam-pling date. Tow distances were recorded using aGarmin GPS and swept areas (m2) estimated as towdistances multiplied by 1.5 m.
Catches from the beam trawl were immediatelypre-sorted on the beach into juvenile flatfish andpotential predators (mainly shrimp and crabs but alsosome roundfish). Juvenile flatfish were preserved in100% ethanol because the samples were also to beused for otolith microincrement analyses, and poten-tial predators were wrapped in foil and flash-frozenusing a liquid nitrogen dry-shipper for transfer to thelaboratory.
224

Albaina et al.: Molecular detection of plaice remains
Carcinus maenas were not caught in large num-bers in the beam trawl. Occasionally, they wereobserved to be feeding on juvenile plaice in the net.We therefore collected additional samples of shorecrabs using a hand-net and electric torch thus ensur-ing that crabs and juvenile plaice could not come intocontact after capture. Crabs were collected aroundmidnight when they are most active (Burrows et al.1994, Ansell et al. 1999), but this method of collectionwas only possible on very calm nights and so waslimited to 3 occasions. These animals were used forsubsequent molecular testing whilst crabs caught bybeam trawl were only used to estimate density.
Identification of predators and prey
Juvenile flatfish were identified to spe cies by fin-raycount (Nichols 1971) and their total lengths recordedunder an Olympus SZX9 stereomicroscope using agraticule slide (Cambridge Graticules). Fish lengthswere not corrected for shrinkage. Although length corrections for juvenile plaice fixed in formalin areavailable in Lockwood & Daly (1975), there are no published corrections for ethanol preservation.
To minimise post-mortem degradation of gut con-tents, potential predators were covered with 80%ethanol and allowed to thaw at room temperature.They were then identified to the lowest practicaltaxo nomic category and measured as cephalothoraxlength (CL) for shrimps, cephalothorax width (CW)for crabs and total length (TL) for fish.
Trawl catch data were converted to numbers per1000 m2 of swept area but were not corrected for netavoidance, except in density estimates for plaiceand Crangon crangon used later for mortality estima-tion. Catchability estimates for species other thanplaice and C. crangon in small beam-trawls are notavailable.
Analysis of gut contents of potential plaicepredators
After being measured, shrimp ≥ 7 mm CL (equiva-lent to 28.5 mm TL) were stored individually in tubescontaining fresh 80% ethanol. Van der Veer & Berg -man (1987) reported that shrimps <30 mm TL areunable to predate juvenile flatfish so shrimps smallerthan this were excluded from stomach analyses.Crustaceans with softened exoskeletons were alsoexcluded as feeding largely ceases during ecdysis(Oh et al. 2001). Stomachs were dissected out from allbeam-trawl caught roundfish that were ≥ 44.5 mm TLand all hand-net collected crabs and preserved individually in tubes containing fresh 80% ethanol.All instruments were flame-sterilised between eachdissection.
Visual identification of stomach contents
During stomach dissection the following criteriawere scored: sex (only for crustacea); gonad stage(only for female crustacea) as 1 (immature, no ovar-ian thickening), 2 (thickened ovarian diverticula notreaching the cardiac stomach), 3 (ripe, thickenedovarian diverticula extending over the cardiac stom-ach), or 4 (ovigerous, individuals carrying eggs); andstomach fullness was assigned as 1 (<1/10 of the vol-ume filled), 2 (between 1/10 and half full), or 3 (vol-ume completely filled). Stomach contents were visu-ally examined under the ste reomicroscope and anyobvious identifiable remains noted; however stom-ach contents were not sorted microscopically as thiscould have increased the risk of cross-contaminationof DNA.
Detection of plaice DNA within stomach contents
We used a TaqMan real-time PCR based assay todetect plaice DNA in predator stomachs. This probeis highly species specific and has been tested against
225
Sampling Day of Time of Water tempe- Swept date year day rature (°C) area (m2)
25 April 115 Midnight 8.6 714.001 May 121 Dawn 7.9 558.004 May 124 Dusk 9.1 492.009 May 129 Midnight 8.5 514.516 May 136 Dawn 8.6 480.021 May 141 Dusk 10.6 502.525 May 145 Midnight 9.4 390.030 May 150 Dawn 11.5 525.004 June 155 Dusk 9.8 496.509 June 160 Midnight 10.1 375.015 June 166 Dawn 11.0 400.5
Table 1. Survey details for plaice and potential predatorssampling during spring 2009 at Tralee Beach (ArdmucknishBay, west Scotland). Samples were collected with a 1.5 mbeam trawl approximately every 5 d at low water in depths<1 m within 2 h of dusk, midnight or dawn. Trawls weretowed for ~10 min tow−1 with a minimum of 3 tows per sam-pling date and swept areas (m2) estimated as tow distances
multiplied by the trawl diameter

Mar Ecol Prog Ser 444: 223–238, 2012226
a wide range of marine organisms with no cross-reaction (Albaina et al. 2010). At higher tempera-tures, digestion proceeds more rapidly and time-detection thresholds are reduced. For organismsshowing distinct feeding periods within any 24 h,samples should be collected within, at most, 6 h ofthe expected peak of feeding.
Whole shrimp stomachs (due to the relatively smallsizes of the shrimps) and stomach contents (fromcrabs and fish) were partially homogenized in 1.5 mlautoclaved Eppendorf tubes containing either 450 μl(Crangon crangon) or 675 μl (Carcinus maenas andfish) of extraction buffer (30 mM Tris, 10 mM EDTAand 1% sodium dodecyl sulphate). Then, 10 μl ofproteinase K (Qiagen) was added and the samplesdigested overnight at 55°C. DNA was purified fol-lowing a modified salt protocol (Aljanabi & Martinez1997) using 1.2 ml wells in 96 well blocks (SarstedtMegaBlock; Crangon crangon) or 1.5 ml Eppendorftubes (Carcinus maenas or fish). The DNA was resus-pended in 100 μl ultrapure H2O and stored at −20°C.An extraction blank control (negative control, whereno tissue is added to the extraction buffer prior toDNA extraction protocol) was included every 11samples to detect cross-contamination. DNA yield(ng μl−1) and 2 purity indexes, determined from theab sorbance (A) at different wavelengths (nm; A260/A280 and A260/A230 ratios), were determined usinga NanoDrop ND-1000 spectro photometer. Whilethe yield detection limit is set below 2 ng μl−1, a ratio>1.8 for both sample ab sorbance indexes is associatedwith pure DNA (Nano Drop ND-1000 V3.5 User’sManual).
TaqMan assays were run on an Applied Biosystems7900 real-time sequence detection system followingAlbaina et al. (2010). PCR inhibiting compounds areoften extracted along with DNA from stomach con-tents of crustaceans in particular. Albaina et al. (2010)demonstrated that PCR inhibition could be overcomeusing a combination of the addition of 1.25 μg μl−1
bovine serum albumin (BSA) along with a dilutionstep. Therefore, the TaqMan assays were run usingboth a non-diluted and 1/10 dilution for Crangoncrangon DNA extracts with yields <100 ng μl−1 (ex-tracting the whole stomach) and for Carcinus maenas<10 ng μl−1 (extracting only the stomach’s contents),while the assay was run for a combination of 1/10 and1/100 dilution for Crangon crangon DNA extractsyielding >100 ng μl−1 and for Carcinus maenas yield-ing >10 ng μl−1. For fish, the same dilutions as Carci-nus maenas were applied. Twenty μl volume reactionswere run in Optical 96-well reaction plates using Optical Adhesive Covers (Applied Biosystems). Each
20 μl reaction contained 0.48125 μl of plaice probe(10 μM; VIC reporter), 1.3125 μl of the PLA-F andPLA-R primers (10 μM; Forward and Reverse PLAiceprimers), 8.75 μl of TaqMan Universal PCR MasterMix (NO UNG + ROX passive reference; AppliedBiosystems), 3.45625 μl tissue culture H2O (Sigma),2.5 μl BSA (#B9001S New England Biolabs) and2.1875 μl of extracted DNA. Plates were run underreal-time conditions on a single dye layer with 2 notemplate controls (NTCs) and 2 positive controls(DNA extracted from adult plaice muscle tissue) per96 well plate. The assay was run using 40 PCR cycleswith the default cycling conditions; after a first stageof 50°C for 2 min followed by 10 min at 95°C, the runincluded 40 repetitions (cycles) of a 15 s 95°C stagefollowed by a 60 s 60°C one. After PCR, the resultswere analysed using the Sequence Detection Softwareversion 2.3 (Applied Biosystems). A positive ΔRnthreshold (as defined in the rtPCR machine manual)of 0.02 was set for the assay and threshold cycle (Ct)values were computed; see Albaina et al. (2010) forfurther details. All amplification curves were checkedvisually to remove false positive/negative signals.Chi-square tests were computed to examine differ-ences with categorical variables (sex, gonad stage,stomach fullness index and TaqMan assay result).
Plaice mortality estimated by density decline
Plaice densities were corrected for catchability bybeam trawl assuming a fixed catch efficiency of 20%(Wennhage et al. 1997). Instantaneous mortality forthe overall population was then estimated as the lin-ear slope of decline of ln plaice abundance over timefrom the peak of density (Iles & Beverton 1991).
Plaice mortality estimated from TaqMan results
As field digestion rates of the set of potential pre -dators tested for plaice DNA ingestion were not com-pared, comparisons between species are limited.However, estimates of predation induced mortalitybased on molecular results were limited to Crangoncrangon as this was the only potential predator cap-tured consistently across the study. We made 4 sim-plifying assumptions: (1) a positive TaqMan assaycorresponded to a predation event invol ving thekilling of a single juvenile plaice; (2) C. crangonexhibit a crepuscular feeding pattern and during theperiod of darkness only 1 plaice consumption eventtook place per predator yielding a positive TaqMan

Albaina et al.: Molecular detection of plaice remains 227
result; (3) any predation event occurring within a24 h period would be detected since the TaqManassay can detect >90% of predation events up to 5 hafter ingestion (Albaina et al. 2010); and (4) few if anypositive TaqMan results would come from feedingevents which took place >24 h previously (Albaina etal. 2010). Then
(1)
where Np is the mean number of prey consumed overthe previous 24 h per unit area, p is the proportionof positive TaqMan assay results from samples ofpredators collected in any 24 h period, and DC isthe estimated density of the predators (≥7 mm CLC. cran gon) per unit area.
Estimates of prey consumption from samplingundertaken just after dawn should detect nearly allfeeding events that occurred between the previousdusk and the sampling (the length of night-time onthe Scottish west coast from May onwards is <7 h).Because of the need to sample at low water, this onlycoincided with dawn for some of the dates. Samplescollected around dusk or midnight (Table 1) mayhave under-estimated total consumption during theprevious 24 h since feeding at the previous dawnwould be 15 or more h prior to sample collection. Inexperiments, detection rates varied between 20 and50% after 15 h post-ingestion de pending on sampleprocessing (Albaina et al. 2010). However, becauseof uncertainties in exactly when animals were feed-ing we did not attempt to further correct dusk andmidnight results.
Both prey and predator densities were correctedfor catchability by beam trawl assuming fixed catchefficiencies of 20% for plaice and 50% for shrimp(Wennhage et al. 1997). Daily mortality due to shrimppredation was then computed as the fraction of plaicejuveniles per unit area eaten by the shrimp:
(2)
where Md is the daily percentage mortality on any onesampling date, Np is the mean number of prey con-sumed over the previous 24 h from Eq. (1) and DP isthe estimated density of juvenile plaice per unit area.
RESULTS
Community composition
Overall 22 taxa were recorded (Table A1 in theAppendix) with the most common species being
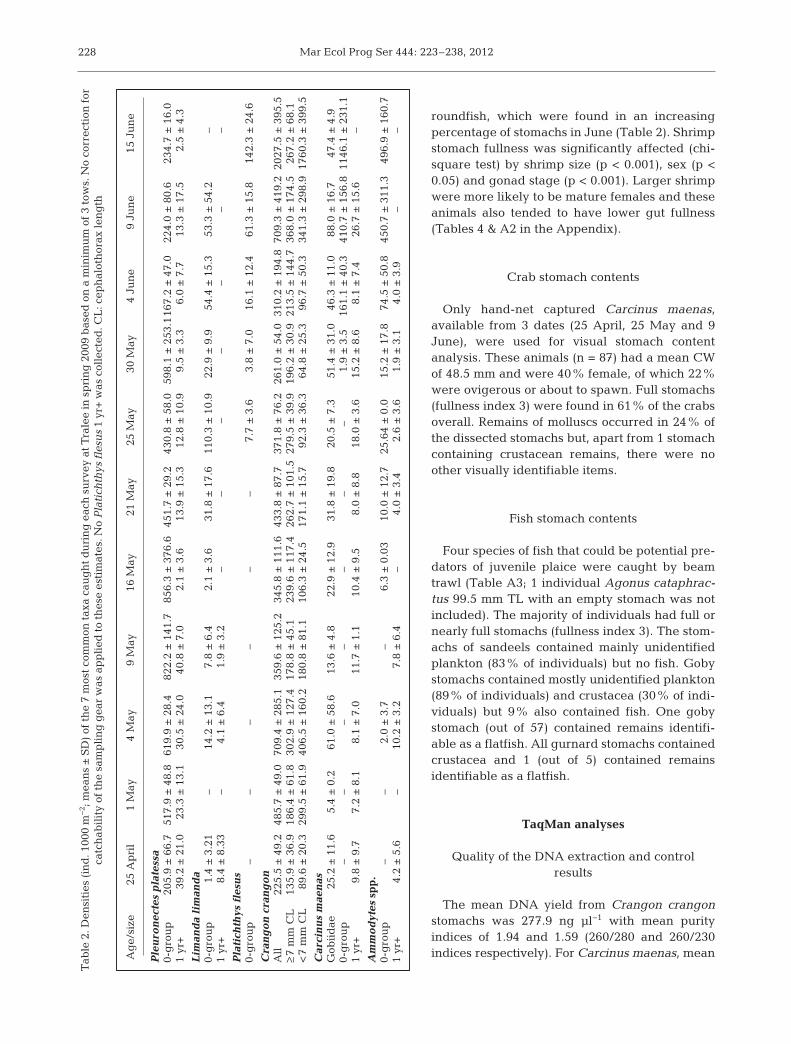
brown shrimp Crangon crangon, plaice Pleuro - nectes platessa, gobies Gobiidae, sandeels Ammo -dytes spp., shore crab Carcinus maenas, dab Lim -anda limanda and flounder Platichthys flesus.Small plaice were already present on 25 April at~0.2 ind. m−2. Plaice densities in creased to a peakof 0.86 ind. m−2 by mid-May and declined to~0.2 ind. m−2 by mid-June (Table 2). Growth in -creased strongly from mid-May onwards withsome individual fish attaining 55 mm TL by mid-June (Fig. 1). However, the size range of the popu-lation also increased over time so that at the endof the study fish as small as 15 mm TL were stillbeing caught. In late April the density of brownshrimp was ~0.2 ind. m−2 but reached >2 ind. m−2
by mid-June (Table 2). The shrimp population con-sisted of at least 2 cohorts, one present at the startof sampling and one which recruited in earlyJune (Fig. 2). Crab, along with larger gobies andsandeels, did not show clear temporal patterns insize or abundance, although crab densities in -creased from the start of mid-May and, if consider-ing 0-group category, fish densities did from June(Table 2).
Visual identification of stomach contents
Shrimp stomach contents
The stomach contents of 1137 shrimp (CL ≥ 7 mm;non-molting animals) were analysed visually(Table 3). Stomach fullness was significantly differ-ent when comparing sampling dates (p < 0.001; chi-square test) but not for time of sampling (dusk, mid-night and dawn; p = 0.11). There was no cleartemporal pattern for shrimps with maximum stomachfullness, which fluctuated between 16 and 76% ofanimals examined (mean 45%, n = 11 surveys). How -ever, when stomach fullness data were pooled bysampling time, the incidence of maximum fullness(Index 3; see Methods section) was slightly higher forsamples collected at dawn (49%) compared withmidnight (45%) or dusk (40%), possibly reflectingcrepuscular feeding behaviour. Crusta cean remains,noted in 28% of shrimp stomachs, consisted mainlyof mysids, amphipods, isopods and juvenile Crangoncrangon. Annelids were present in ~4% of shrimpstomachs whilst fish remains were found in ~2% ofthe stomachs. Remains identifiable as flatfish wereonly found in 0.4% of stomachs while roundfishremains were slightly more common at 0.7%. Cleartemporal changes in prey were only apparent for
N p Dp C= ×
MN
D Ndp
P p( )=
+× 100
Mar Ecol Prog Ser 444: 223–238, 2012
roundfish, which were found in an increasingpercentage of stomachs in June (Table 2). Shrimpsto mach fullness was significantly affected (chi-square test) by shrimp size (p < 0.001), sex (p <0.05) and gonad stage (p < 0.001). Larger shrimpwere more likely to be mature females and theseanimals also tended to have lower gut fullness(Tables 4 & A2 in the Appendix).
Crab stomach contents
Only hand-net captured Carcinus maenas,available from 3 dates (25 April, 25 May and 9June), were used for visual stomach contentanalysis. These animals (n = 87) had a mean CWof 48.5 mm and were 40% female, of which 22%were ovigerous or about to spawn. Full stomachs(fullness index 3) were found in 61% of the crabsoverall. Remains of molluscs occurred in 24% ofthe dissected stomachs but, apart from 1 stomachcontaining crustacean remains, there were noother visually identifiable items.
Fish stomach contents
Four species of fish that could be potential pre -dators of juvenile plaice were caught by beamtrawl (Table A3; 1 individual Agonus cataphrac-tus 99.5 mm TL with an empty stomach was notin cluded). The majority of individuals had full ornearly full sto machs (fullness index 3). The stom-achs of sandeels contained mainly unidentifiedplankton (83% of individuals) but no fish. Gobystomachs contained mostly unidentified plankton(89% of individuals) and crustacea (30% of indi-viduals) but 9% also contained fish. One gobystomach (out of 57) contained remains identifi-able as a flatfish. All gurnard stomachs containedcrustacea and 1 (out of 5) contained remainsidentifiable as a flatfish.
TaqMan analyses
Quality of the DNA extraction and controlresults
The mean DNA yield from Crangon crangonstomachs was 277.9 ng μl−1 with mean purity in dices of 1.94 and 1.59 (260/280 and 260/230indices respectively). For Carcinus maenas, mean
228
Ag
e/si
ze25
Ap
ril
1 M
ay4
May
9 M
ay16
May
21 M
ay25
May
30 M
ay4
Jun
e9
Jun
e15
Ju
ne
Ple
uro
nec
tes
pla
tess
a0-
gro
up
205.
9 ±
66.
751
7.9
± 4
8.8
619.
9 ±
28.
482
2.2
± 1
41.7
856.
3 ±
376
.645
1.7
± 2
9.2
430.
8 ±
58.
059
8.1
± 2
53.1
167.
2 ±
47.
022
4.0
± 8
0.6
234.
7 ±
16.
01
yr+
39.2
± 2
1.0
23.3
± 1
3.1
30.5
± 2
4.0
40.8
± 7
.02.
1 ±
3.6
13.9
± 1
5.3
12.8
± 1
0.9
9.5
± 3
.36.
0 ±
7.7
13.3
± 1
7.5
2.5
± 4
.3
Lim
and
a li
man
da
0-g
rou
p1.
4 ±
3.2
1–
14.2
± 1
3.1
7.8
± 6
.42.
1 ±
3.6
31.8
± 1
7.6
110.
3 ±
10.
922
.9 ±
9.9
54.4
± 1
5.3
53.3
± 5
4.2
–1
yr+
8.4
± 8
.33
–4.
1 ±
6.4
1.9
± 3
.2–
––
––
––
Pla
tich
thys
fle
sus
0-g
rou
p–
––
––
–7.
7 ±
3.6
3.8
± 7
.016
.1 ±
12.
461
.3 ±
15.
814
2.3
± 2
4.6
Cra
ng
on
cra
ng
on
All
225.
5 ±
49.
248
5.7
± 4
9.0
709.
4 ±
285
.135
9.6
± 1
25.2
345.
8 ±
111
.643
3.8
± 8
7.7
371.
8 ±
76.
226
1.0
± 5
4.0
310.
2 ±
194
.870
9.3
± 4
19.2
2027
.5 ±
395
.5≥7
mm
CL
135.
9 ±
36.
918
6.4
± 6
1.8
302.
9 ±
127
.417
8.8
± 4
5.1
239.
6 ±
117
.426
2.7
± 1
01.5
279.
5 ±
39.
919
6.2
± 3
0.9
213.
5 ±
144
.736
8.0
± 1
74.5
267.
2 ±
68.
1<
7 m
m C
L89
.6 ±
20.
329
9.5
± 6
1.9
406.
5 ±
160
.218
0.8
± 8
1.1
106.
3 ±
24.
517
1.1
± 1
5.7
92.3
± 3
6.3
64.8
± 2
5.3
96.7
± 5
0.3
341.
3 ±
298
.917
60.3
± 3
99.5
Car
cin
us
mae
nas
Gob
iid
ae
25.2
± 1
1.6
5.4
± 0
.261
.0 ±
58.
613
.6 ±
4.8
22.9
± 1
2.9
31.8
± 1
9.8
20.5
± 7
.351
.4 ±
31.
046
.3 ±
11.
088
.0 ±
16.
747
.4 ±
4.9
0-g
rou
p–
––
––
––
1.9
± 3
.516
1.1
± 4
0.3
410.
7 ±
156
.811
46.1
± 2
31.1
1 yr
+9.
8 ±
9.7
7.2
± 8
.18.
1 ±
7.0
11.7
± 1
.110
.4 ±
9.5
8.0
± 8
.818
.0 ±
3.6
15.2
± 8
.68.
1 ±
7.4
26.7
± 1
5.6
–
Am
mo
dyt
essp
p.
0-g
rou
p–
–2.
0 ±
3.7
–6.
3 ±
0.0
310
.0 ±
12.
725
.64
± 0
.015
.2 ±
17.
874
.5 ±
50.
845
0.7
± 3
11.3
496.
9 ±
160
.71
yr+
4.2
± 5
.6–
10.2
± 3
.27.
8 ±
6.4
–4.
0 ±
3.4
2.6
± 3
.61.
9 ±
3.1
4.0
± 3
.9–
–
Tab
le 2
. Den
siti
es (
ind
. 100
0 m
−2 ;
mea
ns
± S
D)
of t
he
7 m
ost
com
mon
tax
a ca
ug
ht
du
rin
g e
ach
su
rvey
at
Tra
lee
in s
pri
ng
200
9 b
ased
on
a m
inim
um
of
3 to
ws.
No
corr
ecti
on f
or
catc
hab
ilit
y of
th
e sa
mp
lin
g g
ear
was
ap
pli
ed t
o th
ese
esti
mat
es. N
o P
lati
chth
ys f
lesu
s1
yr+
was
col
lect
ed. C
L: c
eph
alot
hor
ax le
ng
th

Albaina et al.: Molecular detection of plaice remains
yields were 889.8 ng μl−1 and purity indexes were 1.4and 0.62. For the 81 stomach contents analysed fromfish, mean DNA yield was 1355.2 ng μl−1 and purityindexes were 1.98 and 1.80 (260/280 and 260/230indices respectively). All positive controls yieldedpositive results whilst 1 out of 106 negative controlsreacted positively.
TaqMan results from shrimp stomachs
Overall 45% of the 1137 Crangon crangon stom-achs analysed gave a positive reaction for plaiceDNA (Table 5). When pooling individuals by sizecategories (7 to 8.5, 9 to 10.5 and ≥11 mm CL), sexor gonad stages, no significant differences werere vealed (chi-square test). Differences were signif-icant (p < 0.001; chi-square test) comparing bothsampling date and time of sampling. The percent-age of positive TaqMan responses by samplingdate varied between 20 and 91% (Table 5). Therewas no strong temporal pattern, although therewere relatively fewer positive results later in thestudy (Fig. 3). Positive detection of plaice DNA inshrimp stomachs increased from ~38% for bothdusk and midnight sample collections to 59% insamples collected around dawn (Table 5), andthese differences were statistically significant (p <0.001; chi-square test). The proportion of positiveTaqMan results from C. crangon stomachs wasalso positively related with estimated plaice density(Fig. 4).
TaqMan results from crab stomachs
The percentages of Carcinus maenas stomachs tes -ting positive for plaice DNA on each sampling variedfrom 0 to 12% (Table 5). The minimum CW for a crabyielding a positive result was 31.5 mm.
TaqMan results from fish
No sandeel stomachs tested positive for plaiceDNA (n = 18), but ~11% of Gobiidae stomachs (n =57) yielded positive results (Table 5). For gur nards40% gave a positive result, although the sample sizewas small (n = 5).
Estimation of the predation impact of shrimp onjuvenile plaice
Instantaneous population mortality was estimatedto be 0.0448 ind. d−l, which corresponded to an ab -solute mortality rate of 4.4% ind. d−1 (Fig. 5). The pre-dation impact of shrimp based on the TaqMan results(Fig. 6) was relatively stable across the season andvaried between 5 and 20% d−l (corresponding to0.051 and 0.223 ind. d−l instantaneous mortality) withhigher values in June.
229
Fig. 1. Pleuronectes platessa. Growth and density of juve-niles collected on each sampling date in spring 2009. Lengthdata were binned to 1 mm categories and the density scaled
to unit area (relative units)
Fig. 2. Crangon crangon. Growth and density of brownshrimp collected on each sampling date in spring 2009.Length data were binned to 1 mm categories and the densityscaled to unit area (relative units). Measurements on a sub-set of 97 shrimp allowed interconversion of total and cara-pace lengths as: TL = 4.0124 × CL + 0.4282 (R2 = 0.99, p <0.001). TL: total length from the tip of the rostrum to the tipof the telson; CL: cephalothorax length from the tip of the
rostrum to the end of the thorax

Mar Ecol Prog Ser 444: 223–238, 2012
DISCUSSION
Predation and mortality rates
Overall ~45% of brown shrimp stom-achs tested positive with the TaqMan as-say, suggesting that shrimp do play amajor role as predators on recently set-tled plaice in line with previous reports(van der Veer & Bergman 1987, Ansell etal. 1999, Burrows et al. 2001, Oh et al.2001, Amara & Paul 2003).
Estimated daily mortality due toshrimp based on TaqMan results (Fig. 6)was approximately twice that estimatedfrom catch-curve analysis across most ofthe season (~0.095 and 0.0448 ind. d−l
respectively). Although the 2 estimateswere of the same order of magnitude,the difference could be generated by avariety of factors including uncertaintiesin both catch-curve analysis and in themolecular approach. Catch-curve analy-sis is strongly affected by the accuracywith which target species abundancecan be estimated (Burrows et al. 2001).The catch efficiency of small beamtrawls is known to be related to multiplefactors including gear design and rig-ging, tow speed, organism type and size,and ground and sea conditions (Rogers& Lockwood 1989, Kuipers et al. 1992,Wennhage et al. 1997). Most of thesefac tors are difficult to control and re -searchers have usually applied rela-tively simple catch corrections, as in thepresent study. In 2009, the densities of 0-group plaice at Tralee ranged from0.21 to 0.86 ind. m−2 (1.1 to 4.3 ind. m−2
corrected for catchability). These valuesare within the range of previous esti-mates reported from this site (Burrows etal. 2001, Nash et al. 2007).
For means computed from n multipletransects, precision improves as (√⎯n)–1.Precision on our ln density estimatesfor each sampling should therefore bearound ±0.58 per 1000 m2 or an order ofmagnitude lower than the ln observedabundance (Iles & Beverton 1991). Juve-nile plaice mortality rates from a varietyof nursery grounds have been reportedto be between 0.02 and 0.052 ind. d−1
230
Sam
pli
ng
dat
esT
ime
of s
amp
lin
gA
ll25
Ap
ril
1 M
ay4
May
9 M
ay16
May
21 M
ay25
May
30 M
ay4
Jun
e9
Jun
e15
Ju
ne
Du
skM
idn
igh
tD
awn
(A)
Des
crip
tive
cri
teri
aN
o. o
f sh
rim
p88
9914
089
107
130
102
102
102
7710
137
235
640
911
37M
ean
siz
e C
L (
mm
)8.
878.
388.
518.
628.
438.
428.
918.
828.
978.
549.
248.
608.
758.
728.
69%
fem
ales
61.3
646
.46
64.2
957
.30
48.6
056
.92
53.9
263
.73
57.8
438
.96
55.4
559
.95
53.3
753
.55
55.5
8%
gon
ad i
nd
ex 3
+4
38.8
934
.78
40.0
035
.29
44.2
327
.03
49.0
935
.38
42.3
743
.33
65.4
536
.32
41.5
844
.95
40.8
9%
fu
lln
ess
ind
ex 3
50.0
075
.76
42.1
448
.31
28.0
456
.92
50.0
035
.29
15.6
928
.57
60.4
040
.05
44.9
449
.39
44.9
4
(B)
Sto
mac
h c
on
ten
ts (
% o
f o
ccu
rren
ce)
Fis
h t
otal
3.41
0.00
2.14
1.12
0.00
0.00
0.00
0.98
2.94
6.49
3.96
1.61
2.53
1.22
1.76
Fla
tfis
h2.
270.
001.
430.
000.
000.
000.
000.
000.
001.
300.
000.
540.
840.
000.
44R
oun
dfi
sh0.
000.
000.
000.
000.
000.
000.
000.
981.
962.
602.
970.
540.
560.
980.
70U
nk
now
n f
ish
1.14
0.00
0.71
1.12
0.00
0.00
0.00
0.00
0.98
2.60
0.99
0.54
1.12
0.24
0.62
Cru
stac
ean
tot
al28
.41
47.4
717
.14
22.4
720
.56
47.6
930
.39
34.3
117
.65
18.1
823
.76
27.9
625
.28
31.3
028
.32
Mys
id4.
5532
.32
12.1
414
.61
2.80
31.5
45.
8814
.71
0.98
10.3
98.
9115
.86
8.71
14.4
313
.10
Am
ph
ipod
1.14
1.01
0.00
2.25
3.74
3.85
10.7
86.
865.
883.
900.
992.
964.
783.
183.
61Is
opod
1.14
0.00
0.71
0.00
0.00
0.77
0.00
0.98
0.00
0.00
0.99
0.54
0.28
0.49
0.44
C. c
ran
gon
(ju
ven
ile)
1.14
0.00
0.71
1.12
0.93
2.31
0.00
1.96
1.96
1.30
2.97
1.61
0.84
1.47
1.32
Un
kn
own
cru
stac
ean
21.5
914
.14
4.29
5.62
14.0
211
.54
15.6
912
.75
9.80
3.90
10.8
98.
3312
.08
12.9
611
.17
An
nel
id4.
557.
075.
714.
493.
740.
771.
965.
882.
942.
602.
973.
233.
374.
893.
87M
ollu
sc0.
000.
000.
710.
000.
930.
000.
000.
980.
000.
000.
000.
270.
000.
490.
26In
sect
0.00
0.00
0.00
1.12
0.00
0.00
0.00
4.90
0.00
0.00
0.00
0.00
0.28
1.22
0.53
Tab
le 3
. Cra
ng
on c
ran
gon
. (A
) D
escr
ipti
ve c
rite
ria
for
bro
wn
sh
rim
p ≥
7 m
m c
eph
alot
hor
ax le
ng
th (
CL
) co
llec
ted
on
eac
h o
f th
e 11
sam
pli
ng
dat
es a
nd
poo
led
by
tim
e of
sam
pli
ng
. (B
) S
hri
mp
sto
mac
h c
onte
nts
id
enti
fied
by
visu
al i
nsp
ecti
on a
nd
rep
orte
d a
s p
erce
nta
ge
of o
ccu
rren
ce f
or e
ach
id
enti
fied
ite
m.
C.
cran
gon
size
SD
ran
ged
fr
om 1
.44
to 1
.94
mm
CL
for
eve
ry c
ase
(dat
a n
ot s
how
n)

Albaina et al.: Molecular detection of plaice remains
(Iles & Beverton 1991). Subsequent studies, includingthe present one, have tended to generate similar val-ues (Burrows et al. 2001), although Freitas et al.(2010) reported a higher mortality rate of 0.062 ind.d−1 from a Norwegian nursery ground. Our catch-curve estimate of 0.0448 ind. d−1 for 2009 thus lieswithin the reported range of mortality rates fromTralee and other areas. Iles & Beverton (1991) alsoreported the standard error of mortality estimatesfrom catch-curve analyses across multiple study sitesat between 0.0014 and 0.0299 ind. d−1. These valuesbracket a standard error of 0.0145 ind. d−1 in the pre-sent study.
Regarding the molecular approach, fin-nibbling ofjuvenile flatfish by shrimp, as well as failed attacksresulting in wounding, have both been reported (vander Veer & Bergman 1987, Gibson et al. 1995) andthis could result in positive TaqMan results but not infish mortality. Previous laboratory work (Albaina etal. 2010) examined the post-ingestion decay curve forplaice DNA in shrimp stomachs but not the minimumamount of tissue that would need to be ingested togenerate a positive TaqMan response. However,since the method is highly sensitive, it may respondto very small quantities of ingested tissue. The sec-ond factor that might lead to over-estimation was oursampling approach, which was designed to maximisethe probability of detecting predation events. Sam-pling at low water is commonly used in juvenile flat-fish field studies as it concentrates the fish, improv-ing catch rates and thus the precision of abundanceestimates (Nash & Geffen 2000, Burrows et al. 2001,Fox et al. 2006). However, the coincidence of lowwater with dusk, dawn or midnight would concen-
trate predators and prey together at the time whenthe shrimp are most likely to be feeding (del Norte-Campos & Temming 1994) and would likely result inincreased predation (Burrows et al. 2001). Predationmortality estimated over a complete tidal cycle mighttherefore be lower than that reported in the presentstudy because the concentration of predators andprey would not always coincide with peaks in preda-tor feeding. Finally, Naviaux et al. (2005) were able toextract and sequence DNA from common beachsand. They reported sequences from a wide range oftaxa dominated by Protista but including someteleosts. Since sand grains were noted in many Cran-gon crangon stomachs, some of the positive TaqManresults could have resulted from ingested sand,although that is unlikely.
Size dependent predation by shrimp
The relationship between attack success and rela-tive sizes of predator and prey has been wellresearched for Crangon crangon−plaice interactions.Gibson et al. (1995) showed that around half ofattacks succeed when the predator is twice the size ofthe prey. Based on this result, plaice at the start ofsampling in 2009 (mean size 16 mm TL) would havebeen most vulnerable to attack by shrimp >32 mmTL. However, at this time only a small proportion ofthe shrimp were larger than this size (Fig. 2). As mod-elled by Burrows et al. (2001), overall predationimpacts are the result of a growth race betweenpredators and prey. By mid-May 2009 the size of thejuvenile plaice at Tralee had not increased substan-tially (Fig. 1), but a larger proportion of shrimp were>32 mm TL. We might therefore expect overall vulnerability to be greatest at this time Indeed thehighest proportion of positive TaqMan results fromshrimp stomachs was found on 16 May (91%),although this was shortly followed by one of the low-est observed proportions (25 May, 23%). Gibson etal. (1995) also showed that plaice can usually escapeattacks by shrimp when their size is larger thanthree-quarters of the size of the predator. In late Mayand early June, the largest shrimp at Tralee werebetween 40 and 50 mm TL (Fig. 2) so only plaicelarger than 30 to 38 mm would be very likely toescape. This size refuge is in close agreement withthe value of 30 mm quoted by van der Veer & Berg -man (1987). Plaice growth at Tralee in 2009 onlyaccelerated in late May and even at the end of thestudy ~50% of the fish were still <30 mm TL. Accord-ing to Burrows et al. (2001), all plaice would not
231
CL (mm)7 to 8.5 9 to 10.5 ≥11
(A) Descriptive criteriaNo. of shrimp 708 275 154% females 32.63 89.82 100.00% gonad index 3+4 12.99 46.56 73.38% fullness index 3 47.60 44.73 33.12
(B) % occurrence in dietFish total 0.42 3.64 4.55Flatfish 0.00 1.09 1.30Crustacean total 26.84 34.18 24.68Mysid 12.29 15.64 12.34
Table 4. Crangon crangon. Effect of size on the (A) descrip-tive criteria for shrimp ≥7 mm cephalothorax length (CL)collected during sampling and (B) occurrence of speciesin the diet (%) of brown shrimp based on visual stomachcontent analyses. Data were pooled from all sampling dates

Mar Ecol Prog Ser 444: 223–238, 2012
exceed 38 mm TL until late July orAugust and thus be safe from shrimppredation. These conclusions are sup -ported by the TaqMan results, whichonly showed a small decline in positivereactions towards the end of the study(Fig. 3).
The estimated predation impact(Fig. 6) peaked in early June, suggest-ing that shrimp growth counteracts theoverall decline in abundance of plaiceof vulnerable size and maintains therate of shrimp−plaice interactions intoearly summer. This is again in line withmodel predictions from Burrows et al.(2001) where predation impact peakedin mid to late May.
Density dependent effects
Densities of Crangon crangon ≥7 mmCL (~30 mm TL) at Tralee in 2009ranged from 0.14 ind. m−2 in late Aprilto 0.37 ind. m−2 by June (0.28 to0.74 ind. m−2 respectively corrected forcatch ability (Table 2). Again these val-ues lie within the range previouslyrecorded at this site (Burrows et al.2001).
Overall there was a positive, linearrelationship between the proportion ofshrimp stomachs containing plaiceDNA and plaice density (Fig. 4). Thissuggests that across the range ofshrimp and plaice densities sampledingestion events were occurring at aconstant rate. The effect of availabilityof alternative prey (e.g. mysids, amphi -pods, annelids) was not assessed in thepresent study but should be consideredin future work.
Importance of non-shrimp predators
In addition to shrimp, plaice DNAwas detected in stomachs of shorecrabs, larger gobies and grey gur nardEutrigla gurnardus. These results con-firm earlier studies where flatfish re -mains have been found in these pre -dators but specifically confirm the prey
232
Sam
pli
ng
dat
eT
ime
of s
amp
lin
gA
ll25
Ap
ril
1 M
ay4
May
9 M
ay16
May
21 M
ay25
May
30 M
ay4
Jun
e9
Jun
e15
Ju
ne
Du
skM
idn
igh
tD
awn
(A)
Bro
wn
sh
rim
p C
ran
go
n c
ran
go
nN
o. o
f sh
rim
p88
9914
089
107
130
102
102
102
7710
137
235
640
911
37%
pos
itiv
es39
.77
56.5
743
.57
50.5
690
.65
45.3
822
.55
50.9
819
.61
41.5
633
.66
37.6
337
.92
58.4
445
.21
Siz
e ra
ng
e (m
m C
L)
7−13
.57−
147−
11.5
7−13
7−15
7−12
.57−
147−
127−
13.5
7−13
.57−
12.5
7−13
.57−
147−
157−
15
(B)
Sh
ore
cra
b C
arci
nu
s m
aen
asN
o. o
f cr
abs
22–
––
––
33–
–32
––
87–
87%
pos
itiv
es4.
55–
––
––
12.1
2–
–0.
00–
–5.
75–
5.75
Siz
e ra
ng
e (m
m C
W)
dam
aged
––
––
–31
.5−
51.5
––
––
–31
.5−
51.5
–31
.5−
51.5
(C)
Go
bii
dae
No.
of
fish
74
46
43
78
410
011
3016
57%
pos
itiv
es0.
0025
.00
0.00
33.3
30.
0033
.33
0.00
12.5
00.
0010
.00
–9.
0910
.00
12.5
010
.53
Siz
e ra
ng
e (m
m T
L)
–58
–49
.5−
61.5
–51
.5–
56.5
–47
.5–
51.5
47.5
−61
.556
.5−
5847
.5−
61.5
(D)
San
d l
ance
Am
mo
dyt
essp
p.
No.
of
fish
30
54
02
11
20
09
81
18%
pos
itiv
es0.
00–
0.00
0.00
–0.
000.
000.
000.
00–
–0.
000.
000.
000.
00S
ize
ran
ge
(mm
TL
)–
––
––
––
––
––
––
––
(E)
Gre
y g
urn
ard
Eu
trig
la g
urn
ard
us
No.
of
fish
00
00
00
30
01
10
41
5%
pos
itiv
es–
––
––
–66
.67
––
0.00
0.00
–50
.00
0.00
40.0
0S
ize
ran
ge
(mm
TL
)–
––
––
–91
−11
5.5
––
––
–91
−11
5.5
–91
−11
5.5
Tab
le 5
. P
leu
ron
ecte
s p
late
ssa-
spec
ific
Taq
Man
ass
ay.
Mol
ecu
lar
det
ecti
on o
f p
laic
e D
NA
in
sto
mac
hs
of (
A)
shri
mp
, (B
) cr
ab a
nd
(C
−E
) fi
sh.
Res
ult
s ar
e li
mit
ed t
oC
.cra
ng
on≥7
mm
CL
, han
d-n
et c
olle
cted
C. m
aen
asan
d 1
yr+
fis
h in
div
idu
als
(see
‘Mat
eria
ls a
nd
met
hod
s’).
Dat
a ar
e sh
own
for
th
e 11
sam
pli
ng
dat
es a
nd
poo
led
by
tim
e of
sam
pli
ng
. S
ee T
able
1 f
or s
amp
le c
olle
ctio
n d
etai
ls.
Siz
e ra
ng
e re
por
ts t
he
min
imu
m a
nd
max
imu
m p
red
ator
siz
es w
her
e a
pos
itiv
e as
say
was
rec
ord
ed.
CL
: ce
ph
alot
hor
ax le
ng
th; C
W: c
eph
alot
hor
ax w
idth
; TL
: tot
al le
ng
th

Albaina et al.: Molecular detection of plaice remains
identity (Gibson & Robb 1996). TaqMan results sug-gested that ~6% of shore crabs may have consumedplaice tissue. Based on visual identification of thefore-gut contents of crabs collected at Tralee be -tween June and August, Ansell et al. (1999) re porteda somewhat higher proportion of crabs containingfish remains (55%). The proportions of roundfish andflatfish in June were approximately equal, but byAugust flatfish were largely absent from the diet(Ansell et al. 1999). However, because we observedseveral incidences of crabs feeding on fish in thebeam trawl, the estimates in Ansell et al. (1999) arelikely to be artefactually high.
Eutrigla gurnardus has been previouslyreported as a predator of juvenile plaice (8.3%occurrence; Ellis & Gibson 1995) and our mole-cular results confirm this observation. For Gob-iidae, only consumption of dab and flounderhas been previously re por ted (Ellis & Gibson1995, Gibson & Robb 1996), but our results sug-gest that larger gobies will also take juvenileplaice. Piscine predation on juvenile flatfishhas been recognised as an important factor onsandy nursery grounds, especially later in theyear (Macer 1967, Edwards & Steele 1968, Gib-son & Robb 1996). A full evaluation of the rangeof predators taking post-settlement plaice atTralee Beach would need to utilise differentsampling gears (e.g. beach seine) and sam-pling would need to continue into the summerand autumn. Because the size of the juvenileflatfish prey will be larger by late summer,
the application of molecular probes may have lessadvantage at this time; evaluating this was beyondthe scope of the present study.
Advantages and disadvantages of the molecularapproach for dietary studies
Visually identifying prey remains is time consum-ing and requires skilled analysts so results are oftenrestricted to broad categories, e.g. roundfish and flat-fish (Pihl & Rosenberg 1984, Pihl 1985, del Norte-Campos & Temming 1994, Ansell et al. 1999, Oh et al.
2001, Chen et al. 2004, Baeta et al. 2006). Inthe present study, 5 Crangon crangon stom-achs contained flatfish remains but only 3gave positive TaqMan responses, indicatingthat the shrimp were also eating flatfish otherthan plaice (probably dab or flounder). Sincepositive visual identification of small juvenileflatfish requires fin-ray counts (Nichols 1971)and this is usually impossible with partiallydigested material, the application of moleculartechniques represents a significant advance inimproving distinction between prey species.The molecular approach was also able todetect plaice DNA even when there were novisually identifiable fish remains in the stom-achs, e.g. in shore crabs and in C. crangon of 7to 8.5 mm CL.
Experiments using the TaqMan approachhave also shown that plaice DNA is detectablein >90% of individual shrimp for up to 5 hpost-ingestion (Al baina et al. 2010). This is
233
Fig. 4. Crangon crangon predation on Pleuronectes platessa. Relation-ship between the occurrence of plaice DNA in stomachs of shrimp≥7 mm cephalothorax length (CL) (% positive TaqMan reactions) andthe density of plaice juveniles (ind. 1000 m−2). No correction for catch-ability of the sampling gear was applied to these estimates. Continu-ous line represents optimal linear regression model based on AkaikeInformation Criterion (AIC) fitted to the data (y = 0.0576x + 18.153;
R² = 0.5456, p = 0.009)
Fig. 3. Crangon crangon predation on Pleuronectes platessa. j: per-centage of stomach contents from shrimp ≥7 mm cephalothoraxlength (CL) from each sampling date that tested positive for theplaice-specific TaqMan assay. Dashed line: juvenile plaice mean
total length (TL) on each sampling date

Mar Ecol Prog Ser 444: 223–238, 2012
considerably longer than the time that hard partshave been reported to remain detectable. Based onvisual analysis, van der Veer & Bergman (1987) sug-gested that the 80% detection limit for plaice con-sumed by shrimp was only 2 to 3 h. Longer detectiontimes are clearly advantageous for field studies sothat sampling does not need to be so tightly tied topeaks of feeding activity.
A significant disadvantage of present molecularmethods for diet studies is that they cannot easily beused to estimate the amounts of prey ingested. Al -though future developments combining quantitativePCR with fragment-length analysis may have thepotential to overcome this limitation (Deagle et al.2006, Troedsson et al. 2009), we were forced to make
several simplifying assumptions in order to convertthe binary TaqMan response to estimates of mortal-ity. The main assumption was that each positive Taq-Man result corresponded to a single plaice con-sumed. In experiments, handling times of plaice byshrimp varied from almost instantaneous up to 5 hdepending on the relative sizes of the predator andprey (Gibson et al. 1995). However, consumptionrates are the result of a combination of handling, sati-ation and digestion times and there are rather fewreports on consumption rates by individual Crangoncrangon. Van der Veer & Bergman (1987) showedthat large shrimp (>60 mm TL) can consume an aver-age of ~0.7 plaice (<25 mm TL) per predator in a 12 hperiod. Consumption rates for both smaller shrimpand larger prey were lower. In experiments con-ducted by Wennhage (2002) shrimp (32 to 38 mm TL)could consume up to 4 plaice each over 12 h, but thisonly occurred at very high prey densities (>32 plaicem−2). At prey densities comparable to the presentstudy (~1 to 5 prey m−2 net avoidance corrected),average consumption dropped to 1 prey or less. How-ever, since these experiments were conducted with3 predators in each arena, whether each shrimp wasconsuming partial prey or some shrimp failed tocatch any prey at these low densities is unclear. Ourassumption of single feeding events does not there-fore seem unreasonable, although we cannot elimi-nate the possibility that several shrimp were feedingon individual prey. The over-estimation of shrimppredation by TaqMan could also be due to partialfeeding, i.e. fin nibbling and shrimp abandoningnon-lethally wounded prey, or to predators and preybeing concentrated at peak feeding times (see ‘Dis-cussion: Predation and mortality rates’). Alternativeroutes by which prey DNA might get into the guts ofpredators include secondary predation and scaveng-ing (King et al. 2008). While secondary predation ofjuvenile plaice by shrimp would be highly unlikely,scavenging (including cases of >1 shrimp feedingfrom a single plaice) probably does occur. Macer(1967) also reported that 0-group plaice were foundin up to 20% of stomachs of 1-group plaice so canni-balism may represent an additional source of preda-tion at Tralee that cannot be detected using the pre-sent TaqMan approach.
In conclusion, molecular detection of plaice DNAprovided a sensitive technique that allowed rapidscreening of large numbers of predator stomachsfrom Tralee Beach. The importance of the brownshrimp as a consumer of recently settled plaice wasconfirmed and additional potential predators such asshore crab, gurnard and gobies were identified. For
234
Fig. 5. Pleuronectes platessa. Change in juvenile plaice den-sity over time in spring 2009. Fitted line is the regression oflog plaice abundance versus day of year (y = −0.0448x +14.251; R² = 0.6557, p = 0.027) (h) before and (j) after thepeak of density. Instantaneous mortality for plaice popula-tion is estimated as the linear slope of the decline (ind. d−1).Plaice densities were corrected for catchability by beam
trawl assuming a fixed catch efficiency of 20%
Fig. 6. Pleuronectes platessa. Estimated plaice mortality dueto Crangon crangon predation based on TaqMan results. See
Eq. (2) in ‘Materials and methods’ for further information
Albaina et al.: Molecular detection of plaice remains
shrimp, molecular detection rates significantly ex -ceeded the occurrence of visually identifiable re -mains in shrimp stomachs, suggesting that previousstudies may have under-estimated the impact ofshrimp on recently settled plaice.
Acknowledgements. The authors thank W. Grail for helpwith laboratory work. A.A. was supported by a Postdoctoralfellowship from the Education, Universities and ResearchDepartment of the Basque Country Government. C.J.F. wassupported by NERC Oceans 2025 Program, Theme 4, Workpackage 4.4 Predators and prey. Probe development andtesting was financially supported by Defra (UK Departmentfor Environment, Food and Rural Affairs) under researchproject MF0432 (Detecting predation on fish eggs and lar-vae) and by a Small Research Grant award of the FisheriesSociety of the British Isles awarded to M.I.T.
LITERATURE CITED
Albaina A, Fox CJ, Taylor N, Hunter E, Maillard M, TaylorMI (2010) A TaqMan real-time PCR based assay target-ing plaice (Pleuronectes platessa L.) DNA to detect pre-dation by the brown shrimp (Crangon crangon L.) andthe shore crab (Carcinus maenas L.) — assay develop-ment and validation. J Exp Mar Biol Ecol 391: 178−189
Aljanabi SM, Martinez I (1997) Universal and rapid salt-extraction of high quality genomic DNA for PCR-basedtechniques. Nucleic Acids Res 25: 4692−4693
Amara R, Paul C (2003) Seasonal patterns in the fish andepibenthic crustaceans community of an intertidal zonewith particular reference to the population dynamics ofplaice and brown shrimp. Estuar Coast Shelf Sci 56: 807−818
Ansell AD, Gibson RN (1993) The effect of sand and light onpredation of juvenile plaice (Pleuronectes platessa) byfishes and crustaceans. J Fish Biol 43: 837−845
Ansell AD, Comely CA, Robb L (1999) Distribution, move-ments and diet of macrocrustaceans on a Scottish sandybeach with particular reference to predation on juvenilefishes. Mar Ecol Prog Ser 176: 115−130
Asahida T, Yamashita Y, Kobayashi T (1997) Identification ofconsumed stone flounder, Kareius bicoloratus (Basi lews -ky), from the stomach contents of sand shrimp, Crangonaffinis (De Haan) using mitochondrial DNA analysis.J Exp Mar Biol Ecol 217: 153−163
Baeta A, Cabral HN, Marques JC, Pardal MA (2006) Feed-ing ecology of the green crab, Carcinus maenas (L.,1758) in a temperate estuary, Portugal. Crustaceana 79: 1181−1193
Bailey KM, Brodeur RD, Merati N, Yoklavich MM (1993)Predation on walleye pollock (Theragra chalcogramma)eggs and yolk-sac larvae by pelagic crustacean inverte-brates in the western Gulf of Alaska. Fish Oceanogr 2: 30−39
Bannister RCA, Harding D, Lockwood SJ (1974) Larval mor-tality and subsequent year-class strength in the plaice(Pleuronectes platessa L.). In: Blaxter JHS (ed) The earlylife history of fish. Springer, Berlin, p 21−37
Barnett A, Redd KS, Frusher SD, Stevens JD, Semmens JM(2010) Non-lethal method to obtain stomach samplesfrom a large marine predator and the use of DNA analy-
sis to improve dietary information. J Exp Mar Biol Ecol393: 188−192
Beverton RJH, Iles TC (1992) Mortality rates of 0-groupplaice (Pleuronectes platessa L.), dab (Limanda limandaL.) and turbot (Scophthalmus maximus L.) in Europeanwaters: III. Density dependence of mortality rates of 0-group plaice and some demographic implications.Neth J Sea Res 29: 61−79
Braley M, Goldsworthy SD, Page B, Steer M, Austin JJ(2010) Assessing morphological and DNA-based dietanalysis techniques in a generalist predator, the arrowsquid Nototodarus gouldi. Mol Ecol Resour 10: 466−474
Burrows MT, Gibson RN, Robb L, Comely CA (1994) Tempo-ral patterns of movement in juvenile flatfishes and theirpredators: underwater television observations. J ExpMar Biol Ecol 177: 251−268
Burrows MT, Gontarek SJ, Nash RDM, Gibson RN (2001)Shrimp predation on 0-group plaice: contrasts betweenfield data and predictions of an individual-based model.J Sea Res 45: 243−254
Chen RB, Watanabe S, Yokota M (2004) Feeding habits of anexotic species, the Mediterranean green crab Carcinusaestuarii, in Tokyo Bay. Fish Sci 70: 430−435
Deagle BE, Eveson JP, Jarman SN (2006) Quantification ofdamage in DNA recovered from highly degraded sam-ples − a case study on DNA in faeces. Front Zool 3: 11
Deagle BE, Kirkwood R, Jarman SN (2009) Analysis of Aus-tralian fur seal diet by pyrosequencing prey DNA in fae-ces. Mol Ecol 18: 2022−2038
del Norte-Campos AGC, Temming A (1994) Daily activity,feeding and rations in gobies and brown shrimp in thenorthern Wadden Sea. Mar Ecol Prog Ser 115: 41−53
Edwards RRC, Steele JH (1968) The ecology of 0-groupplaice and common dabs at Lochewe. I. Population andfood. J Exp Mar Biol Ecol 2: 215−238
Ellis T, Gibson RN (1995) Size-selective predation of 0-group flatfishes on a Scottish coastal nursery ground.Mar Ecol Prog Ser 127: 27−37
Ellis T, Nash RDM (1997) Predation by sprat and herring onpelagic fish eggs in a plaice spawning area in the IrishSea. J Fish Biol 50: 1195−1202
Fox CJ, McCloghrie P, Young EF, Nash RDM (2006) Theimportance of individual behaviour for successful settle-ment of juvenile plaice (Pleuronectes platessa L.): a mod-elling and field study in the eastern Irish Sea. FishOceanogr 15: 301−313
Freitas V, Campos J, Skreslet S, van der Veer HW (2010)Habitat quality of a subarctic nursery ground for 0-groupplaice (Pleuronectes platessa L.). J Sea Res 64: 26−33
Gibson RN, Robb L (1996) Piscine predation on juvenilefishes on a Scottish sandy beach. J Fish Biol 49: 120−138
Gibson RN, Ansell AD, Robb L (1993) Seasonal and annualvariations in abundance and species composition of fishand macrocrustacean communities on a Scottish sandybeach. Mar Ecol Prog Ser 98: 89−105
Gibson RN, Yin MC, Robb L (1995) The behavioural basis ofpredator-prey size relationships between shrimp (Cran-gon crangon) and juvenile plaice (Pleuronectes platessa).J Mar Biol Assoc UK 75: 337−349
Gibson RN, Robb L, Burrows MT, Ansell AD (1996) Tidal,diel and longer term changes in the distribution of fisheson a Scottish sandy beach. Mar Ecol Prog Ser 130: 1−17
Gibson RN, Pihl L, Burrows MT, Modin J, Wennhage H,Nickell LA (1998) Diel movements of juvenile plaicePleuronectes platessa in relation to predators, competi-
235

Mar Ecol Prog Ser 444: 223–238, 2012
tors, food availability and abiotic factors on a microtidalnursery ground. Mar Ecol Prog Ser 165: 145−159
Gibson RN, Robb L, Wennhage H, Burrows MT (2002) Onto-genetic changes in depth distribution of juvenile flatfishesin relation to predation risk and temperature on a shallow-water nursery ground. Mar Ecol Prog Ser 229: 233−244
Granadeiro JP, Silva MA (2000) The use of otoliths and ver-tebrae in the identification and size-estimation of fish inpredator–prey studies. Cybium 24: 383−393
Hamer KC, Humphreys EM, Garthe S, Hennicke J and others (2007) Annual variation in diets, feeding locationsand foraging behaviour of gannets in the North Sea: flex-ibility, consistency and constraint. Mar Ecol Prog Ser 338: 295−305
Iles TC, Beverton RJH (1991) Mortality rates of 0-groupplaice (Pleuronectes platessa L.), dab (Limanda limandaL.) and turbot (Scophthalmus maximus L.) in Europeanwaters: I. Statistical analysis of the data and estimation ofparameters. Neth J Sea Res 27: 217−235
Iles TC, Beverton RJH (2000) The concentration hypothesis: the statistical evidence. ICES J Mar Sci 57: 216−227
King RA, Read DS, Traugott M, Symondson WOC (2008)Molecular analysis of predation: a review of best practicefor DNA-based approaches. Mol Ecol 17: 947−963
Kuipers BR, Currin BM, Miller JM, van der Veer HW, deWitte JIJ (1992) Small trawls in juvenile flatfish research: their development and efficiency. Neth J Sea Res 29: 109−117
Labansen AL, Lydersen C, Haug T, Kovacs KM (2007) Springdiet of ringed seals (Phoca hispida) from northwesternSpitsbergen, Norway. ICES J Mar Sci 64: 1246−1256
Leopold MF, van Damme CJG, van der Veer HW (1998) Dietof cormorants and the impact of cormorant predation onjuvenile flatfish in the Dutch Wadden Sea. J Sea Res 40: 93−107
Lockwood SJ, Daly C de B (1975) Further observations onthe effects of preservation in 4% neutral formalin on thelength and weight of 0-group flatfish. J Cons Int ExplorMer 36: 170−175
Macer CT (1967) The food web in Red Wharf Bay (NorthWales) with particular reference to young plaice (Pleu-ronectes platessa). Helgol Wiss Meeresunters 15: 560−573
Marshall HD, Hart KA, Yaskowiak ES, Stenson GB, McKin-non D, Perry EA (2010) Molecular identification of preyin the stomach contents of harp seals (Pagophilus groen-landicus) using species-specific oligonucleotides. MolEcol Resour 10: 181−189
Nash RDM, Geffen AJ (2000) The influence of nurseryground processes in the determination of year-classstrength in juvenile plaice Pleuronectes platessa L. inPort Erin Bay, Irish Sea. J Sea Res 44: 101−110
Nash RDM, Geffen AJ, Burrows MT, Gibson RN (2007)Dynamics of shallow-water juvenile flatfish nurserygrounds: application of the self-thinning rule. Mar EcolProg Ser 344: 231−244
Naviaux RK, Good B, McPherson JD, Steffen DL, MarkusicD, Ransom B, Corbeil J (2005) Sand DNA — a geneticlibrary of life at the water’s edge. Mar Ecol Prog Ser 301: 9−22
Nejstgaard JC, Frischer ME, Raule CL, Gruebel RC,Kohlberg KE, Verity PG (2003) Molecular detection ofalgal prey in copepod guts and fecal pellets. LimnolOceanogr Methods 1: 29−38
Nichols JH (1971) Pleuronectidae. Fiches d’identification
des oeufs et larves de poissons, Fiches 4−6. Conseil Inter-national pour l’Exploration de la Mer, Copenhagen
Oh CW, Hartnoll RG, Nash RDM (2001) Feeding ecology ofthe common shrimp Crangon crangon in Port Erin Bay,Isle of Man, Irish Sea. Mar Ecol Prog Ser 214: 211−223
Pihl L (1985) Food selection and consumption of mobileepibenthic fauna in shallow marine areas. Mar Ecol ProgSer 22: 169−179
Pihl L, Rosenberg R (1984) Food selection and consumptionof the shrimp Crangon crangon in some shallow marineareas in western Sweden. Mar Ecol Prog Ser 15: 159−168
Rogers SI, Lockwood SJ (1989) Observations on the captureefficiency of a two-metre beam trawl for juvenile flatfish.Neth J Sea Res 23: 347−352
Rosel PE, Kocher TD (2002) DNA-based identification of lar-val cod in stomach contents of predatory fishes. J ExpMar Biol Ecol 267: 75−88
Saitoh K, Takagaki M, Yamashita Y (2003) Detection ofJapanese flounder-specific DNA from gut contents ofpotential predators in the field. Fish Sci 69: 473−477
Smith PJ, McVeagh SM, Allain V, Sanchez C (2005) DNAidentification of gut contents of large pelagic fishes.J Fish Biol 67: 1178−1183
Symondson WOC (2002) Molecular identification of prey inpredator diets. Mol Ecol 11: 627−641
Taylor DL (2004) Immunological detection of winter floun-der (Pseudopleuronectes americanus) eggs and juvenilesin the stomach contents of crustacean predators. J ExpMar Biol Ecol 301: 55−73
Taylor DL (2005a) Predation on post-settlement winterfloun der Pseudopleuronectes americanus by sandshrimp Crangon septemspinosa in NW Atlantic estuar-ies. Mar Ecol Prog Ser 289: 245−262
Taylor DL (2005b) Predatory impact of the green crab(Carcinus maenas Linnaeus) on post-settlement winterflounder (Pseudopleuronectes americanus Walbaum) asrevealed by immunological dietary analysis. J Exp MarBiol Ecol 324: 112−126
Troedsson C, Frischer ME, Nejstgaard JC, Thompson EM(2007) Molecular quantification of differential ingestionand particle trapping rates by the appendicularian Oiko-pleura dioica as a function of prey size and shape. LimnolOceanogr 52: 416−427
Troedsson C, Simonelli P, Nägele V, Nejstgaard JC, FrischerME (2009) Quantification of copepod gut content by differential length amplification quantitative PCR (dla-qPCR). Mar Biol 156: 253−259
van der Veer HW, Bergman MJN (1987) Predation by crus-taceans on a newly settled 0-group plaice Pleuronectesplatessa population in the western Wadden Sea. MarEcol Prog Ser 35: 203−215
van der Veer HW, Bolle LJ, Geffen AJ, Witte JIJ (2009) Vari-ability in transport of fish eggs and larvae. IV. Interan-nual variability in larval stage duration of immigratingplaice in the Dutch Wadden Sea. Mar Ecol Prog Ser 390: 213−223
Wennhage H (2002) Vulnerability of newly settled plaice(Pleuronectes platessa L.) to predation: effects of habitatstructure and predator functional response. J Exp MarBiol Ecol 269: 129−145
Wennhage H, Gibson RN, Robb L (1997) The use of droptraps to estimate the efficiency of two bean trawls com-monly used for sampling juvenile flatfishes. J Fish Biol51: 441−445
236

Albaina et al.: Molecular detection of plaice remains 237
Table A1. Taxa caught at Tralee in spring 2009. Mean and maximum densities(ind. 1000 m−2) for the 11 sampling dates along with the relative density (%)pooling all surveys together. No correction for catchability of the sampling
gear was applied
Species Density (ind. 1000 m–2) Relative Mean Max density (%)
Crangon crangon 567.22 2027.47 39.438Pleuronectes platessa 483.88 862.97 36.478Gobiidae 167.71 1146.07 10.383Ammodytes spp. 101.44 496.88 6.197Carcinus maenas 37.60 88.00 2.740Limanda limanda 28.42 110.26 1.928Platichthys flesus 21.02 142.32 1.281Solea solea 9.42 46.65 0.702Clupeidae 4.07 42.68 0.303Eutrigla gurnardus 1.99 10.26 0.124Syngnathus rostellatus 1.19 3.89 0.083Pleuronectidae unknown 0.73 2.56 0.055Myoxocephalus scorpius 0.60 2.67 0.041Liocarcinus holsatus 0.61 2.67 0.041Cyclopterus lumpus 0.55 2.03 0.041Gadidae 0.35 3.89 0.028Agonus cataphractus 0.40 2.50 0.028Spinachia spinachia 0.36 2.01 0.028Pollachius virens 0.35 3.89 0.028Pholis gunnellus 0.23 2.50 0.014Gobiesocidae 0.18 2.03 0.014Clupea harengus 0.17 1.90 0.014
Appendix
Table A2. Crangon crangon. Effect of shrimp sex and female gonad maturation on the (A) descriptive criteria for shrimp ≥7 mmcepha lothorax length (CL) collected during sampling and (B) occurrence of different prey items in the stomachs of shrimpsdetermined though visual identification. GS: Gonad Stage (see ‘Materials and methods’). All the sampling dates were pooled
Male Female (all) Female GS1 Female GS2 Female GS3 Female GS4
(A) Descriptive criteriaNo. of shrimp 505 632 351 22 55 203Size (mm CL) 7.51 9.63 8.82 10.48 10.53 10.72% fullness index 3 46.93 43.42 52.42 40.91 23.64 33.50
(B) Prey items in the shrimp stomachs (% occurrence)Fish total 0.99 2.37 0.85 13.64 0 4.43Flatfish 0.20 0.63 0.28 4.55 0 0.99Crustacean total 26.34 29.91 32.19 27.27 18.18 29.56Mysid 11.29 14.56 14.53 18.18 7.27 16.26

Mar Ecol Prog Ser 444: 223–238, 2012238
Table A3. Ammodytes spp., Eutrigla gurnardus, Gobiidae. (A) Descriptive cri-teria of fish collected during sampling. (B) Diet of 3 fish taxa identified fromvisual inspection of stomach contents. Prey is reported as percentage of occur-
rence. Results are limited to 1 yr+ fish individuals. TL: total length
Gobiidae Ammodytes Eutrigla spp. gurnardus
(A) Descriptive criteriaNo. of fish 57 18 5Size (mm TL) 56.75 ± 8.26 105.53 ± 26.05 88.1 ± 23.13% fullness index 3 70.18 61.11 100.00
(B) Prey items in the fish stomachs (% occurrence)Unidentified plankton 89.47 83.33 0.00Fish total 8.77 0.00 20.00Flatfish 1.75 0.00 20.00Roundfish 8.77 0.00 0.00Unknown fish 1.75 0.00 20.00
Crustacean total 28.07 11.11 100.00Mysid 8.77 0.00 20.00Amphipod 12.28 0.00 80.00Isopod 0.00 0.00 0.00Crangon crangon (juvenile) 7.02 5.56 80.00Unknown crustacean 7.02 5.56 0.00
Editorial responsibility: Nicholas Tolimieri, Seattle, Washington, USA
Submitted: June 23, 2011; Accepted: October 3, 2011Proofs received from author(s): December 14, 2011