molecular dynamics of tert-butyl chloride conflned to cpg...
TRANSCRIPT

Vol. 108 (2005) ACTA PHYSICA POLONICA A No. 2
Proceedings of the XXI International Meeting on Radio and Microwave SpectroscopyRAMIS 2005, Poznan-Bedlewo, Poland, April 24–28, 2005
Molecular Dynamics of Tert-butyl
Chloride Confined to CPG (7.4, 15.6 nm)
L. Szutkowska, B. Peplinska and S. Jurga∗
Department of Macromolecular Physics, Adam Mickiewicz UniversityUmultowska 85, 61-614 Poznan, Poland
The paper complements our earlier NMR investigation of molecular dy-
namics of tert-butyl chloride restricted by geometries of the type MCM-41
and CPG by the new sizes of CPG and by differential scanning calorime-
try method. We report proton and deuteron NMR lineshapes and the spin-
-lattice relaxation results of tert-butyl chloride in CPG of the 15.6 nm and
7.4 nm pore diameter in the temperature range 70 K ≤ T ≤ 292 K. The
bulk-like component of the confined tert-butyl chloride, in temperatures cor-
responding to phase III, is interpreted as a composition of two dynamically
different subphases. The parameters of motions of both subphases are de-
rived. The tert-butyl group motion in both subphases is more restricted than
in the bulk tert-butyl chloride, although the activation energies are lower.
Differential scanning calorimetry was used to determine temperatures of the
phase transitions (140 K ≤ T ≤ 292 K). The results show that the depres-
sion of the phase transition temperature is pore size dependent and that the
confinement has less influence on transition to the plastic phase than on the
freezing and on the solid II – solid III transition.
PACS numbers: 76.60.Es, 81.05.Rm, 33.15.Vb, 33.20.Bx, 68.35.Rh
1. Introduction
A variety of porous systems with different properties, mean pore sizes anddistributions, connectivities and dimensionalities are now available and providean opportunity to study confinement, finite size, and surface effects. Confinedgeometry has generated much interest in many fields of applied and fundamentalresearch. It is well recognized that the characteristic features of the molecularmotion and the thermal properties as well as the spatial structure of solids can bemodified by the proximity of an interface, which provides geometrical constraintson the material [3–8]. The low dimensionality and fluid-wall interactions lead to
∗corresponding author; e-mail: [email protected]
(357)

358 L. Szutkowska, B. Peplinska, S. Jurga
the formation of a highly defective nature of the crystallites or pseudo-liquid withinthe porous medium. As a consequence, in comparing to bulk sample in the highertemperatures decreasing mobility of the liquid and increased rotational mobilityin the crystalline phases are observed [9, 10]. According to the Gibbs–Thomsonequation, the observed depression of the transition temperatures is inversely pro-portional to the pore size [11]. This equation does not hold for the narrowest poresdue to surface heterogeneity and finite size effects. Below the critical size, whichdepends on the properties of the confined fluid, the freezing does not occur at all[12, 13].
The relative influence of topology of the confining matrix and fluid-wall inter-actions are difficult to separate. To disentangle all parameters, systematic studieswith adequate surface, topology and pore size modifications are needed. Thetert-butyl cloride (TBC) is particularly well suited to such studies because of aninteresting and well-documented phase diagram and internal dynamics [14–17].The interaction of TBC with the surface of CPG is non-specific, so that the fea-tures studied, such as the changes in transition temperatures and molecular motionshould reflect the properties of the small size crystals rather than specific interac-tions between TBC molecules and silica. This effect is particularly clear in the caseof small pore diameter like the CPG of 7.4 nm, because of a relatively large S/V
ratio, where a large fraction of confining molecules experience direct interactionswith pore walls and large compressive stress. A combination of the thermal anddynamical methods is a valuable approach to investigation of molecular interac-tions within the constrained geometry of the surrounding silica.
In this paper the influence of confinement on the molecular dynamics andtemperature of the phase transitions of TBC restricted by CPG of diameter15.6 nm and 7.4 nm are studied by NMR 1H and 2H linewidths, lineshapes, spin--lattice relaxation times, and by differential scanning calorimetry (DSC) method.
2. Experimental
2.1. DSC measurements
A NETZSCH DSC204 Phoenix (Differential Scanning Calorimeter) was usedto perform calorimetric experiments. Calibration of the equipment was performedusing the phase transition temperatures of several pure materials. The DSC mea-surements were carried out in the range 140 K ≤ T ≤ 292 K. The cooling ratewas 2 K/min. The samples were sealed using high-pressure pans to avoid evapo-ration of TBC. The amount of the liquid TBC was chosen so that to fill the porescompletely and keep a few percent of excess liquid outside the pores to detect thebulk and determine precisely the temperature depression.
2.2. NMR measurements1H and 2H measurements were performed using a Bruker CXP-200 spectro-
meter with a 4.7 Tesla magnet. 1H spin-lattice relaxation times were measured

Molecular Dynamics of Tert-butyl Chloride . . . 359
with the standard π − τ − π/2 inversion-recovery pulse sequence with phase cy-cling. Magnetization was inspected up to 5T1. 1H spectra were obtained by theconventional quadrature FFT method. The same procedure was used to obtain2H spectra and 2H T1 relaxation data for the liquid and the solid phase I ofTBC. 2H measurements in the solid phases II and III of TBC were made with the(π/2)x− τQ− (π/2)y pulse sequence, and the spectra were obtained as the Fouriertransform of the one half of the quadrupolar echo. The frequency independent 2Hspin-lattice relaxation data for the solid phases II and III were obtained from the re-covery of the quadrupolar echo amplitude following the π−τ−(π/2)x−τQ−(π/2)y
sequence [18, 19]. The temperature of the sample was stabilized in a dynamic Ox-ford helium flow cryostat and was controlled by an Oxford ITC 503 controller.Lineshape simulations of the spectra were performed by standard methods [20]using the MXQET computer program.
The pore silica CPG of the pore diameter 15.6 and 7.4 nm were obtainedfrom CPG Inc. The specific surface area measured by nitrogen adsorption equals153 m2/g for 7.5 nm and 91 m2/g for 15.6 nm CPG.
The sample preparation has been described in the previous papers [1, 2].
3. Results and discussion
3.1. DSC
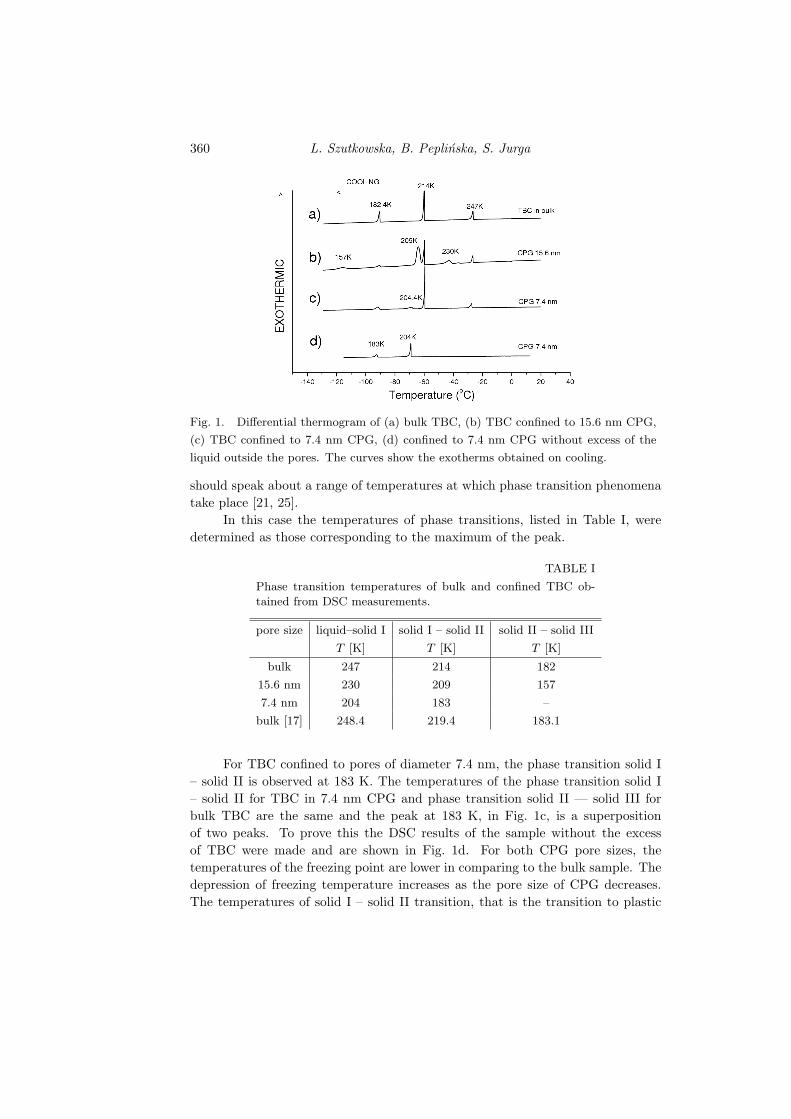
The DSC thermal curves of the bulk TBC (a) and TBC confined to CPGof pore diameter 15.6 nm (b) and 7.4 nm (c) are shown in Fig. 1. The DSCcurves recorded on cooling the sample from room temperature to 140 K at therate of 2 K/min reveal peaks, assigned to exothermic transitions. The curve forthe bulk TBC (a) shows three peaks at 247 K, 214 K, and 182.4 K, which is ingood agreement with literature values [17]. The first peak at 247 K is assigned toliquid–solid I transition, while the latter to the solid I – solid II (at 214 K) andsolid II – solid III (182.4 K) transitions. The characteristic larger peak at 214 Kmarks the transition to the plastic phase, in which molecules are very mobile andorientationally disordered [21–23].
The thermograms (b) and (c) show the peaks of the phase transitions ofthe confined material and the bulk excess outside the pores. In the bulk samples,phase transition temperatures are given by the onset of the transition peak onDSC scans.
The same method cannot be used when dealing with confined material be-cause of the broadening of the transition peaks.
The broadening of the transition may reflect the distribution of the phasetransition temperatures, due to the polydispersity of porous medium [24]. An-other explanation is that in the pores where crystallization occurs this processprogresses gradually (“layer-by-layer” [25]) over a wide temperature range. Theexact temperature of the phase transition cannot be determined, therefore we
360 L. Szutkowska, B. Peplinska, S. Jurga
Fig. 1. Differential thermogram of (a) bulk TBC, (b) TBC confined to 15.6 nm CPG,
(c) TBC confined to 7.4 nm CPG, (d) confined to 7.4 nm CPG without excess of the
liquid outside the pores. The curves show the exotherms obtained on cooling.
should speak about a range of temperatures at which phase transition phenomenatake place [21, 25].
In this case the temperatures of phase transitions, listed in Table I, weredetermined as those corresponding to the maximum of the peak.
TABLE I
Phase transition temperatures of bulk and confined TBC ob-
tained from DSC measurements.
pore size liquid–solid I solid I – solid II solid II – solid III
T [K] T [K] T [K]
bulk 247 214 182
15.6 nm 230 209 157
7.4 nm 204 183 –
bulk [17] 248.4 219.4 183.1
For TBC confined to pores of diameter 7.4 nm, the phase transition solid I– solid II is observed at 183 K. The temperatures of the phase transition solid I– solid II for TBC in 7.4 nm CPG and phase transition solid II — solid III forbulk TBC are the same and the peak at 183 K, in Fig. 1c, is a superpositionof two peaks. To prove this the DSC results of the sample without the excessof TBC were made and are shown in Fig. 1d. For both CPG pore sizes, thetemperatures of the freezing point are lower in comparing to the bulk sample. Thedepression of freezing temperature increases as the pore size of CPG decreases.The temperatures of solid I – solid II transition, that is the transition to plastic
Molecular Dynamics of Tert-butyl Chloride . . . 361
phase, observed for TBC confined to CPG with 15.6 nm as well as 7.4 nm porediameter is also depressed, 5 K and 21 K, respectively. Similarly to the results forcyclohexane [21, 23, 25], the extent of the depression, is smaller than that of thefreezing temperatures, 17 K and 43 K, respectively.
The solid II – solid III phase transition of TBC in 15.6 nm pores was detectedat 157 K and the extent of the depression, 25 K, comparing to that of the freezingtemperature, 17 K, is larger, like in a typical solid–solid phase transition [26, 27].The results show that the confinement has less influence on transition to the plasticphase than on freezing and on the solid II – solid III transition.
The phase transition solid II – solid III for TBC in 7.4 nm CPG was notobserved down to 140 K. It may be due to additional heterogeneity in the orienta-tion and structure of the adsorbed layers induced in smaller pores by the radius ofcurvature. A crystal growing inside a pore, because of relative strong reduced size,experiences larger compressive stress, so the structure of the solid TBC is in theform of a disordered aggregate rather than in its conventional solid structure, andsolid–solid transitions do not occur at all [23, 28, 29]. Probably the critical sizeof the crystal is required. Also, it may be argued that the number of molecules ofTBC in pores with high S/V is not large enough to detect the solid II – solid IIIphase transitions due to the resolution of our DSC system or that temperature ofthe shifted phase transition has not been reached.
3.2. Spin-lattice relaxation
The 1H and 2H spin-lattice relaxation times as a function of inverse temper-ature for TBC confined in 15.6 and 7.4 nm CPG are given in Figs. 2 and 3. Theresults for bulk TBC obtained earlier [1, 2] are presented for comparison.
Similarly to the earlier results [1, 2] the 2H spin-lattice relaxation timesof TBC for both new sizes of CPG are insensitive to the liquid–solid I phasetransition, however the 1H T1 data exhibit a small modification of the slope in thetemperatures range corresponding to the solid phase I on the DSC curves.
Lowering the temperature, the plots of T1 for both sizes of CPG exhibitdiscontinuities, which are associated with solid I – solid II transition manifestingalso in the DSC measurements. This transition detected by proton and deuteronNMR relaxation times occurs at 205 K for 15.6 nm CPG and at about 183 K for7.4 nm CPG. Taking into account that the confined systems always exhibit largetransition temperature differences due to the broadening of transitions, the NMRresults are in good agreement with the ones obtained from DSC method, 209 Kand 183 K for 15.6 nm and 7.4 nm CPG, respectively.
In the temperature regions considered, the proton and deuteron T1 relaxationtime values of TBC confined in CPG are reduced. The reduction is larger for7.4 nm pore size, showing increasing restriction of the translational motion andtumbling with the reduced pore size. These results are in agreement with previousobservations [1, 2] and those given in literature [5, 6, 8].

362 L. Szutkowska, B. Peplinska, S. Jurga
Fig. 2. Temperature dependences of 1H relaxation time, T1, for TBC confined in
15.6 nm CPG (open and solid squares for the two components of relaxation), in 7.4 nm
CPG (solid triangles) and bulk TBC (solid circles).
Fig. 3. Temperature dependences of 2H relaxation time, T1, for TBC confined in
15.6 nm CPG (open and solid squares for the two components of relaxation), in 7.4 nm
CPG (open and solid triangles for the two components of relaxation) and bulk TBC
(solid circles).
Below the temperature of the solid I – solid II phase transition of TBCconfined to 15.6 nm CPG, two spin-lattice relaxation components are revealed byproton and deuteron data. The two-component system corresponds to two dynam-ically different regions formed as a result of confinement. One can be attributedto a more mobile fraction of molecules in the liquid-like surface layer and the otherto the bulk-like phase at the center of the pore.
Molecular Dynamics of Tert-butyl Chloride . . . 363
In temperatures between 165 K and 105 K, the two-exponential magneti-zation recovery of the proton relaxation disappears. The values of the protonrelaxation times of both regions of confinement TBC are so similar that it is verydifficult to distinguish between them.
For the 7.4 nm pore system in the temperature range studied only one com-ponent of the spin-lattice relaxation times of TBC was observed for the protondata, whereas the 2H spin-lattice relaxation times show one component of T1
above 100 K. It follows that the fast exchange limit is fulfilled and only a singleexchange averaged T1 is observed.
The bulk-like component of confined TBC in phase III in the plots of 1Hand 2H spin-lattice relaxation times exhibit minima. The minima are higher,shallower, and wider for 7.4 nm than for 15.6 nm CPG and than in the bulk TBC.Broad minima have been associated with a distribution of correlation times as aconsequence of the confinement. It is a result of coexistence of subphases withinthe bulk-like component with different correlation times characterizing rotation ofthe tert-butyl group.
1H relaxation proceeds mainly via dipolar coupling, while 2H relaxation isdominated by the quadrupolar interaction. As in the bulk TBC, both processesare modulated by a composite motion involving reorientation of the methyl groupsabout their symmetry axes (C3 rotation) and rotation of the whole tert-butyl groupabout the axis of the C–Cl bond (C ′3 reorientation). Assuming that the motionsare thermally activated and independent of each other, the intra-methyl relaxationrate of protons and deuterons can be analyzed by the following expressions [30, 31]:
(1
T1H1
)ME
=980
γ4h2
r6
3∑
i=1
Ai(θ, ϕ)f(ω, τi), (1)
(1
T2H1
)ME
=350
π2
[2I + 3
I2(2I − 1)
]χ2
3∑
i=1
Ai(θ, ϕ)f(ω, τi), (2)
where all parameters have their usual meaning [1, 2].It is sufficient to assume the existence of only two kinds of tert-butyl groups
in bulk-like phase of TBC in both 15.6 and 7.4 nm CPG. The best fit of Eqs. (1)and (2), with the simple assumption that the tert-butyl groups are dynamicallydifferent, i.e. that the C ′3 reorientation is described by different activation param-eters, is shown by the solid and dashed lines in Figs. 2 and 3. An attempt torationalize the relaxation results by fitting to different distribution models (likeCole-Cole, Cole-Davidson, Fuoss-Kirkwood [32]) has not been successful, even forthe very broad and shallow minimum of TBC in 7.4 nm CPG.
The calculated activation energies and preexponential factors for the C ′3 ro-tation in two dynamically different states of bulk-like phase, together with thoseearlier obtained for the bulk TBC, from both 1H and 2H T1 data, are given in

364 L. Szutkowska, B. Peplinska, S. Jurga
TABLE II
Activation energies and the preexponential factors of the C′3 motion of bulk-like phase
of TBC confined to 15.6 nm and 7.4 nm pore diameters CPG obtained from 1H, 2H T1,
and 2H NMR spectra.
1HT12HT1
2H spectra
15.6 nm 7.4 nm 15.6 nm 7.4 nm 15.6 nm 7.4 nm
Subphase I
Ea [kJ/mol] 8.8 4.2 9.6 4.6 9.3 4.6
τ0 [s] 3.5·10−13 1.4·10−11 4·10−13 2.2·10−11 4.8·10−13 1.26·10−11
Subphase II
Ea (kJ/mol) 8.8 4.2 9.6 4.6 7.8 4.4
τ0 [s] 0.2·10−11 1·10−10 0.9·10−11 1·10−10 0.18·10−11 1·10−10
TBC in bulk [1]
Ea [kJ/mol] 15.5
τ0 [s] 1·10−14
Table II. Note that the contribution of the C3 motion to the temperature depen-dence of T1 at the discussed range is insignificant (τc(C3) À τc(C′3)).
The derived activation energies considered in the context of the change in-duced by confinement effects are lower than in bulk for all molecular groups buttaking into account preexponential factor values, the molecular motion of the tert--butyl groups is slower. The fact that the energies of the tert-butyl reorientationare much lower than in the bulk TBC and lower than for TBC confined to largerpore diameter [2], may result from a decrease of the intermolecular interactions inthe bulk liquid phase of confined TBC. The slowing down of the motion can bedue to the geometrical restrictions and is dependent on the degree of reduction ofthe pore width.
3.3. 1H NMR lineshapes and linewidth
Figure 4 depicts the 1H NMR lineshapes of bulk and confined TBC at differ-ent temperatures, while Fig. 5 shows the corresponding linewidths as a functionof reciprocal temperature.
The linewidths of TBC in the liquid phase in both sizes of CPG are nearlytemperature independent and compare to those for phase I of the bulk sample. Itcan be due to the restrictions of the translational motion and molecular tumblingresponsible for T2.
Below the freezing point, 204 K for 15.6 nm CPG and 192 K for 7.4 nm CPG,the line is composed of a narrower line superimposed on a broader one, suggestingtwo different molecular mobilities of the confined TBC. The broad component canbe attributed to molecules of the crystalline solid localized at the center of the

Molecular Dynamics of Tert-butyl Chloride . . . 365
Fig. 4. 1H line shapes of TBC confined (b) in 15.6 nm CPG and (c) in 7.4 nm CPG
at different temperatures in comparing to (a) bulk TBC.
Fig. 5. Temperature dependences of 1H linewidths for TBC confined in 15.6 nm (open
and solid squares for the two spectral components), in 7.4 nm CPG (open and solid
triangles for the two spectral components) and bulk TBC (open and solid circles for the
two spectral components).
pores and the narrow line to a more mobile fraction of molecules in the liquid-likesurface layer.
The linewidths of the narrow components of TBC confined in 15.6 and 7.4 nmCPG start to increase at 138 K and 151 K, respectively, reaching linewidths ofbroad component. The linewidths of the broad components are nearly constantup to 138 K and than grow continuously, reflecting the decreasing in the rate ofthe molecular reorientations C3 and C ′3. We have made similar observations inprevious investigations of TBC confined to other sizes CPG and other types ofpores [1, 2].

366 L. Szutkowska, B. Peplinska, S. Jurga
3.4. 2H NMR spectra
The temperature changes of the representative 2H spectra of TBC confinedto CPG of pore diameter 7.4 and 15.6 nm and those obtained in the bulk TBC,given for comparison, are shown in Fig. 6. One single narrow line is observed downto 206 K for 15.6 nm CPG and to 196 K for 7.4 nm CPG, reflecting the lowering ofthe freezing point of confined TBC by about 15 K and 27 K, respectively. Below thefreezing, a narrow liquid-like component stemming from more mobile molecules, isstill visible and is superimposed on the broad line with the quadrupolar splitting
Fig. 6. The representative 2H spectra of TBC confined to CPG of pore diameter (b)
15.6 nm and (c) 7.4 nm in comparison to (a) bulk TBC.
Molecular Dynamics of Tert-butyl Chloride . . . 367
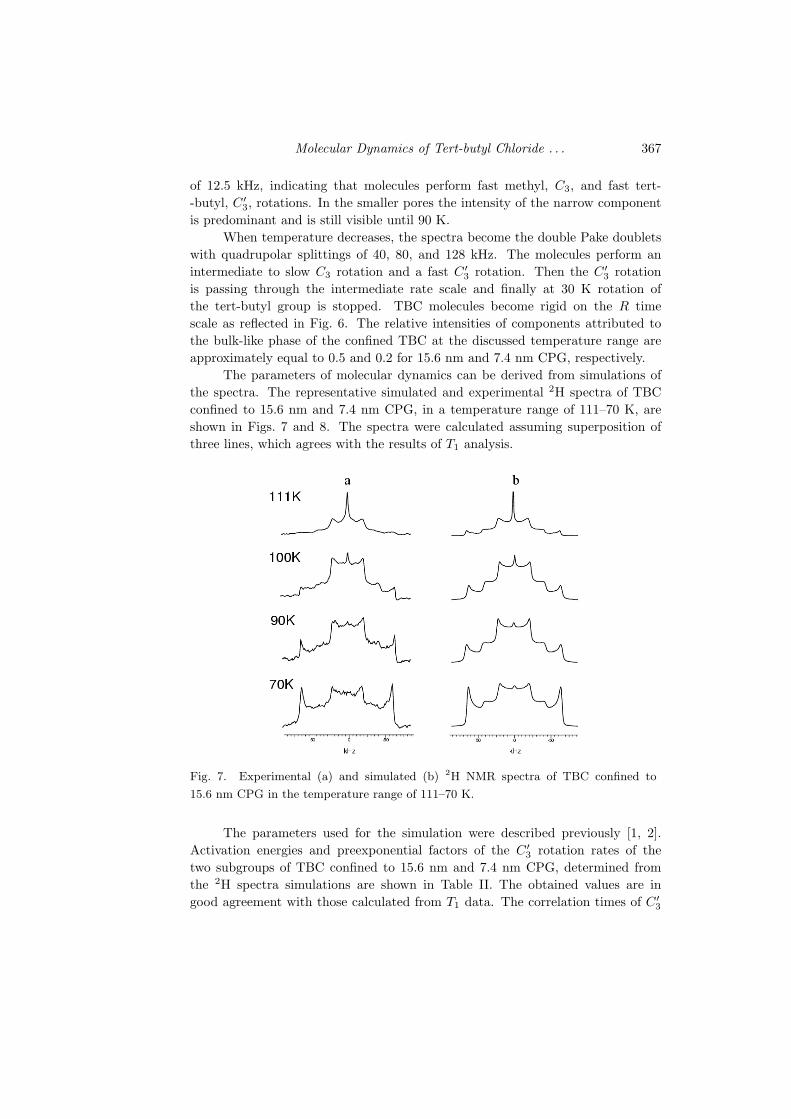
of 12.5 kHz, indicating that molecules perform fast methyl, C3, and fast tert--butyl, C ′3, rotations. In the smaller pores the intensity of the narrow componentis predominant and is still visible until 90 K.
When temperature decreases, the spectra become the double Pake doubletswith quadrupolar splittings of 40, 80, and 128 kHz. The molecules perform anintermediate to slow C3 rotation and a fast C ′3 rotation. Then the C ′3 rotationis passing through the intermediate rate scale and finally at 30 K rotation ofthe tert-butyl group is stopped. TBC molecules become rigid on the R timescale as reflected in Fig. 6. The relative intensities of components attributed tothe bulk-like phase of the confined TBC at the discussed temperature range areapproximately equal to 0.5 and 0.2 for 15.6 nm and 7.4 nm CPG, respectively.
The parameters of molecular dynamics can be derived from simulations ofthe spectra. The representative simulated and experimental 2H spectra of TBCconfined to 15.6 nm and 7.4 nm CPG, in a temperature range of 111–70 K, areshown in Figs. 7 and 8. The spectra were calculated assuming superposition ofthree lines, which agrees with the results of T1 analysis.
Fig. 7. Experimental (a) and simulated (b) 2H NMR spectra of TBC confined to
15.6 nm CPG in the temperature range of 111–70 K.
The parameters used for the simulation were described previously [1, 2].Activation energies and preexponential factors of the C ′3 rotation rates of thetwo subgroups of TBC confined to 15.6 nm and 7.4 nm CPG, determined fromthe 2H spectra simulations are shown in Table II. The obtained values are ingood agreement with those calculated from T1 data. The correlation times of C ′3
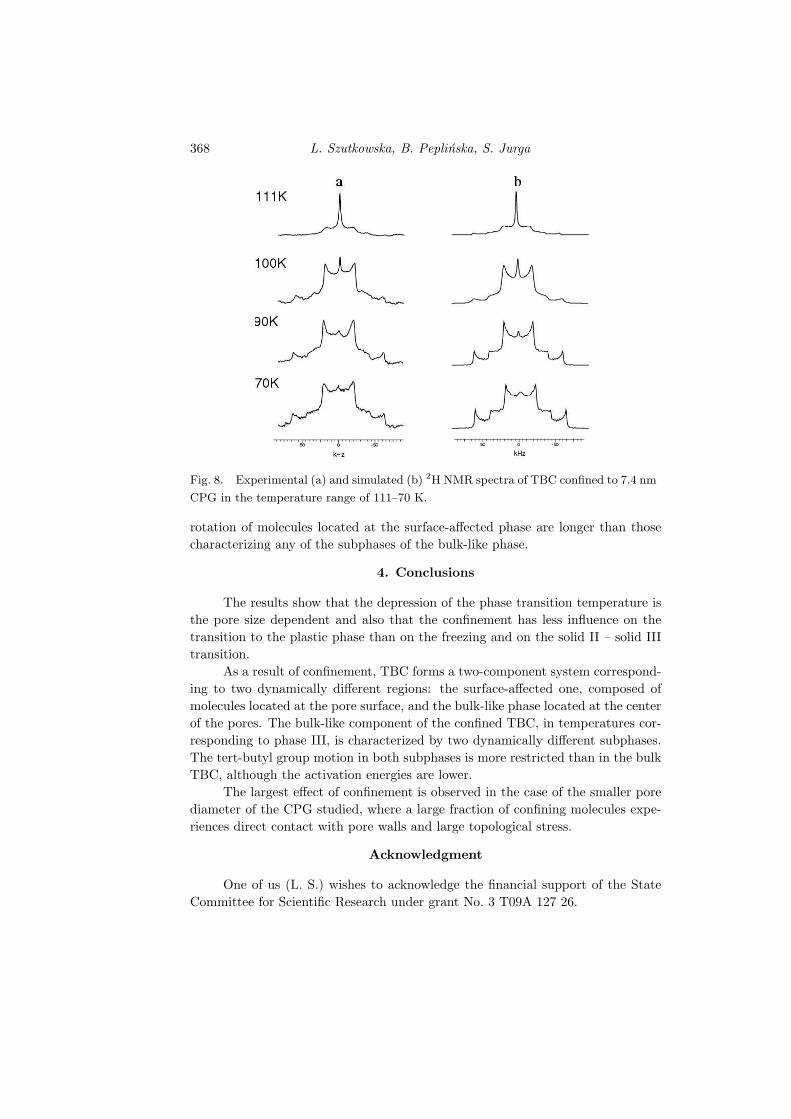
368 L. Szutkowska, B. Peplinska, S. Jurga
Fig. 8. Experimental (a) and simulated (b) 2H NMR spectra of TBC confined to 7.4 nm
CPG in the temperature range of 111–70 K.
rotation of molecules located at the surface-affected phase are longer than thosecharacterizing any of the subphases of the bulk-like phase.
4. Conclusions
The results show that the depression of the phase transition temperature isthe pore size dependent and also that the confinement has less influence on thetransition to the plastic phase than on the freezing and on the solid II – solid IIItransition.
As a result of confinement, TBC forms a two-component system correspond-ing to two dynamically different regions: the surface-affected one, composed ofmolecules located at the pore surface, and the bulk-like phase located at the centerof the pores. The bulk-like component of the confined TBC, in temperatures cor-responding to phase III, is characterized by two dynamically different subphases.The tert-butyl group motion in both subphases is more restricted than in the bulkTBC, although the activation energies are lower.
The largest effect of confinement is observed in the case of the smaller porediameter of the CPG studied, where a large fraction of confining molecules expe-riences direct contact with pore walls and large topological stress.
Acknowledgment
One of us (L. S.) wishes to acknowledge the financial support of the StateCommittee for Scientific Research under grant No. 3 T09A 127 26.

Molecular Dynamics of Tert-butyl Chloride . . . 369
References
[1] L. Wasyluk, B. Peplinska, J. Klinowski, S. Jurga, Phys. Chem. Chem. Phys. 4,
2392 (2002).
[2] L. Wasyluk, B. Peplinska, S. Jurga, Solid State Nucl. Magn. Reson. 25, 177
(2004).
[3] R. Kimmich, F. Klammler, V.D. Skirda, I.A. Serebrennikova, A.I. Maklakov,
N. Fatkullin, Appl. Magn. Reson. 4, 425 (1993).
[4] V.S. Sullivan, Y.J. Kim, S. Xu, J. Jonas, J.P. Korb, Langmuir 15, 4664 (1999).
[5] L. Gjerdaker, D.W. Aksnes, G.H. Sorland, M. Stocker, Micoporous Mesoporous
Mater. 42, 89 (2001).
[6] D.W. Aksnes, L. Gjerdaker, L. Kimtys, J. Mol. Struc. 522, 209 (2000).
[7] H.F. Booth, J.H. Strange, Mol. Phys. 93, 263 (1998).
[8] D.W. Aksnes, L. Gjerdaker, L. Kimtys, J. Mol. Struc. 509, 297 (1999).
[9] E. Gedat, A. Schreiber, J. Albrecht, T. Emmler, I. Shenderovich, G.H. Findenegg,
H.H. Limbach, G. Buntkowsky, J. Phys. Chem. B 106, 1977 (2002).
[10] J. Bodurka, G. Buntkowsky, A. Gutsze, H.H. Limbach, Z. Naturforsch. 51, 81
(1996).
[11] C.L. Jackson, G.B. Mckenna, J. Chem. Phys. 93, 9002 (1990).
[12] G. Dosseh, D. Morineau, C. Alba-Simionesco, J. Phys. IV 10, 99 (2000).
[13] K. Morishige, K. Kawano, J. Chem. Phys. 112, 11023 (2000).
[14] E.R. Andrew, K. Jurga, E. Szczesniak, Mol. Phys. 65, 1421 (1988).
[15] G.H. Penner, B.Y. Zhao, K.R. Jeffrey, Z. Naturforsch. A 50, 81 (1995).
[16] J.A. Ripmeester, C.I. Ratcliffe, J. Chem. Phys. 82, 1053 (1985).
[17] S. Urban, Z. Tomkowicz, J. Mayer, T. Waluga, Acta Phys. Pol. A 48, 61 (1975).
[18] J.H. Davis, K.R. Jeffrey, M. Bloom, M.I. Valic, T.P. Higgs, Chem. Phys. Lett.
42, 390 (1976).
[19] R. Kimmich, NMR: Tomography, Diffusometry, Relaxometry, Springer, Berlin
1997.
[20] M.S. Greenfield, A.D. Ronemus, R.L. Vold, R.R. Vold, P.D. Ellis, T.E. Raidy, J.
Magn. Reson. 72, 89 (1987).
[21] G. Dosseh, Y.D. Xia, C. Alba-Simionesco, J. Phys. Chem. B 107, 6445 (2003).
[22] A. Ksiazczak, I. Nagata, Thermochim. Acta 254, 31 (1995).
[23] R. Mu, V.M. Malhotra, Phys. Rev. B 44, 4296 (1991).
[24] D. Morineau, G. Dosseh, C. Alba-Simionesco, P. Llewellyn, Philos. Mag. B 79,
1847 (1999).
[25] P.E. Sokol, W.J. Ma, K.W. Herwig, W.M. Snow, Y. Wang, J. Koplik, J.R. Ba-
navar, Appl. Phys. Lett. 61, 777 (1992).
[26] P. Espeau, J.W. White, J. Chem. Soc. Faraday Trans. 93, 3197 (1997).
[27] D.D. Awschalom, J. Warnock, Phys. Rev. B 35, 6779 (1987).
[28] R. Mu, Y. Xue, D.O. Henderson, D.O. Frazier, Phys. Rev. B 53, 6041 (1996).

370 L. Szutkowska, B. Peplinska, S. Jurga
[29] R. Mu, F. Jin, S.H. Morgan, D.O. Henderson, E. Silberman, J. Chem. Phys. 100,
7749 (1994).
[30] M.B. Dunn, C.A. Mcdowell, Mol. Phys. 24, 969 (1972).
[31] D.W. Aksnes, K. Ramstad, Magn. Reson. Chem. 27, 830 (1989).
[32] P.A. Beckmann, Phys. Rep. 171, 85 (1988).