molecular dynamics simulation of melittin in a
TRANSCRIPT

Molecular Dynamics Simulation of Melittin ina Dimyristoylphosphatidylcholine (DMPC)
Bilayer Membrane
XIE ZHIYAO (Andy)
Contact: [email protected]
JIANG HUANBO (Bobby)
Contact: [email protected]
2015-08-07

CONTENTS CONTENTS
Contents
1 Preparation 3
2 Background 3
3 Introduction to our system 4
4 Cooperator’s experimental results 4
5 Method 55.1 Building system . . . . . . . . . . . . . . . . . . . . . . . . . . 55.2 Preparing for gromacs . . . . . . . . . . . . . . . . . . . . . . 65.3 Runing simulation . . . . . . . . . . . . . . . . . . . . . . . . 6
5.3.1 Minimization . . . . . . . . . . . . . . . . . . . . . . . 65.3.2 Equilibration . . . . . . . . . . . . . . . . . . . . . . . 65.3.3 Set different temperature . . . . . . . . . . . . . . . . . 75.3.4 Production . . . . . . . . . . . . . . . . . . . . . . . . 7
5.4 Analysis . . . . . . . . . . . . . . . . . . . . . . . . . . . . . . 75.4.1 Area per lipid . . . . . . . . . . . . . . . . . . . . . . . 75.4.2 Density . . . . . . . . . . . . . . . . . . . . . . . . . . 75.4.3 Order parameter . . . . . . . . . . . . . . . . . . . . . 75.4.4 g angle . . . . . . . . . . . . . . . . . . . . . . . . . . . 8
6 Result 86.1 Area Per Lipid . . . . . . . . . . . . . . . . . . . . . . . . . . 86.2 Order Parameter . . . . . . . . . . . . . . . . . . . . . . . . . 96.3 Gauche Conformation Fraction . . . . . . . . . . . . . . . . . 106.4 RMSF . . . . . . . . . . . . . . . . . . . . . . . . . . . . . . . 12
7 Future Development 12
8 Appendix 148.1 Structure of melittin . . . . . . . . . . . . . . . . . . . . . . . 148.2 Structure of DMPC . . . . . . . . . . . . . . . . . . . . . . . . 148.3 Figure of DMPC bilayer membrane . . . . . . . . . . . . . . . 148.4 File location . . . . . . . . . . . . . . . . . . . . . . . . . . . . 15
9 Acknowledgement 15
1

CONTENTS CONTENTS
Abstract
Molecular dynamics(MD) trajectories of melittin inserted into DMPCbilayer membrane are generated using MD simulation for a better un-derstanding of protein-membrane interactions, especially interactionsinvolved in the anchoring and stabilization of membrane-bound pro-teins. Four different systems were constructed. Temperature scanwas adopted for DMPC only system and DMPC+Melittin system forphase transition comparison and the effects melittin and Cholesterolhavce on the dynamics of DMPC at both liquid and gel phases wereobserved by measuring some properties of our systems, area per lipid,order parameter, gauche fraction and RMSF value, for instance. Somerelative experimental results were also provided here to verify our sim-ulation trajectories.
2

2 BACKGROUND
1 Preparation
workshops Attend some required workshop related to our research work,for instance: Introduction to Linux command, vi usage, make file usage,High performance Computing(HPC) introduction, mpi and OpenMp parallelcomputing, graphics processing unit (gpu) computing (CUDA language).
Cooperation and discussion Discuss with our supervisor in Oak RidgeLaboratory, Dr. Xiaolin Cheng and our cooperators, who have much expe-rience with neutron scattering experiment to decide the simulation systemswe are going to build. Some experimental results about DMPC and Melittintheyve already obtained are also covered in our discussion. Their experi-ments are conducted under two temperatures: 7 C (280K) for Gel phase and37 C (310K) for liquid phase.
2 Background
Melitin (structure is displayed in Appendix) is the major protein componentof the bee venom that has a pronounced effect on the lysis of membranes [1].The amino-terminal region (residues 1 to 20) is predominantly hydrophobicwhereas the carboxy-terminal region (residues 21 to 26) is hydrophilic due tothe presence of a stretch of positively charged amino acids. This amphiphilicproperty of melittin makes it water soluble and yet it spontaneously asso-ciates with natural and artificial membranes. [2]
The majority of phospholipids belong to the phosphatidylcholine (PC) andphosphatidylethanolamine (PE) families.(ref 1) Although phospholipid bi-layers containing PC headgroups express fewer functionalities, it is centralin maintaining membrane integrity. (ref 8)
The structure and iteractions of membrane-bound form is still difficult tobe characterized by some advanced techniques like x-ray crystallography [3],electron microscopy [4], and nuclear magnetic resonance [5] due to the com-plexity of membrane environment. Thus the detailed computer simulationcan be valuable for a better understanding of interactions like anchoring andstabilization of membrane-bound proteins. Simulations can be used to pro-vide additional information on an atomic level, in a resolution that cannot beobtained experimentally. However, simulations may suffer from uncertain-ties in the forcefield and relatively short simulation times. Since simulationsresult from a modeling of the actual interactions and forces in a bilayer, they
3

4 COOPERATOR’S EXPERIMENTAL RESULTS
should be validated by comparing to experimental data.
In fact different mechanisms about lytic activity of melittin has been pro-posed based on observations. Some suggested that membrane melittin in-creases membrane permeability by partial penetration of the bilayer.[6] Somemodels involved the formation of a canal structure by the aggregation offour transbilayer melittin molecules.[7][8] Others proposed that aggregatedmelittin could lead to cell lysis by leaving large holes.[9] What’s more, othermembrane protein may also be involved in membrane lytic process.[10]
The detailed understanding of interaction of melittin with lipid bilayer mem-brane is of significance since the amphiphilic a-helical conformation resemblesthose of signal peptides[11], and the envelope glycoprotein gp41 from the hu-man immunodeficiency virus (HIV) [12]. What’s more, melittin mimics theN-terminal of HIV-1 virulence factor Nef1-25.[13]
3 Introduction to our system
Four systems We have four systems, the following CHLs means choles-terol.
1 Pure DMPC, DMPC concentration 5 (w/w) %, Melittin to DMPC ratio:1:500 (Temperature scan, from 275K to 315K, A total of 9 sets of tempera-tures with a 5 K difference)
2 DMPC + CHL, CHL to DMPC ratio: 1:4, Melittin to DMPC ratio: 1:500(Temperature scan, from 275K to 315K, A total of 9 sets of temperatureswith a 5 K difference)
3 DMPC + Melittin, DMPC concentration 5 (w/w) %, Melittin to DMPCratio: 1:500 (7 centigrade and 27 centigrade)
4 DMPC + CHL + Melittin, CHL to DMPC ratio: 1:4, Melittin to DMPCratio: 1:500 (7 centigrade and 27 centigrade)
4 Cooperator’s experimental results
1. At 7 C and 37 C, DMPC dynamics are very different from each other.
4
5 METHOD
2. Adding Melittin to DMPC, the dynamics are affected at both 7 C and 37C.
3. At 7 C and 37 C, DMPC+CHL dynamics are different from each other.
4. Adding Melittin to DMPC+CHL, the dynamics at liquid phase (37 C) isnot affected.
5. Temperature scan for DMPC, there is phase transition. Adding Melittinto DMPC, there is no phase transition for temperature scan.
5 Method
5.1 Building system
Generate membrane Build the DMPC membrane on website http://
www.charmm-gui.org/. Select Membrane only system, set the water thick-ness to be 27 and select the DMPC lipid. Set DMPC number to be 250 (orDMPC to be 200 and cholesterol to be 50) for both upper leaflet and lowerleaflet. Ions are not included in this step. We only generate water box here.Record the box size information displayed here for later usage.
Obtain polypeptide Download pdb file of Melittin from protein bankwebsite http://www.rcsb.org/pdb/home/home.do. Dow2nload the proteinwith acess code 2MLT. There are two chains inside it and we will only takeone chain of melittin (one melittin monomer).
Generate protein-membrane system Open the .pdb file of ’Melittin’and ’DMPC’ using software Visual Molecular Dynamics (VMD). Move theMelittin into proper position (inside the water layer of membrane withoutcontacting with lipid) of DMPC membrane by using VMD. Prepare all pdbfiles. System get built here.
Discussion about proper protein position Based on some previouswork about simulation on melittin and DMPC, our supervisor, Dr Chengsuggested that it may take a long simulation time for the melittin to automat-ically get inserted into membrane by just putting melittin on lipid-solutionregion. After reading more iterature we find a possible better and more ad-vanced way to construct the microscopic model. In this approach melittinis supposed to be deeply inserted into the upper layer of bilayer membrane
5

5.2 Preparing for gromacs 5 METHOD
and corresponding lipid molecules should be deleted to aviod heavy atomsoverlap. The helix should still be oriented parallel to membrane-water inter-face, leaving the hytrophilic residues contacting with water and hytrophobicresidues in contact with lipid acyl chains.
5.2 Preparing for gromacs
Gromacs version We choose to use gromacs 5.0.1 installed on clusterdarter and nanoheat. We used single precision to run the simulation.
Preparing .gro file for simulation Download force field charmm 36 tocurrent directory and choose to use it in next step. Use ’pdb2gmx’ (maytake a long time) in gromacs to get .gro format for system. Then modifythe name of atoms, box size recorded in gro file. For systems with melittin,considering the melittin is of +5 charge, we change five water molecules tobe chlorine atoms to neutralize this system.
Preparing .top file for simulation Then we generate .itp files separatelyfor DMPC and cholesterol and melittin and create top file ourselves to in-clude them. And we will modify the atom number recorded in it to make itcorrsponds to our system.
Preparing .ndx file for simulation Use make ndx command to selectand rename coupling atom groups. Name of groups need to be correspondingto what recorded inside the .mdp file we are going to use for minimization,equilibration and production.
5.3 Runing simulation
5.3.1 Minimization
Run minimization without any coupling.
5.3.2 Equilibration
Run several steps of equilibrations at certain temperature (290K, for in-stance). Since the initial structure of our system is not well equilibrated,first of all we need to set the time step to be quite small and graduallyincrease it so that gromacs won’t give error report.
6

5.4 Analysis 5 METHOD
5.3.3 Set different temperature
After system gets well equilibrated, difference in temperature happens beforethe production run. Generate velocities at different desired temperatures andrun simulation for around 1 or 2 ns. Starting from this step all simulationsare done in clusters using at least 64 cores for better performance.
5.3.4 Production
Run the final simulation for 5 nanoseconds and start analysis. Using VMDto check the structure of systems in Gel phase. After some analysis based onthe simulation trajectory we got, the system under relatively low temperature(Gel phase) takes longer time to get stable. Thus we run simulation for 50nsaltogether (we run double precision gromacs on cluster ’darter’ with 192 coresand wall time 24 hours, it can generate around 35 ns trajectories per day).
5.4 Analysis
5.4.1 Area per lipid
Use ’g energy’ command in gromacs and select to record x and y in .xvg file.Then plot area per lipid (x length * y length /lipid number) versus time figure.
This result will generally increase with temperature increasing. And theincreasing rate can be larger for systems in liquid phase. The result mayindicate whether our system has reached equilibrated or not.
5.4.2 Density
Use ’g density’ command in gromacs to record density value in .xvg file.Then plot density versus z coordinate figure.
The result reveals the change in density along the normal direction. Bysuch analysis the location and thickness of different layers of component canbe determined.
5.4.3 Order parameter
Generate .ndx file to select carbon atoms in two tails of DMPC lipid (C22to C214 for tail 2 and C32 t0 C314 for tail 3). Use ’g order’ command ingromacs to record the order parameter of two tails for the last nanosecond.The orientational order parameter is defined as:
7

6 RESULT
S =1
2(3 < cos2β > −1)
where β is the instantaneous angle between the director of the C-D bondand the bilayer normal. The angular brackets denote a time and ensembleaverage.
The order parameter, which is often used to validate or calibrate molec-ular dynamics simulations, can measure the rigidity and orderliness of tailsin DMPC lipid.
5.4.4 g angle
In stereochemistry, The term gauche refers to conformational isomers(conformers)where two vicinal groups are separated by a 60 torsion angle. We calculatedthe proportion of gauche in all dihedrals in two lipid acyl chains.
6 Result
6.1 Area Per Lipid
Just as the name implies, Area Per Lipid is the average area each lipidpossesses in the leaflet of DMPC bilayer. The equation below is how wecalculated it.
Area per lipid =Area of the laeflet
Lipid number per leaflet=X ∗ Y
250
In figure 1, for systems with temperatures from 275K to 305K, the area perlipid drops down significantly, which means the systems are still not wellequilibrated. While for 310K and 315K, the curves are kind of stable, whichmeans the systems might have already equilibrated.
Besides, from 275K to 285K and from 295K to 315K, the area per lipidwill increase as temperature increases, while from 285K to 295K, on thecontrary, the area per lipid will decrease as temperatures increases. It iseasy to understand that area per lipid will increase with temperature. Astemperature goes up, the molecules will move faster and possess more space,therefore the area per lipid will increase. According to a related paper, thetransition temperature of DMPC is about 296K, which is in consistent withthis anomalism.
8

6.2 Order Parameter 6 RESULT
Figure 1: Area per lipid
6.2 Order Parameter
Lipid order parameter is a measure of the orientational alignment of the CD(carbon-deuterium) bond and is defined previously. By observing the orderparameter of the two tails of DMPC, we can have a general idea of how theDMPCs are aligned in the DMPC bilayer.
Figure 2: Structure of DMPC
The four charts in 3 separately plot out the order parameters of the firsttail of DMPC in different time intervals. In 0 1 ns, the curves are very closeto each other, while in 24 25 ns, it is obvious that the curves are divided into
9

6.3 Gauche Conformation Fraction 6 RESULT
Figure 3: Order parameter in tail1
two groups. The upper group has lower temperatures, namely, from 275Kto 295K. While the lower group has a higher temperature, or from 300K to315K. The reason why these curves are divided into two groups is becauseof phase transition too. Meanwhile, the gap is in well consistent with theexperiment result that the melting point of DMPC is 296K.
6.3 Gauche Conformation Fraction
In stereochemistry, The term gauche refers to conformational isomers(conformers)where two vicinal groups are separated by a 60 torsion angle.
Figure 4 below shows the trans(left) and gauche(right) rotamers of butane.The two methyl groups can be in an anti-bonding relationship, or offset atsixty degree dihedral angles.
There are both 14 carbon atoms in the two tails of DMPC, and everyfour adjacent carbon atoms can form a dihedral. Because trans and gaucheconformations are two stable structure, the dihedral angles will be close to
10

6.3 Gauche Conformation Fraction 6 RESULT
Figure 4: rotamers of butane
either 60 degree or 180 degree. Therefore, we divided all the dihedrals intotwo groups. One is from -120 degree to 120 degree, which is named gauche.The other group trans is from 120 to 180 degree or -120 to -180 degree. Thenwe calculated the fraction of gauche over all the dihedrals in one tail of allthe 500 DMPC in the DMPC only system.
Figure 5: gauche fraction
In 5, for both tails, generally the gauche fraction will increase as tempera-ture increases. This is what we should expect because trans conformation hasa little higher energy then gauche conformation. Besides, in higher tempera-tures, the gauche fraction curves already converge, which means the systemsare already well equilibrated. However, in lower temperatures, the gaucheconformation fractions are still dropping down, which might imply us to ex-tend our simulations to a longer time. Again, the difference happens aroundthe transition temperature 296K.
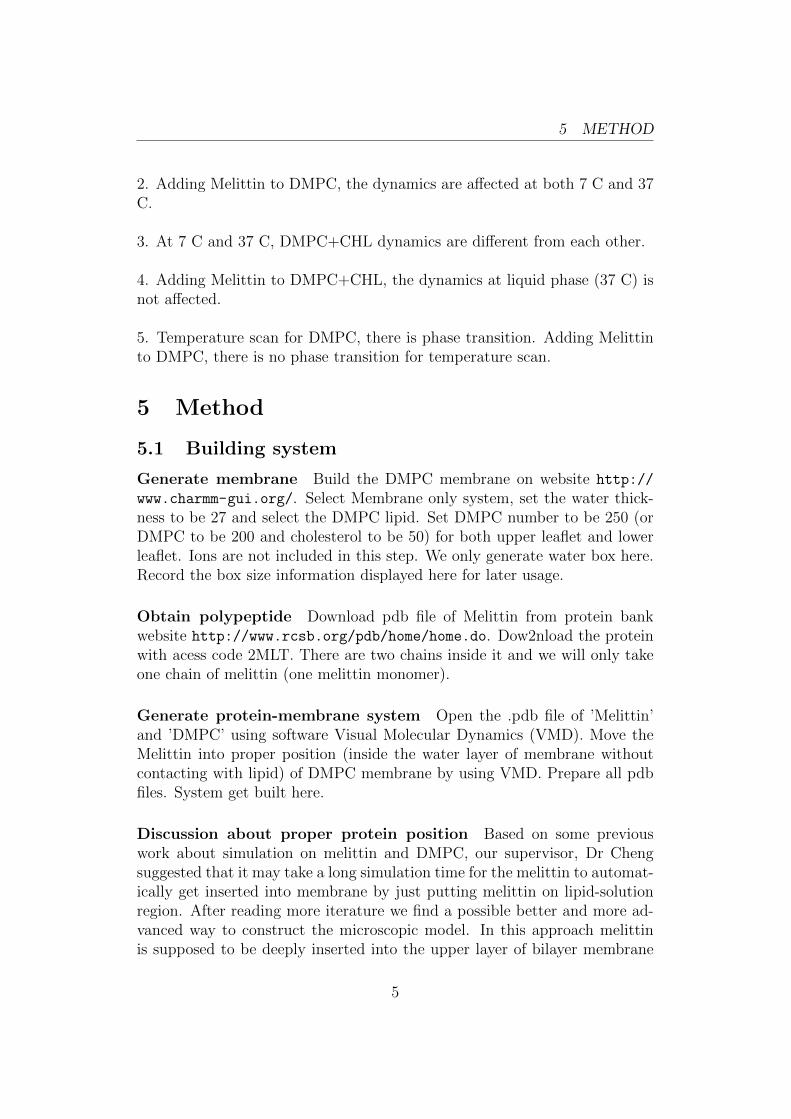
In 6, there are two plots which aim to compare the gauche fraction be-tween the systems with different starting structures. However, the resultsseem to conflict with each other. So due to the lack of sufficient data, noconclusion might be drawn from these two figures. We can only say that inthe time interval 59 60ns, it seems that the first tail of DMPCs in the DMPConly system has a higher level of gauche fraction, which means the DMPC+ melittin system is more ordered in this specific situation.
11
6.4 RMSF 7 FUTURE DEVELOPMENT
Figure 6: gauche fraction comparison
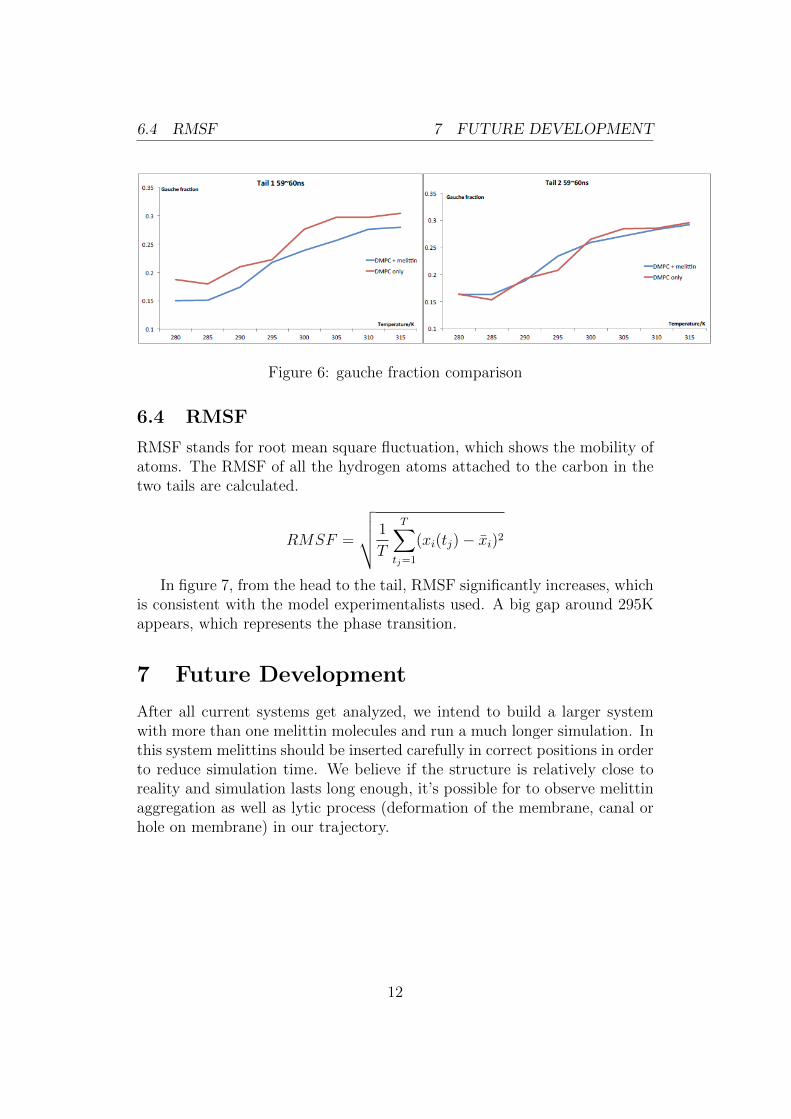
6.4 RMSF
RMSF stands for root mean square fluctuation, which shows the mobility ofatoms. The RMSF of all the hydrogen atoms attached to the carbon in thetwo tails are calculated.
RMSF =
√√√√ 1
T
T∑tj=1
(xi(tj) − x̄i)2
In figure 7, from the head to the tail, RMSF significantly increases, whichis consistent with the model experimentalists used. A big gap around 295Kappears, which represents the phase transition.
7 Future Development
After all current systems get analyzed, we intend to build a larger systemwith more than one melittin molecules and run a much longer simulation. Inthis system melittins should be inserted carefully in correct positions in orderto reduce simulation time. We believe if the structure is relatively close toreality and simulation lasts long enough, it’s possible for to observe melittinaggregation as well as lytic process (deformation of the membrane, canal orhole on membrane) in our trajectory.
12

7 FUTURE DEVELOPMENT
Figure 7: RMSF
13

8 APPENDIX
Figure 8: Melittin structure
8 Appendix
8.1 Structure of melittin
Figure 8 demonstrates the structure of melittin, residues 1-20 (painted to or-ange) make up the amino-terminal region, which is predominantly hydropho-bic and was deeply inserted into lipid membrane whereas carboxy-terminalregion (residues 2126 painted to blue) is hydrophilic and in contact with bulk
8.2 Structure of DMPC
Figure 9: DMPC structure
Figure 9 demonstrates the structure of DMPC generated by software’VMD’, we can observe its two lipid acyl tails and lipid head structure.
8.3 Figure of DMPC bilayer membrane
Figure 10 demonstrates the overall structure of our most complicated systemwith cholesterol in green and melittin in red color. The melittin is generally
14

8.4 File location 9 ACKNOWLEDGEMENT
Figure 10: overall structure
parallel to membrane-solution interface.
8.4 File location
Our initial systems and force feild files are in cluster ’nanoheat’. Later priduc-tion simulation results are in cluster ’darter’(/luster/medusa/zhiyao).
9 Acknowledgement
Support from City University of Hong Kong, Oak Ridge National Laboratory,Joint Institute for Computational Sciences and University of Tennessee aregratefully acknowledged. Our mentors Dr Kwai Wong and Dr Xiaolin Cheng,as well as other students in this CSURE program, are of great help. We alsosincerely thank Dr Jun Fan in City University of Hong Kong for her valuableinstructions to our project.
15

REFERENCES REFERENCES
References
[1] E. Habermann, Bee and wasp venoms., vol. 177. 1972.
[2] Dempsey and C. E., The actions of melittin on membranes., vol. 1031.1990.
[3] Deisenhofer, J., and H. Michel, The photosynthetic reaction center fromthe purple bacterium rhodopseudomonas viridis., vol. 245. 1989.
[4] Henderson, J. M. Baldwin, T. A. Ceka, F. Zemlin, E. Beckmann, andK. H. Downing, Model for the structure of bacteriorhodopsin based onhigh-resolution electron cryo-microscopy., vol. 213. 1990.
[5] Cross, T. A., and S. J. Opella., Protein structure by solid-state nuclearmagnetic resonance: residues 40 to 45 of bacteriophage fd coat protein.,vol. 182. 1985.
[6] Ash, P. S., A. S. Bunce, C. R. Dawson, and R. C. Hider, Study of vesicleleakage induced by melittin, vol. 510. 1978.
[7] Smith, R., F. Separovic, T. J. Milne, A. Whittaker, F. M. Bennett,B. A.Cornell, and A. Makriyannis, Structure and orientation of the pore-forming peptide, melittin, in lipid bilayer, vol. 241. 1994.
[8] Tosteson, M. T., and D. C. Tosteson, Melittin forms channels in lipidbilayers, vol. 36. 1981.
[9] Dufourc, E. J., I. C. P. Smith, and J. Dufourcq, Molecular details ofmelittin-induced lysis of phospholipid membranes as revealed by deu-terium and phosphorus NMR, vol. 25. 1986.
[10] Werkmeister, J. A., A. Kirkpatrick, J. A. McKenzie, and D. E. Rivett,The effect of sequence variations and structure on the cytolytic activityof melittin peptides, vol. 1157. 1993.
[11] Golding, C., and P. OShea, The interactions of signal sequences withmembranes, vol. 23. 1995.
[12] Rabenstein, M., and Y. K. Shin, A peptide from the heptad repeat ofhuman immunodeficiency virus gp41 shows both membrane binding andcoiled-coil formation, vol. 34. 1995.
[13] Barnham, K. J., S. A. Monks, M. G. Hinds, A. A. Azad, and R. S.Norton, Solution structure of polypeptide from the N terminus of theHIV protein Nef, vol. 36. 1997.
16