molecular mechanisms of dna regulatory segment recognition
TRANSCRIPT
HAL Id: tel-01135210https://tel.archives-ouvertes.fr/tel-01135210
Submitted on 25 Mar 2015
HAL is a multi-disciplinary open accessarchive for the deposit and dissemination of sci-entific research documents, whether they are pub-lished or not. The documents may come fromteaching and research institutions in France orabroad, or from public or private research centers.
L’archive ouverte pluridisciplinaire HAL, estdestinée au dépôt et à la diffusion de documentsscientifiques de niveau recherche, publiés ou non,émanant des établissements d’enseignement et derecherche français ou étrangers, des laboratoirespublics ou privés.
Molecular mechanisms of DNA regulatory segmentrecognition by mads box family transcription factors
Barbora Profantova
To cite this version:Barbora Profantova. Molecular mechanisms of DNA regulatory segment recognition by mads boxfamily transcription factors. Chemical Physics [physics.chem-ph]. Université Pierre et Marie Curie -Paris VI; Univerzita Karlova (Prague), 2014. English. �NNT : 2014PA066436�. �tel-01135210�

UNIVERSITÉ PIERRE ET MARIE CURIE École Doctorale Chimie Physique et Chimie Analytique de Paris Centre (ED 388)
France
CHARLES UNIVERSITY IN PRAGUE Faculty of Mathematics and Physics
Czech Republic Study programme: Physics
Specialisation: Biophysics, chemical and macromolecular physics
Molecular mechanisms of DNA regulatory segment recognition by MADS box family
transcription factors
DOCTORAL THESIS OF
Barbora Profantová - Řezáčová
Supervised by Josef Štěpánek and Pierre-Yves Turpin
Presented and publicly defended on September 23, 2014
Members of the jury:
Prof. Vladimír Baumruk Fac.Math.Phys. Charles University in Prague, Czech Rep. Examiner Assoc.prof. Otakar Jelínek 1st Fac.Med.,Charles University in Prague, Czech Republic Referee Prof. Michel Manfait Université de Reims Champagne-Ardenne, France Referee Prof. Josef Štěpánek Fac.Math.Phys. Charles University in Prague, Czech Rep. Supervisor Prof. Germain Trugnan ERL INSERM, France Examiner Prof. Pierre-Yves Turpin Université Pierre et Marie Curie, France Supervisor

I declare that I carried out this doctoral thesis independently, and only with the cited sources, literature and other professional sources. I understand that my work relates to the rights and obligations under the Act No. 121/2000 Coll., the Copyright Act, as amended, in particular the fact that the Charles University in Prague has the right to conclude a license agreement on the use of this work as a school work pursuant to Section 60 paragraph 1 of the Copyright Act.
In…...... date............ signature

Acknowledgements
I hereby wish to express my deepest gratitude to both of my supervisors,
Prof. Josef Štěpánek and Prof. Pierre-Yves Turpin, for their guidance, ever-present
optimism and encouragement during the research and writing of this thesis. It has
been my honor to work with them.
Special thanks to all the staff members and students of the Laboratoire Jean
Perrin and ANbioPhy in France for creating a helpful and friendly atmosphere,
especially to Jaroslava Joniová, Veronika Huntošová and Imène Chebbi.
Furthermore, I would like to express my sincere gratitude to Christian Zentz for his
patience during our discussions on various scientific topics and fluorescence
measurements. I owe my thanks to Sergei Kruglik for his kind help with Raman
measurements.
For their friendship, support and excellent working conditions I also thank to
all members of the Division of Biomolecular Physics at Institute of Physics of
Charles University in Prague, especially to Pavla Pečínková, Vlastimil Zíma and
Kateřina Hofbauerová. Many thanks belong to Vladimír Kopecký Jr. for his
cooperation and guidance in FTIR and Raman measurements and their analysis.
I would like to thank to Jiří Bok from the Theoretical Division for development of
the software for pre-processing of Raman spectra.
My great thanks belong to Lucie Bednárová from Institute of Organic
Chemistry and Biochemistry of the Academy of Sciences of the Czech Republic in
Prague for performing some CD experiments for us. I would also like to thank to
Yves-Marie Coic from Institut Pasteur in France for synthesis of several model
oligopeptides.
Last but not least, my personal thanks belong to my family whose support
and patience have been invaluable. The greatest thanks belong to my husband Václav
not only for helpful discussions of my research, but also for being there for me all the
time. Special thanks belong to my little daughter Lada for making my life more
beautiful and wonderful.
I gratefully acknowledge support of the French government scholarship
"thése en cotutelle" of the Ministry of Education of France, the Czech Science
Foundation (No. 202/09/0193) and the Grant Agency of Charles University
(No. 402111).

- 1 -
Title: Molecular mechanisms of DNA regulatory segment recognition by MADS box family transcription factors Author: Barbora Profantová –Řezáčová Department / Institute: Institute of Physics of Charles University, Faculty of Mathematics and Physics, Charles University in Prague École Doctorale Chimie Physique et Chimie Analytique de Paris Centre (ED 388) Supervisors of the doctoral thesis: Prof. RNDr. Josef Štěpánek, CSc., Faculty of Mathematics and Physics, Charles University in Prague Prof. Pierre Yves Turpin., Laboratoire Jean Perrin, Université Pierre et Marie Curie Assistant supervisor: RNDr. Vladimír Kopecký Jr., PhD., Faculty of Mathematics and Physics, Charles University in Prague Abstract: The thesis deals with physico-chemical properties of the MADS box, binding domain of transcription factors, which are important for the formation of complexes with the DNA regulatory segment bearing the CArG box. The study was performed also on model oligopeptides, selected segments of the MADS box and their analogues with a point mutation. A wide range of spectroscopic techniques was employed, namely absorption, circular dichroism, fluorescence and Raman spectroscopies. Advanced approaches including multivariate methods were used for data processing. The three tyrosines of the MADS box located in amino-acid vicinities of different charge and hydrophobicity, were used as intrinsic spectroscopic probes. The obtained characteristics of the MADS box and its segments structural arrangement, flexibility and acid-base equilibria are the main results of the work. Keywords: MADS box, optical spectroscopy, factor analysis, protein-DNA interaction, tyrosine

- 2 -
Název práce: Molekulární mechanismy rozpoznání regulačního úseku DNA transkripčními faktory z rodiny MADS box
Autor: Barbora Profantová –Řezáčová Katedra / Ústav: Fyzikální ústav UK, Matematicko fyzikální fakulta, Univerzita Karlova v Praze École Doctorale Chimie Physique et Chimie Analytique de Paris Centre (ED 388) Vedoucí doktorské práce: Prof. RNDr. Josef Štěpánek, CSc., Matematicko fyzikální fakulta, Univerzita Karlova v Praze Prof. Pierre Yves Turpin., Laboratoire Jean Perrin, Université Pierre et Marie Curie Konzultant: RNDr. Vladimír Kopecký Jr., PhD., Matematicko fyzikální fakulta, Univerzita Karlova v Praze Abstrakt: Disertační práce se zabývá fyzikálně-chemickými vlastnostmi vazebné domény MADS box transkripčních faktorů, významnými pro tvorbu komplexů s regulačním segmentem DNA obsahujícím CArG box. Studium probíhalo i na modelových oligopeptidech, vybraných kratších segmentech MADS boxu a jejich analozích s bodovou mutací. Byla využitá široká škála spektroskopických technik, jmenovitě absorpční, fluorescenční a Ramanova spektroskopie a spektroskopie cirkulárního dichroismu. Ke zpracování dat byly použity pokročilé postupy včetně multivariačních metod. Tři tyrosiny MADS boxu, nacházející se v okolí aminokyselin s různým nábojem a hydrofobicitou, byly využity jako vnitřní spektroskopické sondy. Výsledkem práce jsou charakteristiky strukturního uspořádání, flexibility a acidobasických rovnováh MADS boxu a jeho vybraných segmentů. Klíčová slova: MADS box, optická spektroskopie, faktorová analýza, interakce protein-DNA, tyrosin
- 3 -
Titre de la thèse: Mécanismes moléculaires de reconnaissance de segments de régulation de l’ADN par des facteurs de transcription de la famille des “boîtes MADS”
Auteur: Barbora Profantová –Řezáčová
Department / Institute: Institute of Physics of Charles University, Faculty of Mathematics and Physics, Charles University in Prague École Doctorale Chimie Physique et Chimie Analytique de Paris Centre (ED 388) Directeurs de thèse: Prof. RNDr. Josef Štěpánek, CSc., Faculty of Mathematics and Physics, Charles University in Prague Prof. Pierre Yves Turpin., Laboratoire Jean Perrin, Université Pierre et Marie Curie Professeur consultant: RNDr. Vladimír Kopecký Jr., PhD., Faculty of Mathematics and Physics, Charles University in Prague Résumé: Cette thèse concerne les propriétés physico-chimiques des « Boîtes MADS », séquences de liaison de facteurs de transcription déterminantes pour la formation de complexes avec des segments de régulation de l’ADN comportant des séquences spécifiques nommées « Boîtes CArG ». Des études ont aussi été menées sur certains segments bien choisis des Boîtes MADS et quelques-uns de leurs analogues mutés. Un large choix d’approches spectroscopiques a été employé pour ces études : absorption électronique, dichroïsme circulaire, fluorescence et diffusion Raman. Des approches performantes d’analyse multivariée ont été utilisées pour le traitement des résultats expérimentaux. Les trois tyrosines de la Boîte MADS, situées dans des environnements de charge et d’hydrophobicité différents, ont été utilisées comme marqueurs spectroscopiques intrinsèques. Les principaux résultats de ce travail concernent les caractéristiques de structures, flexibilités et équilibres acido-basiques de la Boîte MADS et de ses différents segments. Mots clés: MADS box, spectroscopie optique, analyse factorielle, interactions protéine-ADN, tyrosine
- 4 -
Contents
1. THEORY ............................................................................................................ 7
1.1. Transcription of a gene .......................................................................................................... 7
1.1.1. Regulation of the transcription initiation .................................................................... 8
1.1.2. Regulation segments of DNA ..................................................................................... 9
1.1.3. Transcription factors ................................................................................................. 11
1.2. MADS box family of transcription factors ........................................................................ 13
1.2.1. The MADS box ......................................................................................................... 14
1.2.2. Biological role of MADS box proteins ..................................................................... 15
1.2.3. SRF and its DNA regulatory segment recognition ................................................... 17
1.2.4. Primary structure of the MADS box of SRF............................................................. 19
1.3. Tyrosine as an inner probe of the MADS box ................................................................... 21
1.3.1. Absorption properties of tyrosine ............................................................................. 21
1.3.2. Fluorescence properties of tyrosine .......................................................................... 22
1.3.3. Raman characteristics of tyrosine ............................................................................. 23
2. OBJECTIVES OF THE THESIS ................................................................... 26
3. EXPERIMENTAL ........................................................................................... 28
3.1. Samples ................................................................................................................................. 28
3.1.1. Model oligopeptides.................................................................................................. 28
3.1.2. Model DNA oligonucleotides ................................................................................... 29
3.1.3. Other biomolecules and chemicals ........................................................................... 30
3.1.4. Buffers ...................................................................................................................... 30
3.1.5. Sample preparation ................................................................................................... 31
3.1.6. Oligopeptide repurification ....................................................................................... 31
3.2. Experimental techniques ..................................................................................................... 33
3.2.1. Fluorescence spectroscopy ........................................................................................ 33
3.2.2. UV-VIS Absorption spectroscopy ............................................................................ 34
3.2.3. Raman spectroscopy ................................................................................................. 34

- 5 -
3.2.4. Infrared spectroscopy ................................................................................................ 36
3.2.5. Circular dichroism .................................................................................................... 37
3.2.6. pH measurement ....................................................................................................... 37
3.3. Data analysis ......................................................................................................................... 38
3.3.1. Factor analysis .......................................................................................................... 38
3.3.2. Fluorescence quenching analysis .............................................................................. 39
3.3.3. pH titration analysis .................................................................................................. 40
4. RESULTS AND DISCUSSION ...................................................................... 43
4.1. Free tyrosine ......................................................................................................................... 43
4.1.1. Concentration dependence of free tyrosine ............................................................... 43
4.2. Shorter segments of the MADS box ................................................................................... 46
4.2.1. Fluorescence and absorption pH dependence of CH08 oligopeptide ....................... 46
4.2.2. Fluorescence quenching of the CH08 ....................................................................... 49
4.2.3. CD spectra of CH08 oligopeptide ............................................................................. 51
4.2.4. Raman spectra of CH08 oligopeptide ....................................................................... 52
4.2.5. Infrared spectra of CH08 oligopeptide...................................................................... 55
4.2.6. Fluorescence and absorption pH dependence of JS01 oligopeptide ......................... 57
4.2.7. CD spectra of JS01 oligopeptide ............................................................................... 57
4.2.8. Raman spectra of JS01 oligopeptide ......................................................................... 58
4.2.9. Raman spectra of JS03 oligopeptide ......................................................................... 60
4.2.10. Raman spectra of JS02 oligopeptide .................................................................... 61
4.3. Longer segments of MADS box .......................................................................................... 62
4.3.1. Raman spectra of longer oligopeptides ..................................................................... 62
4.3.2. Absorption and fluorescence spectra of longer oligopeptides ................................. 64
4.4. MADS box ............................................................................................................................ 65
4.4.1. Fluorescence of the MADS box ................................................................................ 66
4.4.2. MADS box fluorescence quenching ......................................................................... 67
4.4.3. Fluorescence and absorption pH dependency of the MADS box ............................. 71
4.5. Peptide/DNA interaction ..................................................................................................... 77
4.5.1. Addition of the oligonucleotide to the oligopeptide sample ..................................... 77

- 6 -
4.5.2. Addition of the oligopeptide to the oligonucleotide sample ..................................... 79
4.5.3. Comparison of the interaction experiments .............................................................. 84
5. CONCLUSIONS .............................................................................................. 88
6. DISSEMINATION OF THE THESIS RESULTS ........................................ 91
7. BIBLIOGRAPHY ............................................................................................ 93
8. LIST OF ABBREVIATIONS ....................................................................... 105
9. LIST OF FIGURES ....................................................................................... 106
10. LIST OF TABLES ......................................................................................... 111
11. ATTACHMENTS .......................................................................................... 112
- 7 -
1. Theory
1.1. Transcription of a gene
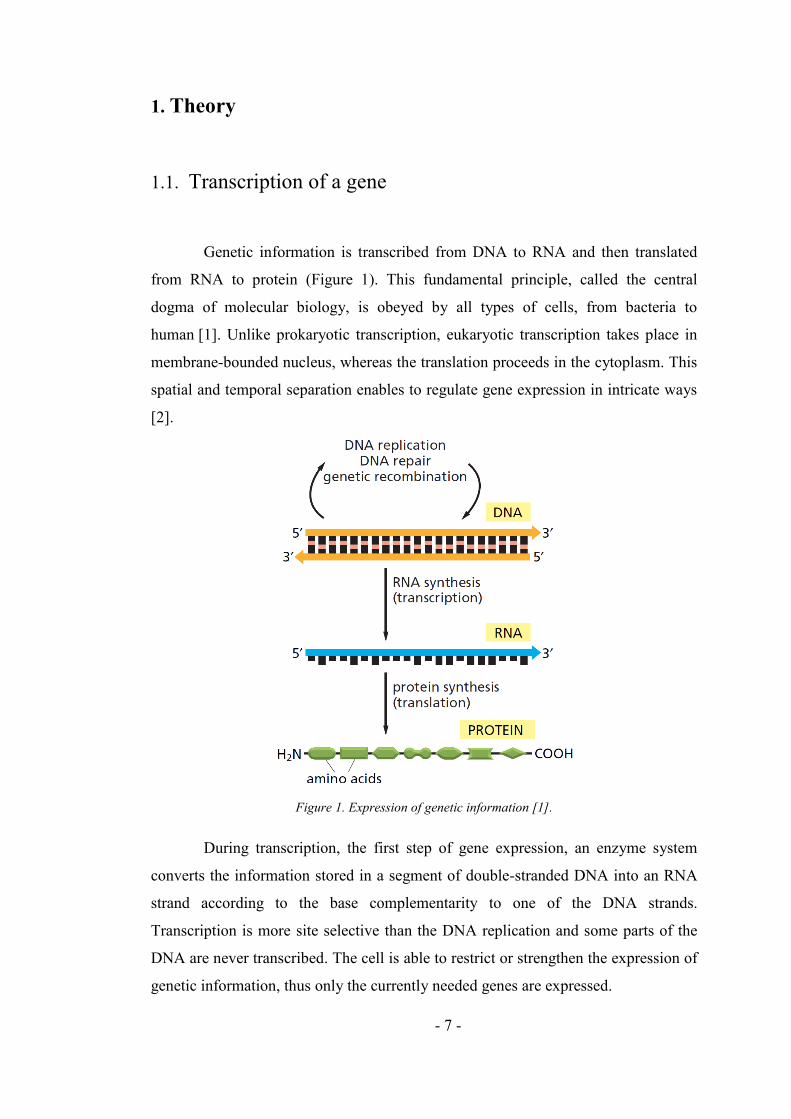
Genetic information is transcribed from DNA to RNA and then translated
from RNA to protein (Figure 1). This fundamental principle, called the central
dogma of molecular biology, is obeyed by all types of cells, from bacteria to
human [1]. Unlike prokaryotic transcription, eukaryotic transcription takes place in
membrane-bounded nucleus, whereas the translation proceeds in the cytoplasm. This
spatial and temporal separation enables to regulate gene expression in intricate ways
[2].
Figure 1. Expression of genetic information [1].
During transcription, the first step of gene expression, an enzyme system
converts the information stored in a segment of double-stranded DNA into an RNA
strand according to the base complementarity to one of the DNA strands.
Transcription is more site selective than the DNA replication and some parts of the
DNA are never transcribed. The cell is able to restrict or strengthen the expression of
genetic information, thus only the currently needed genes are expressed.

- 8 -
The process of transcription consists of three phases: initiation, elongation
and termination. It is initiated by an attachment of RNA polymerase to the DNA
template strand at a promoter DNA sequence. Like the DNA polymerase catalysing
DNA replication, the RNA polymerase catalyses formation of phosphodiester bonds
that link the nucleotides together, forming a linear chain. The RNA polymerase
moves along the DNA, unwinding the DNA helix just ahead of the active site
exposing a new region of the template strand. It elongates the RNA strand by adding
ribonucleotide units (using molecules ATP, CTP, UTP and GTP as substrates) to the
3′-hydroxyl end, synthesizing RNA in the 5′→ 3′ direction [3]. Each nucleotide in
the newly formed RNA corresponds to Watson-Crick base-pairing scheme. During
the elongation, the nucleobases of the growing RNA end pair temporarily with the
DNA template, forming a short hybrid RNA-DNA double helix. Just behind the
transcribed region, the RNA chain is displaced and the DNA helix is re-formed.
In eukaryotes, the termination of transcription occurs by different processes
depending on the type of the RNA polymerase. It can happen by using a termination
factor, after a transcription of a termination sequence or it can be even more
complex. Next RNA synthesis from the same DNA template can start before the first
RNA is complete; therefore many RNA copies usually arise from the same gene in a
relatively short time.
1.1.1. Regulation of the transcription initiation
Synthesis of informational macromolecules is highly expensive in terms of
energy; therefore the beginning of the pathway is the essential place for its
regulation. The initiation of the transcription is thus the main point controlling which
protein is to be produced and at what rate. In contrast to bacteria, RNA polymerases
of eukaryotes cannot initiate the transcription process without additional proteins and
their transcription is mediated and regulated by protein/DNA interactions [1].
The regulation of transcription initiation is often caused by differences in the
interaction between RNA polymerase and promoter. Like in the case of bacteria, the
sequences of various promoters differ considerably, affecting the binding affinity of
RNA polymerases and thus the basal frequency of transcription initiation [3]. In
eukaryotes the expression of genes is further modulated by regulatory proteins. Many

- 9 -
of them enhance or repress interaction between RNA polymerase and the promoter.
A typical eukaryotic gene has many activator and repressor proteins determining
together the rate and pattern of its transcription. To bind a promoter the three
eukaryotic RNA polymerases also need a group of general transcription factors (see
Figure 2), which must assemble at the specific short DNA sequence (promoter) with
the polymerase before the transcription may begin.
Before the initiation of eukaryotic transcription the DNA, densely packed
into nucleosomes and higher order forms of chromatin structure, need to be opened
and unwound to afford access to RNA polymerases.
Figure 2. Initiation of transcription in eukaryotic cell (adapted from [1]). Transcription factors are
marked as A,B…H.
1.1.2. Regulation segments of DNA
Hundreds of DNA regulation segments have already been identified. Both
eukaryotic and prokaryotic genes require promoters for the initiation of the
transcription. These DNA sequences are referred as cis-acting elements, meaning
they are always on the same molecule of DNA as the regulated gene [2]. A typical
gene is usually regulated by a number of cis-regulating segments, some of them are

- 10 -
closer to the coding sequence (proximal promoter region), some of them are placed
further (distal) [4].
Each type of eukaryotic RNA polymerases needs its characteristic promoter.
RNA polymerase I discerns a single type of promoter, present only in rRNA genes.
Polymerase III transcribes from promoters located in the upstream position,
embedded in the genes or downstream of the initiation site. Promoters of RNA
polymerase II can be either simple or more complex (see Figure 3). They are
combinations of short sequence elements usually located in the immediate upstream
region of the gene.
Two classes of promoters can be distinguished. The core promoters
encompass components directing the basal transcription complex to initiate
transcription and allow a constitutive expression of the gene even in the absence of
additional regulatory elements, but at very low (basal) levels. They do not need to
contain all elements shown in the Figure 3. For example in many of them the initiator
element (INR) may substitute a function of the TATA box [5]. Noncore promoters
can be found in the core promoter region but are usually located in the sequence
upstream of it (proximal or distal promoter regions). They typically contain multiple
recognition sites that may operate as enhancer or silencer sequences (see below)
modulating the basal transcription level.
Enhancers present another type of cis-acting DNA segments. They are able
to immensely increase the effectiveness of promoters. Their positions relative to
promoters are not fixed and can vary substantially [2]. Silencers on the other hand
have an opposite function and serve to reduce the transcription levels.
Figure 3. Binding of transcription factors to the regulatory promoter elements in eukaryotes [5].
Abbreviations: TATA box (sequence TATA(A/T)A(A/T)), BRE (TFIIB Recognition Element), DPE
(Downstream Promoter Element), CCAAT box (sequence GGCCAATCT).

- 11 -
Response elements modulate transcription in response to external stimuli
(specific hormones or intracellular second messengers such as cyclic AMP). They
can be usually found at a short distance upstream of promoters [5].
Cis-acting elements are binding sites for transcription factors. Such a protein
is sometimes called a trans-acting factor because it may be encoded by a gene on a
different DNA molecule than the gene it regulates.
1.1.3. Transcription factors
Transcription factors (TF) are often identified as key metabolic or
developmental regulators. They are absolutely necessary for the normal development
of a living organism and also for correct functioning of all the processes within its
cells. Though they present a variable family of proteins, they are generally defined
by their ability to bind specific sequences of DNA and regulate transcription of a
gene in time. TFs are active inside the nucleus; their activity is therefore affected by
nuclear transport (import/export). Posttranslational modifications like
phosphorylation present also an important mechanism controlling their activity (see
Figure 4). TFs may also control genes necessary for their own transcription and thus
be responsible for their own transcription.
General transcription factors (GTFs), also known as basal, are required for
transcription of all genes. They participate in formation of the transcription-initiation
complex that binds to promoter region upstream of the regulated gene and interacts
directly with the RNA polymerase. They are considered as the most basic set of
proteins necessary to activate the gene transcription [5]. The most common GTFs are
TFIIA, TFIIB, TFIID, TFIIE, TFIIF and TFIIH (marked in Figure 2).
Specific TFs stimulate or repress transcription of individual genes by binding
to their regulatory sequences [4]. They are especially important during the
development of multicellular organisms dictating the fate of individual cells. For
example, homeotic genes controlling the pattern of body formation encode a
transcription factor instructing cells to form various structures of the body. These
genes may activate one gene and repress another, creating effects that are necessary
for the proper development of an organism. A mutation of any of these homeotic
transcription factors results in incorrect development of the organism.

- 12 -
More than 2000 transcription factors were found encoded in the human
genome [6]. They can be classified according to their role within cellular regulatory
circuits [6] but they are usually distinguished according to their common structural
motives [7-8] (see Figure 5) based on the similarity of sequence and from the tertiary
structure of their DNA binding domains.
Figure 4. General scheme of response to signals from extracellular signalling proteins through cell
surface receptors to the nucleus. Latent cytoplasmatic factors activated by prosphorylation (green),
regulated phosphorylation or proteolysis (light purple), and second messenger fluctuations (light
blue). Internal signals regulate proteolysis at the plasma membrane liberating some transcription
factors (dark purple). Resident nuclear proteins (yellow, □) may be phosphorylated on serine and
thus activated either by binding to DNA or free at nucleus) [6].

- 13 -
1.2. MADS box family of transcription factors
The MADS box family of transcription factors can be distinguished based on
the primary sequence similarity amongst a number of proteins from a wide range of
eukaryotic organisms [9]. These transcriptional regulators are involved in a diverse
range of important biological functions, embryogenesis, flower and root development
in plants [10-13], expression of immediate early genes, muscle differentiation and
maintenance in animals [14-17], cell type-specific transcription, arginine metabolism
and pheromone response in yeast [9, 18-19].
The MADS acronym is derived from abbreviation of its earliest four founded
members: MCM1 (Minichromosome Maintenance 1) from the yeast [20], Agamous
from the thale cress -Arabidopsis thaliana [21], Deficiens from the snapdragon -
Antirrhinum majus [22] and SRF (Serum Response Factor) from the human [23].
Within the class of MADS box factors we distinguish two families: type I of
SRF-like proteins that are mainly responders to external signals (like SRF and yeast
RLM1) [7-8]; type II of MEF2-like (Myocyte Enhancer Factor) regulators of
differentiation, homeotic genes and yeast regulators.
Figure 5. Relative sizes of the 10 human TF superclasses distinguished according to the type of
DNA binding domain [7].

- 14 -
In addition to the MADS box domain, these factors share a loose sequence
similarity in another region called SAM domain for the SRF-like proteins (e.g., SRF,
ARGRI, and MCM1) and MEF2 domain for the MEF2-like proteins [9]. In plants,
the MEF-like proteins are also called MIKC-type proteins referring to comprised
domains: (M) MADS, (I) an intervening domain, (K) a keratin-like domain and (C) a
C-terminal region [24-25].
1.2.1. The MADS box
The MADS box is constituted by a conserved sequence of 56 amino acids
shared within the members of the family (see Figure 6). Several members of this
family have been shown to form dimmers. Two functional segments within the
sequence have been determined: the N-terminal basic half of the MADS box presents
the DNA binding domain whereas the C-terminal hydrophobic segment forms a
protein dimerization domain.
The X-ray structures of several members of MADS box family of
transcription factors bound to their DNA consensus (human SRF [26-27], yeast
MCM1 [28], MEF2a [29-30]) have revealed that their overall structures are very
similar, but with differences in DNA binding.
Generally the MADS box proteins bind to similar A/T rich DNA regions,
however there are distinctive consensus sequences: SRF binds as a homodimer
specifically to a 10-bp cis element known as the CArG-box of sequence
CC(A/T)6GG [31], whereas MEF2-like proteins binds as homo- or heterodimer to
another 10-bp segment CTA(A/T)4TAG called MEF2 site [32].
Some members of MADS box family particularly recruit other transcription
factors and form regulatory multi-protein complexes: SRF/TCF [33],
MCM1/MATα2 [34] and MEF2/MyoD [35]. The interaction with other auxiliary
proteins is common for the MADS box family of transcription factors and plays a
crucial role in the regulation of the target genes.

- 15 -
Figure 6. Protein sequences of non-identical MADS domains aligned to show their homology. The
amino acid positions involved in DNA contacts, dimerization interactions and α, β structure are
indicated below for the core SRF [26].
1.2.2. Biological role of MADS box proteins
In yeast, the MCM1 can act both as an activator or repressor in the
regulation of many genes involved in arginine metabolism, mating or cell cycle
depending on the proteins it attracts [36]. It plays a crucial role in the control of the
cell cycle at both G2/M and M/G1 transitions by interacting with the Yox1, Yhp1 or
Fkh2 proteins [37-38], transcription of cell-type specific genes in cooperation with
the MATα1 activator and the MATα2 repressor [39], in the pheromone response
mediated by the STE cofactors [19, 40] and together with Arg80 a SRF-like protein
serve as an additional regulating factor in the arginine metabolism [41].
In plants, the representation of MADS box containing proteins is rather
extensive, forming a group of homeotic transcription factors. Initially they have been
found to participate in the floral organ specification from root to flower and fruit, but
more recent studies disclosed their functions in the morphogenesis of almost all
organs throughout the life cycle of the plant, from vegetative to reproductive growth,
determining the identity of the floral meristem, ovules and root development

- 16 -
[24, 42-43]. The MADS-box gene family with more than 100 genes in representative
flowering plant genomes is significantly larger than that found in animals or fungi
[43]. The best studied plant MADS box genes are those determining floral identity in
Arabidopsis and Antirrhinum [22, 44] (Figure 7).
In animals the SRF-like MADS box factors are involved in the regulation of
many immediate early genes involved in the mitogenic response of proliferative
cells [46]. They are also important in the control of gene tissue specificity and the
response to hypertrophic growth stimuli of muscle genes expressed in post-
replicative myocytes [47-50]. Additionally to DNA binding and dimerization
domains, these factors contain a C-terminal transcription activation domain. The
transcription activation also requires additional accessory proteins in response to
extracellular signals such as growth and differentiation signals [51].
Similar to SRF the MEF2-like factors also regulate the transcription of genes
necessary for muscle differentiation and cell proliferation in animals. In mammals
there are four MEF2 genes (A, B… D) expressed in distinct but overlapping patterns
during embryogenesis and in adult tissues [52-53]. In mice, inactivation of the
MEF2C gene leads to cardiac morphogenetic defects, vascular abnormalities and
Figure 7. Structure of MADS-domain proteins and their function in determining floral organ identity
[45]. Structures of ‘floral quartets’. Multimeric complexes of MIKCC-group proteins, bound to two
DNA sequence elements (CArG-boxes) present in numerous target genes, determine floral organ
identity.

- 17 -
lethality by embryogenetic day 10 [54]. In contrast to mammals, Drosophila has only
one D-MEF2 gene, its mutation results in embryos lacking differentiated skeletal,
cardiac and visceral muscle cells [55].
1.2.3. SRF and its DNA regulatory segment recognition
The Serum Response Factor (SRF), one of the founding members of the
MADS box family of transcription factors, plays an important role in the control of
differentiation and proliferation in mammalian cells. SRF was firstly identified due
to its role in the regulation of immediate early genes in response to growth factor
induction [46, 56]. Later on it was found to regulate also the expression of muscle-
specific genes [47]. Since then there has been a large number of studies on SRF-
dependent gene expression and on promoters containing its binding site. These
studies assisted in identification of more than 150 genes regulated by SRF in
mammals [14]. In addition to the immediate early genes, SRF controls genes coding
components of the actin cytoskeleton and the muscular contractile apparatus [57].
The regulation of such a vast number of different genes proceeds through
combinatorial interactions with several signal regulated and tissue specific regulatory
cofactors (for example see Figure 8) [58].

- 18 -
The SRF is a 508 amino acids long protein and its core domain (residues
132-223) is sufficient for DNA binding, dimerization and interaction with other
accessory factors [23, 59]. The sequence is shown in the Figure 9. The core SRF
includes the MADS-box, a C-terminal transcriptional activation domain and a
N-terminal domain that can be phosphorylated by kinases.
Figure 8. Model of two principal pathways regulating SRF activity in non-muscle cells [58].
Figure 9. Core SRF sequence (residues 132-223). The α and β secondary structure assignment are
boxed, MADS box region is marked by purple (according to Pellegrini, et al. [26]).

- 19 -
SRF binds as a homodimer to the serum response element (SRE), which
contains the CArG box segment, having the sequence CC(A/T)6GG [60]. The X-ray
structure of the core SRF domain bound to DNA was solved by Pellegrini et al. in
1995 [26] (see Figure 10).
In the DNA-bound dimer, the core SRF forms two antiparallel amphipathic alpha-
helices αI oriented approximately parallel on the minor groove. These helices make
minor and major groove contacts, while the N-terminal extensions form minor
groove contacts with the DNA. The bound DNA is on Figure 10. bent and wrapped
around the protein, but it was shown by following studies on core SRF with 20mer
SRE that the oligonucleotide does not stay in a stable bending conformation in
solution and keeps switching between bent and linear conformations [62]. It exhibits
a compressed minor groove in the center and widened minor groove in the flanks.
1.2.4. Primary structure of the MADS box of SRF
The MADS box is constituted by a conserved sequence of 56 amino acids.
The knowledge of their chemical properties may be essential to understand the
biochemistry of the oligopeptide. Amino acids are usually divided into five main
classes based on the properties of side chains (R groups), in particular, on their
polarity or tendency to interact with water at biological pH. The hydropathies and
dissociation constants of the MADS box amino acids are shown in Table 1.
Figure 10. The core SRF/DNA complex (PDB file 1srs [26] vizualized by VMD [61]). Left: Possition
of the MADS box within the core SRF (marked by violet colour). Middle: View perpendicular to the
molecular two-fold and overall DNA helix axes. Right: View revealing the stab-like structure of the
monomers. The two SRF-core monomers (blue and red) have highly similar conformations. DNA
recognition segment is in dark grey colour (middle and right).

- 20 -
Table 1. Properties of amino acids within the SRF MADS box. a pKa of R groups of titratable amino acids; taken from [3]. b A scale combining the hydrophobicity and hydrophilicity of R group which can be used to measure
the tendency of the amino acid to seek aqueous environment ( values > 0) or avoid it (values < 0);
according to Hopp–Woods hydrophobicity scale [63].
SRF residue
Amino acid
pKaa
R group Charge Hydropathy
b
SRF residue
Amino acid
pKaa
R group Charge Hydropathy
b
142 G Gly 0.0 170 K Lys 10.53 1 → 0 3.0 143 R Arg 12.48 1 → 0 0.2 171 K Lys 10.53 1 → 0 3.0 144 V Val -1.5 172 A Ala -0.5 145 K Lys 10.53 1 → 0 3.0 173 Y Tyr 10.07 0 → -1 -2.3 146 I Ile -1.8 174 E Glu 4.25 0 → -1 3.0 147 K Lys 10.53 1 → 0 3.0 175 L Leu -1.8 148 M Met -1.3 176 S Ser 0.3 149 E Glu 4.25 0 → -1 3.0 177 T Thr -0.4 150 F Phe -2.5 178 L Leu -1.8 151 I Ile -1.8 179 T Thr -0.4 152 D Asp 3.65 0 → -1 3.0 180 G Gly 0.0 153 N Asn 0.2 181 T Thr -0.4 154 K Lys 10.53 1 → 0 3.0 182 Q Gln 0.2 155 L Leu -1.8 183 V Val -1.5 156 R Arg 12.48 1 → 0 3.0 184 L Leu -1.8 157 R Arg 12.48 1 → 0 3.0 185 L Leu -1.8 158 Y Tyr 10.07 0 → -1 -2.3 186 L Leu -1.8 159 T Thr -0.4 187 V Val -1.5 160 T Thr -0.4 188 A Ala -0.5 161 F Phe -2.5 189 S Ser 0.3 162 S Ser 0.3 190 E Glu 4.25 0 → -1 3.0 163 K Lys 10.53 1 → 0 3.0 191 T Thr -0.4 164 R Arg 12.48 1 → 0 3.0 192 G Gly 0.0 165 K Lys 10.53 1 → 0 3.0 193 H His 6 1 → 0 -0.5 166 T Thr -0.4 194 V Val -1.5 167 G Gly 0.0 195 Y Tyr 10.07 0 → -1 -2.3 168 I Ile -1.8 196 T Thr -0.4 169 M Met -1.3 197 F Phe -2.5
From the three common aromatic amino acids photosensitive in the middle
UV region, there are no tryptophan but three tyrosines and three phenylalanines
within the sequence of the MADS box. Due to the low absorption and quantum yield
of the phenylalanine, the tyrosines can be used as spectroscopic inner probes
sensitive to changes in their environment. It is expected that the spectroscopic
characteristics of individual tyrosines largely differ from each other due to the
different charges and hydrophobicities of amino acids in their proximity. Tyr195 is
situated in the most hydrophobic environment according to Hopp–Woods
hydrophobicity scale [63]. Tyr158 is in proximity of two positively charged arginines

- 21 -
(Arg156, Arg157) and Tyr173 is close to two positive lysines (Lys170, Lys171) and
one negative glutamic acid (Glu174).
1.3. Tyrosine as an inner probe of the MADS box
Tyrosine can be used as an intrinsic fluorophore and thus to serve as a
spectroscopic probe of the MADS box. L-tyrosine exists in the protonated form at
neutral pH, its phenolic hydroxyl group has the dissociation constant value
of 10.07 [3].
1.3.1. Absorption properties of tyrosine
Tyrosine has two main absorption bands in the region between 200 and 300
nm (see Figure 11). The theoretical interpretation of the UV absorption transitions of
its phenol ring is that the lowest energy singlet transition of tyrosine is due to the 1Lb
band, having a maximum near 277 nm and the much stronger 1La band near 223 nm
(see Figure 12) [64]. Hydrogen bonding is expected to cause a shift to lower energies
(red shift) since the absorption transitions to the 1La and 1Lb are of π→ π* type [64-
66]. It has also been shown that the hydrogen bonding and solvation increase the
extinction [67]. The extent of these changes depends upon the degree of the
chromophore interactions with polar solvents.
. Figure 11. Orientations of the absorption transition moments of the tyrosine lowest-energy singlet-
singlet electronic transitions [64].
In a hydrogen bond the phenolic hydroxyl group can act both as a proton
acceptor and donor. Aromatic alcohols are hydrogen bonded in water, but if stronger
proton acceptors are present, other hydrogen bonds can be formed causing further
shifts of the absorption bands. A loss of the hydrogen on a phenol hydroxyl group in

- 22 -
tyrosine shifts the absorption peak at 275 nm to 294 nm and the 223 nm peak to
240nm. The molar extinction coefficients for the 275 nm band increase from about
1400 cm-1/M to 2350 cm-1/M and for the 223 nm band from about 8200 cm-1/M to
about 11000 cm-1/M [64].
1.3.2. Fluorescence properties of tyrosine
The fluorescence and phosphorescence emissions of a protein are the
sums of contributions from the three aromatic amino acids: tryptophan, tyrosine, and
phenylalanine. These three residues have distinct absorption and emission
wavelengths and also differ in their quantum yields and lifetimes. Their excitation
and emission spectra are shown in Figure 12.
Figure 12. Absorption and emission spectra of aromatic amino acids [68].
The MADS box of SRF has no tryptophan, three phenylalanines and three
tyrosines. Considering that phenylalanine has very weak absorption and emission in
comparison to tyrosine, we can completely avoid phenylalanine emission by choice
of an excitation wavelength above 270 nm.
The tyrosine fluorescence emission spectrum is a single unstructured band
with a maximum near 303 nm. Deprotonation of the phenol hydroxyl group leads to
a large red shift of the spectrum to about 340 nm and a dramatic decrease of the
fluorescence intensity [69].

- 23 -
1.3.3. Raman characteristics of tyrosine
In the Raman spectrum of a protein, there are bands assignable to the
tyrosine residues, some of them being nearly free from overlapping of other Raman
bands. Raman spectra of L-tyrosine at pH 13 and 1 are shown in Figure 13 [70].
(Tyrosine is not enough soluble at neutral pH to give a concentration sufficient for
Raman measurement.) As can be seen, the loss of the hydrogen at Tyr phenol group
leads to shifts and intensity changes of several peaks.
The difference between the neutral and negatively charged forms of Tyr is
most prominent on the in-plane stretching vibrations ν(C=C) of the ring [71-72]. At
neutral pH, the pair of bands ν8a ~ 1620 cm-1 and ν8b ~ 1600 cm-1
(according to the
nomenclature of benzene ring modes by Wilson [73] see Figure 14 for the detailed
band assignment) are observed while at basic pH only one strong band
ν8a ~ 1600 cm-1 is present [74].
Moreover, additional information on the ionic form of the hydroxyl group
may be provided by a change in the ratio of the bands assigned to the Fermi
resonance between the symmetric ring-breathing deformation (CCC), ν1 ~ 850 cm-1
and the overtone of the nonplanar ring vibration (CCC), 2x ν16a ~ 830 cm-1 [71, 75].
When the phenolic hydroxyl group is a strong hydrogen-bond donor the ratio
, when it functions as both a donor and an acceptor
and when it is a strong hydrogen-bond acceptor [75-76].

- 24 -
Figure 13. Polarized Raman spectra of L-tyrosine in aqueous solutions of pH 13 (A) and pH 1 (B).
Upper curves: the scattered radiation polarized parallel to the polarization direction of the exciting
radiation. Lower curves: the scattered radiation polarized perpendicular to the polarization direction
of the exciting radiation [70].

- 25 -
Figure 14. Nomenclature of the ring modes in benzene molecule [73, 77].
(*) The motions appears as (CCC+CH). (+) Vibration degenerated according to Scherer [73].
ν: stretching, δ: in-plane deformation, γ: out-of-plane deformation vibrations.

- 26 -
2. Objectives of the thesis
As follows from the introduction, the MADS box represents a significant
family of transcription factors which is widely studied (see Figure 15). Yet still not
much is known about the process of DNA recognition and the mechanism of DNA
binding. It is now obvious that the structural arrangement of both the DNA chain and
the MADS box protein are closely related in the recognition process and that both
partners are influenced and maybe even controlled by the state of their hydration
shell and its ionic content.
Figure 15. Published articles concerning the MADS box in each year. (Taken from the Web of
Science; topic = “MADS box”.)
The aim of this study is to gain a deeper understanding of the structure,
behaviour and basic functional properties of model oligomers in water solution. The
conserved MADS box motif, its shorter segments and analogues with a point
mutation are used as basic models for studies of common functional properties of all
the protein family. We focus on a number of physico-chemical characteristics of
selected molecules; particularly the acid-base equilibria and effect of concentration
of selected ions are examined. Essential is also the developed methodology
applicable on low amounts of sample that employs fluorescence spectroscopy in
combination with UV absorption, Raman and FTIR spectroscopies. Model DNA
oligonucleotides are used for pilot interaction experiments.
The French and Czech research groups have built an intensive collaboration
on several research projects concerning physico-chemical properties of important

- 27 -
biomolecules and their systems. Within the few last years, structural and dynamical
aspects of the transcription factors and their interactions with their DNA target
became a new theme of the research cooperation [62]. This thesis that was enabled
by a French government scholarship “de doctorat en cotutelle” represents a
continuation of this long-term collaboration.

- 28 -
3. Experimental
3.1. Samples 3.1.1. Model oligopeptides
All model oligopeptides representing selected segments of human SRF
MADS box are listed in Table 2 and depicted in Figure 16. Three tyrosines of the
MADS box were used as photosensitive inner probes. Therefore, short segments (8-9
amino acids) encompassing them were chosen for the first studies. After the
characterisation of shorter segments of the MADS box the whole sequence was
studied. For investigation of the protein/DNA interaction, longer oligopeptides (42-
mers encompassing the helical part of the MADS box responsible for the DNA
binding) were used as well as two analogue sequences with point mutations at the
positions of tyrosines. Table 2. Summary of employed model oligopeptides.
Sample Length
Mw Yield Fluorophores Sequence
(g/mol) (mg)
1 CH08 8 1036 32.4 Y173 Ac-IMKKAYEL-amid
2 JS01 9 1212 20.0 Y158 Ac-KLRRYTTFS-amid
3 JS02 12 1573 20.0 F150→W150 Ac-KTRGRVKIKMEW-amid
4 JS03 12 1534 10.0 F150 Ac-KTRGRVKIKMEF-amid
5 JS04 42 4996 29.7 Y158, Y173 NH2-KTRGRVKIKMEFIDNKLRRYT TFSKRKTGIMKKAYELSTLTG-C00H
6 JS05 42 4980 19.7 Y158→F158, Y173 NH2-KTRGRVKIKMEFIDNKLRRFT TFSKRKTGIMKKAYELSTLTG-C00H
7 JS06 42 4980 34.3 Y158, Y173→F173 NH2-KTRGRVKIKMEFIDNKLRRYT TFSKRKTGIMKKAFELSTLTG-C00H
8 MADS 56 6512 1.1 Y158, Y173, Y195
Ac-GRVKIKMEFIDNKLRRYT TFSKRKTGIMKKAYELSTLTGT QVLLLVASETGHVYTF-amid
Figure 16. Studied model oligopeptides of the human SRF MADS box (in boxes). The MADS box
sequence within the SRF is highlighted by grey background. Green colour shows hydrophobic, red
colour positively charged and blue negatively charged amino acids at neutral pH).

- 29 -
Most of oligopeptides (JS01-6) were purchased from Apigenex (Prague,
Czech Republic). Purity and mass weight were tested by HPLC and MS.
MADS box and CH08 were synthesized by Yves-Marie Coïc at Institut
Pasteur (Paris, France) according to the Fmoc/tBu solid-phase strategy [98] on a
433A peptide synthesizer (Applied Biosystems) using a Fmoc Polystyrene AM RAM
resin (RAPP Polymere, Tübingen, Germany) and Fmoc Amide Resin (Applied
Biosystems) respectively. The mass characterization of the purified CH08
oligopeptide was in agreement with the expected value (above 98 % by RP-HPLC).
The purified MADS box was quantified by amino acid analysis (total yield 0.72 %)
and characterized by positive ion electrospray ionisation mass spectrometry. The
experimental data (6512 ± 29 Da) was consistent with the expected mass (6512 Da).
The stability of the peptide was checked by fluorescence emission spectra at
concentration 1×10⁻⁵ M.
3.1.2. Model DNA oligonucleotides
For peptide/DNA interaction studies short SRE segments were used as
model oligonucleotides. As was revealed in our previous work [78] the original SRE
sequence forms a hairpin. Therefore, analogue sequences were also used. These
oligonucleotides shared the same DNA base composition as SRE but differed in the
order of bases which prevented them to form intramolecular hairpins. Self
complementarity of proposed oligonucleotides was checked using Oligo Calc:
Oligonucleotide Properties Calculator [79]. All oligonucleotides (see Table 3) were
commercially synthesized and purified at Central-European Technology Institute of
the Masaryk University (Brno, Czech Republic).
Table 3. Summary of model oligonucleotides. *Extinction coefficients of single stranded (ss) and
double stranded (ds) oligonucleotides were calculated using the nearest neighbour model [80].
Sample Length DNA sequence (5' to 3')
Mw Yield *
*
(g/mol) (umol) (l/mol/cm) (l/mol/cm)
1 SREfos 20 GGA TGT CCA TAT TAG GAC AT 6156 1.29 202700 320715
2 SREfoscompl 20 ATG TCC TAA TAT GGA CAT CC 6076 1.18 196100 320715
3 modSRE 20 GAG TAG CAT CTT AGG ACA TT 6156 1.49 201500 317659
4 modSREcompl 20 AAT GTC CTA AGA TGC TAC TC 6076 1.37 193500 317659
- 30 -
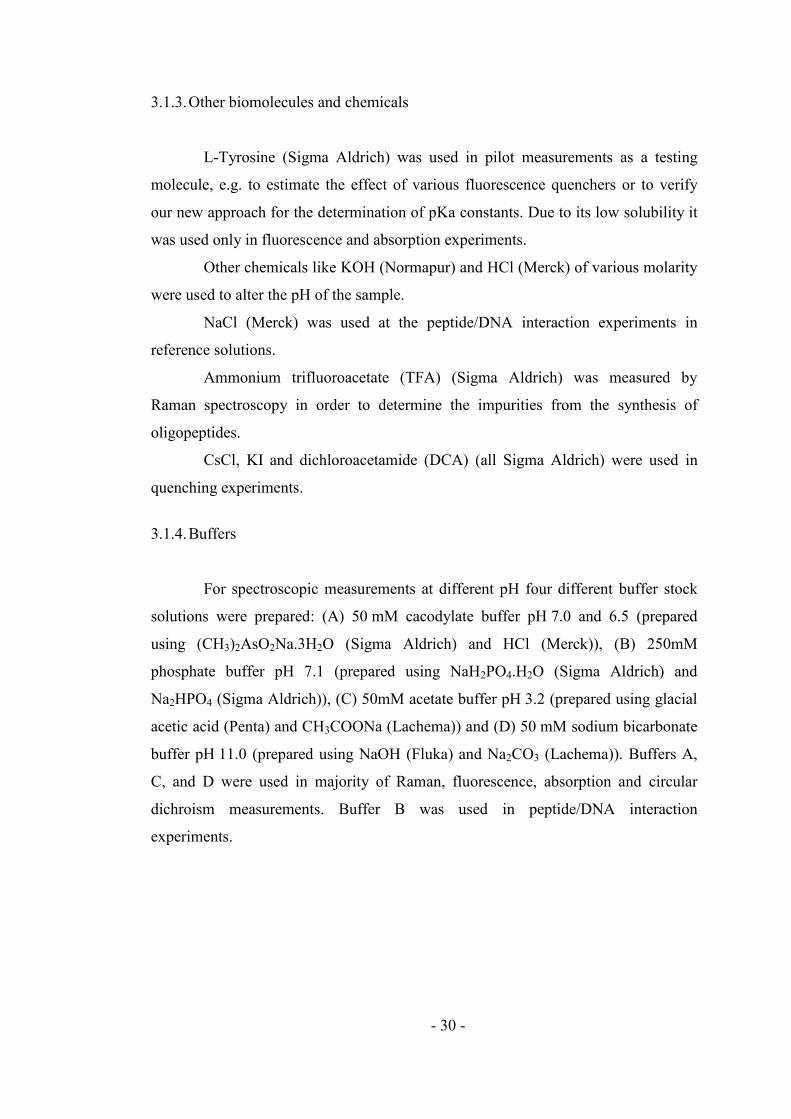
3.1.3. Other biomolecules and chemicals
L-Tyrosine (Sigma Aldrich) was used in pilot measurements as a testing
molecule, e.g. to estimate the effect of various fluorescence quenchers or to verify
our new approach for the determination of pKa constants. Due to its low solubility it
was used only in fluorescence and absorption experiments.
Other chemicals like KOH (Normapur) and HCl (Merck) of various molarity
were used to alter the pH of the sample.
NaCl (Merck) was used at the peptide/DNA interaction experiments in
reference solutions.
Ammonium trifluoroacetate (TFA) (Sigma Aldrich) was measured by
Raman spectroscopy in order to determine the impurities from the synthesis of
oligopeptides.
CsCl, KI and dichloroacetamide (DCA) (all Sigma Aldrich) were used in
quenching experiments.
3.1.4. Buffers
For spectroscopic measurements at different pH four different buffer stock
solutions were prepared: (A) 50 mM cacodylate buffer pH 7.0 and 6.5 (prepared
using (CH3)2AsO2Na.3H2O (Sigma Aldrich) and HCl (Merck)), (B) 250mM
phosphate buffer pH 7.1 (prepared using NaH2PO4.H2O (Sigma Aldrich) and
Na2HPO4 (Sigma Aldrich)), (C) 50mM acetate buffer pH 3.2 (prepared using glacial
acetic acid (Penta) and CH3COONa (Lachema)) and (D) 50 mM sodium bicarbonate
buffer pH 11.0 (prepared using NaOH (Fluka) and Na2CO3 (Lachema)). Buffers A,
C, and D were used in majority of Raman, fluorescence, absorption and circular
dichroism measurements. Buffer B was used in peptide/DNA interaction
experiments.

- 31 -
3.1.5. Sample preparation
Both oligopeptides and oligonucleotides were delivered in a form of
lyophilisate. Samples with desired concentration of the studied molecules were
prepared by two consecutive dilutions. A stock sample solution was prepared by
addition of a small amount of deionized water (0.1 ml) to the sample. In the second
dilution a buffer and/or deionized water were used depending on type of experiment.
For every sample a reference solution, consisting of the same amount of buffer and
deionized water was also prepared.
DNA duplexes were prepared by an annealing procedure. Two
complementary single strands in equal molar amounts were mixed in the solvent,
then heated to 70° C for 40 min. and after gradually cooled (2 hours) to room
temperature. The resulting product was stored frozen at (-20°C).
3.1.6. Oligopeptide repurification
All oligopeptide samples contained small remains of trifluoroacetic acid
(TFA) used in FMOC synthesis to cleave the peptide from the resin and in HPLC
purification. TFA persists in the oligopeptide as ammonium trifluoroacetate, bound
to cationic amino acids (Lys, Arg...). The salt dissociates in solution and rebinds
while drying, which is why it is not detected by mass spectrometry used for the
quality control of the synthesised product.
The standard procedure, consisting of several freeze-drying cycles in the
presence of HCl excess (stronger acid than TFA) was performed for oligopeptide
samples. The procedure was checked up on one of the longer oligopeptides - JS06.
By means of Raman spectrum recorded after each step of the procedure, the reming
of TFA was monitored simultaneously with verification that the oligopeptide is not
degraded (see Figure 17).
In each cycle i of TFA elution a HCl was added to an eppendorf tube with
known amount of JS06 oligopeptide, so that . Solution was vortexed,
stirred for about 10 minutes and then lyophilized. Sample was then dissolved in
water. Small amount of the solution was taken and measured by Raman spectroscopy

- 32 -
(see Figure 17). HCl was added to the rest of the solution and the whole process was
repeated. Each cycle of the elution may be characterized by elution ratio.
Figure 17. A) Raman spectra of oligopeptide JS06 in water measured after each step of repurification.
Spectra are normalized at 1004 cm-1 band. B) Raman spectrum of ammonium trifluoroacetate in water.

- 33 -
3.2. Experimental techniques 3.2.1. Fluorescence spectroscopy
Most of the fluorescence measurements were performed on a SLM Aminco-
Bowman series 2 luminescence spectrometer at UPMC. The excitation and emission
spectral bandwidths were 4 nm. Emission spectra were measured with a scan rate of
1 nm / sec in the wavelength range 290 - 380 nm. The excitation wavelength was
275 nm for pH titration and protein / DNA interaction experiments, and 278 nm for
fluorescence quenching. Excitation spectra of several oligopeptides were measured
for emissions at 293, 304 and 325 nm with a scan rate of 1 nm / sec, in the spectral
regions below corresponding to emission wavelengths.
Complementary measurements were performed on a Jobin Yvon Spex
FluoroMax 2 fluorescence spectrophotometer at Charles University. The excitation
and emission spectral bandwidths were 4 nm, excitation wavelength 275 nm and scan
rate 10 nm / 1 sec.
Samples were measured in a quartz 10 mm square cuvette (Hellma). Both
spectrophotometers were equipped with a thermostated cell holder and a magnetic
stirrer.
For acid-base titration measurements the samples were diluted in deionised
water. Small amounts of KOH or HCl of various molarity were added gradually to
the solution in order to sensitively alter the pH in the range from 3 to 12. After each
addition of pH changing solution, the pH value was checked and the sample was
placed in a thermostated holder in a fluorimeter and stirred magnetically for 6 min.
Then the fluorescence and absorption spectra were recorded. After that pH of the
solution was measured again and compared with the value before the spectral
measurement. Spectra of reference solution (consisting of the same amount of water,
HCl and KOH) undergoing the same procedure was measured immediately after the
sample.
Recorded fluorescence spectra were corrected for the Rayleigh and Raman
scatterings as well as for the small changes of the sample concentration resulting
from addition of quenchers or pH changing solutions. The inner filter effect (IFE)
was also corrected taking the optical density at the excitation (ODEX) and emission
(ODEM) wavelength into consideration in accordance with [81]

- 34 -
(3.1)
Maximal absorbance was 0.2 in the spectral range of fluorescence excitation
and emission, limiting the concentration of the sample. It was ranging from 8.10-5 M
for the shortest oligopeptides with just one tyrosine to 5.10–6 M for the whole MADS
box.
Fluorescence quenching was investigated in a 25 mM cacodylate buffer by
adding increasing amounts of quenchers I–, Cs+ or DCA. A small amount of S2O32–
(~ 10-4 M) was added in the case of iodide anion to prevent I3– formation.
Fluorescence spectra were corrected for the solvent background and for small
changes of the sample concentration resulting from the addition of the quencher
(dilution method).
3.2.2. UV-VIS Absorption spectroscopy
At UPMC two instruments for measurement of absorption spectra were
employed: Cary 3E UV-visible spectrophotometer and UVIKON 923
spectrophotometer (Bio-Tek Kontron Instruments). At Charles University, a
spectrophotometer Lambda 12 (Perkin-Elmer) was used. The samples were measured
in 1 cm2 quartz cells.
In the case of combined fluorescence-absorption experiment, absorption
spectra were recorded immediately after acquisition of the fluorescence. Otherwise
the sample was placed in a temperature stabilized cell-holder and tempered for about
10min. before the measurement. Acquired absorption spectra were corrected for a
background threshold and for the sample dilution if necessary.
3.2.3. Raman spectroscopy
Most of the Raman spectra were recorded at Charles University in Prague on
a home-made Raman spectrometer in a standard 90° geometry on a multichannel
spectrograph Spex 270 M (Jobin Yvon). To excite Raman scattering a
532.15 nm / 200 mW Nd-YAG Verdi V2 laser (Coherent) was used. Data were
recorded on a CCD detector (Princeton Instruments) with 1340x100 pixel array
cooled by liquid nitrogen. Holographic diffraction grating was used with groove
- 35 -
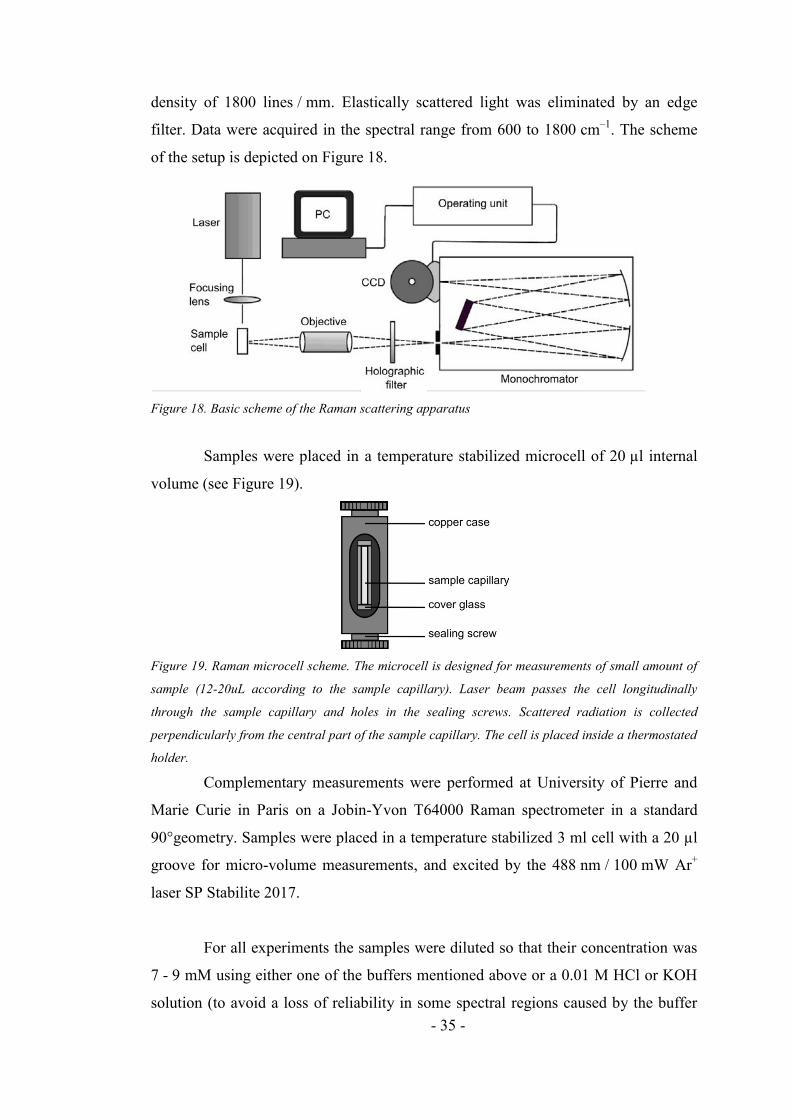
density of 1800 lines / mm. Elastically scattered light was eliminated by an edge
filter. Data were acquired in the spectral range from 600 to 1800 cm–1. The scheme
of the setup is depicted on Figure 18.
Figure 18. Basic scheme of the Raman scattering apparatus
Samples were placed in a temperature stabilized microcell of 20 µl internal
volume (see Figure 19).
Figure 19. Raman microcell scheme. The microcell is designed for measurements of small amount of
sample (12-20uL according to the sample capillary). Laser beam passes the cell longitudinally
through the sample capillary and holes in the sealing screws. Scattered radiation is collected
perpendicularly from the central part of the sample capillary. The cell is placed inside a thermostated
holder.
Complementary measurements were performed at University of Pierre and
Marie Curie in Paris on a Jobin-Yvon T64000 Raman spectrometer in a standard
90°geometry. Samples were placed in a temperature stabilized 3 ml cell with a 20 µl
groove for micro-volume measurements, and excited by the 488 nm / 100 mW Ar+
laser SP Stabilite 2017.
For all experiments the samples were diluted so that their concentration was
7 - 9 mM using either one of the buffers mentioned above or a 0.01 M HCl or KOH
solution (to avoid a loss of reliability in some spectral regions caused by the buffer

- 36 -
Raman signal). Samples were placed in a cell and tempered for about 20 minutes
before the measurement. The total acquisition time was 20 min. for each
measurement.
Every spectrum was calibrated independently by using a spectrum of neon
discharge lamp measured immediately afterward. Calibration program NeoKalSPex
and Labkal5 was used for spectra measured in Prague and in Paris, respectively. Both
programs were developed at Charles University in Prague by assoc. prof. Jiří Bok.
Unwanted signal of solvent and impurities from the synthesis of the biomolecules
(see Figure 20) was removed with help of a singular value decomposition-based
method [82].
Figure 20. Unwanted signal in Raman spectra. Spectra of used dissolving agents, artefact signal of
the microcell glass and possible impurity from the synthesis of oligopeptides (TFA).
3.2.4. Infrared spectroscopy
Infrared spectra were recorded on a Bruker Vector 33 Fourier-transform
infrared (FTIR) spectrometer at Charles University in Prague. Spectrophotometer
was equipped with a standard MIR globar source, a KBr beamsplitter and an MCT
detector. 4000 scans were collected with a 2 cm–1 spectral resolution and a
Blackman-Harris 3-term apodization function. Aqueous 3 mM peptide solutions
were measured at room temperature in CaF2-cell with an 8 µm path length. Spectral
contribution of water was corrected following the standard algorithm [83]. Spectrum

- 37 -
of water vapours was subtracted and finally the spectra were intensity normalized at
amide I band.
3.2.5. Circular dichroism
Circular dichroism (CD) spectra of shorter oligopeptides (CH08 and JS01)
were recorded on Jasco J-815 spectropolarimeter at Institute of Organic Chemistry
and Biochemistry AS CR. The spectra were collected from 180 to 260 nm at room
temperature in 0.1 cm quartz cells (peptide concentration 5 mM, 2 scans, 0.5 nm
steps, 20 nm/min speed, 8 s time constant, 1 nm spectral bandwidth) and from 230 to
380 nm in 1 cm quartz cells (peptide concentration 23 mM and identical other
experimental parameters). After baseline subtraction, final data were expressed as
molar ellipticities (deg·cm2·dmol–1) per residue.
3.2.6. pH measurement
pH meter IQ170G (IQ Scientific Instruments) equipped with a stainless steel
pH probe was used to verify the pH of all buffers and samples during the pH
sensitive measurements at UPMC. At Charles University, pH meter Orion PerpHect
LogRmeter 350 (Thermo) equipped with a glass electrode was employed.
- 38 -
3.3. Data analysis 3.3.1. Factor analysis
Factor analysis (FA) belongs to multidimensional statistical methods
enabling reduction of a set of experimental data without any loss of information. The
general task of FA is to reduce the set of random variables Y1,...YN to smaller data set,
which represents their best substitution. This task has several solutions. The
fundament of the simplest one lies in a consecutive retrieval of random variables,
called factors, which were linear combinations of the original variables and gradually
reached the greatest part of their variability [84].
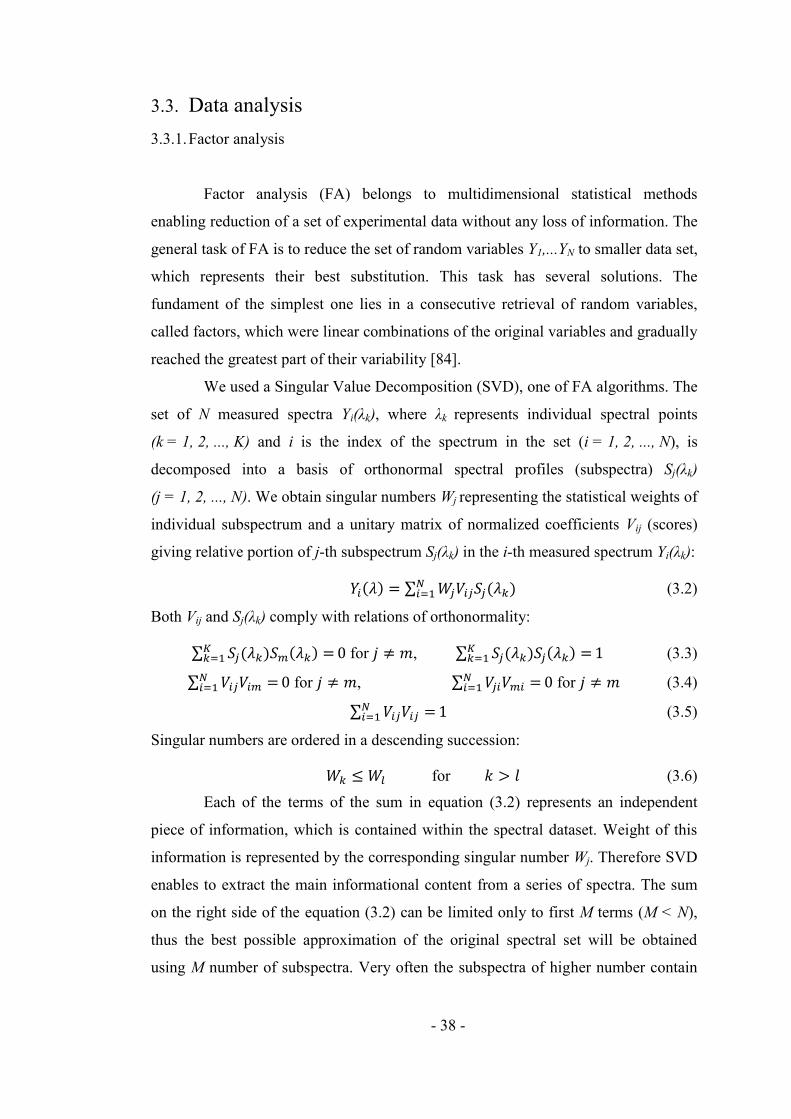
We used a Singular Value Decomposition (SVD), one of FA algorithms. The
set of N measured spectra Yi(λk), where λk represents individual spectral points
(k = 1, 2, ..., K) and i is the index of the spectrum in the set (i = 1, 2, ..., N), is
decomposed into a basis of orthonormal spectral profiles (subspectra) Sj(λk)
(j = 1, 2, ..., N). We obtain singular numbers Wj representing the statistical weights of
individual subspectrum and a unitary matrix of normalized coefficients Vij (scores)
giving relative portion of j-th subspectrum Sj(λk) in the i-th measured spectrum Yi(λk):
(3.2)
Both Vij and Sj(λk) comply with relations of orthonormality:
for ,
(3.3)
for ,
for (3.4)
(3.5)
Singular numbers are ordered in a descending succession:
for (3.6)
Each of the terms of the sum in equation (3.2) represents an independent
piece of information, which is contained within the spectral dataset. Weight of this
information is represented by the corresponding singular number Wj. Therefore SVD
enables to extract the main informational content from a series of spectra. The sum
on the right side of the equation (3.2) can be limited only to first M terms (M < N),
thus the best possible approximation of the original spectral set will be obtained
using M number of subspectra. Very often the subspectra of higher number contain
- 39 -
only a noise. Therefore omitting these components, a better signal to noise ratio is
gained and also a number of data is reduced without any loss of information.
(3.7)
The smallest M value, for which both sides of equation (3.7) differ only by an
experimental error, represents a meaningful number of subspectra. It is called “factor
dimension”. Factor dimension of analysed data should correspond to a number of
independent components and can be estimated from the decrease in progression of
singular values, or the noise increase in the subspectra succession. Another
appropriate criterion is a progress on m of the residual error:
(3.8)
In the region above the suitable M a weak, almost linear decrease of residual error is
usually observed [85].
3.3.2. Fluorescence quenching analysis
FA enables generally distinguishing among individual spectral components
in the series of spectra dependent on a certain property. In particular case of
fluorescence quenching this concerns the decrease of the fluorescence intensity
caused by the addition of quencher.
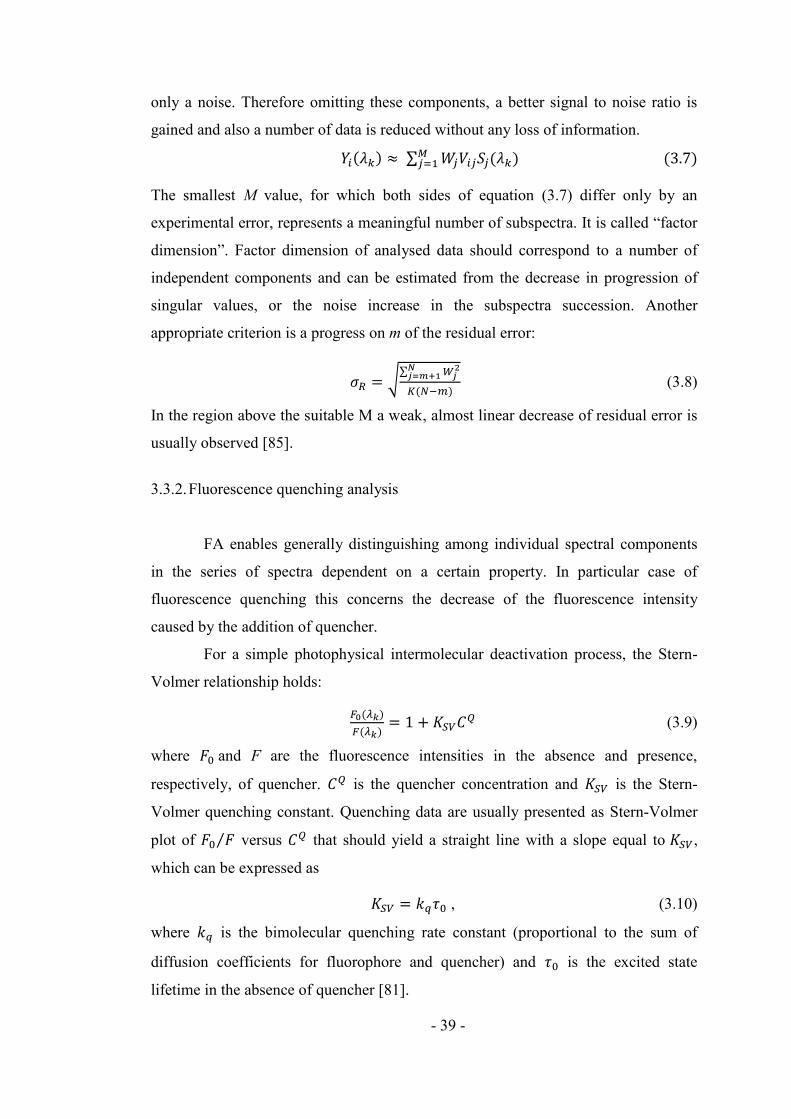
For a simple photophysical intermolecular deactivation process, the Stern-
Volmer relationship holds:
(3.9)
where and F are the fluorescence intensities in the absence and presence,
respectively, of quencher. is the quencher concentration and is the Stern-
Volmer quenching constant. Quenching data are usually presented as Stern-Volmer
plot of versus that should yield a straight line with a slope equal to ,
which can be expressed as
, (3.10)
where is the bimolecular quenching rate constant (proportional to the sum of
diffusion coefficients for fluorophore and quencher) and is the excited state
lifetime in the absence of quencher [81].
- 40 -
In our study, quenching measurements of both shorter and longer
oligopeptides by various quenchers of different charges were performed. Corrected
data (according to the procedure mentioned in chapter 3.2.1) were treated by factor
analysis (SVD). The SVD results revealed factor dimension of two for oligopeptides
containing several tyrosines. We have thus generalized the Stern-Volmer model for
two independently quenched spectral components FI(λ) and FII(λ) composing the
measured spectrum:
, (3.11)
where and are the two fluorescence components without quencher, CiQ
is the concentration of the quencher, and KSVI, KSV
II are the corresponding Stern-
Volmer constants. and can be approximated as linear combinations of
the first and the second subspectrum:
,
, (3.12)
where rjI and rj
II are coefficients of linear combination. Considering equation (3.7)
for and orthogonality of subspectra equation (3.3) a final set of 2N equations
is obtained:
(3.13)
The six unknown parameters (
can be determined as
a simultaneous non-linear least-square fit of the right sides to the left ones.
3.3.3. pH titration analysis
pH titration was performed on shorter oligopeptides (CH08 and JS01) and on
the MADS box. Corrected fluorescence and absorption data were processed by FA
and fitted in order to determine the pKa constants of titratable amino acids.
The derivation of pH as a measure of acidity in a system is described by
Henderson-Hasselbalch equation:
. (3.14)
- 41 -
Here is the molar concentration of the undissociated weak acid and is the
molar concentration of the acid’s conjugate base in the non-specific Brønsted acid-
base reaction:
. (3.15)
In our experiments an increase of pH causes gradual deprotonation of
titratable amino acids (Asp, Glu, His, Cys, Tyr, Lys, Arg) within the oligopeptide.
Using fluorescence and absorption spectroscopy only the changes influencing
photosensitive residues can be observed and examined. Our approach for the
determination of constant of oligopeptide intrinsic fluorophores and spectral
components referring to differently charged states was already published in [I]. In
this article the methodology was applied on oligopeptides with only one tyrosine,
hence resolving the simplest case of a peptide undergoing only one spectrally
sensitive pH transition.
The following theoretical relations represent extension to the most complex
case of three distinct constants, with whom we met in the case of MADS box
measurement. In this case, four different states of the oligopeptide ( ) are
considered:
(3.16)
Four spectral components are then resolved in the pH titration spectra, therefore:
(3.17)
where FA(), FB(), FC() and FD() are the spectra of individual components
corresponding to its unit concentration. They form the original spectrum Yi()
proportionally to their current portions CiA, Ci
B, CiC and Ci
D,
(3.18)
Following equation (3.14) they depend on pH as:
(3.19)

- 42 -
On the other hand, the four spectral components can be approximated as linear
combinations of FA subspectra:
(3.20)
where rj represent the coefficients of linear combination. Due to the orthogonality of
spectral profiles a final set of MN equations is obtained:
(3.21)
In a simultaneous fit of fluorescence and absorbance data, which we also performed,
two sets of spectral components (of absorbance and of fluorescence emission) were
obtained by fitting two sets of equations (3.21) with help of relations (3.19) using the
same triad of pKa constants.

- 43 -
4. Results and discussion
4.1. Free tyrosine 4.1.1. Concentration dependence of free tyrosine
To correct the inner filter effect (IFE) due to a high optical density, equation
(3.1) was mostly employed [81]. This formula is though well applicable only when
the absorbance of the examining sample is less than 0.2. As in some cases, in
particular those concerning the study of MADS interaction with oligonucleotides the
absorbance exceeded 0.2 at the excitation wavelength of 275 nm, a calibration curve
for precise correction of the attenuation due to absorption of exciting radiation
(primary IFE) was determined.
Tyrosine solution was gradually diluted (from 0.64 to 0.03 mM). After each
dilution, fluorescence and absorption spectra were recorded. Measured spectra were
treated as described in chapters 3.2.1 and 3.2.2. Factor analysis (SVD) applied to
fluorescence emission spectra (see Figure 21) showed that the factor dimension is
equal to 1, which confirmed a negligible concentration effect on the shape of the
fluorescence spectrum. The dependence of V1 on the Tyr concentration was fitted by
equation derived from equation (3.1.) so that a primary IFE effect was corrected
according to:
,
where fex is the factor correcting the absorption of incident light
Since the absorption is below 0.2 in the whole emission region (and the same
is expected when oligonucleotides are present in the sample), a recalibration of the
fluorescence reabsorption (secondary IFE) is not necessary and can be corrected as in
equation (3.1) [81]:
The IFE corrected fluorescence intensity is then given by:
Figure 22 shows that observed fluorescence intensities are proportional to
the absorbance over only a limited range (A < 0.05 [81]). For higher absorption
values additional correction is indispensable.

- 44 -
Figure 21. SVD results of the tyrosine fluorescence in dependence on its concentration. (To
completely avoid possible contributions from elastic scattering of the excitation, only spectral region
300-370 nm was analysed.) Red line in the graph of V1 corresponds to the fit.
Figure 22. The effect of optical density on the fluorescence intensity of tyrosine and its correction.
Black line shows the measured fluorescence intensities. Blue and red circles indicate corrected
intensities according to equation (3.1) (*) and to our fit (**).Red curve is a linear regression of (**)
corrected intensities. (ODem = 0 in both cases).

- 45 -
It can be seen from Figure 22 that application of our formula improves the
IFE correction in respect to equation (3.1). This is demonstrated by the coefficient of
determination for linear regressions of corrected intensities:
Rsqr = 0.9975 for IFE according to the equation (3.1),
Rsqr = 0.9993 for IFE* based on our approach.

- 46 -
4.2. Shorter segments of the MADS box
The N terminal part containing prevailingly basic amino acids of the SRF
MADS box is responsible for the DNA binding. To characterize it in a closer detail,
model oligomers corresponding its three selected segments (see Figure 23) were
investigated. CH08 and JS01 appear in the helix, whereas JS02 in the N-extension
of the SRF MADS box [26]. Structure and physico-chemical properties of the short
oligopeptides in aqueous solution were characterized by fluorescence, Raman, UV
and IR absorption, and CD spectra and their dependence on temperature and pH.
Figure 23. Short model oligopeptides within the sequence of human SRF. Denoted is the secondary
structure in single crystal of SRF dimer with target DNA element according to X-ray [26].
4.2.1. Fluorescence and absorption pH dependence of CH08 oligopeptide
Sensitivity of the CH08 segment to pH changes was studied by fluorescence
and absorption spectroscopies. Absorption spectra (measured and treated as
described in chapter 3.2.2) were almost constant in the pH range 3 - 8. Noticeable
changes were observed by further pH increase: the absorption band peaking at
275 nm moved to a longer wavelengths and increased its high - band maximum at
294 nm and 1.5-fold increase of intensity for pH 11 (see Figure 24). Results of factor
analysis applied on absorption spectra are shown in Figure 25. The factor dimension
is 2, indicating a single acido-basic transition. The first subspectrum S1 represents
certain average of measured spectra - the 1st coefficients Vi1 thus describe the overall
increase of absorbance as a function of pH. The second subspectrum S2, with
comparable weight as the first one, accounts for the main changes of the spectral
shape. The fit according a model of single acido-basic transition between two CH08
forms (see chapter 3.3.3) matched perfectly the pH dependences of V1 and V2 values
and provided the value of pKa constant:

- 47 -
Figure 24. pH dependence of CH08 oligopeptide absorption spectra. From acidic (red) to basic
(violet) pH.
Figure 25. Factor analysis (SVD) of pH dependency of CH08 absorption and its fit according to
chapter 3.3.3. (A) SVD characteristics. Red lines show the results of the fit. (B) Determined pH
dependences of the two CH08 forms. (C) Isolated absorption spectra of both forms.
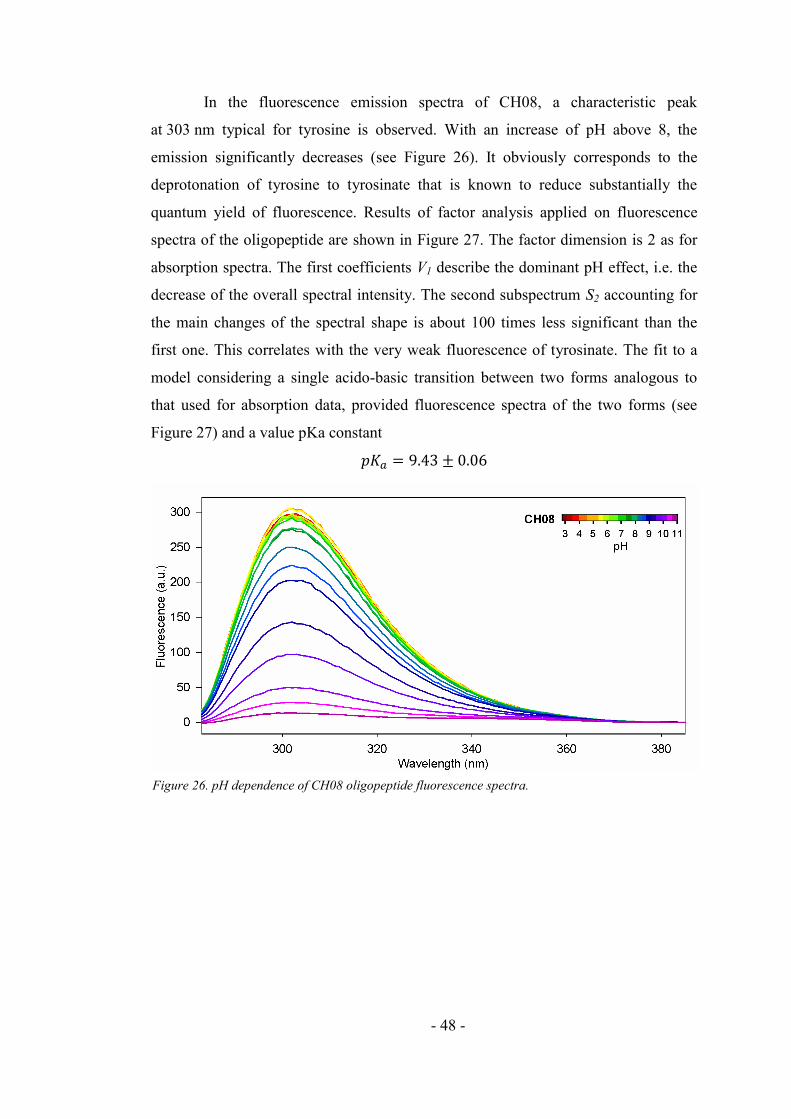
- 48 -
In the fluorescence emission spectra of CH08, a characteristic peak
at 303 nm typical for tyrosine is observed. With an increase of pH above 8, the
emission significantly decreases (see Figure 26). It obviously corresponds to the
deprotonation of tyrosine to tyrosinate that is known to reduce substantially the
quantum yield of fluorescence. Results of factor analysis applied on fluorescence
spectra of the oligopeptide are shown in Figure 27. The factor dimension is 2 as for
absorption spectra. The first coefficients V1 describe the dominant pH effect, i.e. the
decrease of the overall spectral intensity. The second subspectrum S2 accounting for
the main changes of the spectral shape is about 100 times less significant than the
first one. This correlates with the very weak fluorescence of tyrosinate. The fit to a
model considering a single acido-basic transition between two forms analogous to
that used for absorption data, provided fluorescence spectra of the two forms (see
Figure 27) and a value pKa constant
Figure 26. pH dependence of CH08 oligopeptide fluorescence spectra.

- 49 -
Figure 27. Factor analysis (SVD) of pH dependency of CH08 fluorescence and its fit according to
chapter 3.3.3. (A) SVD characteristics. Red lines show the results of the fit. (B) Determined pH
dependences of the two CH08 forms. (C) Isolated emission spectra of both forms, normalized by using
coefficients nA = 0.003, nB = 0.201.
Perfect agreement of pKa constants obtained independently from absorption
and fluorescence experiment verify the reliability of the obtained value. This value is
though significantly lower than 10.07 corresponding to free tyrosine [3]. Our
explanation is that this shift of pKa is caused by the positively charged environment
of tyrosine in CH08 thanks to two positively charged lysines [86], only partly
compensated by negatively charged glutamic acid. Results of this experiment were
published in [I].
4.2.2. Fluorescence quenching of the CH08
Quenching of CH08 by DCA was performed in 25mM acetate and 25mM
cacodylate buffer at pH 3.2 and 7.0, respectively, to disclose whether there is any
difference in the structure of the oligopeptide changing the accessibility of the non-
ionic quencher to the tyrosine. Sets of obtained fluorescence spectra were treated as
described in the chapter 3.2.1. Stern-Volmer constants in both buffers were first
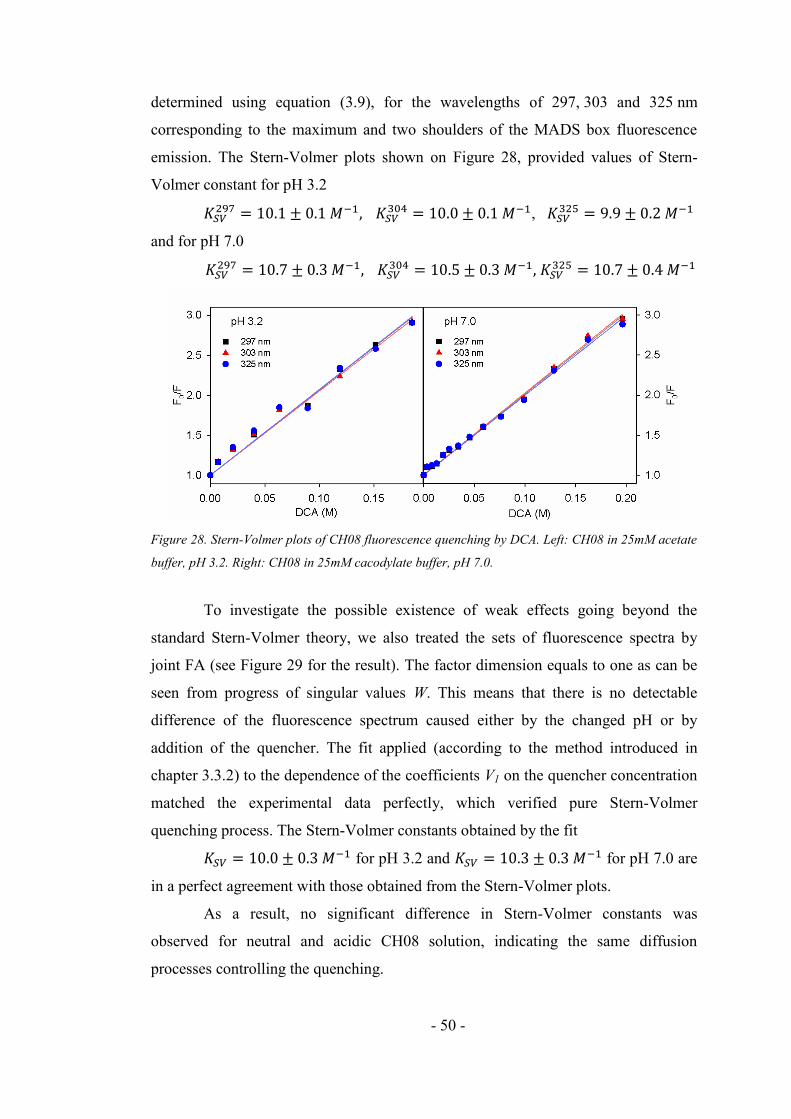
- 50 -
determined using equation (3.9), for the wavelengths of 297, 303 and 325 nm
corresponding to the maximum and two shoulders of the MADS box fluorescence
emission. The Stern-Volmer plots shown on Figure 28, provided values of Stern-
Volmer constant for pH 3.2
,
and for pH 7.0
Figure 28. Stern-Volmer plots of CH08 fluorescence quenching by DCA. Left: CH08 in 25mM acetate
buffer, pH 3.2. Right: CH08 in 25mM cacodylate buffer, pH 7.0.
To investigate the possible existence of weak effects going beyond the
standard Stern-Volmer theory, we also treated the sets of fluorescence spectra by
joint FA (see Figure 29 for the result). The factor dimension equals to one as can be
seen from progress of singular values W. This means that there is no detectable
difference of the fluorescence spectrum caused either by the changed pH or by
addition of the quencher. The fit applied (according to the method introduced in
chapter 3.3.2) to the dependence of the coefficients V1 on the quencher concentration
matched the experimental data perfectly, which verified pure Stern-Volmer
quenching process. The Stern-Volmer constants obtained by the fit
for pH 3.2 and for pH 7.0 are
in a perfect agreement with those obtained from the Stern-Volmer plots.
As a result, no significant difference in Stern-Volmer constants was
observed for neutral and acidic CH08 solution, indicating the same diffusion
processes controlling the quenching.

- 51 -
Figure 29. SVD results of CH08 fluorescence quenching by DCA. Black and red lines in the graph of
V1 correspond to the fit applied to the values corresponding tot neutral and acidic pH, respectively.
4.2.3. CD spectra of CH08 oligopeptide
CD spectra of the CH08 were measured for three pH (acetate buffer -
pH 3.2; water - pH 5.0; sodium bicarbonate buffer - pH 11.0). The most intensive CD
signal was obtained in the spectral region 190–240 nm where are bands attributed to
π-π* and n-π* transitions localized at the peptide backbone. A negative band at
196 nm was observed at all measured pH. In acidic and neutral pH it was
accompanied by a negative shoulder around 230 nm whereas in the basic pH this
shoulder shifted to 225 nm and its intensity increased (see Figure 30). These CD
characteristics indicate unordered secondary structure as a main structural motif [87-
88]. However, electronic CD is essentially sensitive to long range interactions.
Therefore a study by vibrational spectroscopies (Raman and FTIR) which are more
sensitive to structural details and local arrangements was necessary for deeper
understanding of the structure (see following chapters 4.2.4 and 4.2.5).
As CH08 contains tyrosine residue, one can expect up to four additional
π-π* transitions due to the phenolic chromophore of tyrosine side chain. Although
they are partially hidden by a signal of n-π* transitions of the peptide backbone we

- 52 -
can assume that in CH08 oligopeptide π-π* Bb transitions significantly contribute to
the weak spectral band observed at ~225 nm.
The distinct contribution of aromatic side chains appeared in the spectral
region of 240-320 nm. Weak positive spectral band around 276 nm was observed for
acidic and neutral environment. At basic pH a red shift to 294 nm and intensity
increase (without change of the sign) occurred. This corresponds to the appearance of
tyrosinate form according to published data [89].
Results of this experiment were published in [II].
Figure 30. Electronic circular dichroism spectra of CH08 oligopeptide in acetate buffer (red), in
water (green) and in a sodium bicarbonate buffer (blue).
4.2.4. Raman spectra of CH08 oligopeptide
Raman spectra of CH08 (Figure 31) were measured at pH 3.2, 5.0 and 12.0
and treated according to chapter 3.2.3. Negligible difference between Raman spectra
in acidic and neutral pH indicated that deprotonation of glutamic acid (
) [3] did not have any effect neither on the secondary structure of the oligomer
nor on the polarizability of Glu residue. Further increase of pH resulted in significant
changes of several Raman bands. These changes could be divided into two groups,
the first corresponding to tyrosine deprotonation and the second to the changes in the
secondary structure. No direct spectroscopic markers of deprotonation of the pair of
Lys residues (
) [3] were observed.
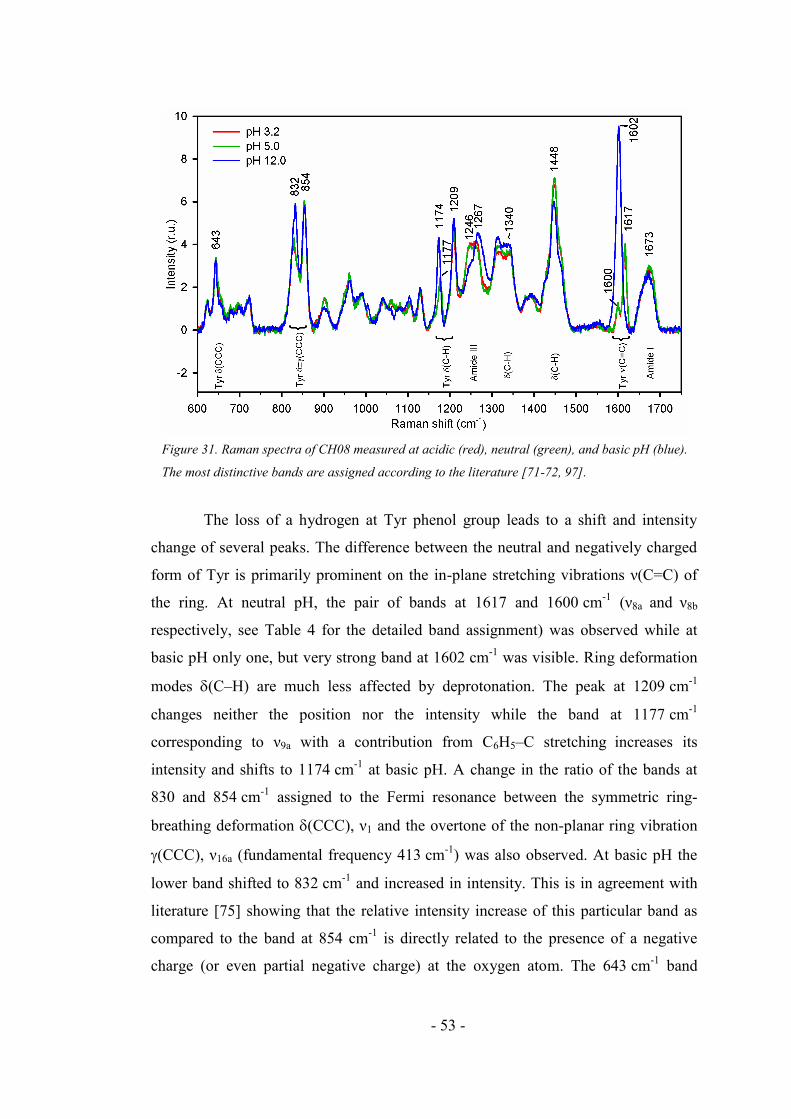
- 53 -
The loss of a hydrogen at Tyr phenol group leads to a shift and intensity
change of several peaks. The difference between the neutral and negatively charged
form of Tyr is primarily prominent on the in-plane stretching vibrations ν(C=C) of
the ring. At neutral pH, the pair of bands at 1617 and 1600 cm-1 (ν8a and ν8b
respectively, see Table 4 for the detailed band assignment) was observed while at
basic pH only one, but very strong band at 1602 cm-1 was visible. Ring deformation
modes (C–H) are much less affected by deprotonation. The peak at 1209 cm-1
changes neither the position nor the intensity while the band at 1177 cm-1
corresponding to ν9a with a contribution from C6H5–C stretching increases its
intensity and shifts to 1174 cm-1 at basic pH. A change in the ratio of the bands at
830 and 854 cm-1 assigned to the Fermi resonance between the symmetric ring-
breathing deformation (CCC), ν1 and the overtone of the non-planar ring vibration
(CCC), ν16a (fundamental frequency 413 cm-1) was also observed. At basic pH the
lower band shifted to 832 cm-1 and increased in intensity. This is in agreement with
literature [75] showing that the relative intensity increase of this particular band as
compared to the band at 854 cm-1 is directly related to the presence of a negative
charge (or even partial negative charge) at the oxygen atom. The 643 cm-1 band
Figure 31. Raman spectra of CH08 measured at acidic (red), neutral (green), and basic pH (blue).
The most distinctive bands are assigned according to the literature [71-72, 97].

- 54 -
corresponding to the (CCC) deformation, ν6b appears to be insensitive to the
protonation state at all.
Table 4. Frequencies of selected vibrational modes of tyrosine and tyrosinate observed in Raman
spectra of CH08 oligopeptide.
* according to the nomenclature of benzene ring modes by Wilson [73, 77], see Figure 14.
** Fermi doublet, the second harmonic of the mode ν16a combined with ν1
Information about the secondary structure can be derived from the position
and shape of the amide I and amide III bands. In acidic and neutral environments, the
amide I was located at 1673 cm-1 while at basic pH a small downshift to 1671 cm-1
was observed. The difference is more obvious in the amide III region consisting of
two components. At acidic and neutral pH they are approximately of the same
intensity with low and high frequency components at 1246 cm-1 and 1262 cm-1,
respectively. At basic pH, the relative intensity of the low frequency component
decreases while its position remains the same as mentioned above, i.e., 1246 cm-1;
the high frequency component is shifted to 1267 cm-1. This indicates that CH08
adopts a slightly different (average) secondary structure in basic environment than in
neutral and acidic one.
Maximum of the amide I at ~1672 cm-1 points on a possible presence of β-
sheet, β-turns and β-hairpins along with random coil/unordered structures. The two
bands at 1246 and ~1265 cm–1 in the amide III region can be assigned to the same
description
ν8a 1617 ν(C=C) ν8a 1602 ν(C=C)
ν8b 1600 ν(C=C) ν19b 1425 ν(C=C)
ν19b 1448 ν(C=C) ν14 1313 ν(C=C)
ν3 1341 (C-H) ν9a 1174 (C-H)
ν9a 1177 (C-H) ν15 1104 (C-H)
ν15 1129 (C-H) ν1 854, 832** (CCC)
ν17a 962 (C-H) ν17b 832 (C-H)
ν1 854, 830** (CCC) ν4 723 (CCC)
ν17b 830 (C-H) ν6b 642 (CCC)
ν4 723 (CCC) ν16a 854, 832** (CCC)
ν6b 643 (CCC)
ν16a 854, 830** (CCC)
Wilson*
nomenclature
Raman shift
(cm-1)
Raman shift
(cm-1)
Tyrosine Tyrosinate
Wilson*
nomenclaturedescription

- 55 -
structures [90-91]. This is in a general agreement with an estimation of the secondary
structure from the primary peptide sequence by Garnier-Osguthorpe-Robson method
(GOR) [92] and Chou and Fasman [93] algorithms (data not shown). Based on this
analysis it may be stated that CH08 tends to form a β-hairpin structure which is in a
dynamical equilibrium with an unordered/random coil structure.
At neutral and basic pH, there are also small differences between intensities
of the band at 1448 cm-1 and the broad band at ~1340 cm–1 corresponding to (C–H)
deformations (CH2 and CH3 bending modes). This could be an effect of both the
deprotonation of Lys side chains and the overall influence of the highly basic
environment.
The results of this experiment were also published in [II] where the
experimentally obtained spectra were compared with the ones calculated by DFT
calculations based on the secondary structures obtained from molecular dynamics
(MD). The DFT calculations served for more precise and accurate assignment of
Raman spectral bands.
4.2.5. Infrared spectra of CH08 oligopeptide
FTIR spectra of CH08 were measured at pH 3.0 and 11.5 (see Figure 32),
since at these pH the CH08 tyrosine is fully protonated or deprotonated, respectively.
Two major bands, observed at ~1649 and ~1543 cm-1, are assigned to amide I
(arising mainly from ν(C=O) with minor contributions from out-of-phase ν(C-N))
and amide II (mainly (N-H) and ν(C-N)) vibrations of the backbone chain,
respectively [94]. The second derivative, which can resolve overlapping components,
reveals the prevalence of either α-helix or unordered structures (these structures are
undistinguishable without comparison with measurements in D2O). Surprisingly,
β-sheets are also observable at pH 3.0 owing to the negative band at 1636 cm-1 [94].
The second component of β-sheets at 1682 cm-1 suggests the presence of antiparallel
β-hairpin [94]. Classical Tyr ring vibrations [95] ν(C=C) are clearly visible at
1618 cm-1, ν8a and 1518 cm-1, ν19a along with a weaker ν(C=C), ν8b ring vibration
[95] at 1599 cm-1. Thus we may conclude that CH08 exists in various geometries;

- 56 -
vibrational spectra contain a mixture of unordered structure and turn characteristics
together with that of β-hairpin at pH 3.0.
The most apparent spectral changes at pH 11.5 in respect to pH 3.0 are
connected with Tyr deprotonation. The band corresponding to tyrosine ring ν(C=C),
ν19a vibrations [95] at 1518 cm-1 is downshifted by 19 cm-1 at 1499 cm-1. The
tyrosinate is more polar than the neutral tyrosine and thus the intensity of several
other bands increases, e.g., ν(C=C) ring vibrations at 1600 cm-1, ν8a and 1522 cm-1,
ν8b. Moreover, it seems that the -hairpin structure nearly disappears at pH 11.5 and
disordered structure (at 1650 cm-1) with turns (at 1676 cm-1) prevails [94]. It
indicates that negative charges prevent the formation of any stable compact
secondary structure. The results of this experiment were also published in [II].
Figure 32. Infrared absorption spectra of CH08 in the region of amide I and amide II bands at
various pH. The red solid curves represent the original spectra (normalized) while the blue dash-dot
lines are their second derivatives (smoothed by Savitski-Golay function over 21 points).

- 57 -
4.2.6. Fluorescence and absorption pH dependence of JS01 oligopeptide
Sensitivity of JS01 segment of the MADS box to pH was studied by using
the same procedures of absorption and fluorescence measurements and data
treatment as in the case of CH08 (see chapter 4.2.1). JS01 contains as well as CH08
only one photosensitive amino acid – tyrosine. Therefore, very similar spectral sets
were obtained (data not shown). SVD analysis provided factor dimension of 2; the
pKa value determined by a fit of absorption data was
and that obtained from fluorescence
.
As in the case of CH08, perfect agreement of pKa constants was achieved for the two
kinds of spectroscopic characteristics. The lowering of pKa value in respect to free
tyrosine, which is even greater than in the case of CH08 oligopeptide, can be
explained by the presence of two positively charged arginines in the tyrosine closest
vicinity.
4.2.7. CD spectra of JS01 oligopeptide
CD spectra of JS01 oligopeptide were measured at two pH (water - pH 5.0;
sodium bicarbonate buffer - pH 11.0). Similarly to CH08 a negative band at 196 nm
was observed in the spectral region 190–240 nm at all measured pH. In neutral pH it
was accompanied by a negative shoulder around 230 nm whereas in the basic pH the
shoulder shifted to around 225 nm and its intensity increased (see Figure 33).
Bands at 196 nm and about 230 nm can be attributed to π-π* and n-π*
backbone transitions and assigned to revealing unordered conformation. Likewise
CH08, we assume that π-π* Bb transitions of the tyrosine in JS01 significantly
contribute to the weak spectral band observed at ~225 nm.
In spectral region 240-320 nm of distinct tyrosine bands a weak positive
spectral band around 276 nm was observed for the oligomer at neutral environment.
At basic pH it shifted to 294 nm and gained substantially keeping the sign of the

- 58 -
band. As in the case of CH08, this change of CD spectra corresponds to the acido-
basic transition from tyrosine to tyrosinate [89].
Figure 33. Electronic circular dichroism spectra of the JS01 oligopeptide in water pH 5.0 (green) and
in a sodium bicarbonate buffer pH 11.0 (blue).
4.2.8. Raman spectra of JS01 oligopeptide
Raman spectrum of JS01 (Figure 34) was measured in water at pH 5.0 and
treated according to the procedure described in chapter 3.2.3. Like CH08, JS01
contains one tyrosine residue and its vibrations appeared at approximately the same
wavenumbers (for neutral pH). ν8a and ν8b bands were observed at 1617 and 1604 cm-
1, respectively, ring deformation modes (C–H) at 1208 cm-1 and at 1177 cm-1
corresponding to ν9a with a contribution from C6H5–C stretching were also
distinguishable as well as the bands at 832 and 855 cm-1 of the Fermi doublet and
643 cm-1 band of the (CCC) deformation, ν6b.
Besides the tyrosine, JS01 contains also one phenylalanine residue whose
vibrations significantly contribute to Raman spectra. Among the in-plane ring
bending modes, noticeable are the strong trigonal breathing mode, ν12, at 1003 cm-1
and the weak degenerate mode of quadratic ring deformation ν6b at 621 cm-1 [96].
(C–H) deformation modes are present by bands at 1033 cm-1, ν18a; 1159 cm-1, ν15;
1170 cm-1, ν9a and 1466 cm-1, ν19b [96]. The band at 1206 cm-1 corresponds to ring C
stretching vibration. Quadratic ring stretching modes ν8b and ν8a appear at 1583 cm-1
and 1604 cm-1 respectively [96].

- 59 -
Figure 34. Raman spectrum of JS01 oligopeptide measured in water at pH 5.0. Most distinctive bands
are assigned according to the literature [71-72, 96-97].
Information about secondary structure can be derived from the position and
shape of the amide I and amide III bands. The amide I band is located at 1678 cm-1.
The amide III consists of two components (at 1246 cm-1 and 1265 cm-1) of
approximately the same intensity. Maximum of the amide I at ~1678 cm-1 points on a
possible presence of β-sheet, β-turns or β-hairpins along with random coil/unordered
structures. The two bands at 1246 and ~1265 cm–1 in the amide III region confirm
this conclusion [90-91]. It is in a general agreement with an estimation of the
secondary structure from the primary peptide sequence by GOR [92] and Chou and
Fasman [93] algorithms (data not shown).

- 60 -
4.2.9. Raman spectra of JS03 oligopeptide
Raman spectrum of JS03 (Figure 35) was measured in water at pH 5.0 and
treated according to the procedure described in chapter 3.2.3. Like JS01, JS03
contains one phenylalanine residue and its vibrations appeared at approximately the
same wavenumbers. Noticeable in-plane ring bending modes are the strong ν12 at
1003 cm-1 and the weak ν6b at 621 cm-1 [96]. (C–H) deformation modes are present
by bands at 728 cm-1 (ν11), 1033 cm-1 (ν18a), 1159 cm-1 (ν15), and a shoulder at 1470
cm-1 (ν19b) [76, 96]. The band at 1207 cm-1 corresponds to ring C stretching
vibration. Quadratic ring stretching modes ν8b and ν8a appear at 1584 cm-1 and
1605 cm-1 respectively [96].
The secondary structure is estimated from the position and shape of the
amide I and amide III bands at 1678 cm-1 and 1252 cm-1 respectively. Maximum of
the amide I at ~1678 cm-1 points on a possible presence of β-sheet, β-turns and β-
hairpins along with random coil/unordered structures. The band at 1252 cm–1 in the
amide III region confirms this conclusion [90-91]. It is in a general agreement with
the estimation of the secondary structure from the primary peptide sequence by GOR
[92] and Chou and Fasman [93] algorithms (data not shown). Based on this analysis
Figure 35. Raman spectrum of JS03 oligopeptide measured in water at pH 5.0. Most distinctive bands
are assigned according to the literature [71, 76, 96].

- 61 -
it may be stated that the JS03 tends to form β-hairpin structure (with about the same
probability as CH08) that is in a dynamical equilibrium with an unordered/random
coil structure.
4.2.10. Raman spectra of JS02 oligopeptide
Raman spectrum of JS02 (Figure 36) was measured in water at pH 5.0 and
treated according to the procedure described in chapter 3.2.3. Oligopeptide JS02 has
the same sequence as JS03 except a point mutation at position of phenylalanine
(Phe→Trp). Tryptophan vibrations significantly contribute to Raman spectra. Its
Fermi doublet appears at 1340 and 1360 cm-1 [76, 99]. The band at 877 cm-1
corresponds to mode ν17 [76, 99]. Indole ring vibrations appear at 1620 cm-1 (ν1
mode), 1579 cm-1 (ν2), 1553 cm-1 (ν3), 1012 cm-1 (ν16) and indole ring-breathing
vibration ν18 at 759 cm-1 [76, 100]. The band at 1130 cm-1 belongs to indole ring
bending and the bands at 1236 and 1253 cm-1 can be assigned to pyrrole ring
vibrations [101].
Figure 36. Raman spectrum of JS02 oligopeptide measured in water at pH 5.0. Most distinctive bands
are assigned according to the literature [71, 76, 99-101].

- 62 -
Secondary structure of this oligomer was determined similarly to its analog
JS03 described in the chapter 4.2.9. JS02 oligopeptide also tends to form a β-hairpin
structure (with about the same probability as CH08 and JS02) that is in a dynamical
equilibrium with an unordered/random coil structure.
4.3. Longer segments of MADS box
Oligopeptides of 42 amino-acid length (see Figure 37) were used to examine
interaction of the MADS box with its DNA target. These oligomers (residues 139-
180) contain the N-extension and α1-helix of the human SRF which is responsible
for DNA binding. The two tyrosines Y173 and Y158 serve as inner spectroscopic
probes sensitive to changes in their closest environment, therefore in different parts
of the oligopeptide. To determine, which part of the oligopeptide is influenced by the
interaction, two analogue sequences with a single point mutation (Tyr→Phe) in
either tyrosine position were employed as reference samples.
Figure 37. Longer model oligopeptides within the sequence of human SRF. Secondary structure
according to X-ray [26].
4.3.1. Raman spectra of longer oligopeptides
Raman spectra of JS04-6 (Figure 38) were measured in water at pH 4.0 and
treated according to chapter 3.2.3. The three spectra have been scaled to match the
intensities at 1447 cm-1. These oligomers contain both tyrosine and phenylalanine
residues whose vibrations dominate their spectra.
At pH 4, the pair of bands at 1617 and 1606 cm-1 corresponding to the in-
plane stretching vibrations of the tyrosine ring ν8a and ν8b, respectively, was observed.
Raman bands resulting from the ring deformations occur at 1208 cm-1 and at

- 63 -
1178 cm-1 (ν9a with a contribution from C6H5–C stretching) [71]. The bands at 831
and 854 cm-1 are assigned to the tyrosine Fermi resonance (modes ν1 and ν16a) [75].
The 644 cm-1 band corresponds to tyrosine ν6b mode.
Phenylalanine also generates numerous prominent Raman bands. Notable are
in-plane ring bending modes: the strong trigonal breathing mode ν12 at 1003 cm-1 and
the weak degenerate mode of quadratic ring deformation ν6b at 622 cm-1 [96, 102].
(C–H) deformation modes occur at 1032 cm-1 (ν18a) and 1159 cm-1, (ν15) [96]. Ring
C stretching vibration corresponds to the band at 1208 cm-1. The 1586 cm-1 and
1606 cm-1 lines result from quadratic ring stretching ν8b and ν8a, respectively [96].
Figure 38. Raman spectra of JS04, JS05, and JS06 oligopeptides measured in water at pH 4.0. Most
distinctive bands are assigned according to the literature [71, 75-76, 96, 102]. Besides the overall
spectra (A), details of important spectral regions are shown below: (B) Tyrosine Fermi doublet, (C)
Characteristic phenylalanine vibrations, (D) In-plane stretching vibrations of tyrosine and
phenylalanine rings.
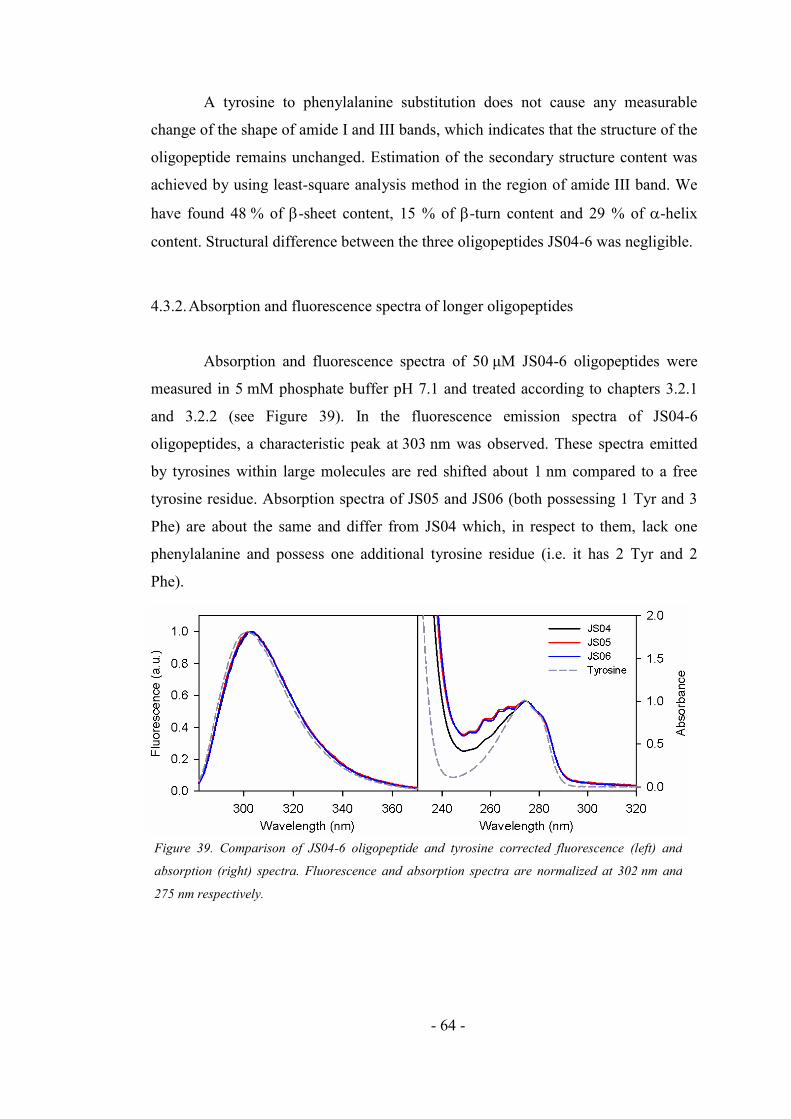
- 64 -
A tyrosine to phenylalanine substitution does not cause any measurable
change of the shape of amide I and III bands, which indicates that the structure of the
oligopeptide remains unchanged. Estimation of the secondary structure content was
achieved by using least-square analysis method in the region of amide III band. We
have found 48 % of -sheet content, 15 % of -turn content and 29 % of -helix
content. Structural difference between the three oligopeptides JS04-6 was negligible.
4.3.2. Absorption and fluorescence spectra of longer oligopeptides
Absorption and fluorescence spectra of 50 μM JS04-6 oligopeptides were
measured in 5 mM phosphate buffer pH 7.1 and treated according to chapters 3.2.1
and 3.2.2 (see Figure 39). In the fluorescence emission spectra of JS04-6
oligopeptides, a characteristic peak at 303 nm was observed. These spectra emitted
by tyrosines within large molecules are red shifted about 1 nm compared to a free
tyrosine residue. Absorption spectra of JS05 and JS06 (both possessing 1 Tyr and 3
Phe) are about the same and differ from JS04 which, in respect to them, lack one
phenylalanine and possess one additional tyrosine residue (i.e. it has 2 Tyr and 2
Phe).
Figure 39. Comparison of JS04-6 oligopeptide and tyrosine corrected fluorescence (left) and
absorption (right) spectra. Fluorescence and absorption spectra are normalized at 302 nm and
275 nm respectively.

- 65 -
4.4. MADS box
The conserved sequence of the MADS box forms a part of core domain of
many members of the MADS box family of transcription factors (see Figure 40).
Therefore its study may underline basic functional properties of the whole protein
family. Its N-terminal basic part enables DNA specific sequence recognition and
binding, whereas the C-terminal hydrophobic segment forms a protein dimerization
domain. The three tyrosine residues of the MADS box were used as spectroscopic
internal probes. To distinguish their individual contributions to the spectra and their
further characterization, the effect of small changes of the environmental conditions
especially the effect of pH and presence of variously charged quenchers were
examined. The results of the MADS box study are part of the submitted article [III].
Figure 40. The MADS box segment of human SRF. Secondary structure according to X ray [26].
The secondary structure of the MADS box has been first estimated from its
primary sequence using Chou and Fashman and GOR algorithms [III]. They
predicted that the C-terminal part (amino acids 181–197) folds into β-strands and
adopts a β-hairpin like topology, while the N-terminal part (amino acids 142–180)
forms a strand of alternating short β-sheet and -helical segments. This estimation
well corresponded to the analysis of the amide I and III bands of Raman spectra [III].
A 64-69 % of -sheet content, 22–25 % of -turn content and ~2 % of -helix
content was found. Structural difference between the MADS box at pH 4.5 and 7.0
was found to be negligible. The intensity of the tyrosine doublet I854/I828 = 1.3
reflected that the majority of tyrosines is placed on the surface of the peptide, and
exposed to weak or moderate H-bonding as both donors and acceptors.
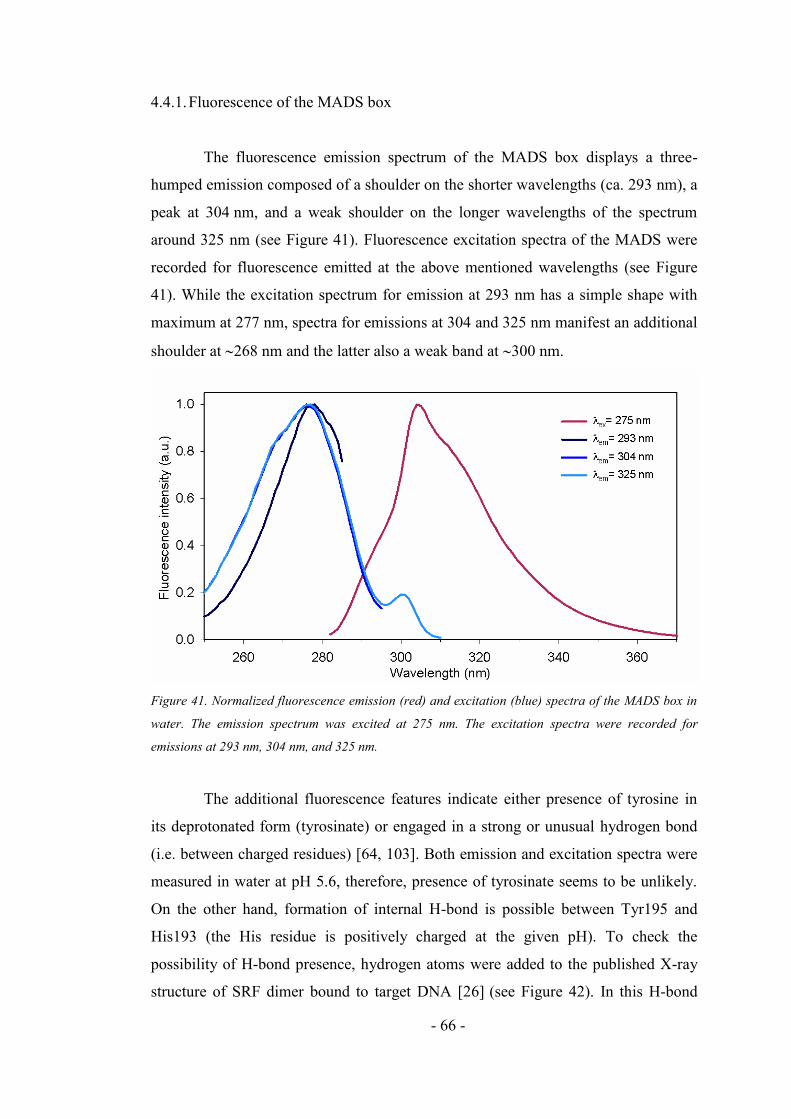
- 66 -
4.4.1. Fluorescence of the MADS box
The fluorescence emission spectrum of the MADS box displays a three-
humped emission composed of a shoulder on the shorter wavelengths (ca. 293 nm), a
peak at 304 nm, and a weak shoulder on the longer wavelengths of the spectrum
around 325 nm (see Figure 41). Fluorescence excitation spectra of the MADS were
recorded for fluorescence emitted at the above mentioned wavelengths (see Figure
41). While the excitation spectrum for emission at 293 nm has a simple shape with
maximum at 277 nm, spectra for emissions at 304 and 325 nm manifest an additional
shoulder at 268 nm and the latter also a weak band at 300 nm.
Figure 41. Normalized fluorescence emission (red) and excitation (blue) spectra of the MADS box in
water. The emission spectrum was excited at 275 nm. The excitation spectra were recorded for
emissions at 293 nm, 304 nm, and 325 nm.
The additional fluorescence features indicate either presence of tyrosine in
its deprotonated form (tyrosinate) or engaged in a strong or unusual hydrogen bond
(i.e. between charged residues) [64, 103]. Both emission and excitation spectra were
measured in water at pH 5.6, therefore, presence of tyrosinate seems to be unlikely.
On the other hand, formation of internal H-bond is possible between Tyr195 and
His193 (the His residue is positively charged at the given pH). To check the
possibility of H-bond presence, hydrogen atoms were added to the published X-ray
structure of SRF dimer bound to target DNA [26] (see Figure 42). In this H-bond

- 67 -
tyrosine probably acts as a proton acceptor and histidine as a donor (similar case is
described in Fernandez-Recio, 1999 [104]). The distance of H...O is ca. 1.91 Å,
which corresponds to the standard H-bond length. While the length 1.01 Å of the
chemical N–H bond in histidine is standard.
Figure 42. Possible H-bond formation between tyrosine and histidine in the X-ray structure of the
SRF MADS box [26] (visualized using the VMD [61]). The distance of H..O is ca.1.9 Å.
4.4.2. MADS box fluorescence quenching
To determine the accessibility of the tyrosine residues to solvent and
charges, quenching of 10 μM MADS box oligopeptide fluorescence by charged
quenchers (Cs+ and I–) were performed in 25 mM cacodylate buffer pH 6.5.
Increasing the concentration of the quencher a decrease of the fluorescence intensity
was observed, while the absorption spectra remained almost unaffected by the
quencher adding (data not shown). Measured spectra were treated as described in
chapter 3.2.1 and 3.2.2.
The sets of fluorescence spectra obtained for various concentrations of either
of the quenchers were individually subjected to factor analysis (SVD), for details see
chapter 3.3.1. In both cases the factor dimension equals to two, meaning that all
fluorescence spectra can be reconstructed as linear combinations of just two
subspectra, S1 and S2. Figure 43 shows the SVD results of the quenching by iodide.
By a fit of V1 and V2 dependences to Stern–Volmer equation (for details see chapter
3.3.2.) we obtained the same two major components of emission spectrum for both
quenchers, FI and FII (see Figure 44) for fluorescence components revealed by iodide
quenching).

- 68 -
Figure 43. The factor analysis (SVD) results of the MADS-box emission spectra quenched by iodide.
Red solid lines represent the fit of coefficients according to Stern-Volmer equation.
Figure 44. Two differently quenched spectral components (left) and their decreasing fractions in the
spectra of the MADS box with increasing iodide concentrations (right). Solid lines correspond to the
more efficiently quenched FI component and dashed lines to the second component FII.

- 69 -
Due to the similarity of SVD results for both quenchers (factor dimension of
two; similar shapes of subspectra S1 and S2; and also of the spectral components FI
and FII obtained by an analogous fit) a joint fit as described in chapter 3.3.2 was
performed (see Figure 45). Two common components, FI and FII were obtained (see
Figure 46) each of them characterized with a certain Stern–Volmer constant KQ, a
measure of the quenching efficacy. In particular, for spectral component FI:
KII = 33.2 7.0 M–1 and KI
Cs = 3.4 0.5 M–1 and, for component FII:
KIII = 2.5 0.8 M–1 and KII
Cs = 0.2 0.2 M–1.
Figure 45. The factor analysis (SVD) results of the MADS-box emission spectra quenched by iodide
(red triangles) and cesium (blue circles). Solid lines represent the fit of coefficients according to
Stern-Volmer equation.

- 70 -
Figure 46. Two differently quenched spectral components (left) and their Stern-Volmer representation
(right). Solid lines correspond to the more efficiently quenched FI component and dashed lines to the
second component FII. Circles and red color correspond to Cs+, triangles and blue to I– quenching.
The more efficiently quenched component FI possesses the more
complicated shape (with maximum at 304 nm). The spectral shape of the less
efficiently quenched component FII is simpler and similar to the emission spectra of
free tyrosine. The ratios of Stern-Volmer constants of iodide over caesium KI/KCs are
nearly the same for both components FI and FII and amount to about 10. It means that
iodide quenches fluorescence of both components significantly more efficiently than
caesium, while the Stern-Volmer constant ratio KI/KII remains similar independently
on the quencher charge.
The Stern-Volmer constant depends on the efficiency of the quencher as well
as the quencher diffusion and its influencing by electrostatic effects [105]. As I– and
Cs+ provide a pair of quenchers with opposite charges and similar diffusion
parameters [105], it could be anticipated that due to their different charge they would
quench preferentially tyrosines surrounded by environment of opposite charge.
Contrary to this assumption the same ratio of the Stern–Volmer constant KI /KCs was
observed for both components FI and FII. Therefore, the quenching mainly resolves
the global solvent accessibility and does not differentiate between various
microenvironments of the Tyr residues.
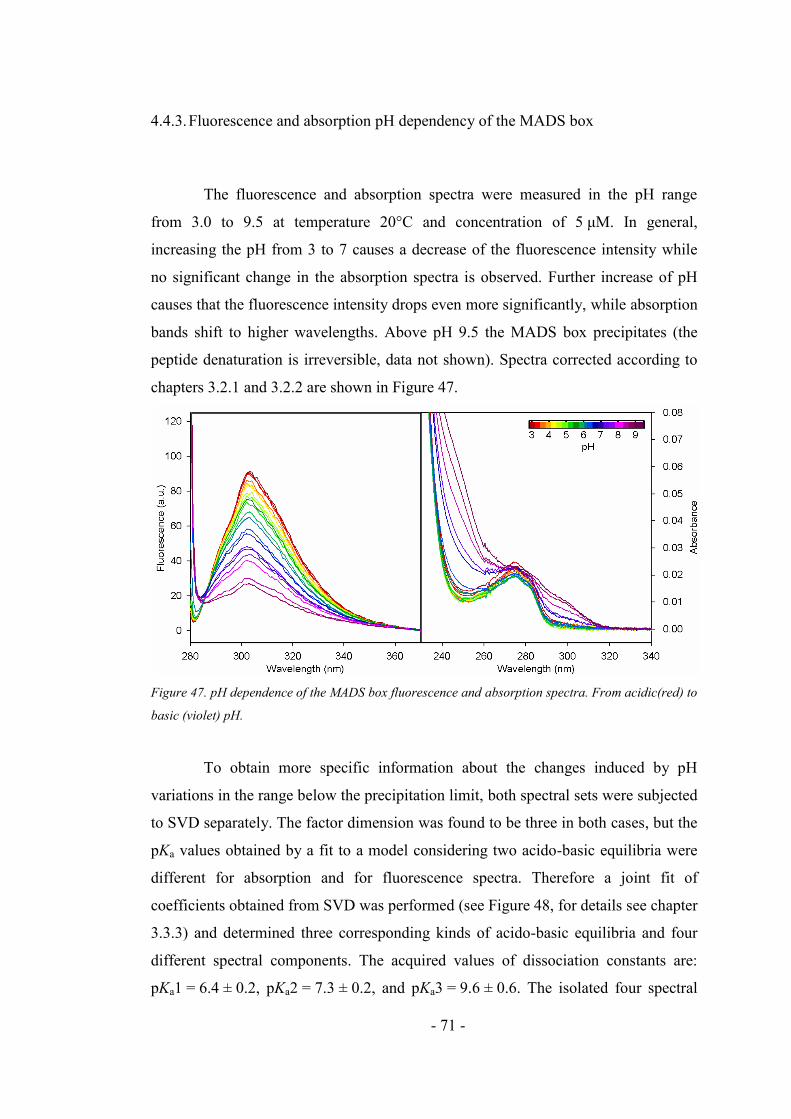
- 71 -
4.4.3. Fluorescence and absorption pH dependency of the MADS box
The fluorescence and absorption spectra were measured in the pH range
from 3.0 to 9.5 at temperature 20°C and concentration of 5 μM. In general,
increasing the pH from 3 to 7 causes a decrease of the fluorescence intensity while
no significant change in the absorption spectra is observed. Further increase of pH
causes that the fluorescence intensity drops even more significantly, while absorption
bands shift to higher wavelengths. Above pH 9.5 the MADS box precipitates (the
peptide denaturation is irreversible, data not shown). Spectra corrected according to
chapters 3.2.1 and 3.2.2 are shown in Figure 47.
Figure 47. pH dependence of the MADS box fluorescence and absorption spectra. From acidic(red) to
basic (violet) pH.
To obtain more specific information about the changes induced by pH
variations in the range below the precipitation limit, both spectral sets were subjected
to SVD separately. The factor dimension was found to be three in both cases, but the
pKa values obtained by a fit to a model considering two acido-basic equilibria were
different for absorption and for fluorescence spectra. Therefore a joint fit of
coefficients obtained from SVD was performed (see Figure 48, for details see chapter
3.3.3) and determined three corresponding kinds of acido-basic equilibria and four
different spectral components. The acquired values of dissociation constants are:
pKa1 = 6.4 ± 0.2, pKa2 = 7.3 ± 0.2, and pKa3 = 9.6 ± 0.6. The isolated four spectral

- 72 -
components of fluorescence emission (FA, FB, FC, FD) and of UV absorption (FA’,
FB’, FC’, FD’) are shown in Figure 49.
Figure 48. The factor analysis (SVD) results of both fluorescence and absorption spectral pH titration
of the MADS box shown in common graphs. Solid curves inside the graphs of coefficients show the
joint fit according to the model of three acido-basic equilibria.

- 73 -
Figure 49. Absorption spectral components FA’, FB’, FC’, FD’ (lower right) and fluorescence spectral
components FA, FB, FC, FD (lower left) extracted by a joint fit of the SVD results of the MADS-box pH
titration. Relative occurrences of particular components at various pH are shown in the upper graph.
Absorption components FA’ and FB’ are nearly identical. They resemble the
absorption spectrum of free tyrosine and differ from each other only by a
multiplication factor close to unity. FD’ component resembles the spectrum of free
tyrosinate, but still contains some tyrosine contribution. It is probably caused by the
restriction of the upper pH limit of the measurement to 9.5 (due to the strong sample
precipitation). Component FC’ represents a state where part of tyrosines is converted
into tyrosinate form. We may consider two possible combinations: (i) 2×Tyr and
1×tyrosinate or (ii) 1×Tyr and 2×tyrosinate. The resulting spectra, given by such
combination of FB’ and FD’ components, are shown in Figure 50. It is obvious that the
variant (i) corresponds, in contrast to the variant (ii), well to the spectral shape of FC’
component.
In fluorescence, FD component shows only a subtle fluorescence, thus it can
be assigned to tyrosinate (consistently with absorption). Normalized components FC
and FB resemble each other; however, FC has notably stronger fluorescence above

- 74 -
330 nm. It points out that some of tyrosines are transformed into tyrosinate form.
Similarly to absorbance, FC component can be expressed as linear combination of FB
and FD components in the ratio corresponding to two tyrosines and one tyrosinate
(see Figure 50). Normalized components FA and FB differ in the region below
305 nm and around 315 nm, and they are nearly identical above 335 nm (see Figure
51). The difference (FA – FB) is characterized by an absence of low frequency
shoulder at 295 nm. A sharp increase is observed up to 304 nm (maximum), then
shoulder at 315 nm and subsequent decrease of the signal at higher wavelengths.
The apparent analogy of (FA – FB) spectral shape with the effect of
excitation wavelength on fluorescence spectrum indicates relation between the acido-
basic equilibrium with pKa1 and a change of Tyr195 H-bonding to His193. This
Figure 50. FC (and FC’) fluorescence (and absorption) component and its comparison with two
considered linear combination of FB and FD (FB’and FD’) components.
Figure 51. Comparison of components FA and FB and their difference spectrum. All spectra are
normalized at their maxima.

- 75 -
leads to interpretation of the acido-basic transition as a deprotonation of His193. The
pKa of free histidine side chain is 6.0 [3]; this value can be higher when His is inside
the peptide chain: The pKa of His34 in wild-type apoflavodoxin is 6.36 [104]; pKa
values of protein histidinyl residues in unfolded proteins were found in the interval
6.5-6.6 [106-108]. Further, it is known that H-bonds between His and Tyr are
stabilizing even in the case of a charged form of His (0.7 kcal/mol) [104]. For the
neutral form of His, the energy of H-bond is higher (1.3 kcal/mol). Computations in
vacuum imply that H-bond between Tyr and charged His is stronger due to more
negative enthalpy [109], however, this decrease of enthalpy is outweighed by
increase of entropy (desolvation penalty). In our case, we assume that H-bond is
formed between His193 a Tyr195, the excited state of which is affected while His is
present in its charged form. This leads to a decrease of the fluorescence contribution
(FA – FB) during the acid-base transition.
Based on the conclusions mentioned above the basic interpretation of the
three acido-basic transitions is possible (see Figure 52). The first acid-base transition,
given by pKa1 = 6.4 ± 0.2, connected with minimal change in the absorption
spectrum (i.e., spectra indicate presence of only tyrosines and no tyrosinate) and with
significant change in the fluorescence spectrum, can be assigned to deprotonation of
His193. Between pKa1 and pKa2 the prevailing is the state when all tyrosines remain
in a neutral form, tyrosines Tyr173 and Tyr158 are H-bonded to the water milieu and
Tyr195 to neutral His193 (This is supported by the tyrosine Fermi doublet in Raman
spectrum [III]). During the second acid-base transition with pKa2 = 7.3 ± 0.2, one of
tyrosines is deprotonated. The last pKa3 = 9.6 ± 0.6 corresponds to deprotonation of
remaining two tyrosines.
A considerable lowering of one of the tyrosines pKa (to 7.3) was observed,
when compared to pKa of a free tyrosine (10.0) [3]. Such a decrease in pKa is
probably caused by presence of positively charged amino acids in a proximity to
tyrosine. This effect was described for the case of tyrosine in the vicinity of Lys or
Arg residues in literature [110-111]. The pKa of tyrosine residues was discerned
within short oligopeptide segment of the MADS box in the vicinity of Tyr158,
154KLRRYTTFS162, and Tyr173, 168IMKKAYEL175 (for details see chapters 4.2.1
and 4.2.6). The dissociation constants of Tyr173 and Tyr158 were determined as 9.5
and 9.0, respectively. The decrease of pKa value of Tyr173 is caused by proximity of
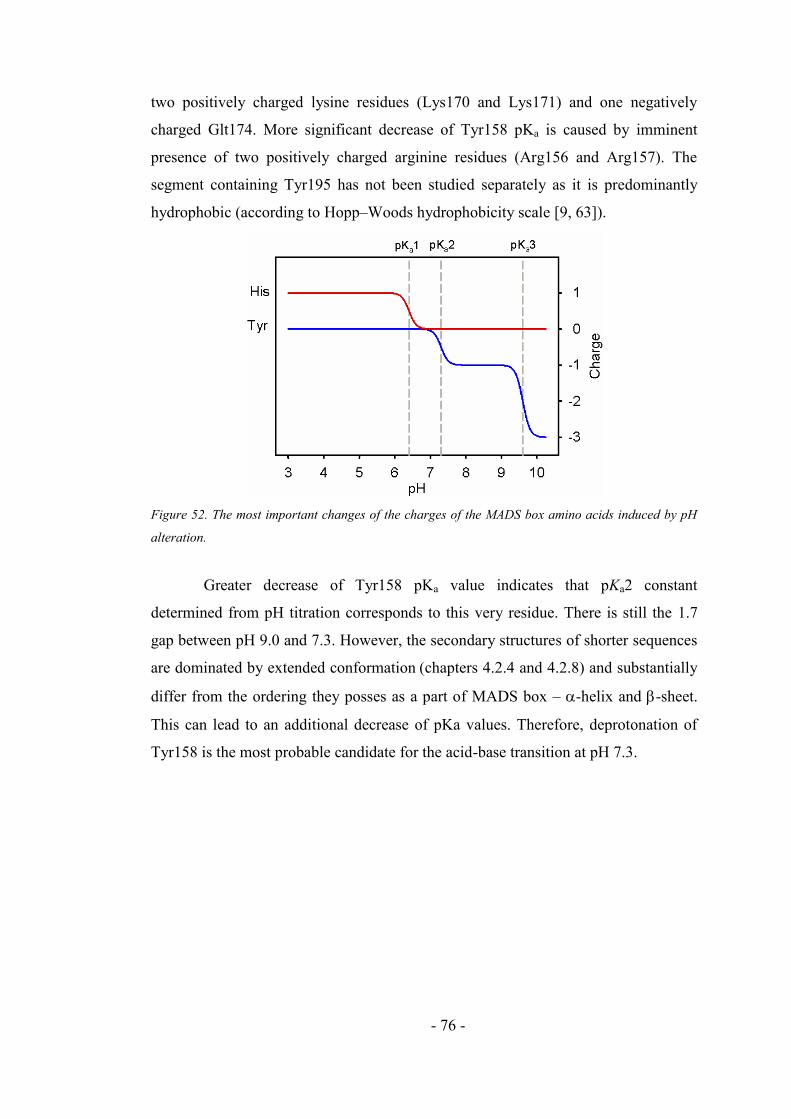
- 76 -
two positively charged lysine residues (Lys170 and Lys171) and one negatively
charged Glt174. More significant decrease of Tyr158 pKa is caused by imminent
presence of two positively charged arginine residues (Arg156 and Arg157). The
segment containing Tyr195 has not been studied separately as it is predominantly
hydrophobic (according to Hopp–Woods hydrophobicity scale [9, 63]).
Figure 52. The most important changes of the charges of the MADS box amino acids induced by pH
alteration.
Greater decrease of Tyr158 pKa value indicates that pKa2 constant
determined from pH titration corresponds to this very residue. There is still the 1.7
gap between pH 9.0 and 7.3. However, the secondary structures of shorter sequences
are dominated by extended conformation (chapters 4.2.4 and 4.2.8) and substantially
differ from the ordering they posses as a part of MADS box – -helix and -sheet.
This can lead to an additional decrease of pKa values. Therefore, deprotonation of
Tyr158 is the most probable candidate for the acid-base transition at pH 7.3.

- 77 -
4.5. Peptide/DNA interaction
The interaction between the MADS box and DNA was found to be so strong
that in concentrations necessary for Raman measurements it immediately precipitated
(data not shown). It was known that interaction of tyrosyl residues with nucleic acids
leads to a quenching of tyrosine fluorescence [112-5]. Therefore fluorescence and
absorption titration experiments were employed to test whether the interaction
between the two partners can be examined by using the methods of electron optical
spectroscopy. Two types of experiments were performed. Either the oligonucleotide
solution was gradually added to oligopeptide sample, or vice versa. In both cases a
parallel experiment was performed using solutions with added 0.5 M NaCl to prevent
interaction between DNA and the peptide [112].
4.5.1. Addition of the oligonucleotide to the oligopeptide sample
5.7 μM solution of modSRE oligonucleotide was gradually added to
35.3 μM solution of JS06 oligopeptide and simultaneously to the solution of JS06
oligopeptide containing 0.5 M NaCl. All samples were dissolved in 5 mM phosphate
buffer pH 7.1; solutions without oligopeptides were also prepared and employed as
reference.
Addition of the oligonucleotide resulted in immediate precipitation. Increase
of the solution turbidity brought about an additive background to absorption
spectrum (see Figure 53, solution without added NaCl). No such effect was observed
in spectra of solution with NaCl, where the only visible change is the increase of the
absorption band (with maximum at 260 nm) caused by gradual adding the
oligonucleotide solution.
Addition of the oligonucleotide caused increase of the elastic scattering of
the incident light within fluorescence spectra (see Figure 54). Fluorescence
quenching was not observed in such a low ratios of modSRE:JS06.

- 78 -
Figure 53. Measured absorption spectra of modSRE addition to JS06 sample. (i) Samples in buffer.
(ii) Samples in buffer and 0.5 M NaCl. Solid lines correspond to solutions with oligopeptide, dashed
lines to reference solutions.
Figure 54. Corrected fluorescence spectra of modSRE addition to JS06 sample. (i) Samples in buffer.
(ii) Samples in buffer and 0.5 M NaCl. Spectra were corrected for IFE*, Raman scattering,
background and dilution (as described in chapters 3.2.1 and 4.1.1).
Factor analysis (SVD) of fluorescence spectra gave two dimensions (Figure
55). The first subspectrum shows average spectral shape partly distorted by elastic
scattering. Second subspectrum, representing the main spectral change, shows
mainly the effect of Rayleigh elastic scattering of the excitation light. The presence
of the scattering within the spectra is linearly dependent on DNA/protein ratio (see
coefficients V2). This can be explained by a single oligonucleotide binding many
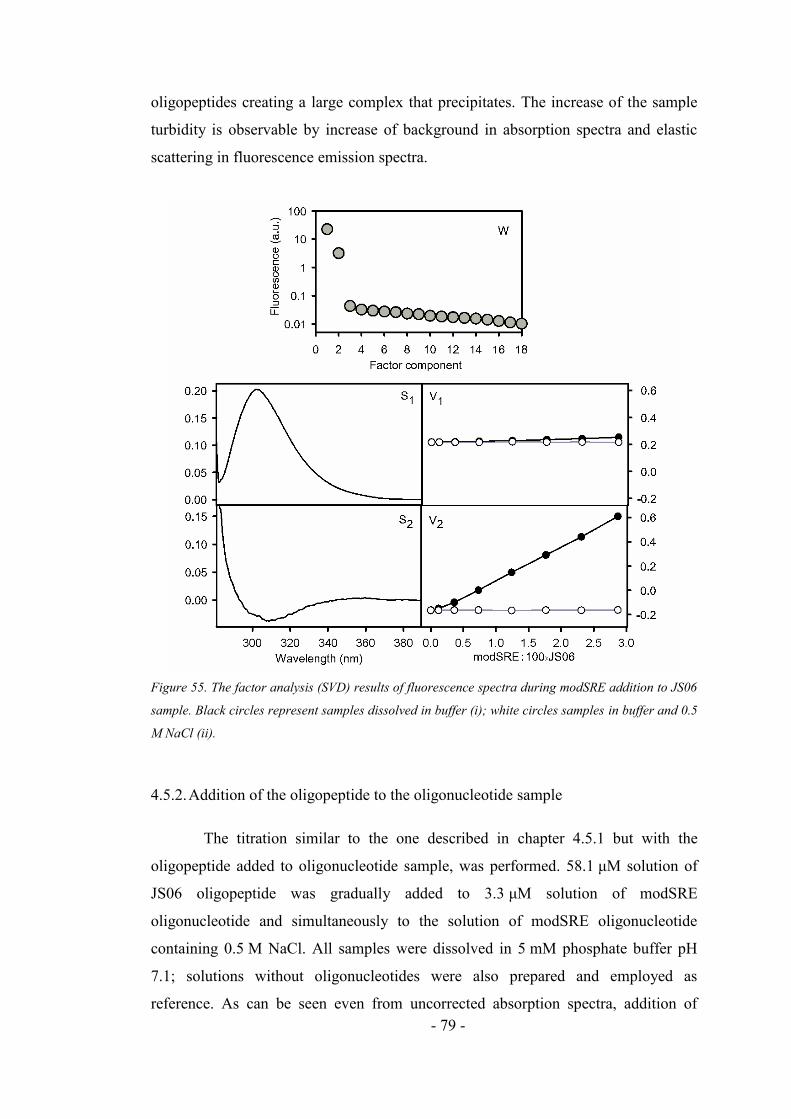
- 79 -
oligopeptides creating a large complex that precipitates. The increase of the sample
turbidity is observable by increase of background in absorption spectra and elastic
scattering in fluorescence emission spectra.
Figure 55. The factor analysis (SVD) results of fluorescence spectra during modSRE addition to JS06
sample. Black circles represent samples dissolved in buffer (i); white circles samples in buffer and 0.5
M NaCl (ii).
4.5.2. Addition of the oligopeptide to the oligonucleotide sample
The titration similar to the one described in chapter 4.5.1 but with the
oligopeptide added to oligonucleotide sample, was performed. 58.1 μM solution of
JS06 oligopeptide was gradually added to 3.3 μM solution of modSRE
oligonucleotide and simultaneously to the solution of modSRE oligonucleotide
containing 0.5 M NaCl. All samples were dissolved in 5 mM phosphate buffer pH
7.1; solutions without oligonucleotides were also prepared and employed as
reference. As can be seen even from uncorrected absorption spectra, addition of

- 80 -
oligopeptide causes precipitation when certain peptide/DNA ratio is exceeded (see
Figure 56, solution without added NaCl). The precipitation increases the solution
turbidity, which brings about an additive background to absorption spectrum. No
such effect is seen in spectra of solution with NaCl, where the only visible change is
the slight decrease of the DNA absorption band (with maximum at 260 nm). It is
caused by dilution of the oligonucleotide sample by gradual adding the oligopeptide
solution with about hundredfold lower extinction coefficient.
Absorption spectra were treated as described in chapter 3.2.2. Figure 57
shows the results of factor analysis (SVD). Factor dimension is three in this case. S1
represents the average spectral shape, S2 shows mainly the distortion resulting from
the precipitation of the sample and S3 shows the spectral change that might be a
result of peptide/DNA interaction, since its contribution increases (see coefficients
V3) with increase of the oligopeptide concentration till the precipitation appears (in
the solution without NaCl).
Figure 56. (i) Measured absorption spectra of modSRE solution during gradual addition of JS06 ;
(ii) the same experiment for solution with 0.5 M NaCl. Solid lines correspond to the
oligonucleotide solution, dashed lines to JS06 added to the reference solvent.

- 81 -
Figure 57. Factor analysis (SVD) of JS06 addition to modSRE solution monitored by UV absorption.
Black circles correspond to mixed solutions in buffer, white circles to solutions where peptide/DNA
interaction was prevented by high salinity (0.5 M NaCl).
To examine the interaction in closer detail, SVD was next applied only to the
low peptide/DNA ratios (see Figure 58). In this case the factor dimension was two.
S1 represents the average spectral shape, S2 shows the main spectral change. No
significant change of the overall absorption intensity was observed (see coefficients
V1 ). Coefficients V2, on the other hand, show that the main spectral change S2 is
significant only in a solution without NaCl and thus can be assigned to
JS06/modSRE interaction.

- 82 -
Figure 58. Factor analysis (SVD) of JS06 addition to modSRE solution monitored by UV absorption,
limited for low peptide concentrations when no clear signs of precipitation were observed. Black
circles correspond to mixed solutions in buffer, white circles to solutions where peptide/DNA
interaction was prevented by high salinity (0.5 M NaCl).
Besides the absorption spectra described above, fluorescence spectra were
also measured within the titration experiment (see Figure 59). In both reference
solutions (with and without NaCl content) the addition of the JS06 oligopeptide
resulted in the same increase of tyrosine emission. This confirms that the high
salinity of the solution doesn’t affect the peptide. Due to the inner filter effect the
intensity of the JS06 oligopeptide in solution with both the modSRE oligonucleotide
and NaCl was lower than in corresponding reference solution (corrected spectra are
shown in Figure 60). On the other hand in the case of the solution without NaCl, the
oligonucleotide caused nearly complete quenching of tyrosine fluorescence. The
measured spectra represented mainly Raman spectrum of water for lower
oligopeptide concentrations). Exceeding 1:1 concentration ratio of JS06:modSRE,
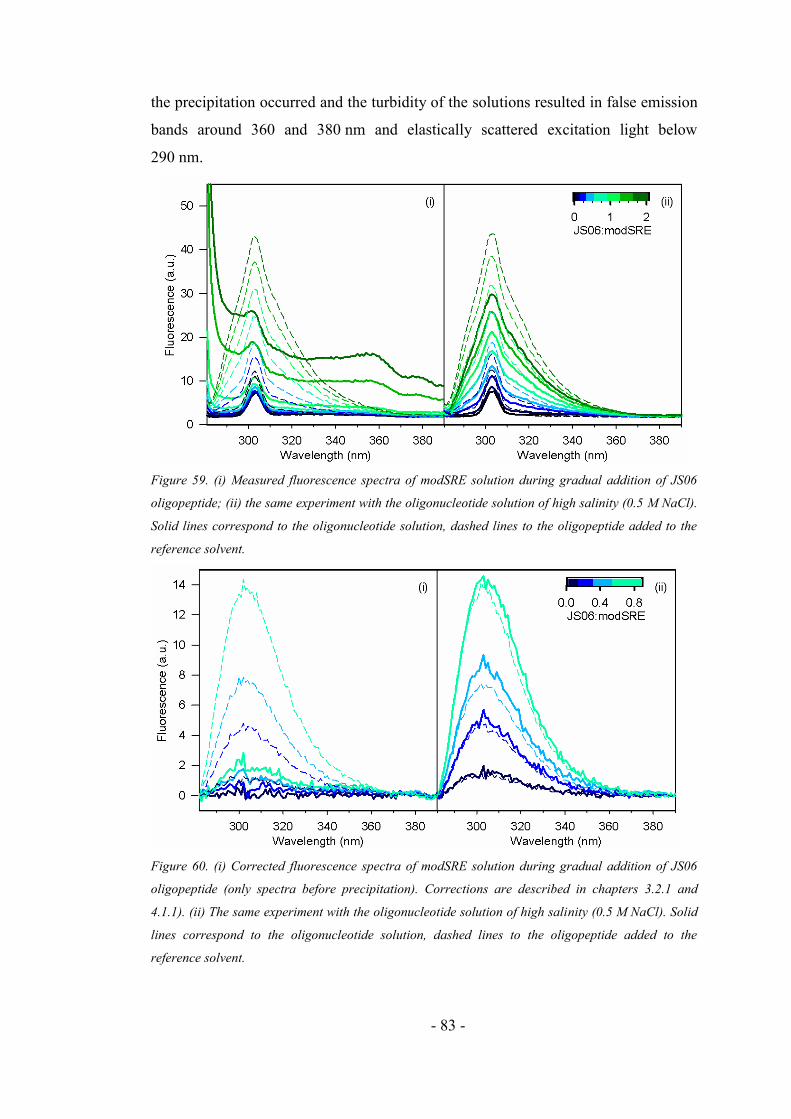
- 83 -
the precipitation occurred and the turbidity of the solutions resulted in false emission
bands around 360 and 380 nm and elastically scattered excitation light below
290 nm.
Figure 59. (i) Measured fluorescence spectra of modSRE solution during gradual addition of JS06
oligopeptide; (ii) the same experiment with the oligonucleotide solution of high salinity (0.5 M NaCl).
Solid lines correspond to the oligonucleotide solution, dashed lines to the oligopeptide added to the
reference solvent.
Figure 60. (i) Corrected fluorescence spectra of modSRE solution during gradual addition of JS06
oligopeptide (only spectra before precipitation). Corrections are described in chapters 3.2.1 and
4.1.1). (ii) The same experiment with the oligonucleotide solution of high salinity (0.5 M NaCl). Solid
lines correspond to the oligonucleotide solution, dashed lines to the oligopeptide added to the
reference solvent.
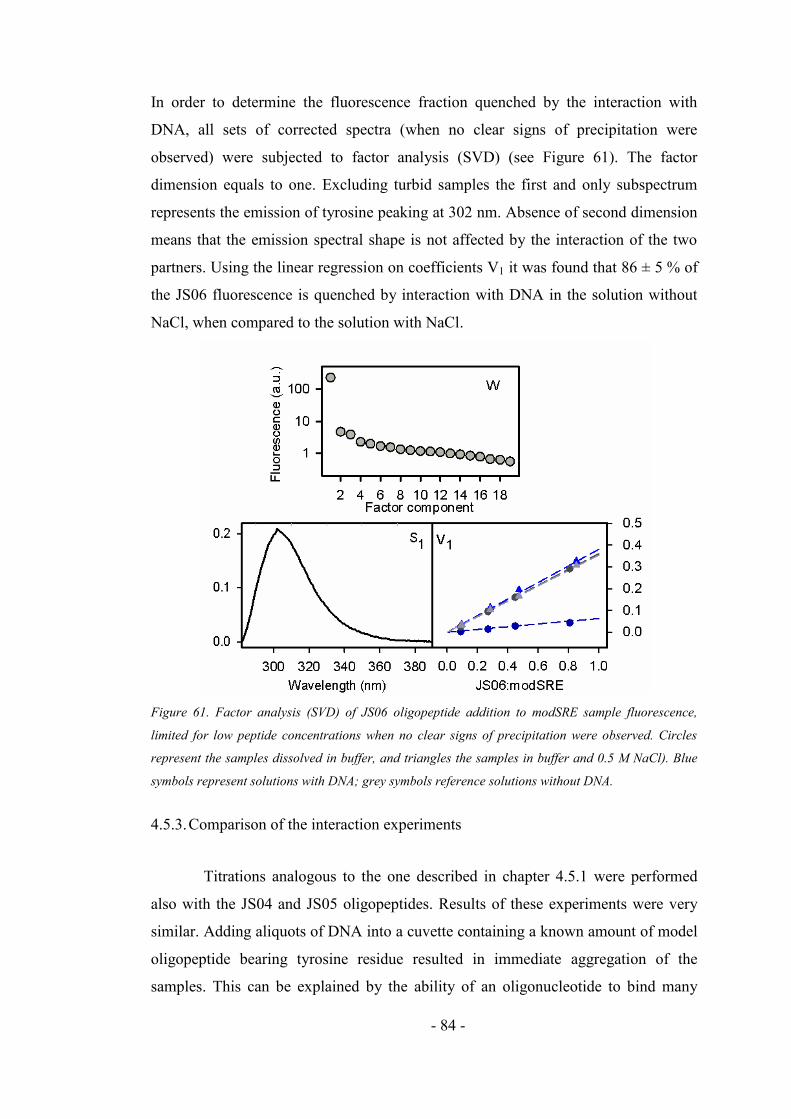
- 84 -
In order to determine the fluorescence fraction quenched by the interaction with
DNA, all sets of corrected spectra (when no clear signs of precipitation were
observed) were subjected to factor analysis (SVD) (see Figure 61). The factor
dimension equals to one. Excluding turbid samples the first and only subspectrum
represents the emission of tyrosine peaking at 302 nm. Absence of second dimension
means that the emission spectral shape is not affected by the interaction of the two
partners. Using the linear regression on coefficients V1 it was found that 86 ± 5 % of
the JS06 fluorescence is quenched by interaction with DNA in the solution without
NaCl, when compared to the solution with NaCl.
Figure 61. Factor analysis (SVD) of JS06 oligopeptide addition to modSRE sample fluorescence,
limited for low peptide concentrations when no clear signs of precipitation were observed. Circles
represent the samples dissolved in buffer, and triangles the samples in buffer and 0.5 M NaCl). Blue
symbols represent solutions with DNA; grey symbols reference solutions without DNA.
4.5.3. Comparison of the interaction experiments
Titrations analogous to the one described in chapter 4.5.1 were performed
also with the JS04 and JS05 oligopeptides. Results of these experiments were very
similar. Adding aliquots of DNA into a cuvette containing a known amount of model
oligopeptide bearing tyrosine residue resulted in immediate aggregation of the
samples. This can be explained by the ability of an oligonucleotide to bind many

- 85 -
oligopeptides creating a large precipitating complex. Thus the standard Stern-Volmer
characterisation of fluorescence quenching mechanism (described in chapter 3.3.2)
could not be applied.
On the other hand, when the oligopeptide was added to the oligonucleotide
solution (chapter 4.5.2.) no such behaviour was observed. Titrations analogous to the
one described in chapter 4.5.2. were also performed with oligopeptides JS05 and
JS04 and different oligonucleotides (see Table 5). Results of these experiments were
very similar. The addition of oligopeptide caused precipitation only when the ratio
1:1 peptide:ssDNA was exceeded (in the case of the duplex DNA the ratio 2:1
peptide:dsDNA). Probably each oligopeptide binds preferentially to unengaged
oligonucleotide and form a complex which is smaller and do not form a precipitate.
Consecutive addition of oligopeptide to the oligonucleotide solution lead to
increase of the tyrosine emission, but with lower quantum yield than in the solution
without DNA. This is in agreement with the literature [112, 114-115] stating that the
interaction of tyrosine with DNA causes quenching of its fluorescence emission.
In all cases a parallel experiment was performed using solutions with added
0.5 M NaCl. Similarly to literature [112, 114] it was observed that addition of salt to
the solution hampered the quenching of tyrosine by DNA. The quantum yield of the
tyrosine in the solution with and without DNA content was about the same. Na+ ions
probably interact with the phosphate backbone of the DNA [114] preventing the
peptide/DNA interaction.
Table 5. Summary of interaction experiments – decrease of tyrosine quantum yield comparing the
solution with and without DNA (additions of oligopeptide to oligonucleotide solution).
oligopeptide JS06 (Y158)
JS05 (Y173)
JS04 (Y158, Y173) oligonucleotide
ss modSRE 86 ± 5 % 46 ± 5 % 71 ± 6 %
ss SREfos 74 ± 5 %
ds modSRE 65 ± 5 %

- 86 -
The addition of the oligopeptides to the oligonucleotide solution can be well
compared. Fitting of factor analysis (SVD) fluorescence results limited for low
peptide concentrations (when no clear signs of precipitation were observed) served
for determination of the fraction of the oligopeptide emission statically quenched
after its binding to the oligonucleotide. Comparing the results of the various fits it
can be stated that the tyrosine Y173 is quenched by 46 ± 5 % (in JS05), while Y158
by 86 ± 5 % (in JS06), by the interaction with the single stranded modSRE.
According to our assumptions the fraction of quenched fluorescence of the JS04
oligopeptide bearing both tyrosines is in between of the two previous values, i.e.
71 ± 5 %. Result of joint factor analysis of oligopeptide JS04-6 additions to the
modSRE oligonucleotide solution is shown in Figure 62. The factor dimension
equals to one. Increase of the first coefficients depends on the quenched fraction of
the fluorescence already described in previous paragraph.
Figure 62. Factor analysis (SVD) of JS04-6 oligopeptide addition to modSRE oligonucleotide sample
fluorescence limited for low peptide concentrations. All spectra were normalized according to
reference solution. Circles represent samples dissolved in buffer; triangles samples in reference
solution without DNA. Black symbols represent JS05; red JS06 and blue JS04 oligopeptide.
Furthermore the JS06 additions to SREfos and ds modSRE (duplex of
modSRE and modSREcompl) oligonucleotides were performed. From the separate

- 87 -
analyses of the fluorescence spectra (Table 5) it may be deduced that modSRE
quenches the fluorescence of the JS06 more effectively (86 ± 5 %) than SREfos
(74 ± 5 %) and ds modSRE (65 ± 5 %).
As a result it may be stated that the MADS-box N-terminal segments
possess high affinity to deoxyoligonucleotides, forming soluble complexes when the
concentration ratios is optimal for 1:1 stoichiometry, but creating precipitating
complexes in the case of the oligopeptide excess. No remarkable binding specificity
distinguishing single and double stranded DNA was though observed. Nevertheless,
a feasible way for monitoring DNA/MADS-box protein interactions was
demonstrated by these pilot experiments.
- 88 -
5. Conclusions
The thesis was devoted to investigation of physico-chemical properties of the
Human SRF MADS box in respect to its biological function. The study of the MADS
box and its oligopeptide segments was performed in aqueous solution by using a
wide range of spectroscopic techniques. The three tyrosine residues (Tyr158, Tyr173
and Tyr195) of the MADS box located in differently charged and differently
hydrophobic amino-acid vicinities were used as spectroscopic inner probes.
Accordingly a great attention was paid to their spectroscopic characterization. To
distinguish their individual contributions to the MADS-box spectra and to reveal
their particular physico-chemical characteristics, subtle spectral changes caused by
varied environmental conditions were visualized by means of factor analysis. An
approach based on a least square fit of the multi-wavelength spectroscopic pH
titration data to an adequate thermodynamic model, was developed for determination
of pKa constants and spectral characteristics of variously protonated tyrosine forms
(published in [I]). It was revealed that the positively charged amino acids in the
vicinity of the tyrosine residues Tyr158 and Tyr173 inside short MADS-box
segments reduce pKa value in respect to a free tyrosine (9.0 and 9.5 versus 10.0).
The structural properties of the short MADS-box segment around Tyr173 in
dependence on the tyrosine protonation state were investigated in details by Raman
scattering, infrared and circular dichroism spectroscopies in combination with
molecular dynamics simulations (MDS) and density functional theory calculations
(published in [II]). The major spectral changes were attributed to the tyrosine
deprotonation. All techniques also proved that the short oligopeptide doesn’t have a
stable secondary structure and exists in a state of dynamical equilibrium among
several conformations mostly close to the beta turn, unordered conformation and
extended structure. Nevertheless, the quantum chemical calculations of vibrational
states of the most populated oligopeptide geometries (obtained by MDS) enabled to
simulate Raman spectra for both tyrosine forms. Our approach seems to be generally
applicable as a useful tool for study of short oligopeptides.
A thorough study of the MADS box was performed using fluorescence, UV-
absorption and Raman spectroscopy, in order to disclose its behavior and basic
functional properties in aqueous environment (results published in [III]). The
secondary structure of the MADS box was estimated to 64–69 % of -sheet content,

- 89 -
22–25 % of -turn content and only ~2 % of -helix content by analysis of the amide
I and III bands of Raman spectra, without any remarkable sensitivity to pH changes.
Using factor analysis a two-component fluorescence quenching was revealed and
corresponding Stern–Volmer constants determined. Their values indicated prevailing
diffusion-limited mechanism of quenching. Simultaneous fit of the results obtained
by factor analyses of both UV-absorption and fluorescence pH titration data led to
determination of three dissociation constants pKa1 = 6.4 ± 0.2, pKa2 = 7.3 ± 0.2, and
pKa3 = 9.6 ± 0.6. Critical comparison of all experiments identified the deprotonation
of His193 (hydrogen bonded to Tyr195) as the transition connected with the acid-
base equilibrium corresponding to pKa1 and that of Tyr158 as a candidate for pKa2.
The occurrence of two acid-basic transitions close to a neutral pH leads to a
variability in possible electrostatic interactions which seem to be together with the
structural flexibility advantageous for recognition and binding to the DNA target.
Attempts to monitor at lower concentrations the interaction between DNA
and longer segments of the MADS box, which represented its N-terminal part or
analogs with a single point mutation, were performed by UV absorption and
fluorescence spectroscopies. It was found out that adding even small aliquots of
deoxyoligonucleotides into ~ 3×10⁻⁵ M oligopeptide solution resulted in immediate
precipitation of the sample. This was explained by a capability of
deoxyoligonucleotide to bind many MADS-box oligopeptides creating a large
precipitating complex. On the other hand, when the oligopeptide was added to the
oligonucleotide solution no precipitation was observed (until a molecular ratio 1:1
was reached). Comparing the fluorescence spectra with those of the samples where
the oligopeptide was added to a deoxyoligonucleotide solution containing 0.5 M
NaCl (which prevents the interaction), it was possible to determine partial quenching
of the tyrosine fluorescence. No remarkable binding specificity resolving single
stranded and double stranded DNA was though observed. Nevertheless, these pilot
experiments showed a feasible way for monitoring DNA/MADS-box protein
interactions in future studies.
The acquired data provided a number of physico-chemical characteristics of
the MADS box and its segments concerning the structural properties and protonation
states. This has gained the understanding to the behaviour of the MADS box and
thereby the whole MADS box family of transcription factors. Our results can be

- 90 -
concluded on the fact that the MADS box as an isolated protein exhibits high
structural and charge variability enabling to effectively bind to DNA. Reaching the
structural arrangement necessary for the recognition and binding to the specific target
DNA site requires, though, additional intra- and intermolecular interactions including
also the parts of transcription factors situated outside the MADS box domain. The
study should therefore continue in the future by investigation of larger parts or even
complete molecules of MADS-box transcription factors employing (where possible)
the methodological approaches developed and proved within this doctoral work.

- 91 -
6. Dissemination of the thesis results
The results of the thesis were published in two articles in the following two papers
available online and one article was currently submitted.
Articles:
[I] ŘEZÁČOVÁ B., COIC Y.M., ZENTZ C., TURPIN P.Y., ŠTĚPÁNEK J.
Spectroscopic Determination of pKa Constants of MADS Box Segments.
Spectrosc. Int. J. 2012, 27, 455-461. ISSN: 0712-4813.
Published also as a book chapter in: MARQUES M.P., BATISTA DE
CARVALHO L.A.E., HARIS P.I. Spectroscopy of Biological Molecules,
Amsterdam: IOS Press BV, 2013. ISBN 978-1-61499-183-0.
[II] PROFANTOVÁ B., PROFANT V., ZÍMA V., KOPECKÝ JR. V.,
BEDNÁROVÁ L., ZENTZ C., BAUMRUK V., TURPIN P.Y., ŠTĚPÁNEK
J. Protonation effect of tyrosine in a segment of the SRF transcription factor:
A combined optical spectroscopy, molecular dynamics, and density
functional theory calculation study. J. Phys. Chem. B. 2013, 117, 16086-
16095. ISSN: 1520-6106
[III] PROFANTOVÁ B, COÏC Y.M., PROFANT V., ŠTĚPÁNEK J., KOPECKÝ
V. JR., TURPIN P.Y., ALPERT B., ZENTZ C. A role of histidine in the
MADS Box from Human SRF revealed by tyrosine perturbation.
Biochemistry, 2014. (submitted).
Conference contributions:
1. PROFANTOVÁ B., ZENTZ C., KOPECKÝ V.JR., TURPIN P.Y.,
ŠTĚPÁNEK J., poster: "Spectroscopic study of MADS-box segments and
their interaction with DNA." 15th European Conference on the Spectroscopy
of Biological Molecules (15th ECSBM), Oxford, United Kingdom,
25-30.8.2013.
2. PROFANTOVÁ-ŘEZÁČOVÁ B., ZENTZ C., TURPIN P.Y., KRUGLIK S.,
ŠTĚPÁNEK J., oral contribution: „Boîte MADS et ses segments courts:

- 92 -
étude physicochimique.“ Journées de Rentrée ED iViv, Paris, France,
13-14.11.2012.
3. PROFANTOVÁ-ŘEZÁČOVÁ B., PROFANT V., ZÍMA V., ZENTZ C.,
KRUGLIK S., BEDNÁROVÁ L., TURPIN P.Y., ŠTĚPÁNEK J., poster:
„Raman spectroscopy of a MADS box segment: experiments and
calculations.“ 23rd International Conference on Raman Spectroscopy
(ICORS 2012), Bangalore, India, 12-17.8.2012.
4. ŘEZÁČOVÁ B., PROFANT V., ZENTZ C., COÏCC Y.M., KRUGLIK, S.,
TURPIN P.Y., ŠTĚPÁNEK J., poster: „Spectroscopic study of the MADS
box.“ X Discussions in Structural Molecular Biology, Nové Hrady, Czech
Republic, 22-24.3.2012.
5. ŘEZÁČOVÁ B., COÏC Y.M., ZENTZ C., TURPIN P.Y., ŠTĚPÁNEK J.,
poster: “Investigation of MADS box intrinsic fluorophores.” Journées de
Rentrée ED iViv, Paris, France, 25-26.10.2011.
6. ŘEZÁČOVÁ B., COÏC Y.M., ZENTZ C., TURPIN P.Y., ŠTĚPÁNEK J.,
poster: “Investigation of MADS box intrinsic fluorophores.” 12th Conference
on Methods and Applications of Fluorescence Spectroscopy, Imaging and
Probes (MAF12), Strasbourg, France, 11-14.9.2011.
7. ŘEZÁČOVÁ B., ZENTZ C., TURPIN P.Y., KOPECKÝ V., ŠTĚPÁNEK J.,
poster: “Spectroscopic investigation of the MADS box.” 14th European
Conference on the Spectroscopy of Biological Molecules (14th ECSBM),
Coimbra, Portugal, 28.8-3.9.2011.
8. ŘEZÁČOVÁ B., ZENTZ C., TURPIN P.Y., ŠTĚPÁNEK J., oral
contribution: “Spectroscopic study of MADS box and its interaction with
DNA.” 30th European Congress on Molecular Spectroscopy
(30th EUCMOS), Florence, Italy, 29.8-3.9.2010.
9. ŘEZÁČOVÁ B., ZENTZ C., TURPIN P.Y., ŠTĚPÁNEK J., oral
contribution: “Spectroscopic study of MADS box and its interaction with
DNA.” Week of Doctoral Students 2010 (WDS 2010), Prague, Czech
Republic, 1-4.6.2010.

- 93 -
7. Bibliography
[1] ALBERTS B., JOHNSON A., LEWIS J., RAFF M., ROBERTS K.,
WALTER P. Molecular Biology of the Cell. 4th ed. New York: Garland Science,
2002. ISBN 0-8153-3218-1.
[2] BERG J.M., TYMOCZKO J.L., STRYER L. Biochemistry. 5th ed. New
York: W H Freeman, 2002. ISBN 0-7167-3051-0.
http://www.ncbi.nlm.nih.gov/books/NBK21154/ (accessed 15.10.2013).
[3] NELSON D.L., COX M.M., LEHNINGER A.L. Lehninger Principles of
Biochemistry. 4th ed. New York: W. H. Freeman, 2005. ISBN 0-7167-4339-6.
[4] LODISH H., BERK A., ZIPURSKY S.L., MATSUDAIRA P.,
BALTIMORE D., DARNELL J. Molecular Cell Biology. 4th ed. New York: W. H.
Freeman, 2000. ISBN 0-7167-3136-3.
http://www.ncbi.nlm.nih.gov/books/NBK21475/ (accessed 11.10.2013).
[5] STRACHAN T., READ A.P. Human Molecular Genetics. 2nd ed. New
York: Wiley-Liss, 1999. ISBN 1-85996-202-5.
http://www.ncbi.nlm.nih.gov/books/NBK7580/ (accessed 11.10.2013).
[6] BRIVANLOU A.H., DARNELL J.E. Transcription - Signal transduction and
the control of gene expression. Science. 2002, 295 (5556), 813-818. ISSN 0036-
8075.
[7.] WINGENDER E., SCHOEPS T., DONITZ J. TFClass: an expandable
hierarchical classification of human transcription factors. Nucleic Acids Res. 2013,
41 (D1), D165-D170. ISSN 0305-1048.
[8.] MATYS V., KEL-MARGOULIS O.V., FRICKE E., LIEBICH I., LAND S.,
BARRE-DIRRIE A., REUTER I., CHEKMENEV D., KRULL M., HORNISCHER
K., VOSS N., STEGMAIER P., LEWICKI-POTAPOV B., SAXEL H., KEL A.E.,
WINGENDER E. TRANSFAC (R) and its module TRANSCompel (R):
transcriptional gene regulation in eukaryotes. Nucleic Acids Res. 2006, 34, D108-
D110. ISSN 0305-1048.
[9] SHORE P., SHARROCKS A.D. The MADS-box family of transcription
factors. Eur. J. Biochem. 1995, 229 (1), 1-13. ISSN 0014-2956.

- 94 -
[10] FORNARA F., MARZIANI G., MIZZI L., KATER M., COLOMBO L.
MADS-box genes controlling flower development in rice. Plant Biol. 2003, 5 (1),
16-22. ISSN 1435-8603.
[11] ADAMCZYK B.J., FERNANDEZ D.E. MIKC* MADS Domain
Heterodimers Are Required for Pollen Maturation and Tube Growth in Arabidopsis.
Plant Physiol. 2009, 149 (4), 1713-1723. ISSN 0032-0889.
[12] ZHENG Y.M., REN N., WANG H., STROMBERG A.J., PERRY S.E.
Global Identification of Targets of the Arabidopsis MADS Domain Protein
AGAMOUS-Like15. Plant Cell. 2009, 21 (9), 2563-2577. ISSN 1040-4651.
[13] SHU Y.J., YU D.S., WANG D., GUO D.L., GUO C.H. Genome-wide
survey and expression analysis of the MADS-box gene family in soybean. Mol. Biol.
Rep. 2013, 40 (6), 3901-3911. ISSN 0301-4851.
[14] SUN Q., CHEN G., STREB J.W., LONG X.C., YANG Y.M., STOECKERT
C.J., MIANO J.M. Defining the mammalian CArGome. Genome Res. 2006, 16 (2),
197-207. ISSN 1088-9051.
[15] POTTHOFF M.J., OLSON E.N. MEF2: a central regulator of diverse
developmental programs. Development. 2007, 134 (23), 4131-4140. ISSN 0950-
1991.
[16] FLAVELL S.W., KIM T.K., GRAY J.M., HARMIN D.A., HEMBERG M.,
HONG E.J., MARKENSCOFF-PAPADIMITRIOU E., BEAR D.M., GREENBERG
M.E. Genome-Wide Analysis of MEF2 Transcriptional Program Reveals Synaptic
Target Genes and Neuronal Activity-Dependent Polyadenylation Site Selection.
Neuron. 2008, 60 (6), 1022-1038. ISSN 0896-6273.
[17] MCDONALD O.G., WAMHOFF B.R., HOOFNAGLE M.H., OWENS G.K.
Control of SRF binding to CArG box chromatin regulates smooth muscle gene
expression in vivo. J. Clin. Invest. 2006, 116 (1), 36-48. ISSN 0021-9738.
[18] THEISSEN G., KIM J.T., SAEDLER H. Classification and phylogeny of the
MADS-box multigene family suggest defined roles of MADS-box gene subfamilies
in the morphological evolution of eukaryotes. J. Mol. Evol. 1996, 43 (5), 484-516.
ISSN 0022-2844.
[19] MEAD J., BRUNING A.R., GILL M.K., STEINER A.M., ACTON T.B.,
VERSHON A.K. Interactions of the Mcm1 MAIDS box protein with cofactors that

- 95 -
regulate mating in yeast. Mol. Cell. Biol. 2002, 22 (13), 4607-4621. ISSN 0270-
7306.
[20] PASSMORE S., ELBLE R., TYE B.K. A protein involved in
minichromosome maintenance in yeast binds a transcriptional enhancer conserved in
eukaryotes. Genes Dev. 1989, 3 (7), 921-935. ISSN 0890-9369.
[21] YANOFSKY M.F., MA H., BOWMAN J.L., DREWS G.N., FELDMANN
K.A., MEYEROWITZ E.M. The protein encoded by the Arabidopsis homeotic gene
agamous resembles transcription factors. Nature. 1990, 346 (6279), 35-39. ISSN
0028-0836.
[22] SOMMER H., BELTRAN J.P., HUIJSER P., PAPE H., LONNIG W.E.,
SAEDLER H., SCHWARZSOMMER Z. Deficiens, a homeotic gene involved in the
control of flower morphogenesis in Antirrhinum majus: the protein shows homology
to transcription factors. Embo J. 1990, 9 (3), 605-613. ISSN 0261-4189.
[23] NORMAN C., RUNSWICK M., POLLOCK R., TREISMAN R. Isolation
and properties of cDNA clones encoding SRF, a transcription factor that binds to the
c-fos serum response element. Cell. 1988, 55 (6), 989-1003. ISSN 0092-8674.
[24] BECKER A., THEISSEN G. The major clades of MADS-box genes and
their role in the development and evolution of flowering plants. Mol. Phylogenet.
Evol. 2003, 29 (3), 464-489. ISSN 1055-7903.
[25] MUNSTER T., PAHNKE J., DIROSA A., KIM J.T., MARTIN W.,
SAEDLER H., THEISSEN G. Floral homeotic genes were recruited from
homologous MADS-box genes preexisting in the common ancestor of ferns and seed
plants. Proc. Natl. Acad. Sci. U. S. A. 1997, 94 (6), 2415-2420. ISSN 0027-8424.
[26] PELLEGRINI L., SONG T., RICHMOND T.J. Structure of Serum Response
Factor Core Bound to DNA. Nature. 1995, 376 (6540), 490-498. ISSN 0028-0836.
[27] HASSLER M., RICHMOND T.J. The B-box dominates SAP-1-SRF
interactions in the structure of the ternary complex. Embo J. 2001, 20 (12), 3018-
3028. ISSN 0261-4189.
[28] TAN S., RICHMOND T.J. Crystal structure of the yeast MAT alpha
2/MCM1/DNA ternary complex. Nature. 1998, 391 (6668), 660-666. ISSN 0028-
0836.

- 96 -
[29] SANTELLI E., RICHMOND T.J. Crystal structure of MEF2A core bound to
DNA at 1.5 angstrom resolution. J. Mol. Biol. 2000, 297 (2), 437-449. ISSN 0022-
2836.
[30] HUANG K., LOUIS J.M., DONALDSON L., LIM F.L., SHARROCKS
A.D., CLORE G.M. Solution structure of the MEF2A-DNA complex: structural
basis for the modulation of DNA bending and specificity by MADS-box
transcription factors. Embo J. 2000, 19 (11), 2615-2628. ISSN 0261-4189.
[31] WU W.W., SHEN X., TAO S.H. Characteristics of the CArG-SRF binding
context in mammalian genomes. Mamm. Genome. 2010, 21 (1-2), 104-113. ISSN
0938-8990.
[32] GOSSETT L.A., KELVIN D.J., STERNBERG E.A., OLSON E.N. A New
Myocyte-Specific Enhancer-Binding Factor That Recognizes a Conserved Element
Associated with Multiple Muscle-Specific Genes. Mol. Cell. Biol. 1989, 9 (11),
5022-5033. ISSN 0270-7306.
[33] SCHROTER H., MUELLER C.G.F., MEESE K., NORDHEIM A.
Synergism In Ternary Complex-Formation between the Dimeric Glycoprotein
P67SRF, Polypeptide P62TCF and the C-fos Serum Response Element. Embo J.
1990, 9 (4), 1123-1130. ISSN 0261-4189.
[34] PRIMIG M., WINKLER H., AMMERER G. The DNA-Binding and
Oligomerization Domain of MCM1 is Sufficient for its Interaction with other
Regulatory Proteins. Embo J. 1991, 10 (13), 4209-4218. ISSN 0261-4189.
[35] MOLKENTIN J.D., OLSON E.N. Combinatorial control of muscle
development by basic helix-loop-helix and MADS-box transcription factors. Proc.
Natl. Acad. Sci. U. S. A. 1996, 93 (18), 9366-9373. ISSN 0027-8424.
[36] LEATHERWOOD J., FUTCHERT B. King of the Castle: Competition
between Repressors and Activators on the Mcm1 Platform. Mol. Cell. 2010, 38 (1),
1-2. ISSN 1097-2765.
[37] PRAMILA T., MILES S., GUHATHAKURTA D., JEMIOLO D.,
BREEDEN L.L. Conserved homeodomain proteins interact with MADS box protein
Mcm1 to restrict ECB-dependent transcription to the M/G1 phase of the cell cycle.
Genes Dev. 2002, 16 (23), 3034-3045. ISSN 0890-9369.
[38] DARIEVA Z., CLANCY A., BULMER R., WILLIAMS E., PIC-TAYLOR
A., MORGAN B.A., SHARROCKS A.D. A Competitive Transcription Factor
- 97 -
Binding Mechanism Determines the Timing of Late Cell Cycle-Dependent Gene
Expression. Mol. Cell. 2010, 38 (1), 29-40. ISSN 1097-2765.
[39] SENGUPTA P., COCHRAN B.H. MAT alpha 1 can mediate gene activation
by a-mating factor. Genes Dev. 1991, 5 (10), 1924-1934. ISSN 0890-9369.
[40] OEHLEN L., MCKINNEY J.D., CROSS F.R. Ste12 and Mcm1 regulate cell
cycle-dependent transcription of FAR1. Mol. Cell. Biol. 1996, 16 (6), 2830-2837.
ISSN 0270-7306.
[41] EL BAKKOURY M., DUBOIS E., MESSENGUY F. Recruitment of the
yeast MADS-box proteins, ArgRI and Mcm1 by the pleiotropic factor ArgRIII is
required for their stability. Mol. Microbiol. 2000, 35 (1), 15-31. ISSN 0950-382X.
[42] THEISSEN G., BECKER A., DI ROSA A., KANNO A., KIM J.T.,
MUNSTER T., WINTER K.U., SAEDLER H. A short history of MADS-box genes
in plants. Plant Mol.Biol. 2000, 42 (1), 115-149. ISSN 0167-4412.
[43] SMACZNIAK C., IMMINK R.G.H., ANGENENT G.C., KAUFMANN K.
Developmental and evolutionary diversity of plant MADS-domain factors: insights
from recent studies. Development. 2012, 139 (17), 3081-3098. ISSN 0950-1991.
[44] WEIGEL D., MEYEROWITZ E.M. The ABCs of Floral Homeotic Genes
Cell. 1994, 78 (2), 203-209. ISSN 0092-8674.
[45] GRAMZOW L., THEISSEN G. A hitchhiker's guide to the MADS world of
plants. Genome Biol. 2010, 11 (6). ISSN 1474-7596.
[46] GREENBERG M.E., SIEGFRIED Z., ZIFF E.B. Mutation of the c-fos gene
dyad symmetry element inhibits serum inducibility of transcription in vivo and the
nuclear regulatory factor binding in vitro. Mol. Cell. Biol. 1987, 7 (3), 1217-1225.
ISSN 0270-7306.
[47] BOXER L.M., PRYWES R., ROEDER R.G., KEDES L. The sarcomeric
actin CArG-binding factor is indistinguishable from the c-fos serum response factor.
Mol. Cell. Biol. 1989, 9 (2), 515-522. ISSN 0270-7306.
[48] CHEN C.Y., SCHWARTZ R.J. Recruitment of the tinman homolog Nkx-2.5
by serum response factor activates cardiac alpha-actin gene transcription. Mol. Cell.
Biol. 1996, 16 (11), 6372-6384. ISSN 0270-7306.
[49] BELAGULI N.S., SEPULVEDA J.L., NIGAM V., CHARRON F., NEMER
M., SCHWARTZ R.J. Cardiac tissue enriched factors serum response factor and
- 98 -
GATA-4 are mutual coregulators. Mol. Cell. Biol. 2000, 20 (20), 7550-7558. ISSN
0270-7306.
[50] BELAGULI N.S., SCHILDMEYER L.A., SCHWARTZ R.J. Organization
and myogenic restricted expression of the murine serum response factor gene - A
role for autoregulation. J. Biol. Chem. 1997, 272 (29), 18222-18231. ISSN 0021-
9258.
[51] HILL C.S., TREISMAN R. Transcriptional Regulation by Extracellular
signals: Mechanisms and Specificity. Cell. 1995, 80 (2), 199-211. ISSN 0092-8674.
[52] BLACK B.L., OLSON E.N. Transcriptional control of muscle development
by myocyte enhancer factor-2 (MEF2) proteins. Annu. Rev. Cell Dev. Biol. 1998, 14,
167-196. ISSN 1081-0706.
[53] MESSENGUY F., DUBOIS E. Role of MADS box proteins and their
cofactors in combinatorial control of gene expression and cell development. Gene.
2003, 316, 1-21. ISSN 0378-1119.
[54] LIN Q., SCHWARZ J., BUCANA C., OLSON E.N. Control of mouse
cardiac morphogenesis and myogenesis by transcription factor MEF2C. Science.
1997, 276 (5317), 1404-1407. ISSN 0036-8075.
[55] LILLY B., ZHAO B., RANGANAYAKULU G., PATERSON B.M.,
SCHULZ R.A., OLSON E.N. Requirement of MADS domain transcription factor D-
MEF2 for muscle formation in Drosophila. Science. 1995, 267 (5198), 688-693.
ISSN 0036-8075.
[56] TREISMAN R. Identification and purification of a polypeptide that binds to
the c-fos serum response element. Embo J. 1987, 6 (9), 2711-2717. ISSN 0261-4189.
[57] MIANO J.M., LONG X.C., FUJIWARA K. Serum response factor: master
regulator of the actin cytoskeleton and contractile apparatus. Am. J. Physiol.-Cell
Physiol. 2007, 292 (1), C70-C81. ISSN 0363-6143.
[58] POSERN G., TREISMAN R. Actin' together: serum response factor, its
cofactors and the link to signal transduction. Trends Cell Biol. 2006, 16 (11), 588-
596. ISSN 0962-8924.
[59] MUELLER C.G.F., NORDHEIM A. A protein domain conserved between
yeast MCM1 and human SRF directs ternary complex formation. Embo J. 1991, 10
(13), 4219-4229. ISSN 0261-4189.

- 99 -
[60] MINTY A., KEDES L. Upstream Regions of the Human Cardiac Actin Gene
That Modulate Its Transcription in Muscle Cells: Presence of an Evolutionarily
Conserved Repeated Motif. Mol. Cell. Biol. 1986, 6 (6), 2125-2136. ISSN 0270-
7306.
[61] HUMPHREY W., DALKE A., SCHULTEN K. VMD: Visual molecular
dynamics. J. Mol. Graph. 1996, 14 (1), 33-38. ISSN 1093-3263.
[62] STEPANEK J., VINCENT M., TURPIN P.Y., PAULIN D.,
FERMANDJIAN S., ALPERT B., ZENTZ C . C→G base mutations in the CArG
box of c-fos serum response element alter its bending flexibility. Consequences for
core-SRF recognition. FEBS J. 2007, 274, 2333-2348.
[63] HOPP T.P., WOODS K.R. Prediction of protein antigenic determinants from
amino acid sequences. Proc. Natl. Acad. Sci. USA 1981, 78, 3824–3828. ISSN:
0027-8424.
[64] ROSS J. B. A., LAWS W.R., ROUSSLANG K.W., WYSSBROD H.R.,
Topics in Fluorescence Spectroscopy: Tyrosine Fluorescence and Phosphorescence
from Proteins and Polypeptides, E Lakowicz, Springer, vol. 3, 2002, 1-64. ISBN
978-0-306-47059-2.
[65] PIMENTEL G. C. Hydrogen bonding and electronic transitions: The role of
the Franck– Condon principle. J. Am. Chem. Soc. 1957, 79, 3323–3326. ISSN 0002-
7863.
[66] BREALEY G. J., KASHA M. The role of hydrogen bonding in the blue-shift
phenomenon. J. Am. Chem. Soc. 1955, 77, 4462–4468. ISSN: 0002-7863.
[67] CHIGNELL D. A., GRATZER W. B. Solvent effects on aromatic
chromophores and thein relation to ultraviolet difference spectra of proteins, J. Phys.
Chem. 1968, 72, 2934–2941. ISSN 0022-3654.
[68] DU H., FUH R. A., LI J., CORKAN A., LINDSEY J. S. PhotochemCAD: A
computer-aided design and research tool in photochemistry. Photochem. Photobiol.
1998, 68, 141-142.
[69] RAYNER D.M., KRAJCARSKI D.T., SZABO A.G., Excited-state acid–
base equilibrium of tyrosine, Can. J. Chem. 1978, 56, 1238–1245. ISSN 0008-4042.
[70] TSUBOI M., EZAKI Y., AIDA M., SUZUKI M., YIMIT A., USHIZAWA,
K.; UEDA, T. Raman Scattering Tensors of Tyrosine. Biospectroscopy. 1998, 4, 61-
71. ISSN: 1075-4261.

- 100 -
[71] TUMA R. Raman Spectroscopy of Proteins: from Peptides to Large
Assemblies. J. Raman Spectrosc. 2005, 36, 307-319. ISSN: 0377-0486
[72] LUDWIG M., ASHER S. A. Ultraviolet Resonance Raman Excitation
Profiles of Tyrosine: Dependence of Raman Cross Sections on Excited-State
Intermediates. J. Am. Chem. Soc. 1988, 110, 1005-1011. ISSN: 0002-7863
[73] WILSON E. B. JR. The Normal Modes and Frequencies of Vibration of the
Regular Plane Hexagon Model of the Benzene Molecule. Phys. Rev. 1934, 45,
706-714.
[74] LEE H.I., KIM M.S., SUH S.W. Raman-spectroscopy of L-Phenylalanine,
L-tyrosine, and their Peptides absorbed on silver surface. Bull. Korean Chem. Soc.
1988, 9, 218-223. ISSN: 0253-2964.
[75] SIAMWIZA M. N., LORD R. C., CHEN M. C., TAKAMATSU T. ,
HARADA I., MATSUURA H., SHIMANOUCHI T. Interpretation of the Doublet at
850 and 830 cm-1 in the Raman Spectra of Tyrosyl Residues in Proteins and Certain
Model Compounds. Biochemistry. 1975, 14, 4870-4876. ISSN: 0006-2960.
[76] NEMECEK D., STEPANEK J., THOMAS G.J.JR. Raman Spectroscopy of
Proteins and Nucleoproteins Curr. Protoc. Protein Sci. 2013, 71, 17.8.1-17.8.52.
[77] PALAFOX M.A. Scaling Factors for the Prediction of Vibrational Spectra. I.
Benzene Molecule. Int. J. Quant. Chem. 2000, 77, 661-684. ISSN: 0020-7608.
[78] REZACOVA B. Diploma thesis: Strukturní flexibilita regulačního segmentu
DNA, 2009.
[79] KIBBE W.A. OligoCalc: an online oligonucleotide properties calculator.
Nucleic Acids. Res. 2007, 35, W43-W46. ISSN: 0305-1048.
http://www.basic.northwestern.edu/biotools/oligocalc.html (accessed 28.3.2012).
[80] TATAUROV A.V., YOU Y., OWCZARZY R. Predicting ultraviolet
spectrum of single stranded and double stranded deoxyribonucleic acids, Biophys.
Chem.2008, 133, 66-70. ISSN: 0301-4622.
[81] LAKOWICZ J.R. Principles of fluorescence spectroscopy. 3rd ed. New
York: Springer, 2006. ISBN 0-387-31278-1.
[82] PALACKY J., MOJZES P., BOK J. SVD-Based Method for Intensity
Normalization, Background Correction and Solvent Subtraction in Raman
Spectroscopy Exploiting the Properties of Water Stretching Vibrations. J. Raman
Spectrosc. 2011, 42, 1528-1539. ISSN: 0377-0486.

- 101 -
[83] DOUSSEAU F., THERRIEN M., PEZOLET M. On the Spectral Subtraction
of Water from the FT-IR Spectra of Aqueous Solutions of Proteins. Appl. Spectrosc.
1989, 43, 538-542. ISSN: 0003-7028.
[84] ANDEL J. Matematická statistika, 2nd ed., Praha: SNTL, 1985.
[85] MALINOWSKI E.R. Factor Analysis in Chemistry, 3rd ed. New York:
Willey-Interscience, 2002. ISBN 0471134791.
[86] SELA M., KATCHALSKI E. Spectrophotometric Titration of Alpha-Amino
Acid Copolymers Containing Tyrosine. J. Am. Chem. Soc. 1956, 78, 3986-3989.
ISSN: 0002-7863.
[87] DRAKE A.F., SILIGARDI G., GIBBONS W.A. Reassessment of the
Electronic Circular-Dichroism Criteria for Random Coil Conformations of Poly(L-
Lysine) and the Implications for Protein Folding and Denaturation Studies. Biophys.
Chem. 1988, 31, 143-146. ISSN: 0301-4622.
[88] GOKCE I., WOODY R.W., ANDERLUH G., LAKEY J.H. Single Peptide
Bonds Exhibit Poly(pro)II ("Random Coil") Circular Dichroism Spectra. J. Am.
Chem. Soc. 2005, 127, 9700-9701. ISSN: 0002-7863.
[89] SIMMONS N.S., GLAZER A.N. An Analysis of the Tyrosine Circular
Dichroism Bands in Ribonuclease. J. Am. Chem. Soc. 1967, 89, 5040-2. ISSN: 0002-
7863.
[90] TENSMEYER L.G., KAUFFMAN E.W. Protein Structure as Revealed by
Nonresonance Raman Spectroscopy. In Spectroscopic methods for determining
protein structure in solution, New York: VCH Publishers, 1996, 69-95.
[91] PELTON J.T., MCLEAN L.R. Spectroscopic Methods for Analysis of
Protein Secondary Structure. Anal. Biochem. 2000, 277, 167-176. ISSN: 0003-2697.
[92] GARNIER J., GIBRAT J.F., ROBSON B. GOR Method for Predicting
Protein Secondary Structure from Amino Acid Sequence. Methods Enzymol. 1996,
266, 540-553. ISSN: 0076-6879.
[93] CHOU P.Y., FASMAN G.D. Conformational Parameters for Amino Acids
in Helical, β-Sheet, and Random Coil Regions Calculated from Proteins.
Biochemistry 1974, 13, 211-222. ISSN: 0006-2960.
[94] BARTH A. Infrared Sectroscopy of Proteins. Biochim. Biophys. Acta-
Bioenerg. 2007, 1767, 1073-1101. ISSN 0005-2728.

- 102 -
[95] BARTH A. The Infrared Absorption of Amino Acid Side Chains. Prog.
Biophys. Mol. Biol. 2000, 74, 141-173. ISSN: 0079-6107.
[96] RAJKUMAR B.J.M., RAMAKRISHNAN V. Infrared and laser Raman
studies of l-phenylalanine l-phenylalaninium perchlorate and bis(dl-
phenylalaninium) sulphate monohydrate, Spectrochim. Acta A. 2002, 58, 1923-1934.
ISSN 1386-1425.
[97] JOHNSON C.R., LUDWIG M., ASHER S.A. Ultraviolet Resonance Raman
Characterization of Photochemical Transients of Phenol, Tyrosine, and Tryptophan.
J. Am. Chem. Soc. 1986, 108, 905-912. ISSN: 0002-7863.
[98] CHAN W.C., WHITE P.D., Fmoc solid phase peptide synthesis: A practical
approach, London: Oxford University Press, 2000. ISBN 0199637245.
[99] HARADA I., MIURA T., TAKEUCHI H. Origin of the doublet at 1360 and
1340 cm−1 in the Raman spectra of tryptophan and related compounds. Spectrochim.
Acta A. 1986, 42, 307-312. ISSN: 0584-8539.
[100] MIURA T., TAKEUCHI H., HARADA I. Tryptophan Raman bands
sensitive to hydrogen-bonding and side-chain conformation. J. Raman Spectrosc.
1989, 20, 667-671. ISSN: 0377-0486.
[101] MAITI N, THOMAS S., JACOB J.A., CHADHA R., MUKHERJEE T.,
KAPOOR S. DFT and surface-enhanced Raman scattering study of tryptophan-silver
komplex. J. Colloid Interface Sci. 2012, 380, 141-149. ISSN: 0021-9797.
[102] HERNANDEZ B, PFLUGER F., KRUGLIK S.G., GHOMI M. TI
Characteristic Raman lines of phenylalanine analyzed by a multiconformational
approach. J. Raman Spectrosc. 2013, 44, 827-833. ISSN: 0377-0486.
[103] DIETZE E.C., WANG R.W., LU A.Y.H., ATKINS W.M. Ligand effects on
the fluorescence properties of tyrosine-9 in alpha 1-1 glutathione S-transferase.
Biochemistry 1996, 35, 6745–6753. ISSN: 0006-2960.
[104] FERNANDEZ-RECIO J., ROMERO A., SANCHO J. Energetics of a
hydrogen bond (charged and neutral) and of a cation-pi interaction in apoflavodoxin.
J. Mol. Biol. 290, 1999, 319-330. ISSN: 0022-2836.
[105] HOMER R.B., ALLSOPP S.R. An investigation of the electronic and steric
environment of tyrosyl residues in ribonuclease a and Erwinia Caroto-voral-
asparaginase through fluorescence quenching by caesium, iodide and phosphate.
Biochim. Biophys. Acta. 1976, 434, 297–310.

- 103 -
[106] MATTHEWS C.R., WESTMORELAND D.G. Nuclear magnetic resonance
studies of residual structure in thermally unfolded ribonuclease A. Biochemistry
1975, 14, 4532-4538. ISSN: 0006-2960.
[107] ANDERSON D.E., BECKTEL W.J., DAHLQUIST F.W. pH-induced
denaturation of proteins: a single salt bridge contributes 3-5 kcal/mol to the free
energy of folding of T4 lysozyme. Biochemistry 1990, 29, 2403-2408. ISSN: 0006-
2960.
[108] SANCHO J., SERRANO L., FERSHT A.R. Histidine residues at the N- and
C-termini of alpha-helices: perturbed pKas and protein stability. Biochemistry 1992,
31, 2253-2258. ISSN: 0006-2960.
[109] WEINER S.J., KOLLMAN P.A., CASE D.A., SINGH U.C., GHIO C.,
ALAGONA G., PROFETA S., WEINER P. A new force-field for molecular
mechanical simulation of nucleic-acids and proteins. J. Am. Chem. Soc. 1984, 106,
765-784. ISSN: 0002-7863. [110] SELA M., KATCHALSKI E. Spectrophotometric titration α-amino acid
copolymers containing tyrosine. J. Am. Chem. Soc. 1956, 78, 3986–3989.
ISSN: 0002-7863.
[111] VINOGRADOV S.N., LINNEL R.H. Hydrogen Bonding. New York: Van
Nostrand Reinhold, 1971.
[112] MAYER R., TOULME F., MONTENAYGARESTIER T. HELENE C. The
role of tyrosine in the association of proteins and nucleic-acids. Specific recognition
of single-stranded nucleic-acids by tyrosine-containing peptides. J. Biol. Chem.
1979, 254, 75-82. ISSN: 0021-9258.
[113] AKAMA K., SATO H., FURIHATA-YAMAUCHI M., KOMATSU Y.,
TOBITA T., NAKANO M. Interaction of Nucleosome Core DNA with Transition
Proteins 1 and 3 from Boar Late Spermatid Nuclei. J.Biochem. 1996, 119, 448-455.
ISSN: 0021-924X.
[114] TAN L., YAO S.Z., XIE Q.J., ZHANG Y.Y. Studies on interaction of
tyrosine with DNA by fluorescence spectra. Anal. Lett. 2003, 36, 2167-2181.
ISSN: 0003-2719.
[115] FOTOUHI L., TABATABAEE R. A study of the interaction tyrosine and
DNA using voltammetry and spectroscopy methods. Spectrochim. Acta A. 2014, 121,
152-156. ISSN: 1386-1425.

- 104 -

- 105 -
8. List of abbreviations
ARG Arginine CArG box DNA sequence CC(A/T)6GG CD circular dichroism DCA Dichloroacetamide DNA deoxyribonucleic acid ds DNA double stranded DNA FA factor analysis Fmoc fluorenylmethyloxycarbonyl FTIR Fourier-transform infrared spectroscopy GLU glutamic acid GOR Garnier-Osguthorpe-Robson method GTF general transcription factor HIS Histidine HPLC high-performance liquid chromatography IFE inner filter effect LYS Lysine MADS box family of TF, abbreviation of its earliest four founded
members: MCM1, Agamous , Deficiens and SRF MIR mid-infrared OD optical density PDB protein data bank PHE Phenylalanine RNA ribonucleic acid SRE serum response element SRF serum response factor ss DNA single stranded DNA SVD singular value decomposition TF transcription factor TFA ammonium trifluoroacetate TRP Tryptofan TYR Tyrosine UV Ultraviolet VMD visual molecular dynamics
- 106 -
9. List of Figures
Figure 1. Expression of genetic information [1]. ..................................................................... 7
Figure 2. Initiation of transcription in eukaryotic cell (adapted from [1]). Transcription factors are marked as A,B…H. ....................................................................................... 9
Figure 3. Binding of transcription factors to the regulatory promoter elements in eukaryotes [5]. Abbreviations: TATA box (sequence TATA(A/T)A(A/T)), BRE (TFIIB Recognition Element), DPE (Downstream Promoter Element), CCAAT box (sequence GGCCAATCT). ............................................................................................................ 10
Figure 4. General scheme of response to signals from extracellular signalling proteins through cell surface receptors to the nucleus. Latent cytoplasmatic factors activated by prosphorylation (green), regulated phosphorylation or proteolysis (light purple), and second messenger fluctuations (light blue). Internal signals regulate proteolysis at the plasma membrane liberating some transcription factors (dark purple). Resident nuclear proteins (yellow, □) may be phosphorylated on serine and thus activated either by binding to DNA or free at nucleus) [6]. ........................................................................ 12
Figure 5. Relative sizes of the 10 human TF superclasses distinguished according to the type of DNA binding domain [7]. ......................................................................................... 13
Figure 6. Protein sequences of non-identical MADS domains aligned to show their homology. The amino acid positions involved in DNA contacts, dimerization interactions and α, β structure are indicated below for the core SRF [26]. ................... 15
Figure 7. Structure of MADS-domain proteins and their function in determining floral organ identity [45]. Structures of ‘floral quartets’. Multimeric complexes of MIKCC-group proteins, bound to two DNA sequence elements (CArG-boxes) present in numerous target genes, determine floral organ identity. ................................................................ 16
Figure 8. Model of two principal pathways regulating SRF activity in non-muscle cells [58]. ....................................................................................................................................... 18
Figure 9. Core SRF sequence (residues 132-223). The α and β secondary structure assignment are boxed, MADS box region is marked by purple (according to Pellegrini, et al. [26]). ..................................................................................................................... 18
Figure 10. The core SRF/DNA complex (PDB file 1srs [26] vizualized by VMD [61]). Left: Possition of the MADS box within the core SRF (marked by violet colour). Middle: View perpendicular to the molecular two-fold and overall DNA helix axes. Right: View revealing the stab-like structure of the monomers. The two SRF-core monomers (blue and red) have highly similar conformations. DNA recognition segment is in dark grey colour (middle and right). ..................................................................................... 19
Figure 11. Orientations of the absorption transition moments of the tyrosine lowest-energy singlet-singlet electronic transitions [64]. ..................................................................... 21
Figure 12. Absorption and emission spectra of aromatic amino acids [68]. .......................... 22
Figure 13. Polarized Raman spectra of L-tyrosine in aqueous solutions of pH 13 (A) and pH 1 (B). Upper curves: the scattered radiation polarized parallel to the polarization

- 107 -
direction of the exciting radiation. Lower curves: the scattered radiation polarized perpendicular to the polarization direction of the exciting radiation [70]. .................... 24
Figure 14. Nomenclature of the ring modes in benzene molecule [73, 77]. .......................... 25
Figure 15. Published articles concerning the MADS box in each year. (Taken from the Web of Science; topic = “MADS box”.) ............................................................................... 26
Figure 16. Studied model oligopeptides of the human SRF MADS box (in boxes). The MADS box sequence within the SRF is highlighted by grey background. Green colour shows hydrophobic, red colour positively charged and blue negatively charged amino acids at neutral pH). ...................................................................................................... 28
Figure 17. A) Raman spectra of oligopeptide JS06 in water measured after each step of repurification. Spectra are normalized at 1004 cm-1 band. B) Raman spectrum of ammonium trifluoroacetate in water. ............................................................................ 32
Figure 18. Basic scheme of the Raman scattering apparatus ................................................. 35
Figure 19. Raman microcell scheme. The microcell is designed for measurements of small amount of sample (12-20uL according to the sample capillary). Laser beam passes the cell longitudinally through the sample capillary and holes in the sealing screws. Scattered radiation is collected perpendicularly from the central part of the sample capillary. The cell is placed inside a thermostated holder. ............................................ 35
Figure 20. Unwanted signal in Raman spectra. Spectra of used dissolving agents, artefact signal of the microcell glass and possible impurity from the synthesis of oligopeptides (TFA). ............................................................................................................................ 36
Figure 21. SVD results of the tyrosine fluorescence in dependence on its concentration. (To completely avoid possible contributions from elastic scattering of the excitation, only spectral region 300-370 nm was analysed.) Red line in the graph of V1 corresponds to the fit. ............................................................................................................................ 44
Figure 22. The effect of optical density on the fluorescence intensity of tyrosine and its correction. Black line shows the measured fluorescence intensities. Blue and red circles indicate corrected intensities according to equation (3.1) (*) and to our fit (**).Red curve is a linear regression of (**) corrected intensities. (ODem = 0 in both cases). ... 44
Figure 23. Short model oligopeptides within the sequence of human SRF. Denoted is the secondary structure in single crystal of SRF dimer with target DNA element according to X-ray [26]. ................................................................................................................. 46
Figure 24. pH dependence of CH08 oligopeptide absorption spectra. From acidic (red) to basic (violet) pH. ........................................................................................................... 47
Figure 25. Factor analysis (SVD) of pH dependency of CH08 absorption and its fit according to chapter 3.3.3. (A) SVD characteristics. Red lines show the results of the fit. (B) Determined pH dependences of the two CH08 forms. (C) Isolated absorption spectra of both forms. .................................................................................................... 47
Figure 26. pH dependence of CH08 oligopeptide fluorescence spectra. ............................... 48
Figure 27. Factor analysis (SVD) of pH dependency of CH08 fluorescence and its fit according to chapter 3.3.3. (A) SVD characteristics. Red lines show the results of the

- 108 -
fit. (B) Determined pH dependences of the two CH08 forms. (C) Isolated emission spectra of both forms, normalized by using coefficients nA = 0.003, nB = 0.201. ......... 49
Figure 28. Stern-Volmer plots of CH08 fluorescence quenching by DCA. Left: CH08 in 25mM acetate buffer, pH 3.2. Right: CH08 in 25mM cacodylate buffer, pH 7.0. ........ 50
Figure 29. SVD results of CH08 fluorescence quenching by DCA. Black and red lines in the graph of V1 correspond to the fit applied to the values corresponding tot neutral and acidic pH, respectively. ................................................................................................. 51
Figure 30. Electronic circular dichroism spectra of CH08 oligopeptide in acetate buffer (red), in water (green) and in a sodium bicarbonate buffer (blue). ......................................... 52
Figure 31. Raman spectra of CH08 measured at acidic (red), neutral (green), and basic pH (blue). The most distinctive bands are assigned according to the literature [71-72, 97]. ....................................................................................................................................... 53
Figure 32. Infrared absorption spectra of CH08 in the region of amide I and amide II bands at various pH. The red solid curves represent the original spectra (normalized) while the blue dash-dot lines are their second derivatives (smoothed by Savitski-Golay function over 21 points). ............................................................................................... 56
Figure 33. Electronic circular dichroism spectra of the JS01 oligopeptide in water pH 5.0 (green) and in a sodium bicarbonate buffer pH 11.0 (blue). ......................................... 58
Figure 34. Raman spectrum of JS01 oligopeptide measured in water at pH 5.0. Most distinctive bands are assigned according to the literature [71-72, 97]. ......................... 59
Figure 35. Raman spectrum of JS03 oligopeptide measured in water at pH 5.0. Most distinctive bands are assigned according to the literature [71, 76, 96]. ......................... 60
Figure 36. Raman spectrum of JS02 oligopeptide measured in water at pH 5.0. Most distinctive bands are assigned according to the literature [71, 76, 100]. ....................... 61
Figure 37. Longer model oligopeptides within the sequence of human SRF. Secondary structure according to X-ray [26]. ................................................................................. 62
Figure 38. Raman spectra of JS04, JS05, and JS06 oligopeptides measured in water at pH 4.0. Most distinctive bands are assigned according to the literature [71, 76, 102]. Besides the overall spectra (A), details of important spectral regions are shown below: (B) Tyrosine Fermi doublet, (C) Characteristic phenylalanine vibrations, (D) In-plane stretching vibrations of tyrosine and phenylalanine rings. ............................................ 63
Figure 39. Comparison of JS04-6 oligopeptide and tyrosine corrected fluorescence (left) and absorption (right) spectra. Fluorescence and absorption spectra are normalized at 302 nm and 275 nm respectively. .................................................................................. 64
Figure 40. The MADS box segment of human SRF. Secondary structure according to X ray [26]. ............................................................................................................................... 65
Figure 41. Normalized fluorescence emission (red) and excitation (blue) spectra of the MADS box in water. The emission spectrum was excited at 275 nm. The excitation spectra were recorded for emissions at 293 nm, 304 nm, and 325 nm. ......................... 66

- 109 -
Figure 42. Possible H-bond formation between tyrosine and histidine in the X-ray structure of the SRF MADS box [26] (visualized using the VMD [61]). The distance of H..O is ca.1.9 Å. ........................................................................................................................ 67
Figure 43. The factor analysis (SVD) results of the MADS-box emission spectra quenched by iodide. Red solid lines represent the fit of coefficients according to Stern-Volmer equation. ........................................................................................................................ 68
Figure 44. Two differently quenched spectral components (left) and their decreasing fractions in the spectra of the MADS box with increasing iodide concentrations (right). Solid lines correspond to the more efficiently quenched FI component and dashed lines to the second component FII. ......................................................................................... 68
Figure 45. The factor analysis (SVD) results of the MADS-box emission spectra quenched by iodide (red triangles) and cesium (blue circles). Solid lines represent the fit of coefficients according to Stern-Volmer equation. ......................................................... 69
Figure 46. Two differently quenched spectral components (left) and their Stern-Volmer representation (right). Solid lines correspond to the more efficiently quenched FI component and dashed lines to the second component FII. Circles and red color correspond to Cs+, triangles and blue to I– quenching. .................................................. 70
Figure 47. pH dependence of the MADS box fluorescence and absorption spectra. From acidic(red) to basic (violet) pH. ..................................................................................... 71
Figure 48. The factor analysis (SVD) results of both fluorescence and absorption spectral pH titration of the MADS box shown in common graphs. Solid curves inside the graphs of coefficients show the joint fit according to the model of three acido-basic equilibria. . 72
Figure 49. Absorption spectral components FA’, FB’, FC’, FD’ (lower right) and fluorescence spectral components FA, FB, FC, FD (lower left) extracted by a joint fit of the SVD results of the MADS-box pH titration. Relative occurrences of particular components at various pH are shown in the upper graph. ..................................................................... 73
Figure 50. FC (and FC’) fluorescence (and absorption) component and its comparison with two considered linear combination of FB and FD (FB’and FD’) components. ............ 74
Figure 51. Comparison of components FA and FB and their difference spectrum. All spectra are normalized at their maxima. .................................................................................... 74
Figure 52. The most important changes of the charges of the MADS box amino acids induced by pH alteration. .............................................................................................. 76
Figure 53. Measured absorption spectra of modSRE addition to JS06 sample. (i) Samples in buffer. (ii) Samples in buffer and 0.5 M NaCl. Solid lines correspond to solutions with oligopeptide, dashed lines to reference solutions. ......................................................... 78
Figure 54. Corrected fluorescence spectra of modSRE addition to JS06 sample. (i) Samples in buffer. (ii) Samples in buffer and 0.5 M NaCl. Spectra were corrected for IFE*, Raman scattering, background and dilution (as described in chapters 3.2.1 and 4.1.1). 78
Figure 55. The factor analysis (SVD) results of fluorescence spectra during modSRE addition to JS06 sample. Black circles represent samples dissolved in buffer (i); white circles samples in buffer and 0.5 M NaCl (ii). .............................................................. 79

- 110 -
Figure 56. (i) Measured absorption spectra of modSRE solution during gradual addition of JS06 ; (ii) the same experiment for solution with 0.5 M NaCl. Solid lines correspond to the oligonucleotide solution, dashed lines to JS06 added to the reference solvent. ...... 80
Figure 57. Factor analysis (SVD) of JS06 addition to modSRE solution monitored by UV absorption. Black circles correspond to mixed solutions in buffer, white circles to solutions where peptide/DNA interaction was prevented by high salinity (0.5 M NaCl). ....................................................................................................................................... 81
Figure 58. Factor analysis (SVD) of JS06 addition to modSRE solution monitored by UV absorption, limited for low peptide concentrations when no clear signs of precipitation were observed. Black circles correspond to mixed solutions in buffer, white circles to solutions where peptide/DNA interaction was prevented by high salinity (0.5 M NaCl). ....................................................................................................................................... 82
Figure 59. (i) Measured fluorescence spectra of modSRE solution during gradual addition of JS06 oligopeptide; (ii) the same experiment with the oligonucleotide solution of high salinity (0.5 M NaCl). Solid lines correspond to the oligonucleotide solution, dashed lines to the oligopeptide added to the reference solvent................................................ 83
Figure 60. (i) Corrected fluorescence spectra of modSRE solution during gradual addition of JS06 oligopeptide (only spectra before precipitation). Corrections are described in chapters 3.2.1 and 4.1.1). (ii) The same experiment with the oligonucleotide solution of high salinity (0.5 M NaCl). Solid lines correspond to the oligonucleotide solution, dashed lines to the oligopeptide added to the reference solvent. .................................. 83
Figure 61. Factor analysis (SVD) of JS06 oligopeptide addition to modSRE sample fluorescence, limited for low peptide concentrations when no clear signs of precipitation were observed. Circles represent the samples dissolved in buffer, and triangles the samples in buffer and 0.5 M NaCl). Blue symbols represent solutions with DNA; grey symbols reference solutions without DNA. ................................................ 84
Figure 62. Factor analysis (SVD) of JS04-6 oligopeptide addition to modSRE oligonucleotide sample fluorescence limited for low peptide concentrations. All spectra were normalized according to reference solution. Circles represent samples dissolved in buffer; triangles samples in reference solution without DNA. Black symbols represent JS05; red JS06 and blue JS04 oligopeptide. .................................................................. 86

- 111 -
10. List of Tables
Table 1. Properties of amino acids within the SRF MADS box. ........................................... 20
Table 2. Summary of employed model oligopeptides. .......................................................... 28
Table 3. Summary of model oligonucleotides. *Extinction coefficients of single stranded (ss) and double stranded (ds) oligonucleotides were calculated using the nearest neighbour model [80]. .................................................................................................................... 29
Table 4. Frequencies of selected vibrational modes of tyrosine and tyrosinate observed in Raman spectra of CH08 oligopeptide. .......................................................................... 54
Table 5. Summary of interaction experiments – decrease of tyrosine quantum yield comparing the solution with and without DNA (additions of oligopeptide to oligonucleotide solution). .............................................................................................. 85

- 112 -
11. Attachments
[I] ŘEZÁČOVÁ B., COIC Y.M., ZENTZ C., TURPIN P.Y., ŠTĚPÁNEK J.
Spectroscopic Determination of pKa Constants of MADS Box Segments.
Spectrosc. Int. J. 2012, 27, 455-461. ISSN: 0712-4813.
[II] PROFANTOVÁ B., PROFANT V., ZÍMA V., KOPECKÝ JR. V.,
BEDNÁROVÁ L., ZENTZ C., BAUMRUK V., TURPIN P.Y., ŠTĚPÁNEK
J. Protonation effect of tyrosine in a segment of the SRF transcription factor:
A combined optical spectroscopy, molecular dynamics, and density
functional theory calculation study. J. Phys. Chem. B. 2013, 117, 16086-
16095. ISSN: 1520-6106

- 113 -
Attachment I.
Spectroscopic determination of pKa constants of MADS box segments Barbora Řezáčováa,b*, Yves-Marie Coïcc Christian Zentzb, Pierre-Yves Turpinb and Josef Štěpáneka
a Institute of Physics, Faculty of Mathematics and Physics, Charles University in Prague, Ke Karlovu 5, CZ-12116 Prague 2, Czech Republic bLaboratoire Acides Nucléiques et Biophotonique, FRE 3207, Université Pierre et Marie Curie, place Jussieu 4, 75252 Paris Cedex 5, France cUnité de Chimie des Biomolécules, URA 2128 CNRS, Institut Pasteur, Rue Du Dr. Roux 28, 75724 Paris Cedex 15, France Abstract: We have introduced a new promising approach for the determination of pKa constants of oligopeptide intrinsic fluorophores and spectral components referring to their differently charged states. The method is based on the factor analysis of multiwavelength spectroscopic pH titration data. As an illustration we present its application on the study of short segments of the MADS box, which is a highly conserved sequence of a so-called family of transcription factors, by techniques of UV absorption and fluorescence spectroscopies. Investigated oligopeptides contain no tryptophan but one tyrosine serving as an intrinsic fluorophore and absorber. The results indicate both good sensitivity and spectroscopic selectivity of our method, which thus may be considered as a complementary technique to conventional electrochemical methods. Keywords: factor analysis, dissociation constant, fluorescence spectroscopy, MADS box, tyrosine
Hindawi Publishing CorporationSpectroscopy: An International JournalVolume 27 (2012), Issue 5-6, Pages 455–461doi:10.1155/2012/674032
Spectroscopic Determination of pKaConstants of MADS Box Segments
Barbora Rezacova,1, 2 Yves-Marie Coıc,3 Christian Zentz,2
Pierre-Yves Turpin,2 and Josef Stepanek1
1Faculty of Mathematics and Physics, Institute of Physics, Charles University in Prague, Ke Karlovu 5,12116 Prague 2, Czech Republic
2Laboratoire Acides Nucleiques et Biophotonique, FRE 3207, Universite Pierre et Marie Curie,place Jussieu 4, 75252 Paris Cedex 5, France
3Unite de Chimie des Biomolecules, URA 2128 CNRS, Institut Pasteur, rue du Dr. Roux 28,75724 Paris Cedex 15, France
Correspondence should be addressed to Barbora Rezacova, [email protected]
Copyright © 2012 Barbora Rezacova et al. This is an open access article distributed under the Creative Commons AttributionLicense, which permits unrestricted use, distribution, and reproduction in any medium, provided the original work is properlycited.
Abstract. We have introduced a new promising approach for the determination of pKa constants of oligopeptide intrinsicfluorophores and spectral components referring to their differently charged states. The method is based on the factor analysisof multiwavelength spectroscopic pH titration data. As an illustration, we present its application on the study of short segmentsof the MADS box, which is a highly conserved sequence of a so-called family of transcription factors, by techniques of UVabsorption and fluorescence spectroscopies. Investigated oligopeptides contain no tryptophan but one tyrosine serving as anintrinsic fluorophore and absorber. The results indicate both good sensitivity and spectroscopic selectivity of our method,which thus may be considered as a complementary technique to conventional electrochemical methods.
Keywords: Factor analysis, dissociation constant, fluorescence spectroscopy, MADS box, tyrosine
1. Introduction
Proteins are biological molecules that usually contain amino acids with both acidic and basic functionalgroups. These amino acids can be divided into several categories according to their residue charge,polarity, and hydrophobicity. Titratable amino acids of the protein may be completely exposed tosolution or buried inside the 3D structure of the protein. Their pKa constants are thus influenced byprotein folding and may be sensitive to protein oligomerization, binding of ligand, denaturation, and soforth.
Determination of pKa constants of proteins is usually done by electrochemical techniques (e.g.,polarimetric, potentiometric, and voltammetric titration). Direct techniques such as NMR can be usedon small peptides to monitor their ionization state.

456 Spectroscopy: An International Journal
There are also several methods of computational biology, molecular modelling, and structuralbioinformatics, which can be used to estimate roughly the pKa values of titratable amino acids withinproteins.
In this work, we present a highly sensitive method of pKa determination (complementary to themethods mentioned previously), based on a factor analysis of spectroscopic data, obtained namely fromUV-visible absorption and fluorescence measurements. Analogous methodology can though be appliedto any other kind of spectroscopic data. It should be mentioned that factor analysis has already beenused to determine pKa values of small organic molecules [1, 2]; however, it has not been used to studypeptides so far (to our current knowledge).
The MADS box family of transcription factors counts over 200 members playing a crucialrole in the gene regulation of higher organisms. The MADS box acronym is derived from initialsof four of the originally identified members of the family: MCM1, AG, DEFA, and SRF [3]. Thesetranscription factors share a highly conserved DNA binding motif showing a wide sequence homologyof 56 amino acids. Still little is known about how targeted DNAs are recognized by these transcriptionfactors. Available structural data reveal that MADS box protein-DNA complexes have a high structurehomology, but with differences in the DNA binding process [4–9].
Core SRF contains its own intrinsic fluorophores: three tyrosines with different amino-acidicenvironments. In order to distinguish between these tyrosines and to see the effect of diverseenvironments, the pH dependency measurements of two small segments of SRF, each containing onetyrosine, were performed by using UV absorption and fluorescence spectroscopies: 154KLLRYTTFS162
and 168IMKKAYEL175.
2. Materials and Methods
2.1. Materials
Synthesis of octamer oligopeptide of sequence Ac-IMKKAYEL-amid, average Mw = 1036.30,was carried out according to the Fmoc/tBu solid-phase strategy [10] on a 433A peptide synthesizer(Applied Biosystems-Forster City, CA, USA), using a Fmoc Amide Resin (Applied Biosystems). Masscharacterization of the purified peptide (above 98% by RP-HPLC) was consistent with the expectedvalue.
HPLC 98% purified oligopeptide Ac-KLRRYTTFS-amid, Mw = 1212.43, was purchased fromApigenex (Prague, Czech Republic). Purity and mass weight were tested by HPLC and MS.
Spectroscopically pure KOH and HCl were obtained from Normapur and MERCK.
2.2. Optical Absorbance and Fluorescence Measurements
Optical absorbance spectra were recorded on a Cary 3E UV-visible spectrophotometer. Fluorescencemeasurements were performed on a SLM Aminco-Bowman series 2 luminescence spectrometer. Theexcitation and emission spectral bandwidths used were 4 nm. The optical path length was 1 cm.Upon excitation at 276 nm, both tyrosine and tyrosinate contribute to the fluorescence emission. Allfluorescence spectra were corrected for a minor inner filter effect (optical density being bellow 0.1) [11],and contributions of Rayleigh and Raman light scattering were subtracted. Spectra were also corrected

Spectroscopy: An International Journal 457
(slight intensity renormalization) for the small changes of concentration of oligopeptides resulting fromthe addition of HCl and/or KOH.
Fluorescence and absorption spectra of oligopeptides were measured in the pH range from 3 to11 at room temperature (20◦C). Concentration of the oligopeptide was 8 · 10−5 M. Addition of HCl orKOH caused no precipitation.
Measurements of pH were made on a IQ Scientific Instruments pH meter IQ170G equipped witha stainless steel pH probe.
2.3. Spectra Analysis
To find out the individual components forming the resulting fluorescence or absorption spectra, wesubmitted the set of spectra Fi(λ) obtained at various pH conditions to factor analysis, that is, singularvalue decomposition (SVD) algorithm decomposing a set of N spectra into a set of orthogonal normal-ized spectral profiles Sj(λ), j = 1, 2, . . . , N ,
Fi(λ) =M∑
j=1
VijWjSj(λ), (2.1)
where the normalized coefficients Vij quote the relative portions of the jth spectral profile Sj(λ) inthe original spectra Fi(λ) [12]. The singular numbers Wj stand for the statistical weights of spectralprofiles. As the spectral components are ordered to reach a descending succession of singular values,usually a few first terms at the right side are sufficient to approximate the original spectral set within anexperimental error. This value of M is referred to as factor dimension. It represents the minimal numberof independent components resolved in the analyzed spectral set.
In case of M equal to two (which is actually the case in the present paper), the spectralcomponents attributable to the two different components A and B in the spectra (from either absorptionor fluorescence) can be extracted, so that
Fi(λ) = FA(λ) ∗ CAi + FB(λ) ∗ CB
i , (2.2)
where FA(λ) and FB(λ) are the spectral components forming the original spectra proportionally totheir current concentrations CA
i and CBi . These are given by the current pH value as
CAi =
1
1 + 10pH−pKa , CBi = CA
i ∗ 10 pH−pKa, (2.3)
where pKa is the dissociation constant of the chromophore (here tyrosine).

458 Spectroscopy: An International Journal
Thanks to the factor dimension of two, both FA(λ) and FB(λ) components can be well approx-imated as linear combinations (with coefficients rA
j and rBj ) of the first and the second SVD spectral
profiles
FA(λ) =2∑
j=1
rAj ∗ Sj(λ), FB(λ) =
2∑
j=1
rBj ∗ Sj(λ). (2.4)
Considering the above-mentioned basic SVD formula for Fi(λ) and orthogonality of SVD spec-tral components, we obtained a final set of 2 × N equations
WjVij = rAj ∗ 1
1 + 10pH−pKa + rBj ∗
(1 − 1
1 + 10pH−pKa
), i = 1, 2, . . . N, j = 1, 2. (2.5)
The five unknown parameters (pKa, rAj , rB
j ; j = 1, 2) can be solved by means of a simultaneousnonlinear least-square fit of the right sides in (2.5) to the left ones.
3. Results and Discussion
3.1. Absorption Spectra
In the measured region 220–330 nm, both oligopeptides show a characteristic peak at 275 nm typical fortyrosine. Noticeable changes were observed by increasing the pH: the absorption band moved to longerwavelength at 294 nm, with a 1.5-fold increase of intensity (data not shown).
3.2. Fluorescence Spectra
In the measured region 290–390 nm, both oligopeptides have a characteristic peak at 303 nm typical fortyrosine. With an increase of the pH, the emission significantly decreases thanks to deprotonation oftyrosine to tyrosinate (see Figure 1(a)), which has a much lower fluorescence quantum yield [13] and itsemission is shifted to higher wavelengths at about 345 nm [14].
3.3. Analysis of pH Dependent Fluorescence Spectra
Results of factor analysis applied on fluorescence spectra of oligopeptide Ac-IMKKAYEL-amid areshown in Figure 1(d). We obtained a factor dimension of 2 (the same as for absorption spectra). The firstspectral profile S1 represents an average of measured spectra, and the 1st coefficients V1 thus describethe decrease of the overall spectral intensity as a function of pH. The second spectral profile S2, which isabout 100 times less significant than the first one, accounts for the main spectral changes. Contributionof this profile is about zero for spectra below pH 7, while above this pH its value increases, as can beseen from the behaviour of the 2nd coefficients V2.
By using our method, pKa constants were determined for both fluorescence and absorption datawith a good agreement for both oligopeptides. From the oligopeptide Ac-IMKKAYEL-amid absorption

Spectroscopy: An International Journal 459
300250200150100
500
300 320 340 360 380
pH3
pH11
Wavelength (nm)
Fluo
resc
ence
inte
nsity
(a.
u.)
Fluo
resc
ence
inte
nsity
(a.
u.)
1
0.8
0.6
0.4
0.2
0
10.80.60.40.2
0
4 6 8 10pH
Component AComponent B
Frac
tion
−0.2
6000
5000
4000
3000
2000
1000
02 4 6 8 1012141618
Factorcomponent
(a.u
.)
300 320 340 360 380Wavelength (nm)
0
Normalized component ANormalized component B
W-singular numbers
300 320 340 360Wavelength (nm)
4 6 8 10pH
(a.u
.)(a
.u.)
00.05
0.10.15
0.20.25
00.50.40.30.20.10
0.050.10.150.20.250.3
0.2
1
0
(a)
(b)
(c) (d)
−0.2−0.1
V1 -1st coefficients
V2 -2nd coefficientsS2 -2nd spectral profile
S1 -1st spectral profile
Figure 1: Fluorescence pH dependency of the MADS box segment Ac-IMKKAYEL-amid (a), deter-mined fractions (b), normalized emission spectra of the two components—normalization factor NA =0.003, NB = 0.201 (c), and factor analysis results (d).
we obtained pKa = 9, 45 ± 0, 05, from its fluorescence spectra pKa = 9, 43 ± 0, 06. For oligopeptideAc-KLRRYTTFS-amid absorption, we obtained pKa = 9, 01 ± 0, 05, and using fluorescence spectra,we calculated pKa = 9, 03 ± 0, 06. This is in good agreement with previous determinations of tyrosinepKa in various oligopeptides [15, 16].
In correspondence with our assumptions, we observed that the positively charged amino acids(R: arginines; K: lysines) do shift the dissociation constant of the free-state tyrosine to lower values (thedissociation constant of free tyrosine is 10.07 [15, 17]).

460 Spectroscopy: An International Journal
Moreover, using this method, we were able to distinguish the two emission components (seeFigure 1(c)) and their respective fractions (Figure 1(b)). Component A represents the tyrosine emissionspectrum (maximum at 303 nm), whereas component B represents the emission of tyrosinate (maximumnear 345 nm), which is about 60 times weaker.
4. Conclusions
Using the factor analysis on absorption and fluorescence-monitored titration, we were able to determinethe pKa constants of two tyrosine-containing oligopeptides with a high precision as well as absorptionand fluorescence spectral profiles corresponding to the differently charged forms. Furthermore, weobtained quantitative information about the effect of a specific environment on pKa of tyrosine, whichwill help us to better distinguish between the different tyrosines in MADSSRF.
The presented methodology is applicable to any oligopeptide bearing at least one pH-dependentphotosensitive amino acid or probe and in general can be applied to a vast number of spectroscopictechniques reflecting protonation changes in peptides. Further study on larger oligopeptide segments ofSRF will be performed.
Acknowledgments
This work is supported by the Czech Science Foundation (Project 202/09/0193) and Grant Agencyof Charles University (Project 402111). B. Rezacova gratefully acknowledges the French Governmentsupport for her stay in Laboratoire Acides Nucleiques et Biophotonique.
References
[1] M. Meloun, Z. Ferencıkova, and A. Vrana, “The thermodynamic dissociation constants of me-thotrexate by the nonlinear regression and factor analysis of multiwavelength spectrophotometricpH-titration data,” Central European Journal of Chemistry, vol. 8, no. 1, pp. 494–507, 2010.
[2] K. Y. Tam and K. Takacs-Novak, “Multiwavelength spectrophotometric determination of aciddissociation constants—part II. First derivative versus target factor analysis,” PharmaceuticalResearch, vol. 16, pp. 374–381, 1999.
[3] P. Shore and A. D. Sharrocks, “The MADS-box family of transcription factors,” European Journalof Biochemistry, vol. 229, no. 1, pp. 1–13, 1995.
[4] M. Hassler and T. J. Richmond, “The B-box dominates SAP-1-SRF interactions in the structure ofthe ternary complex,” EMBO Journal, vol. 20, no. 12, pp. 3018–3028, 2001.
[5] K. Huang, J. M. Louis, L. Donaldson, F. L. Lim, A. D. Sharrocks, and G. M. Clore, “Solutionstructure of the MEF2A-DNA complex: structural basis for the modulation of DNA bending andspecificity by MADS-box transcription factors,” EMBO Journal, vol. 19, no. 11, pp. 2615–2628,2000.
[6] Y. Mo, W. Ho, K. Johnston, and R. Marmorstein, “Crystal structure of a ternary SAP-1/SRF/c-fosSRE DNA complex,” Journal of Molecular Biology, vol. 314, no. 3, pp. 495–506, 2001.
[7] L. Pellegrini, S. Tan, and T. J. Richmond, “Structure of serum response factor core bound to DNA,”Nature, vol. 376, no. 6540, pp. 490–498, 1995.

Spectroscopy: An International Journal 461
[8] E. Santelli and T. J. Richmond, “Crystal structure of MEF2A core bound to DNA at 1.5 A Resolu-tion,” Journal of Molecular Biology, vol. 297, no. 2, pp. 437–449, 2000.
[9] S. Tan and T. J. Richmond, “Crystal structure of the yeast MATα2/MCM1/DNA ternary complex,”Nature, vol. 391, no. 6668, pp. 660–666, 1998.
[10] W. C. Chan and P. D. White, Fmoc Solid Phase Peptide Synthesis: A Practical Approach, OxfordUniversity Press, London, UK, 2000.
[11] J. R. Lakowicz, Principles of Fluorescence Spectroscopy, Springer, Singapore, 3rd edition, 2006.[12] E. R. Malinowski, Factor Analysis in Chemistry, Wiley, New York, NY, USA, 2nd edition, 1991.[13] J. B. A. Ross, W. R. Laws, K. W. Rousslang, and H. R. Wyssbrod, “Biochemical applications,”
in Topics in Fluorescence Spectroscopy, J. R. Lakowicz, Ed., vol. 3, pp. 1–63, Kluwer AcademicPublishers, New York, NY, USA, 2002.
[14] A. G. Szabo, K. R. Lynn, D. T. Krajcarski, and D. M. Rayner, “Tyrosinate fluorescence maxima at345 nm in proteins lacking tryptophan at pH7,” FEBS Letters, vol. 94, no. 2, pp. 249–252, 1978.
[15] M. Sela and E. Katchalski, “Spectrophotometric titration of α-amino acid copolymers containingtyrosine,” Journal of the American Chemical Society, vol. 78, no. 16, pp. 3986–3989, 1956.
[16] R. L. Thurlkill, G. R. Grimsley, J. M. Scholtz, and C. N. Pace, “pK values of the ionizable groupsof proteins,” Protein Science, vol. 15, no. 5, pp. 1214–1218, 2006.
[17] A. L. Lehninger, D. L. Nelson, and M. M. Cox, Lehninger Principles of Biochemistry, W. H.Freeman, New York, NY, USA, 4th edition, 2004.

- 114 -
Attachment II.
Protonation Effect of Tyrosine in a Segment of the SRF Transcription Factor: A Combined Optical Spectroscopy, Molecular Dynamics and DFT Calculation Study
Barbora Profantová1, 2, Václav Profant1, Vlastimil Zíma1, Vladimír Kopecký Jr.1, Lucie Bednárová3, Christian Zentz4, Vladimír Baumruk1, Pierre-Yves Turpin2, Josef Štěpánek1, *
1 Institute of Physics, Faculty of Mathematics and Physics, Charles University in Prague, Ke Karlovu 5, 121 16 Prague 2, Czech Republic 2 Laboratoire Jean Perrin, FRE 3231, Université Pierre et Marie Curie, place Jussieu 4, 75252, Paris Cedex 5, France 3 Institute of Organic Chemistry and Biochemistry, Academy of Sciences of the Czech Republic, Flemingovo nám. 2, 166 10 Prague, Czech Republic 4 ER12, Université Pierre et Marie Curie, Place Jussieu 4, 75252, Paris Cedex 5, France Abstract: The high sensitivity to pH of a short segment (an octamer) of Serum Response Factor (SRF), an important member of the MADS box family of transcription factors, was investigated by Raman scattering, infrared and circular dichroism spectroscopies. Molecular dynamics (MD) and density functional theory (DFT) calculations enabled interpretation of spectral changes in close detail. Although there was a negligible difference between spectra in acidic and neutral environments, the spectrum in basic pH was substantially different. The major changes were attributed to the deprotonation of tyrosine. The secondary structure of the SRF octamer fragment was estimated experimentally as well as predicted theoretically by MD. All techniques proved that it exists in a dynamical equilibrium among several conformations mostly close to β-turn, unordered conformations and extended structure; in contrast to the stable secondary structure it possesses as a part of SRF. Generally, this approach represents a useful tool for study of various short oligopeptides. Keywords: MADS box, protein secondary structure, tyrosine, pH transition, Raman spectroscopy, infrared spectroscopy

Protonation Effect of Tyrosine in a Segment of the SRF TranscriptionFactor: A Combined Optical Spectroscopy, Molecular Dynamics, andDensity Functional Theory Calculation StudyBarbora Profantova,†,‡ Vaclav Profant,† Vlastimil Zíma,† Vladimír Kopecky, Jr.,† Lucie Bednarova,§
Christian Zentz,⊥ Vladimír Baumruk,† Pierre-Yves Turpin,‡ and Josef Stepanek*,†
†Institute of Physics, Faculty of Mathematics and Physics, Charles University in Prague, Ke Karlovu 5, 121 16 Prague 2, CzechRepublic‡Laboratoire Jean Perrin, FRE 3231, Universite Pierre et Marie Curie, place Jussieu 4, 75252 Paris CEDEX 5, France§Institute of Organic Chemistry and Biochemistry, Academy of Sciences of the Czech Republic, Flemingovo nam. 2, 166 10 Prague 6,Czech Republic⊥ER12, Universite Pierre et Marie Curie, Place Jussieu 4, 75252 Paris CEDEX 5, France
*S Supporting Information
ABSTRACT: The high sensitivity to pH of a short segment (an octamer) of serumresponse factor (SRF), an important member of the MADS box family of transcriptionfactors, was investigated by Raman scattering, infrared and circular dichroismspectroscopies. Molecular dynamics (MD) and density functional theory (DFT)calculations enabled interpretation of spectral changes in close detail. Although therewas a negligible difference between spectra in acidic and neutral environments, thespectrum in basic pH was substantially different. The major changes were attributed to thedeprotonation of tyrosine. The secondary structure of the SRF octamer fragment wasestimated experimentally as well as predicted theoretically by MD. All techniques provedthat it exists in a dynamical equilibrium among several conformations mostly close to βturn, unordered conformations, and extended structure, in contrast to the stable secondarystructure it possesses as a part of SRF. Generally, this approach represents a useful tool forthe study of various short oligopeptides.
■ INTRODUCTION
Transcription factors play an essential role in the generegulation of higher organisms by binding to multiple targetgene sequences in a complex manner. In particular, the so-called serum response factor (SRF), by binding to the DNAserum response element (SRE), regulates the transcription of anumber of immediate early genes, neuronal and muscle genes,and thus controls cell growth and differentiation, neuronaltransmission, and muscle function and development.1 SRF isone of the first discovered members of a family of transcriptionfactors that share a highly conserved segment of 56 aminoacids, called the MADS box.2 The MADS box of SRF has beenidentified as the major determinant for DNA-bindingspecificity.3 It is encompassed within a sequence of a hundredresidues that form a core domain (core-SRF) responsible forthe activities of DNA specific recognition and recruitment ofaccessory factors.4,5 The MADS box motif and its selectedsegments are believed to be able to serve as basic models for thestudy of local functional properties of the DNA recognitionwithin the protein family.The SRF MADS box contains three tyrosine residues that
can be used as spectroscopic inner probes sensitive to changesin their environment. To distinguish contributions of individual
tyrosine moieties to the whole MADS box spectra, weinvestigated shorter segments of the MADS box. In a previousUV/fluorescence study, we revealed that pKa values of MADSbox tyrosines are affected by other amino acids located in theirvicinity.6 These neighboring amino acids, and especiallycharged residues like arginine or lysine, tend to shift thedissociation constant of the free state of tyrosine.7,8
Here, we focus on the extensive study of vibrational spectraof one of the substantial segments of the MADS box, locatedbetween the 168 and 175 positions of SRF (i.e., octamerSRF)having the sequence: Ac-IMKKAYEL-amid. The X-raystructure of the complex formed by two core-SRF subunitsbound to the DNA target shows that this oligopeptideconstitutes the end of an α1-helix, the main DNA bindingelement of the protein, and is situated at the junction with thedimerization domain.9,10 In the octamerSRF sequence, Lys170,Lys171, and Glu174 amino acids are highly invariant, whereasTyr173 is less conserved within the whole MADS box proteinfamily.3,11
Received: October 8, 2013Revised: November 20, 2013Published: November 21, 2013
Article
pubs.acs.org/JPCB
© 2013 American Chemical Society 16086 dx.doi.org/10.1021/jp4099864 | J. Phys. Chem. B 2013, 117, 16086−16095

In the available structures of core-SRF/DNA complexesLys170 and Lys171 may be involved in forming salt bridgeswith the phosphate backbone of the DNA site, and theirsimultaneous mutation decreases core-SRF/DNA bindingaffinity,5 whereas Glu174 is involved in the core-SRF dimerinterface.9,10,12 The variation of the repartition of charges andH-bonding configuration of less conserved Tyr173 areconcerned in the specificity of core-SRF/DNA complex.13
When the fact that the X-ray structure of the octamerSRF
within the SRF is known is considered,9 its conformation as anisolated fragment in solution is expected to be dramaticallydifferent. In our study, we combine the electronic circulardichroism, Raman, and infrared spectroscopies with up-to-datetheoretical techniques of molecular dynamics (MD) anddensity functional theory (DFT) calculations to verify whetherit is possible to correctly simulate the behavior andspectroscopic properties of this relatively large system (154atoms). The accuracy and sensitivity of calculated results can beelucidated from a comparison of the simulated spectra of theoctamerSRF in the secondary structure based on both X-ray ofthe whole SRF and MD prediction and from the directcomparison with the experimental data.14 The results can serveas an advanced tool for detailed vibrational analysis,interpretation of experimental spectra and further character-ization of the selected inner probe, its sensitivity to variations ofenvironmental conditions, and so forth. This is demonstratedby measurements at various pH and simulations of theoctamerSRF in differently charged states, which provide adetailed understanding of changes observed in the experimentalspectra.Generally, this approach, which is based on a close
interconnection between experiments and MD simulationsalong with DFT calculations, represents a very powerful tool forgeneral applications to the study of various short oligopeptides(up to ∼180 atoms).
■ MATERIALS AND METHODSMaterials. The octamerSRF oligopeptide of sequence Ac-
IMKKAYEL-amid (Mw = 1036.30 Da) was synthetizedaccording to the Fmoc/tBu solid-phase strategy15 on a 433Apeptide synthesizer (Applied Biosystems) using a Fmoc AmideResin (Applied Biosystems). The mass characterization of thepurified peptide was in agreement with the expected value(above 98% by RP-HPLC). For spectroscopic measurements,the following buffers were used: 50 mM cacodylate buffer pH7.0 (prepared using (CH3)2AsO2Na.3H2O (Sigma Aldrich) andHCl (Merck)), acetate buffer pH 3.2 (prepared using glacialacetic acid (Penta) and CH3COONa (Lachema)), and 50 mMsodium bicarbonate buffer pH 11.0 (prepared using NaOH(Fluka) and Na2CO3 (Lachema)). To avoid any loss ofreliability in some spectral regions caused by the subtraction ofbuffer Raman and infrared bands, samples were also diluted inwater with small amounts of NaOH (Normapur) or HCl(Merck) to reach pH 12 or 3.0, respectively.Electronic Circular Dichroism. Circular dichroism (CD)
spectra were recorded on Jasco J-815 spectropolarimeter(Jasco) purged with N2. The spectra were collected from 180to 260 nm at room temperature in 0.1 cm quartz cells (withfollowing parameters: peptide concentration = 4.7 mM, 2 scans,0.5 nm steps, 20 nm/min speed, 8 s time constant, 1 nmspectral bandwidth) and from 230 to 380 nm in 1 cm quartzcells (with peptide concentration = 23.4 mM and with identicalexperimental parameters). After the baseline subtraction, the
final data were expressed as molar ellipticities, θ (deg cm2
dmol−1), per residue.Raman Spectroscopy. Raman spectra were recorded on a
Jobin-Yvon T64000 Raman spectrometer in a standard 90°geometry. Samples, having concentration 7.1 mM, were placedin a temperature-stabilized microcell of 20 μL internal volumeand excited by the 488 nm/200 mW Ar+ laser. Data wererecorded in the spectral range from 600 to 1900 cm−1; theeffective spectral resolution was ∼4 cm−1. Raman spectra werecorrected using a singular value decomposition-based methodfor intensity normalization, background correction, and solventsubtraction.16
Infrared Spectroscopy. Infrared spectra were recorded ona Bruker Vector 33 Fourier transform infrared (FTIR)spectrometer using a standard MIR globar source, a KBrbeamsplitter, and an MCT detector. 4000 scans were collectedwith a 2 cm−1 spectral resolution and a Blackman−Harris 3-term apodization function. Aqueous 2.9 mM peptide solutionswere measured at room temperature in a CaF2 cell with an 8μm path length. The spectral contribution of water wascorrected following the standard algorithm.17 Spectrum ofwater vapors was subtracted and, finally, the spectra werenormalized at amide I band intensity.
■ THEORYMolecular Dynamics. An all-atom structure model of the
octamerSRF with acetylated N-terminus and amidated C-terminus with overall charge +1 (neutral pH, see Figure 1)
was created using the tLEaP program from the Amber Tools18
suite and the force field AmberFF99SB.19 The model wasneutralized using a chloride anion and solvated in TIP3 water.The second model (overall charge 0, Figure 1) was created byreplacing tyrosine with tyrosinate to simulate the oligopeptidestate reached at high basic pH values. The force field fortyrosinate was generated using the R.E.D. server.20−23
The initial equilibration of the systems was performed usingNAMD 2.7 and 2.824 with time step of 2 fs and a cutoff 10 Å,PME grid size 48 × 48 × 48, Langevin damping 1/ps, and allbonds rigid using Settle algorithm.25 The systems were firstminimized for 1000 steps and then thermalized to 310 K and
Figure 1. Titration curve of the octamerSRF. pKa transitions of R-groups: (A) glutamic acid pKa = 4.25; (B) tyrosine pKa = 9.45, (C)lysine pKa = 10.53.
The Journal of Physical Chemistry B Article
dx.doi.org/10.1021/jp4099864 | J. Phys. Chem. B 2013, 117, 16086−1609516087

equilibrated at 1 atm for 20 ns. Potential energies and volumeswere monitored and reached stable values. For production runs,we used ACEMD26 running on a local workstation equippedwith GPU graphics card. The simulations were run in the NVTensemble with the same parameters as for equilibration, exceptfor a time step of 4 fs enabled by the hydrogen mass repartitionscheme.27 The initial 4 ns of each production trajectory wereneglected due to possible artifacts from equilibration afterchange of configuration parameters for NVT ensemble, leavinga 400 ns trajectory with snapshots every 20 ps. Data analysiswas performed using the program PTRAJ from theAmberTools18 suite and visualized using the VMD.28 Thesecondary structure was analyzed using the DSSP method.29
Cluster analysis was performed using an average-linkagealgorithm with limit of the distance at 2.5 Å (every fifthsnapshot was used, leaving 100 ps between frames).QM Spectral Calculations. All input geometries were
optimized by energy minimization using Gaussian09.30 In thecase of conformers obtained from MD simulations, backbonetorsion angles were kept fixed during minimization (Mod-Redundant option). The force field and spectral intensitieswere calculated at the same theory level within the harmonicapproximation by Gaussian, as well. We used standard DFTprocedure31 employing the B3PW91 functional32 and 6-31G**basis set,33 that is, the balanced level of calculation between theaccuracy and time demands (∼300 h of CPU time). Stability ofthe results toward other methods and functionals (HF,BPW9134) and basis sets (6-31G, 6-31G*) was also checked.The molecular environment was accounted for the COSMO-PCM35,36 dielectric model.Simulated Raman spectral profiles were generated by a
convolution of calculated intensities with a Lorentzian function10 cm−1 wide (full width at half of maximum) and adjusted by aBoltzmann factor37 to 298 K. The computed and experimentalintensities were normalized to have similar magnitudes. Theassignment of experimental bands to particular vibrationalmodes was performed by using the computer program Facio,38
which provided animations of nuclear motions along computednormal modes. The final assignment was then based onagreement of experimental/calculated positional and intensityparameters.
For the direct comparison between experimental andcalculated spectra (at DFT/B3PW91/6-31G**/COSMOlevel) an empirical scaling39,40 of wavenumber scale based onquadratic fit was applied. The five well assigned bands (evenlydistributed across the experimental region) were selected, andtheir calculated wavenumber values were fitted at theexperimental ones determining the coefficients of the quadraticfit as
ν ν ν= − + −0.000568 1.09 43.08s c2
c (1)
where νc represents the calculated wavenumber and νscorresponds to the scaled wavenumber.
■ RESULTS AND DISCUSSIONMolecular Structure and Geometry. The sequence of
octamerSRF possesses four functional groups of amino acids(Tyr, Glu, and two Lys) that can be protonated/deprotonateddepending on the acidity/basicity of environment. On the basisof pKa’s of free Glu 4.25,41 Lys 10.53,41 and Tyr 9.45 in theoctamerSRF (as determined in our preceding study;6 free Tyrhas a pKa of 10.07
41), the titration curve can be depicted (seeFigure 1). There are four differently charged states with chargeq = +2 at acidic pH < 4, q = +1 at neutral pH ∈ (4.5−9.2), q =0 at basic pH ∈ (9.7−10.3), and q = −2 at highly basic pH >10.8. However, only three of them (q = +2, +1, −2) areexperimentally accessible in a pure form because Tyr and Lyshave their dissociation constants close to each other. For thedetermination of the conformation of the free octamerSRF indifferent charged states a combination of CD, Raman, andFTIR spectroscopies was used.
CD Spectroscopy. In the UV spectral region (190−240nm), a negative spectral band at 196 nm was observed in thewhole pH range (3−11). This spectral band was accompaniedby a negative shoulder around 230 nm (for acidic and neutralpH). In the basic environment, this shoulder shifts to 225 nmand its intensity slightly increases (see Figure 2). Bands at 196nm and about 230 nm can be attributed to π−π* and n−π*transitions and assigned to an unordered conformation.42,43 Asthe octamerSRF in its primary structure contains tyrosineresidue, one can expect up to four additional π−π* transitionsbecause of the phenolic chromophore of tyrosine side chain.Although they are partially hidden by a signal of n−π*
Figure 2. Electronic circular dichroism spectra of the octamerSRF in an acetate buffer pH 3.2 (red), in water pH 5.0 (green) and in a sodiumbicarbonate buffer pH 11.0 (blue).
The Journal of Physical Chemistry B Article
dx.doi.org/10.1021/jp4099864 | J. Phys. Chem. B 2013, 117, 16086−1609516088

transitions of the peptide backbone we can assume that in theoctamerSRF π−π* Bb transitions significantly contribute to theweak spectral band observed at ∼225 nm.The contribution of aromatic side chains can be easily
identified in longer wavelengths (240−320 nm). The weakpositive spectral band around 276 nm was observed for thepeptide at acidic and neutral environment (pH 3.2 and 5.0,
respectively) together with the weak positive band at 275 nm inabsorption spectra (Figure S1, Supporting Information). Atbasic pH 11.0, a red shift to 294 nm was observed for bothabsorption and CD spectra, though the sign of the CD banddoes not change. This behavior corresponds to the phenolateform of the tyrosine side chain and is in a good agreement withpublished data.44,45
Figure 3. Raman spectra of the octamerSRF measured at acidic pH 3.2 (red), neutral pH 5.0 (green), and basic pH 12.0 (blue). Most distinctivebands are labeled and empirically assigned according to the literature.46,47,49−51
Table 1. Calculated and Experimental Frequencies of Selected Vibrational Modes of the Tyrosine Resp. Tyrosinate within theOctamerSRF
Raman shift (cm−1) Raman shift (cm−1)
tyrosine (Y)modesa description experiment DFTb
Wilsonc
nomenclaturetyrosinate (Y′)
modesa description experiment DFTbWilsonc
nomenclature
1 ν(CC) 1617 1620 ν8a 1 ν(CC) 1602 1600 ν8a2 ν(CC) 1600 1599 ν8b 2 ν(CC) 1525 ν8b3 ν(CC) 1515 ν19a 3 ν(CC) 1512 ν19a4 ν(CC) 1448 1440 ν19b 4 ν(CC) 1425 1426 ν19b5 ν(CC) 1358 ν14 5 ν(CC) 13686 δ(CH) 1341 1340 ν3 6 ν(CC) 1313 1319 ν147 δ(CH) 1274 7 ν(CC), δ(CH) 1253 ν14, ν38 δ(CH) 1209 1212 8 δ(CH) 1209 12089 δ(CH) 1188 ν9a 9 δ(CH) 1174 1160 ν9a9a δ(CH) 1177 1178 ν9a 10 δ(CH) 1104 1094 ν1510 δ(CH) 1129 1122 v15 11 δ(CH) 986 ν18a11 δ(CH) 1016 ν18a 12 γ(CH) 946 ν17a12 γ (CH) 962 958 ν17a 13 γ(CH) 936 ν10b13 γ(CH) 942 ν10b 14 δ(CCC) 854, 832d 842 ν114 δ(CCC) 854, 830d 854 ν1 15 γ(CH) 832 830 ν17b15 γ(CH) 830 830 ν17b 16 γ(CH) 809 ν10a16 γ(CH) 820 ν10a 17 γ(CCC) 723 737 ν417 γ(CCC) 760 ν4 18 δ(CCC) 642 635 ν6b17a γ(CCC) 723 717 ν4 19 γ(CCC) 854, 832d 430 ν16a18 δ(CCC) 643 642 ν6b19 γ (CCC) 854, 830d 420 ν16a
aSelected vibrational modes of tyrosine within the octamerSRF determined by DFT calculations (scaled). bLevel B3PW91/6-31G**/COSMO(water); scaled according to eq 1. cBased on refs 48 and 58. dFermi doublet, the second harmonic of the mode 19 (ν16a) combined with 14 (ν1).
The Journal of Physical Chemistry B Article
dx.doi.org/10.1021/jp4099864 | J. Phys. Chem. B 2013, 117, 16086−1609516089

In summary, the CD data support features of an unorderedstructure as a main structural motif of the octamerSRF. However,electronic CD is essentially sensitive to long-range interactions.Therefore, we include a study by vibrational spectroscopies(Raman and FTIR), which are more sensitive to structuraldetails and local arrangements.Raman Spectroscopy. Experimental Raman spectra
(Figure 3) were measured at pH 3.2 (acidic), 5.0 (neutral),and 12.0 (basic), which correspond to the +2, +1, and −2charged states, respectively (see Figure 1). Negligible changebetween Raman spectra in acidic and neutral pH was observed.It indicates that deprotonation of Glu does not have any effecton either the secondary structure of the oligomer or on thepolarizability of Glu residue. Further increasing of pH to thebasic range resulted in significant changes of several Ramanbands. These changes could be divided into two groups, thefirst one corresponding to tyrosine deprotonation and thesecond one to the secondary structure changes. Nevertheless, itis worth noting that no direct spectroscopic markers ofdeprotonation of the pair of Lys residues were observed.The loss of a hydrogen at the Tyr phenol group leads to a
shift and intensity change of several peaks. The differencebetween the neutral and negatively charged form of Tyr is mostprominent on the in-plane stretching vibrations ν(CC) ofthe ring.46,47 At neutral pH, the pair of bands at 1617 and 1600cm−1 (ν8a and ν8b, respectively; according to the nomenclatureof benzene ring modes by Wilson,48 see Table 1 for the detailedband assignment) was observed, whereas at basic pH, only onestrong band at 1602 cm−1 corresponding to the ν8a was present.Ring deformation modes δ(CH) are much less affected bydeprotonation. The peak at 1209 cm−1 changes neither theposition nor the intensity, whereas the band at 1177 cm−1
corresponding to ν9a with a contribution from C6H5Cstretching increases its intensity and shifts to 1174 cm−1 at basicpH.47,49,50 A change in the ratio of the bands at 830 and 854cm−1 assigned to the Fermi resonance46,51 between thesymmetric ring-breathing deformation δ(CCC), ν1 and theovertone of the nonplanar ring vibration γ(CCC), ν16a(fundamental frequency 413 cm−1) was also observed. Atbasic pH, the lower band shifts to 832 cm−1 and increases inintensity. This is in agreement with literature51 showing thatthe relative intensity increase of this particular band ascompared to that of the band at 854 cm−1 is directly relatedto the presence of a negative charge (or even partial negativecharge) at the oxygen atom. The 643 cm−1 band correspondingto the δ(CCC) deformation, ν6b appears to be insensitive to theprotonation state at all.Information about the secondary structure can be derived
from the position and shape of the amide I and amide III bandsin Raman spectra. In acidic and neutral environments, theamide I is located at 1673 cm−1, whereas at basic pH, a smalldownshift to 1671 cm−1 was observed. The difference is moreobvious in the amide III region consisting of two components.At acidic and neutral pH, they are of approximately the sameintensity, with low and high frequency components at 1246cm−1 and 1262 cm−1, respectively. At basic pH, the relativeintensity of the low frequency component decreases while itsposition remains the same as mentioned above (i.e., 1246cm−1); the high frequency component is shifted to 1267 cm−1.This indicates that the octamerSRF adopts a slightly differentsecondary structure in a basic environment than in neutral andacidic ones.
The maximum of the amide I at ∼1672 cm−1 points on apossible presence of β sheets, β turns, and β hairpins along withrandom coil or unordered structures. The two bands at 1246and ∼1265 cm−1 in the amide III region can be assigned to thesame structures.52,53 This is in a general agreement with anestimation of the secondary structure from the primary peptidesequence by GOR54 and Chou and Fasman55 algorithms (datanot shown). Based on this analysis it may be stated that theoctapeptide tends to form a β-hairpin structure, which is in adynamical equilibrium with an unordered or random coilstructure.At neutral and basic pH, there are also small differences
between intensities of the band at 1448 cm−1 and the broadband at ∼1340 cm−1 corresponding to δ(C−H) deformations(CH2 and CH3 bending modes). This could be an effect ofboth the deprotonation of Lys side chains and the overallinfluence of the highly basic environment.
Infrared Spectroscopy. FTIR spectra of the octamerSRF
were measured at pH 3.0 and 11.5 because at these pHs, thepeptide is fully protonated or deprotonated, respectively (seeFigure 1). The Figure 4 depicts FTIR spectra at given pH. Two
major bands, observed at ∼1649 and ∼1543 cm−1, are assignedto amide I (arising mainly from ν(CO) with minorcontributions from out-of-phase ν(CN)) and amide II(mainly δ(NH) and ν(CN)) vibrations of the backbonechain, respectively.56 The second derivative, which can identifyoverlapping components, reveals the prevalence of either α-helix or unordered structures (these structures are undistin-guishable without comparison with measurements in D2O).Surprisingly, β sheets are also observable at pH 3.0 owing to thenegative band at 1636 cm−1.56 The second component of βsheets at 1682 cm−1 suggests the presence of an antiparallel β
Figure 4. Comparison of infrared spectra of the octamerSRF in theregion of the amide I and amide II bands at various pH. The red solidcurves represent the original spectra (normalized), and the blue dash-dot lines are associated with the second derivative of the spectra(smoothed by Savitski-Golay function over 21 points).
The Journal of Physical Chemistry B Article
dx.doi.org/10.1021/jp4099864 | J. Phys. Chem. B 2013, 117, 16086−1609516090

hairpin.56 Classical Tyr ring vibrations57 ν(CC) are clearlyvisible at 1618 cm−1, ν8a, and 1518 cm−1, ν19a along with aweaker ν(CC), ν8b ring vibration57 at 1599 cm−1. Thus, wemay conclude that the octamerSRF exists as a mixture ofunordered structure with turns together with a dominantstructure of β hairpin at pH 3.0.The most apparent spectral changes at pH 11.5 are
connected with Tyr deprotonation. The band correspondingto tyrosinate ring ν(CC), ν19a vibrations
57 at 1518 cm−1 isdownshifted by 19 cm−1 at 1499 cm−1. This state is more polarthan the neutral state, and thus, the intensity of several otherbands increases (e.g., ν(CC) ring vibrations at 1600 cm−1,ν8a and 1522 cm−1, ν8b). Moreover, it seems that the β-hairpinstructure nearly disappears at pH 11.5 and that disorderedstructure (at 1650 cm−1) with turns (at 1676 cm−1) prevails.56
It indicates that negative charges prevent the formation of anystable compact secondary structure.Molecular Dynamic Simulations. Based on the exper-
imental results showing that the main spectral difference arisesbetween the octamer structures with total charge q = +1 and 0
(see Figure 1), that is, between the octamer containing Tyr inits protonated and deprotonated (tyrosinate) form, the MDsimulation was performed only for these two states. In thefollowing text, they are referred to according to the pH regionin which they occur (i.e. “neutral” or N for the octamerSRF withtyrosine (q = +1) and “basic” or B for the octamerSRF withtyrosinate (q = 0)). From the total number of 4000 frames ofMD trajectory for both forms, cluster analysis found 21 and 16individual clusters for neutral and basic form, respectively. Theoccurrences and secondary structure characteristics for themost frequent clusters (occurrence above 4%) are listed inTable 2. Their geometries are shown in Figure 5 together withdiagrams of their incidence during the simulation.The secondary structure of neutral clusters is dominated by
unordered and extended conformations (∼70%); regularstructure motives are represented by β turns (∼20%) and bysmall contribution of α-helical loops (<10%). Basic clustersprefer unordered and extended arrangement even more(∼85%) mainly at the expense of β turns (∼10%). The
Table 2. Occurrences of Selected Clusters in the MD Trajectory and Description of Their Secondary Structure
neutral pH basic pH
cluster occurrence (%) structure cluster occurrence (%) structure
N1 25 β turn, unordered B1 24.9 extendedN2 17.5 extended B2 20.2 extendedN3 10.4 β turn, extended B3 18.4 β turn, extendedN4 6.9 α helix, unordered B4 7.9 β turn, unorderedN5 6.3 β turn, extended B5 6.5 unorderedN6 5.6 β turn, unordered Σ B6−16 22.3a
N7 5.2 α helix, unorderedN8 5.1 α helix, unorderedΣ N9−21 18.2a
aThe clusters with occurrence below 4%
Figure 5. Most probable conformers sorted according to their occurrence as revealed by the cluster analysis both in neutral (N1−8) and basic (B1−5) pH upon the MD trajectory acquired from 400 ns AMBER99SB simulation (lower). Colors of the clusters correspond to their occurrence withinthe MD trajectory (gray color represents less occurring clusters). The X-ray structure of the octamerSRF was extracted from the structure of the SRFbound to DNA.9
The Journal of Physical Chemistry B Article
dx.doi.org/10.1021/jp4099864 | J. Phys. Chem. B 2013, 117, 16086−1609516091

occurrence of α-helical loops is also lower in basic clusters(<5%).QM simulations. As a first step, the octamerSRF spectra in
its differently charged forms (see Figure 1) were simulated toobserve a pure effect of deprotonation on Raman spectra. The
α-helical structure of the model molecule was derived from theX-ray structure of core-SRF (Figure 5, upper right corner),which was not altered by an energy minimization andrepresents a stable local minimum independent of the chargestate.9,10 Therefore, differences among the charged forms could
Figure 6. Comparison of experimental and calculated (B3PW91/6-31G**/COSMO(water)) Raman spectra of the octamerSRF at neutral pH.Vibrations of Tyr (Y) and the most significant bands of other amino acids present in the oligopeptide are assigned (and marked by one-letter aminoacid code) according to the results of DFT calculations. Calculated frequencies were scaled using the second order polynomial fit to enable a directassignment of bands (for details, see eq 1 in the Theory section).
Figure 7. Comparison of experimental and calculated (B3PW91/6-31G**/COSMO(water)) Raman spectra of the octamerSRF at basic pH.Vibrations of tyrosinate (Y′) and the most significant bands of other amino acids present in the oligopeptide are assigned according to the results ofDFT calculations. Calculated frequencies were scaled using the second order polynomial fit to enable the direct assignment of bands (for details, seeeq 1 in the Theory section).
The Journal of Physical Chemistry B Article
dx.doi.org/10.1021/jp4099864 | J. Phys. Chem. B 2013, 117, 16086−1609516092

be directly assigned to the changes in protonation state ofpresent amino acids. Calculations were performed on theB3PW91/6-31G**/COSMO level using water as an implicitsolvent. Simulated spectra are depicted in Figure S2,Supporting Information. It is evident that the major alterationsare associated with change of the total charge from +1 to 0 (i.e.,with the deprotonation of the Tyr residue), whereas the chargechanges on Glu and Lys residues have only a negligible effect, ingood agreement with experimental results. Therefore, furthersimulation could be limited to only two charged states: neutraland basic (similarly to MD simulations).The geometries resulting from the MD cluster analysis with
occurrence >4% (see Table 2) were used for more accuratecalculation of octamerSRF Raman spectra. All conformers wereenergy minimized using the ModRedundant option for keepingthe backbone torsion angles fixed. Spectra of individualconformers were simulated using the above-mentioned levelof theory. The final spectra of neutral and basic forms werecalculated as a weighted average in using the occurrences ofgiven forms mentioned in Table 2 (see Figure S3, SupportingInformation). The use of Boltzmann weights led to unreliableresults as the calculated energy of conformers does not includeany contribution from hydrogen bonding and chargedissipation.For the purpose of direct comparison between experimental
and calculated spectra, a scaling according to the eq 1 wasapplied. A very good agreement was achieved between theexperiment and the simulation, as can be seen in Figure 6 forthe neutral form (and in Figure 7 for the basic form), allowingthe precise vibrational analysis. Almost all experimental bands(including very weak features) were assigned with emphasis onpeptide backbone vibrations and characteristic modes ofindividual amino acids, especially on Tyr. Experimental spectrawere also fitted using a basis consisting of spectra of individualconformers (relative occurrences as free parameters), but nosignificant improvement comparing experimental and calcu-lated spectra was reached.Every neutral conformer possessed 456 fundamental
vibrations (basic conformers 453), from which ∼245 were inour region of interest between 600 and 1800 cm−1. Amongthem, 19 specific vibrations of tyrosine Y (tyrosinate Y′) phenyl(phenolate) ring were identified for every conformer, oftencoupled with vibrations of other parts of the oligopeptide.Frequencies and Raman intensities of these modes are listed inSupporting Information Tables S1, neutral conformers andbasic conformers in Supporting Information Table S2;Supporting Information Tables S3 and S4 contain the scaledfrequencies used for direct comparison to experiments. Thegeneral description of selected modes for both neutral and basicform is listed in Table 1 along with their experimental andcalculated (weighted average) wavenumbers and labeling byWilson.48 The graphical representation of these modes isshown in Figure S4, Supporting Information. Changes in thesecondary structure among individual conformers have nosignificant influence on frequencies of Tyr vibrations thatmostly differ by less than ±3 cm−1. Rare larger shifts are usuallycaused by couplings with other parts of the structure, whichalso influences the calculated intensities.In general, the quality of simulated spectrum and its
resemblance to the experimental one is better for the neutralform than for the basic one. We assume that this is caused bythe higher number of charged groups in the latter case; theimplicit solvent model is not able to mimic the effects of charge
distribution adequately. Furthermore, the absence of explicitsolvent and hydrogen bonding to the carbonyls of the peptidebackbone lead to the limited precision of calculated frequenciesand band shapes in the amide I and amide III region.We found that even smaller basis sets can be used to reach a
reasonable agreement with experimental data, provided thatthey include at least polarization functions on non-hydrogenatoms (6-31G* level and higher). Spectra simulated using theBPW91 functional manifested better agreement in thefrequency scale; however, the overall spectral shape wassubstantially worse as compared to that of the B3PW91 (seeFigure S5, Supporting Information).The Fermi doublet at 832 and 854 cm−1 formed by the mode
Y14 (δ(CCC), ν1) and the second harmonic of the mode Y19(γ(CCC), ν16a) cannot be correctly calculated at a harmoniclevel of simulation; thus, only the mode Y14 can be found in thesimulated spectra in this region.Our calculations also reveal the origin of the major spectral
changes between the tyrosine in its protonated anddeprotonated forms. The nature of both tyrosine and tyrosinatevibrational modes was found to be very similar, as could be seenfrom comparison of (i) their visualization in the upper andlower part of Figure S4, Supporting Information as well as (ii)their overall description in Table 1. Generally, absence ofhydrogen from the hydroxyl group leads to the downshift ofcalculated frequencies for about ∼20 cm−1, to the change of thesymmetry leading to different selection rules, and consequently,to changes in Raman intensities. This can be demonstrated onseveral bands visible in the measured Raman spectrum. One ofthe most distinctive features, the mode Y1 (ν(CC), ν8a) at1620 cm−1 (exp. 1617 cm−1) in neutral pH, shifts in basic pHto 1600 cm−1 (Y′1, exp. 1602 cm−1) and increases in intensity.On the other hand, the mode Y2 (ν(CC), ν8b) at 1599 cm−1
(exp. 1600 cm−1) in neutral pH exhibits nearly zero intensity inbasic pH due to the symmetry, and calculations suggest a largeshift to 1525 cm−1 (Y′2). The deformation modes δ(CH)between 1170 and 1210 cm−1, Y9a (ν9a) and Y8, shift onlyslightly and remain on the approximately same intensity as wellas the mode Y18 (δ(CCC), ν6b) at 642 cm−1 (exp. 643 cm−1).
■ CONCLUSIONSThe secondary structure of isolated octamerSRF was found to besubstantially different as compared to its arrangement as a partof the core-SRF. However, the crystal structure of the core-SRF−DNA complex does not take in account the variety ofconformations experienced by both partners in solution.13
Analysis of FTIR and Raman experimental spectra revealed thepresence of unordered or random coil structure together with βturns and β hairpins. The occurrence of β turns and β hairpinswas greater in neutral pH, whereas in basic pH, their contentvanished. CD, less local than previous vibrational techniquesand sensitive to the arrangement of large segments, indicatedthe unordered or random coil structure as a main structuralmotif.Structures predicted by MD simulations were in an excellent
agreement with experimental analysis for both neutral and basicforms of the octamerSRF. The secondary structure of eachconformer was dominated by unordered or extendedconformation and contained a substantial proportion of βturns. The loss of β-like structure in basic form was wellrepresented. Furthermore, MD simulations suggested a minorpresence of α-helical loops in the neutral form, which could notbe observed experimentally due to their low occurrence. MD
The Journal of Physical Chemistry B Article
dx.doi.org/10.1021/jp4099864 | J. Phys. Chem. B 2013, 117, 16086−1609516093

proved to be a powerful tool for prediction of highlyconformationally unstable peptide oligomers.Several spectral bands were successfully assigned according
to the available literature; however, for a precise and accurateassignment of weaker features, QM calculations were necessary.Spectra simulated on the basis of MD predicted conformerswere found to be in a fine correspondence with experimentalprofiles, especially for the neutral pH form, which proves thereliability of MD simulations. Tyrosine and tyrosinatevibrations were additionally characterized and classified in thecontext of previous research.The most distinctive features of the Raman, FTIR, and CD
spectra were associated with Tyr173. Both vibrational andelectronic spectra proved to be sensitive to its deprotonation,whereas charge changes on other amino acids caused no or onlynegligible differences. Thus, it can be concluded that thevariation of charges of the highly conserved amino acid Lys170,Lys171, and Glu174 do not change the organization ofoctamerSRF, in contrast to the less-conserved Tyr173. On thepoint of view of the biological relevance of these observations, itis worth noting that all these charged residues are involved inthe formation of the complex of core-SRF with DNA. Thepeculiar properties of Tyr173 revealed in octamerSRF areprobably involved in the formation of the complex with thecognate DNA. Only residues located at or nearby a non-conserved position might play a role in the DNA specificity;this differentiates SRF among other MADS proteins. Thus, wecan assess that octamerSRF reveals fundamental properties ofTyr173 that are involved in the functional role of the MADSbox (i.e., the determination of the DNA binding specificity).3
In conclusion, it was successfully demonstrated that interplayof experimental and theoretical approach represents a usefuland powerful tool for detailed study of various shortoligopeptides (up to ∼180 atoms) with biological relevance.Although separately both experiment and MD simulationaccompanied by DFT calculation offer rich information, it istheir combination which provides deeper understanding andleads to the more accurate interpretation of acquired results.
■ ASSOCIATED CONTENT
*S Supporting InformationComplementary data include experimental and computationaldetails and spectra with graphical representations of vibrationmodes. This information is available free of charge via theInternet at http://pubs.acs.org/.
■ AUTHOR INFORMATION
Corresponding Author*J. Stepanek. Phone: +420 221 911 345. Fax: +420 224 922797. E-mail: [email protected].
NotesThe authors declare no competing financial interest.
■ ACKNOWLEDGMENTS
The authors express gratitude to Sergei Kruglik (Universite Pierre et Marie Curie, France) for kind help with Ramanmeasurements and to Yves-Marie Coıc (Institut Pasteur,France) for synthesis of the octamerSRF. B.P. gratefullyacknowledges the French Government support for her stay inLaboratoire Jean Perrin (Universite Pierre et Marie Curie,France). This work was supported by the Czech Science
Foundation (No. 202/09/0193) and the Grant Agency ofCharles University (No. 402111).
■ REFERENCES(1) Miano, J. M.; Long, X. C.; Fujiwara, K. Serum Response Factor:Master Regulator of the Actin Cytoskeleton and ContractileApparatus. Am. J. Physiol.: Cell Physiol. 2007, 292, C70−C81.(2) Schwarzsommer, Z.; Huijser, P.; Nacken, W.; Saedler, H.;Sommer, H. Genetic Control of Flower Development by HomeoticGenes in Antirrhinum majus. Science 1990, 250, 931−936.(3) Shore, P.; Sharrocks, A. D. The MADS-box Family ofTranscription Factors. Eur. J. Biochem. 1995, 229, 1−13.(4) Norman, C.; Runswick, M.; Pollock, R.; Treisman, R. Isolationand Properties of cDNA Clones Encoding SRF, a Transcription Factorthat Binds to the c-Fos Serum Response Element. Cell 1988, 55, 989−1003.(5) Sharrocks, A. D.; Gille, H.; Shaw, P. E. Identification of AminoAcids Essential for DNA Binding and Dimerization in p67SRF:Implications for a Novel DNA-Binding Motif. Mol. Cell. Biol. 1993, 13,123−132.(6) Rezacova, B.; Coic, Y. M.; Zentz, C.; Turpin, P. Y.; Stepanek, J.Spectroscopic Determination of pKa Constants of MADS BoxSegments. Spectrosc. Int. J. 2012, 27, 455−461.(7) Thurlkill, R. L.; Grimsley, G. R.; Scholtz, J. M.; Pace, C. N. pKValues of the Ionizable Groups of Proteins. Protein Sci. 2006, 15,1214−1218.(8) Sela, M.; Katchalski, E. Spectrophotometric Titration of α-AminoAcid Copolymers Containing Tyrosine. J. Am. Chem. Soc. 1956, 78,3986−3989.(9) Pellegrini, L.; Song, T.; Richmond, T. J. Structure of SerumResponse Factor Core Bound to DNA. Nature 1995, 376, 490−498.(10) Mo, Y.; Ho, W.; Johnston, K.; Marmorstein, R. Crystal Structureof a Ternary SAP-1/SRF/c-fos SIRE DNA Complex. J. Mol. Biol. 2001,314, 495−506.(11) Gramzow, L.; Ritz, M. S.; Theissen, G. On the Origin of MADS-Domain Transcription Factors. Trends Genet. 2010, 26, 149−153.(12) Hassler, M.; Richmond, T. J. The B-box Dominates SAP-1-SRFInteractions in the Structure of the Ternary Complex. EMBO J. 2001,20, 3018−3028.(13) Stepanek, J.; Kopecky, V.; Mezzetti, A.; Turpin, P. Y.; Paulin, D.;Alpert, B.; Zentz, C. Structural and Dynamic Changes of the SerumResponse Element and the Core Domain of Serum Response FactorInduced by Their Association. Biochem. Biophys. Res. Commun. 2010,391, 203−208.(14) Kopecky, V.; Ettrich, R.; Hofbauerova, K.; Baumruk, V.Vibrational Sectroscopy and Computer Modeling of Proteins: SolvingStructure of Alpha(1)-Acid Glycoprotein. Spectrosc. Int. J. 2004, 18,323−330.(15) Chan, W. C.; White, P. D. Fmoc Solid Phase Peptide Synthesis: APractical Approach; Oxford University Press: London, 2000.(16) Palacky, J.; Mojzes, P.; Bok, J. SVD-Based Method for IntensityNormalization, Background Correction and Solvent Subtraction inRaman Spectroscopy Exploiting the Properties of Water StretchingVibrations. J. Raman Spectrosc. 2011, 42, 1528−1539.(17) Dousseau, F.; Therrien, M.; Pezolet, M. On the SpectralSubtraction of Water from the FT-IR Spectra of Aqueous Solutions ofProteins. Appl. Spectrosc. 1989, 43, 538−542.(18) Case, D. A.; Darden, T. A.; Cheatham, T. E.; Simmerling, C. L.;Wang, J.; Duke, R. E.; Luo, R.; Walker, R. C.; Zhang, W.; Merz, K. M.,et al. AMBER 11; University of California: San Francisco, 2010.(19) Hornak, V.; Abel, R.; Okur, A.; Strockbine, B.; Roitberg, A.;Simmerling, C. Comparison of Multiple Amber Force Fields andDevelopment of Improved Protein Backbone Parameters. Proteins2006, 65, 712−725.(20) Vanquelef, E.; Simon, S.; Marquant, G.; Garcia, E.; Klimerak, G.;Delepine, J. C.; Cieplak, P.; Dupradeau, F. Y. RED Server: a WebService for Deriving RESP and ESP Charges and Building Force FieldLibraries for New Molecules and Molecular Fragments. Nucleic AcidsRes. 2011, 39, W511−W517.
The Journal of Physical Chemistry B Article
dx.doi.org/10.1021/jp4099864 | J. Phys. Chem. B 2013, 117, 16086−1609516094

(21) Bayly, C. I.; Cieplak, P.; Cornell, W. D.; Kollman, P. A. A Well-Behaved Electrostatic Potential Based Method Using ChargeRestraints for Deriving Atomic Charges: the RESP Model. J. Phys.Chem. 1993, 97, 10269−10280.(22) Dupradeau, F. Y.; Pigache, A.; Zaffran, T.; Savineau, C.; Lelong,R.; Grivel, N.; Lelong, D.; Rosanski, W.; Cieplak, P. The R.E.D. Tools:Advances in RESP and ESP Charge Derivation and Force Field LibraryBuilding. Phys. Chem. Chem. Phys. 2010, 12, 7821−7839.(23) Granovsky, A. A. Firefly version 7.1.G. http://classic.chem.msu.su/gran/firefly/index.html (accessed June 19, 2012).(24) Phillips, J. C.; Braun, R.; Wang, W.; Gumbart, J.; Tajkhorshid,E.; Villa, E.; Chipot, C.; Skeel, R. D.; Kale, L.; Schulten, K. ScalableMolecular Dynamics with NAMD. J. Comput. Chem. 2005, 26, 1781−1802.(25) Miyamoto, S.; Kollman, P. A. Settle: An Analytical Version ofthe SHAKE and RATTLE Algorithm for Rigid Water Models. J.Comput. Chem. 1992, 13, 952−962.(26) Harvey, M. J.; Giupponi, G.; De Fabritiis, G. ACEMD:Accelerating Biomolecular Dynamics in the Microsecond Time Scale.J. Chem. Theory Comput. 2009, 5, 1632−1639.(27) Feenstra, K. A.; Hess, B.; Berendsen, H. J. C. ImprovingEfficiency of Large Time-Scale Molecular Dynamics Simulations ofHydrogen-Rich Systems. J. Comput. Chem. 1999, 20, 786−798.(28) Humphrey, W.; Dalke, A.; Schulten, K. VMD: Visual MolecularDynamics. J. Mol. Graphics 1996, 14, 33−38.(29) Kabsch, W.; Sander, C. Dictionary of Protein SecondaryStructure: Pattern Recognition of Hydrogen-Bonded and GeometricalFeatures. Biopolymers 1983, 22, 2577−2637.(30) Frisch, M. J.; Trucks, G. W.; Schlegel, H. B.; Scuseria, G. E.;Robb, M. A.; Cheeseman, J. R.; Scalmani, G.; Barone, V.; Mennucci,B.; Petersson, G. A., et al. Gaussian 09, Revision B01; Gaussian, Inc.:Wallingford CT, 2009.(31) Parr, R. G.; Yang, W. Density-Functional Theory of Atoms andMolecules; Oxford University Press: New York, 1994.(32) Perdew, J. P.; Burke, K.; Wang, Y. Generalized GradientApproximation for the Exchange-Correlation Hole of a Many-ElectronSystem. Phys. Rev. B 1996, 54, 16533−16539.(33) Ditchfield, R.; Hehre, W. J.; Pople, J. A. Self-ConsistentMolecular-Orbital Methods. IX. An Extended Gaussian-Type Basis forMolecular-Orbital Studies of Organic Molecules. J. Chem. Phys. 1971,54, 724−728.(34) Perdew, J. P.; Wang, Y. Accurate and Simple AnalyticRepresentation of the Electron-Gas Correlation Energy. Phys. Rev. B1992, 45, 13244−13249.(35) Klamt, A.; Schuurmann, G. COSMO: a New Approach toDielectric Screening in Solvents With Explicit Expressions for theScreening Energy and its Gradient. J. Chem. Soc., Perkin Trans. 2 (1972-1999) 1993, 799−805.(36) Klamt, A. COSMO and COSMO-RS. In The Encyclopedia ofComputational Chemistry; Schleyer, P. R.; Allinger, N. L.; Clark, T.;Gasteiger, J.; Kollman, P. A.; Schaefer III, H. F.; Schreiner, P. R., Eds.;John Wiley & Sons: Chichester, U. K., 1998; Vol. 1, pp 604−615.(37) Polavarapu, P. L. Vibrational Spectra: Principles and Applicationswith Emphasis on Optical Activity; Elsevier: Amsterdam, 1998; Vol. 85.(38) Suenaga, M. Facio: New Computational Chemistry Environ-ment for PC Gamess. J. Comput. Chem. Jpn. 2005, 4, 25−32.(39) Scott, A. P.; Radom, L. Harmonic Vibrational Frequencies: AnEvaluation of Hartree-Fock, Moller-Plesset, Quadratic ConfigurationInteraction, Density Functional Theory, and Semiempirical ScaleFactors. J. Phys. Chem. 1996, 100, 16502−16513.(40) Merrick, J. P.; Moran, D.; Radom, L. An Evaluation ofHarmonic Vibrational Frequency Scale Factors. J. Phys. Chem. A 2007,111, 11683−11700.(41) Lehninger, A. L.; Nelson, D. L.; Cox, M. M. Lehninger Principlesof Biochemistry, 4th ed.; W.H. Freeman: New York, 2004.(42) Drake, A. F.; Siligardi, G.; Gibbons, W. A. Reassessment of theElectronic Circular-Dichroism Criteria for Random Coil Conforma-tions of Poly(L-Lysine) and the Implications for Protein Folding andDenaturation Studies. Biophys. Chem. 1988, 31, 143−146.
(43) Gokce, I.; Woody, R. W.; Anderluh, G.; Lakey, J. H. SinglePeptide Bonds Exhibit Poly(pro)II (″Random Coil″) CircularDichroism Spectra. J. Am. Chem. Soc. 2005, 127, 9700−9701.(44) Simmons, N. S.; Glazer, A. N. An Analysis of the TyrosineCircular Dichroism Bands in Ribonuclease. J. Am. Chem. Soc. 1967, 89,5040−2.(45) Woody, R. W. In Comprehensive Chiroptical Spectroscopy;Beerova, N.; Polaravapu, P. L.; Nakanishi, K.; Woody, R. W., Eds.;John Wiley and Sons: Hoobokken, NJ, 2012; Vol. 2, p 475.(46) Tuma, R. Raman Spectroscopy of Proteins: from Peptides toLarge Assemblies. J. Raman Spectrosc. 2005, 36, 307−319.(47) Ludwig, M.; Asher, S. A. Ultraviolet Resonance RamanExcitation Profiles of Tyrosine: Dependence of Raman Cross Sectionson Excited-State Intermediates. J. Am. Chem. Soc. 1988, 110, 1005−1011.(48) Wilson, E. B., Jr. The Normal Modes and Frequencies ofVibration of the Regular Plane Hexagon Model of the BenzeneMolecule. Phys. Rev. 1934, 45, 706−714.(49) Johnson, C. R.; Ludwig, M.; Asher, S. A. Ultraviolet ResonanceRaman Characterization of Photochemical Transients of Phenol,Tyrosine, and Tryptophan. J. Am. Chem. Soc. 1986, 108, 905−912.(50) Tsuboi, M.; Ezaki, Y.; Aida, M.; Suzuki, M.; Yimit, A.; Ushizawa,K.; Ueda, T. Raman Scattering Tensors of Tyrosine. Biospectroscopy1998, 4, 61−71.(51) Siamwiza, M. N.; Lord, R. C.; Chen, M. C.; Takamatsu, T.;Harada, I.; Matsuura, H.; Shimanouchi, T. Interpretation of theDoublet at 850 and 830 cm−1 in the Raman Spectra of TyrosylResidues in Proteins and Certain Model Compounds. Biochemistry1975, 14, 4870−4876.(52) Tensmeyer, L. G.; Kauffman, E. W. Protein Structure asRevealed by Nonresonance Raman Spectroscopy. In Spectroscopicmethods for determining protein structure in solution; Havel, H. A., Ed.;VCH Publishers: New York, 1996; pp 69−95.(53) Pelton, J. T.; McLean, L. R. Spectroscopic Methods for Analysisof Protein Secondary Structure. Anal. Biochem. 2000, 277, 167−176.(54) Garnier, J.; Gibrat, J. F.; Robson, B. GOR Method for PredictingProtein Secondary Structure from Amino Acid Sequence. MethodsEnzymol. 1996, 266, 540−553.(55) Chou, P. Y.; Fasman, G. D. Conformational Parameters forAmino Acids in Helical, β-Sheet, and Random Coil Regions Calculatedfrom Proteins. Biochemistry 1974, 13, 211−222.(56) Barth, A. Infrared Sectroscopy of Proteins. Biochim. Biophys.Acta, Bioenerg. 2007, 1767, 1073−1101.(57) Barth, A. The Infrared Absorption of Amino Acid Side Chains.Prog. Biophys. Mol. Biol. 2000, 74, 141−173.(58) Palafox, M. A. Scaling Factors for the Prediction of VibrationalSpectra. I. Benzene Molecule. Int. J. Quantum Chem. 2000, 77, 661−684.
The Journal of Physical Chemistry B Article
dx.doi.org/10.1021/jp4099864 | J. Phys. Chem. B 2013, 117, 16086−1609516095