molecular value predictions: associations with beef...
TRANSCRIPT

5912
Molecular value predictions: Associations with beef quality, carcass, production, behavior, and efficiency phenotypes in Brahman cattle1
P. L. Greenwood,*†2 L. M. Cafe,*† B. L. McIntyre,*‡ G. H. Geesink,*§ J. M. Thompson,*§ R. Polkinghorne,# D. W. Pethick,*ǁ and D. L. Robinson*†
*Australian Cooperative Research Centre for Beef Genetic Technologies, University of New England, Armidale, NSW 2351, Australia; †NSW Department of Primary Industries, Beef Industry Centre, University of New
England, Armidale, NSW 2351, Australia; ‡Department of Agriculture and Food, Western Australia, South Perth, WA 6151, Australia; §Department of Meat Science, University of New England, Armidale, NSW 2351, Australia; #Marrinya Agricultural Enterprises, 70 Vigilantis Road, Wuk Wuk, Vic. 3875, Australia; and ǁSchool of Veterinary
and Biomedical Science, Murdoch University, Murdoch, WA 6150, Australia
ABSTRACT: Data from 2 previously published experiments, New South Wales (NSW; n = 161) and Western Australia (WA; n = 135), were used to test molecular value predictions (MVP), generated from commercially available gene markers, on economically important traits of Bos indicus (Brahman) cattle. Favorable tenderness MVP scores were associated with reduced shear force values of strip loin (LM) steaks aged 7 d from Achilles-hung carcasses (P ≤ 0.06), as well as steaks aged 1 (P ≤ 0.08) or 7 d (P ≤ 0.07) from carcasses hung from the pelvis (tenderstretch). Favorable tenderness MVP scores were also associated with improved consumer tenderness ratings for strip loin steaks aged 7 d and either Achilles hung (P ≤ 0.006) or tenderstretched (P ≤ 0.07). Similar results were observed in NSW for rump (top butt; gluteus medius) steaks, with favorable tenderness MVP scores associated with more tender (P = 0.006) and acceptable (P = 0.008) beef. Favorable marbling MVP scores were associated with
improved (P ≤ 0.021) marbling scores and intramuscular fat (IMF) content in the NSW experiment, despite low variation in marbling in the Brahman cattle. For the WA experiment, however, there were no (P ≥ 0.71) relationships between marbling MVP and marbling scores or IMF content. Although residual (net) feed intake (RFI) was not associated (P = 0.63) with the RFI (feed efficiency) MVP, the RFI MVP was adversely associated with LM tenderness and acceptability of 7-d-aged Achilles-hung carcasses in NSW (P ≤ 0.031) and WA (P ≤ 0.037). Some other relationships and trends were noted between the MVP and the other traits, but few reached statistical significance, and none were evident in both experiments. Results from this study provide evidence to support the use of the tenderness MVP. The value of the marbling MVP, which was associated with marbling in only 1 herd, warrants further evaluation; however, there appears to be no evidence to support use of the RFI MVP in Brahman cattle.
Key words: beef quality, Bos indicus, genetic markers, marbling, residual feed intake, SNP
© 2013 American Society of Animal Science. All rights reserved. J. Anim. Sci. 2013.91:5912–5925 doi:10.2527/jas2013-6960
1This work was possible because of the financial and in-kind sup-port and efforts of many individuals from the Australian Cooperative Research Centre for Beef Genetic Technologies, NSW Department of Primary Industries, QLD Department of Primary Industries and Fisheries, CSIRO Livestock Industries, the University of New England, WA Department of Agriculture and Food, South Australian Research and Development Institute, Victorian Department of Primary Industries, the Australian Brahman Breeders’ Association, John Dee Abattoir, Warwick QLD, and Harvey Beef (Harvey, WA). Financial and laboratory support for this research was also kindly provided by
Pfizer Animal Health– Animal Genetics who provided funding for the Meat & Livestock Australia Donor Company within which this work was performed, and who generated the Molecular Value Predictions. In particular, the support of Dr. Gerard Davis is acknowledged. Meat & Livestock Australia also provided Strategic Science funding towards this research.
2Corresponding author: [email protected] July 25, 2013.Accepted October 4, 2013.
Published November 24, 2014

Molecular value predictions in beef cattle 5913
INTRODUCTION
Genomic technologies have the potential to improve livestock production [National Beef Cattle Evaluation Consortium (NBCEC), 2012]. Some gene markers, or SNP, are reported to be associated with enhanced per-formance for commercial traits, including meat tender-ness and marbling (Barendse, 2009; Mullen et al., 2009) and feed efficiency (Barendse et al., 2007; Nkrumah et al., 2007; Sherman et al., 2008). Recently, panels of SNP have become commercially available (Van Eenennaam et al., 2007; DeVuyst et al., 2011), including a 56-SNP panel, which allows molecular value predictions (MVP) of breeding values to be calculated for tenderness, mar-bling, and residual (net) feed intake (RFI; Pfizer, 2009b).
There is a continuing need to evaluate associations between MVP and economically important traits in differ-ent commercial beef production and processing systems. There is also a need for evaluation of MVP against a broad-er range of production, carcass, and beef quality traits to quantify favorable or antagonistic relationships with other traits of interest. Improved tenderness is phenotypically associated with increased protein turnover (Koohmaraie et al., 2002), as well as with gene markers associated with protein turnover (Cafe et al., 2010b; Robinson et al., 2012), suggesting possible adverse associations of tenderness MVP with feed efficiency and marbling.
It was hypothesized that MVP generated from a com-mercially available SNP panel (Pfizer, 2009b) would have favorable associations with the traits (tenderness, marbling, and RFI) they are designed to predict but no unfavorable associations with other traits of economic importance. This hypothesis was tested using data from 2 previously published experiments (Cafe et al., 2010a, 2010b; Robinson et al., 2012) designed to examine tender-
ness gene markers and their interactions with production and processing factors in Bos indicus (Brahman) cattle.
MATERIALS AND METHODS
Cattle care and use as well as all procedures per-formed in these studies were approved by the New South Wales Department of Primary Industries Orange Agri-cultural Institute Animal Ethics Committee (approval numbers ORA 06/001 and ORA 06/004), Common-wealth Scientific and Industrial Research Organisation (CSIRO) Rockhampton Animal Experimentation Eth-ics Committee (approval number RH216–06), and the Department of Agriculture and Food, Western Australia Animal Ethics Committee (approval number 2-06-11). These experiments were originally designed to assess the effects of calpain-system gene markers (calpastatin, CAST; calpain 3, CAPN3; μ-calpain, CAPN1-4751, and CAPN1-316) on production and beef quality characteris-tics of Bos indicus (Brahman) cattle, as well as to iden-tify interactions of the gene markers with production [sex and hormonal growth promotant (HGP) implantation] and processing (carcass suspension, muscle, and dura-tion of the postmortem aging period) effects (Cafe et al., 2010a, 2010b; Robinson et al., 2012).
New South Wales Study
Brahman cattle were sourced at weaning (6 to 8 mo of age) from 4 commercial and 3 research herds (Spring-sure, Rockhampton, Marlborough, Julia Creek, and Mil-laroo regions of central and northern Queensland). All progeny were from natural matings. Pedigrees and birth dates were known for the 3 research herds, which sup-plied only heifers. The commercial herds supplied both steers and heifers, which were born during the same sea-son as the research herds and weaned at 7 to 8 mo of age; however, the commercial herds used 20 to 30 sires and could not provide pedigree information or individual birth dates of calves.
Blood samples were collected for DNA analysis before weaning of calves from research herds and after weaning in commercial herds. A total of 1,090 weaned calves were DNA tested (gene marker frequencies are shown in Table 1), and the results were used to select 164 steers and heifers in groups that were homozygous for favorable and unfavorable CAST and CAPN3 gene markers and as balanced as possible across groups for CAPN1 gene marker allelic status. The number of Brah-man cattle in the New South Wales (NSW) herd with MVP data, stratified by sex, implant status, and geno-type (number of favorable alleles) for calpain-system gene markers, is shown in Table 2. The cattle were transported to the Queensland Department of Primary
Table 1. Frequency (% of cattle tested) of favorable alleles for the 4 calpain-system gene markers in Brahman cattle in New South Wales and Western Australia (Cafe et al., 2010a)
Herd and gene marker
Gene markers1
0 1 2New South Wales (n = 1090)
CAST 17.0 42.6 40.3CAPN3 31.6 47.0 21.4CAPN1–4751 69.6 25.9 4.6CAPN1-316 93.2 6.8 0.0
Western Australia (n = 574)CAST 24.2 44.3 31.4CAPN3 19.4 41.7 38.9CAPN1-4751 49.3 40.4 10.3CAPN1-316 85.5 14.0 0.6
1Gene markers for CAST = calpastatin; CAPN3 = calpain 3; and CAPN1-4571 and CAPN1-316 = μ-calpain.

Greenwood et al.5914
Industries Brigalow Research Station (Theodore, Queensland, Australia), where they were held up to 4 wk while undergoing a cattle tick treatment program required for transport to Glen Innes, NSW, for back-grounding.
After 4 mo of grazing, calves were allocated to 4 backgrounding groups balanced for sex, gene marker status, origin, and previous management and were grazed an additional 2 mo. When necessary, calves were provided a pelleted energy supplement to main-tain growth during the winter. At the end of the 6-mo backgrounding period, all calves were transported to the Australian Cooperative Research Centre for Beef Genetic Technologies “Tullimba” Research Feedlot near Kingstown, NSW. Upon arrival calves were seg-regated by sex, and the design algorithms of Robin-son (2009) were used to allocate individual animals to treatment (implant/none) and management groups (8 large open bunk pens, then 20 automatic feeder pens), aiming for the greatest possible balance of genotypes, sex, BW, and treatments across property of origin and other management groups and to minimize the error variance of comparisons of marker and treatment ef-fects. For more details, see Robinson et al. (2007) and Robinson (2009).
After 2 wk in the feed yard during a 4-wk adap-tion period to grain-based diets, half of the cattle were implanted with an HGP containing 200 mg tren-bolone acetate and 20 mg estradiol-17β (Revalor-H; Virbac, Milperra, NSW, Australia). All cattle were fed a grain-based diet formulated to provide 12.0 MJ ME/kg, 16.0% CP, and 10.5% ADF (DM basis). Cattle were 17 to 19 mo of age at the end of the 117-d finish-ing period.
Feed Intake Measurement and Calculations. At the conclusion of the 4-wk adaption period, cattle were moved to the 20 intake pens (8 to 9 per pen), which contained an automated feed intake recorder that measured individual feed intake (Bindon, 2001) over a 70-d period. Cattle remained segregated by sex. During this test period, cattle were weighed weekly. It should be noted that 4 cattle did not eat from the automatic feeders, and 1 steer became ill during the final weeks, and at the end of the feed intake period, all cattle were returned to their original designated pens for 6 to 8 d before slaughter. The ADG was cal-culated by regressing individual BW over time for the 70-d intake test; the feed conversion ratio (FCR) for each animal was calculated by dividing DMI by ADG. Residual feed intake was calculated using a multiple linear regression of DMI on mean metabolic BW (MMW = mean BW0.73) and ADG (Arthur et al., 2001) as the error term (e) in the equation for DMI:
DMI = –3.18 + (0.129 × MMW) = (1.96 × ADG) + e (R2 = 0.78).
Western Australia Study
Brahman cattle were sourced at weaning (6 to 8 mo of age) from 4 producers in the Northern Agricultural Region of Western Australia (WA); no records of birth dates or sire and dam pedigrees were available for these calves. A total of 574 calves were tested for calpain-system gene marker status (gene marker frequencies are presented in Table 1); 173 steers were then selected on the basis of their initial DNA tests for the calpain-system gene markers to create similarly sized groups of cattle that were homozygous or heterozygous for favorable and unfavorable CAST and CAPN3 gene markers and as balanced as possible for CAPN1 gene marker allelic status. The selected cattle were transported to Vasse Re-search Station for backgrounding and finishing.
Table 2. Number of Brahman cattle stratified by sex, implant status, and genotype (number of favorable alleles) for calpain-system gene markers for which molecular value predictions (MVP) were determined in New South Wales (NSW) and Western Australia (WA)1
Factor NSW1 WASex
Heifer 79 —Steer 82 135
Implant status2
No HGP 80 68HGP 81 67
CAST3
0 65 391 — 482 76 48
CAPN33
0 87 311 5 582 69 46
CAPN1–47513
0 89 641 64 582 8 13
CAPN1-3163
0 146 1141 15 202 0 1
1Differences in total number of cattle within gene marker variables in the NSW herd from the experimental design criteria of Cafe et al. (2010a, 2010b) were due to reclassification of gene marker status of some cattle on validation testing and MVP not being able to be determined on a small number of cattle for which sensory data (DNA was extracted) were not collected.
2200 mg trenbolone acetate and 20 mg estradiol-17β (Revalor-H; Virbac, Milperra, NSW, Australia). HGP = hormonal growth promotant.
3Gene markers for CAST = calpastatin; CAPN3 = calpain 3; and CAPN1-4571 and CAPN1-316 = μ-calpain.

Molecular value predictions in beef cattle 5915
Calves were grazed for 6 mo on pasture in groups based solely on BW before allocation using the algo-rithms of Robinson (2009) into replicates (n = 4), feedlot pens (n = 12), and HGP implant treatments, balanced for gene marker status, property of origin, and previous management groups. After an additional 2 mo grazing pasture, steers were transferred to the pens in the feed-lot facility and, following a 2-wk adaption period, fed a high-grain diet containing 10.8 MJ ME/kg DM and 13.4% CP. As in the NSW experiment, half of the steers received a combination trenbolone acetate-estradiol-17β implant (Revalor-H; Virbac) 2 wk after arrival at the feed yard. At the end of the 80-d feedlot phase, steers were 21 to 24 mo of age. Table 2 shows numbers of cattle in the WA herd with MVP data, stratified by HGP implant status and genotype (number of favorable alleles) for calpain-system gene markers.
Data Collection
Cattle Temperament. Temperament was assessed at both locations during routine handling events through-out the experiment. Flight speed (m/s) was calculated from the electronically recorded time it took an ani-mal to cover approximately 1.7 m on release from the squeeze chute (Burrow et al., 1988).
Slaughter. The NSW cattle were transported 270 km to John Dee Abattoir (Warwick, Queensland, Austra-lia). The WA cattle were transported approximately 100 km to Harvey Beef plant (Harvey, Western Australia). After captive bolt stunning and exsanguination, standard AUS-MEAT carcasses (AUS-MEAT, 2007) were pre-pared and split into 2 sides. Rump (P8) fat depth was measured on each carcass, both sides weighed, and right sides were hung using a rope through the pelvic ligament (tenderstretch method of Thompson, 2002), whereas left sides were hung via the Achilles tendon. Both sides were subsequently placed in a chiller overnight; temper-ature and pH characteristics were described by Cafe et al. (2010b). No data were collected on 33 carcasses from the Harvey Beef plant because of a serious breakdown in the slaughter chain.
After an overnight chill, carcass sides were ribbed (quartered) between the 10th and 11th ribs and, within 20 min, graded according to Meat Standards Australia (2009). Data recorded included LM area (LMA), rib fat depth, meat color (1 = lightest to 9 = darkest; Meat Standards Australia, 2009), fat color (0 = whitest to 9 = darkest yellow; Meat Standards Australia, 2009), skel-etal maturity (100 = A00 to 590 = E90; USDA, 1997), and marbling score based on Australian (0 = Practically de-void to 6 = Abundant; Meat Standards Australia, 2009) and U.S. (100 = Practically Devoid00 to 1100 = Abun-dant00; USDA, 1997) scoring systems, as well as ultimate
muscle pH. All carcass data were collected by the same AUS-MEAT trained personnel at both slaughter facilities.
Objective Beef Quality. At approximately 20 (WA) and 28 h (NSW) postmortem, the LM, semitendinosus (ST), gluteus medius (GM), and supraspinatus (SS) were removed from the Achilles-hung carcasses; the LM was the only muscle excised from tenderstretch car-casses. The LM (from both Achilles- and tenderstretch-hung carcasses) was cut into 3 equal portions, and the ST was cut into 2 equal portions, which were vacuum packaged. One portion from each muscle was immedi-ately frozen at –20°C (1 d aged), and another was aged an additional 6 d at 1°C before freezing for storage at –20°C (7 d aged). Details of thawing, intramuscular fat (IMF) content, cooking, and instrumental shear force and compression are provided by Cafe et al. (2010b) in accordance with the protocols of Perry et al. (2001).
The third section of the LM from both carcass sus-pension treatments, as well as the GM and SS, were pro-cessed into 25-mm-thick steaks, individually wrapped, vacuum packaged in sets of 5 steaks/muscle, stored at 2°C, and at 7 d postmortem, packages of steaks were fro-zen at –20°C for consumer sensory testing according to the protocol described by Watson et al. (2008). Consumer recruitment, steak preparation, and sample service are provided in greater detail by Robinson et al. (2012). Con-sumers scored each sample for tenderness, juiciness, and liking the flavor on a 100-mm line, anchored at 0 (least favorable) and 100 (most favorable), and overall liking on a 100-mm line, anchored at 0 (least favorable) and 5 (most favorable). In addition, a meat quality score (MQ4) was calculated using the formula of Watson et al. (2008): MQ4 = (0.4 × tenderness score) + (0.1 × juiciness score) + (0.2 × flavor liking score) + (0.3 × overall liking score).
Molecular Value Predictions
The DNA, extracted from blood samples as described by Cafe et al. (2010a), was provided to Pfizer Animal Health Australia (Albion, Queensland, Australia). The MVP for tenderness (predicting Warner-Bratzler shear force at 14 d of postmortem aging), marbling (AUS-MEAT marble score), and RFI were calculated from re-sults of a panel of 56 SNP, with the aim of predicting true breeding values and resulting phenotypes (Pfizer, 2009b).
Development and validation of the MVP used a 4-step process described in detail by Pfizer (2009b): 1) marker discovery, 2) incorporation of individual mark-ers into panels for MVP and reliability predictions using “shrinkage” methodology, 3) internal assessment of as-sociations between MVP and phenotypes by Pfizer Ani-mal Genetics, and 4) independent validation of the MVP. The shrinkage methodology reduces the contribution of individual marker effects according to their estimated

Greenwood et al.5916
standard errors so that the more reliable makers carry more weight in the MVP prediction.
Details of the cattle populations used for develop-ment, internal refinement, and external validation of MVP are provided in Pfizer (2009b). Briefly, 5 popu-lations (n = 2,866 head) comprising 4 populations of Bos taurus cattle (n = 2,072 to 2,515 head) and 1 Bos taurus × Bos indicus composite population (n = 114 to 254 head) were used to develop the MVP.
Internal evaluation and refinement of calibrations and prediction equations were undertaken using a fur-ther 8 populations (total n = 4,455 head). Included were 6 Bos taurus populations, 1 Brangus population (n = 468 head) with RFI phenotypes, and 1 Santa Ger-trudis population (n = 206 to 230 head) with marbling score, shear force, and RFI phenotypes. The overall correlations between MVP and the phenotypes were 0.30 for tenderness, 0.12 for marbling, and 0.13 for RFI; reliabilities of the MVP for these traits were 49.1%, 25.5%, and 29.8%, respectively.
Independent validation was undertaken using 4 National Beef Cattle Evaluation Consortium popula-tions (NBCEC, 2011): A) European Maternal Line Composite bulls (n = 462 to 671 head), B) European Maternal Line Composite steers (n = 723 to 785 head), C) a Bos indicus–influenced composite (n = 390 to 394 head), and D) the Australian Beef Cooperative Research Centre multibreed population that included Angus, Brahman, Belmont Red, Hereford, Murray Grey, Santa Gertrudis, and Shorthorn cattle (n = 1,244 to 1,345 head).
In the external validation populations (Pfizer, 2009b), tenderness MVP was associated with shear force at 1-d aging (P ≤ 0.021) in all 3 populations (A, C, and D) where shear force was measured. Marbling was not measured in population A. Marbling MVP was or tended to be associated with marbling score and IMF content in populations B (P ≤ 0.146) and C (P ≤ 0.096) but not D (P ≥ 0.43). The RFI MVP was associated with RFI in populations A (P = 0.020) and D (P = 0.001) but not C (P > 0.50).
Statistical Analyses of NSW and WA Experiments
Statistical analyses were conducted by fitting lin-ear mixed models with the REML methodology of Robinson (1987) in Genstat (version 10, VSN Inter-national Ltd., Hemel Hempstead, UK). Because of subtle differences in experimental designs, experi-mental sites (NSW and WA) were analyzed separately. For each trait, individual animals were the experi-mental unit; the effect of each MVP was determined separately by including the MVP as a single covariate in the model fitted to each trait:
y = (other terms) + S × MVP + error, [1]
where S is the slope of the relationship between the trait of interest and the MVP.
Other fixed effects in the model were implant sta-tus and (NSW data only) sex. Random effects includ-ed property of origin, backgrounding replicate, feed-lot replicate, and sex × HGP implant status (NSW). Slaughter date and slaughter group were also includ-ed as random effects in the analyses of carcass and beef palatability traits. Additionally, the estimated percentage of Bos indicus inheritance was included as a covariate in the analyses of the WA data (Cafe et al., 2010a, 2010b); however, there were only a small number of cattle with some Bos taurus influence, and this did not affect the results. Associations between MVP and each trait were deemed significant at P < 0.05, with a P-value between 0.05 and 0.10 consid-ered a tendency.
When a relationship was identified between an MVP and a trait that it was designated to predict (i.e., tenderness traits for the tenderness MVP, mar-bling scores or IMF content for the marbling MVP, and RFI for the RFI MVP), the percentage of phe-notypic variation (%PV) explained by the MVP was calculated according to the equation of Thallman et al. (2009): %PV = S2PV(MVP)/PV(trait), where S = slope of the regression coefficient of the MVP from Eq. [1], PV(trait) = phenotypic variation of the trait, and PV(MVP) = phenotypic variation of the MVP, which was assumed to be equal to the observed vari-ance of the MVP.
The phenotypic variance of the trait (y) was cal-culated as S2Var(MVP) + RV, where RV was the residual variance from Eq. [1]. To enable compari-sons with the results of Johnston and Graser (2009), approximate percentages of genetic variation were derived as %PV/h2, using weighed heritability esti-mates of 20.7%, 33.0%, and 36.4% for shear force/sensory tenderness, marbling scores, and IMF con-tent, respectively.
Table 3. Molecular value predictions (MVP) for tenderness (shear force), marbling (AUS-MEAT marble scores), and residual feed intake (RFI) of Brahman cattle in New South Wales (NSW; n = 161) and Western Australia (WA; n = 135)MVP NSW WA
Mean SD Min Max Mean SD Min MaxTenderness, kg 0.49 0.15 0.14 0.81 0.43 0.16 0.08 0.84
Marbling1 –0.30 0.11 –0.71 –0.003 –0.29 0.12 –0.59 0.10
RFI, kg DM/d –0.04 0.20 –0.52 0.58 –0.07 0.19 –0.51 0.38
10 = Practically devoid to 6 = Abundant (Meat Standards Australia, 2009).

Molecular value predictions in beef cattle 5917
RESULTS AND DISCUSSION
Distributions of MVP
Distributions for each MVP at each experimental site were examined and found to be unimodal with only a small amount of skewness (Table 3). The tenderness MVP pre-dicts shear force, so lower values represent more tender beef. The marbling MVP predicts the AUS-MEAT marble score. The RFI MVP predicts RFI (difference between an animal’s expected ADFI based on BW and ADG), so a negative RFI MVP is indicative of a more efficient animal.
Relative to the full published range for the MVP, the range in the present study represented 50% and 57% (NSW and WA, respectively) of the full published range of tenderness MVP, which was –0.47 to 0.96 kg shear force (Pfizer, 2009a). For the marbling MVP, the range in the present study was 34% and 33% (NSW and WA, respectively) of the full range (–1.00 to 1.11; AUS-MEAT marbling score; Pfizer, 2009a), whereas the range in RFI MVP was 44% and 35% (NSW and WA, respectively) of the full range from –1.44 to 1.08 kg/d (Pfizer, 2009a). The observed ranges of MVP relative to the full published ranges probably reflect the assessment of Brahman cattle in the present study compared with Wagyu, Angus, Com-posite, and Shorthorn cattle used for development and refinement of the MVP (Pfizer, 2009b). Current MVP percentiles vary according to breed and breed type. For Australian Bos indicus breeds, the 90th to 1st percentile range for tenderness is from 0.57 to –0.17, compared with 0.17 to –0.33 for Bos taurus breeds (Pfizer, 2011).
It is important to recognize that the relationship between the 2 populations from which the experimental cattle were sourced is unknown, with no common sires. The present study was designed 1) to create 2 independent populations of Bos indicus cattle sourced from geographically distinct locations in distinctly different environments on opposite sides of Australia to test the robustness of the results for ef-fects of the calpain-system gene markers and MVP and 2) to make a detailed assessment of traits other than those for which the markers and MVP were developed within popu-lations of cattle run under commercial conditions.
Correlations Among MVP
There were no significant correlations among MVP at either site (P ≥ 0.10) except for a tendency toward a nega-tive correlation (P = 0.06) between the tenderness and RFI MVP in the NSW herd (Table 4). Even though the latter could be a chance effect, it may relate to weightings on the calpain-system gene markers that form part of the 56-SNP marker panel. Calpain activity and protein deg-radation affect tenderness, and lines of cattle divergently
selected for RFI were noted to differ in postslaughter cal-pastatin levels (McDonagh et al., 2001).
MVP and Corresponding Phenotypic Traits
Beef Quality Phenotypes. Cafe et al. (2010b) noted that average shear forces for 1- and 7-d-aged LM steaks from Achilles-hung carcasses from WA cattle were less than those from NSW cattle (Table 5). However, differ-ences in sensory and MQ4 scores between NSW and WA cattle were less pronounced (Table 5). Comparison be-tween the range for phenotypic values obtained in the present study and those of Johnston and Graser (2009) and NBCEC (2011) is of limited value because of pro-cessing differences, as well as other factors that varied across this and past experiments.
Marbling Phenotypes. The AUS-MEAT marbling scores ranged from 0 to 1, with means of 0.16 ± 0.37 and 0.26 ± 0.44 in NSW and WA, respectively (Table 6). De-scriptive statistics for other marbling and carcass traits are also presented in Table 6. The range of values for the marbling phenotypes in the present study was less than in the Johnston and Graser (2009) study, which included a purebred Bos indicus validation population.
Feed Efficiency Phenotypes. The range of RFI val-ues in the NSW herd was –3.69 to 3.09, with a mean of –0.07 ± 0.83 (Table 6); RFI was not measured in WA. Descriptive statistics for growth, flight speed, and intake traits are also presented in Table 6. The range of RFI values in the NSW herd was similar to the range for the purebred Bos indicus validation population in the study of Johnston and Graser (2009).
Association among MVP and All Phenotypic Traits
Tenderness MVP. In both NSW and WA, the ten-derness MVP was, or tended to be, associated with re-duced shear force (more tender beef) of 1- and 7-d-aged LM from tenderstretched sides and 7-d-aged LM from Achilles-hung sides (Table 7). In addition, tenderness MVP tended to be associated with lower shear force values in 1-d-aged ST from Achilles-hung carcasses of
Table 4. Correlations among molecular value predictions (MVP) for tenderness, marbling, and residual feed intake (RFI) in the New South Wales (NSW, n = 161; above diagonal) and Western Australian (WA, n = 135; below diagonal) herds
WA herd MVP correlations
NSW herd MVP correlations
Tenderness Marbling RFI
Tenderness 0.127 –0.148*
Marbling –0.007 0.034
RFI, kg DM/d 0.005 0.137
*P < 0.10.

Greenwood et al.5918
cattle from NSW; however, there were no associations of tenderness MVP with either compression force or drip loss (results not shown). There were favorable associa-tions, or tendencies toward favorable associations, be-tween tenderness MVP and tenderness, flavor, and MQ4 scores among cattle from both NSW and WA, but favor-able associations between tenderness MVP and juiciness and overall liking were only observed in the NSW herd (Table 8). In the LM from tenderstretched sides, tender-ness MVP was associated favorably with tenderness and overall liking ratings in the NSW herd and tended to be associated favorably with tenderness and MQ4 scores in the WA herd. Additionally, tenderness MVP was associ-ated favorably with tenderness, juiciness, flavor, overall
liking, and MQ4 scores for the GM in the NSW herd, but there were no associations with consumer sensory rat-ings for the GM from the WA herd (Table 9). There were no associations of tenderness MVP with any sensory as-sessment of the SS in either herd.
An important issue in comparing results of associa-tions between MVP and beef quality phenotypes is the lack of standardization of objectively measured tender-ness phenotypes and a scarcity of phenotypes for con-sumer-assessed eating quality and other measures of palatability. For example, other studies have assessed the palatability of 1- and 14-d-aged (NBCEC, 2011) or 2-d-aged (Johnston and Graser, 2009) LM from Achilles-hung carcasses but did not report any other
Table 5. Phenotypic statistics for beef quality traits in the New South Wales (NSW, n = 161) and Western Australian (WA, n = 135) herds
Trait1
NSW WAMean SD Minimum Maximum Mean SD Minimum Maximum
Shear force, NLM
1 d aged, Achilles hung 78.2 18.53 47.0 142.3 52.2 11.45 31.3 83.17 d aged, Achilles hung 68.1 17.63 32.7 126.0 49.5 10.25 28.4 84.51 d aged, tenderstretched 47.2 5.61 30.7 72.8 51.6 11.81 31.5 106.87 d aged, tenderstretched 45.6 5.56 32.6 66.9 46.0 9.63 28.7 90.3
Semitendinosus1 d aged, Achilles hung 56.3 6.54 40.7 72.9 54.0 8.05 38.2 78.27 d aged, Achilles hung 55.7 6.21 41.8 73.5 50.5 6.25 37.4 69.3
Sensory beef quality scoresLM (Achilles hung)
Tenderness1 38.9 11.89 12 75 40.3 12.51 14 69Juiciness1 46.6 10.75 16 70 47.4 10.99 24 75Flavor1 48.6 9.81 23 70 49.8 9.90 26 72Overall liking2 2.83 0.345 2.2 3.9 2.88 0.404 2.1 3.9MQ41,3 43.1 10.45 18 72 44.6 11.10 20 72
LM (Tenderstretched)Tenderness1 51.8 10.80 25 77 51.4 11.11 20 85Juiciness1 50.3 10.82 26 75 52.8 10.34 24 78Flavor1 55.0 9.58 30 77 56.6 9.32 33 77Overall liking2 3.17 0.359 2.4 2.9 3.19 0.362 2.3 42MQ41,3 52.8 9.85 28 75 53.6 9.74 26 78
Gluteus mediusTenderness1 47.7 11.73 15 77 46.8 11.09 21 79Juiciness1 51.5 9.87 31 74 50.6 10.27 30 76Flavor1 54.1 9.12 27 73 53.7 9.91 33 81Overall liking2 3.07 0.333 2.3 3.8 3.06 0.337 2.4 4.0MQ41,3 50.5 10.11 24 76 49.6 10.0 30 77
SupraspinatusTenderness1 70.0 9.60 46 90 69.0 9.42 45 92Juiciness1 71.3 8.33 51 88 70.2 7.69 50 89Flavor1 67.1 9.10 43 87 66.6 8.36 36 89Overall liking2 3.69 0.373 2.6 4.5 3.64 0.372 2.7 4.6MQ41,3 68.9 8.81 43 86 68.0 8.22 42 88
10 = least desirable to 100 = most desirable.20 = least liked to 5 = most liked.3Meat quality score (MQ4) = (0.4 × tenderness score) + (0.1 × juiciness score) + (0.2 × flavor score) + (0.3 × overall liking score).

Molecular value predictions in beef cattle 5919
objective or consumer assessments of beef palatability or results for other abattoir processing methods. This is in stark contrast to the present study, which measured phenotypes for a broad range of commercially impor-tant palatability characteristics under various process-ing conditions, both within and between experiments and between cuts of beef (Cafe et al., 2010b; Robinson et al., 2012). These issues are particularly important in identifying ways to improve eating quality in beef from Bos indicus cattle, which can have substantially inferior eating quality than beef from Bos taurus cattle (Robinson et al., 2012).
There were no associations between tenderness MVP and marbling or carcass traits (Table 10). There was, however, a tendency for tenderness MVP to have an unfavorable association with BW at the start of back-grounding in the NSW herd, but this apparent effect did
not persist (Table 11). Tenderness MVP also tended to have an unfavorable association with feedlot flight speed in both NSW and WA cattle, and this is consistent with the results of Cafe et al. (2010a) in the WA experiment, which revealed that cattle with 2 favorable alleles for 2 of the tenderness markers (CAPN14751 and CAPN3) had, or tended to have, greater flight speeds. However, phenotypic correlations for the directly measured traits were positive (Cafe et al., 2011), implying that cattle with greater flight speed measurements produced less tender beef.
Ideally, a 1-kg difference in tenderness MVP should produce a 1-kg (9.8 N) difference in shear force for the cut of meat, ageing period, and processing conditions used in the original calibration. The average slope (9.3 N) for 1- and 7-d-aged LM suggests that the calibration is both useful and reasonable.
Table 6. Phenotypic statistics for performance, behavior, and carcass traits in the New South Wales (NSW, n = 161) and Western Australian (WA, n = 135) herds
Trait
NSW WAMean SD Minimum Maximum Mean SD Minimum Maximum
Performance traitsStart background BW, kg 218 36.0 152 354 208 59.2 105 396Background ADG, g 717 118.6 394 1013 640 169.2 91 945End background BW, kg 321 38.1 238 421 342 35.6 240 468Feedlot ADG, kg 1.13 0.314 0.22 2.28 1.28 0.345 0.35 2.36Feedlot ending BW, kg 435 55.8 286 602 449 51.1 269 600Feedlot DMI, kg/d 8.0 1.36 4.5 12.5 — — — —Feedlot FCR1 7.5 2.39 3.9 27.3 — — — —Feedlot RFI2 –0.07 0.83 –3.69 3.09 — — — —
Behavior traitsBackground flight speed, m/s 1.82 0.669 0.73 3.99 1.56 0.419 0.61 3.02Feedlot flight speed, m/s 2.07 0.694 0.74 4.56 1.50 0.454 0.61 2.75DMI/feeding session, kg 1.02 0.886 0.28 5.12 — — — —Feeding time, s/d 4,403 1,232 1,050 7,950 — — — —Feed sessions, no./d 11.7 6.14 1.4 30.5 — — — —
Carcass traitsHCW, kg 243 32.3 157 338 242 25.7 151 315LM area, cm2 60 8.6 41 82 64 6.3 46 77Skeletal maturity3 152 20.9 120 280 138 16.1 100 190Rump (P8) fat, mm 12.0 2.61 8 25 8.0 2.56 3 1810th rib fat, mm 6.2 2.08 2 17 5.3 2.38 0 14AUS-MEAT marbling score4 0.16 0.366 0 1 0.26 0.440 0 1USDA marbling score5 261 66.2 130 440 293 61.9 130 410Intramuscular fat % 1.90 0.750 0.15 4.04 2.14 0.946 0.56 5.43Fat color score6 0.43 0.588 0 2 0.70 0.641 0 3Lean color score7 2.84 1.070 2 6 2.72 1.051 2 8Ultimate pH 5.49 0.051 5.36 5.80 5.57 0.085 5.41 6.25
1Feed conversion ratio, kg DM/kg gain.2Residual (net) feed intake, kg DM/d.3100 = A00 to 590 = E90 (USDA, 1997).40 = Practically devoid to 6 = Abundant (Meat Standards Australia, 2009).5100 = Practically Devoid00 to 1100 = Abundant00 (USDA, 1997).60 = whitest to 9 = darkest yellow (Meat Standards Australia, 2009).71 = lightest to 9 = darkest (Meat Standards Australia, 2009).

Greenwood et al.5920
Table 7. Estimates (slope) of the relationship of a 1.0-unit change in molecular value predictions (MVP) with shear force values of the LM and semitendinosus (ST) from Brahman cattle from New South Wales (NSW; n = 161) and Western Australia (WA; n = 135)
Trait
Site
Tenderness MVP Marbling MVP RFI MVP2
Estimate SE P-value %Var1 Estimate SE P-value Estimate SE P-valueLM shear force, N
1 d aged, Achilles hung NSW 6.2 8.33 0.46 14.2 11.28 0.21 3.3 6.64 0.62WA 1.0 6.11 0.87 6.0 8.04 0.46 8.2 5.16 0.12
7 d aged, Achilles hung NSW 15.5 7.99 0.06 2.6 (12.4) 6.9 10.60 0.51 –11.2 6.19 0.07WA 17.8 5.14 0.001 9.1 (44.2) 7.8 7.12 0.27 –2.1 4.78 0.66
1 d aged, Tenderstretched NSW 7.2 2.48 0.004 5.5 (26.6) –2.9 3.39 0.39 –1.6 1.98 0.43WA 11.0 6.15 0.08 2.6 (12.5) –0.81 8.099 0.92 0.41 5.302 0.94
7 d aged, Tenderstretched NSW 4.9 2.61 0.07 2.3 (11.1) 1.7 3.49 0.62 –2.9 2.03 0.15WA 11.0 4.97 0.029 4.0 (19.3) –10.4 6.96 0.14 –0.35 4.486 0.94
ST shear force, N1 d aged, Achilles hung NSW 6.0 3.13 0.06 2.4 (11.6) –2.0 4.21 0.64 2.0 2.43 0.41
WA 5.4 4.47 0.23 3.0 5.91 0.61 –3.7 3.83 0.347 d aged, Achilles hung NSW 4.5 3.04 0.14 –5.7 4.12 0.17 –1.0 2.37 0.68
WA 3.9 3.39 0.25 –0.28 4.479 0.95 0.65 2.915 0.82
1Percentage of phenotypic variation explained by tenderness MVP, if P-value for slope < 0.1. Values in parentheses are percentage of genetic variation explained, assuming h2 = 20.7%.
2Residual (net) feed intake.
Table 8. Estimates (slope) of the relationship of a 1.0-unit change in molecular value predictions (MVP) with consumer sensory scores for 7-d-aged LM steaks from Brahman cattle from New South Wales (NSW; n = 161) and Western Australia (WA; n = 135)
Trait
Site
Tenderness MVP Marbling MVP RFI MVP2
Estimate SE P-value %Var1 Estimate SE P-value Estimate SE P-valueLM, Achilles hung
Tenderness3 NSW –19.11 5.879 0.001 6.9 (33.3) –4.85 8.051 0.55 12.14 4.621 0.010WA –17.30 6.178 0.006 6.0 (29.2) –0.29 8.354 0.97 11.73 5.364 0.031
Juiciness3 NSW –11.92 5.798 0.042 2.9 (13.8) 7.51 7.669 0.33 11.46 4.458 0.011WA –7.73 5.662 0.17 0.58 7.556 0.94 8.25 4.848 0.091
Flavor3 NSW –12.39 5.198 0.018 3.8 (18.4) –7.86 6.908 0.26 6.08 4.049 0.14WA –8.15 4.678 0.084 2.4 (11.7) 1.01 6.241 0.87 4.27 3.987 0.29
Overall liking4 NSW –0.44 0.177 0.015 4.0 (19.5) –0.16 0.237 0.51 0.297 0.138 0.033WA –0.28 0.197 0.163 0.03 0.262 0.93 0.18 0.170 0.30
MQ43,5 NSW –16.17 5.342 0.003 6.0 (28.9) –5.16 7.206 0.48 9.11 4.192 0.031WA –12.49 5.340 0.021 4.2 (20.3) 0.12 7.215 0.99 9.75 4.617 0.037
LM, tenderstretchedTenderness3 NSW –12.44 5.647 0.029 3.2 (15.7) 1.88 7.491 0.80 –2.57 4.328 0.55
WA –10.88 5.926 0.07 2.7 (13.0) 1.08 7.870 0.89 8.35 5.035 0.10Juiciness3 NSW –1.09 5.823 0.85 0.15 7.609 0.98 0.62 4.398 0.89
WA –7.22 5.554 0.20 –0.9 7.340 0.90 3.91 4.673 0.40Flavor3 NSW –2.77 5.197 0.60 –3.30 6.804 0.63 –1.74 3.926 0.66
WA –7.26 5.215 0.17 2.68 6.850 0.70 3.63 4.387 0.41Overall liking4 NSW –0.39 0.187 0.042 2.9 (13.8) 0.02 0.249 0.92 0.03 0.145 0.85
WA –0.24 0.198 0.23 0.09 0.261 0.72 0.24 0.165 0.16MQ43,5 NSW –8.01 5.231 0.13 –0.17 6.882 0.98 –2.56 3.981 0.52
WA –9.58 5.221 0.07 2.7 (13.0) 0.83 6.942 0.91 5.70 4.428 0.20
1Percentage of phenotypic variation explained by tenderness MVP, if P-value for slope < 0.1. Values in parentheses are percentage of genetic variation explained, assuming h2 = 20.7%.
2Residual (net) feed intake.30 = least desirable to 100 = most desirable.40 = least liked to 5 = most liked.5Meat quality score (MQ4) = (0.4 × tenderness score) + (0.1 × juiciness score) + (0.2 × flavor score) + (0.3 × overall liking score).

Molecular value predictions in beef cattle 5921
Tenderness MVP explained 2.4% to 9.1% of the phenotypic variation in shear force traits, virtually iden-tical to the phenotypic variation reported by Johnston and Graser (2009) in 2 unrelated data sets of Bos indicus cattle. Using the weighted mean estimate of 20.7% for shear force heritability from Johnston and Graser (2009), the tenderness MVP explained 11% to 44% of the ge-netic variation in shear force, implying that the inclusion of the tenderness MVP in a selection index could be a useful strategy.
Ultimately, consumer satisfaction depends on cooked beef palatability. The tenderness MVP was con-sistently associated with improved consumer-assessed palatability of the LM from Achilles-hung carcasses but less consistently for LM from tenderstretched car-casses. Consumer palatability ratings for the GM were also correlated with tenderness MVP in the NSW herd. This demonstrates the potential of tenderness MVP for improving the palatability attributes of muscles with the capacity to age, such as the LM and GM. These findings are consistent with the effects of calpain-system tender-
ness gene markers on tenderness (Cafe et al., 2010b; Johnston and Graser, 2010; Robinson et al., 2012), par-ticularly in muscles with the capacity to age (Cafe et al., 2010b; Robinson et al., 2012) but not other traits (Cafe et al., 2010a, 2011), apart from minor effects on fatness (Wolcott and Johnston, 2009).
The contribution of the calpain-system gene markers to the tenderness MVP is not publicly known; however, inclusion of the gene marker status for the calpain-system markers in the statistical models of the present study re-sulted in the disappearance of statistical significance of the tenderness MVP in relation to shear forces and eating quality (L. M. Cafe, D. L. Robinson, and P. L. Greenwood, unpublished data). This suggests that despite it not being known whether any of the calpain-system gene markers are causal, they were major contributors to the improve-ment in tenderness from tenderness MVP. In the current data set, 3 of the 4 calpain-system markers explained 44% and 43% of the variation in tenderness MVP in the NSW and WA herds, whereas adding the CAPN3 marker pro-duced only a marginal change in R2. If tenderness is to
Table 9. Estimates (slope) of the relationship of a 1.0-unit change in molecular value predictions (MVP) with consumer sensory scores for steaks from the gluteus medius (GM) and supraspinatus (SS) of Brahman cattle from New South Wales (NSW; n = 161) and Western Australia (WA; n = 135)
Trait
Site
Tenderness MVP Marbling MVP RFI MVP2
Estimate SE P-value %Var1 Estimate SE P-value Estimate SE P-valueGM sensory score
Tenderness3 NSW –16.59 6.000 0.006 4.8 (23.2) 2.65 8.192 0.75 3.08 4.732 0.52WA –4.40 5.756 0.45 5.80 7.454 0.44 5.27 4.911 0.29
Juiciness3 NSW –11.54 5.183 0.028 3.2 (15.2) –3.08 7.031 0.66 4.68 4.040 0.25WA –4.26 5.491 0.44 2.29 7.157 0.75 3.95 4.685 0.40
Flavor3 NSW –10.17 4.721 0.034 2.9 (14.2) –5.10 6.371 0.43 –0.98 3.69 0.79WA –3.29 5.395 0.54 12.22 6.925 0.08 5.14 4.612 0.27
Overall liking4 NSW –0.50 0.170 0.004 5.4 (26.2) –0.05 0.234 0.85 0.046 0.135 0.73WA –0.14 0.181 0.45 0.49 0.232 0.037 0.05 0.156 0.75
MQ43,5 NSW –13.87 5.174 0.008 4.5 (21.8) 0.57 7.075 0.94 1.62 4.086 0.69WA –4.88 5.270 0.36 8.55 6.802 0.21 4.48 4.513 0.32
SS sensory scoreTenderness3 NSW –1.25 5.215 0.81 3.30 7.184 0.65 3.50 4.029 0.39
WA –6.67 5.130 0.20 –2.94 6.630 0.66 7.77 4.340 0.08Juiciness3 NSW –2.15 4.462 0.63 0.37 6.16 0.95 3.40 3.451 0.33
WA –0.87 4.329 0.84 –1.19 5.606 0.83 7.87 3.606 0.031Flavor3 NSW –3.66 4.728 0.44 –3.05 6.543 0.64 2.57 3.696 0.49
WA –4.33 4.651 0.35 –6.79 5.969 0.26 5.26 3.949 0.19Overall liking4 NSW –0.14 0.199 0.47 –0.02 0.276 0.94 0.10 0.156 0.51
WA –0.16 0.212 0.45 –0.34 0.273 0.21 –0.01 0.181 0.95MQ43,5 NSW –3.17 4.684 0.50 0.42 6.483 0.95 3.33 3.648 0.36
WA –5.70 4.525 0.21 –5.69 5.827 0.33 5.68 3.843 0.141Percentage of phenotypic variation explained by tenderness MVP, if P-value for slope < 0.1. Values in parentheses are percentage of genetic variation
explained, assuming h2 = 20.7%.2Residual (net) feed intake.30 = least desirable to 100 = most desirable.40 = least liked to 5 = most liked.5Meat quality score (MQ4) = (0.4 × tenderness score) + (0.1 × juiciness score) + (0.2 × flavor score) + (0.3 × overall liking score).

Greenwood et al.5922
be incorporated into a selection index for breeding herds, a selection function is required that clearly and validly predicts tenderness for the range of breeding herds that will use it. Results of this study confirm the potential of the current tenderness MVP, which is readily available to cattle breeders, to serve this purpose.
There were large differences between NSW and WA in the rate of pH and temperature decline of the carcasses during processing (Cafe et al., 2010b), which resulted in differences between sites in the postmortem tenderization process. Despite this, the overall consistency of the effects of the tenderness MVP on cooked beef palatability, includ-ing tenderness and overall liking, by consumers in the 2 experiments suggested robustness in the associations be-tween tenderness MVP and palatability traits in Brahman carcasses processed under widely different conditions.
Marbling MVP. A favorable marbling MVP was asso-ciated with more marbling in the NSW but not the WA herd (Table 10) for the very limited range of marbling MVP and marbling scores and IMF in Brahman cattle (Table 6). The
marbling MVP explained approximately 3.4% to 6.5% of the phenotypic variation in marbling assessments (Table 10). In this regard, the reliability of individual gene mark-ers for marbling has been shown to be poor (Hocquette et al., 2010; Johnston and Graser, 2010), suggesting the value of using the marbling MVP for selection may be lim-ited in Brahman cattle. In fact, Johnston and Graser (2009) reported that the marbling MVP explained only 0.1% of the phenotypic variation and 0.4% of the genetic variation in IMF content in purebred Bos indicus breeds. Yet Igenity (Lincoln, NE) panel scores for marbling had a genotypic correlation of 0.63 with USDA quality grades (DeVuyst et al., 2011), and there were significant associations be-tween marbling MVP and marbling phenotypes in a North American Bos indicus–influenced validation population (NBCEC, 2011). Further elucidation of the biology of intramuscular adipocyte development and accumulation of IMF using genomic, transcriptomic, and proteomic techniques should enhance the capacity to identify useful markers for marbling in beef cattle (Hocquette et al., 2010).
Table 10. Estimates (slope) of the relationship of a 1.0-unit change in molecular value predictions (MVP) with carcass characteristics of Brahman cattle from New South Wales (NSW: n = 161) and Western Australia (WA; n = 135) Trait
Site
Tenderness MVP Marbling MVP RFI MVP2
Estimate SE P-value Estimate SE P-value %Var1 Estimate SE P-valueHCW, kg NSW –8.2 12.68 0.52 –20.5 17.29 0.24 –3.4 10.25 0.74
WA 1.7 11.10 0.88 –17.1 14.27 0.23 –9.6 9.28 0.30LM area, cm2 NSW –3.7 3.53 0.29 –5.2 4.80 0.28 –0.10 2.821 0.97
WA –2.4 3.36 0.47 3.2 4.37 0.45 3.8 2.82 0.18Skeletal maturity3 NSW 4.7 8.21 0.57 –8.3 11.02 0.45 –0.69 6.628 0.92
WA –0.43 7.64 0.96 1.3 10.05 0.90 –1.9 6.41 0.77Rump (P8) fat, mm NSW –0.9 1.41 0.50 –0.48 1.87 0.80 –0.74 1.079 0.49
WA 0.73 1.381 0.60 0.44 1.83 0.81 0.63 1.165 0.5910th rib fat, mm NSW –0.6 1.06 0.59 2.3 1.41 0.10 0.06 0.814 0.95
WA –1.5 1.31 0.25 –0.58 1.749 0.74 –0.50 1.112 0.66AUS-MEAT marbling score4 NSW 0.2 0.22 0.32 1.0 0.29 0.001 6.5 (19.6) –0.22 0.172 0.20
WA –0.05 0.242 0.85 0.12 0.315 0.71 0.37 0.201 0.07USDA marbling score5 NSW 1.9 34.20 0.96 107.3 45.83 0.021 3.4 (10.3) –66.5 26.35 0.013
WA –3.4 32.95 0.92 15.1 42.83 0.73 4.3 27.69 0.88Intramuscular fat, % NSW 0.03 0.367 0.95 1.6 0.49 0.002 6.4 (17.6) –1.08 0.279 <0.001
WA –0.12 0.456 0.79 –0.03 0.600 0.96 0.24 0.384 0.54Fat color score6 NSW –0.01 0.188 0.95 0.12 0.250 0.63 –0.02 0.144 0.87
WA –0.05 0.373 0.91 –0.24 0.482 0.62 0.13 0.303 0.67Lean color score7 NSW 0.64 0.498 0.20 –0.13 0.671 0.85 –0.11 0.386 0.78
WA 0.25 0.486 0.61 –0.60 0.641 0.35 –0.47 0.409 0.25Ultimate pH NSW 0.03 0.023 0.19 0.07 0.032 0.025 –0.01 0.019 0.75
WA –0.04 0.029 0.15 0.03 0.039 0.39 –0.05 0.024 0.031
1Percentage of phenotypic variation explained by marbling MVP for marble score and intramuscular fat for traits where P ≤ 0.10 for the slope. Values in parentheses are percentage of genetic variation explained, assuming h2 = 33.0% for marbling scores and 36.4% for intramuscular fat percentage.
2Residual (net) feed intake.3100 = A00 to 590 = E90 (USDA, 1997).40 = Practically devoid to 6 = Abundant (Meat Standards Australia, 2009).5100 = Practically Devoid00 to 1,100 = Abundant00 (USDA, 1997).60 = whitest to 9 = darkest yellow (Meat Standards Australia, 2009).71 = lightest to 9 = darkest (Meat Standards Australia, 2009).
Molecular value predictions in beef cattle 5923
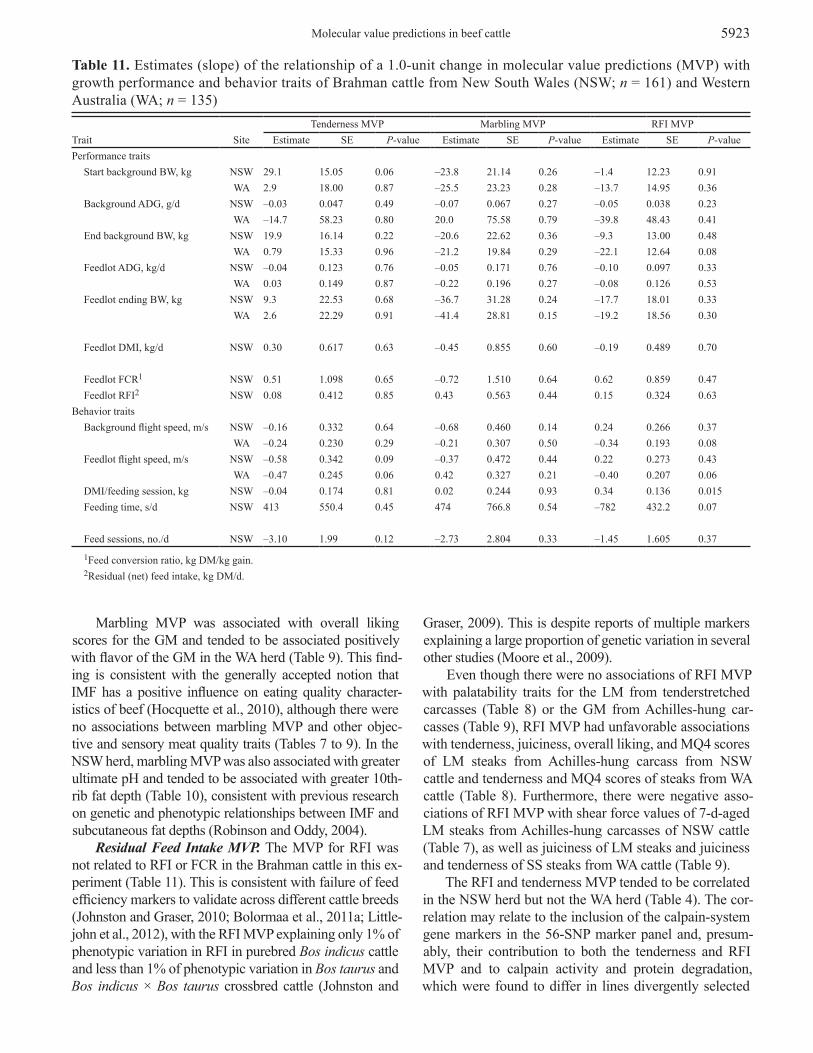
Marbling MVP was associated with overall liking scores for the GM and tended to be associated positively with flavor of the GM in the WA herd (Table 9). This find-ing is consistent with the generally accepted notion that IMF has a positive influence on eating quality character-istics of beef (Hocquette et al., 2010), although there were no associations between marbling MVP and other objec-tive and sensory meat quality traits (Tables 7 to 9). In the NSW herd, marbling MVP was also associated with greater ultimate pH and tended to be associated with greater 10th-rib fat depth (Table 10), consistent with previous research on genetic and phenotypic relationships between IMF and subcutaneous fat depths (Robinson and Oddy, 2004).
Residual Feed Intake MVP. The MVP for RFI was not related to RFI or FCR in the Brahman cattle in this ex-periment (Table 11). This is consistent with failure of feed efficiency markers to validate across different cattle breeds (Johnston and Graser, 2010; Bolormaa et al., 2011a; Little-john et al., 2012), with the RFI MVP explaining only 1% of phenotypic variation in RFI in purebred Bos indicus cattle and less than 1% of phenotypic variation in Bos taurus and Bos indicus × Bos taurus crossbred cattle (Johnston and
Graser, 2009). This is despite reports of multiple markers explaining a large proportion of genetic variation in several other studies (Moore et al., 2009).
Even though there were no associations of RFI MVP with palatability traits for the LM from tenderstretched carcasses (Table 8) or the GM from Achilles-hung car-casses (Table 9), RFI MVP had unfavorable associations with tenderness, juiciness, overall liking, and MQ4 scores of LM steaks from Achilles-hung carcass from NSW cattle and tenderness and MQ4 scores of steaks from WA cattle (Table 8). Furthermore, there were negative asso-ciations of RFI MVP with shear force values of 7-d-aged LM steaks from Achilles-hung carcasses of NSW cattle (Table 7), as well as juiciness of LM steaks and juiciness and tenderness of SS steaks from WA cattle (Table 9).
The RFI and tenderness MVP tended to be correlated in the NSW herd but not the WA herd (Table 4). The cor-relation may relate to the inclusion of the calpain-system gene markers in the 56-SNP marker panel and, presum-ably, their contribution to both the tenderness and RFI MVP and to calpain activity and protein degradation, which were found to differ in lines divergently selected
Table 11. Estimates (slope) of the relationship of a 1.0-unit change in molecular value predictions (MVP) with growth performance and behavior traits of Brahman cattle from New South Wales (NSW; n = 161) and Western Australia (WA; n = 135)
Trait
Site
Tenderness MVP Marbling MVP RFI MVPEstimate SE P-value Estimate SE P-value Estimate SE P-value
Performance traitsStart background BW, kg NSW 29.1 15.05 0.06 –23.8 21.14 0.26 –1.4 12.23 0.91
WA 2.9 18.00 0.87 –25.5 23.23 0.28 –13.7 14.95 0.36Background ADG, g/d NSW –0.03 0.047 0.49 –0.07 0.067 0.27 –0.05 0.038 0.23
WA –14.7 58.23 0.80 20.0 75.58 0.79 –39.8 48.43 0.41End background BW, kg NSW 19.9 16.14 0.22 –20.6 22.62 0.36 –9.3 13.00 0.48
WA 0.79 15.33 0.96 –21.2 19.84 0.29 –22.1 12.64 0.08Feedlot ADG, kg/d NSW –0.04 0.123 0.76 –0.05 0.171 0.76 –0.10 0.097 0.33
WA 0.03 0.149 0.87 –0.22 0.196 0.27 –0.08 0.126 0.53Feedlot ending BW, kg NSW 9.3 22.53 0.68 –36.7 31.28 0.24 –17.7 18.01 0.33
WA 2.6 22.29 0.91 –41.4 28.81 0.15 –19.2 18.56 0.30
Feedlot DMI, kg/d NSW 0.30 0.617 0.63 –0.45 0.855 0.60 –0.19 0.489 0.70
Feedlot FCR1 NSW 0.51 1.098 0.65 –0.72 1.510 0.64 0.62 0.859 0.47Feedlot RFI2 NSW 0.08 0.412 0.85 0.43 0.563 0.44 0.15 0.324 0.63
Behavior traitsBackground flight speed, m/s NSW –0.16 0.332 0.64 –0.68 0.460 0.14 0.24 0.266 0.37
WA –0.24 0.230 0.29 –0.21 0.307 0.50 –0.34 0.193 0.08Feedlot flight speed, m/s NSW –0.58 0.342 0.09 –0.37 0.472 0.44 0.22 0.273 0.43
WA –0.47 0.245 0.06 0.42 0.327 0.21 –0.40 0.207 0.06DMI/feeding session, kg NSW –0.04 0.174 0.81 0.02 0.244 0.93 0.34 0.136 0.015Feeding time, s/d NSW 413 550.4 0.45 474 766.8 0.54 –782 432.2 0.07
Feed sessions, no./d NSW –3.10 1.99 0.12 –2.73 2.804 0.33 –1.45 1.605 0.37
1Feed conversion ratio, kg DM/kg gain.2Residual (net) feed intake, kg DM/d.

Greenwood et al.5924
for RFI (McDonagh et al., 2001). However, the lack of association between RFI measurements in the NSW herd and the RFI MVP suggests that protein turnover repre-sents only a small proportion of the complex trait repre-senting feed efficiency and that the RFI MVP will need to be recalibrated, possibly using a wider set of SNP, before it could be recommended for use in Brahman cattle.
The RFI MVP had favorable associations with USDA marbling scores and IMF content in the NSW herd but an unfavorable association with ultimate pH in the WA herd. In WA, there was a tendency for the RFI MVP to be associated unfavorably with AUS-MEAT marbling scores. In the NSW herd, where feed intake and effi-ciency were measured, RFI MVP was associated with intake per session and tended to be associated with feed-ing time (Table 11). In the WA herd, there were tenden-cies for the RFI MVP to be associated favorably with the end of backgrounding BW and unfavorably with back-grounding and feedlot flight speeds (Table 11).
These findings do not support the use of the current RFI MVP in Brahman cattle. Indeed, because numer-ous factors, including growth and maintenance of body components, are known to contribute to feed conversion efficiency of beef cattle (Robinson and Oddy, 2004) and because RFI is a complex, index-based trait, the capacity to develop markers for this and other traits would be en-hanced by genome-wide association studies on the com-ponent traits that contribute to RFI, including a wider range of biological phenotypes (Hocquette et al., 2012; Pollak et al., 2012).
CONCLUSIONS
The findings of the present study demonstrated good consistency between experiments in effects of the MVP across Brahman cattle, and they confirm that tender-ness MVP were favorably associated with objective and consumer assessments of beef quality, with little or no adverse effects on the other traits assessed. Therefore, tenderness MVP may be potentially useful in genetic improvement programs and prediction of genotypes for Brahman cattle, although it might not explain much ad-ditional variation in tenderness beyond that explained by the calpastatin and calpain gene markers. The results for marbling MVP were inconsistent between the NSW and WA herds across the limited ranges of marbling scores and IMF content, although there were few adverse ef-fects of marbling MVP on other traits. Consequently, further evaluation in Brahman cattle is warranted before use of the marbling MVP could be recommended for ge-netic selection or prediction of phenotypes for Brahmans. The utility of the marbling MVP will depend on the cost of the test relative to a seemingly inconsistent benefit. By contrast, the RFI MVP was not associated with feed
efficiency and had adverse effects on beef eating quality traits; thus, results of this study do not support the use of the RFI MVP in Brahman cattle. On the basis of the evidence presented in this paper, there is little reason to believe that the markers on the 56-SNP panel are causal for marbling or feed efficiency.
The development of improved MVP for feed effi-ciency and other traits will require large-scale discovery and validation of SNP from genome-wide association studies (Bolormaa et al., 2011a, 2011b, 2013; Eggen, 2012) and SNP panels, which are becoming increasingly available commercially, with more gene markers con-tributing to genotypic and phenotypic variation. Their utility would be enhanced by the development of phe-notyping systems with more efficient, higher throughput and standardized phenotyping, particularly for difficult to measure traits, such as cooked beef palatability and FCR, that allow for deeper biological phenotyping, en-abling meaningful biological phenotypes to contribute to commercial traits (Hocquette et al., 2012; Pollak et al., 2012). This is likely to be particularly important for complex, index-based traits, such as FCR and RFI, so that variation in the component traits and their biology can be determined and would enhance the capacity to identify causal mutations.
LITERATURE CITEDArthur, P. F., J. A. Archer, D. J. Johnston, R. M. Herd, E. C. Rich-
ardson, and P. F. Parnell. 2001. Genetic and phenotypic vari-ance and covariance components for feed intake, feed efficien-cy, and other postweaning traits in Angus cattle. J. Anim. Sci. 79:2805–2811.
AUS-MEAT. 2007. AUS-MEAT national accreditation standards. AUS-MEAT Ltd., Brisbane, Australia.
Barendse, W. 2009. Genetic-based diagnostic tools for predicting beef quality. In: J. P. Kerry and D. Ledward, editors, Improv-ing the sensory and nutritional quality of fresh meat. Woodhead, Cambridge. p. 292–317.
Barendse, W., A. Reverter, R. J. Bunch, B. E. Harrison, W. Barris, and M. B. Thomas. 2007. A validated whole-genome association study of efficient food conversion in cattle. Genetics 176:1893–1905.
Bindon, B. M. 2001. Genesis of the Cooperative Research Centre for the Cattle and Beef Industry: Integration of resources for beef quality research (1998–2000). Aust. J. Exp. Agric. 41:843–853.
Bolormaa, S., B. J. Hayes, K. Savin, R. Hawken, W. Barendse, P. F. Arthur, R. M. Herd, and M. E. Goddard. 2011a. Genome-wide association studies for feedlot and growth traits in cattle. J. Anim. Sci. 89:1684–1697.
Bolormaa, S., L. R. Porto Neto, Y. D. Zhang, R. J. Bunch, B. E. Har-rison, M. E. Goddard, and W. Barendse. 2011b. A genome-wide association study of meat and carcass traits in Australian cattle. J. Anim. Sci. 89:2297–2309.
Bolormaa, S., J. E. Pryce,K. Kemper,K. Savin, B. J. Hayes, W. Barendse, Y. Zhang, C. M. Reich, B. A. Mason, R. J. Bunch, B. E. Harrison, A. Reverter, R. M. Herd, B. Tier, H.-U. Graser, and M. E. Goddard. 2013. Accuracy of prediction of genomic breeding values for re-sidual feed intake and carcass and meat quality traits in Bos taurus, Bos indicus, and composite beef cattle. J. Anim. Sci. 91:3088-3104.

Molecular value predictions in beef cattle 5925
Burrow, H. M., G. W. Seifert, and N. J. Corbet. 1988. A new tech-nique for measuring temperament in cattle. Proc. Aust. Soc. Anim. Prod. 17:154–157.
Cafe, L. M., B. L. McIntyre, D. L. Robinson, G. H. Geesink, W. Bar-endse, and P. L. Greenwood. 2010a. Production and processing studies on calpain-system gene markers for tenderness in cattle: 1. Growth, efficiency, temperament and carcass characteristics. J. Anim. Sci. 88:3047–3058.
Cafe, L. M., B. L. McIntyre, D .L. Robinson, G. H. Geesink, W. Bar-endse, D. W. Pethick, J. M. Thompson, and P. L. Greenwood. 2010b. Production and processing studies on calpain-system gene markers for tenderness in cattle: 2. Objective meat quality. J. Anim. Sci. 88:3059–3069.
Cafe, L. M., D. L. Robinson, D. M. Ferguson, B. L. McIntyre, G. H. Geesink, and P. L. Greenwood. 2011. Cattle temperament: Persis-tence of assessments and associations with productivity, efficien-cy, carcass and meat quality traits. J. Anim. Sci. 89:1452–1465.
DeVuyst, E. A., J. T. Biermacher, J. L. Lusk, R. G. Mateescu, J. B. Blanton Jr., J. S. Swigert, B. J. Cook, and R. R. Reuter. 2011. Relationship between fed cattle traits and Igenity panel scores. J. Anim. Sci. 89:1260–1269.
Eggen, A. 2012. The development and application of genomic selec-tion as a new breeding paradigm. Anim. Front. 2:10–15.
Hocquette, J. F., C. Capel, D. Valerie, D. Guéméne, J. Bidanel, C. Pon-sart, P. Y. Bail, P. Monget, P. Mormède, M. Barnezant, F. Guillou, and J. L. Peyraud. 2012. Objectives and applications of pheno-typing network set-up for livestock. Anim. Sci. J. 83:517–528.
Hocquette, J. F., F. Gondret, E. Baéza, F. Médale, C. Jurie, and D. W. Pethick. 2010. Intramuscular fat content in meat-producing ani-mals: Development, genetic and nutritional control, and identi-fication of putative markers. Animal 4:303–319.
Johnston, D., and H.-U. Graser. 2009. Evaluation of Pfizer Animal Genetics 56 marker panel. Version 3. http://agbu.une.edu.au/pdf/Pfizer_MVP_Report%203_November%202012.pdf. (Accessed Nov. 16, 2012).
Johnston, D. J., and H.-U. Graser. 2010. Estimated gene frequencies of GeneSTAR markers and their size of effects on meat tender-ness, marbling, and feed efficiency in temperate and tropical beef cattle breeds across a range of production systems. J. Anim. Sci. 88:1917–1935.
Koohmaraie, M., M. P. Kent, S. D. Shackelford, E. Veiseth, and T. L. Wheeler. 2002. Meat tenderness and muscle growth: Is there any relationship? Meat Sci. 62(S1):345–352.
Littlejohn, M., T. Grala, K. Sanders, C. Walker, G. Waghorn, K. Macdonald, R. Spelman, S. Davis, and R. Snell. 2012. Non-replication of genome-wide-based associations of efficient food conversion in dairy cows. Anim. Genet. 43:781–784.
McDonagh, M. B., R. M. Herd, E. C. Richardson, V. H. Oddy, J. A. Archer, and P. F. Arthur. 2001. Meat quality and the calpain system of feedlot steers following a single generation of di-vergent selection for residual feed intake. Aust. J. Exp. Agric. 41:1013–1021.
Meat Standards Australia. 2009. MSA standards manual for beef grading. Meat Stand. Aust., Fortitude Valley, Queensland.
Moore, S. S., F. D. Mujibi, and E. L. Sherman. 2009. The molecular basis for feed efficiency: Molecular basis for residual feed in-take in beef cattle. J. Anim. Sci. 87:E41–E47.
Mullen, A. M., L. Pannier, and R. Hamill. 2009. New insights into the biology of meat quality from genomic and proteomic per-spectives. In: J. P. Kerry and D. Ledward, editors, Improving the sensory and nutritional quality of fresh meat. Woodhead, Cambridge. p. 199–224.
NBCEC. 2011. Commercial genetic test validation. www.nbcec.org/validation.html. (Accessed Jan. 10, 2013).
NBCEC. 2012. National Beef Cattle Evaluation Consortium white pa-per—Delivering genomics technology to the beef industry. www.nbcec.org/topics/WhitePaperGenomicsTechnology.pdf. (Ac-cessed Jan. 10, 2013).
Nkrumah, J. D., E. L. Sherman, C. Li, E. Marques, D. H. Crews Jr., R. Bartusiak, B. Murdoch, Z. Wang, J. A. Basarab, and S. S. Moore. 2007. Primary genome scan to identify putative quan-titative trait loci for feedlot growth rate, feed intake, and feed efficiency of beef cattle. J. Anim. Sci. 85:3170–3181.
Perry, D., W. R. Shorthose, D. M. Ferguson, and J. M. Thompson. 2001. Methods used in the CRC program for the determination of carcass yield and beef quality. Aust. J. Exp. Agric. 41:953–957.
Pfizer. 2009a. Understanding GeneSTAR MVP results. Pfizer Anim. Health Anim. Genet., Albion, Queensland, Australia.
Pfizer. 2009b. GeneSTAR MVPs—Molecular value predictions for beef feed efficiency, marbling and tenderness. Technical sum-mary, March 2009. Pfizer Anim. Health Anim. Genet., Albion, Queensland, Australia.
Pfizer. 2011. GeneSTAR MVP. Breed statistics and percentile bands. www.pfizeranimalgenetics.com.au/sites/pag/aus/Documents/Breed%20statistics%20update_June2011.pdf. (Acccessed May 3, 2013).
Pollak, E. J., G. L. Bennett, W. M. Snelling, R. M. Thallman, and L. A. Kuehn. 2012. Genomics and the global beef industry. Anim. Prod. Sci. 52:92–99.
Robinson, D. L. 1987. Estimation and use of variance components. Statistician 36:3–14.
Robinson, D. L. 2009. Experimental design for complex, large-scale research projects to estimate genetic parameters plus numerous treatment and sire effects. Livest. Sci. 121:300–307.
Robinson, D. L., L. M. Cafe, B. L. McIntyre, G. H. Geesink, W. Barendse, D. W. Pethick, J. M. Thompson, R. Polking-horne, and P. L. Greenwood. 2012. Production and process-ing studies on calpain-system gene markers for beef tender-ness: Consumer assessments of eating quality. J. Anim. Sci. 90:2850–2860.
Robinson, D. L., L. M. Cafe, J. M. Thompson, and P. L. Greenwood. 2007. Designing experiments that estimate genetic marker, ma-jor gene and treatment effects. Proc. Assoc. Adv. Anim. Breed. Genet. 17:312–315.
Robinson, D. L., and V. H. Oddy. 2004. Genetic parameters for feed efficiency, fatness, muscle area and feeding behaviour of feed-lot finished cattle. Livest. Prod. Sci. 90:255–270.
Sherman, E. L., J. D. Nkrumah, B. M. Murdoch, and S. S. Moore. 2008. Identification of 438 polymorphisms influencing feed intake and efficiency in beef cattle. Anim. Genet. 39:225–231.
Thallman, R. M., K. J. Hanford, R. L. Quaas, S. D. Kachman, R. J. Tem-pelman, R. L. Fernando, L. A. Kuehn, and E. J. Pollak. 2009. Esti-mation of the proportion of genetic variation accounted for by DNA tests. In: Proc. 41st BIF Res. Symp., Sacramento, CA. p. 184–209.
Thompson, J. M. 2002. Managing meat tenderness. Meat Sci. 62:295–308.
USDA. 1997. United States standards for grades of carcass beef. Ag-ric. Marketing Serv., USDA, Washington, DC.
Van Eenennaam, A. L., J. Lee, R. M. Thallman, R. L. Quaas, M. E. Dikeman, C. A. Gill, D. E. Franke, and M. G. Thomas. 2007. Validation of commercial DNA tests for quantitative beef qual-ity traits. J. Anim. Sci. 85:891–900.
Wolcott, M. L., and D. J. Johnston. 2009. The impact of genetic markers for tenderness on steer carcass and feedlot exit and heifer puberty traits in Brahman cattle. Proc. Assoc. Adv. Anim. Breed. Genet. 18:159–162.
Watson, R., A. Gee, R. Polkinghorne, and M. Porter. 2008. Consumer as-sessment of eating quality- development of protocols for Meat Stan-dards Australia (MSA) testing. Aust. J. Exp. Agric. 48:1360–1367.