molecules between the stars - paul ruffle · molecules between the stars: ... oh ocs h2cs nh2cn...
TRANSCRIPT

Molecules Between the Stars: The Astrochemistry of the ISM
Paul RuffleNational Radio Astronomy Observatory
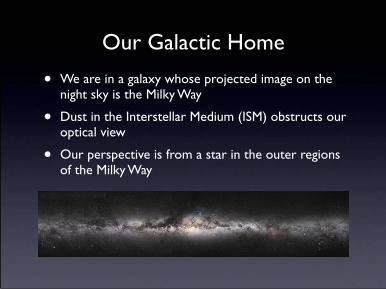
Our Galactic Home
• We are in a galaxy whose projected image on the night sky is the Milky Way
• Dust in the Interstellar Medium (ISM) obstructs our optical view
• Our perspective is from a star in the outer regions of the Milky Way

Our Galactic Home
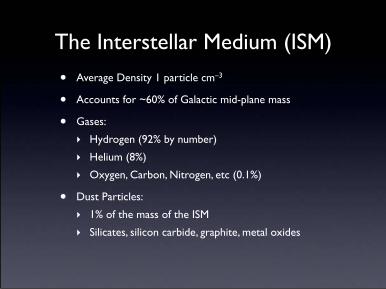
The Interstellar Medium (ISM)
• Average Density 1 particle cm–3
• Accounts for ~60% of Galactic mid-plane mass
• Gases:
‣ Hydrogen (92% by number)
‣ Helium (8%)
‣ Oxygen, Carbon, Nitrogen, etc (0.1%)
• Dust Particles:
‣ 1% of the mass of the ISM
‣ Silicates, silicon carbide, graphite, metal oxides
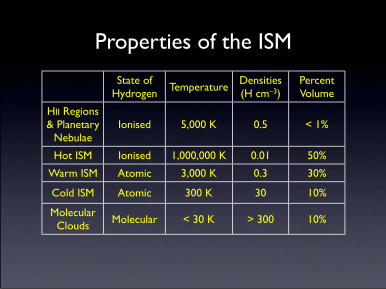
Properties of the ISM
State of Hydrogen Temperature
Densities (H cm–3)
Percent Volume
HII Regions & Planetary
NebulaeIonised 5,000 K 0.5 < 1%
Hot ISM Ionised 1,000,000 K 0.01 50%
Warm ISM Atomic 3,000 K 0.3 30%
Cold ISM Atomic 300 K 30 10%
Molecular Clouds Molecular < 30 K > 300 10%
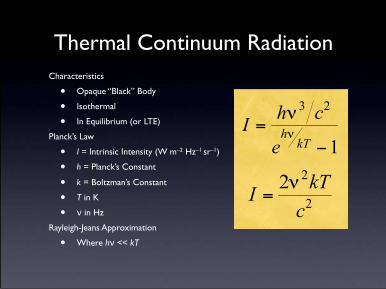
Thermal Continuum RadiationCharacteristics
• Opaque “Black” Body
• Isothermal
• In Equilibrium (or LTE)
Planck’s Law
• I = Intrinsic Intensity (W m–2 Hz–1 sr–1)
• h = Planck’s Constant
• k = Boltzman’s Constant
• T in K
• ν in Hz
Rayleigh-Jeans Approximation
• Where hν << kT
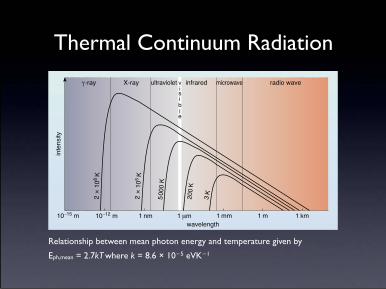
Thermal Continuum Radiation
Relationship between mean photon energy and temperature given by
Eph,mean = 2.7kT where k = 8.6 × 10⁻⁵ eVK−1
inten
sity
X-ray ultraviolet infrared microwave radio wave!-ray2"
108 K
5000
K
2"
105 K
3 K200 K
wavelength10#15 m 10#12 m 1 nm 1$m 1 mm 1 m 1 km
visible

NGC 604 Giant HII Region
Emission nebula in the Triangulum Galaxy (M33). HST wide field and planetary camera 2

HII Regions & Planetary Nebulae
• Isolated regions where H is ionised (H+)
• HII Regions:
‣ UV from hot, blue stars (20,000 – 50,000 K)
‣ Young, massive and short-lived (< 106 years)
‣ HII regions have short lives
‣ Near regions where stars formed
• Planetary Nebulae (PNe):
‣ Evolved stars (white dwarf)
‣ Ejected stellar atmosphere
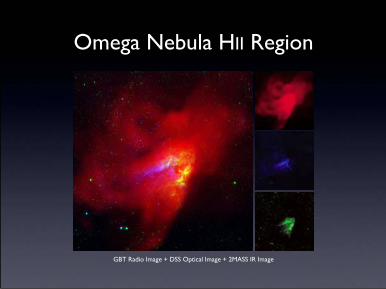
Omega Nebula HII Region
GBT Radio Image + DSS Optical Image + 2MASS IR Image
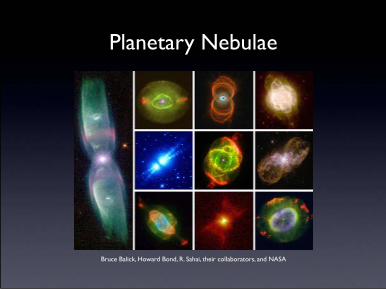
Planetary Nebulae
Bruce Balick, Howard Bond, R. Sahai, their collaborators, and NASA

Non-Thermal Continuum Radiation
Free-Free Emission
• Ionised regions: HII regions and Planetary Nebulae
• Free electrons accelerated by encounters with free protons
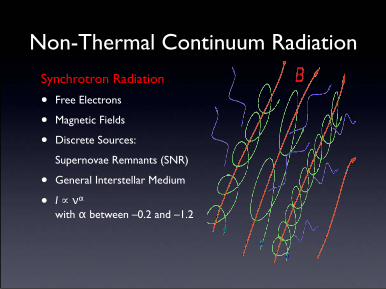
Non-Thermal Continuum Radiation
Synchrotron Radiation
• Free Electrons
• Magnetic Fields
• Discrete Sources:
Supernovae Remnants (SNR)
• General Interstellar Medium
• I ∝ να with α between –0.2 and –1.2

Spectral-Line Radiation
Recombination Lines
• Discovered in 1965 by Hogburn and Mezger
• Ionised regions (HII regions and Planetary Nebulae)
• Free electrons temporarily recaptured by a proton
• Atomic transitions between outer orbital (e.g. n = 177 to m = 176)

Spectral-Line Radiation
Hyperfine Transition of Hydrogen
• Discovered by Ewen and Purcell in 1951
• Found in regions where H is atomic
• Spin-flip (hyperfine) transition
‣ Electron and protons have “spin”
‣ Spins of proton and electron may be aligned or anti-aligned
‣ Aligned state has more energy
‣ Difference in Energy = hν (ν = 1420 MHz λ ≈ 21 cm)
‣ Aligned H atom will take 11 million years to flip the spin of the electron
‣ 1067 atoms in Milky Way – 1052 H atoms emit every second
Spectral-Line Radiation
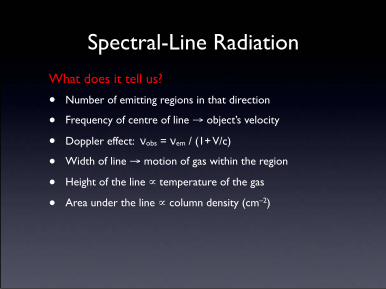
What does it tell us?
• Number of emitting regions in that direction
• Frequency of centre of line → object’s velocity
• Doppler effect: νobs = νem / (1+ V/c)
• Width of line → motion of gas within the region
• Height of the line ∝ temperature of the gas
• Area under the line ∝ column density (cm–2)

Spectral-Line Radiation
Milky Way rotation and mass
For any cloud• Observed cloud velocity = difference
between projected Sun’s motion and projected cloud motion
For cloud B• Highest observed velocity along
line of site
• Vrot = Vobs + Vsun sin(L)
• R = Rsun sin(L)
Repeat for cloud B with new angle L• Determine Vrot (R)
• From Newton’s 2nd Law derive m(R) from V(R)
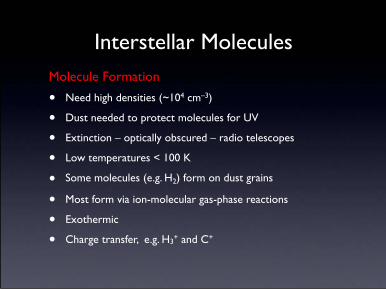
Interstellar MoleculesMolecule Formation
• Need high densities (~104 cm–3)
• Dust needed to protect molecules for UV
• Extinction – optically obscured – radio telescopes
• Low temperatures < 100 K
• Some molecules (e.g. H2) form on dust grains
• Most form via ion-molecular gas-phase reactions
• Exothermic
• Charge transfer, e.g. H3+ and C+

Interstellar Molecules
• About 90% of the over 130 interstellar molecules discovered with radio telescopes.
• Rotational (electric dipole) transitions
• Up to thirteen Atoms
• Most carbon-based (organic)
• Many cannot exist in normal laboratories (e.g. OH)
• H2 most common molecule:‣ No dipole moment so no radio transition
‣ Only observable in UV (rotational) or Infrared (vibrational) transitions
‣ Astronomers use CO as a tracer for H2
• A few molecules (OH, H2O, CH3OH) maser

Interstellar MoleculesDiatomic Triatomic 4 Atoms 5 Atoms 6 Atoms 7 Atoms 8 Atoms 9 Atoms 10 Atoms 11 Atoms 12 Atoms 13 Atoms
CH H2O NH3 HC3N CH3OH CH3NH2 CH3C3N CH3OCH3 (CH3)2CO HC9N C6H6 HC11N
CN HCO+ H2CO HCOOH CH3CN CH2CHCN C7H C2H5OH NH2CH2COOH HOCHC2CH2OH CO(CH2OH)2
CH+ HCN HNCO CH2NH NH2HCO CH3CHO CH3COOH CH3CH2CN CH3CH2CHO CH3C6H
OH OCS H2CS NH2CN CH3CHO CH3C2H CH2OHCHO HC7N CH3C5N
CO H2S C3N H2C2O C2H4 HC5N C6H2 CH3C4H
H2 HNC HNCS C4H C5H C6H CH2CHCHO C8H
SiO N2H+ HOCO+ SiH4 CH2CHO c-C2H4O CH2CCHCN CH3CONH2
CS C2H C3H c-C3H2 HC3NH+ CH2CHOH
SO SO2 C3O CH2CN C5N C6H-
SiS HDO HCNH+ C5 H2COH+
NS HCO H3O+ SiC4 C4H-
C2 HNO C3S l-C3H2 C4H2
NO OCN- c-C3H CH4 HC4N
HCl HCS+ C2H2 HC2NC c-C2H3O
NaCl HOC+ HC2N HNC3 CH2CNH
AlCl c-SiC2 H2CN H2COH+
KCl MgNC SiC3 C4H-
AlF C2S CH3
PN C3
SiC CO2
CP CH2
NH C2O
SiN NH2
SO+ NaCN
CO+ N2O
HF MgCN
LiF H3+
SH SiCN
FeO AlNC
N2 SiNC
CF+
O2

Interstellar Molecules
CO used to trace distribution of mass
H3+ plays role in gas-phase reactions
H2CO organic molecule widely distributed
NH3 used to determine temperature
CH4 and CH3OH
HCN
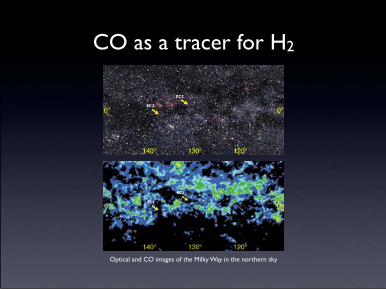
CO as a tracer for H2
Optical and CO images of the Milky Way in the northern sky
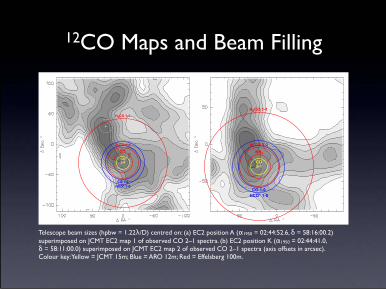
12CO Maps and Beam Filling
Telescope beam sizes (hpbw = 1.22λ/D) centred on: (a) EC2 position A (α1950 = 02:44:52.6, δ = 58:16:00.2)superimposed on JCMT EC2 map 1 of observed CO 2–1 spectra. (b) EC2 position K (α1950 = 02:44:41.0, δ = 58:11:00.0) superimposed on JCMT EC2 map 2 of observed CO 2–1 spectra (axis offsets in arcsec). Colour key: Yellow = JCMT 15m; Blue = ARO 12m; Red = Effelsberg 100m.
NH3
CO2-1
CO 1-0
H2CO 1-1
HCO+ 1-0
H2CO 2-2
NH3
CO2-1
CO 1-0
H2CO 1-1
HCO+ 1-0
H2CO 2-2

Molecular Line Spectra
Observations of Edge Cloud 2 (EC2) taken at the ARO 12m Telescope February to June 2002
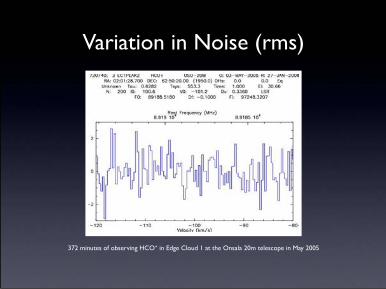
Variation in Noise (rms)
372 minutes of observing HCO+ in Edge Cloud 1 at the Onsala 20m telescope in May 2005

Variation in Noise (rms)
372 minutes of observing HCO+ in Edge Cloud 1 at the Onsala 20m telescope in May 2005
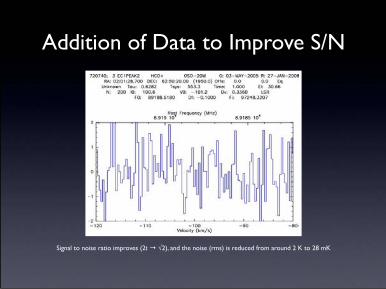
Addition of Data to Improve S/N
Signal to noise ratio improves (2t → √2), and the noise (rms) is reduced from around 2 K to 28 mK
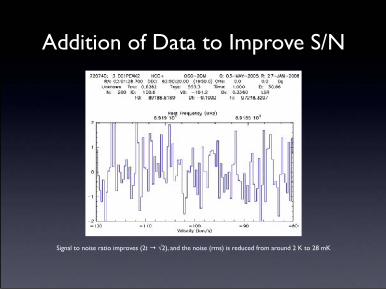
Addition of Data to Improve S/N
Signal to noise ratio improves (2t → √2), and the noise (rms) is reduced from around 2 K to 28 mK

Ammonia as a Thermometer
Trot = 20 ± 3 K. Assuming LTE and a Boltzmann distribution. Combined statistical weight factors = 5/3
N(J, K) = 1.55 ! 1014J(J + 1)!K2
TmbdVN(2,2)N(1,1)
=gop(2)gop(1)
g2g1exp(!!E/kT )

Molecular Clouds
• Discovered in 1970(Penzias, Jefferts & Wilson and others)
• Cold (5-30 K) and dense (102 -106 cm–3)
• Where stars are formed
• A few percent of the Galaxy’s volume
• But 50% of the ISM mass
• Concentrated in spiral arms
• Dust Clouds = Molecular Clouds
The Eagle Nebula (M16), which comprises cold gas and dustNASA, ESA, and The Hubble Heritage Team (STScI/AURA)

Cloud Chemical Evolution
Fractional abundances varying over time for molecular cloud Model 8
1e-20
1e-18
1e-16
1e-14
1e-12
1e-10
1e-08
1e-06
1e-04
1 10 100 1,000 10,000 1e+05 1e+06 1e+07
Frac
tiona
l Abu
ndan
ce
Time (yr)
CCOCNHCNNH3CSSOH2COHCO+
C+
OC2HHNCNSS+
Model 8
C CO
CN
NH3
CS
SO
H2COHCO+ HNC
HCN
C+ON
S
S+
C2H
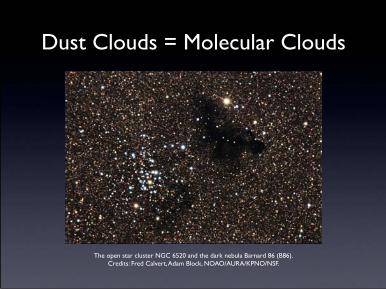
Dust Clouds = Molecular Clouds
The open star cluster NGC 6520 and the dark nebula Barnard 86 (B86).Credits: Fred Calvert, Adam Block, NOAO/AURA/KPNO/NSF.
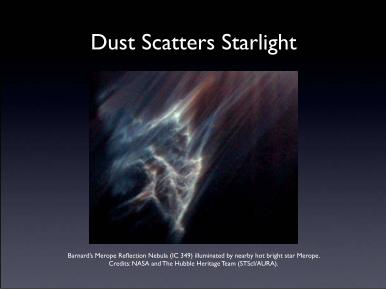
Dust Scatters Starlight
Barnard’s Merope Reflection Nebula (IC 349) illuminated by nearby hot bright star Merope. Credits: NASA and The Hubble Heritage Team (STScI/AURA).
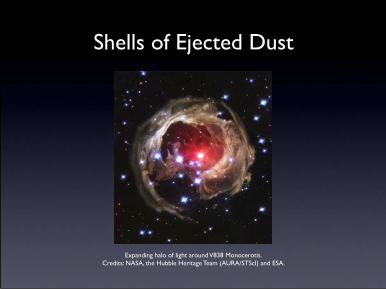
Shells of Ejected Dust
Expanding halo of light around V838 Monocerotis.Credits: NASA, the Hubble Heritage Team (AURA/STScI) and ESA.

Dust Continuum Emission
CO 2–1 intensity contours overlaid on a 1.2mm dust map of Edge Cloud 2 (axis offsets in arcsec)

More Information• Tielens: “The Physics and Chemistry of the Interstellar Medium”
• Dyson and Williams: “The Physics of the Interstellar Medium”
• Evans: “The Dusty Universe”
• Millar and Williams: “Dust and Chemistry in Astronomy”
• Whittet: “Dust in the Galactic Environment”
• Harwitt: “Astrophysical Concepts”
• Verschuur and Kellerman: “Galactic and Extra-Galactic Radio Astronomy”
• Verschuur: “Invisible Universe Revealed”
• Kraus: “Radio Astronomy”
• Burke and Smith: “Radio Astronomy”

Paul Rufflewww.paulruffle.com [email protected]