molino ii -model structure- kuleuven and adpc. contents molino i: –overview –list of...
TRANSCRIPT
MOLINO II -model structure-
KULeuven and ADPC
Contents
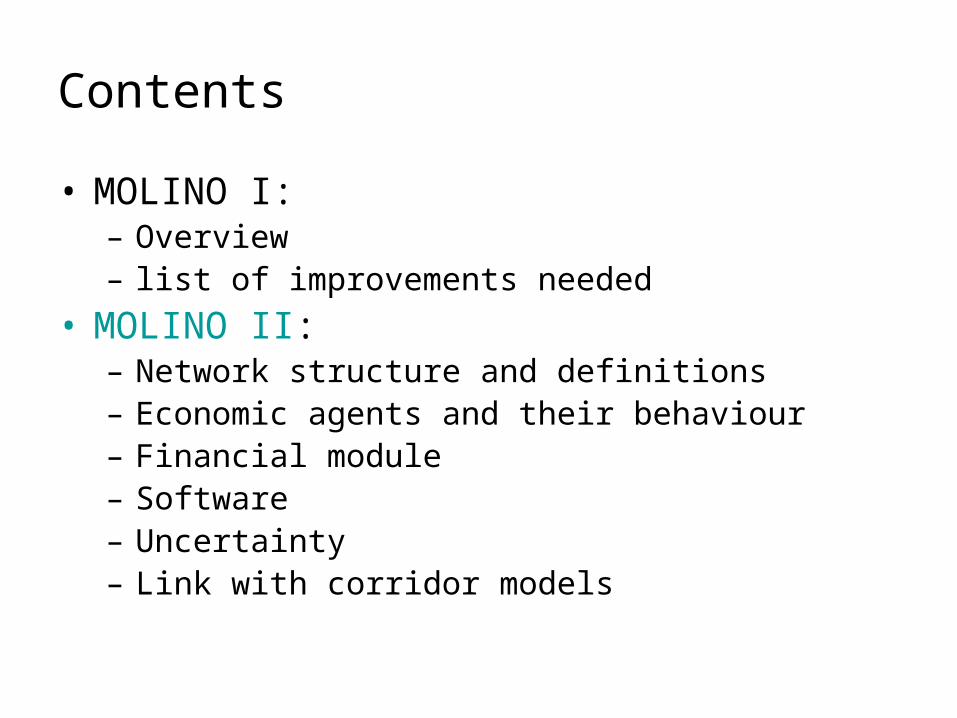
• MOLINO I:– Overview– list of improvements needed
• MOLINO II:– Network structure and definitions– Economic agents and their behaviour– Financial module– Software– Uncertainty– Link with corridor models
Objectives of MOLINO I
• Small model to support implementation of theoretical guidelines of Revenue-consortium
• Designed to compute impacts (short to long term) of alternative pricing, investment and revenue use strategies
• Implementable for all case studies
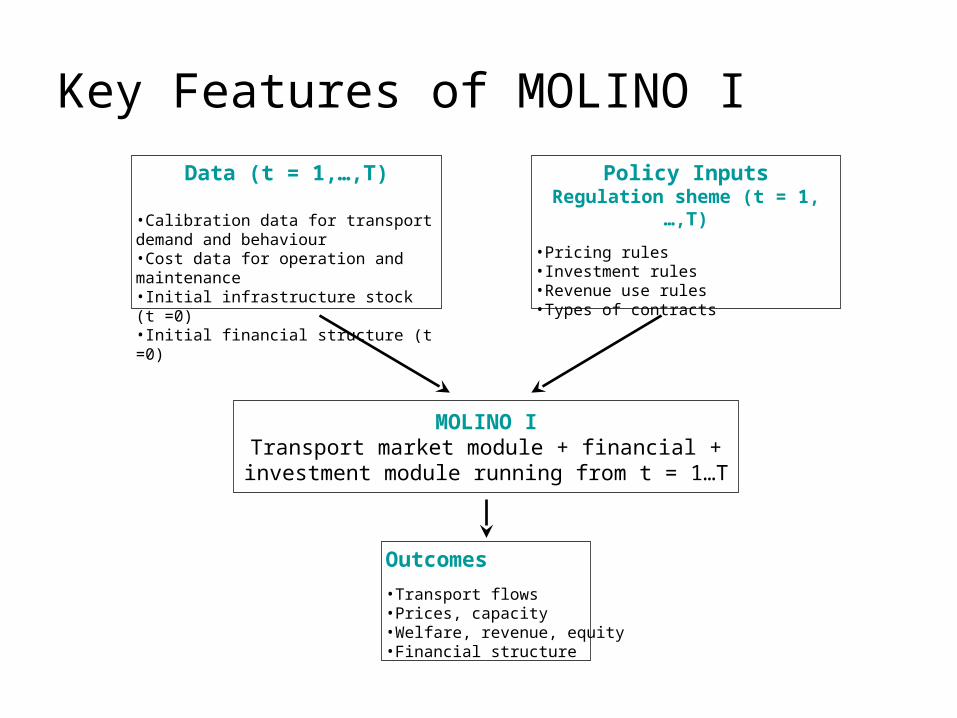
Data (t = 1,…,T)
•Calibration data for transport demand and behaviour•Cost data for operation and maintenance•Initial infrastructure stock (t =0)•Initial financial structure (t =0)
Policy InputsRegulation sheme (t = 1,…,T)
•Pricing rules•Investment rules•Revenue use rules•Types of contracts
MOLINO ITransport market module + financial + investment
module running from t = 1…T
Outcomes
•Transport flows•Prices, capacity•Welfare, revenue, equity•Financial structure
Key Features of MOLINO I
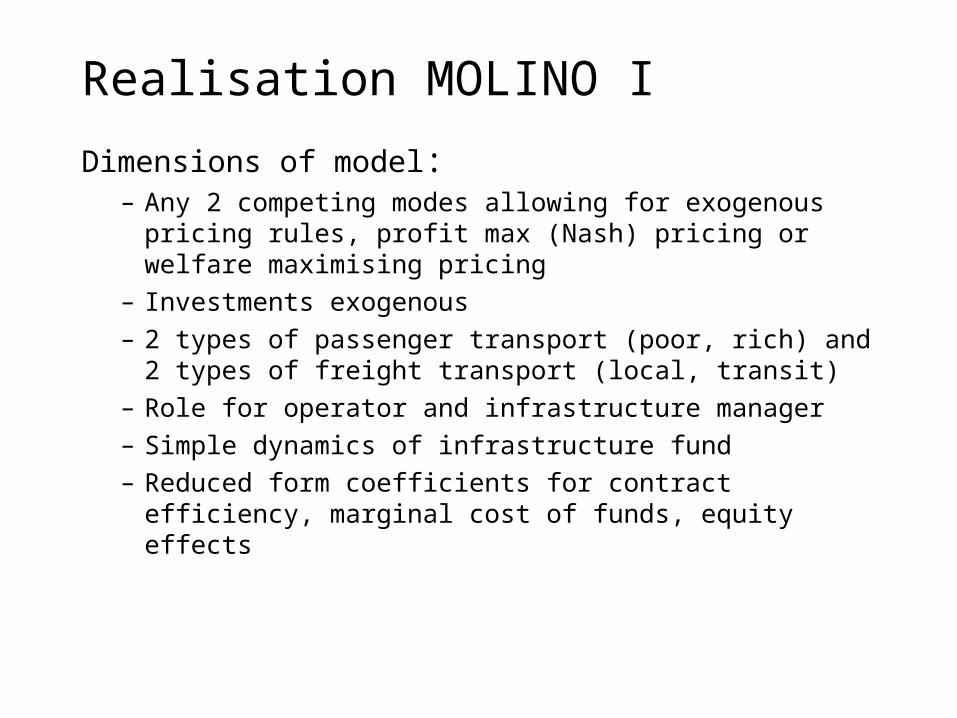
Realisation MOLINO I
Dimensions of model:– Any 2 competing modes allowing for exogenous
pricing rules, profit max (Nash) pricing or welfare maximising pricing
– Investments exogenous– 2 types of passenger transport (poor, rich) and 2
types of freight transport (local, transit)– Role for operator and infrastructure manager– Simple dynamics of infrastructure fund– Reduced form coefficients for contract efficiency,
marginal cost of funds, equity effects
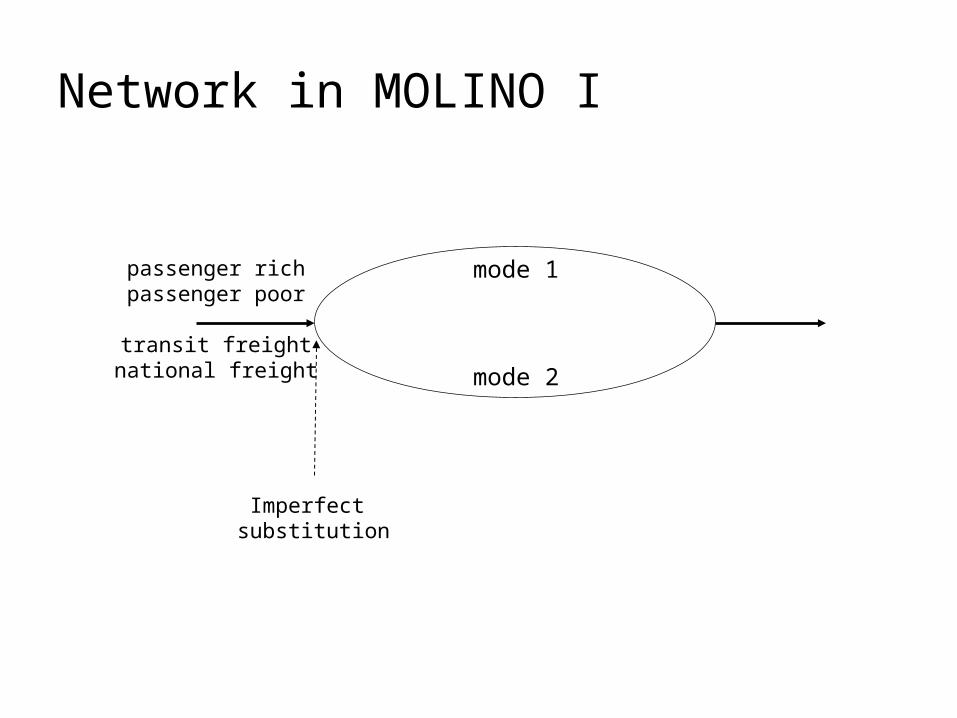
Network in MOLINO I
Imperfect substitution
passenger richpassenger poor
transit freightnational freight mode 2
mode 1
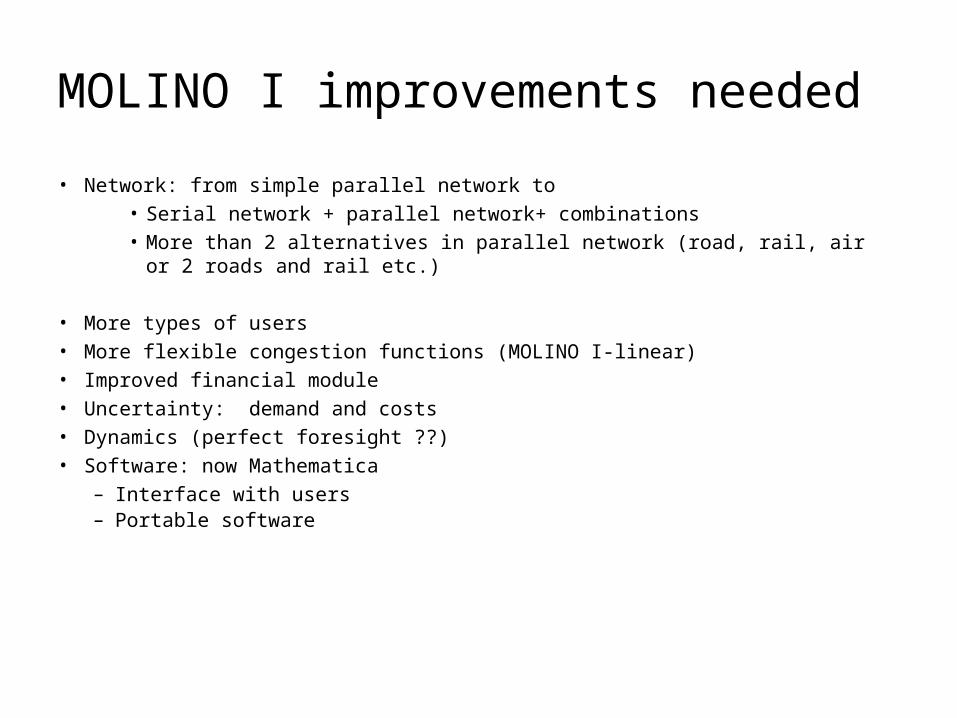
MOLINO I improvements needed
• Network: from simple parallel network to • Serial network + parallel network+ combinations• More than 2 alternatives in parallel network (road, rail, air or 2 roads and rail etc.)
• More types of users• More flexible congestion functions (MOLINO I-linear)• Improved financial module• Uncertainty: demand and costs• Dynamics (perfect foresight ??)• Software: now Mathematica
– Interface with users– Portable software

Contents
• MOLINO I:– Overview– list of improvements needed
• MOLINO II:– Network structure and definitions– Economic agents and their behaviour– Financial module– Software– Uncertainty– Link with corridor models
Network representation
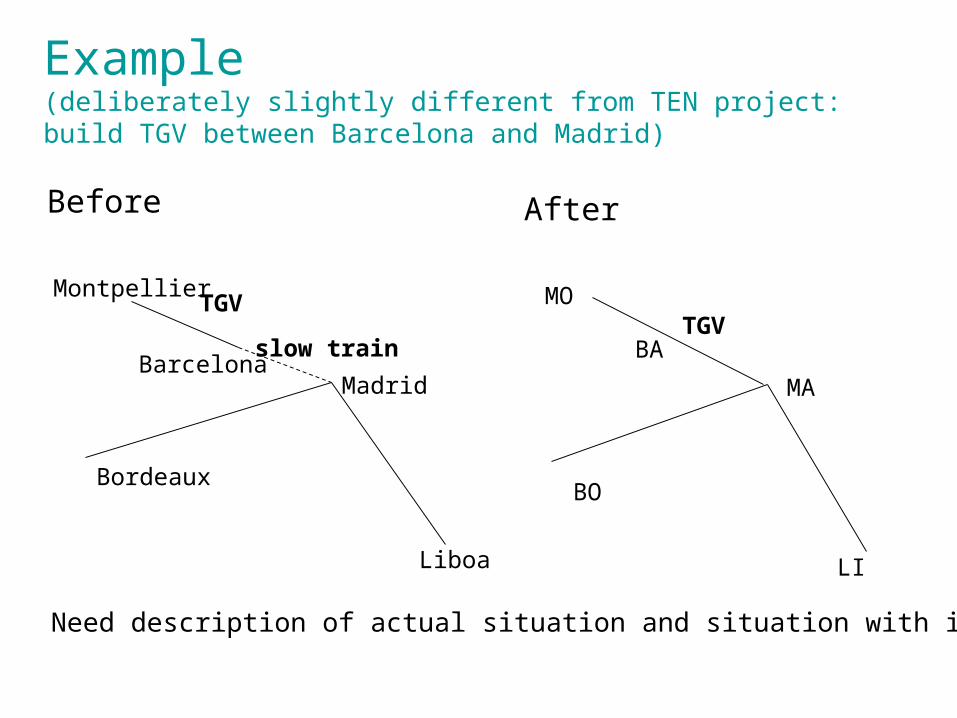
• The final objective of the model is to study a particular infrastructure investment project.
• The procedure is to start with the investment project and its corridor– This means a physical network generally implying
only one mode – The network will be defined using OD pairs, links and
paths
Madrid
Montpellier
Bordeaux
Liboa
MA
MO
BO
LI
slow train
TGVTGV
Example(deliberately slightly different from TEN project: build TGV between Barcelona and Madrid)
Before After
Need description of actual situation and situation with investment
BarcelonaBA
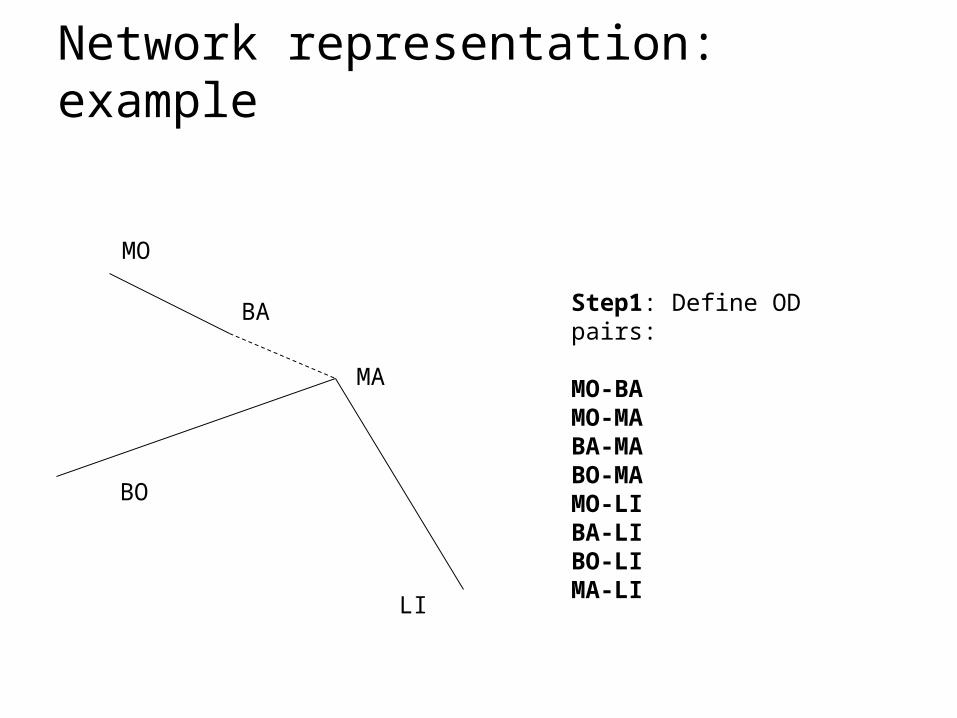
Step1: Define OD pairs:
MO-BAMO-MABA-MABO-MAMO-LIBA-LIBO-LIMA-LI
MA
MO
BO
LI
Network representation: example
BA
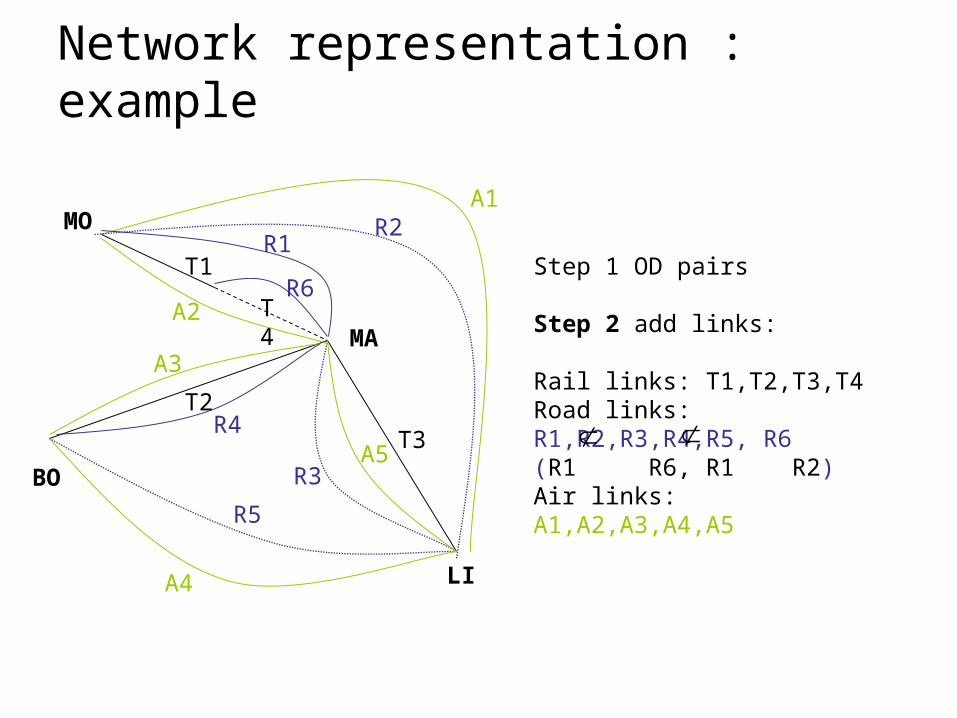
Step 1 OD pairs
Step 2 add links:
Rail links: T1,T2,T3,T4Road links: R1,R2,R3,R4,R5, R6(R1 R6, R1 R2)Air links: A1,A2,A3,A4,A5BO
MA
MO
LI
T1
T2
T3
T4
R1
A1
A2
A5
R2
R3
R5
R4
A4
A3
R6
Network representation : example
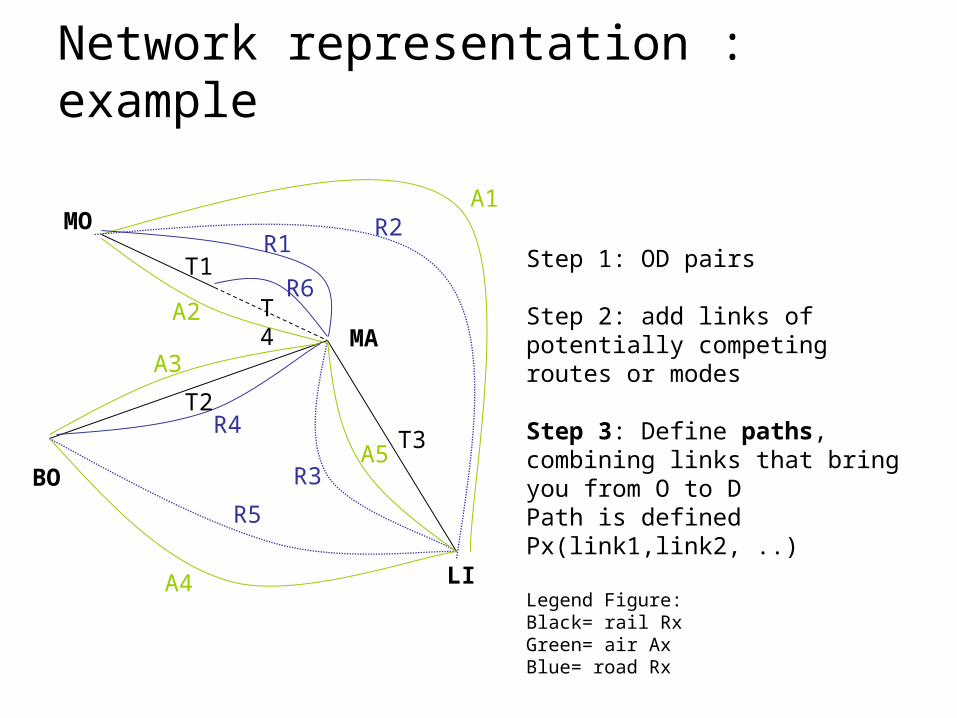
Step 1: OD pairs
Step 2: add links of potentially competing routes or modes
Step 3: Define paths, combining links that bring you from O to DPath is defined Px(link1,link2, ..)
Legend Figure:Black= rail RxGreen= air AxBlue= road Rx
Network representation : example
MA
MO
LI
T1
T2
T3
T4
R1
A1
A2
A5
R2
R3
R5
R4
A4
A3
R6
BO
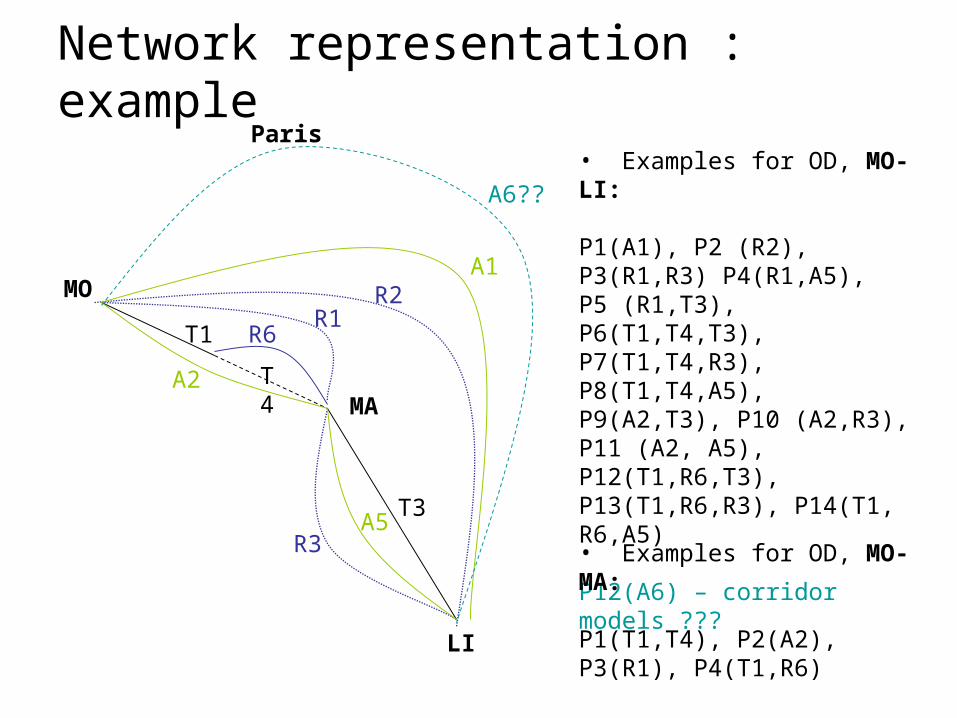
• Examples for OD, MO-LI:
P1(A1), P2 (R2),P3(R1,R3) P4(R1,A5),P5 (R1,T3),P6(T1,T4,T3), P7(T1,T4,R3), P8(T1,T4,A5),P9(A2,T3), P10 (A2,R3),P11 (A2, A5),P12(T1,R6,T3), P13(T1,R6,R3), P14(T1, R6,A5)
P12(A6) – corridor models ???
• Examples for OD, MO-MA:
P1(T1,T4), P2(A2), P3(R1), P4(T1,R6)
Network representation : exampleParis
MA
MO
LI
T1
T3
T4
R1
A1
A2
A5
R2
R3
A6??
R6
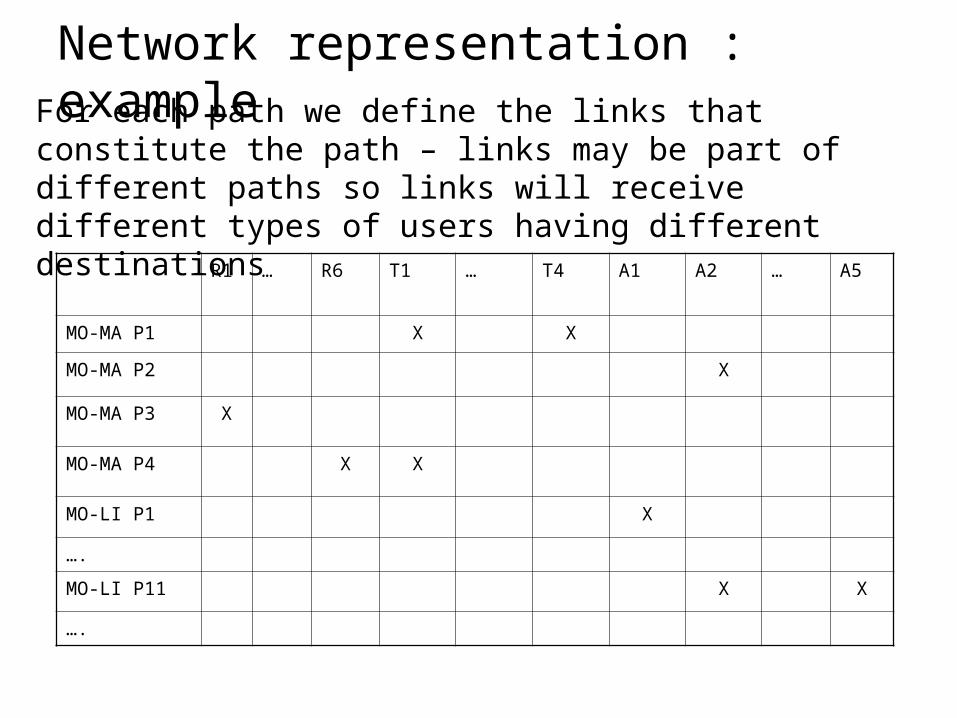
For each path we define the links that constitute the path – links may be part of different paths so links will receive different types of users having different destinations
R1 … R6 T1 … T4 A1 A2 … A5
MO-MA P1 X X
MO-MA P2 X
MO-MA P3 X
MO-MA P4 X X
MO-LI P1 X
….
MO-LI P11 X X
….
Network representation : example
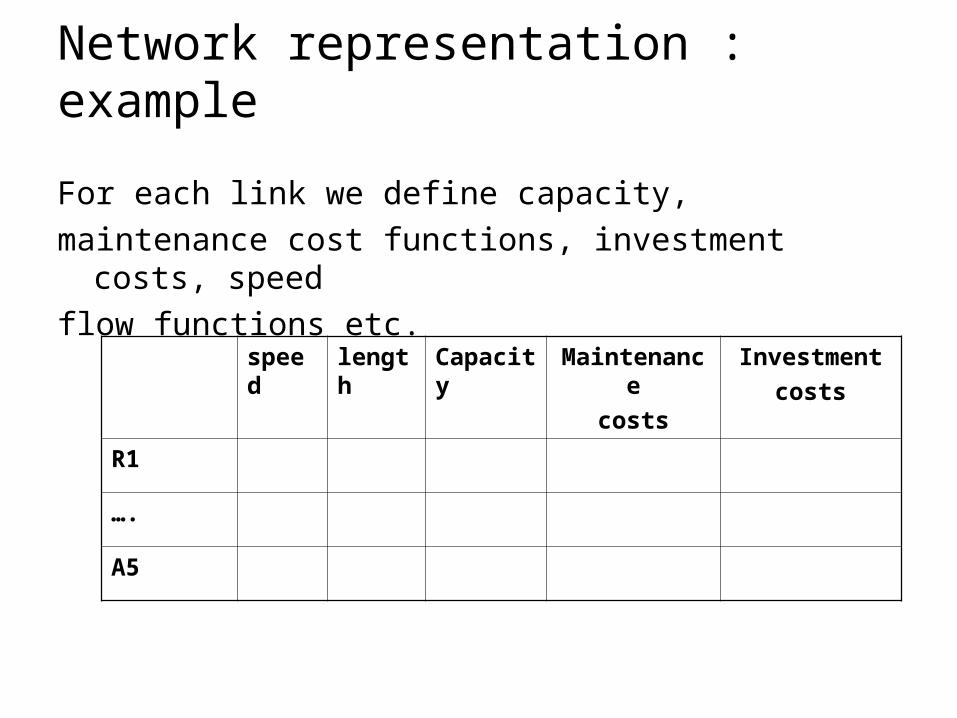
For each link we define capacity,
maintenance cost functions, investment costs, speed
flow functions etc.
speed length Capacity Maintenance
costs
Investment
costs
R1
….
A5
Network representation : example
Network representation
• Serial links added (n but not too large, some TEN projects have 15 segments..)
• Parallel links: n choices offered
• But in modelling:
“Less can be more”
smaller number of alternatives can often generate a lot more insights…
Contents
• MOLINO I:– Overview– list of improvements needed
• MOLINO II:– Network structure and definitions– Economic agents and their behaviour– Financial module– Software– Uncertainty– Link with corridor models
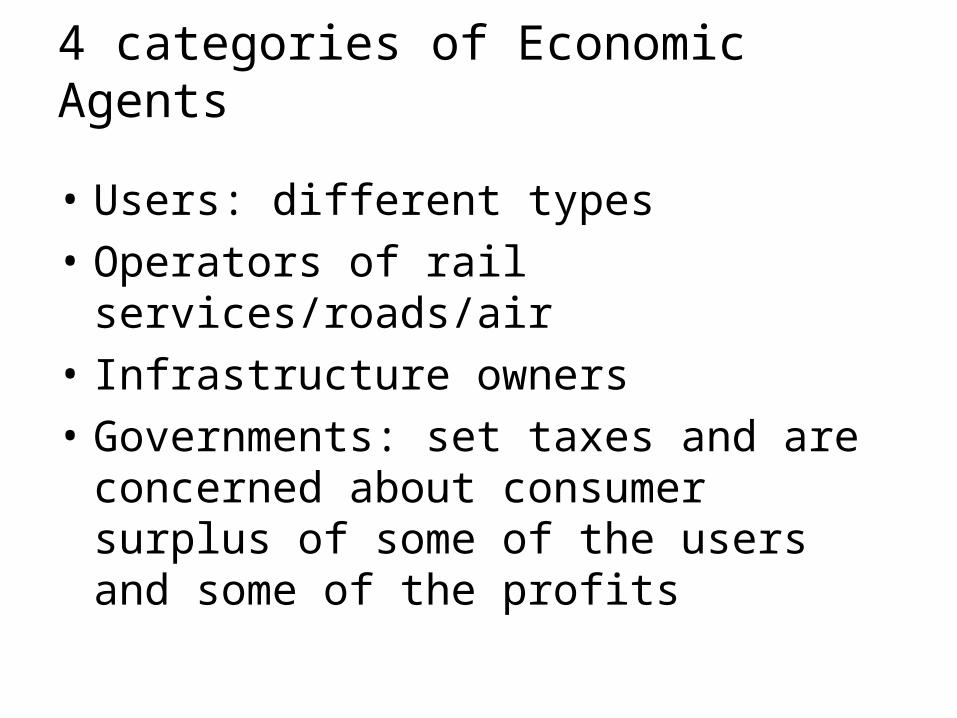
• Users: different types
• Operators of rail services/roads/air
• Infrastructure owners
• Governments: set taxes and are concerned about consumer surplus of some of the users and some of the profits
4 categories of Economic Agents
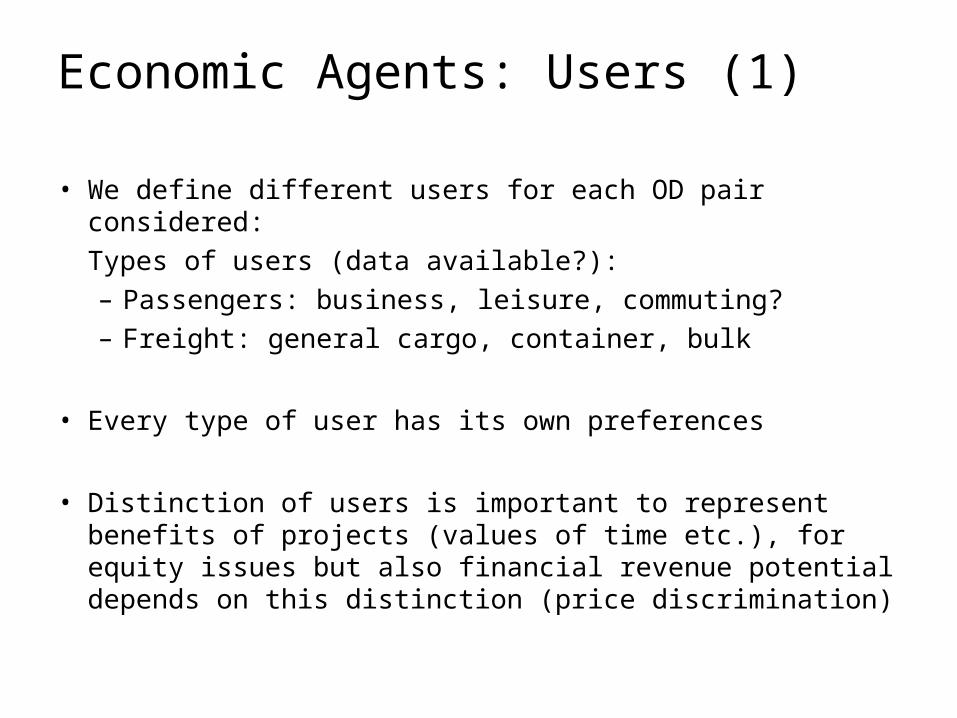
• We define different users for each OD pair considered:
Types of users (data available?):– Passengers: business, leisure, commuting? – Freight: general cargo, container, bulk
• Every type of user has its own preferences
• Distinction of users is important to represent benefits of projects (values of time etc.), for equity issues but also financial revenue potential depends on this distinction (price discrimination)
Economic Agents: Users (1)
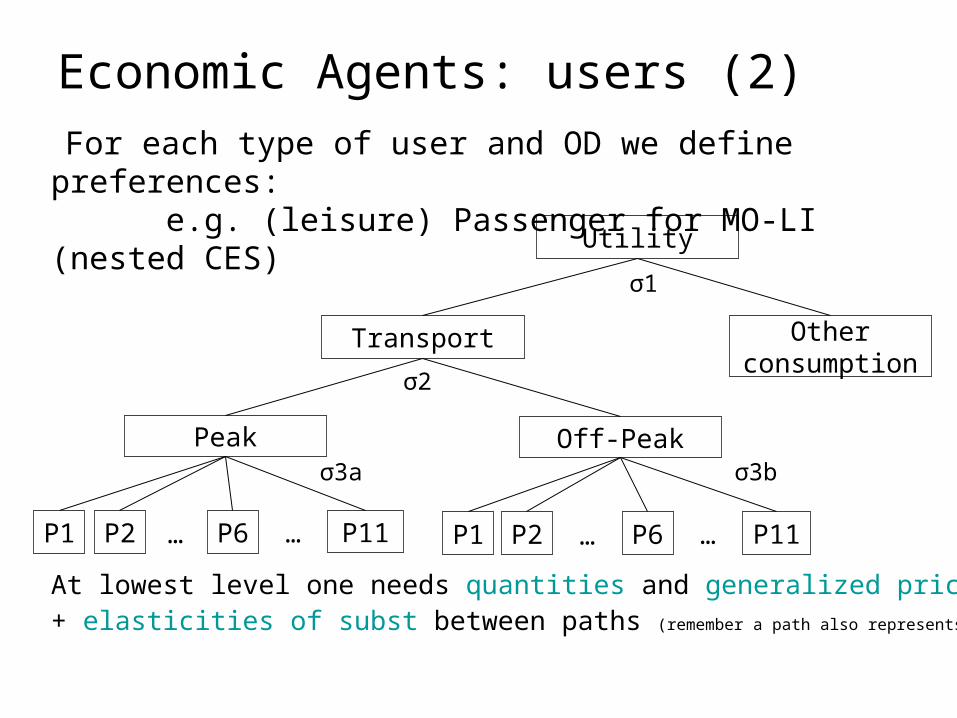
For each type of user and OD we define preferences: e.g. (leisure) Passenger for MO-LI (nested CES)
Utility
Transport Other consumption
P11…
Peak
P1 P2 P6… P11…
Off-Peak
P1 P2 P6…
Economic Agents: users (2)
At lowest level one needs quantities and generalized prices for each path.+ elasticities of subst between paths (remember a path also represents modes)
σ1
σ2
σ3a σ3b
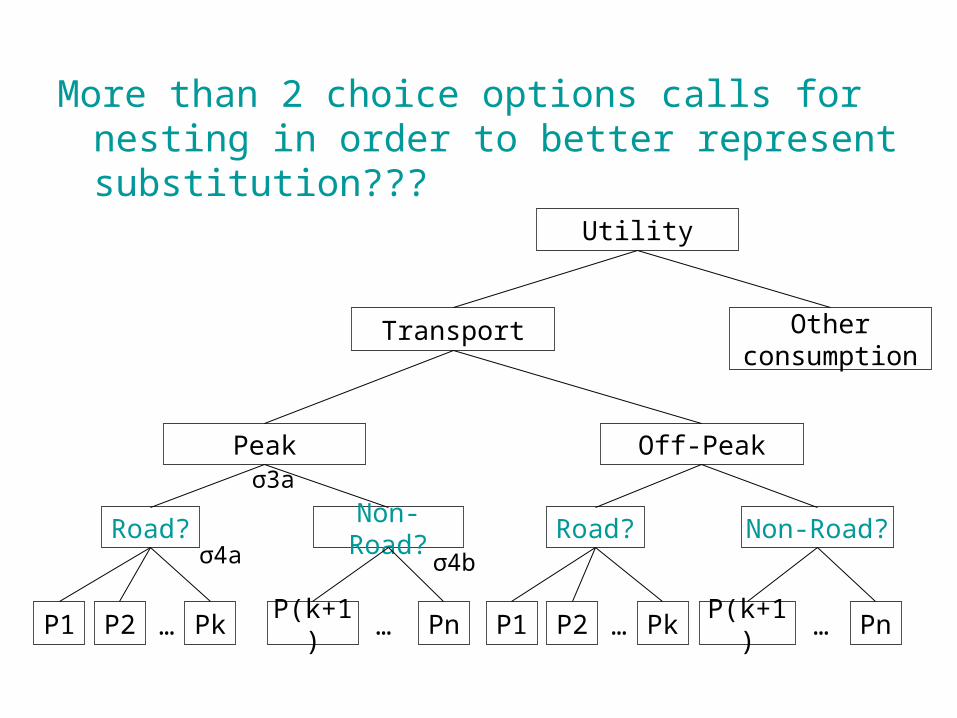
More than 2 choice options calls for nesting in order to better represent substitution???
Road?
P1 P2 Pk…
Utility
Transport Other consumption
Peak Off-Peak
Non-Road?
P(k+1) Pn…
Road?
P1 P2 Pk…
Non-Road?
P(k+1) Pn…
σ4a σ4b
σ3a
User preference representation
• CES utility or CES cost tree with max 4 levels for each OD pair
• Number of alternatives can change over time when investment adds an option (to be checked)
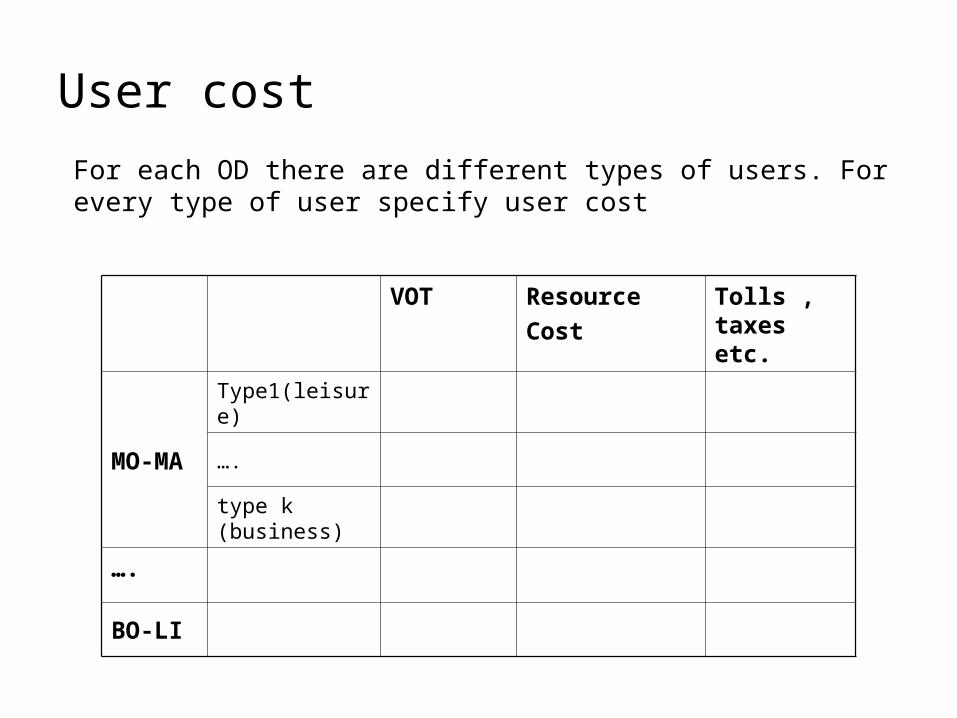
User cost
VOT Resource
Cost
Tolls , taxes etc.
MO-MA
Type1(leisure)
….
type k (business)
….
BO-LI
For each OD there are different types of users. For every type of user specify user cost

• Users: different types
• Operators of rail services/roads/air
• Infrastructure owners
• Governments: set taxes and are concerned about consumer surplus of some of the users and some of the profits
4 categories of Economic Agents
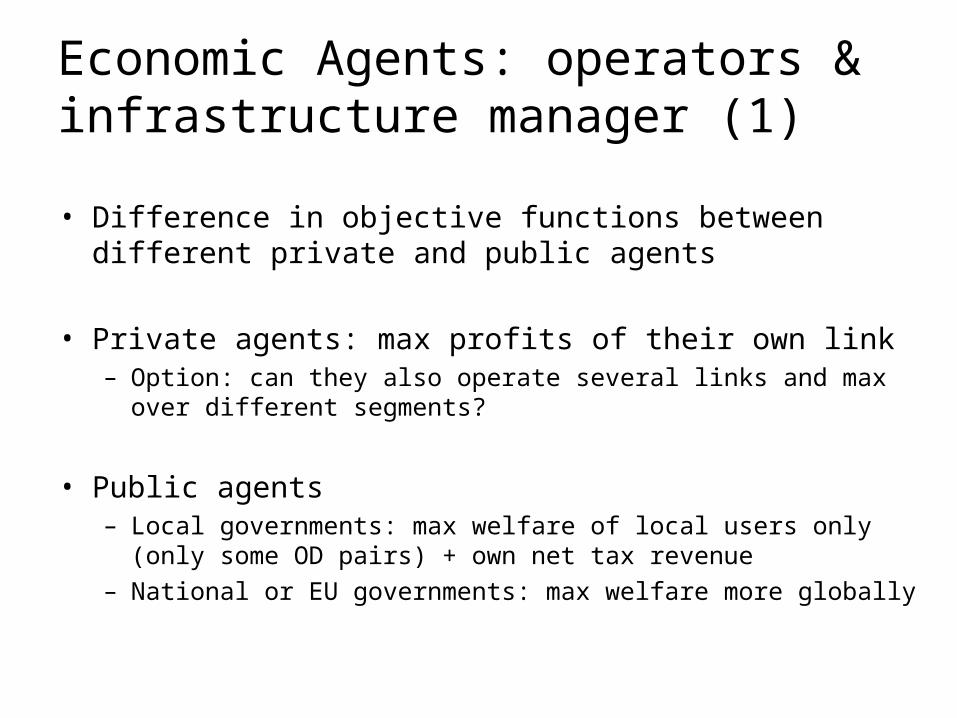
• Difference in objective functions between different private and public agents
• Private agents: max profits of their own link – Option: can they also operate several links and max over different
segments?
• Public agents– Local governments: max welfare of local users only (only some
OD pairs) + own net tax revenue– National or EU governments: max welfare more globally
Economic Agents: operators & infrastructure manager (1)
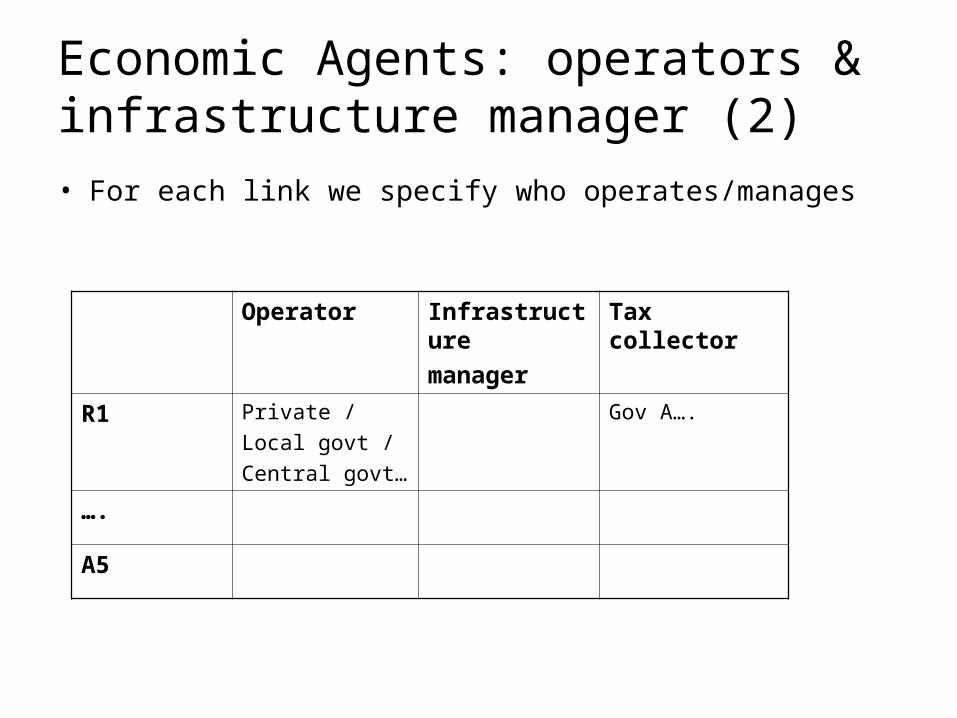
• For each link we specify who operates/manages
Operator Infrastructure
manager
Tax collector
R1 Private /
Local govt /
Central govt…
Gov A….
….
A5
Economic Agents: operators & infrastructure manager (2)
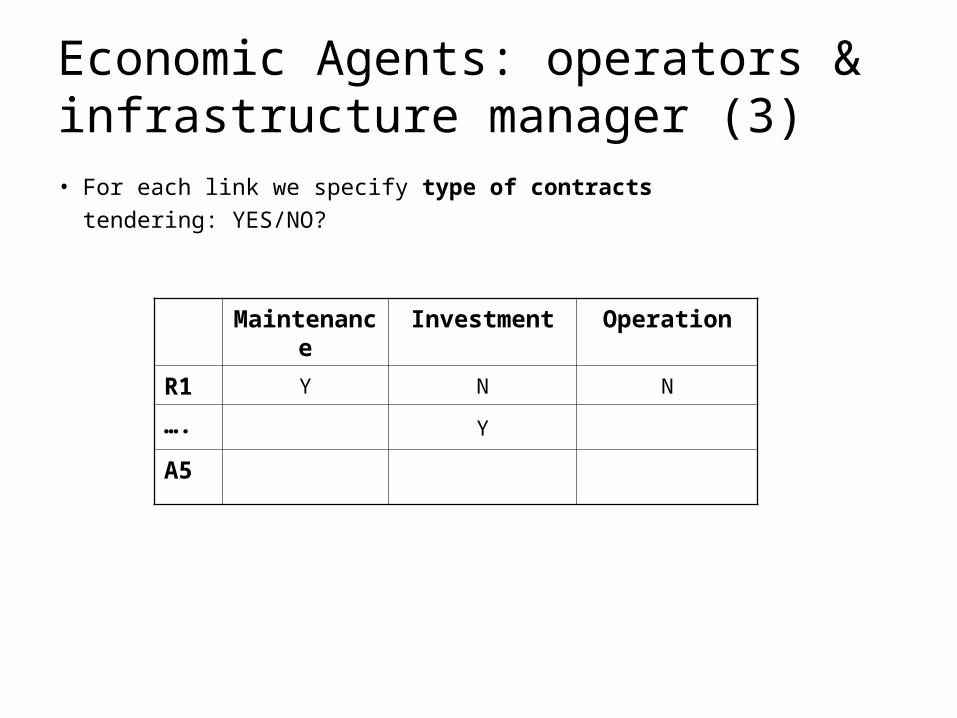
• For each link we specify type of contracts
tendering: YES/NO?
Maintenance Investment Operation
R1 Y N N
…. Y
A5
Economic Agents: operators & infrastructure manager (3)
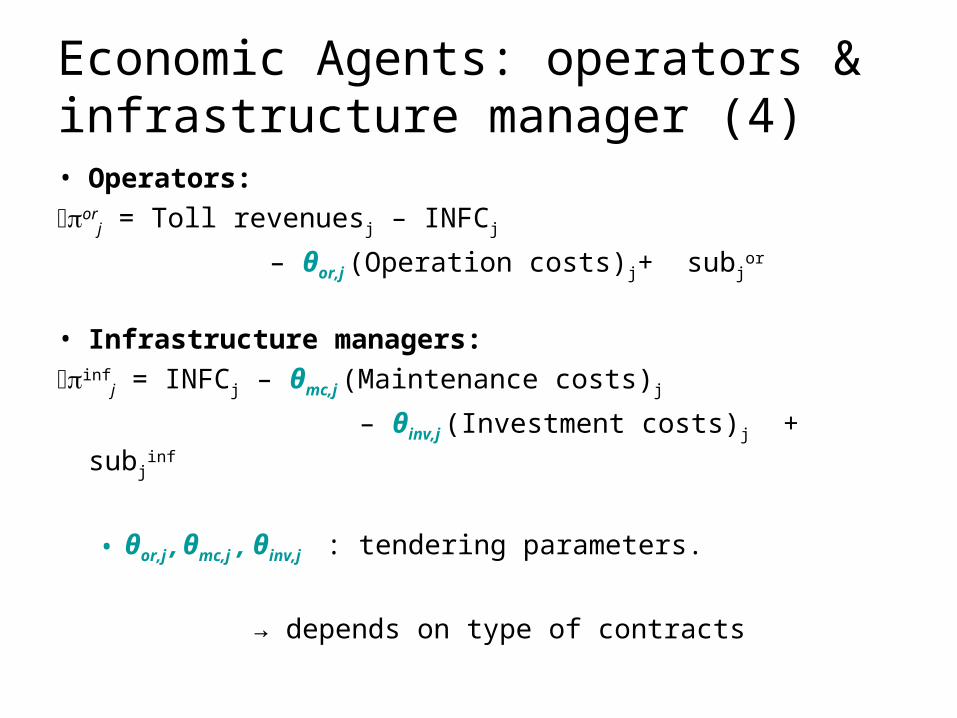
• Operators:
orj = Toll revenuesj – INFCj
– θor,j (Operation costs)j+ subjor
• Infrastructure managers:
infj = INFCj – θmc,j (Maintenance costs)j
– θinv,j (Investment costs)j + subjinf
• θor,j , θmc,j , θinv,j : tendering parameters.
→ depends on type of contracts
Economic Agents: operators & infrastructure manager (4)

Contents
• MOLINO I:– Overview– list of improvements needed
• MOLINO II:– Network structure and definitions– Economic agents and their behaviour– Financial module– Software – Uncertainty– Link with corridor models
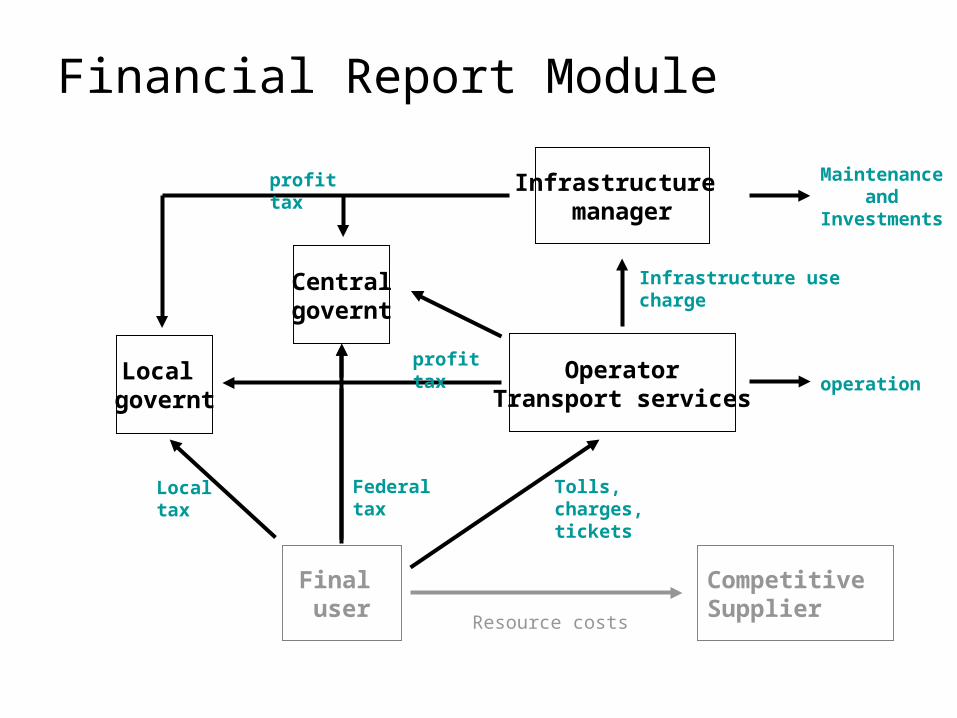
Financial Report Module
Final user
Competitive Supplier
OperatorTransport services
Centralgovernt
Local governt
Infrastructure manager
Localtax
Federaltax
Resource costs
Tolls, charges, tickets
Infrastructure use charge
Maintenanceand
Investments
operation
profit tax
profit tax
subsidy
tax or subsidy
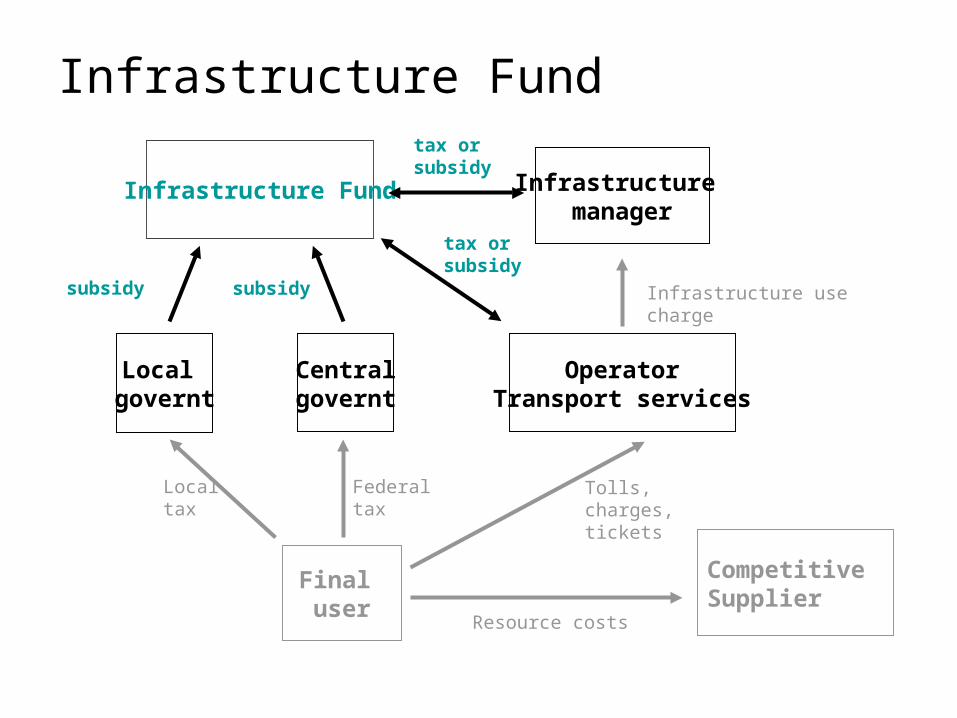
Infrastructure Fund
Final user
Competitive Supplier
OperatorTransport services
Centralgovernt
Local governt
Infrastructure manager
Localtax
Federaltax
Resource costs
Tolls, charges, tickets
Infrastructure use charge
Infrastructure Fund
tax or subsidy
subsidy
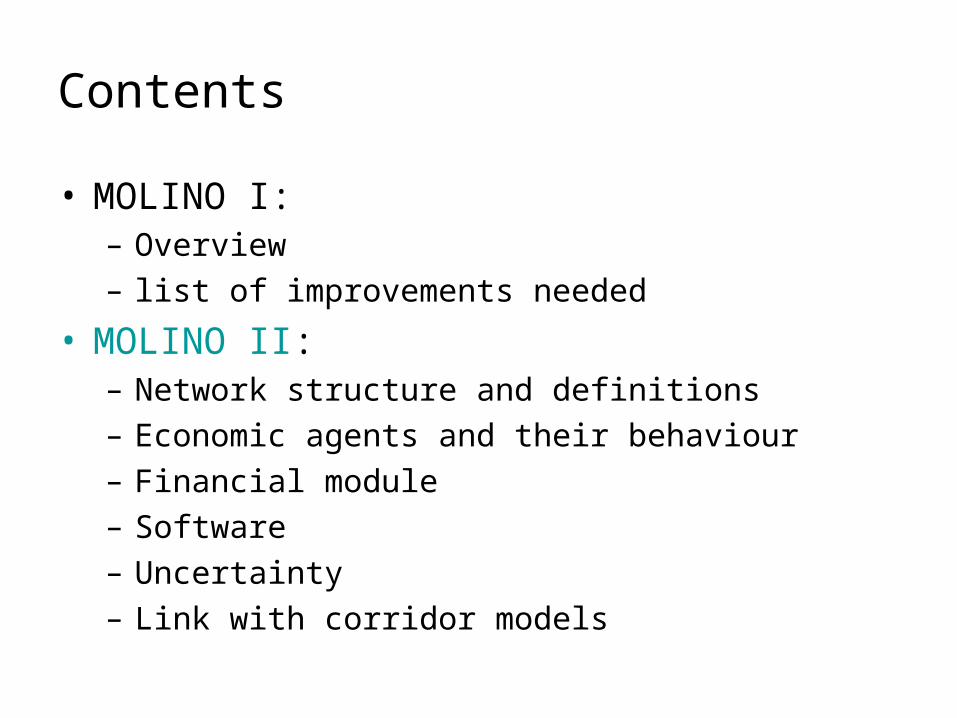
Contents
• MOLINO I:– Overview– list of improvements needed
• MOLINO II:– Network structure and definitions– Economic agents and their behaviour– Financial module– Software (José)– Uncertainty (Stef)– Link with corridor models (Stef)
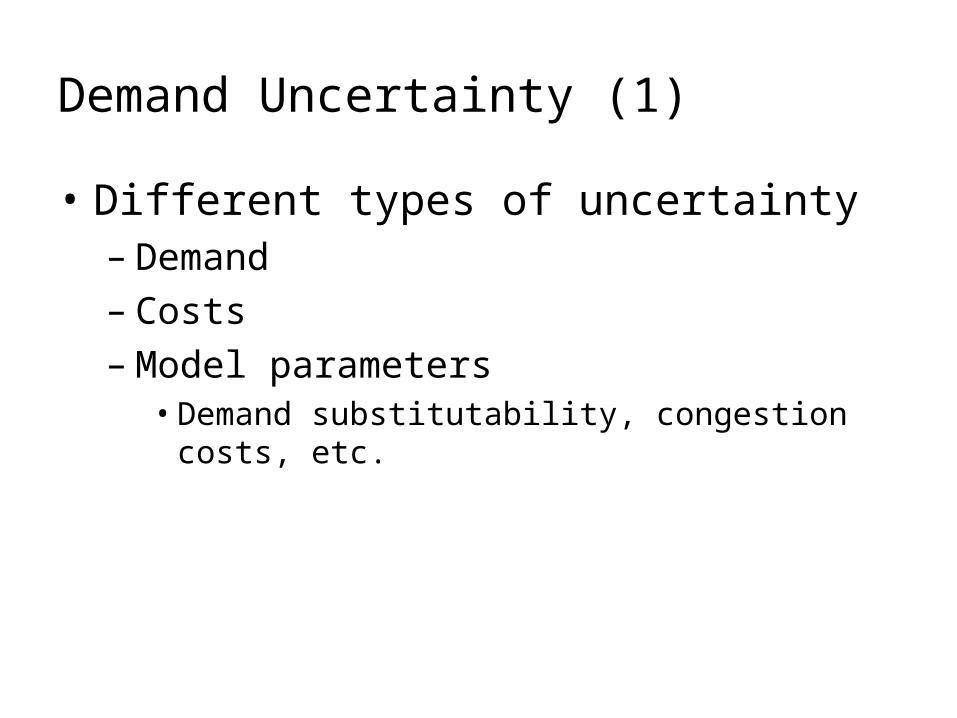
Demand Uncertainty (1)
• Different types of uncertainty– Demand– Costs– Model parameters
• Demand substitutability, congestion costs, etc.
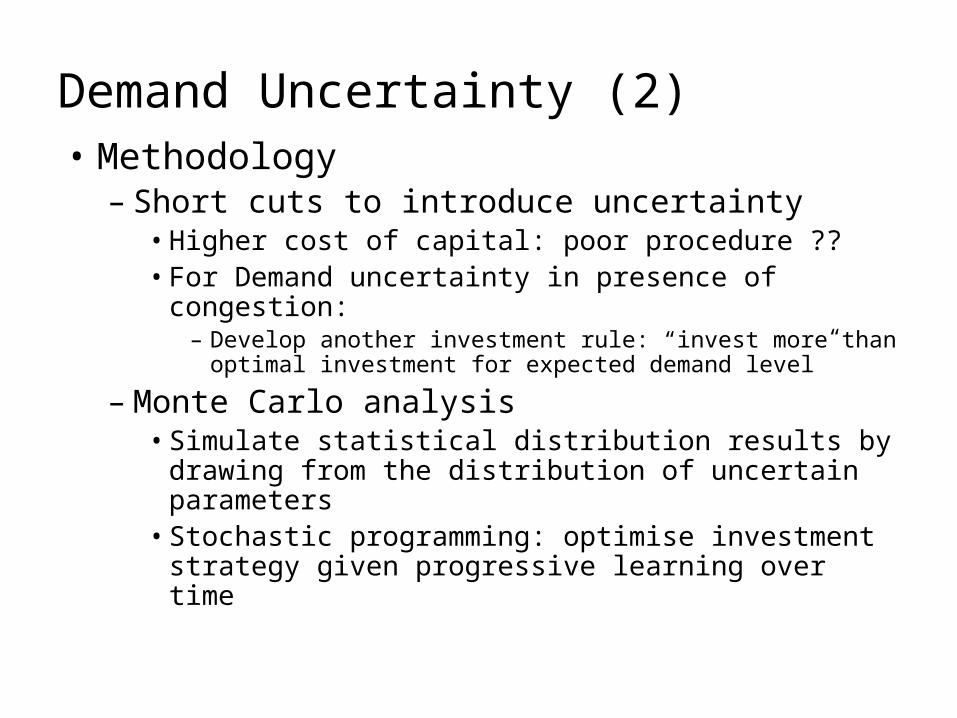
Demand Uncertainty (2)• Methodology
– Short cuts to introduce uncertainty• Higher cost of capital: poor procedure ??• For Demand uncertainty in presence of
congestion: – Develop another investment rule: “invest more than
optimal investment for expected demand level”
– Monte Carlo analysis• Simulate statistical distribution results by drawing
from the distribution of uncertain parameters• Stochastic programming: optimise investment
strategy given progressive learning over time