mombasa commuter railwaysffeasibility study - final report
TRANSCRIPT

MOMBASA COMMUTER RAILWAYS FEASIBILITY STUDY
190 591.10 Mombasa Final Report 27th May 2014
Rev 0
KENYA RAILWAYS CORPORATION KRC Final Report
KRC/PLM/40/2011 Mombasa Commuter Railways Feasibility Study

190 591.10
1 Kenya Railways Corporation KRC Mombasa Commuter Railways Feasibility Study KRC/PLM/40/2011 Final Report
Pöyry Switzerland Ltd.
Copyright © Pöyry Switzerland Ltd.
All rights are reserved. This document or any part thereof may not be copied or repro-duced without permission in writing from Pöyry Switzerland Ltd.

190 591.10
2 Kenya Railways Corporation KRC Mombasa Commuter Railways Feasibility Study KRC/PLM/40/2011 Final Report
Pöyry Switzerland Ltd.
Contact Christian Bergerhoff Hardturmstrasse 161, P.O. Box CH-8037 Zurich/Switzerland Tel. +41 44 355 55 55 Fax +41 44 355 55 56 http://www.poyry.ch Pöyry Switzerland Ltd. Christian Bergerhoff Project Manager

190 591.10
1 Kenya Railways Corporation KRC Mombasa Commuter Railways Feasibility Study KRC/PLM/40/2011 Final Report
Pöyry Switzerland Ltd.
EXECUTIVE SUMMARY
Pöyry Switzerland Ltd., in collaboration with GA Consultants, was appointed by Kenya Railway Corporation (KRC) to perform a feasibility study for the development of a modern metropolitan commuter railway network within the City of Mombasa and sur-rounding counties. The aim was to advise on the type, nature, location and scope of an efficient, safe, cost effective and environmentally sustainable railway system that meets the transport demand of the region as envisaged under Vision 2030, and is expandable to meet needs up to the year 2045 horizon. This report evaluates the feasibility of developing this passenger railway system from technical, socio-environmental, economic and financial perspectives. The market study estimates present and future traffic volumes and serves as input to the route definitions and operational concept. The 7 key lines identified initially were adjusted on the basis of the findings of the study, and resulted in the following 6 corridors totalling some 624 km: Corridor 1: Mombasa – Airport – Likoni - Ramisi Corridor Corridor 2: Mombasa – Mtwapa – Kilifi – Malindi Corridor Corridor 3: Mombasa – Mazeras – Voi Corridor Corridor 4: Likoni Ferry – Bamburi Corridor (Mombasa Ring Corridor) Corridor 5: Mazeras – Kaloleni – Takaungu Corridor Corridor 6: Malindi – Lamu Corridor
The TOR did not define any alignment standards. The study proposes design speeds ranging from 80 km/h in the mountainous region to 120 km/h in the plain region with the corresponding constraints for the minimum radii and maximum slope. The proposed standards correspond to those for a commuter railway, but would also allow for light freight traffic. A standard gauge track of 1.435 m is specified. A single track line has been assumed initially, with 2 tracks at terminal stations and at stations with train crossings or heavy passenger traffic. For signalling and train control it is recommended to adopt a system based on ETCS Level 3. In view of the insufficient and insecure power supply and the high electrification costs it is recommended to use diesel propulsion for the initial phases and base the rolling stock on diesel multiple units (DMUs). As part of the Feasibility Study, both a Preliminary Environmental Impact Assessment (EIA) and a Preliminary Social Impact Assessment (SIA) were to be conducted. These have been prepared together as a Preliminary Environmental and Social Impact As-sessment (ESIA), in the form of a Screening Report, in order to meet the requirements of the National Environment Management Authority (NEMA). Environmental and so-cial mitigation measures to address the identified impacts were outlined in the Environ-mental and Social Management Plan.

190 591.10
2 Kenya Railways Corporation KRC Mombasa Commuter Railways Feasibility Study KRC/PLM/40/2011 Final Report
Pöyry Switzerland Ltd.
The investment costs have been estimated on the basis of a preliminary bill of quanti-ties. The operations costs include the costs of staff (stations, depots and workshops), in-frastructure (depreciation, maintenance and replacement) and train operations (person-nel, fuels and lubricants, depreciation, maintenance and replacement of rolling stock).
A Road Map for the project implementation has been developed based on 12 sections within the 6 corridors described above. These have been prioritised according to the cri-teria investment costs, operation costs and expected traffic volume. A further criterion is the development of a coherent network in each stage of system implementation; sections will only be realised, if they have connectivity to the network (no stand-alone sections). The economic viability assessment considers the macro-economic environment, costs and externalities to assess the economic surplus generated by the project. The first result obtained is a negative NPV (with an interest of 5.5%) and an EIRR of 4.3% for the to-tal project. The sensitivity analysis assuming increased infrastructure costs results in a more negative NPV and reduced EIRR of 3.3%, whereas an increase in benefits im-proves the results and renders a positive NPV and an EIRR of 7.1%. To improve the economic viability of the project a new calculation was made for a re-duced project which excludes the least viable corridors 5 and 6. The reduced project is based on the same Road Map but includes only 10 sections within 4 corridors, with a to-tal length of 365 km. The corresponding calculation gives a positive NPV and an EIRR of 6.3%. The sensitivity analysis assuming increased infrastructure costs results in a negative NPV and reduced EIRR of 5.1%, whereas an increase in benefits improves the results and renders an increased NPV and an EIRR of 9.1%.
The financial viability assessment considers the micro-economic context of the project itself, focusing on identification of the financial gap or surplus from construction and operations and the financing resources required to execute it. From the financial point of view the project NPV (excluding subsidies) is negative, and consequently the FIRR cannot be computed. It concludes that the project, as such, is not considered financially viable and able to sustain its own financing. Operations will require an operations sub-sidy to break even. The study includes a Risk Analysis which identifies and describes the various types of risks which are critical for the future realisation of the project, and proposes mitigation measures for all the identified risks at the various project phases.
The consultant recommends to develop the Mombasa commuter railway project with the reduced scope including the corridors 1 to 4. The corridor 6 Malindi – Lamu should be examined by a new study with the focus freight transport in conjunction with the Lamu port project. The corridor 5 Mazeras – Takaungu shall be included to this freight traffic study representing a bypass to Mombasa for freight trains from Lamu to Nairobi.

190 591.10
1 Kenya Railways Corporation KRC Mombasa Commuter Railways Feasibility Study KRC/PLM/40/2011 Final Report
Pöyry Switzerland Ltd.
Contents
EXECUTIVE SUMMARY.............................................................................................................. 1
1 FRAMEWORK OF THE FINAL REPORT .................................................................. 10
1.1 Final Report ....................................................................................................................... 10 1.2 Scope of Work ................................................................................................................... 10 1.3 Outputs/ Deliverables ......................................................................................................... 11 1.4 Limitation of the Scope of Work ........................................................................................ 12 1.5 Optional Tasks ................................................................................................................... 13
2 PROJECT BACKGROUND ........................................................................................... 14
2.1 The country and its people ................................................................................................. 14 2.2 The Client .......................................................................................................................... 16 2.3 Project Location ................................................................................................................. 16 2.4 Overview of the Counties ................................................................................................... 19 2.4.1 Mombasa ........................................................................................................................... 19 2.4.2 Kwale ................................................................................................................................ 20 2.4.3 Kilifi .................................................................................................................................. 20 2.4.4 Taita Taveta ....................................................................................................................... 21 2.5 Rationale for the Project..................................................................................................... 21 2.6 Objectives of the Study ...................................................................................................... 22 2.7 Background Information about Kenya ................................................................................ 23 2.7.1 Kenya’s Macro-Economic Setting ...................................................................................... 23 2.7.2 Project History: Initial Concept Proposal ........................................................................... 23 2.8 Authorities ......................................................................................................................... 24
3 MARKET STUDY AND TRAFFIC DEMAND FORECAST ....................................... 25
3.1 Introduction ....................................................................................................................... 25 3.2 Methodical Approach ......................................................................................................... 25 3.3 Description of the Existing Situation .................................................................................. 28 3.3.1 Geography ......................................................................................................................... 28 3.3.2 Population and Economy ................................................................................................... 29 3.3.3 Travel behaviour ................................................................................................................ 30 3.3.4 Transport networks ............................................................................................................ 33 3.3.5 Traffic Data Collection ...................................................................................................... 39 3.3.6 Outlook .............................................................................................................................. 42 3.4 Traffic Demand Forecast .................................................................................................... 45 3.4.1 Passenger Demand Potential .............................................................................................. 45 3.4.2 Traffic Volume without Railway ........................................................................................ 46 3.4.3 Traffic Volume with Railway ............................................................................................. 48

190 591.10
2 Kenya Railways Corporation KRC Mombasa Commuter Railways Feasibility Study KRC/PLM/40/2011 Final Report
Pöyry Switzerland Ltd.
3.5 Appraisal of the Operating System ..................................................................................... 53
4 ROUTE LOCATION AND ALIGNMENT .................................................................... 55
4.1 Introduction ....................................................................................................................... 55 4.2 Alignment Standards .......................................................................................................... 55 4.3 Other projects in connection with the railway study ........................................................... 55 4.3.1 New Standard Gauge Railway Mombasa – Nairobi ............................................................ 56 4.3.2 Mombasa port development projects .................................................................................. 56 4.3.3 Lamu Port Project .............................................................................................................. 57 4.4 The Corridor Study ............................................................................................................ 59 4.4.1 Corridor 1: Mombasa – Airport – Likoni - Ramisi Corridor ............................................... 59 4.4.2 Corridor 2: Mombasa – Mtwapa – Kilifi – Malindi Corridor .............................................. 65 4.4.3 Corridor 3: Mombasa – Mazeras – Voi Corridor ................................................................ 71 4.4.4 Corridor 4: Likoni Ferry – Bamburi Corridor (Mombasa Ring Corridor) ............................ 76 4.4.5 Corridor 5: Mazeras – Kaloleni – Takaungu Corridor......................................................... 80 4.4.6 Corridor 6: Malindi – Lamu Corridor ................................................................................. 84 4.5 Road Map for Development ............................................................................................... 86
5 OPERATIONAL CONCEPT .......................................................................................... 89
5.1 Introduction ....................................................................................................................... 89 5.2 Network characteristics ...................................................................................................... 89 5.3 Corridors ........................................................................................................................... 90 5.4 Proposed train services....................................................................................................... 91 5.4.1 Corridor 1: North-South corridor ....................................................................................... 91 5.4.2 Corridor 2: Western corridor .............................................................................................. 91 5.4.3 Corridor 3: Western ring .................................................................................................... 92 5.4.4 Corridor 4: Eastern ring ..................................................................................................... 92 5.5 Alternatives ....................................................................................................................... 92 5.5.1 Likoni corridor ................................................................................................................... 92 5.5.2 Malindi - Lamu .................................................................................................................. 92 5.5.3 Mazeras – Kaloleni - Takaungu.......................................................................................... 92 5.6 Nodes, connections with long-distance services ................................................................. 93 5.7 Train schedule ................................................................................................................... 94 5.7.1 General .............................................................................................................................. 94 5.7.2 Mombasa – Airport – Likoni – Ramisi Service................................................................... 94 5.7.3 Mombasa – Mtwapa – Kilifi – Malindi Service .................................................................. 95 5.7.4 Mombasa – Mazeras – Voi Service .................................................................................... 96 5.7.5 Likoni Ferry – Bamburi Service ......................................................................................... 97 5.7.6 Mazeras – Kaloleni – Takaungu Service ............................................................................ 98 5.7.7 Malindi – Lamu Service ..................................................................................................... 98 5.8 Staffing and organization ................................................................................................... 99 5.9 Maintenance concept ......................................................................................................... 99
6 RAILWAY TECHNOLOGY ........................................................................................ 100

190 591.10
3 Kenya Railways Corporation KRC Mombasa Commuter Railways Feasibility Study KRC/PLM/40/2011 Final Report
Pöyry Switzerland Ltd.
6.1 Introduction ..................................................................................................................... 100 6.2 Trackwork, stations and maintenance facilities ................................................................. 100 6.2.1 Track work ...................................................................................................................... 100 6.2.2 Stations ............................................................................................................................ 101 6.2.3 Maintenance facilities ...................................................................................................... 102 6.3 Signalling and train control .............................................................................................. 104 6.3.1 Purpose of this section ..................................................................................................... 104 6.3.2 Conditions ....................................................................................................................... 104 6.3.3 ETCS system levels ......................................................................................................... 104 6.3.4 Further development ........................................................................................................ 109 6.3.5 Open questions about ETCS Levels 2 / 3 / ERTMS Regional ........................................... 109 6.3.6 PTC (Positive Train Control) ........................................................................................... 112 6.3.7 System recommendation .................................................................................................. 112 6.4 Data transmission network ............................................................................................... 113 6.4.1 Purpose ............................................................................................................................ 113 6.4.2 Network architecture ........................................................................................................ 113 6.4.3 Data transmission............................................................................................................. 115 6.4.4 Available systems ............................................................................................................ 116 6.5 Electrification and power supply ...................................................................................... 116 6.5.1 Energy supply .................................................................................................................. 116 6.5.2 Selection of traction power supply system ........................................................................ 116 6.5.3 Substations ...................................................................................................................... 118 6.5.4 Overhead contact wire system .......................................................................................... 118 6.5.5 Remote control centre ...................................................................................................... 118 6.5.6 Operation and maintenance .............................................................................................. 119 6.5.7 Risks, mitigation .............................................................................................................. 119 6.6 Rolling stock .................................................................................................................... 119 6.6.1 General ............................................................................................................................ 119 6.6.2 Train configuration .......................................................................................................... 119 6.6.3 Capacity........................................................................................................................... 120 6.6.4 Vehicle dimensions and characteristics ............................................................................ 120 6.6.5 Entry and floor height ...................................................................................................... 120 6.6.6 Acceleration and speed .................................................................................................... 121 6.6.7 Propulsion and traction .................................................................................................... 121
7 PRELIMINARY ENVIRONMENTAL AND SOCIAL IMPACT ANALYSIS .......... 122
7.1 Introduction ..................................................................................................................... 122 7.2 General basis of the study ................................................................................................ 122 7.3 Sectoral studies ................................................................................................................ 123 7.3.1 Physical environment ....................................................................................................... 123 7.3.2 Natural environment ........................................................................................................ 124 7.3.3 Socio-economic environment ........................................................................................... 127 7.4 Analysis of social context ................................................................................................ 128 7.5 Synopsis .......................................................................................................................... 129 7.5.1 Overall impact per corridor section .................................................................................. 129 7.5.2 Conclusion ....................................................................................................................... 130

190 591.10
4 Kenya Railways Corporation KRC Mombasa Commuter Railways Feasibility Study KRC/PLM/40/2011 Final Report
Pöyry Switzerland Ltd.
7.5.3 Environmental and Social Management Plan ................................................................... 131
8 PRELIMINARY COST ESTIMATES ......................................................................... 135
8.1 General ............................................................................................................................ 135 8.2 Unit costs and total cost calculation principles ................................................................. 135 8.3 Cost estimation of capital costs ........................................................................................ 136 8.4 Cost estimation of operation costs .................................................................................... 136 8.5 Cost estimation reduced project ....................................................................................... 141
9 ECONOMIC APPRAISAL ........................................................................................... 145
9.1 Introduction ..................................................................................................................... 145 9.2 Methodology.................................................................................................................... 146 9.3 Indicators for the economic appraisal ............................................................................... 147 9.4 Input data ......................................................................................................................... 148 9.4.1 Cost estimation (direct and externalities) .......................................................................... 148 9.4.2 Investment costs .............................................................................................................. 148 9.4.3 Operational expenditures ................................................................................................. 149 9.5 Benefit estimation ............................................................................................................ 149 9.5.1 Travel time benefits ......................................................................................................... 149 9.5.2 External impacts .............................................................................................................. 150 9.5.2.1 Vehicle operating costs (VOC) ........................................................................................ 150 9.5.3 Job Creation ..................................................................................................................... 151 9.5.4 Externalities ..................................................................................................................... 152 9.5.5 Safety / Accidents ............................................................................................................ 153 9.5.6 Revenues ......................................................................................................................... 154 9.5.7 Residual value ................................................................................................................. 154 9.5.8 Total values of benefits .................................................................................................... 154 9.6 Calculation of the economic internal rate of return (EIRR) ............................................... 155 9.7 Risk and sensitivity analysis............................................................................................. 157 9.7.1 Risk Analysis ................................................................................................................... 157 9.7.2 Sensitivity Analysis ......................................................................................................... 157 9.7.3 Scenario with reduced sections ........................................................................................ 158
10 FINANCIAL ASESSMENT .......................................................................................... 161
10.1 Introduction ..................................................................................................................... 161 10.1.1 Context: financial appraisal vs. economic appraisal .......................................................... 161 10.1.2 The Distinction between Funding and Financing or the project ........................................ 162 10.2 Methodology and approach – cash flow engineering concepts .......................................... 163 10.2.1 Defining the project cash flows ........................................................................................ 163 10.2.2 Project returns and parameters ......................................................................................... 164 10.2.3 Identifying the Financing Required and the Funding gap .................................................. 165 10.3 Financial model structure and input assumptions.............................................................. 165 10.3.1 Format and methodology ................................................................................................. 165 10.3.2 Model Structure ............................................................................................................... 166

190 591.10
5 Kenya Railways Corporation KRC Mombasa Commuter Railways Feasibility Study KRC/PLM/40/2011 Final Report
Pöyry Switzerland Ltd.
10.3.3 Revenue input assumptions .............................................................................................. 167 10.3.4 Cost Estimates input assumptions .................................................................................... 168 10.3.5 Operating and Maintenance Expenditures ........................................................................ 169 10.4 Overview of financing and procurement options .............................................................. 172 10.4.1 Project’s financing strategy .............................................................................................. 172 10.4.2 Considerations with regards to PPP-based procurement and packaged financing solutions 174 10.4.3 Proposed financing structure for the feasibility study ....................................................... 176 10.5 Project Scenarios returns and viability gap assessment ..................................................... 179 10.5.1 Computation of financial feasibility parameters ............................................................... 179 10.5.2 Base Case scenario........................................................................................................... 179 10.5.3 Sensitivity analysis .......................................................................................................... 180 10.5.4 Results ............................................................................................................................. 181 10.5.5 Cash Flow Prognoses of the Base Case Simulation .......................................................... 182
11 CONCLUSIONS AND RECOMMENDATIONS......................................................... 184
11.1 Technical concept ............................................................................................................ 184 11.2 Environmental and social impact...................................................................................... 185 11.3 Economic appraisal .......................................................................................................... 185 11.4 Financial assessment ........................................................................................................ 186 11.5 Road Map ........................................................................................................................ 187
12 REVIEW OF ASSUMPTIONS, CHANCES AND RISKS ........................................... 188
12.1 Introduction ..................................................................................................................... 188 12.2 General ............................................................................................................................ 188 12.3 Political Risks .................................................................................................................. 188 12.4 Economic Risks ............................................................................................................... 189 12.5 Legal Framework ............................................................................................................. 190 12.6 Financial Risks ................................................................................................................ 191 12.7 Technical Risks................................................................................................................ 192 12.8 Operational Risks............................................................................................................. 193
13 ANNEXES ...................................................................................................................... 194
13.1 Annex 1: Corridor Study Mapbook .................................................................................. 194 13.2 Annex 2: Population Mapbook ......................................................................................... 194 13.3 Annex 3: Longitudinal Sections Mapbook........................................................................ 195 13.4 Annex 4: Preliminary Environmental and Social Impact Assessment ............................... 196 13.5 Annex 5: Environment Mapbook ..................................................................................... 196 13.6 Annex 6: Socio-Economic Mapbook ................................................................................ 196 13.7 Annex 7: Cost Estimation Investment Costs ..................................................................... 197 13.8 Annex 8: Cost Estimation Operation Costs....................................................................... 197

190 591.10
6 Kenya Railways Corporation KRC Mombasa Commuter Railways Feasibility Study KRC/PLM/40/2011 Final Report
Pöyry Switzerland Ltd.
Table of Tables Table 1.1: Report Schedules ........................................................................................................ 11 Table 2.1: Authorities .................................................................................................................. 24 Table 3.1: Current average daily traffic (ADT) ............................................................................ 40 Table 3.2: Modal Split (%) .......................................................................................................... 40 Table 3.3: The average travel time & cost from Mombasa to the surrounding sub centres ............ 41 Table 3.4: Traffic volumes in catchment area 2013, 2020 and 2045 without railway system ........ 48 Table 3.5: Passengers per day, detailed route section in 2020/30/45 ............................................ 52 Table 3.6: Estimation of required train services ........................................................................... 54 Table 4.1: Alignment Standards................................................................................................... 55 Table 4.2: Stations of the Mombasa – Airport – Likoni - Ramisi Corridor ................................... 61 Table 4.3: Main Structures of the Mombasa – Airport – Likoni - Ramisi Corridor ....................... 62 Table 4.4: Junctions of the Mombasa – Airport – Likoni - Ramisi Corridor ................................. 62 Table 4.5: Stations of the Mombasa – Mtwapa – Kilifi – Malindi Corridor .................................. 67 Table 4.6: Main Structures of the Mombasa – Mtwapa – Kilifi – Malindi Corridor ...................... 68 Table 4.7: Junctions of the Mombasa – Mtwapa – Kilifi – Malindi Corridor ................................ 68 Table 4.8: Comparison of stations along the Mombasa – Mazeras – Voi Corridor ....................... 73 Table 4.9: Commuter Service Stations of the Mombasa – Mazeras – Voi Corridor ...................... 73 Table 4.10: Junctions of the Mombasa – Mazeras – Voi Corridor .................................................. 74 Table 4.11: Stations of the Likoni Ferry – Bamburi Corridor ......................................................... 77 Table 4.12: Main Structures of the Likoni Ferry – Bamburi Corridor............................................. 77 Table 4.13: Junctions of the Likoni Ferry – Bamburi Corridor ....................................................... 78 Table 4.14: Stations of the Mazeras – Kaloleni – Takaungu Corridor ............................................ 82 Table 4.15: Main Structures of the Mazeras – Kaloleni – Takaungu Corridor ................................ 82 Table 4.16: Junctions of the Mazeras – Kaloleni – Takaungu Corridor .......................................... 82 Table 4.17: Stations of the Malindi – Lamu Corridor ..................................................................... 84 Table 4.18: Main Structures of the Malindi – Lamu Corridor ........................................................ 85 Table 4.19: Junctions of the Malindi – Lamu Corridor................................................................... 85 Table 4.20: Road map for development, Sections .......................................................................... 86 Table 4.21: Road map for development, schedule .......................................................................... 87 Table 5.1: Travel Time Mombasa – Airport – Likoni – Ramisi Service ....................................... 94 Table 5.2: Travel Time Mombasa – Mtwapa – Kilifi – Malindi Service ....................................... 95 Table 5.3: Travel Time Mombasa – Mazeras – Voi Service ......................................................... 96 Table 5.4: Travel Time Likoni Ferry – Panga Service .................................................................. 97 Table 5.5: Travel Time Mazeras – Kaloleni – Takaungu Service ................................................. 98 Table 5.6: Travel Time Malindi – Lamu Service.......................................................................... 98 Table 6.1: Data Transmission Types .......................................................................................... 115 Table 7.1: Elements of the landscape affected between Waa Station and Gongoni Station ......... 124 Table 7.2: Preliminary evaluation of overall project impacts per corridor section....................... 129 Table 7.3: Impacts and mitigation measures identified for the planning phase ........................... 132 Table 8.1: Cost estimation of capital costs ................................................................................. 137 Table 8.2: Yearly global and sectional investment costs ............................................................ 138 Table 8.3: Road Map for development, sections of the reduced project ...................................... 141 Table 8.4: Cost estimation of capital costs for the reduced project ............................................. 141

190 591.10
7 Kenya Railways Corporation KRC Mombasa Commuter Railways Feasibility Study KRC/PLM/40/2011 Final Report
Pöyry Switzerland Ltd.
Table 8.5: Yearly global investment costs for the reduced project .............................................. 142 Table 9.1: Parameters for the Economic Appraisal .................................................................... 147 Table 9.2: Values for travel times ............................................................................................. 150 Table 9.3: Time savings ............................................................................................................ 150 Table 9.4: Vehicle operating costs for road traffic ..................................................................... 151 Table 9.5: Saved VOC Costs ..................................................................................................... 151 Table 9.6: Infras-IWW unit costs – Euro for base year 2000 ...................................................... 152 Table 9.7: Transfer coefficients based on GDP/capita ................................................................ 152 Table 9.8: Yearly savings from externalities .............................................................................. 153 Table 9.9: Road Accidents in Kenya per year (rough figure) ...................................................... 153 Table 9.10: Values for saved accidents ........................................................................................ 153 Table 9.11: Accident reduction savings ....................................................................................... 154 Table 9.12: Economic analysis – details ...................................................................................... 156 Table 9.13: Overview of economic analysis result ....................................................................... 157 Table 9.14: Share of effects in total present value ........................................................................ 157 Table 9.16: Economic analysis results with increased investment costs ....................................... 158 Table 9.17: Economic analysis results with increased benefit values ........................................... 158 Table 9.17: Economic analysis results with increased benefit values ........................................... 158 Table 9.18: Share of effects of the Reduced Projekt in total present value.................................... 159 Table 9.19: Economic analysis of the reduced projekt – details (all values in mn KES) ............... 160 Table 10.1: Monthly Staff Costs and crew mixes- Stations .......................................................... 169 Table 10.2: Monthly Staff Costs and crew mixes- Maintenance Facilities .................................... 170 Table 10.3: Monthly Staff Costs and crew mixes- Rolling Stock(Train operations) ..................... 170 Table 10.4: Financing instruments for Mombasa Commuter Rail - review of opportunities ......... 173 Table 10.5: Financing Gap and ODA Loan disbursement for construction financing ................... 177 Table 10.6: Base Case Financial Feasibility Results .................................................................... 179 Table 10.7: Reduced Investment Financial Feasibility Results ..................................................... 180 Table 10.8: Sensitivtiy Analysis Results ...................................................................................... 181 Table 10.9: Cash Flow prognoses – D&B Phase .......................................................................... 183 Table 10.10: Cash Flow prognoses – Operating Phase until 2045 .................................................. 183 Table 11.1: Large bridges of the Corridor 1: Mombasa – Likoni – Ramisi ................................... 184 Table 11.2: Large bridges of the Corridor 2: Mombasa – Kilifi – Malindi.................................... 184 Table 11.1: Large bridges of the Corridor 4: Likoni Ferry – Junda – Bamburi ............................. 184 Table 13.1: Content of Corridor Study and Population Mapbook ................................................. 194 Table 13.2: Content of Longitudinal Sections Mapbook .............................................................. 195 Table 13.3: Content of Environment and Socio-economic Mapbook............................................ 196
Table of Figures
Figure 2.1: Kenya - Geography ..................................................................................................... 14 Figure 2.2: Kenya - Population ..................................................................................................... 14 Figure 2.3: Kenya - Administration............................................................................................... 14 Figure 2.4: Mombasa Location Map & National Transport linkages ............................................. 18 Figure 2.5: Major Road Networks in Mombasa Central Business District ..................................... 19

190 591.10
8 Kenya Railways Corporation KRC Mombasa Commuter Railways Feasibility Study KRC/PLM/40/2011 Final Report
Pöyry Switzerland Ltd.
Figure 3.1: Work Steps of Market Study and Traffic Demand Forecast ......................................... 25 Figure 3.2: Increase of Traffic Demand in Chatchment Area (Demand Forecast) .......................... 27 Figure 3.3: Increased Area with Travel Time To Centre < 45 min. due to Railway (exemplary) .... 27 Figure 3.4: Map of Mombasa Island ............................................................................................. 28 Figure 3.5: Map of proposed lines in the Mombasa Region ........................................................... 29 Figure 3.6: Population Distribution in and around Mombasa ......................................................... 30 Figure 3.7: Composition of travel mode for Nairobi ...................................................................... 31 Figure 3.8: Travel modes in Nairobi ............................................................................................. 32 Figure 3.9: Modal Share Mombasa Region 2013 .......................................................................... 32 Figure 3.10: Average trip distance and travel speed per mode ......................................................... 33 Figure 3.11: Transportation Network around Mombasa and the Surrounding Towns ...................... 34 Figure 3.12: Typical pedestrian condition in rural area.................................................................... 35 Figure 3.13: Rural road with pedestrian and bycicle traffic on side strip ......................................... 35 Figure 3.14: Matatu ........................................................................................................................ 36 Figure 3.15: Tuk_Tuk ..................................................................................................................... 37 Figure 3.16: Motorcycle taxi ........................................................................................................... 37 Figure 3.17: Bicycle Taxi ............................................................................................................... 38 Figure 3.18: Likoni Ferry................................................................................................................ 39 Figure 3.19: LAPSSET Transport Corridor Development Plan ....................................................... 43 Figure 3.20: Mombasa Southern Bypass and Kipevu Link Road Development Plan ....................... 44 Figure 3.21: Kenya Population Projection ....................................................................................... 45 Figure 3.22: Population Forecast: Population within 3km areas around stations .............................. 46 Figure 3.23: Modal split changes 2009 - 2045................................................................................. 47 Figure 3.24: Daily trips per transport mode 2020 – 2050................................................................. 47 Figure 3.25: Trip shifts to railway system (2045) ............................................................................ 49 Figure 3.26: Ramp-up of trips acording to built railway infrastructure ............................................ 49 Figure 3.27: Total passengers per year and line. Traffic volumes in catchment area of the railway
system in 2013, 2020 and 2045 ................................................................................... 50 Figure 3.28: Passengers per day and route section in 2045 .............................................................. 51 Figure 4.1: Mombasa Port Projects ............................................................................................... 57 Figure 4.2: Lamu Port Project ....................................................................................................... 58 Figure 4.3: Mombasa Main Station ............................................................................................... 60 Figure 4.4: The Dongo Kundu Table Mountain ............................................................................. 60 Figure 4.5: The Ramisi Sugar Plant Area ...................................................................................... 61 Figure 4.6: Topology of Corridor 1, Section Mombasa Main Station– MOI International Airport . 63 Figure 4.7: Topology of Corridor 1, Section Tsunza - Tiwi ........................................................... 63 Figure 4.8: Topology of Corridor 1, Section Ukunda – Ramisi...................................................... 64 Figure 4.9: Mombasa Central Business District ............................................................................ 65 Figure 4.10: Mombasa Harbour with relicts of the old pontoon bridge ............................................ 66 Figure 4.11: The Kilifi Creek .......................................................................................................... 66 Figure 4.12: Malindi Main Road ..................................................................................................... 67 Figure 4.13: Mida Creek near Watamu ........................................................................................... 69 Figure 4.14: Topology of Corridor 2, Section Mombasa – Shimo la Tewa ...................................... 70 Figure 4.15: Topology of Corridor 2, Section Mtwapa – Kilifi ........................................................ 70 Figure 4.16: Topology of Corridor 2, Section Mtondia – Malindi ................................................... 70 Figure 4.17: Miritini Railway Station ............................................................................................. 71

190 591.10
9 Kenya Railways Corporation KRC Mombasa Commuter Railways Feasibility Study KRC/PLM/40/2011 Final Report
Pöyry Switzerland Ltd.
Figure 4.18: Tsavo National Park, Bachuma Gate ........................................................................... 72 Figure 4.19: C 105 Level crossing at Voi ........................................................................................ 72 Figure 4.20: Topology of Corridor 3, Section Mombasa – Mikindani ............................................. 74 Figure 4.21: Topology of Corridor 3, Section Miritini - Samburu ................................................... 75 Figure 4.22: Topology of Corridor 3, Section Taru - Voi ................................................................ 75 Figure 4.23: Likoni Ferry................................................................................................................ 76 Figure 4.24: Junda Creek ................................................................................................................ 77 Figure 4.25: Topology of Corridor 4, Section Likoni Ferry – Junda ................................................ 78 Figure 4.26: Topology of Corridor 4, Section Kengelani Road – Bamburi ...................................... 79 Figure 4.27: Countryside near Mkapuni .......................................................................................... 80 Figure 4.28: Kambe Cement Plant .................................................................................................. 81 Figure 4.29: Kaloleni Main Road .................................................................................................... 81 Figure 4.30: Topology of Corridor 5, Mazeras - Takaungu ............................................................. 83 Figure 4.31: The Tana River Delta .................................................................................................. 84 Figure 4.32: Topology of Corridor 6, Malindi – Lamu .................................................................... 85 Figure 4.33: Road map for development ......................................................................................... 88 Figure 5.1: General planned network map ..................................................................................... 90 Figure 5.2: City of Mombasa detail map ....................................................................................... 91 Figure 6.1: Typical Cross-Section ............................................................................................... 100 Figure 6.2: Principe schema ETCS Level 1 ................................................................................. 105 Figure 6.3: Example of balises, Hatfield (Pretoria) 9.12.2011 ..................................................... 106 Figure 6.4: Principe schema ETCS Level 2 ................................................................................. 106 Figure 6.5: Example of cab signal display, Gautrain Unit 301.016, Pretoria 9.12.2011 ................ 107 Figure 6.6: Principle schema ETCS Level 3 / ERTMS Regional ................................................. 108 Figure 6.7: Principle schema ETCS Level 3 / ERTMS Regional with GPS tracking .................... 109 Figure 6.8: Principle of “Dark territory management” ................................................................. 110 Figure 6.9: Network architecture................................................................................................. 114 Figure 6.10: Autotransformer system ............................................................................................ 117 Figure 6.11: Overhead contact lines on individual supports using concret poles. ........................... 118 Figure 6.12: Typical configuration schema of rolling stock for commuter rail ............................... 120 Figure 8.1: Yearly and accrued investment cost for each section ................................................. 139 Figure 8.2: Yearly and accrued operation costs for each section ................................................. 140 Figure 8.3: Yearly and accrued investment cost for the reduced project ...................................... 143 Figure 8.4: Yearly and accrued operation costs for each section for the reduced project .............. 144 Figure 9.1: Transport Economic Appraisal Structure ................................................................... 146 Figure 9.2: Investment cost (economic values) ............................................................................ 148 Figure 9.3: Project benefit development ...................................................................................... 155 Figure 9.4: Cash Flow Curve of economic values ....................................................................... 155 Figure 10.1: Socio-Economic vs. Financial appraisal (source RebelGroup) ................................... 161 Figure 10.2: Financing Gap vs. Funding Gap (source RebelGroup) .............................................. 163 Figure 10.3: Mechanics of the spreadsheet financial model ........................................................... 166

190 591.10
10 Kenya Railways Corporation KRC Mombasa Commuter Railways Feasibility Study KRC/PLM/40/2011 Final Report
Pöyry Switzerland Ltd.
1 FRAMEWORK OF THE FINAL REPORT
1.1 Final Report This Final Report is submitted by Pöyry Switzerland Ltd. in accordance with the Con-sultancy Agreement dated 30. October 2012 for Consultancy Services for Feasibility Study, Environment and Social Impact Assessment for Development of Modern Metro-politan Commuter Rail Services within Mombasa City and Surrounding Counties. It is based on the Inception Report dated 11. January 2013, the Interim Report dated 30. April 2013, the Draft Final Report dated 13. November 2013, the conference held in Nairobi with KRC on 10. January 2013 the Stakeholder Conferences held in Mombasa on 15. January and 26. June 2013 and the PIG meeting held in Nairobi on 7. February 2014.
1.2 Scope of Work The consultancy assignment covers the following key areas:
i. Market study: undertake current market demand analysis and demand forecast projection over a period of 30 years based on qualitative and quantitative macro-economic data. The Consultant shall carry out transportation studies including origin-destination study quantifying the factors influencing passenger transport demand to produce data on demand forecasts. The relevant data shall encompass demographic and economic activities.
ii. Route location: identify possible routes and prepare sketch route layout and sta-tions. The route shall be categorized as routes within Mombasa City, and routes linking Mombasa City to other centers including the proposed Lamu port. The route and alignment making shall be to such detail as to enable the Consultant estimate right of way costs, development and operating costs to within +-20%.
iii. Environmental impact analysis: undertake a preliminary Environmental Impact Assessment (EIA) for the proposed project in accordance with National Envi-ronmental Management Authority (NEMA) guidelines to identify the type, na-ture, extent of possible impact to the environment and prepare initial cost esti-mate for recommended mitigation factors.
iv. Social impact assessment: develop framework for SIA as per World Bank Guidelines and undertake a preliminary assessment of the potential social impact in terms of the resettlement of persons and compensation for properties and their cost thereof.
v. Technical viability: undertake option analysis and examine possible railway in-frastructure design options covering permanent way, station facilities, mainte-nance facilities, information communication, train control systems, electrifica-tion, diesel and other railway equipment;
vi. Estimate the costs for the right of way, environment and social mitigations, in-frastructure development and operation of the various systems;

190 591.10
11 Kenya Railways Corporation KRC Mombasa Commuter Railways Feasibility Study KRC/PLM/40/2011 Final Report
Pöyry Switzerland Ltd.
vii. Financial and economic viability assessment: determine the financial and eco-nomic viability of proposed lines and appropriate investment in equipment. Identify financially viable (bankable) routes or systems. Where economic viabil-ity is the criteria determine funding gap required to attract Public Private Part-nership (PPP) and lender funding. In making evaluation due consideration to be given to time based development plan (project phasing) that would assure finan-cial and/or economic viability.
viii. Develop a risk matrix for the project in view of various project implementation and funding option
ix. Examine various project funding options including Government budget provi-sions, county budget support during operation and PPP options.
x. Upon consultations with the Client, stakeholders and investor market sensing, make recommendations on preferred option and priority routes.
xi. Prepare project implementation schedule and funding requirement covering de-tailed design and development for the recommended project implementation op-tion.
xii. Make any other relevant recommendation deemed necessary.
The entire study will be undertaken over a period of 6 (six) calendar months after com-mencement of the study.
1.3 Outputs/ Deliverables The main output will be the final report which will cover the issues referred to under the scope given. However, the Consultant will be required to prepare and submit the follow-ing stage reports:
Table 1.1: Report Schedules WEEKS/MONTH OUTPUT/TASK TYPES, NOs OF REPORTS &
FORMAT -3 weeks Signing of Contract 0 Commencement of Con-
tract
1 month Inception Report 4 (Four) hard copies & soft copy 3 month Interim Report 6 (Six) hard copies and 6 (six) CD’s 4.5 month Stake Holders Conference 5month Draft Final report 6 (Six) hard copies & 6 (six) CDs 6 month Final Report 10 (Ten) hard copies & Ten (10)
CD’s
The inception report shall include: i. Definition of the objectives of the services to be rendered and expected results;
ii. Submission of detailed work plan and performance plan, including indicators for the evaluation of progress;
190 591.10
12 Kenya Railways Corporation KRC Mombasa Commuter Railways Feasibility Study KRC/PLM/40/2011 Final Report
Pöyry Switzerland Ltd.
iii. Possible risks and challenges anticipated to arise during the period of services;
iv. An overview of existing projects documentation and information; v. Results of existing field investigation;
vi. Presentation of the quality assurance mechanisms for implementation of the work;
vii. Quality Plan that the Consultant shall adhere to during Study implementation. Quality Plan shall include sets of success indicators that shall be used for moni-toring and quality assessment;
viii. The name list of authorities, with whom contacts were made during preparation of project and the meetings protocols;
The Interim Report shall cover issues outlined in section 5.4 (i) to (iv) of TOR and should analyze and reflect the working in a way that gives Client an adequate picture of the main outcomes and the reasons thereof.
The Draft Final Report shall cover all issues outlined the TOR. The Draft final shall in-clude all the findings, analysis, conclusions and recommendations of the Consultant. It shall be submitted to the Client and subsequently discussed. The Consultant, upon con-sideration of the Clients views shall review and prepare the Final Report which shall take into account all the Clients input and include final conclusions and recommenda-tions.
1.4 Limitation of the Scope of Work The following railway corridors have been identified to be evaluated within this feasi-bility study:
Moi International Airport Corridor Mombasa – Mtwapa – Kilifi Corridor Kilifi – Lamu Corridor Miritini – Ramisi Corridor Mazeras – Kaloleni – Takaungu Corridor Mombasa – Voi Corridor along the existing meter gauge railway
These corridors connect the most important settlement areas of the Mombasa region with the regional metropolis. The feasibility study will treat these corridors in particular.
The Mombasa – Voi Corridor is as well part of the project to build a standard gauge railway Mombasa – Nairobi – Malaba. The examination for using this corridor for commuter railway of Mombasa region too will therefore be based on results of the Standard Gauge Railway (SGR-)Project to prevent a double alignment in this corridor.
The operational concept would be drawn up in a simple way to get the basis for estima-tion of the operational costs
The study is limited to the investigation of passenger traffic following the task to devel-op a commuter railway network. The proposed railway lines can naturally be used for

190 591.10
13 Kenya Railways Corporation KRC Mombasa Commuter Railways Feasibility Study KRC/PLM/40/2011 Final Report
Pöyry Switzerland Ltd.
freight traffic too but freight traffic evaluation, conception of installations and economic assessment for freight traffic are not subject of this study. The study will be based on a tariff system accordant to the system which is foressen for the Nairobi Commuter Railway. The relevant information must be made available to the consultant.
1.5 Optional Tasks The study may be enhanced by additional topics to be researched. We have identified the following topics to be subject for optional tasks: -
Detailed operational concept study. A detailed operational concept study can result more detailed information for running a commuter railway at Mombasa. We recommend to deepen the investigation of the operating system in a further study.
Feasibility study for a standard gauge railway in the Mombasa – Voi Corridor. The alignment of the Mombasa – Voi corridor is subject of the SGR-Projekt Mombasa – Nairobi. It is foreseen to adopt the SGR alignment for this study with any necessary adjustments. If the alignment is not yet available it would be possible to design an alignment following the SGR design criteria as an option-al task.
Freight traffic. It would be expedient to use the railway corridors for freight traffic too. This could also provide economic and financial benefits. The inclu-sion of freight traffic to the feasibility study can be an optional task.

190 591.10
14 Kenya Railways Corporation KRC Mombasa Commuter Railways Feasibility Study KRC/PLM/40/2011 Final Report
Pöyry Switzerland Ltd.
2 PROJECT BACKGROUND
2.1 The country and its people Kenya is located in East Africa, against the Indian Ocean. It has a surface area of some 580,000 sq.km and a population of 38 mil-lion. Key exports include tea, coffee, flowers, fruits and vegetables. Tourism is an im-portant earner of foreign exchange. Kenya has international borders with 5 countries: Sudan, Ethiopia, Somalia, Tan-zania and Uganda. International relations are maintained through various organisations. Two are of particular interest, the East Afri-can Community1 and the Common Market for Eastern and Southern Africa 2(COMESA). The East African Community (EAC) is the regional intergovernmental or-ganisation of the Republics of Kenya, Ugan-da, the United Republic of Tanzania, Repub-lic of Rwanda and Republic of Burundi with its headquarters in Arusha, Tanzania. COMESA is a regional economic community with a free trade area.
The highest level of the country´s internal administrative structure, in line with the New Constitution promulgated on 27th August, 2010 begins with 47 counties each headed by a presidentially appointed County Commis-sioner. The counties are subdivided into dis-tricts (Wilaya) which are then subdivided in-to divisions (Tarafa). The divison is then subdivided into location (Mtaa) and then sub-location (Kijiji). Mombasa is Kenya’s second largest City as well as being the capi-tal of the county; it is therefore a county di-vided into four divisions and it has six con-stituencies. Mombasa is located on the east coast of Kenya, in the Coast Region. The government supervises administration of the counties and therein the districts, with the
1 East African Community 2 COMESA website
Figure 2.1: Kenya - Geography
Figure 2.2: Kenya - Population
Figure 2.3: Kenya - Administration

190 591.10
15 Kenya Railways Corporation KRC Mombasa Commuter Railways Feasibility Study KRC/PLM/40/2011 Final Report
Pöyry Switzerland Ltd.
government represented by the commissioners.
Climate Kenya has a tropical climate. It is hot and humid at the coast, temperate inland and very dry in the north and northeast parts of the country. There is however a lot of rain be-tween March and May, and moderate rain in October and November. The temperature remains high throughout these months.3
Environment and social impact Kenya has a considerable land area of wildlife habitat, with many national parks and game reserves. Kenya also has a sizeable amount to land occupied by social infrastruc-ture comprising health, education, water and sanitation facilities, including religious and cultural sites. In addition, agricultural land and economic infrastructure such as roads, railway, markets, etc. also occupy a notable area. Land plays a pivotal role in the social, economic and political development.
Land is one of the major foundations for national transformations targeted in achieving Vision 2030 goals4. Under land reforms, computerised land records, reference numbers and establishment of National Spatial Data Infrastructure will make it easier to facilitate tracking of land use patterns, put into place a legal framework for faster resolution of land disputes, and plan and identify needed land based projects. Land owners will also be easily identified and compensated where there is land-take for projects.
Transport administration The central governing authority is the Government of Kenya (GoK). There are several relevant and important government Ministries. Examples are the Ministry of Transport, the Kenya Ministry of Environment and Natural Resources, the Kenya Roads Board, and the Kenya Railways Corporation (KRC), who is the Client for the Kenya railway project.
The main mode types of transport in Kenya are: road, rail, air, maritime and pipeline. The transport sector is seen by the government as “crucial in the promotion of socio-economic activities and development. An effective, efficient and reliable transport sys-tem is a mainspring for rapid and sustained development in terms of national, regional and international integration, trade facilitation, poverty reduction and improvement of welfare of the citizenry”5.
National Development Policy The most important document in recent years on national development policy is the “Vision 2030” report. Available in a popular version (32 pages) and a more technical version (180 page final report, published in 2007). As the popular version explains,
3 Wiki Kenya 4 Vision 2030, Second Annual Progress Report (2009-2010) 5 MoT website

190 591.10
16 Kenya Railways Corporation KRC Mombasa Commuter Railways Feasibility Study KRC/PLM/40/2011 Final Report
Pöyry Switzerland Ltd.
“Kenya Vision 2030 is the country’s new development blue-print covering the period 2008 to 2030. It aims to transform Kenya into a newly industrialising, “middle-income country providing a high quality life to all its citizens by the year 2030”. The Vision has been developed through an all-inclusive and participatory stakeholder consultative process, involving Kenyans from all parts of the country. It has also benefited from suggestions by some of the leading local and international experts on how the newly industrialising countries around the world have made the leap from pov-erty to widely-shared prosperity and equity. The Vision is based on three “pillars”: the economic, the social and the po-litical”.
Key proposals in the technical version of the Vision 2030 which could strongly affect the proposed Kenya railway line include:
development of a national spatial plan an integrated national transport plan expanding sea port facilities light rail and bus rapid transit for Nairobi tourism as one of 6 priority sectors proposed 2 large and 22 medium river dams 6 “metropolitan regions”
The existing railway The main line of the existing narrow gauge (metre gauge) Kenya Railways’ network is some 1000 km long and connects the Indian Ocean port of Mombasa to the port of Ki-sumu on Lake Victoria. There is a link to Uganda and there are a number of branch lines. The RFP note that the “infrastructure is on average 100 years old with limited quality of service and carrying capacity for freight and passengers”. Besides the main line there are a number of commuter rail lines. For example Kenya Railways arrange commuter rail services for Nairobi and its environs, and plans to ex-tend the city commuter rail network. KRC has also initiated studies to develop commut-er rail infrastructure and services for Mombasa and Kisumu.
2.2 The Client Kenya Railways Corporation (KRC) is the client for this proposed project is. KRC is a public enterprise wholly owned by the Government of Kenya and established by an Act of Parliament. KRC is mandated under KRC Act Cap 397 to provide rail and inland wa-terways transport.
2.3 Project Location The proposed project is to be located in Mombasa City/County and its adjoining coun-ties of Kwale, Kilifi and linkage to the proposed Lamu Port. Mombasa is the second
Kenya – Vision 2030

190 591.10
17 Kenya Railways Corporation KRC Mombasa Commuter Railways Feasibility Study KRC/PLM/40/2011 Final Report
Pöyry Switzerland Ltd.
largest city and the gateway to the country from the Indian Ocean. It has a population of about 940,000 people. The populations of the adjoining counties of Kilifi and Kwale are approximately 1,359,100 and 649,950 respectively.
Mombasa lies on the eastern shores of the Indian Ocean and has a major international sea port and an international airport. The city also serves as the centre for coastal tour-ism industry and provides pivotal linkage to the Tsavo National Park located to the east of the city. The Central Business District for the city is located on Mombasa Island, but the city extends to the mainland. Mombasa Island is connected to the mainland to the north by Nyali bridge, to the south by Likoni ferry and to the west by Makupa cause-way. Mombasa port is the largest port in East Africa and serves Kenya, Uganda, Rwan-da, Burundi, the eastern part of the Democratic Republic of Congo (DRC), Northern Tanzania and South Sudan. Mombasa, being the a major tourist destination, an administrative and commercial cen-tre and with a combined population of 3 million people in the city and adjoining coun-ties, is in serious need of an efficient and reliable transport system. Indeed there is need for a sustainable transport solution now and in the near future in order to address the so-cio-economic needs of the cities and surrounding populations as envisaged in the mil-lennium development goals. Currently, the City is linked by two international road networks: International Trunk Road A109 Mombasa to Kampala through Nairobi running to the north east, Interna-tional Trunk Road A14 Mombasa-Lungalunga road running south-west to Likoni, Kwale and to the Tanzania border with linkage to Dar-es-Salaam and National Road B8 running due north east to Malindi and Garissa. The city is also connected by an interna-tional railway main line that runs north-east to the capital city of Nairobi and to Kampa-la, Uganda.

190 591.10
18 Kenya Railways Corporation KRC Mombasa Commuter Railways Feasibility Study KRC/PLM/40/2011 Final Report
Pöyry Switzerland Ltd.
Figure 2.4: Mombasa Location Map & National Transport linkages
Moi International Airport (MIA) serves the city of Mombasa. It is located in the town-ship of Port Reitz. The airport handles growing air traffic with a substantial number of airlines flying directly from and to Europe, and offering connections to over twenty cit-ies in the region. Within the city, Mombasa road, which is part of the International Trunk road A109 and Digo Roads and Nyerere Avenue transverses through the center of the city in east - west direction and also serves the Moi International airport; Moi Avenue which connects the Central Business District to the Kilindini Harbour, Lumumba Road which links road A109 to Mombasa Central Railway Station and Ziwani- Nyali Road which connects to the Mombasa-Malindi Road B8.

190 591.10
19 Kenya Railways Corporation KRC Mombasa Commuter Railways Feasibility Study KRC/PLM/40/2011 Final Report
Pöyry Switzerland Ltd.
Figure 2.5: Major Road Networks in Mombasa Central Business District
2.4 Overview of the Counties
2.4.1 Mombasa An Island lying on the Indian Ocean, Mombasa City is Kenya’s second-largest city, ac-cording to the 2009 Census, has a population of 939,370. Mombasa is an international seaport that serves Kenya’s neighbouring land locked countries. The county is situated in the South Eastern part of Coast Province. It borders Kilifi County to the North, Kwale County to the South West and the Indian Ocean to the East. The Tudor Creek and Kilindini Habour separate Mombasa Island from the mainland. The Nyali Bridge connects the island is connected to the mainland to the North whereas the Likoni Ferry connects it to the South and the Makupa Causeway connects the island to the West. The majestic and imposing baobab trees dot the coastal region. The original Arabic name of the city is Manbasa. Mombasa’s Swahili name, Kisiwa Cha Mvita (or Mvita for short), which means "Island of War" name is a depiction of the numerous wars fought over the centuries for ownership of the island. Mombasa is an ancient city whose rapid expansion in the last two decades has resulted in the prolifera-tion of informal settlements and general poor urban planning.
Mombasa is a regional cultural and economic hub. The city is the tourism capital of the coastal region and a major cog in Kenya’s tourism sector. The main industries in Mom-basa County include the Bamburi Cement, Mombasa Cement factory, Kenya Breweries Limited and The Tourism Industry and supporting services industry is very well devel-oped in Mombasa County. The tourist attractions include the world famous white sandy beaches, Fort Jesus Museum, Bamburi Nature Trail, Mombasa Marine Park, Water
190 591.10
20 Kenya Railways Corporation KRC Mombasa Commuter Railways Feasibility Study KRC/PLM/40/2011 Final Report
Pöyry Switzerland Ltd.
Sports, Haller Park, Mamba Village, Nguuni Nature Sanctuary, Mombasa Old Town, Gedi Ruins amongst numerous others. Mombasa has a well-developed transport connection to the neighbouring counties and the country in general. The Moi International Airport in Port Rietz, the second busiest after Jomo Kenyatta International Airport, links Mombasa to the international world. The Kilindini Harbour connects Mombasa to the rest of the world by sea. The city is al-so linked to the rest of the country by the Uganda Railway that ferries both goods and passengers known for its unpredictability and unreliability. The town is also linked with Voi town and the rest of the country by a rail to Uganda, connecting the landlocked country with the port. The A109/A104/A1, major national highways, connect Mombasa to Eldoret and Busia through the capital city, Nairobi. Mombasa is also linked to Lamu, Kwale, Kilifi and Voi by road. Mombasa County is home to the Mombasa Polytechnic University College. Additional-ly, all the main national universities have their constituent colleges in Mombasa.
2.4.2 Kwale Kwale with a population of 649,931 is located to the south of Kenya. It borders Tanza-nia to the South West, Taita Taveta to the West and North West, Kilifi to the North and North East; Mombasa to the East; and Indian Ocean to the East and South East. Kwale town is the capital of the county. Kwale’s beauty is embedded in its four topographical features; the Coastal Plain, the Foot Plateau, the Coastal Uplands and the Nyika Plateau. Tourism plays an important role in the economy of Kwale. Kwale County is home to the picturesque Diani Beach, the Colobus Trust and Kaya Kinondo Sacred Forest; key tour-ist attractions. Tourist attractions include the Tsavo East and Tsavo West National Parks, Shimba Hills National Reserve, Kisite Mpunguti National Park and Reserve, Shedrick Falls, Maji Moto Springs and Mwaluganje Elephant Sanctuary amongst others.
Deposits of rare earth minerals have been found in Kwale leading to a recent develop-ment of the mining sector in the county with Titanium mining having commenced. Ag-riculture is important to the county with vast sugarcane, coconut vegetables and fruit farms cover the landscape of the county
Kwale County is accessible by road network through the neighbouring counties from Kenya’s capital city, Nairobi. The nearest airport is the Moi International Airport in Mombasa County and the Diani Airstrip in Diani. Kwale County does not have a University. However, the Mombasa Polytechnic Univer-sity College maintains a campus in Ukunda.
2.4.3 Kilifi Kilifi County with a population of 1,109,735 is 60 km from Mombasa City and one of the six counties within Kenya’s Coastal Region. Bordering Kilifi County to the South is Mombasa County; to the North, Tana River and Lamu; to the West Taita Taveta whilst to the East is the Indian Ocean. Kilifi extends to Malindi, Takaungu and Mazeras. It has four major topographical features; the Foot Plateau, the Coastal Range and the Nyika
190 591.10
21 Kenya Railways Corporation KRC Mombasa Commuter Railways Feasibility Study KRC/PLM/40/2011 Final Report
Pöyry Switzerland Ltd.
Plateau. Kilifi, set midway between Mombasa and Malindi, is an ancient coastal Swahili town steeped in history and local African Culture. The county is famous for the ancient Mnarani ruins dating back to 14th century; its pris-tine white sandy beaches, the startlingly beautiful blue and emerald creek and a magnif-icent coral reef are key drivers of its tourism industry. Malindi with a population of ap-proximately 120,000 is the largest town in Kilifi County and a key tourist destination. There are also several industrial developments in Kilifi County as well as agricultural enterprises. Kilifi County is accessible by road network through the neighbouring counties from Kenya’s capital city, Nairobi. The Mombasa International Airport and the Malindi Air-port serve Kilifi County.
Kilifi County is also home to Pwani University. There are also several constituent col-leges of the various national universities.
2.4.4 Taita Taveta The Taita Taveta County with a population of 284,657 covers an extensive 17,084 km2. The county capital and largest town in Taita Taveta Wundanyi, has a population of ap-proximately 63,000; Voi, with a population of 19,865 is the second largest town in the county. Of particular interest to this study is Voi town that lies on the western edge of the Taru Desert; South and West of the Tsavo East National Park and North of Sagala Hills. This has been proposed as a terminal station for the Mombasa Commuter Rail Network. Voi is a busy transit town to Nairobi and a major commercial centre in Taita Taveta County. The Tsavo East and West have access gates from Voi. There are rare gemstones (Tan-zanites and Sapphires) mined in the county as well as Sisal processing factories. Agri-culture is of great importance to the county’s economy in general and Voi town in par-ticular. Taita Taveta County does not have a university; however, Taita Taveta University Col-lege (a constituent college of Jomo Kenyatta University of Agriculture and Technology) maintains a campus in Voi town.
2.5 Rationale for the Project Urbanisation in Kenya has been developing rapidly since independence. The population growth in urban centres has increased from 8 % in 1980s to over 34 % in 2003 and is projected to reach over 50% by 2020. The population of Mombasa and its environs has reached about 3.0 million. This development has not been met with commensurate growth in urban transport infrastructure and services. In major cities and urban areas, especially in Nairobi, Mombasa, Nakuru, Kisumu and Eldoret, urban transport is still characterized by inadequate supply of public transport (mostly buses and matatus), a large number of cars and Heavy Goods Vehicles (HGVs), heavy traffic congestion dur-ing peak hours, and stiff competition for limited road space among motorists, pedestri-ans and cyclists. Traffic congestion is further manifested in long queues of slow-moving vehicles and long waiting times, particularly in Nairobi and Mombasa. Poor physical

190 591.10
22 Kenya Railways Corporation KRC Mombasa Commuter Railways Feasibility Study KRC/PLM/40/2011 Final Report
Pöyry Switzerland Ltd.
planning has led to scarcity of parking space in the CBD in Mombasa. Because of the inefficiency of urban transport due to poor infrastructure, transport costs are high for both passengers and goods. The majority of low-income urban workers currently find public transport costly and financially inaccessible and hence meet most of their transport needs through walking and head loading. Some of them, however, risk their lives by utilizing non-motorized and intermediate means of transport (NMIMTs),especially bicycles, motorcycles and mikokoteni for which there is no ap-propriate infrastructure. Given that about 50 per cent of the country’s total GDP is gen-erated in the urban areas, the adverse consequences of the above scenario on worker’s efficiency and productivity, fuel consumption, education, health and the environment cannot be overemphasized.
Mombasa city is currently experiencing traffic congestion on all the major road arteries linking it to adjoining towns and counties. With the growing population and freight ton-nage handled at the port of Mombasa, both passenger and freight traffic is anticipated to rise leading to more traffic congestion pressure on the roads. In order to address this im-pending traffic snarl on the roads, there is need to develop a new safe and reliable transport mode, which will increase passenger transport capacity and at the same time facilitate intermodal interchange at important nodal points. The Kenya Vision 2030 gives the perspective for development of efficient mobility of people in the cities of Nairobi, Mombasa and Kisumu and their environs. The challenges of climate change call for sustainable transport solutions and the rail mode of transport is friendly to the environment, damaging less per person moved in comparison with other modes of transport.
In consideration of the above, KR which organization is charged with rail development as a Government Agent in the Vision 2030, has decided to facilitate stakeholders con-sultations. In addition, KR plans to undertake studies necessary for development of a modern metropolitan Commuter rail network within Mombasa city and with linkages with principal urban centres in the surrounding counties in the coast region.
2.6 Objectives of the Study The overall objective of the assignment is to advise on the type, nature, location and scope of an efficient, safe, cost effective and environmentally sustainable railway transport system that will meet the transport demand of Mombasa City and adjoining counties as envisaged under Vision 2030 and shall be expandable to meet needs up to a 50 year horizon. The expected results of the study are:
i. Market transport demand; ii. Identify possible metropolitan railway routes within Mombasa City/County and
those to connect neighbouring County headquarters and Lamu Port; iii. Examine technical, economic and financial feasibility
iv. Recommend suitable railway infrastructure options and operating equipment

190 591.10
23 Kenya Railways Corporation KRC Mombasa Commuter Railways Feasibility Study KRC/PLM/40/2011 Final Report
Pöyry Switzerland Ltd.
v. Propose possible development, financing and operational options.
2.7 Background Information about Kenya
2.7.1 Kenya’s Macro-Economic Setting Kenya’s economy recorded high growth rates of real Gross Domestic Product (GDP) averaging 6.6% per annum during the immediate post-independence years (1964-1973) and towards the end of that decade. Deceleration of this growth, which started in the late 1970s, continued until 2002 when the economy registered a record negative growth rate of 0.2%. During the years 1997-2002 economic growth declined steadily with GDP re-cording an average annual growth rate of only 0.9%, against a population growth rate of 2.9% per annum. The economy has been on a recovery path since 2003 when real GDP grew by only 0.5% to 6.1 % in 2007. However, due to post election violence in 2008, the economy grew by a mere 1.6% in 2008 and 2.6% in 2009. Growth in 2009 was mainly supported by resurgence in tourism, building and construction and transport and communication sectors. Key sectorial GDP contribution to the economy were agricul-ture and forestry 24.4%; wholesale and retail trade 10%; transport and communication 9.8% and manufacturing 9.5%. Among the key factors contributing to the economic decline were poor infrastructure, particularly bad roads, inadequate energy supply, inadequate water supply, weak institu-tional framework and poor performance of the major sectors of the economy namely: agricultural and manufacturing sectors, and poor macro-economic management.
2.7.2 Project History: Initial Concept Proposal KRC proposes the development of a commuter rail infrastructure that will meet the pro-jected transport demand and is in consonance with vision 2030 objectives. The proposed infrastructure planning, design and development should be geared to providing integrat-ed transport networks that have intermodal and interchange facilities at major transport nodal points. The selected route should traverse high population density conurbations, major tourist destinations, and all areas with a high potential for the generation passenger traffic. The feasibility study for new standard gauge commuter corridors should, where possible be integrated with the proposed standard gauge line from Mombasa City to Malaba, on the Kenya/Uganda border and Lamu to South Sudan.
The proposed lines shall address two principal areas and may be configured differently or be of different designs in order to meet the specific local needs and infrastructure constraints. The two areas are:
i. Rail transport within Mombasa City and immediate environs;
ii. Rail transport to link adjoining County headquarters or major economic centers and Lamu port.
In undertaking the assignment the Consultant shall examine amongst other routes and without limitation whatsoever the following routes:
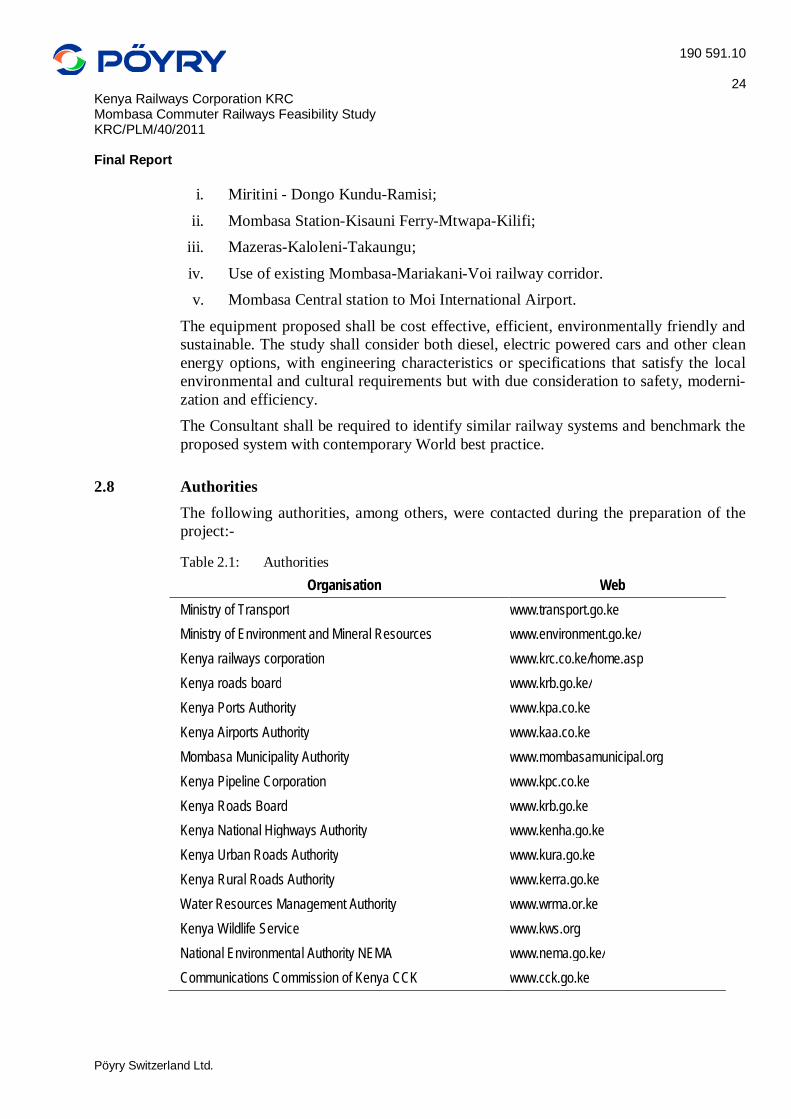
190 591.10
24 Kenya Railways Corporation KRC Mombasa Commuter Railways Feasibility Study KRC/PLM/40/2011 Final Report
Pöyry Switzerland Ltd.
i. Miritini - Dongo Kundu-Ramisi;
ii. Mombasa Station-Kisauni Ferry-Mtwapa-Kilifi; iii. Mazeras-Kaloleni-Takaungu;
iv. Use of existing Mombasa-Mariakani-Voi railway corridor. v. Mombasa Central station to Moi International Airport.
The equipment proposed shall be cost effective, efficient, environmentally friendly and sustainable. The study shall consider both diesel, electric powered cars and other clean energy options, with engineering characteristics or specifications that satisfy the local environmental and cultural requirements but with due consideration to safety, moderni-zation and efficiency. The Consultant shall be required to identify similar railway systems and benchmark the proposed system with contemporary World best practice.
2.8 Authorities The following authorities, among others, were contacted during the preparation of the project:-
Table 2.1: Authorities Organisation Web
Ministry of Transport www.transport.go.ke Ministry of Environment and Mineral Resources www.environment.go.ke/ Kenya railways corporation www.krc.co.ke/home.asp
Kenya roads board www.krb.go.ke/ Kenya Ports Authority www.kpa.co.ke
Kenya Airports Authority www.kaa.co.ke
Mombasa Municipality Authority www.mombasamunicipal.org
Kenya Pipeline Corporation www.kpc.co.ke
Kenya Roads Board www.krb.go.ke Kenya National Highways Authority www.kenha.go.ke
Kenya Urban Roads Authority www.kura.go.ke
Kenya Rural Roads Authority www.kerra.go.ke
Water Resources Management Authority www.wrma.or.ke
Kenya Wildlife Service www.kws.org
National Environmental Authority NEMA www.nema.go.ke/ Communications Commission of Kenya CCK www.cck.go.ke
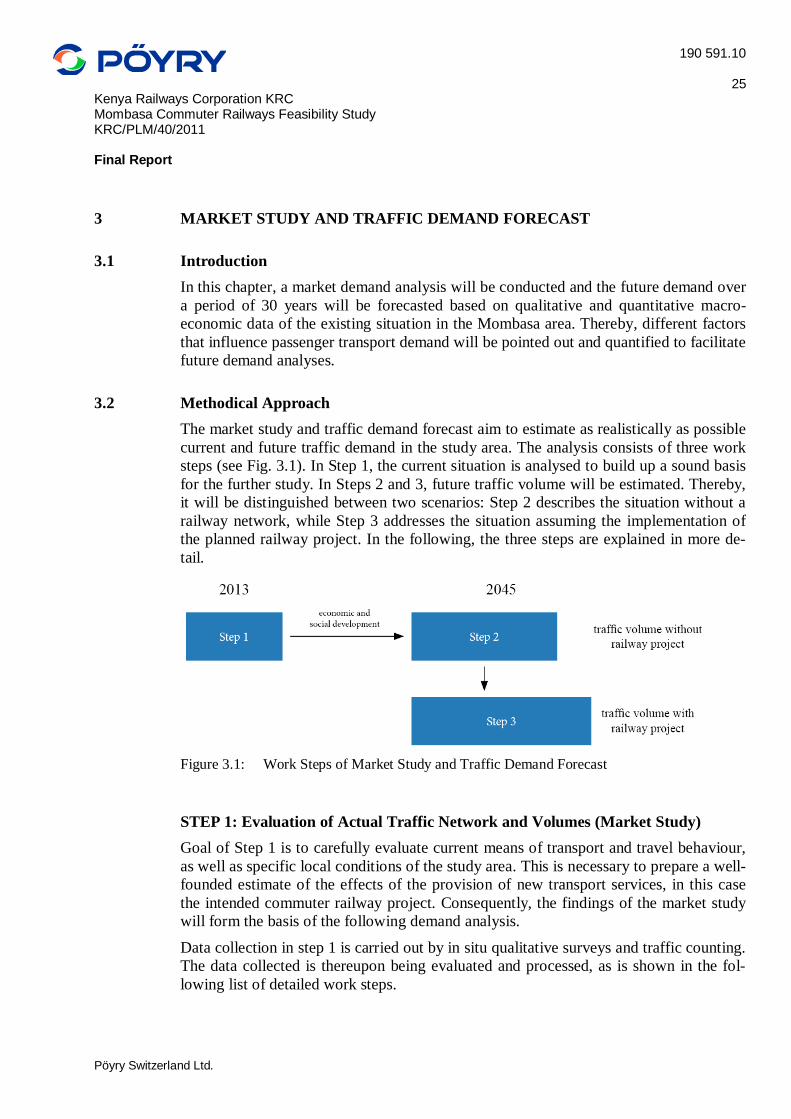
190 591.10
25 Kenya Railways Corporation KRC Mombasa Commuter Railways Feasibility Study KRC/PLM/40/2011 Final Report
Pöyry Switzerland Ltd.
3 MARKET STUDY AND TRAFFIC DEMAND FORECAST
3.1 Introduction In this chapter, a market demand analysis will be conducted and the future demand over a period of 30 years will be forecasted based on qualitative and quantitative macro-economic data of the existing situation in the Mombasa area. Thereby, different factors that influence passenger transport demand will be pointed out and quantified to facilitate future demand analyses.
3.2 Methodical Approach The market study and traffic demand forecast aim to estimate as realistically as possible current and future traffic demand in the study area. The analysis consists of three work steps (see Fig. 3.1). In Step 1, the current situation is analysed to build up a sound basis for the further study. In Steps 2 and 3, future traffic volume will be estimated. Thereby, it will be distinguished between two scenarios: Step 2 describes the situation without a railway network, while Step 3 addresses the situation assuming the implementation of the planned railway project. In the following, the three steps are explained in more de-tail.
Figure 3.1: Work Steps of Market Study and Traffic Demand Forecast
STEP 1: Evaluation of Actual Traffic Network and Volumes (Market Study) Goal of Step 1 is to carefully evaluate current means of transport and travel behaviour, as well as specific local conditions of the study area. This is necessary to prepare a well-founded estimate of the effects of the provision of new transport services, in this case the intended commuter railway project. Consequently, the findings of the market study will form the basis of the following demand analysis.
Data collection in step 1 is carried out by in situ qualitative surveys and traffic counting. The data collected is thereupon being evaluated and processed, as is shown in the fol-lowing list of detailed work steps.

190 591.10
26 Kenya Railways Corporation KRC Mombasa Commuter Railways Feasibility Study KRC/PLM/40/2011 Final Report
Pöyry Switzerland Ltd.
Detailed Tasks of Work Step 1:
a. Description of road and public transport network b. Estimation of the modal split (distinguishing between rural and urban areas)
c. Counting of traffic volumes at defined cross sections (including Matatu and bus traffic)
d. Evaluation of trip purposes, average duration, and cost e. Evaluation of passenger-km, which are currently travelled per day/year in the
catchment area of planned railway stations (Paxkm/year)
STEP 2: Evaluation of Forecasted Traffic Volume without Railway Project Due to macro-economic and social development, as well as public and individual devel-opment projects, trip numbers, distances and modes will change in the future. Step 2 aims to forecast these changes by evaluating economic and social factors. The detailed tasks are displayed in the following.
Detailed Tasks of Work Step 2: a. Calculation of population increase in the catchment area, based on UN figures of
population growth (distinguishing between rural and urban areas) b. Estimation of economy growth as a factor for future changes in travel behaviour
c. Evaluation of planned changes in infrastructure and land use, except from rail-way
d. Estimation of changes in modal split, average travel distance, and total number of trips in catchment area
e. Calculation of passenger-km (Paxkm/year)
STEP 3: Evaluation of Forecasted Traffic Volume with Railway Project The aim of Step 3 is to estimate future passenger demand of the projected commuter railway system over a period of 30 years. As tariff structure and operation schedule have not yet been decided, main focus will be laid on the demand side. However, this data will later support setting up an appropriate operating system and calculating the profitability of the project. To achieve a forecast as sound as possible, the findings of the market study (current means of transport and travel behaviour, as well as specific local conditions of the study area) form the basis of the calculation of future traffic demand. Connected with popula-tion figures and growth estimates, these data are extrapolated and provide information on future demand of the system.
The implementation of a commuter railway system will thereby increase traffic demand in two ways: On the one hand, trips will be shifted from other modes of transport, such as bus or Matatu. On the other hand, new trips will be generated as remote areas now enjoy better transport connections to/from the city centre, as well as within each other, which might lead people to commute and/or to change their place of residence (see Fig.

190 591.10
27 Kenya Railways Corporation KRC Mombasa Commuter Railways Feasibility Study KRC/PLM/40/2011 Final Report
Pöyry Switzerland Ltd.
3.2).Fig. 3.3 exemplarily compares the areas from which the city centre can be reached in less than 45 minutes with and without railway.
Figure 3.2: Increase of Traffic Demand in Chatchment Area (Demand Forecast)
Figure 3.3: Increased Area with Travel Time To Centre < 45 min. due to Railway
(exemplary)
The detailed tasks of Work Step 3 are displayed in the following. The results from the demand forecast will also be the basis for the economic analysis of the project as well as for the design of the future operating system.
Detailed Tasks of Work Step 3: a. Evaluation of trips to be shifted from existing modes to the railway system
b. Distribution of estimated total trips among the assessed lines and route sections c. Evaluation of the assessed lines/corridors regarding the passenger demand
d. Calculation of passenger-km (Paxkm/year)

190 591.10
28 Kenya Railways Corporation KRC Mombasa Commuter Railways Feasibility Study KRC/PLM/40/2011 Final Report
Pöyry Switzerland Ltd.
3.3 Description of the Existing Situation The current population, economy and traffic situation is the basis for a future passenger demand forecast of the project. In the following the actual status is described.
3.3.1 Geography The Mombasa region is characterized by the major city situated on the island with East Africa most important port and sub-centres situated along the north and south coast of Mombasa.
Figure 3.4: Map of Mombasa Island
Major industrial and logistical developments of Mombasa are situated at the north west-ern area of the island where also the connection to Nairobi is established.
The whole region is influenced by the bay situation and its limited possibilities connect-ing the districts and sub centres.

190 591.10
29 Kenya Railways Corporation KRC Mombasa Commuter Railways Feasibility Study KRC/PLM/40/2011 Final Report
Pöyry Switzerland Ltd.
Figure 3.5: Map of proposed lines in the Mombasa Region
3.3.2 Population and Economy With approx. 900,000 inhabitants, Mombasa is the second largest city in Kenya. The surrounding counties are only sparsely populated (see Figure 3.6).
Mombasa is a major trade centre and home to the largest seaport in East Africa, the Kilindini Harbour. The harbour plays a crucial role in the economy not only of Kenya, but also of other eastern African countries.

190 591.10
30 Kenya Railways Corporation KRC Mombasa Commuter Railways Feasibility Study KRC/PLM/40/2011 Final Report
Pöyry Switzerland Ltd.
Mombasa is an important centre of coastal tourism. Other economic activities in the province include trade and commerce, manufacturing, fishing, and agriculture. Momba-sa also counts with an oil refinery and a cement factory.
Despite this promising conditions, Mombasa’s economy could not make yet use out of its significant potential. Infrastructure is decaying and about one-third of the city’s pop-ulation lives below the poverty line. Most of the urban poor live in unplanned settle-ments spread across the city.
Figure 3.6: Population Distribution in and around Mombasa
3.3.3 Travel behaviour The travel behaviour of the population describes the average frequencies and distances as well as selected modes and reasons for the realized trips. Analysis of existing studies for the region showed that the travel behaviour in the catchment area is quite unclear due to missing studies or scientific investigations. For this reason assumption, adoptions of other regions have to be made and matched with observations which have been made during the field trip.
3.3.3.1 Travel frequencies In developed countries the average person generates about 3.5 trips per day. These in-clude trips for work, shopping, education and spare time.

190 591.10
31 Kenya Railways Corporation KRC Mombasa Commuter Railways Feasibility Study KRC/PLM/40/2011 Final Report
Pöyry Switzerland Ltd.
Due to a lower economic development and the structure of housing / working routes, and the limited number of trips for spare time and shopping, a slightly lower figure has been assumed for the catchment area of Mombasa; and a lesser value for the rural areas..
Urban areas: 3 trips per day Rural areas: 2 trips per day
3.3.3.2 Travel reasons The UITP Study “Report on statistical indicators of public transport performance in Af-rica” shows that travel reasons in Nairobi are mainly caused by trips to home and to work. It can be assumed that in Mombasa City this distribution is comparable but in the rural surroundings in the area the percentage of work and others will be less due to the agricultural characteristic of the region.
Source: UITP, “Report on statistical indicators of public transport performance in Africa”JICA Study 2006 Figure 3.7: Composition of travel mode for Nairobi
3.3.3.3 Travel modes Analysing the public transport market in the Mombasa region showed that most trips are done by private non-motorized modes (walking, bicycle) or by public transport. This is had been expected due to the low availability of private cars in Kenya (10.3 cars per 1.000 people) and the low average income of the population. The choice which mode will be taken for a trip depends mainly from the availability, the cost of transport and the required time for the trip. Studies in Nairobi showed that the preferred mode is walking followed by Matatu services and private cars.
This result reflects the urban structure of Nairobi and the relatively good developed Matatu system. For Mombasa this can be adopted only for the City region. The outskirts and even more in the rural regions walking and two wheeled modes have a much bigger percentage of the overall share when on the other hand private cars have a smaller share. This was also observed during the field trip of the consultant.

190 591.10
32 Kenya Railways Corporation KRC Mombasa Commuter Railways Feasibility Study KRC/PLM/40/2011 Final Report
Pöyry Switzerland Ltd.
Source: Githui John Ngatia,The Structure of Users’ Satisfaction on Urban Public Transport Service in Developing Country: the Case of Nairobi Figure 3.8: Travel modes in Nairobi
Adopting the above shown distribution of transport modes to the Mombasa Region a slightly different modal share has been assumed, and cross checked with observations of the consultant and selective surveys.
Figure 3.9: Modal Share Mombasa Region 2013
3.3.3.4 Travel distances The purpose and the used mode for a trip are in a close relationship with the average travel distances per trip. These figures are assumed and based on experience from other regions.
Modal share 2013
Walking49%
Matat u30%
School bus3%Bus
1%
Bicycle2%BodaBoda
2%
Motorbike1%
Pik iPiki2%
pr ivate car10%
Railway0%
Walking Bicycle BodaBoda Motorbike Pik iPik i private car Matatu Bus School bus Railway

190 591.10
33 Kenya Railways Corporation KRC Mombasa Commuter Railways Feasibility Study KRC/PLM/40/2011 Final Report
Pöyry Switzerland Ltd.
Figure 3.10: Average trip distance and travel speed per mode
3.3.4 Transport networks The city of Mombasa and the surrounding towns are served by road, air and water transport. The various transport networks and their characteristics are discussed below.
3.3.4.1 Road Network The coastal region is served with a fairly dense road network. The classified roads A109, A14 highways connect Mombasa to Nairobi and Tanzania, respectively, while the B8 northward road links Mombasa to Malindi and Lamu and extends towards the border with Somali. Several class C, D and E roads also link up several other urban cen-tres in the region (see Figure 3.11).
PikiPiki
School Bus
Private CarMotorbike
Matatu
Bus (LongDistance)
Bicycle
WalkingBodaBoda
Railway
0
10
20
30
40
50
60
70
0 10 20 30 40 50 60
average travel distance (km)
aver
age
trave
l spe
ed (k
m/h
)

190 591.10
34 Kenya Railways Corporation KRC Mombasa Commuter Railways Feasibility Study KRC/PLM/40/2011 Final Report
Pöyry Switzerland Ltd.
Source: Open Street Map 2013 Figure 3.11: Transportation Network around Mombasa and the Surrounding Towns
3.3.4.1.1 Lamu County: Lamu County has a low road network density, with the C112 road being the main road that is used to access Lamu town and the nearby centres. The road starts from the West with its intersection with B8 and ends at the shores of Indian Ocean in the East.
3.3.4.1.2 Kilifi County: The B8 road is the main trunk road connecting Mombasa to Kilifi and Malindi. Howev-er, unlike Lamu, Kilifi County has a fairly dense road network as there are several Class C and D roads traversing through the county and connecting Kilifi town to the surround-ing rural areas. The B8 road is programmed for rehabilitation from Malindi to Garissa and is expected to further improve connectivity of the region to North Eastern region.
3.3.4.1.3 Mombasa County: Mombasa County has a relatively high density road network, with the international A14 and B8 roads connecting it to the other Counties and towns. Several Class C and D roads connect the town to nearby urban centres and sub-urban areas, such as Mazeras and Mariakani. The Mombasa central area is served by several streets and lanes.
3.3.4.1.4 Kwale County: Road A14 traverses through Kwale County to the neighbouring Tanzania. The county has moderately dense road network that connects Kwale to the surrounding urban cen-tres, and beach hotels. The Kenya Rural Roads Authority is currently studying the fea-sibility of constructing a new beach road link from the Shelly Beach through the south coast to Diani, and further on to Chale Island.

190 591.10
35 Kenya Railways Corporation KRC Mombasa Commuter Railways Feasibility Study KRC/PLM/40/2011 Final Report
Pöyry Switzerland Ltd.
3.3.4.2 Pedestrian traffic Proper networks dedicated for pedestrians exist only in the city and town areas where sidewalks are installed. Usually pedestrians use the road shoulders or walk on unpaved paths by the road sides.
Figure 3.12: Typical pedestrian condition in rural area
3.3.4.3 Bicycle traffic Dedicated bicycle lane or networks do not exist in the catchment area. Cyclists use the road or the road edges and paths. Figure 3.13 shows a rural road with pedestrian and bi-cycle traffic on the side strip.
Figure 3.13: Rural road with pedestrian and bycicle traffic on side strip

190 591.10
36 Kenya Railways Corporation KRC Mombasa Commuter Railways Feasibility Study KRC/PLM/40/2011 Final Report
Pöyry Switzerland Ltd.
3.3.4.4 Public Transport Network The public transport network is road based, both in the urban and rural areas. The urban public transport services are provided by Matatus, taxis, and recently by three-wheelers (Tuk-Tuks), motor cycles and bicycle services. Urban services are deregulated and fully privatised. Large buses provide inter city services and normally operate on timetables.
The main mode of passenger transport is the Matatu (privately-owned mini/midi-bus) which is extremely abundant in Kenya and most of the local people in the region use them to move around the towns and their suburbs. Tuk-tuks and Boda-Bodas are also widely used to move around the town centre and the nearby residential areas.
Due to the unregulated structure of these systems there are no fixed stops or stations. For Matatus serving long distance connections bus stations exist in Mombasa and other towns. The various public transport modes are further discussed below with pictures showing the typical vehicles used.
3.3.4.4.1 Matatu Most used public transport mode with a capacity of 14 passengers per vehicle and vari-able timetables and price structures. They are generally used for short and long distance trips also for transport of small goods. Figure 3.14 is a picture the typical Matatu vehi-cle.
Figure 3.14: Matatu
3.3.4.4.2 Tuk-Tuk This is the public transport mode with a carrying capacity of 3 passengers. It serves as a taxi mainly within urban areas where there are paved roads. It is used for short inner

190 591.10
37 Kenya Railways Corporation KRC Mombasa Commuter Railways Feasibility Study KRC/PLM/40/2011 Final Report
Pöyry Switzerland Ltd.
city distance trips mostly in the Mombasa city. The figure below is a picture of a Tuk-Tuk.
Figure 3.15: Tuk_Tuk
3.3.4.4.3 Motorcycle Motorcycles are used either as private modes or as a public transport mode (motor-taxi). They are used for short and medium distance trips in the city and rural areas. The figure below is a picture of a typical motor cycle taxi, often known as Boda-Boda.
Figure 3.16: Motorcycle taxi
3.3.4.4.4 Bicycle taxi Bicycles are used either as personal travel vehicles or for public transport (Piki-Piki). Like the motorcycles, they are used for short distance trips in the city and the rural are-as. The figure shows a typical bicycle taxi.

190 591.10
38 Kenya Railways Corporation KRC Mombasa Commuter Railways Feasibility Study KRC/PLM/40/2011 Final Report
Pöyry Switzerland Ltd.
Figure 3.17: Bicycle Taxi
3.3.4.4.5 Railway Passenger railway has got a low share of the overall modal split of public transport in the Mombasa region.
Actually two overnight passenger trains from Nairobi via Voi are running every week. This service covers more or less the tourism and long distance market for passenger transport. Limited influence in the commuter market can be expected by serving the Mazeras station.
Ticket prices are higher than parallel running bus services which also reduces the actual demand on this line.
3.3.4.4.6 Air traffic The Kenyan coastal region is served by two major airports. The Moi International Air-port in Mombasa and Malindi Airport in Malindi, which is a medium sized airport. Ad-ditionally Lamu has an airport with a high percentage of touristic services.
Moi international airport is located in Port Reitz area, also known locally as Chaani ar-ea, on the mainland metropolitan area. Flights to Nairobi and other Kenyan, European and Middle Eastern destinations depart from the airport. Besides, Mombasa and other coastal towns, and Nairobi are well-connected by char-tered flights operated via Wilson airport in Nairobi. Further airstrips are located in Ukunda with mostly touristic flights, Bamburi which has no scheduled airline services at the moment Mackinnon Road Airport which also has no scheduled airline services at the moment
and Voi Airport close to the Tsavo National Park without scheduled airline services.

190 591.10
39 Kenya Railways Corporation KRC Mombasa Commuter Railways Feasibility Study KRC/PLM/40/2011 Final Report
Pöyry Switzerland Ltd.
Summarizing it can be said that air traffic has got a low influence in the public transport within the Mombasa region but the airports serve as origins/destinations for passengers due to touristic trip reasons.
3.3.4.4.7 Other modes Besides the above described modes the ferry services from Mombasa Island to Likoni south of the Mombasa bay have a big importance for passenger transport. Missing road connections from the southern coast to Mombasa city cause this bottleneck.
The ferry services are operated by the Kenya Ferry Services (KFS) at Kilindini and Mtongwe to link the Mombasa Island and south coast. The ferry service is free for pe-destrians and cyclist, but a graduated charge is payable for motor vehicles. Services are regularly about every 20 min in peak time. Due to the limited capacity and the high demand of passengers and goods on this line heavy congestion and waiting times up to three hours were observed.
Figure 3.18: Likoni Ferry
3.3.5 Traffic Data Collection Traffic volume counts for 12-hours and 24-hours were conducted from 19th - 22nd March 2013 along some main road transport links
3.3.5.1 Current Traffic Volumes and Passenger Modal Split Table 3.1 summarises the average daily traffic along the road links, while Table 3.2 be-low shows the current modal split, by traffic volumes along the main road transport cor-ridors.

190 591.10
40 Kenya Railways Corporation KRC Mombasa Commuter Railways Feasibility Study KRC/PLM/40/2011 Final Report
Pöyry Switzerland Ltd.
Table 3.1: Current average daily traffic (ADT) Pro-
posed Line
Station and Road code
Direction Motor-cycles
Pas-senger
cars
Large pas-
senger car and
4WDs
Bus Pick- up/Van/LGV Mini-
bus/ Matatu
Small bus
Large bus
1 Bamburi (B8)
Mombasa - Nyali 365 109 44 37 5 6 17 Nyali - Mombasa 468 123 49 45 3 0 23
Kisauni Junction (B8)
Mombasa - Mtwapa 1,746 3,604 691 6,079 122 77 1,338 Mtwapa - Mombasa 1,894 3017 1,119 4,971 407 145 1,012
Mtwapa(B8)
Mombasa - Kilifi 1,736 1,894 1,062 2,070 54 54 557 Kilifi - Mombasa 1,721 1,986 842 2,072 41 65 497
MtoPanga (B8)
Panga - Malindi 1,148 224 182 217 112 47 201 Malindi - Panga 1,140 203 195 201 104 37 187
2 Likoni (A14)
Mombasa - Likoni 1,898 539 503 303 72 2 297 Likoni - Mombasa 1,660 497 525 266 78 0 278
3 Lamu (B8)
Malindi - Lamu 1,898 539 503 303 72 2 297 Lamu - Malindi 1,660 497 525 266 78 0 278
4 Kwahola (C110)
Mombasa - Chang-amwe 1,428 1,740 276 997 175 53 482
Changamwe - Mom-basa 1,683 2,255 307 1,506 150 42 561
Kombani (C106)
Mombasa - Kwale 403 154 75 149 35 13 80 Kwale - Mombasa 409 194 74 149 31 9 83
Mrima (A14)
Ramisi - Likoni 159 61 42 118 12 22 30 Likoni - Ramisi 166 53 30 107 9 19 27
Kwahola (C110)
Airport - Changamwe 2,016 1,340 201 1,772 99 114 274 Changamwe - Airport 1,838 947 164 1,431 85 41 187
5 Mazeras (C111)
Kaloleni - Mazeras 973 146 40 327 34 13 79 Mazeras - Kaloleni 958 143 35 341 48 4 81
Source: GA-Consultant, 2013
Table 3.2: Modal Split (%) Road section Motorcy-
cles Passenger
car Large
passenger car, 4WD
Matatu/ Minibus
Small bus Large bus Pick-up/Van/L.
G.V Mombasa -Nyali 65 18 7 6 1 0 3 Mombasa - 14 25 7 42 2 1 9

190 591.10
41 Kenya Railways Corporation KRC Mombasa Commuter Railways Feasibility Study KRC/PLM/40/2011 Final Report
Pöyry Switzerland Ltd.
Road section Motorcy-cles
Passenger car
Large passenger car, 4WD
Matatu/ Minibus
Small bus Large bus Pick-up/Van/L.
G.V Mtwapa Mombasa - Kilifi 24 26 13 28 1 1 7 Panga - Malindi 55 10 9 10 5 2 9 Mombasa - Likoni 21 21 14 27 1 1 15 Mombasa - Lamu 51 15 15 8 2 0 8 Mombasa - Changamwe 27 34 5 21 3 1 9 Mombasa - Kwale 44 19 8 16 4 1 9 Ramisi - Likoni 38 13 8 26 2 5 7 Airport - Chang-amwe 37 22 3 30 2 1 4 Kaloleni - Mazeras 60 9 2 21 3 1 5
Source: GA-Consultant, March 2013 Field Work
From Table 3.2, the motorcycles are the majority along the roads, followed by passen-ger cars and matatus. This modal split points to general congestion on the roads as vehi-cle occupancies for these three traffic categories are lower compared to the large buses, or the proposed commuter rail.
3.3.5.2 Average travel time and cost of passenger trips to main centres The current average travel time and cost from Mombasa to surrounding areas is given in Table 3.3 below.
Table 3.3: The average travel time & cost from Mombasa to the surrounding sub centres Origin place
Destination place
Estimated trip distance
(km)
Estimated travel time
(min)
Estimated trip cost (KES)
Mombasa Town Tudor 4 10 30 Mombasa Town Mishomoroni 6 15 60 Mombasa Town Kisauni 6 12 60 Mombasa Town Changamwe 7 20 60 Mombasa Town Mtwapa 15 30 100 Mombasa Town Kilifi 56 50 400 Mombasa Town Nyali 5 14 50 Mombasa Town Likoni 8 30 20 Mombasa Town Mtongwe 14 35 80 Mombasa Town Kwale 60 80 600 Mombasa Town Malindi 116 120 500 Mombasa Town Voi 180 150 400
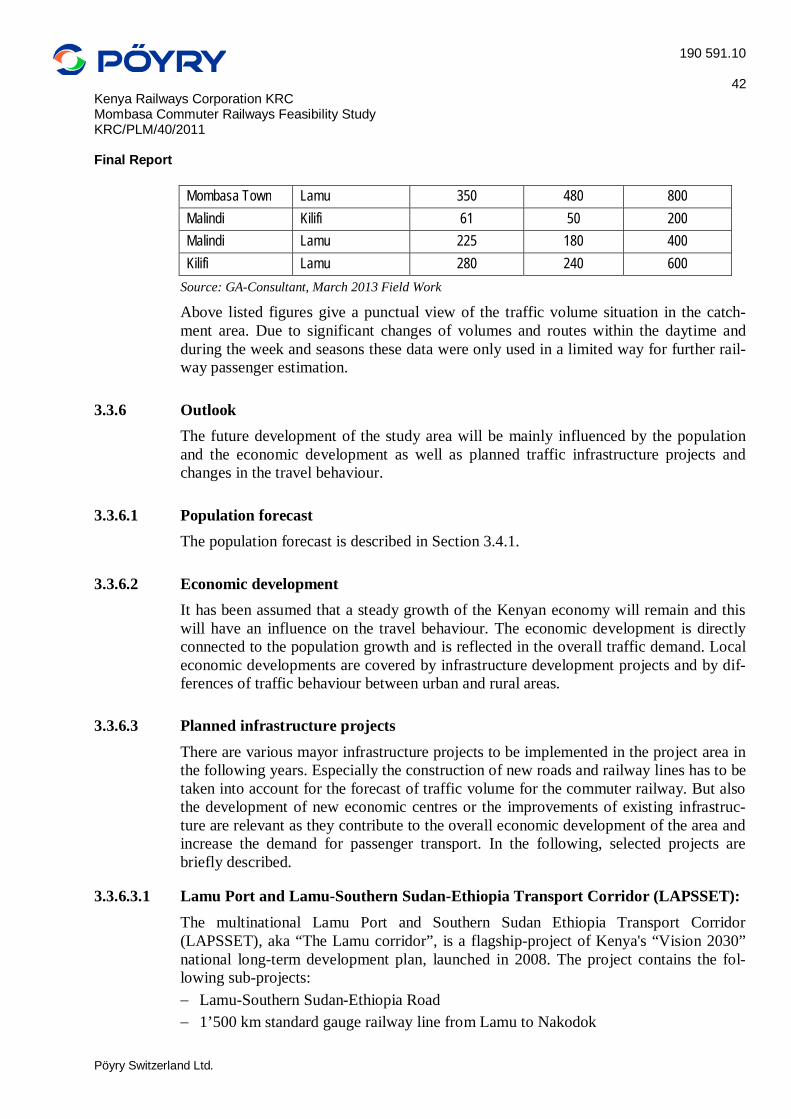
190 591.10
42 Kenya Railways Corporation KRC Mombasa Commuter Railways Feasibility Study KRC/PLM/40/2011 Final Report
Pöyry Switzerland Ltd.
Mombasa Town Lamu 350 480 800 Malindi Kilifi 61 50 200 Malindi Lamu 225 180 400 Kilifi Lamu 280 240 600
Source: GA-Consultant, March 2013 Field Work
Above listed figures give a punctual view of the traffic volume situation in the catch-ment area. Due to significant changes of volumes and routes within the daytime and during the week and seasons these data were only used in a limited way for further rail-way passenger estimation.
3.3.6 Outlook The future development of the study area will be mainly influenced by the population and the economic development as well as planned traffic infrastructure projects and changes in the travel behaviour.
3.3.6.1 Population forecast The population forecast is described in Section 3.4.1.
3.3.6.2 Economic development It has been assumed that a steady growth of the Kenyan economy will remain and this will have an influence on the travel behaviour. The economic development is directly connected to the population growth and is reflected in the overall traffic demand. Local economic developments are covered by infrastructure development projects and by dif-ferences of traffic behaviour between urban and rural areas.
3.3.6.3 Planned infrastructure projects There are various mayor infrastructure projects to be implemented in the project area in the following years. Especially the construction of new roads and railway lines has to be taken into account for the forecast of traffic volume for the commuter railway. But also the development of new economic centres or the improvements of existing infrastruc-ture are relevant as they contribute to the overall economic development of the area and increase the demand for passenger transport. In the following, selected projects are briefly described.
3.3.6.3.1 Lamu Port and Lamu-Southern Sudan-Ethiopia Transport Corridor (LAPSSET): The multinational Lamu Port and Southern Sudan Ethiopia Transport Corridor (LAPSSET), aka “The Lamu corridor”, is a flagship-project of Kenya's “Vision 2030” national long-term development plan, launched in 2008. The project contains the fol-lowing sub-projects: Lamu-Southern Sudan-Ethiopia Road 1’500 km standard gauge railway line from Lamu to Nakodok

190 591.10
43 Kenya Railways Corporation KRC Mombasa Commuter Railways Feasibility Study KRC/PLM/40/2011 Final Report
Pöyry Switzerland Ltd.
Oil refinery at Bargoni Oil pipelines (Southern Sudan and Ethiopia) Airports Lamu Port Resort Cities in Lamu, Isiolo and Lake Turkana.
The project has been launched in 2012. However, a detailed timeline of the project has not been defined yet. Feasibility studies expect the project to cause an additional 2-3% increase in Kenya's GDP by 2020.6
Figure 3.19: LAPSSET Transport Corridor Development Plan
3.3.6.3.2 Mombasa Port Development Project: The Mombasa Port Development Project is a Japanese ODA project agreed in 2007 to construct a new container terminal and provide new handling facilities at the Port of Mombasa. Thereby, the container volume of the port of Mombasa of 480,000 TEU (2006) is expected to be increased to 990,000 TEU in 2017. The larger goal of the pro-
6 Source: http://www.cbcglobal.org/images/uploads/library/KIS2012_LAPSSET_Corridor_Silvester_Kasuku.pdf

190 591.10
44 Kenya Railways Corporation KRC Mombasa Commuter Railways Feasibility Study KRC/PLM/40/2011 Final Report
Pöyry Switzerland Ltd.
ject is to facilitate trade and economic development in Kenya and neighbouring coun-tries in East Africa. The project is scheduled to end in 2015.
3.3.6.3.3 Mombasa Port Area Road Development Project: Next to the aforementioned development of a new container terminal for the port of Mombasa, the construction of two new roads is planned to alleviate congestion and fa-cilitate the logistics from the new terminal. The first road, the Kipevu Link Road, will connect the new terminal with the Northern Corridor (Mombasa-Nairobi road). The second one, Mombasa Southern Bypass (Dongo Kundu Bypass), will connect Mombasa-Nairobi road with Mombasa-Tanzania road, allowing to go from west to south without entering Mombasa Island. The Southern Bypass will also pass the Dongo Kundu Port area, where the development of a new Free Trade Zone is planned for 2010 to 2015.
The project, also financed by Japan, is expected to offload some traffic from the Likoni Ferry crossing, especially vehicles ferrying tourists from South Coast to the Moi Inter-national Airport and those evacuating cargo from the Mombasa port.7 The project has been launched in 2012 and is scheduled to end in August 2018.
Figure 3.20: Mombasa Southern Bypass and Kipevu Link Road Development Plan
7 Source: http://www.jica.go.jp/kenya/english/office/topics/topics130320_06.html

190 591.10
45 Kenya Railways Corporation KRC Mombasa Commuter Railways Feasibility Study KRC/PLM/40/2011 Final Report
Pöyry Switzerland Ltd.
3.4 Traffic Demand Forecast
3.4.1 Passenger Demand Potential First step to determine the passenger demand potential per line has been to identify the number of people living in the 3km-catchment areas of the planned stations. Therefore, a forecast of the number of inhabitants residing in the catchment areas of the projected commuter railway has been carried out on basis of population growth rate estimates for Kenya by the United Nations Population Division (World Urbanization Prospects: The 2011 Revision, October 2012).
Figure 3.21: Kenya Population Projection
The growth rates estimated by the UN have been applied to the number of inhabitants living within the catchment areas of the projected station locations (radius 3km). To achieve an estimate as realistic as possible, urban and rural growth rates have been con-sidered separately. Thereby, urban growth rates have been applied to catchment areas with a density of more than 20’000 inhabitants per 3km radius, whereas areas with a lower density have been considered rural.
The results of the calculation show that the number of inhabitants within the catchment areas of the projected stations is going to increase significantly and could almost triple within the next 40 years (see figure below). As population growth rates for urban areas are higher than for rural areas, the passenger potential of lines passing mainly trough urbanised areas (i.e. Likoni Ferry - Panga Line) is expected to increase significantly faster than for lines in rural environments (i.e. Mazeras - Kaloleni - Takaunga Line).
Kenya Population ProjectionUnited Nations, Department of Economic and Social Affairs, Population Division
World Urbanization Prospects: The 2011 Revision, October 2012
Rural Population
Urban Population
—
20
40
60
80
100
120
2010 2015 2020 2025 2030 2035 2040 2045 2050
Popu
latio
n (m
illion
)

190 591.10
46 Kenya Railways Corporation KRC Mombasa Commuter Railways Feasibility Study KRC/PLM/40/2011 Final Report
Pöyry Switzerland Ltd.
Figure 3.22: Population Forecast: Population within 3km areas around stations
3.4.2 Traffic Volume without Railway For estimation of future traffic volumes for the year 2045 (30 years from starting the project) the total trip number for each transport mode has been multiplied with the as-sumed average trip distance per mode.
Adopting the expected population development the basis for the traffic volumes has been built up with the following input:
Population growth related to base year 1999: Urban areas 55% (2013) – 500% (2050) and Rural Areas 23% – 104%
It can be expected that the modal split will be different from today due to economic de-velopment. The following changes from 2013 till 2045 have been assumed. In Figure 3.23 the total distribution of trips per mode can be seen from 2013 till 2045.
Population within rad. 3km around stations (accumulated)Growth estimate based on United Nations Populations Division, World Urbanization Prospects, 2012
0
500
1.000
1.500
2.000
2.500
3.000
2020 2030 2040 2050Tota
l pop
ulat
ion
with
in ra
d. 3
km a
roun
d st
atio
ns (t
hous
and)
Corridor 1: Mombasa - Mtwapa - Kilifi - Malindi
Corridor 2: Malindi - Lamu
Corridor 3: Mombasa - Ramisi
Corridor 4: Mazeras - Kaloleni - Takaunga
Corrdior 5: Likoni Ferry - Panga
Corridor 6: Mombasa - Mazeras - Voi

190 591.10
47 Kenya Railways Corporation KRC Mombasa Commuter Railways Feasibility Study KRC/PLM/40/2011 Final Report
Pöyry Switzerland Ltd.
Figure 3.23: Modal split changes 2009 - 2045
Figure 3.24: Daily trips per transport mode 2020 – 2050
0
2'000'000
4'000'000
6'000'000
8'000'000
10'000'000
12'000'000
14'000'000
16'000'000
18'000'000
Total Trips per Day per Mode of Transport (Without Railway Project)
Walking Bicycle BodaBodaMotorbike PikiPiki private carMatatu Bus School bus
Changes in modal split 2009 - 2045
-3,00%
2,00%
-0,50%
1,00%
-0,50%
5,00%
-4,00%
0,00% 0,00% 0,00%
-5,00% -4,00% -3,00% -2,00% -1,00% 0,00% 1,00% 2,00% 3,00% 4,00% 5,00% 6,00%
Walking Bicycle BodaBoda Motorbike PikiPiki private car Matatu Bus School bus Railway
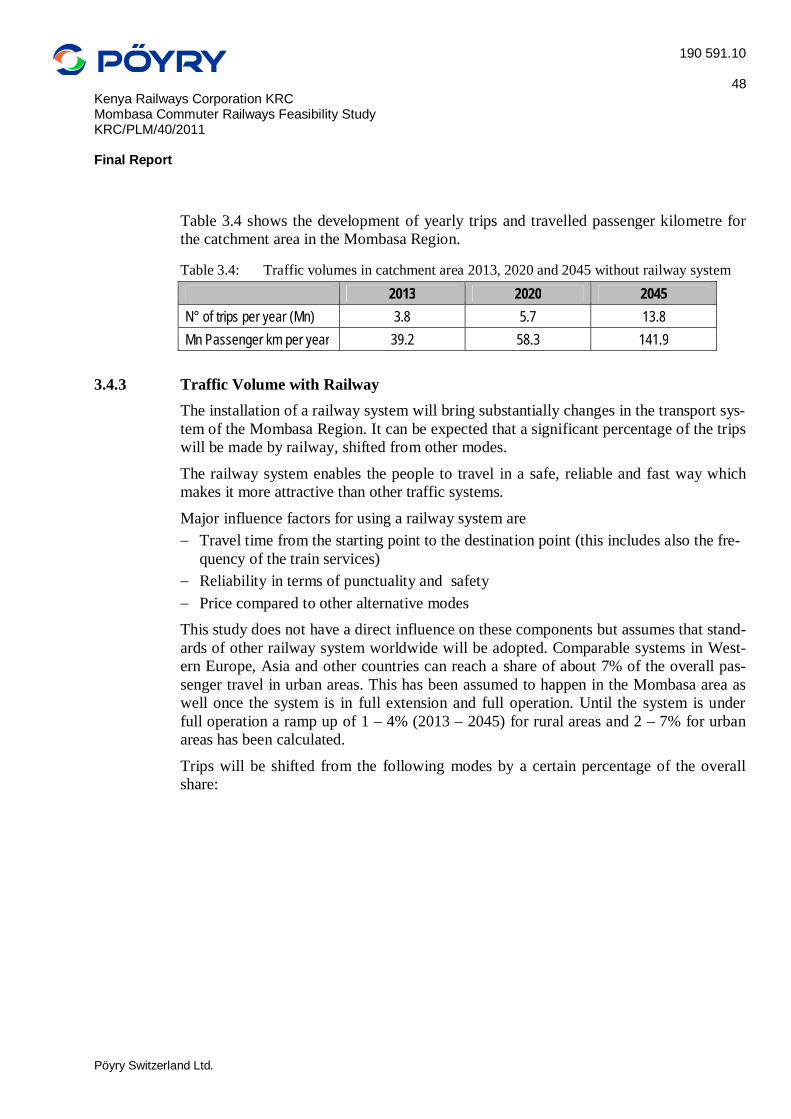
190 591.10
48 Kenya Railways Corporation KRC Mombasa Commuter Railways Feasibility Study KRC/PLM/40/2011 Final Report
Pöyry Switzerland Ltd.
Table 3.4 shows the development of yearly trips and travelled passenger kilometre for the catchment area in the Mombasa Region.
Table 3.4: Traffic volumes in catchment area 2013, 2020 and 2045 without railway system 2013 2020 2045
N° of trips per year (Mn) 3.8 5.7 13.8 Mn Passenger km per year 39.2 58.3 141.9
3.4.3 Traffic Volume with Railway The installation of a railway system will bring substantially changes in the transport sys-tem of the Mombasa Region. It can be expected that a significant percentage of the trips will be made by railway, shifted from other modes.
The railway system enables the people to travel in a safe, reliable and fast way which makes it more attractive than other traffic systems.
Major influence factors for using a railway system are Travel time from the starting point to the destination point (this includes also the fre-
quency of the train services) Reliability in terms of punctuality and safety Price compared to other alternative modes
This study does not have a direct influence on these components but assumes that stand-ards of other railway system worldwide will be adopted. Comparable systems in West-ern Europe, Asia and other countries can reach a share of about 7% of the overall pas-senger travel in urban areas. This has been assumed to happen in the Mombasa area as well once the system is in full extension and full operation. Until the system is under full operation a ramp up of 1 – 4% (2013 – 2045) for rural areas and 2 – 7% for urban areas has been calculated.
Trips will be shifted from the following modes by a certain percentage of the overall share:
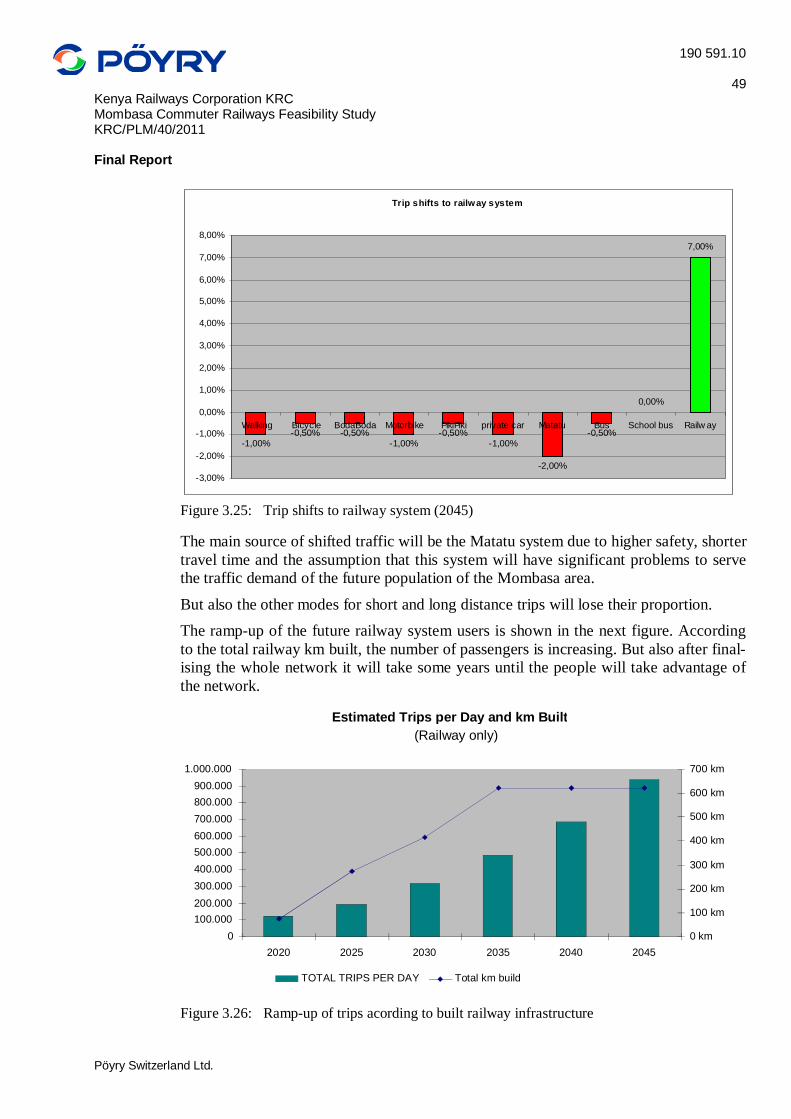
190 591.10
49 Kenya Railways Corporation KRC Mombasa Commuter Railways Feasibility Study KRC/PLM/40/2011 Final Report
Pöyry Switzerland Ltd.
Figure 3.25: Trip shifts to railway system (2045)
The main source of shifted traffic will be the Matatu system due to higher safety, shorter travel time and the assumption that this system will have significant problems to serve the traffic demand of the future population of the Mombasa area.
But also the other modes for short and long distance trips will lose their proportion. The ramp-up of the future railway system users is shown in the next figure. According to the total railway km built, the number of passengers is increasing. But also after final-ising the whole network it will take some years until the people will take advantage of the network.
Figure 3.26: Ramp-up of trips acording to built railway infrastructure
Trip shifts to railway system
-1,00%-0,50% -0,50%
-1,00%-0,50%
-1,00%
-2,00%
-0,50%
0,00%
7,00%
-3,00%
-2,00%
-1,00%
0,00%
1,00%
2,00%
3,00%
4,00%
5,00%
6,00%
7,00%
8,00%
Walking Bicycle BodaBoda Motorbike PikiPiki private car Matatu Bus School bus Railw ay
Estimated Trips per Day and km Built (Railway only)
0100.000 200.000 300.000 400.000 500.000 600.000 700.000 800.000 900.000
1.000.000
2020 2025 2030 2035 2040 20450 km
100 km
200 km
300 km
400 km
500 km
600 km
700 km
TOTAL TRIPS PER DAY Total km build

190 591.10
50 Kenya Railways Corporation KRC Mombasa Commuter Railways Feasibility Study KRC/PLM/40/2011 Final Report
Pöyry Switzerland Ltd.
The calculated future passenger numbers for the railway system reflect those people starting their trip at a certain station and return on the same day to that station. Destina-tions are not known in detail at this stage of the project and it was assumed that 90% of all trips will be made to the city centre area and 10% within a radius of 2 stations to the origin station. The average trip distance with the railway system was assumed by 20 km once the system is fully in operation.
Figure 3.27: Total passengers per year and line. Traffic volumes in catchment area of the
railway system in 2013, 2020 and 2045
0
50
100
150
200
250
300
350
2017
2019
2021
2023
2025
2027
2029
2031
2033
2035
2037
2039
2041
2043
2045
2047
2049
Mill
ions
Total Passenger Trips per Year per Line
Malindi - Lamu Line
Mazeras - Kaloleni - TakaungaLine
Likoni Ferry - Panga Line
Mombasa - Mazeras - Voi Line
Mombasa -Mtwapa - Kilifi -Malindi Line
Mombasa - Ramisi Line

190 591.10
51 Kenya Railways Corporation KRC Mombasa Commuter Railways Feasibility Study KRC/PLM/40/2011 Final Report
Pöyry Switzerland Ltd.
Figure 3.28: Passengers per day and route section in 2045
Status as of June 2013. Later chang-es to the number, location, or name of stations are pos-sible. Though, they are not expected have significant impact on the de-mand potential de-termined.
Mombasa -Mtwapa - Kilifi - Malindi Corridor
Mombasa - Mazeras - Voi Corridor
Likoni Ferry - Panga Corridor
Mazeras - Kaloleni - Takaunga Corridor
Mombasa - Ramisi Corridor
Malindi - Lamu Corridor

190 591.10
52 Kenya Railways Corporation KRC Mombasa Commuter Railways Feasibility Study KRC/PLM/40/2011 Final Report
Pöyry Switzerland Ltd.
The following table displays the load per route section in daily passengers at cross sec-tion between the stations for different years. (numbers at stations represent the number of cross section between stations). D indicate stations that serve two lines.
Table 3.5: Passengers per day, detailed route section in 2020/30/45
2020 2030 2045
Corridors Stations Passengers per day at cross sections 1 Mombasa - Ramisi Corridor
Mombasa Mainstation 15'883 80'911 237'019
D Makupa 8'508 43'339 126'957 Chaani 6'410 32'654 95'657 MOI International Airport 5'306 27'032 79'186 Tsunza 27'204 79'691 Dongo Kundu 26'665 78'113 Likoni 8'661 25'372 Magaoni 8'191 23'995 Waa 7'639 22'376 Tiwi 7'338 21'497 Ukunda 843 2'469 Mwabungu 717 2'099 Gazi 455 1'332
Msambweni 102 298
Ramisi
2 Mombasa -Mtwapa - Kilifi – Malindi Corridor
Mombasa Main station 10'894 55'496 162'569
Kisauni 6'530 33'263 97'440 D Bamburi 5'614 28'600 83'781 Utange 4'214 21'466 62'883 Mtwape 2'993 15'248 44'669 Mwamba 14'673 42'983 Kibaoni 14'448 42'324 D Takaungo 14'217 41'648 Kilifi 9'475 27'755
Mtondia 9'159 26'830
Watamu 8'931 26'163
Gede 8'695 25'472
Malindi
3 Mombasa - Mazeras – Voi Corridor D Makupa 5'149 26'231 76'842 Changamwe 3'816 19'439 56'945

190 591.10
53 Kenya Railways Corporation KRC Mombasa Commuter Railways Feasibility Study KRC/PLM/40/2011 Final Report
Pöyry Switzerland Ltd.
2020 2030 2045
Corridors Stations Passengers per day at cross sections Mikindani 1'807 9'204 26'963 Miritini 715 3'642 10'670 Mazeras 134 681 1'994 Mariakani 425 1'246 Maji Ya Chumvi 376 1'100 Samburu 317 928
Taru 299 875
Mackinnon Road 279 816
Bachuma 274 802
Maungu 250 734
Voi
4 Likoni Ferry - Junda – Bamburi Corridor Likoni Ferry 27'670 81'055 D Makupa 25'856 75'742 Junda 14'008 41'036 D Bamburi 5 Mazeras - Kaloleni – Takaunga Corridor D Mazeras
2'226 6'521
Mkapuni 1'809 5'298 Kambe 1'425 4'175 Kaloleni 994 2'910 Kidutani 648 1'898
D Takaungu
6 Malindi - Lamu Corridor Malindi
439 1'287
Gongoni 280 819 Garsen 85 248 Witu 47 137 Mkunumbu 32 94 Hindi
3.5 Appraisal of the Operating System Knowing the number of people using the railway system enables to estimate the re-quired train operation services.
For the maximum required number of train vehicles the time period with the highest passenger demand was analysed. This is usually the morning peak when most of the passengers want to travel to the city centre for work or for education and business rea-

190 591.10
54 Kenya Railways Corporation KRC Mombasa Commuter Railways Feasibility Study KRC/PLM/40/2011 Final Report
Pöyry Switzerland Ltd.
sons like market visits. A 10% proportion of the daily ridership is a common number in other regions and goes conform with the traffic counting which were made in the Mom-basa region.
Maximum passenger numbers were found in the Mombasa – Mtwapa – Kilifi - Malindi Corridor cross section with about 8 thousand passengers travelling in one hour towards the city centre. Assuming a train configuration can cover 1.000 passengers, 7 services (every 8.5 minutes) per peak hour are required to cover the demand. This is the maxi-mum passenger demand for the year 2045 with the above described input data.
Table 3.6: Estimation of required train services
Corridor Population 2045 Daily Railway
Trips 2045 max. Cross
Section
10% Peak Hour to Centre
required services per hour
Mombasa - Ramisi Line 1’969’024 113’243 5’662 6 Mombasa -Mtwapa - Kilifi - Malin-di Line 2’249’812 145’018 7’250 7
Mombasa - Mazeras - Voi Line 913’693 68’500 3’425 3 Likoni Ferry - Panga Line 1’120’588 72’291 3’614 4 Mazeras - Kaloleni - Takaunga Line 141’444 5’792 289 1
Malindi - Lamu Line 214’327 1’143 57 1 Total 6’608’889 405’989 20’299 23
Due to different demand levels on the corridors it has to be observed very detailed at which cross section a decrease of the passenger demand is given to plan an optimal train operation concept with short running trains or overlapping lines makes sense. Detailed descriptions of the passenger demand for each corridor are given in Figure 3.28. To calibrate those figures it is highly recommended to build up in further planning phases a proper traffic model which includes the detailed destination specification of the passengers which can be made by passenger interviews. In the model on hand the desti-nations are determined by using the above described method that 90% are travelling to the city centre area and 10% within an area of 2 stations from the origin station.

190 591.10
55 Kenya Railways Corporation KRC Mombasa Commuter Railways Feasibility Study KRC/PLM/40/2011 Final Report
Pöyry Switzerland Ltd.
4 ROUTE LOCATION AND ALIGNMENT
4.1 Introduction This chapter proposes alignment standards for the commuter railway system, considers interdependencies to other projects in development and defines the corridors of the study.
The initially identified corridors listed in Section 1.4 have now been adjusted to reflect the findings of the field trip and the advancement of the study, resulting in the following lines:- Corridor 1: Mombasa – Airport – Likoni - Ramisi Corridor Corridor 2: Mombasa – Mtwapa – Kilifi – Malindi Corridor Corridor 3: Mombasa – Mazeras – Voi Corridor Corridor 4: Likoni Ferry – Bamburi Corridor (Mombasa Ring Corridor) Corridor 5: Mazeras – Kaloleni – Takaungu Corridor Corridor 6: Malindi – Lamu Corridor
4.2 Alignment Standards There are no alignment standards defined in the ToR. Alignment standards have a high impact on the request of earthworks and civil buildings in hilly and mountainous re-gions and therewith a high impact on the estimated costs. We propose to use for the study the following alignment standards for the commuter railway system:-
Table 4.1: Alignment Standards Element Plain region Hilly region Mountainous region
Design speed 120 km/h 100 km/h 80 km/h Minimum hor. radius 650 m 450 m 300 m Maximum slope 10 ‰ 20 ‰ 25 ‰ Min. vertical radius 5’800 m 4’000 m 2’600 m
In plain regions the design speed can also be increased to allow fast train operations where applicable. The alignment standards will be discussed and agreed during the workshop in the inception phase.
4.3 Other projects in connection with the railway study In the Mombasa region a number of development projects have to be considered in its interdependencies with the new railway network.

190 591.10
56 Kenya Railways Corporation KRC Mombasa Commuter Railways Feasibility Study KRC/PLM/40/2011 Final Report
Pöyry Switzerland Ltd.
4.3.1 New Standard Gauge Railway Mombasa – Nairobi The proposed Mombasa-Nairobi Standard Gauge Railway Project is the most important railway channel in Kenya, which links the coastal city of Mombasa and the capital city of Nairobi. The railway starts from the city of Mombasa, which is the largest port in East Africa, and ends in Nairobi, the political, economic and cultural centre in Kenya and a key traffic hub in East Africa. The proposed railway line passes through eight (8) Counties: Mombasa, Kilifi, Kwale, Taita-Taveta, Makueni, Kajiado, Machakos and Nairobi. It has a total length of 485.303km consisting of 33 yards/terminals. The study years of the project include the short-term in 2023 and the long-term in 2028.
The provided alignment of this project covers the proposed main line of Mombasa-Nairobi Standard Gauge Railway from the Mombasa Changamwe marshaling station to the Nairobi Embakasi marshaling station. The new Standard Gauge Railway Mombasa – Nairoby is base of the proposed Momba-sa – Mazeras – Voi Commuter Railway Corridor.
4.3.2 Mombasa port development projects There are some projects running to develop capacity of Mombasa Harbour around the Port Reitz. There are interdependencies to be considered in planning the new railway network:- New Mombasa Container Terminal Kipevu Link Road Dongo Kundu Port Area Dongo Kundu Free Trade Zone Dongo Kundu Industrial Area Mombasa Southern Bypass

190 591.10
57 Kenya Railways Corporation KRC Mombasa Commuter Railways Feasibility Study KRC/PLM/40/2011 Final Report
Pöyry Switzerland Ltd.
Figure 4.1: Mombasa Port Projects
4.3.3 Lamu Port Project The Lamu Port and Lamu Southern Sudan-Ethiopia Transport Corridor (LAPSSET) aka The Lamu corridor is a transport and infrastructure project in Kenya that when complete will be the country's second transport corridor. Kenya's other transport corridor is the Mombasa port and Mombasa - Uganda transport corridor that passes through Nairobi and much of the Northern Rift.

190 591.10
58 Kenya Railways Corporation KRC Mombasa Commuter Railways Feasibility Study KRC/PLM/40/2011 Final Report
Pöyry Switzerland Ltd.
The project will involve the following components:[1] A port at Manda Bay Standard gauge railway line to Juba (capital of South Sudan) Road network Oil pipelines (Southern Sudan and Ethiopia) Oil refinery at Bargoni Three Airports Three resort cities (Lamu, Isiolo and Lake Turkana shores)
Key towns in the project are Lamu and Isiolo in Kenya, Juba in Southern Sudan and Addis Ababa in Ethiopia.
Figure 4.2: Lamu Port Project

190 591.10
59 Kenya Railways Corporation KRC Mombasa Commuter Railways Feasibility Study KRC/PLM/40/2011 Final Report
Pöyry Switzerland Ltd.
4.4 The Corridor Study The corridor study is based on:- The desktop study submitted with the inception report from 11. January 2013 The Stakeholder Conference on 14. January 2013 at Mombasa Key Field Trip in January 2013
The Corridor Study includes 6 lines as follows:- Corridor 1: Mombasa – Airport – Likoni - Ramisi Corridor Corridor 2: Mombasa – Mtwapa – Kilifi – Malindi Corridor Corridor 3: Mombasa – Mazeras – Voi Corridor Corridor 4: Likoni Ferry – Bamburi Corridor (Mombasa Ring Corridor) Corridor 5: Mazeras – Kaloleni – Takaungu Corridor Corridor 6: Malindi – Lamu Corridor
The Corridors are described in the following chapters including the proposed alignment, the stations and the main structures. The corridors are shown with the drawings Error! Reference source not found.
4.4.1 Corridor 1: Mombasa – Airport – Likoni - Ramisi Corridor The Mombasa – Airport – Likoni – Ramisi Corridor connects Mombasa CBD to the southern coast region.
4.4.1.1 Corridor description The corridor starts at Mombasa Main Station following the existing Meter Gauge Rail-way up to the Makupa Causeway. The corridor leaves the old route western to the Ma-kupa Causeway running beside the harbour area to the West with a new station Chaani to service the northern harbour area. The Mombasa MOI International Airport is passed by a loop along the coast following the proposed Kipevu Link Road in a common corridor. The connection to the airport is done by bus shuttle from the Airport Station over a distance of about 1.5 km. A new road has to be built. A direct connection to the airport can be realised with a tunnel un-der the airport taking advantage of the topographic situation where the airport is situated on a hill with an altitude of about 60 m above sea level (see also section 4.4.1.5 Alterna-tives)

190 591.10
60 Kenya Railways Corporation KRC Mombasa Commuter Railways Feasibility Study KRC/PLM/40/2011 Final Report
Pöyry Switzerland Ltd.
Figure 4.3: Mombasa Main Station
After passing the airport loop the proposed corridor turns to south following the Mom-basa Southern Bypass with a direct link to the new Dongo Kundu Industrial Area in a common corridor. Some adaptations of the alignment are necessary because of limita-tion of the maximum slope for the railway.
Figure 4.4: The Dongo Kundu Table Mountain
After crossing the Dongo Kundu Area the corridor will have a slope to Likoni to tap in-to this densely populated area by rail. From Likoni to the South the corridor runs along the coast road up to the terminal station at the Sugar Factory of Ramisi.

190 591.10
61 Kenya Railways Corporation KRC Mombasa Commuter Railways Feasibility Study KRC/PLM/40/2011 Final Report
Pöyry Switzerland Ltd.
Figure 4.5: The Ramisi Sugar Plant Area
4.4.1.2 Stations The total corridor length is about 86 km with following proposed stations:-
Table 4.2: Stations of the Mombasa – Airport – Likoni - Ramisi Corridor Station Mileage Interval Rail Level
Mombasa Main Station km 0.0
21 m asl Makupa km 1.9 1.9 km 25 m asl Chaani km 6.1 4.2 km 40 m asl MOI International Airport km 9.0 2.9 km 27 m asl Tsunza km 17.6 8.6 km 23 m asl Dongo Kundu km 23.1 5.5 km 12 m asl Likoni km 29.8 6.7 km 28 m asl Magaoni km 34.4 4.6 km 28 m asl Waa km 41.2 6.8 km 29 m asl Tiwi km 47.3 6.1 km 26 m asl Ukunda km 53.3 6.0 km 34 m asl Mwabungu km 62.2 8.9 km 19 m asl Gazi km 71.3 9.1 km 30 m asl Msambweni km 78.4 7.1 km 20 m asl Ramisi km 87.9 9.5 km 14 m asl asl = above sea level

190 591.10
62 Kenya Railways Corporation KRC Mombasa Commuter Railways Feasibility Study KRC/PLM/40/2011 Final Report
Pöyry Switzerland Ltd.
4.4.1.3 Main Structures The corridor includes the following main structures:-
Table 4.3: Main Structures of the Mombasa – Airport – Likoni - Ramisi Corridor Name Structure Mileage from - to Length
Makupa Causeway Embank. Km 2.9 km 3.5 600 m Mwache Creek Bridge km 12.5 km 13.3 800 m Tsunza Viaduct Bridge km 13.3 km 15.8 2’500 m Tsunza Causeway Embank. km 18.6 km 19.1 500 m Bombo Creek Bridge km 19.1 km 20.7 1’600 m Mwachema River Bridge km 49.1 km 49.4 250 m Embank. = Embankment
4.4.1.4 Junctions The corridor has following junctions to other corridors and railway lines:-
Table 4.4: Junctions of the Mombasa – Airport – Likoni - Ramisi Corridor Station Mileage Connection
Mombasa Main Station km 0.0 Mombasa – Mtwapa – Kilifi – Malindi Corri-dor
Makupa km 1.9 Likoni Ferry – Bamburi Corridor Mombasa – Mazeras – Voi Corridor
4.4.1.5 Alternatives There are two alternatives to be considered within this corridor:-
4.4.1.5.1 Airport Tunnel Instead of running with a loop around the airport, this alternative crosses the MOI Inter-national Airport by tunnelling under the airfield taking advantage of the topographic sit-uation where the airport is situated on a hill with an altitude of about 60 m above sea level. The tunnel with a length of about 2.4 km allows a direct connection to the airport by an underground station below the terminal building.
Advantage: The undergoing station is the closest possible connection between railway and airport. The tunnel allows a high effective integration of rail- and air-travel with di-rect connections to the beach resorts in the Mombasa region. Disadvantage: High costs for tunnel and underground station.
4.4.1.5.2 Miritini – Waa Alternative The Miritini – Waa Alternative runs along the coast line of the creeks in the south of Mombasa. The corridor starts at the new Miritini Station of the Mombasa – Voi line and join the base corridor northern to Waa.

190 591.10
63 Kenya Railways Corporation KRC Mombasa Commuter Railways Feasibility Study KRC/PLM/40/2011 Final Report
Pöyry Switzerland Ltd.
Advantage: The Miritini –Waa – Alternative eliminates the 2 crossings of the Mwache and the Bombo Creek along the base corridor. Since these crossings are foreseen to build the Mombasa Southern Bypass and the proposed base corridor is following the road alignment, the advantage of elimination of these crossings is limited. Disadvantage: The Miritini – Waa Alternative is about 8 km longer than the base corri-dor. The alternative runs mostly along low populated areas. Neither the Dongo Kundu Industrial Area nor the high density populated Likoni Town is connected to the corridor.
4.4.1.6 Corridor Topology The corridor topology shows the proposed structure of the railway line and the ar-rangement of stations, junctions and points.
Figure 4.6: Topology of Corridor 1, Section Mombasa Main Station– MOI International Airport
Figure 4.7: Topology of Corridor 1, Section Tsunza - Tiwi

190 591.10
64 Kenya Railways Corporation KRC Mombasa Commuter Railways Feasibility Study KRC/PLM/40/2011 Final Report
Pöyry Switzerland Ltd.
Figure 4.8: Topology of Corridor 1, Section Ukunda – Ramisi

190 591.10
65 Kenya Railways Corporation KRC Mombasa Commuter Railways Feasibility Study KRC/PLM/40/2011 Final Report
Pöyry Switzerland Ltd.
4.4.2 Corridor 2: Mombasa – Mtwapa – Kilifi – Malindi Corridor The Mombasa – Mtwapa – Kilifi – Malindi Corridor connects Mombasa to the northern coast region. With the terminal station at Malindi the 2nd large town in the coast region is connected to Mombasa by train. An enlargement of the corridor to the north is given by the Malindi – Lamu corridor.
4.4.2.1 Corridor description The corridor starts at Mombasa Main Station on the Mombasa Island in elongation of the existing railway line. The new Mombasa Main Station changes from a terminal sta-tion to a running station in the commuter railway network. The Mombasa Central Dis-trict will be crossed by a viaduct. It is proposed to run the elevated railway line behind the first row of houses to keep the relations of the business houses to the street fully maintained. A gradient of the viaduct above or beside the main road would significantly disturb these relationships. The Mombasa City Viaduct will have a length of about 1’600 m.
Figure 4.9: Mombasa Central Business District
The corridor traverses to Kisauni crossing the Mombasa Harbour by a bridge in the axis of the former pontoon bridge. The bridge with a length of about 700 m is planned to be constructed as a wide span steel bridge with a rail level of 31 m above sea level to allow crossing of ships.

190 591.10
66 Kenya Railways Corporation KRC Mombasa Commuter Railways Feasibility Study KRC/PLM/40/2011 Final Report
Pöyry Switzerland Ltd.
Figure 4.10: Mombasa Harbour with relicts of the old pontoon bridge
In the further course the corridor is proposed to be routed at ground level with overpass-es of crossing roads. An elevated gradient can be considered in the town of Kisauni but preferably by an embankment instead of a viaduct to limit costs.
Figure 4.11: The Kilifi Creek
The course of the corridor up to Mtwapa is determined by the Haller Park along the coast road and the Bamburi Airfield that must be bypassed. Up to Kilifi there are three creeks to be traversed with bridges of a length of 300 m to 550 m. The bridges can be

190 591.10
67 Kenya Railways Corporation KRC Mombasa Commuter Railways Feasibility Study KRC/PLM/40/2011 Final Report
Pöyry Switzerland Ltd.
constructed by prestressed concrete with a span up to 150 m. Alternative constructions are steel composite bridges or steel bridges which allow a wider span. Between Kilifi and Malindi the corridor mostly follows the coast road. In the region of Watamu / Gede two alternatives are shown. The proposed corridor crosses the Mida Creek southern to Watamu and runs along the Watamu Peninsula beside the existing road. Passing the station of Watamu the corridor turns to Gede and runs along the main road to Malindi. The alternative corridor is described below.
Figure 4.12: Malindi Main Road
The terminal station is proposed to be situated between Malindi City and Malindi Air-port. The Mombasa – Mtwapa – Kilifi – Malindi Corridor may be extended by the Ma-lindi – Lamu corridor.
4.4.2.2 Stations The total corridor length is about 114 km with following proposed stations:-
Table 4.5: Stations of the Mombasa – Mtwapa – Kilifi – Malindi Corridor Station Mileage Interval Rail Level
Mombasa Main Station km 0.0
21 m asl Makadara km 1.6 1.6 km 28 m asl Kongowea km 4.1 2.5 km 25 m asl Freretown km 6.7 2.6 km 18 m asl Bamburi km 8.9 2.2 km 22 m asl Utange km 11.9 3.0 km 19 m asl Shimo la Tewa km 14.2 2.3 km 22 m asl Mtwapa km 16.4 2.2 km 25 m asl
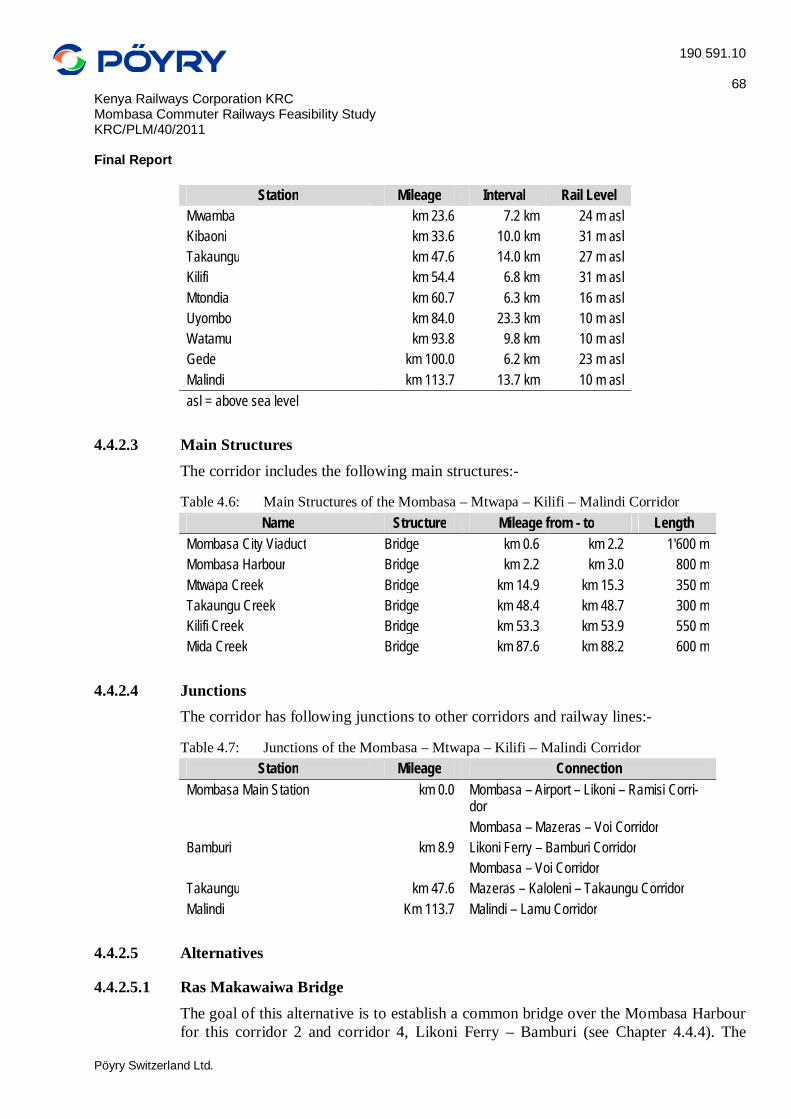
190 591.10
68 Kenya Railways Corporation KRC Mombasa Commuter Railways Feasibility Study KRC/PLM/40/2011 Final Report
Pöyry Switzerland Ltd.
Station Mileage Interval Rail Level Mwamba km 23.6 7.2 km 24 m asl Kibaoni km 33.6 10.0 km 31 m asl Takaungu km 47.6 14.0 km 27 m asl Kilifi km 54.4 6.8 km 31 m asl Mtondia km 60.7 6.3 km 16 m asl Uyombo km 84.0 23.3 km 10 m asl Watamu km 93.8 9.8 km 10 m asl Gede km 100.0 6.2 km 23 m asl Malindi km 113.7 13.7 km 10 m asl asl = above sea level
4.4.2.3 Main Structures The corridor includes the following main structures:-
Table 4.6: Main Structures of the Mombasa – Mtwapa – Kilifi – Malindi Corridor Name Structure Mileage from - to Length
Mombasa City Viaduct Bridge km 0.6 km 2.2 1'600 m Mombasa Harbour Bridge km 2.2 km 3.0 800 m Mtwapa Creek Bridge km 14.9 km 15.3 350 m Takaungu Creek Bridge km 48.4 km 48.7 300 m Kilifi Creek Bridge km 53.3 km 53.9 550 m Mida Creek Bridge km 87.6 km 88.2 600 m
4.4.2.4 Junctions The corridor has following junctions to other corridors and railway lines:-
Table 4.7: Junctions of the Mombasa – Mtwapa – Kilifi – Malindi Corridor Station Mileage Connection
Mombasa Main Station km 0.0 Mombasa – Airport – Likoni – Ramisi Corri-dor
Mombasa – Mazeras – Voi Corridor Bamburi km 8.9 Likoni Ferry – Bamburi Corridor Mombasa – Voi Corridor Takaungu km 47.6 Mazeras – Kaloleni – Takaungu Corridor Malindi Km 113.7 Malindi – Lamu Corridor
4.4.2.5 Alternatives
4.4.2.5.1 Ras Makawaiwa Bridge The goal of this alternative is to establish a common bridge over the Mombasa Harbour for this corridor 2 and corridor 4, Likoni Ferry – Bamburi (see Chapter 4.4.4). The

190 591.10
69 Kenya Railways Corporation KRC Mombasa Commuter Railways Feasibility Study KRC/PLM/40/2011 Final Report
Pöyry Switzerland Ltd.
bridge will be allocated at the Ras Makawaiwa near Mombasa Polytechnic University College. The city viaduct has to be elongated along the Tom Mboya Avenue – Tom Mboya Road – Rassini Road over about 1’800 m.
Advantage: It is only one bridge built over Mombasa Harbour to connect Mombasa Is-land to the northern territories. The town centre of Kisauni is directly connected to the railway line. One more Station (Politechnic University) on Mombasa Island allows a higher service level in Mombasa CBD.
Disadvantage: The corridor 2 is guided in a loop around Mombasa CBD which reduces attractiveness of the diameter route. The elongation of the city viaduct of about 1’800 m balances cost reduction resulting from omission of the 2nd harbour bridge (Junda creek bridge) along corridor 4, Likoni Ferry – Bamburi.
4.4.2.5.2 Gede Alternative The Gede Alternative between Uyombo and Gede keeps the railway following the main road instead of turning off to the Watamu peninsula. The alternative corridor bypasses the Mida Creek area along the Arabuko Sokoke Forest and connects to the main corri-dor eastern of Gede.
Figure 4.13: Mida Creek near Watamu Advantages and disadvantages of the alternatives must be evaluated primarily from the environmental view (refer to chapter 7.5.1). The evaluation from technical view has to consider following points:-
Advantage: With the Gede Alternative the crossing of the Mida Creek with a bridge of a length of about 600 m is omitted which reduces costs for the corridor.

190 591.10
70 Kenya Railways Corporation KRC Mombasa Commuter Railways Feasibility Study KRC/PLM/40/2011 Final Report
Pöyry Switzerland Ltd.
Disadvantage: With the alternative corridor there is no connection to Watamu town which is one of the more interesting places to generate traffic volume along this corri-dor. This will reduce the benefits of the railway line.
4.4.2.6 Corridor Topology The corridor topology shows the proposed structure of the railway line and the ar-rangement of stations, junctions and points.
Figure 4.14: Topology of Corridor 2, Section Mombasa – Shimo la Tewa
Figure 4.15: Topology of Corridor 2, Section Mtwapa – Kilifi
Figure 4.16: Topology of Corridor 2, Section Mtondia – Malindi

190 591.10
71 Kenya Railways Corporation KRC Mombasa Commuter Railways Feasibility Study KRC/PLM/40/2011 Final Report
Pöyry Switzerland Ltd.
4.4.3 Corridor 3: Mombasa – Mazeras – Voi Corridor The Mombasa – Mazeras – Voi Corridor is using the proposed Standard Gauge Railway Mombasa – Nairobi. This alignment starts at the Changamwe Marshalling Yard and has to be extended by a branch to Mombasa Main Station. The proposed stations of the long distance railway to Nairobi are mostly configured as passing stations. For using with the commuter railway the stations must be fitted up by additional tracks and passenger fa-cilities.
4.4.3.1 Description The corridor starts at Mombasa Main Station following the Mombasa – Airport Corridor up to the western side of the Makupa Causeway. A new branch is built to connect the proposed long distance railway at Changamwe Marshalling Yard. With the branch to Mombasa Main Station there is a gap in the Mileage between the commuter railway cor-ridor and the long distance railway Mombasa – Nairobi of about 7.5 km. The following mileage is based on the commuter railway corridor starting at Mombasa Main Station.
Figure 4.17: Miritini Railway Station
The passing stations along the long-distance railway Mombasa – Nairobi are mostly corresponding to the stations which are planned for commuter railway services. Criteria for the location of the passenger stations are: the proximity to residential areas, the proximity to other interesting points.
Such an interesting point is e.g. the Bachuma gate of the Tsavo National Park. Situated close to the railway line the Bachuma Station can be reached with the commuter railway from Mombasa within 1:40h and become an attractive target for tourists in the Momba-sa area.

190 591.10
72 Kenya Railways Corporation KRC Mombasa Commuter Railways Feasibility Study KRC/PLM/40/2011 Final Report
Pöyry Switzerland Ltd.
Figure 4.18: Tsavo National Park, Bachuma Gate
The terminal station for the commuter railway service in Voi is proposed to be located close to the main street C105 to allow a good connection to the city.
Figure 4.19: C 105 Level crossing at Voi
Further adjustment of the station location has to be done with the design of the railway line. The following table shows the corresponding stations of the commuter railway cor-ridor and the long-distance corridor:-

190 591.10
73 Kenya Railways Corporation KRC Mombasa Commuter Railways Feasibility Study KRC/PLM/40/2011 Final Report
Pöyry Switzerland Ltd.
Table 4.8: Comparison of stations along the Mombasa – Mazeras – Voi Corridor Commuter Railway Station Mileage Long Dist. Railway Station Mileage
Mombasa Main Station km 0.0 Makupa km 1.9 Changamwe km 5.4 Mikindani km 9.0 Mombasa Station km 1.0 Miritini km 12.5 Mazeras km 19.3 Mazeras km 12.0 Mariakani km 34.2 Mariakani km 25.4 Maji Ya Chumvi km 49.0 Manjewa km 39.6 Samburu km 60.3 Samburu km 51.0 Taru km 73.8 Mugalani km 65.2 Mackinnon Road km 84.6 Mackinnon Road km 78.3 Bachuma km 97.1 Miaseny km 92.2 Wangala km 106.2 Maungu km 122.9 Maungu km 118.7 Ngutini km 129.7 Voi km 152.7 Voi km 142.8 Mileage gap 7.5 km
4.4.3.2 Stations The total corridor length is about 153 km with following proposed stations:-
Table 4.9: Commuter Service Stations of the Mombasa – Mazeras – Voi Corridor Station Mileage Interval Rail Level
Mombasa Main Station km 0.0
21 m asl Makupa km 1.9 1.9 km 25 m asl Changamwe km 5.4 3.5 km 28 m asl Mikindani km 9.0 3.6 km 58 m asl Miritini km 12.6 3.6 km 40 m asl Mazeras km 19.3 6.7 km 135 m asl Mariakani km 34.2 14.9 km 207 m asl Maji Ya Chumvi km 49.0 14.8 km 234 m asl Samburu km 60.3 11.3 km 294 m asl Taru km 73.8 13.5 km 353 m asl Mackinnon Road km 84.6 10.8 km 360 m asl Bachuma km 97.1 12.5 km 430 m asl Maungu km 122.9 25.8 km 520 m asl Voi km 152.7 29.8 km 570 m asl asl = above sea level

190 591.10
74 Kenya Railways Corporation KRC Mombasa Commuter Railways Feasibility Study KRC/PLM/40/2011 Final Report
Pöyry Switzerland Ltd.
4.4.3.3 Main Structures There are no additional main structures to be built for the Mombasa Branch and the up-grading of the corridor for commuter railway services.
4.4.3.4 Junctions The corridor has following junctions to other corridors and railway lines:-
Table 4.10: Junctions of the Mombasa – Mazeras – Voi Corridor Station Mileage Connection
Mombasa Main Station km 0.0 Mombasa – Mtwapa – Kilifi – Malindi Corri-dor
Makupa km 1.9 Likoni Ferry – Bamburi Corridor Mombasa – Airport – Likoni – Ramisi Corri-
dor Mazeras km 19.3 Mazeras – Kaloleni – Takaungu Corridor
4.4.3.5 Alternative Not applicable.
4.4.3.6 Corridor Topology The corridor topology shows the proposed structure of the railway line and the ar-rangement of stations, junctions and points.
Figure 4.20: Topology of Corridor 3, Section Mombasa – Mikindani
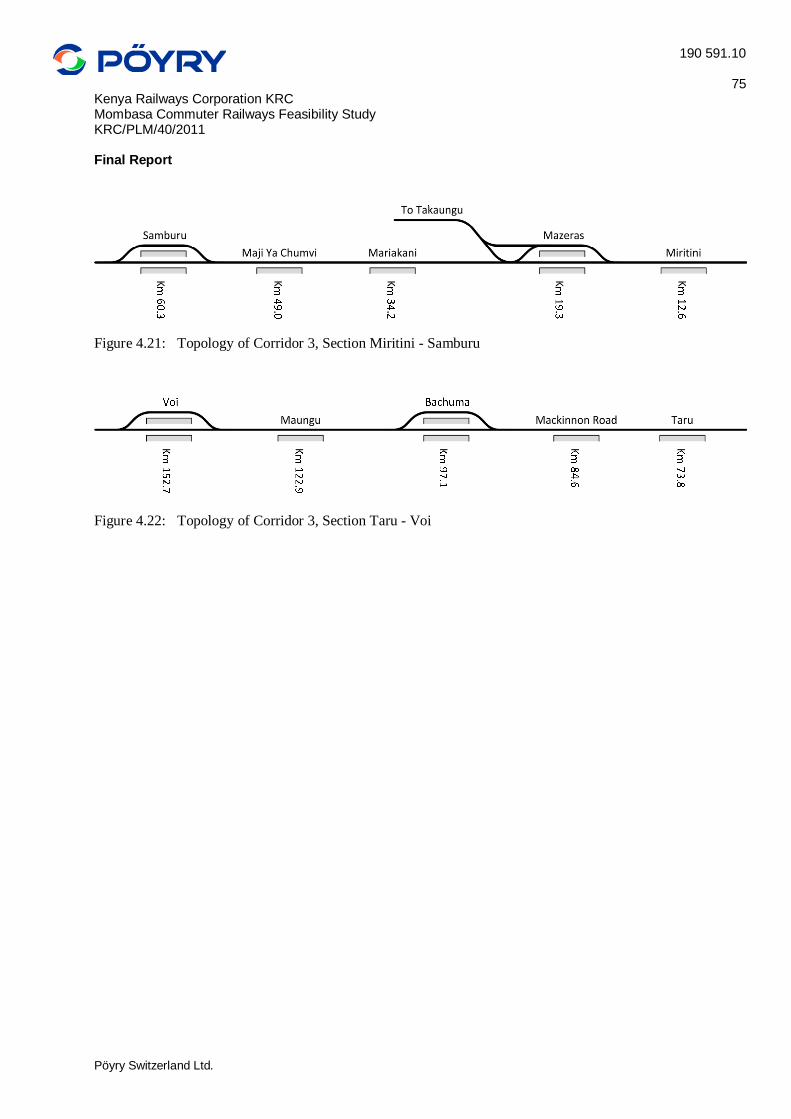
190 591.10
75 Kenya Railways Corporation KRC Mombasa Commuter Railways Feasibility Study KRC/PLM/40/2011 Final Report
Pöyry Switzerland Ltd.
Figure 4.21: Topology of Corridor 3, Section Miritini - Samburu
Figure 4.22: Topology of Corridor 3, Section Taru - Voi

190 591.10
76 Kenya Railways Corporation KRC Mombasa Commuter Railways Feasibility Study KRC/PLM/40/2011 Final Report
Pöyry Switzerland Ltd.
4.4.4 Corridor 4: Likoni Ferry – Bamburi Corridor (Mombasa Ring Corridor) The short Likoni Ferry - Bamburi corridor establishes a ring line within the most popu-lated districts of Mombasa.
4.4.4.1 Description The southern terminal station of the Likoni Ferry – Bamburi corridor is situated at the landing stage of the Likoni Ferry on the Mombasa Island. The corridor follows the abandoned meter-gauge railway line to Makupa.
Figure 4.23: Likoni Ferry
At Makupa there is a junction to the Mombasa – Airport and to the Mombasa – Mazeras – Voi Line. The corridor passes the southern Mombasa Island and crosses the Junda creek to establish a 2nd connection to the northern mainland.

190 591.10
77 Kenya Railways Corporation KRC Mombasa Commuter Railways Feasibility Study KRC/PLM/40/2011 Final Report
Pöyry Switzerland Ltd.
Figure 4.24: Junda Creek
The northern terminal station of this corridor at Bamburi is also the connection station to the northern Mombasa – Mtwapa – Kilifi – Malindi Corridor.
4.4.4.2 Stations The total corridor length is about 13 km with following proposed stations:-
Table 4.11: Stations of the Likoni Ferry – Bamburi Corridor Station Mileage Interval Rail Level
Likoni Ferry km 0.0
12 m asl Cruise Pier km 1.7 1.7 km 19 m asl Makupa km 4.3 2.6 km 25 m asl Junda km 8.4 4.1 km 25 m asl Kengelani Road km 11.0 2.6 km 47 m asl Mtopanga km 13.1 2.1 km 30 m asl Bamburi km 14.8 1.7 km 22 m asl asl = above sea level
4.4.4.3 Main Structures The corridor includes the following main structures:-
Table 4.12: Main Structures of the Likoni Ferry – Bamburi Corridor Name Structure Mileage from - to Length
Junda Creek Bridge km 6.4 km 7.3 900 m

190 591.10
78 Kenya Railways Corporation KRC Mombasa Commuter Railways Feasibility Study KRC/PLM/40/2011 Final Report
Pöyry Switzerland Ltd.
4.4.4.4 Junctions The corridor has following junctions to other corridors and railway lines:-
Table 4.13: Junctions of the Likoni Ferry – Bamburi Corridor Station Mileage Connection
Makupa km 4.3 Mombasa – Airport – Likoni – Ramisi Corri-dor
Mombasa – Mazeras – Voi Corridor Bamburi km 14.8 Mombasa – Mtwapa – Kilifi – Malindi Corri-
dor
4.4.4.5 Alternative In combination with alternative Ras Makawaiwa Bridge of corridor 2, Mombasa – Mtwape – Kilifi – Malindi, the alternative joins the corridor 2 line at Polytechnic Uni-versity. Advantage: The junction to line 2 at Polytechnic University station omits a 2nd bridge to the territories northern to Mombasa. The significant shortening of the corridor reduces the necessary investments.
Disadvantage: The alternative needs a northern city viaduct along Tom Mboya Road – Rassini Road with a length of about 1,500m. This viaduct compensates the cost ad-vantage of omission of the Junda Creek bridge partially. The junction to corridor 2 at Polytechnic University omits the railway corridor from Junda to Bamburi with signifi-cant reduction of service quality in this area.
4.4.4.6 Corridor Topology The corridor topology shows the proposed structure of the railway line and the ar-rangement of stations, junctions and points.
Figure 4.25: Topology of Corridor 4, Section Likoni Ferry – Junda

190 591.10
79 Kenya Railways Corporation KRC Mombasa Commuter Railways Feasibility Study KRC/PLM/40/2011 Final Report
Pöyry Switzerland Ltd.
Figure 4.26: Topology of Corridor 4, Section Kengelani Road – Bamburi

190 591.10
80 Kenya Railways Corporation KRC Mombasa Commuter Railways Feasibility Study KRC/PLM/40/2011 Final Report
Pöyry Switzerland Ltd.
4.4.5 Corridor 5: Mazeras – Kaloleni – Takaungu Corridor The Mazeras – Kaloleni – Takaungu Corridor represents a bypass Mombasa and allows a direct connection from the west to the north without crossing Mombasa Island. It also establish a capable connection of Kaloleni to Mombasa.
4.4.5.1 Corridor description The Mazeras – Kalolini – Takaungu Corridor is situated in a hilly region with moun-tainous sections. The max. slope will be increased up to 25‰ and the min. radius de-creased to 300m. The maximum speed is partially reduced to 80 km/h.
Figure 4.27: Countryside near Mkapuni

190 591.10
81 Kenya Railways Corporation KRC Mombasa Commuter Railways Feasibility Study KRC/PLM/40/2011 Final Report
Pöyry Switzerland Ltd.
Figure 4.28: Kambe Cement Plant
Between Mazeras and Kaloleni the railway follows the road C111 building a common traffic corridor of railway and road. From Kaloleni to Takaungu a new corridor has to be established. The terminal station at Takaungu is also the connection station to the northern Mombasa – Mtwapa – Kilifi – Malindi Corridor.
Figure 4.29: Kaloleni Main Road
4.4.5.2 Stations The total corridor length is about 52 km with following proposed stations:-

190 591.10
82 Kenya Railways Corporation KRC Mombasa Commuter Railways Feasibility Study KRC/PLM/40/2011 Final Report
Pöyry Switzerland Ltd.
Table 4.14: Stations of the Mazeras – Kaloleni – Takaungu Corridor Station Mileage Interval Rail Level
Mazeras km 0.0 135 m asl Mkapuni km 11.0 km 11.0 158 m asl Kambe km 15.9 km 4.9 203 m asl Kaloleni km 20.5 km 4.6 200 m asl Kidutani km 33.5 km 13.0 118 m asl Takaungu km 51.7 km 18.2 27 m asl asl = above sea level
4.4.5.3 Main Structures The corridor includes the following main structures:-
Table 4.15: Main Structures of the Mazeras – Kaloleni – Takaungu Corridor Name Structure Mileage from - to Length
Mangata River Bridge km 6.4 km 6.6 200 m Mleji River Bridge km 12.3 km 12.6 250 m Dzihana River Bridge km 23.6 km 23.8 200 m Darajani River Bridge km 25.3 km 25.7 350 m Sinawe tributary Bridge km 46.9 km 47.1 200 m
4.4.5.4 Junctions The corridor has following junctions to other corridors and railway lines:-
Table 4.16: Junctions of the Mazeras – Kaloleni – Takaungu Corridor Station Mileage Connection
Mazeras km 0.0 Mombasa – Mazeras – Voi Corridor Takaungu km 51.7 Mombasa – Mtwapa – Kilifi – Malindi Corri-
dor
4.4.5.5 Alternative Not applicable.
4.4.5.6 Corridor Topology The corridor topology shows the proposed structure of the railway line and the ar-rangement of stations, junctions and points.

190 591.10
83 Kenya Railways Corporation KRC Mombasa Commuter Railways Feasibility Study KRC/PLM/40/2011 Final Report
Pöyry Switzerland Ltd.
Figure 4.30: Topology of Corridor 5, Mazeras - Takaungu

190 591.10
84 Kenya Railways Corporation KRC Mombasa Commuter Railways Feasibility Study KRC/PLM/40/2011 Final Report
Pöyry Switzerland Ltd.
4.4.6 Corridor 6: Malindi – Lamu Corridor The Malindi – Lamu corridor represent the extension of the Mombasa – Mtwape – Kilifi – Malindi Corridor to the north. The total length of this corridor of about 205 km ex-ceeds the usual distance for commuter railway services. The practicability of this corri-dor must be reviewed considering also the low density population of the passed region.
4.4.6.1 Corridor description The corridor starts at the proposed Malindi station which will become a running station when this corridor is established. The corridor runs largely through the lowlands along the coast line following the road to Lamu. The corridor passes the wetlands of the Tana Delta which requires a wide circumvention to the North and a long bridge for crossing the Tana River.
Figure 4.31: The Tana River Delta
The northern terminus is situated beneath the new Lamu Port Area must be adapted to the detailed concept of the Lamu Port Project.
4.4.6.2 Stations The total corridor length is about 205 km with following proposed stations:-
Table 4.17: Stations of the Malindi – Lamu Corridor Station Mileage Interval Rail Level
Malindi km 0.0 12 m asl Gongoni km 22.0 km 22.0 18 m asl Garsen km 102.0 km 80.0 16 m asl Witu km 142.0 km 40.0 18 m asl
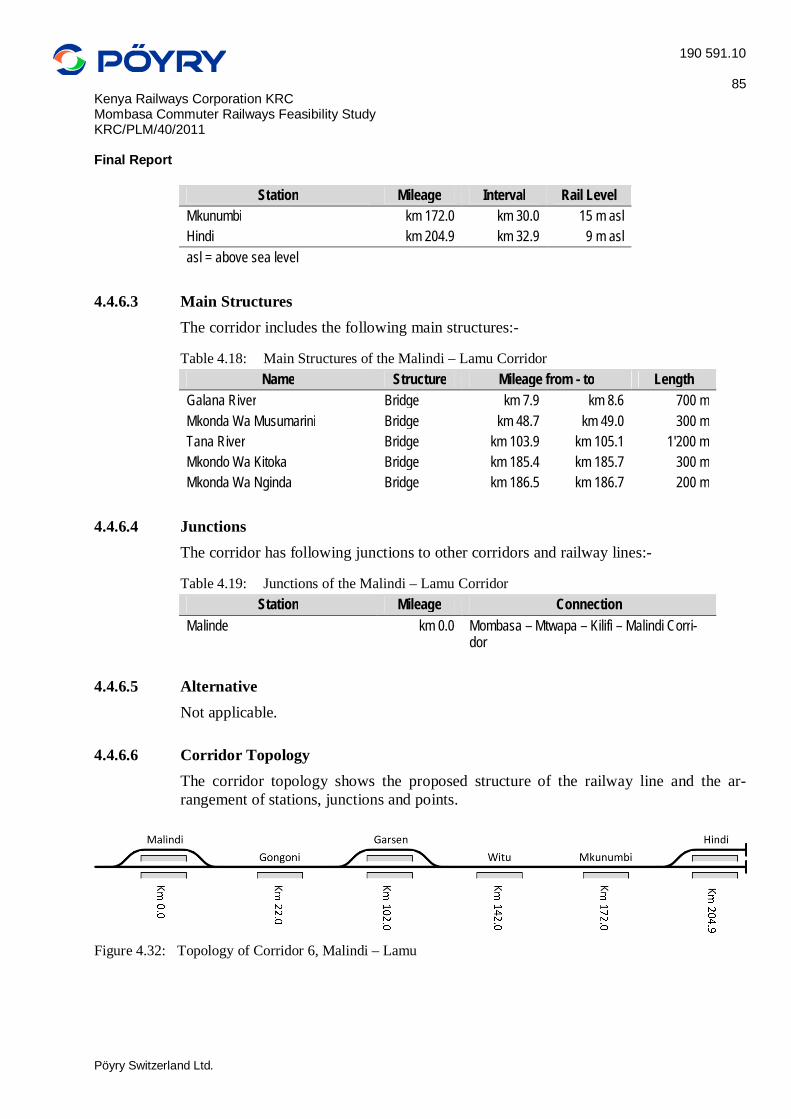
190 591.10
85 Kenya Railways Corporation KRC Mombasa Commuter Railways Feasibility Study KRC/PLM/40/2011 Final Report
Pöyry Switzerland Ltd.
Station Mileage Interval Rail Level Mkunumbi km 172.0 km 30.0 15 m asl Hindi km 204.9 km 32.9 9 m asl asl = above sea level
4.4.6.3 Main Structures The corridor includes the following main structures:-
Table 4.18: Main Structures of the Malindi – Lamu Corridor Name Structure Mileage from - to Length
Galana River Bridge km 7.9 km 8.6 700 m Mkonda Wa Musumarini Bridge km 48.7 km 49.0 300 m Tana River Bridge km 103.9 km 105.1 1'200 m Mkondo Wa Kitoka Bridge km 185.4 km 185.7 300 m Mkonda Wa Nginda Bridge km 186.5 km 186.7 200 m
4.4.6.4 Junctions The corridor has following junctions to other corridors and railway lines:-
Table 4.19: Junctions of the Malindi – Lamu Corridor Station Mileage Connection
Malinde km 0.0 Mombasa – Mtwapa – Kilifi – Malindi Corri-dor
4.4.6.5 Alternative Not applicable.
4.4.6.6 Corridor Topology The corridor topology shows the proposed structure of the railway line and the ar-rangement of stations, junctions and points.
Figure 4.32: Topology of Corridor 6, Malindi – Lamu

190 591.10
86 Kenya Railways Corporation KRC Mombasa Commuter Railways Feasibility Study KRC/PLM/40/2011 Final Report
Pöyry Switzerland Ltd.
4.5 Road Map for Development For developing the railway network of Mombasa region, 12 sections within the 6 corri-dors described above are defined. The principles for definition of the sections are:- Splitting of the investment costs Truncation at stations where a significant traffic volume is expected
The corridors 1 – 3 are split in 3 sections each, corridor 4 is a short corridor to be real-ised in one piece, corridors 5 and 6 do not have intermediate stations with significant traffic volume to make splitting reasonable. The sections are defined as follows:-
Table 4.20: Road map for development, Sections Cor. Sec. from mileage to mileage length
1 Mombasa - Airport - Likoni - Ramisi Corridor
1.1 Makupa km 1.9
MOI International Air-port km 9.0 7.1 km
1.2
MOI International Air-port km 9.0 Likoni km 29.8 20.8 km
1.3 Likoni km 29.8 Ramisi km 87.9 58.1 km
2 Mombasa -Mtwapa - Kilifi - Malindi Corridor 2.1 Mombasa Main Station km 0.0 Mtwapa km 16.4 16.4 km 2.2 Mtwapa km 16.4 Kilifi km 54.4 38.0 km 2.3 Kilifi km 54.4 Malindi km 113.7 59.3 km
3 Mombasa - Mazeras - Voi Corridor 3.1 Mombasa Main Station km 0.0 Mazeras km 19.3 19.3 km 3.2 Mazeras km 19.3 Samburu km 60.3 41.0 km 3.3 Samburu km 60.3 Voi km 152.7 92.4 km
4 Likoni Ferry - Bamburi Corridor 4 Likoni Ferry km 0.0 Bamburi km 14.8 14.8 km
5 Mazeras - Kaloleni - Takaunga Corridor 5 Mazeras km 0.0 Takaungu km 51.7 51.7 km
6 Malindi - Lamu Corridor 6 Malindi km 0.0 Hindi km 204.9 204.9 km
These 12 sections have been prioritised according to the criteria length of the section, investment costs (see Chapter 8) and expected traffic volume (see Chapter 3). A further criterion is the development of a coherent network in each stage of system implementa-tion; sections will only be realised, if they have connectivity to the network (no stand-alone section). The result is the following priority list:-

190 591.10
87 Kenya Railways Corporation KRC Mombasa Commuter Railways Feasibility Study KRC/PLM/40/2011 Final Report
Pöyry Switzerland Ltd.
Table 4.21: Road map for development, schedule Priority Corridor Start / Duration [month] No Section Planning Construction Opera. Start Duration Start Duration Start mm/yy Months mm/yy Months mm/yy 1 3.1 Mombasa - Mazeras - Voi Mombasa - Mazeras 10/13 18 04/15 30 10/17 2 1.1 Mombasa - Airport - Likoni - Ramisi Makupa - Airport 07/14 15 10/15 24 10/17 3 2.1 Mombasa -Mtwapa - Kilifi - Malindi Mombasa - Mtwapa 01/14 27 04/16 54 10/20 4 4 Likoni Ferry - Bamburi Likoni Ferry - Bamburi 04/16 18 10/17 48 10/21 5 1.2 Mombasa - Airport - Likoni - Ramisi Airport - Likoni 10/15 24 10/17 60 10/22 6 3.2 Mombasa - Mazeras - Voi Mazeras - Samburu 10/19 12 10/20 24 10/22 7 2.2 Mombasa -Mtwapa - Kilifi - Malindi Mtwapa - Kilifi 07/20 15 10/21 30 04/24 8 1.3 Mombasa - Airport - Likoni - Ramisi Likoni - Ramisi 07/21 15 10/22 30 04/25 9 3.3 Mombasa - Mazeras - Voi Samburu - Voi 10/21 12 10/22 24 10/24 10 2.3 Mombasa -Mtwapa - Kilifi - Malindi Kilifi - Malindi 07/23 15 10/24 30 04/27 11 5 Mazeras - Kaloleni - Takaungu Mazeras - Takaungu 10/23 18 04/25 36 04/28 12 6 Malindi - Lamu Malindi - Lamu 10/21 30 04/24 78 10/30
The following figure shows the proposed Road Map for development as a Gantt dia-gram showing preceding planning phase, construction phase and operation phase:-

190 591.10
88 Kenya Railways Corporation KRC Mombasa Commuter Railways Feasibility Study KRC/PLM/40/2011 Final Report
Pöyry Switzerland Ltd.
Figure 4.33: Road map for development
Corri
dor
2014
2015
2016
2017
2018
2019
2020
2021
2022
2023
2024
2025
2026
2027
2028
2029
2030
Prio
rity
Secti
onLe
ngth
Mom
basa
- Maz
eras
- Voi
Line
13.1
Mom
basa
Main
Stat
ion -
Maz
eras
19.3
km
Mom
basa
- Airp
ort -
Liko
ni - R
amisi
Line
21.1
Mak
upa -
MOI
Inte
rnat
iona
l Airp
ort
7.1 km
Mom
basa
-Mtw
apa -
Kilif
i - M
alind
i Lin
e3
2.1M
omba
sa M
ain St
atio
n - M
twap
a16
.4 km
Likon
i Fer
ry - B
ambu
ri Lin
e4
4Lik
oni F
erry
- Bam
buri
14.8
km
Mom
basa
- Airp
ort -
Liko
ni - R
amisi
Line
51.2
MOI
Inte
rnat
iona
l Airp
ort -
Liko
ni20
.8 km
Mom
basa
- Maz
eras
- Voi
Line
63.2
Maz
eras
- Sam
buru
41.0
km
Mom
basa
-Mtw
apa -
Kilif
i - M
alind
i Lin
e7
2.2M
twap
a - Ki
lifi
38.0
km
Mom
basa
- Airp
ort -
Liko
ni - R
amisi
Line
81.3
Likon
i - Ra
misi
58.1
km
Mom
basa
- Maz
eras
- Voi
Line
93.3
Sam
buru
- Voi
92.4
km
Mom
basa
-Mtw
apa -
Kilif
i - M
alind
i Lin
e10
2.3Ki
lifi -
Mali
ndi
59.2
km
Maz
eras
- Kalo
leni
- Tak
aung
a Lin
e11
5M
azer
as - T
akau
ngu
51.7
km
Mali
ndi -
Lam
u Lin
e12
6M
alind
i - H
indi
204.9
km
Tota
l Len
gth o
f Rail
way N
etwo
rk62
3.7 km
Plan
ning
Cons
tructi
onOp
erat
ion

190 591.10
89 Kenya Railways Corporation KRC Mombasa Commuter Railways Feasibility Study KRC/PLM/40/2011 Final Report
Pöyry Switzerland Ltd.
5 OPERATIONAL CONCEPT
5.1 Introduction This chapter presents an evaluation and a draft proposition for suitable operations for the planned new commuter railway network in Mombasa, including train schedules. It proposes train services along 6 corridors and discusses alternative options.
5.2 Network characteristics The Kenya Railways Corporation (KRC) is planning a new commuter railway network in the city of Mombasa. This will have the following characteristics: Standard gauge Total line length of approx. 600 Km Single-track, extension to double track possible in a later phase Not electrified, electrification possible in a later phase No connection with the existing meter-gauge network Exploitation with commuter MUs only Goods and long-distance traffic will take place on the corridor in direction of Voi (-
Nairobi) The expected level of traffic is not actually documented, as detailed traffic predic-
tions are not yet available

190 591.10
90 Kenya Railways Corporation KRC Mombasa Commuter Railways Feasibility Study KRC/PLM/40/2011 Final Report
Pöyry Switzerland Ltd.
5.3 Corridors This network will consist of the following corridors:
Figure 5.1: General planned network map
Mombasa – Airport – Likoni - Ramisi (82 Km) Mombasa – Mtwapa – Kilifi – Malindi (114 Km) Mombasa – Mazeras – Voi (153 Km) Likoni Ferry – Makupa – Bamburi (15 Km) Mazeras – Kaloleni – Takaungu (52 Km) Malindi – Lamu (205 Km)

190 591.10
91 Kenya Railways Corporation KRC Mombasa Commuter Railways Feasibility Study KRC/PLM/40/2011 Final Report
Pöyry Switzerland Ltd.
Figure 5.2: City of Mombasa detail map
5.4 Proposed train services The following train services are proposed in a first phase (Line numbers are no official numbers issued by KRC, but only internal references for this document):
5.4.1 Corridor 1: North-South corridor Ramisi – Airport – Mombasa – Kilifi – Malindi (- Lamu) Travel time: Approx. 3h 45minutes (plus 2h 05minutes to Lamu)
Due to the distance and the estimated travel times of both branches of this line (Momba-sa-Ramisi: 1h 45minutes, Mombasa-Malindi: 2h), it would make sense to consider a mixed timetable with local trains (stop at all stations) and accelerated mid-distance ser-vices (stopping at the main stations only), particularly on the northern branch.
5.4.2 Corridor 2: Western corridor Mombasa – Mazeras – Voi

190 591.10
92 Kenya Railways Corporation KRC Mombasa Commuter Railways Feasibility Study KRC/PLM/40/2011 Final Report
Pöyry Switzerland Ltd.
Travel time: Approx. 2h 15minutes
5.4.3 Corridor 3: Western ring Mombasa – Mazeras – Kaloleni - Kilifi
Travel time: Approx. 1h 30minutes
5.4.4 Corridor 4: Eastern ring Likoni Ferry – Makupa – Junda – Bamburi - Kilifi Travel time: Approx. 1h 15minutes
5.5 Alternatives
5.5.1 Likoni corridor Instead of the initially proposed route for the line Mombasa – Ramisi avoiding the town of Likoni southwards, it would certainly make sense to let the line pass through Likoni with a station serving the town, and eventually some stops serving the industrial zone and the nearby harbours.
This will not cause a big travel time loss, but will allow serving a high population densi-ty area, with a harbour and industrial development perspectives. This could also lead to the generation of goods traffic.
5.5.2 Malindi - Lamu The Malindi to Lamu corridor is 204 Km long (Travel time: 2h 05minutes), and runs through an area with very low population density (e.g. between Gongoni and Garsen, there is a stretch of 80 Km without any planned station), so its suitability as commuter traffic line is quite questionable.
If this line would be built for other purposes (e.g. freight traffic), a combined exploita-tion with passenger trains would be possible. Instead, these would be possibly either long distance than commuter trains. These options should be analysed according the ex-pected level of passenger traffic.
5.5.3 Mazeras – Kaloleni - Takaungu This corridor also runs through an area with low population density, so its suitability as commuter traffic line is quite questionable. If this corridor would be built for other purposes (e.g. freight traffic), a combined ex-ploitation with passenger trains would be possible. This option should be analysed ac-cording the expected level of passenger traffic.

190 591.10
93 Kenya Railways Corporation KRC Mombasa Commuter Railways Feasibility Study KRC/PLM/40/2011 Final Report
Pöyry Switzerland Ltd.
5.6 Nodes, connections with long-distance services It is probable that there will be long-distance services on the corridors Mombasa – Voi (new standard-gauge line to Nairobi) and perhaps on Mombasa-Lamu (if theLamindi-Lamu corridor will be actually built, see chapter 5.2). These trains will normally be ter-minated at Mombasa main station, and that brings some shortcomings for their passen-gers: Passengers to Likoni Ferry or the Junda-Bamburi-Kilifi line (red line) must change
the train twice (in Mombasa main station and in Makupa)
Passengers to all other directions (with exception of the northern corridor to Kisauni-
Bamburi-Kilifi) will lose time as they will run twice (there and back) on the section Makupa-Mombasa main station.
From the network map, it is clear that Makupa is the only station where all commuter services and also the service to Nairobi are connected.

190 591.10
94 Kenya Railways Corporation KRC Mombasa Commuter Railways Feasibility Study KRC/PLM/40/2011 Final Report
Pöyry Switzerland Ltd.
For travellers to or from the Nairobi line, a stop in Makupa is also a better connecting possibility for travellers to or from the airport, this saving time in comparison to a con-nection in Mombasa main station. For these reasons, we propose that: Long-distance trains to or from the Nairobi corridor will make an additional stop in
Makupa before terminating in Mombasa main station. Long-distance trains to or from Lamu (if built) will not stop only at Mombasa main
station, but will be extended to Makupa and the airport (Stabling facilities will be necessary, ideally in the Airport to Likoni area)
Makupa can be designed as the central node for commuters and long-distance trains. The timetables for all trains can be designed to offer good connections in Makupa ra-ther than in Mombasa main station.
5.7 Train schedule
5.7.1 General The following travel time tables have been developed on the basis of the distance be-tween stations and the train speeds indicated. Allowance has been made for acceleration and deceleration according to the line speed. Each stop is assumed to last 2 minutes (in-cluded in the row “Interval time incl. Stop” on the following tables).
5.7.2 Mombasa – Airport – Likoni – Ramisi Service
Table 5.1: Travel Time Mombasa – Airport – Likoni – Ramisi Service
Station Mileage Interval Speed Ride time Ac-/De- celeration
Interval Time incl.
Stop Travel Time
Mombasa Main Station 00:00:49 00:00:49 00:00:49 01:46:53
2.5 Km 90 km/h 00:01:40 00:01:40 00:02:29 01:46:05

190 591.10
95 Kenya Railways Corporation KRC Mombasa Commuter Railways Feasibility Study KRC/PLM/40/2011 Final Report
Pöyry Switzerland Ltd.
Station Mileage Interval Speed Ride time Ac-/De- celeration
Interval Time incl.
Stop Travel Time
Makupa km 2.5 00:01:49 00:03:49 00:06:17 01:44:25 3.9 Km 100 km/h 00:02:20 00:02:20 00:08:38 01:40:36
Chaani km 6.4 00:01:49 00:03:49 00:12:26 01:38:16 2.9 Km 90 km/h 00:01:56 00:01:56 00:14:22 01:34:27
MOI International Airport km 9.3 00:01:49 00:03:49 00:18:11 01:32:31
6.9 Km 100 km/h 00:04:08 00:04:08 00:22:19 01:28:43 Tsunza km 16.2 00:02:00 00:04:00 00:26:19 01:24:34
5.5 Km 100 km/h 00:03:18 00:03:18 00:29:37 01:20:34 Dongo Kundu km 21.7 00:02:26 00:04:26 00:34:04 01:17:16
6.8 Km 120 km/h 00:03:24 00:03:24 00:37:28 01:12:50 Likoni km 28.5 00:02:53 00:04:53 00:42:20 01:09:26
4.7 Km 120 km/h 00:02:21 00:02:21 00:44:41 01:04:33 Magaoni km 33.2 00:02:53 00:04:53 00:49:34 01:02:12
6.7 Km 120 km/h 00:03:21 00:03:21 00:52:55 00:57:19 Waa km 39.9 00:02:53 00:04:53 00:57:48 00:53:58
6.0 Km 120 km/h 00:03:00 00:03:00 01:00:48 00:49:05 Tiwi km 45.9 00:02:53 00:04:53 01:05:41 00:46:05
6.1 Km 120 km/h 00:03:03 00:03:03 01:08:44 00:41:13 Ukunda km 52.0 00:02:53 00:04:53 01:13:37 00:38:10
8.9 Km 120 km/h 00:04:27 00:04:27 01:18:04 00:33:17 Mwabungu km 60.9 00:02:53 00:04:53 01:22:56 00:28:50
9.1 Km 120 km/h 00:04:33 00:04:33 01:27:29 00:23:57 Gazi km 70.0 00:02:53 00:04:53 01:32:22 00:19:24
7.0 Km 120 km/h 00:03:30 00:03:30 01:35:52 00:14:31 Msambweni km 77.0 00:02:53 00:04:53 01:40:45 00:11:01
9.4 Km 120 km/h 00:04:42 00:04:42 01:45:27 00:06:08 Ramisi km 86.4 00:01:26 00:01:26 01:46:53 00:01:26
01.46 h
5.7.3 Mombasa – Mtwapa – Kilifi – Malindi Service
Table 5.2: Travel Time Mombasa – Mtwapa – Kilifi – Malindi Service
Station Mileage Interval Speed Ride time Ac-/De- celeration
Interval Time incl.
Stop Travel Time
Mombasa Main Station 00:01:00 00:01:00 00:01:00 02:01:21
1.6 Km 100 km/h 00:00:58 00:00:58 00:01:58 02:00:21 Makadara km 1.6 00:02:26 00:04:26 00:06:24 01:59:23
2.5 Km 120 km/h 00:01:15 00:01:15 00:07:39 01:54:57 Kongowea km 4.1 00:02:53 00:04:53 00:12:32 01:53:42

190 591.10
96 Kenya Railways Corporation KRC Mombasa Commuter Railways Feasibility Study KRC/PLM/40/2011 Final Report
Pöyry Switzerland Ltd.
Station Mileage Interval Speed Ride time Ac-/De- celeration
Interval Time incl.
Stop Travel Time
2.6 Km 120 km/h 00:01:18 00:01:18 00:13:50 01:48:49 Freretown km 6.7 00:02:53 00:04:53 00:18:43 01:47:31
2.2 Km 120 km/h 00:01:06 00:01:06 00:19:49 01:42:38 Bamburi km 8.9 00:02:53 00:04:53 00:24:41 01:41:32
5.3 Km 120 km/h 00:02:39 00:02:39 00:27:20 01:36:40 Utange km 12.1 00:02:53 00:04:53 00:24:41 01:45:55
2.1 Km 120 km/h 00:01:03 00:01:03 00:25:44 01:41:02 Shimo la Tewa km 14.2 00:02:53 00:04:53 00:32:13 01:39:59
2.2 Km 120 km/h 00:01:06 00:01:06 00:33:19 01:35:07 Mtwape km 16.4 00:02:53 00:04:53 00:38:12 01:34:01
7.2 Km 120 km/h 00:03:36 00:03:36 00:41:48 01:29:08 Mwamba km 23.6 00:02:53 00:04:53 00:46:41 01:25:32
10.0 Km 120 km/h 00:05:00 00:05:00 00:51:41 01:20:39 Kibaoni km 33.6 00:02:53 00:04:53 00:56:34 01:15:39
14.0 Km 120 km/h 00:07:00 00:07:00 01:03:34 01:10:46 Takaungu km 47.6 00:02:53 00:04:53 01:08:26 01:03:46
6.8 Km 120 km/h 00:03:24 00:03:24 01:11:50 00:58:53 Kilifi km 54.4 00:02:53 00:04:53 01:16:43 00:55:29
6.3 Km 120 km/h 00:03:09 00:03:09 01:19:52 00:50:37 Mtondia km 60.7 00:02:53 00:04:53 01:24:45 00:47:28
23.3 Km 120 km/h 00:11:39 00:11:39 01:36:24 00:42:35 Uyombo km 84.0 00:02:53 00:04:53 01:41:17 00:30:56
9.8 Km 120 km/h 00:04:54 00:04:54 01:46:11 00:26:03 Watamu km 93.8 00:02:53 00:04:53 01:51:04 00:21:09
6.2 Km 120 km/h 00:03:06 00:03:06 01:54:10 00:16:16 Gede km 100.0 00:02:53 00:04:53 01:59:02 00:13:10
13.7 Km 120 km/h 00:06:51 00:06:51 02:05:53 00:08:17 Malindi km 113.7 00:01:26 00:01:26 02:07:20 00:01:26
02.13 h
5.7.4 Mombasa – Mazeras – Voi Service
Table 5.3: Travel Time Mombasa – Mazeras – Voi Service
Station Mileage Interval Speed Ride time Ac-/De- celeration
Interval Time incl.
Stop Travel Time
Mombasa Main Station 00:00:49 00:00:49 00:00:49 02:15:39
2.5 Km 90 km/h 00:01:40 00:01:40 00:02:29 02:14:50 Makupa km 2.5 00:01:37 00:03:37 00:06:06 02:13:10 2.9 Km 90 km/h 00:01:56 00:01:56 00:08:02 02:09:33

190 591.10
97 Kenya Railways Corporation KRC Mombasa Commuter Railways Feasibility Study KRC/PLM/40/2011 Final Report
Pöyry Switzerland Ltd.
Station Mileage Interval Speed Ride time Ac-/De- celeration
Interval Time incl.
Stop Travel Time
Changamwe km 5.4 00:01:49 00:03:49 00:11:50 02:07:37 3.6 Km 100 km/h 00:02:10 00:02:10 00:14:00 02:03:49 Mikindani km 9.0 00:02:26 00:04:26 00:18:26 02:01:39 3.5 Km 120 km/h 00:01:45 00:01:45 00:20:11 01:57:13 Miritini km 12.5 00:02:53 00:04:53 00:25:04 01:55:28 6.8 Km 120 km/h 00:03:24 00:03:24 00:28:28 01:50:35 Mazeras km 19.3 00:02:53 00:04:53 00:33:21 01:47:11 14.9 Km 120 km/h 00:07:27 00:07:27 00:40:48 01:42:18 Mariakani km 34.2 00:02:53 00:04:53 00:45:41 01:34:51 14.8 Km 120 km/h 00:07:24 00:07:24 00:53:05 01:29:58 Maji Ya Chumvi km 49.0 00:02:53 00:04:53 00:57:58 01:22:34 11.3 Km 120 km/h 00:05:39 00:05:39 01:03:37 01:17:41 Samburu km 60.3 00:02:53 00:04:53 01:08:29 01:12:02 13.5 Km 120 km/h 00:06:45 00:06:45 01:15:14 01:07:10 Taru km 73.8 00:02:53 00:04:53 01:20:07 01:00:25 10.8 Km 120 km/h 00:05:24 00:05:24 01:25:31 00:55:32 Mackinnon Road km 84.6 00:02:53 00:04:53 01:30:24 00:50:08 12.5 Km 120 km/h 00:06:15 00:06:15 01:36:39 00:45:15 Bachuma km 97.1 00:02:53 00:04:53 01:41:32 00:39:00 25.8 Km 120 km/h 00:12:54 00:12:54 01:54:26 00:34:07 Maungu km 122.9 00:02:53 00:04:53 01:59:19 00:21:13 29.8 Km 120 km/h 00:14:54 00:14:54 02:14:13 00:16:20 Voi km 152.7 00:01:26 00:01:26 02:15:39 00:01:26
02.15 h
5.7.5 Likoni Ferry – Bamburi Service
Table 5.4: Travel Time Likoni Ferry – Panga Service
Station Mileage Interval Speed Ride time Ac-/De- celeration
Interval Time incl.
Stop Travel Time
Likoni Ferry 00:01:00 00:01:00 00:01:00 00:30:53 1.7 Km 100 km/h 00:01:01 00:01:01 00:02:01 00:29:53 Cruise Pier km 1.7 00:02:00 00:04:00 00:06:01 00:28:52 3.0 Km 100 km/h 00:01:48 00:01:48 00:07:49 00:24:52 Makupa km 4.7 00:02:00 00:04:00 00:11:49 00:23:04 4.2 Km 100 km/h 00:02:31 00:02:31 00:14:20 00:19:04 Junda km 8.9 00:02:00 00:04:00 00:18:20 00:16:32 2.1 Km 100 km/h 00:01:16 00:01:16 00:19:36 00:12:32 Kengelani Road km 11.0 00:02:00 00:04:00 00:23:36 00:11:17

190 591.10
98 Kenya Railways Corporation KRC Mombasa Commuter Railways Feasibility Study KRC/PLM/40/2011 Final Report
Pöyry Switzerland Ltd.
Station Mileage Interval Speed Ride time Ac-/De- celeration
Interval Time incl.
Stop Travel Time
2.1 Km 100 km/h 00:01:16 00:01:16 00:24:52 00:07:17 Mtopanga km 13.1 00:02:00 00:04:00 00:28:52 00:06:01 1.7 Km 100 km/h 00:01:01 00:01:01 00:29:53 00:02:01 Bamburi km 14.8 00:01:00 00:01:00 00:30:53 00:01:00
00.30 h
5.7.6 Mazeras – Kaloleni – Takaungu Service
Table 5.5: Travel Time Mazeras – Kaloleni – Takaungu Service
Station Mileage Interval Speed Ride time Ac-/De- celeration
Interval Time incl.
Stop Travel Time
Mazeras 00:01:00 00:01:00 00:01:00 00:49:01 11.0 Km 100 km/h 00:06:36 00:06:36 00:07:36 00:48:01 Mkapuni km 11.0 00:02:00 00:04:00 00:11:36 00:41:25 4.9 Km 100 km/h 00:02:56 00:02:56 00:14:32 00:37:25 Kambe km 15.9 00:02:00 00:04:00 00:18:32 00:34:29 4.6 Km 100 km/h 00:02:46 00:02:46 00:21:18 00:30:29 Kaloleni km 20.5 00:02:00 00:04:00 00:25:18 00:27:43 13.0 Km 100 km/h 00:07:48 00:07:48 00:33:06 00:23:43 Kidutani km 33.5 00:02:00 00:04:00 00:37:06 00:15:55 18.2 Km 100 km/h 00:10:55 00:10:55 00:48:01 00:11:55 Takaungu km 51.7 00:01:00 00:01:00 00:49:01 00:01:00 00.49 h
5.7.7 Malindi – Lamu Service
Table 5.6: Travel Time Malindi – Lamu Service
Station Mileage Interval Speed Ride time Ac-/De- celeration
Interval Time incl.
Stop Travel Time
Malindi 00:01:26 00:01:26 00:01:26 02:04:51 22.0 Km 120 km/h 00:11:00 00:11:00 00:12:26 02:03:25 Gongoni km 22.0 00:02:53 00:04:53 00:17:19 01:52:25 80.0 Km 120 km/h 00:40:00 00:40:00 00:57:19 01:47:32 Garsen km 102.0 00:02:53 00:04:53 01:02:12 01:07:32 40.0 Km 120 km/h 00:20:00 00:20:00 01:22:12 01:02:39 Witu km 142.0 00:02:53 00:04:53 01:27:05 00:42:39 30.0 Km 120 km/h 00:15:00 00:15:00 01:42:05 00:37:46 Mkunumbu km 172.0 00:02:53 00:04:53 01:46:58 00:22:46 32.9 Km 120 km/h 00:16:27 00:16:27 02:03:25 00:17:53

190 591.10
99 Kenya Railways Corporation KRC Mombasa Commuter Railways Feasibility Study KRC/PLM/40/2011 Final Report
Pöyry Switzerland Ltd.
Station Mileage Interval Speed Ride time Ac-/De- celeration
Interval Time incl.
Stop Travel Time
Hindi km 204.9 00:01:26 00:01:26 02:04:51 00:01:26
02.04 h
5.8 Staffing and organization Three kinds of staff are envisaged for the operation of the Mombasa Commuter Rail-way, namely station staff, maintenance staff and train staff.
The stations are manned according to their size and importance as follows: Station Cat. 1 24 Station Cat. 2 18 Station Cat. 3 14 Station Cat. 4 11 Station Cat. 5 7
Between 600 and 800 staff in total will be required for the complete project develop-ment The staffing required at the maintenance facilities will grow with the number of train-sets and length of line to be maintained, and is expected to reach a maximum of 50 per-sons.
Each train set will be operated with a crew of 1 driver, 1 conductor, 1 attendant and 1 security guard. With two shifts and one crew on standby a total staff of 10 is required. This will result in a total train staff in the range from 360 to 480. Additional staffing will be required to cover management functions, marketing, eventual freight operations, etc. An organizational structure can only be proposed once a regulatory framework for the new commuter railway is in place and the ownership and operational concept estab-lished.
5.9 Maintenance concept As any infrastructure asset, railways must keep up with periodic inspection and mainte-nance in order to maintain their functionality and minimize the effects of infrastructure failures that can disrupt services.
Railway capacity is fundamentally considered a network system, and as a result, many components are causes and effects of system disruptions. The maintenance philosophy must therefore address the system as a whole. The maintenance shall be based on the “RAMS” (Reliability, Availability, Maintainabil-ity, Safety) concept in order to ensure the safety, functionality and quality of the rail in-frastructure and rolling stock throughout their life-cycles.
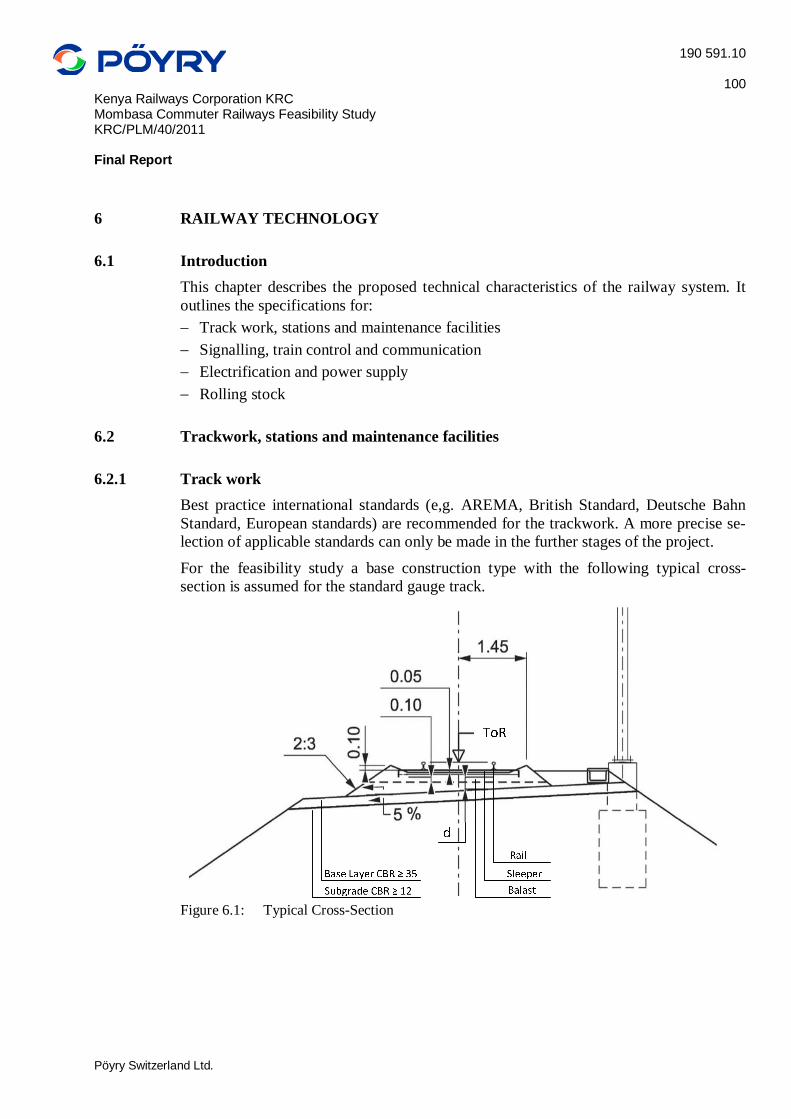
190 591.10
100 Kenya Railways Corporation KRC Mombasa Commuter Railways Feasibility Study KRC/PLM/40/2011 Final Report
Pöyry Switzerland Ltd.
6 RAILWAY TECHNOLOGY
6.1 Introduction This chapter describes the proposed technical characteristics of the railway system. It outlines the specifications for: Track work, stations and maintenance facilities Signalling, train control and communication Electrification and power supply Rolling stock
6.2 Trackwork, stations and maintenance facilities
6.2.1 Track work Best practice international standards (e,g. AREMA, British Standard, Deutsche Bahn Standard, European standards) are recommended for the trackwork. A more precise se-lection of applicable standards can only be made in the further stages of the project.
For the feasibility study a base construction type with the following typical cross-section is assumed for the standard gauge track.
Figure 6.1: Typical Cross-Section

190 591.10
101 Kenya Railways Corporation KRC Mombasa Commuter Railways Feasibility Study KRC/PLM/40/2011 Final Report
Pöyry Switzerland Ltd.
The following assumptions are made: The axle loads for the railway vehicles will be between 17 and 20 tonnes Prestressed concrete sleepers will be used The width at formation level is 8.00m The average earthwork slope (for volume calculation purposes) is 1:2
6.2.2 Stations The stations shall be located so as to provide easy pedestrian and vehicular access, and will include sheltered platforms and general facilities suited to the passenger volumes and the requirements of the line operation. Junction stations shall be designed to allow for easy flow of passengers and goods between the trains. The platforms shall be built, as far as possible, along straight stretches of rail and their lengths shall be commensu-rate to the planned lengths of the trains. All stations shall be planned so as to allow for a future second track. End of section stations and crossing stations shall be built with two tracks. The station areas shall be suitable lit and protected with adequate fencing.
Station types:
Type 1:
Train stops, 1 platform. Country stations with few passengers
Type 2:
Station with 2 tracks, 2 platforms (1 between the tracks). Pedestrian gangways to the central plat-form. Suited for stations with train crossings or as ter-minal station of a service. Possibility for the pas-sengers to change the train easily from the one to the other edge of the central platform without crossing the tracks. This station type will also be used for junction sta-tions
Type 3:
Station with 2 tracks, 2 platforms outside of the tracks. Pedestrian underground gangway between the 2 platforms. Each platform is normally to be dedicated to a direction of travel. Suited for stations with heavy passenger traffic, but with few or no passengers changing the train to the opposite direction. Possibility for the pas-

190 591.10
102 Kenya Railways Corporation KRC Mombasa Commuter Railways Feasibility Study KRC/PLM/40/2011 Final Report
Pöyry Switzerland Ltd.
sengers to change the train without crossing the tracks by using the underground gangway.
6.2.3 Maintenance facilities
6.2.3.1 General The new commuter railway network around the city of Mombasa will need appropriate maintenance facilities. The new facilities shall be designed to handle the envisaged operation and maintenance activities for rolling stock and rail infrastructure, and have a final capacity to meet the expected maximum fleet size of commuter rail vehicles.
The activities to be carried out at the new facilities are essentially: Daily control, interior cleaning and external cleaning Stabling of vehicles (after or between services) Workshop for planned maintenance and minor repairs It will also serve as base for the future maintenance of the rail infrastructure Initially it could serve as base for the construction of the rail infrastructure
The maintenance facilities for the rail infrastructure could later be complemented by service centres at suitable locations along the lines, thus enabling simple railway track maintenance work to be carried out from local bases.
The planning of the new facilities shall take into consideration the needs of the parties involved, i.e. the operator, the maintenance organisation including subcontractors and owner.
6.2.3.2 Planning basis The following items shall be taken into consideration for the planning and design of the facilities: Site conditions
Location Access Utilities
Capacity (Staged and final) Railway vehicles (Indoor, outdoor) Track-bound special maintenance vehicles (Indoor) Special maintenance vehicles (garage) Cars (outdoor parking)
Facility management Design requirements Filling station for diesel units

190 591.10
103 Kenya Railways Corporation KRC Mombasa Commuter Railways Feasibility Study KRC/PLM/40/2011 Final Report
Pöyry Switzerland Ltd.
6.2.3.3 Process oriented aspects (Functional description) The following processes and functions shall be taken into consideration: Work flow Tracks and assigned functions Work flow for road traffic, supply and deliveries Movement of persons Organisation

190 591.10
104 Kenya Railways Corporation KRC Mombasa Commuter Railways Feasibility Study KRC/PLM/40/2011 Final Report
Pöyry Switzerland Ltd.
6.3 Signalling and train control
6.3.1 Purpose of this section This section presents an evaluation with recommendations of suitable signalling and au-tomatic train protection systems (ATP) for the planned new commuter railway network in Mombasa.
6.3.2 Conditions
6.3.2.1 General conditions The Kenya Railways Corporation (KRC) is planning a new commuter railway network in the city of Mombasa. This network will have the following characteristics: Standard gauge Line length of approx. 600 Km Single-track, extension to double track possible in a later phase Not electrified, electrification possible in a later phase Excepted for some mixed-gauge sections for standard and metre-gauge trains, no
connection with the existing metre-gauge network Exploitation with commuter MUs only (Goods and long-distance traffic may be to
considerate in the future) Expected traffic: about 0.5 - 2 trains hourly on each directions and each branch The first lines are expected to be taken in service in 2017
6.3.2.2 Specific conditions Due to the heavy problems experienced with cable theft, material theft and general van-dalism, fixed installations and in particular trackside installations and wiring must be limited to a minimum. Light signals must be avoided. Cab-signalling is mandatory by these conditions.
6.3.3 ETCS system levels The European Train Control System ETCS is a standardised train protection system de-veloped to allow the compatibility and cross-border interoperation of trains and engines in Europe. There are 3 levels suited for different traffic cases, all offering a comparable high safety level (SIL 4). As a European standardised system with defined interfaces, the customer will not be tied to a particular provider, as with use of a proprietary system. Both line and train equipment can be chosen from different providers without interoperability problems.
There are also several systems based on ETCS hardware or software on the market, but they have not been included in these considerations: In order to avoid purchasing and maintenance problems in the future, proprietary systems should be avoided in favour of

190 591.10
105 Kenya Railways Corporation KRC Mombasa Commuter Railways Feasibility Study KRC/PLM/40/2011 Final Report
Pöyry Switzerland Ltd.
systems complying with international (or European) standards. This allows the purchase of hard- and software for vehicles and trackside from different manufacturers if neces-sary.
6.3.3.1 ETCS Level 1
Figure 6.2: Principe schema ETCS Level 1
Trackside signals needed, no cab signaling. The driver gets his movement authority from the trackside signals.
Trackside train detection (track circuits, axle counters) needed Fixed blocks: The train is allowed to enter a block section only when there is no oth-
er train on it. Intermittent transmission to train using balises and loops (The train gets information
only when it passes a balise / loop) (Radio infill using GSM-R possible)

190 591.10
106 Kenya Railways Corporation KRC Mombasa Commuter Railways Feasibility Study KRC/PLM/40/2011 Final Report
Pöyry Switzerland Ltd.
Figure 6.3: Example of balises, Hatfield (Pretoria) 9.12.2011
ETCS Level 1 is basically an ATP system designed to be installed on an existing signal system with none or out-of-design ATP system. It is already used in commercial opera-tion in several European countries.
6.3.3.2 ETCS Level 2
Figure 6.4: Principe schema ETCS Level 2
Cab signalling, no trackside signals needed (only trackside panels indicating the train stop locations). The driver gets his movement authority directly from the ETCS dis-play (see example picture below).
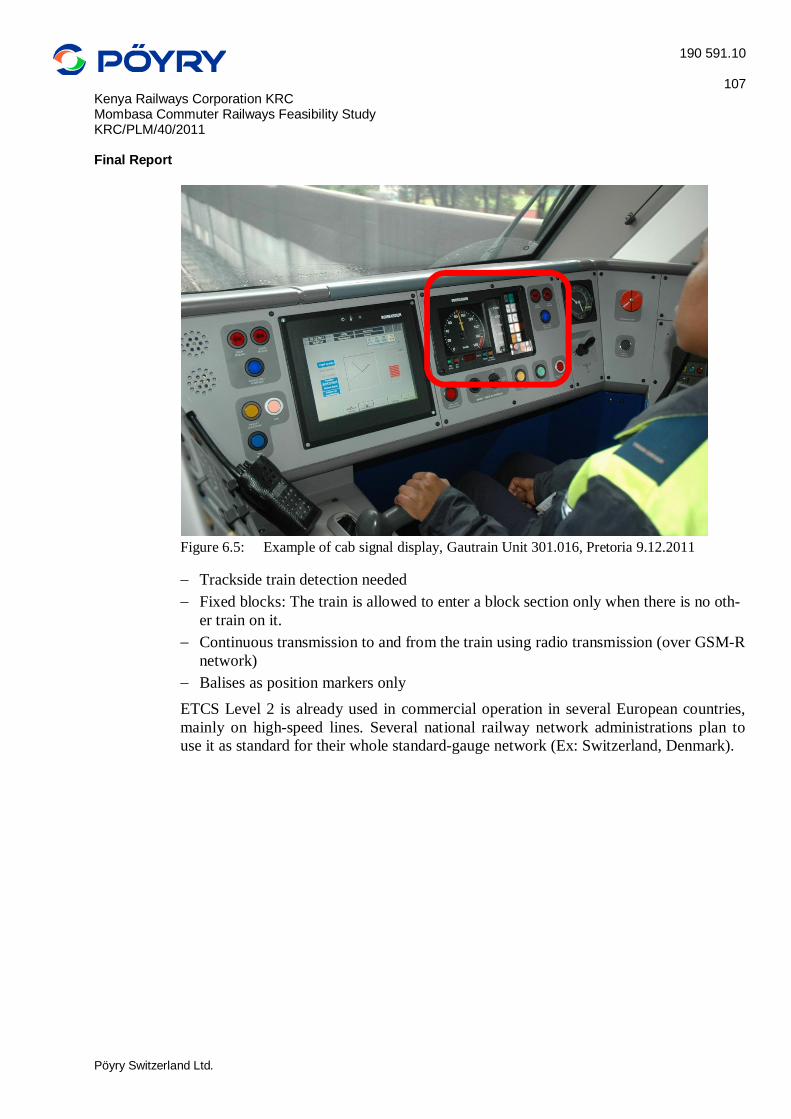
190 591.10
107 Kenya Railways Corporation KRC Mombasa Commuter Railways Feasibility Study KRC/PLM/40/2011 Final Report
Pöyry Switzerland Ltd.
Figure 6.5: Example of cab signal display, Gautrain Unit 301.016, Pretoria 9.12.2011
Trackside train detection needed Fixed blocks: The train is allowed to enter a block section only when there is no oth-
er train on it. Continuous transmission to and from the train using radio transmission (over GSM-R
network) Balises as position markers only
ETCS Level 2 is already used in commercial operation in several European countries, mainly on high-speed lines. Several national railway network administrations plan to use it as standard for their whole standard-gauge network (Ex: Switzerland, Denmark).

190 591.10
108 Kenya Railways Corporation KRC Mombasa Commuter Railways Feasibility Study KRC/PLM/40/2011 Final Report
Pöyry Switzerland Ltd.
6.3.3.3 ETCS Level 3
Figure 6.6: Principle schema ETCS Level 3 / ERTMS Regional
Cab signaling, no trackside signals needed. The driver gets his movement authority directly from the ETCS display
Trackside train detection needed only at special locations. The train position is de-termined by the train borne odometry, resettled by balises for way correction, and transmitted by the train to the interlocking.
Moving blocks: Trains can follow each other in braking distance depending of speed, no fixed stopping locations
Continuous transmission to and from the train using radio transmission (over GSM-R network)
Balises as position markers only. They may be located mainly or only in the station areas.
Proof of train integrity needed, either using trains with fixed composition or by using end of train reporting devices (like, for example, FRED. See also chapter 6.3.5.2)
ETCS Level 3 is actually used on the Västerdal line in Sweden (see also the next chap-ter 6.3.3.4 “ERTMS Regional”)
6.3.3.4 ERTMS Regional ERTMS Regional is a further development of ETCS Level 3 as a reduced-cost system without loss of safety, using GSM-R radio transmission to control also all trackside el-ements (points, level crossings, etc.), this allowing great savings in the trackside equip-ment and in particular in the trackside wiring. It has been designed initially for regional or low-density lines, but can also be used on lines with higher speed or traffic level. ERTMS Regional is actually (05/2013) used in commercial operation only on the Väs-terdal line in Sweden. See also:

190 591.10
109 Kenya Railways Corporation KRC Mombasa Commuter Railways Feasibility Study KRC/PLM/40/2011 Final Report
Pöyry Switzerland Ltd.
http://publikationswebbutik.vv.se/upload/6424/100456_ERTMS_on_the_vasterdal_line_utg2_201204.pdf http://publikationswebbutik.vv.se/upload/5940/100236_ertms_regional_eng.pdf
The implementation of further lines is planned in a near future (particularly in Sweden)
6.3.4 Further development There are studies from the industry for the possibility of removing the positioning balis-es and replacing them with “virtual balises”, by using GPS tracking. This will allow an exact positioning of the trains, without the odometry problems, but the technology is not yet available (To be expected in approx. 5 to 10 years).
Figure 6.7: Principle schema ETCS Level 3 / ERTMS Regional with GPS tracking
6.3.5 Open questions about ETCS Levels 2 / 3 / ERTMS Regional
6.3.5.1 Loss of radio communication ETCS Level 2, 3 and ERTMS Regional are radio communication based train protec-
tion systems. Communication loss can occur if the train is in an area with no coverage between 2
stations (“Dark territory”), or if the train ATP is defective.
Solutions: Satellite communication: This solution would be technically suitable, as it gives an
uninterrupted communication on all points of the network (excepted in tunnels), but it would be very costly in the exploitation.
“Dark territory management”: In case of a loss of communication, CCT has no information about the exact posi-tion of the train, but it knows the approximated location (anywhere on a track sec-tion between 2 stations) and the approximated time, when the train should normally

190 591.10
110 Kenya Railways Corporation KRC Mombasa Commuter Railways Feasibility Study KRC/PLM/40/2011 Final Report
Pöyry Switzerland Ltd.
reach the next station or radio covered area, according the last speed and location information sent by the train before losing the communication. As long as the “normal” time to reach the next station is not over, the track section is considerate as occupied (Normal mode). If the time to reach the next station or covered area (+ safety factor) is over without communication with the train, the track section changes to the “Undefined” mode. Trains can enter this section only on sight, and the “lost” train will also have to stop or carry on travelling on sight (this depending of the regulations, which will have to be defined in a later phase of the project). In addition, it would be useful to install axle counters in the stations giving access to dark territories, this allowing recognising a train with non-working radio equipment when it enters a station, and then releasing the corresponding track section. This train will then have to stop at the station and contact CCT for instructions. Example:
Figure 6.8: Principle of “Dark territory management”
As these axle counters will be installed in stations only (guarded areas), theft and vandalism against them can be prevented. With this solution, the dark territories will not be a safety problem, and the installa-tion of radio relay stations between the stations (in unsafe areas) will not be neces-sary.
6.3.5.2 Train integrity check ETCS Level 3 and ERTMS Regional were basically designed for lines with low level
of traffic, where only multiple units (DMUs or EMUs) are used. They require a train integrity check by the train itself. If there are multiple units in service, this is not a problem, as the train integrity can be checked by means of internal wiring in the train, and additional measures are not needed. Instead, if there is also traffic with locomotive-hauled trains with variable composi-tion (For instance: goods trains), the train integrity must be controlled by other means.
Solutions: Integrity acknowledgment by the driver (eventually with help of the local station
personal): We would NOT recommend this solution, as it needs the train or station personal to control the entire length of the train if it is complete. This may not only

190 591.10
111 Kenya Railways Corporation KRC Mombasa Commuter Railways Feasibility Study KRC/PLM/40/2011 Final Report
Pöyry Switzerland Ltd.
lead to errors, but it is also possible for the driver to give the acknowledgment with-out having actually checked the integrity.
End of train devices: System using an emitting device located on the last vehicle of the train (Example: system FRED / Wilma, widely used on US railroads), allowing the train ATP to check the distance between head and end of train, and giving an alert if this distance reaches an incorrect value (Ex: coupling broken, wagon(s) lost). This system is technically suitable and safe-proof, but it needs to always have the end of train device correctly fitted on the last vehicle. These devices could be an interest-ing target for thieves or vandals, so this solution is not recommended for this project.
Axle counters (Same devices like in the precedent chapter 6.3.5.1): These can safely and automatically check the integrity of a train by counting the number of axles en-tering / exciting a track section. It would then be necessary to install them not only at stations giving access to dark territories, but generally on all entry / exit tracks of all stations (or at least, on the lines where locomotive hauled trains can be expected). If a train then leaves a track section without having the correct axle amount (Wagons lost), CCT can block the corresponding track section (Undefined mode) and give an alert to the driver.
6.3.5.3 Gauge sharing On the Mombasa network, some sections will be shared with the existing metre-gauge railway network, by means of 3-rail tracks (mixed standard / metre gauge). In particular, the bridge Makupa – Changawme (Mombasa-Mazeras corridor), the tracks in the area between Chaani, Makupa and Mikindani (industrial tracks) and some sections of the line Mombasa-Voi may be equipped this way.
If they are not equipped with ATP, the trains of the metre-gauge network running on the standard-gauge lines fitted with ATP will be detected only by the axle counters, but a permanent positioning will not occur (CTC will only know that there is a train anywhere on the section, but where exactly?). A much heavier issue is that these trains will not be controlled by ATP, a braking cannot be automatically released, and these trains will be actually permanently in full staff responsible mode.
This problem will occur independently of the chosen ATP system for the commuter network.
Solutions: Metre-gauge trains without ATP: This means that the metre-gauge trains running
on the commuter rail system will be totally out of control of CTC, being permanently in staff responsible mode. The drivers will get no MA information (no trackside sig-nals!) and will have to navigate blind on a network with heavy commuter traffic. This solution would be VERY hazardous and is to reject.
Equipment of all metre-gauge motive power with the commuter railway’s ATP sys-tem: This would be by far the best solution, but may be a costly one.
Equipment of selected metre-gauge motive power with the commuter railway’s ATP system: This would be a suitable solution, but the access to the commuter net-work will need to be strictly controlled, as no metre-gauge engine without ATP will

190 591.10
112 Kenya Railways Corporation KRC Mombasa Commuter Railways Feasibility Study KRC/PLM/40/2011 Final Report
Pöyry Switzerland Ltd.
be allowed to access the network (= CTC will have to be able to distinguish if a train requesting to enter the network is equipped or not, and if not will have to be redirect it on pocket tracks or, in case of emergency, on derailers)
Equipment of metre-gauge “pilot” engines with the commuter railway’s ATP system: These pilots will be coupled in front of the metre-gauge engines entering the network, and can consist of light or older locomotives equipped with ATP. Their purpose will be to communicate with CTC, giving position, informing the driver with MA’s and releasing emergency braking if necessary. No metre-gauge train will be al-lowed to enter the network without pilot. Like in the case above, CTC must be able to discriminate trains with or without pilot, and then grant or reject access to the net-work.
6.3.5.4 Theft / Vandalism ETCS Level 3 and ERTMS Regional are designed with a highly reduced amount of trackside installation and wiring, in particular: No trackside signals No trackside wiring No track equipment out of the stations
For these reasons, ETCS level 3 will offer only few targets to thieves and vandals, as there will be no “interesting” equipment outside of guarded station areas.
6.3.6 PTC (Positive Train Control) The Positive Train Control PTC is a signalling and ATP system developed for the American railway operators, following a bill (Rail Safety Improvement Act, published 16 October 2008) requesting the equipment of all US main railway lines with ATP until 2015.
Information about this system has been requested by potential providers, but no details have been received so far.
6.3.7 System recommendation Here are recommendations regarding which system would be the best suitable for this project: ETCS Level 1 needs trackside train detection and also trackside signals, which
should be avoided for this project. For this reason, we do not recommend it. ETCS Level 2 needs no trackside signals, but needs trackside train detection on the
whole network. It would be useable, but not optimal. ETCS Level 3 needs neither trackside signals nor trackside train detection, excepted
on particular locations. Balises are still needed, but only for train positioning. ERTMS Regional needs almost no trackside data wiring, excepted on particular loca-
tions.

190 591.10
113 Kenya Railways Corporation KRC Mombasa Commuter Railways Feasibility Study KRC/PLM/40/2011 Final Report
Pöyry Switzerland Ltd.
ETCS Level 3 with GPS tracking needs neither trackside signals nor trackside train detection, excepted on particular locations. Also balises are no longer needed, but the technology is not yet available.
PTC: So far no concrete information has been obtained from providers.
For these reasons, we recommend the use of the combination of: ETCS Level 3 GPS tracking (if available when the construction work actually starts) ERTMS Regional Additional measures due to the specific exploitation characteristics (Axle counters,
and other to be defined)
PTC may be an alternative, but this can be only be analysed when detailed information about this system is available.
6.4 Data transmission network
6.4.1 Purpose The data transmission network will ensure the data and voice transmission between: CTC Stations Trains Mobile users (Handheld “mobile phones” for station personal, track worker teams,
track inspectors, security guards, etc.) It has to be a dedicated network, as the public GSM of wired networks doesn’t ensure the needed availability and transmission reliability for security sensible purposes.
6.4.2 Network architecture The data transmission network will be divided in 2 transmission levels, similar to the architecture of most public mobile phone networks: CTC to stations / stations to stations: By a backbone network (Ex: communication by
microwave links. A wired network can’t be used here because of the cable theft prob-lem)
Stations to trains and mobile users: by GSM-R or a similar system. The stations act here as interfaces between backbone and GSM-R

190 591.10
114 Kenya Railways Corporation KRC Mombasa Commuter Railways Feasibility Study KRC/PLM/40/2011 Final Report
Pöyry Switzerland Ltd.
Figure 6.9: Network architecture

190 591.10
115 Kenya Railways Corporation KRC Mombasa Commuter Railways Feasibility Study KRC/PLM/40/2011 Final Report
Pöyry Switzerland Ltd.
6.4.3 Data transmission Example (not exhaustive) of the data transmitted over the transmission network:
Table 6.1: Data Transmission Types To:
From: CTC Stations Trains Mobile users
CTC - - Switch move
orders - PIS data - Voice
- Movement Au-thorities
- Voice
- Train movement alerts
- Voice
Stations
- Gen. Feedbacks - Switch positions - Track occupan-
cy - SCADA - Local requests - Voice
- Voice - Voice - Voice
Trains - Position info - Speed info - Gen. Feedbacks - Voice
- Voice - Voice - Voice
Mobile users
- Track occupan-cy requests
- Voice
- Voice - Voice - Voice
In particular: Any user connected to the network is normally able to contact any other one for ver-
bal communication (Access restrictions may be defined). All non-verbal communication is centralised to CTC CTC gives all switch movement orders to the stations, and gets feedback over the po-
sition and status of the switches. The stations may have the possibility to be locally operated, either by sending switch and train movement requests to CTC or by direct control of the locally connected elements (but only in emergency case, under staff re-sponsibility!)
CTC gives the movement authorities to the trains, and gets feedback over the actual position, speed and general status of them.
Mobile users may request track locking for works on the track, either by contacting a CTC operator by phone, or by requesting it directly by data transmission. CTC then grants the track lock and gives the authorisation to walk the track for works.
CTC may also send train approaching alerts when a train is nearing the actual posi-tion of the mobile user.

190 591.10
116 Kenya Railways Corporation KRC Mombasa Commuter Railways Feasibility Study KRC/PLM/40/2011 Final Report
Pöyry Switzerland Ltd.
6.4.4 Available systems
6.4.4.1 GSM-R GSM-R (Global System for Mobile Communications – Rail) is a communication system carrying voice and data for mobile users (persons and trains). It is a direct derivate of GSM (standard for commercial mobile phone communication) with specific adaptations for railway traffic purposes. GSM-R is widely used on the most railways systems in Europe for voice and data communication, including ETCS L2 and L3 applications in several countries.
6.4.4.2 Tetra Tetra (TErrestrial Trunked RAdio) is a system initially developed for public services transmissions (Police, fire departments, emergency services, public transports, etc.), and is widely used worldwide. It is also used to transmit data for ATP applications (also ETCS L3) in several countries
6.5 Electrification and power supply As part of this study the possibility of the electrification of the new railway lines was investigated. The following key data have been taken into account: Development plans 2030 Headway between trains approx. 120 min Maximum speed 120km/h Maximum inclination 25 ‰ Trains with double composition will be used Power consumption per train is approx. 2000kW 2 Trains within one electrical section are considered
6.5.1 Energy supply It is assumed that the power will be supplied by the national grid with sufficient and se-cure power available. The availability of a power grid near the required supply points for the railway electrification and the sufficiency of the power source is not part of this study and was not further investigated.
An independent power supply grid built and operated by KRC would be an alternative but would require additional investments and organizational engagement.
6.5.2 Selection of traction power supply system Commuter railways are usually electrified with AC or DC traction power supply and an overhead contact wire system (catenary system). With DC systems usually lower volt-ages are applied (750V, 1500V, 3000V) than for AC systems which is preferred in rural
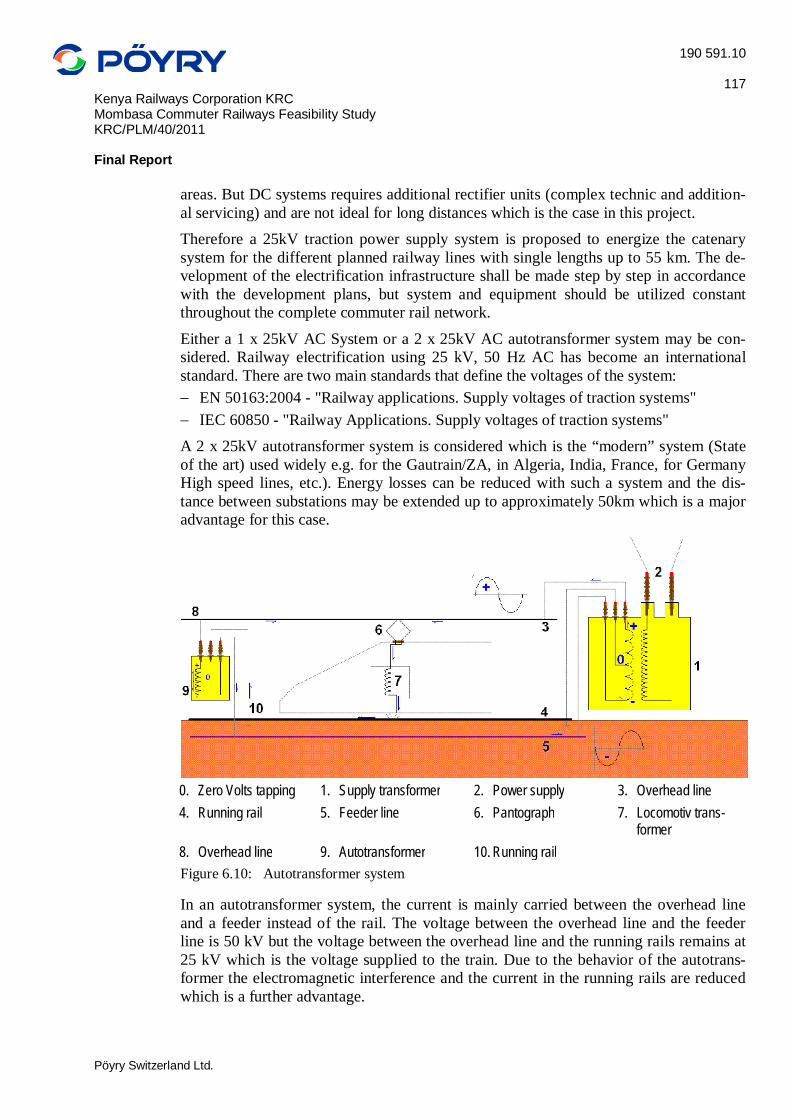
190 591.10
117 Kenya Railways Corporation KRC Mombasa Commuter Railways Feasibility Study KRC/PLM/40/2011 Final Report
Pöyry Switzerland Ltd.
areas. But DC systems requires additional rectifier units (complex technic and addition-al servicing) and are not ideal for long distances which is the case in this project. Therefore a 25kV traction power supply system is proposed to energize the catenary system for the different planned railway lines with single lengths up to 55 km. The de-velopment of the electrification infrastructure shall be made step by step in accordance with the development plans, but system and equipment should be utilized constant throughout the complete commuter rail network.
Either a 1 x 25kV AC System or a 2 x 25kV AC autotransformer system may be con-sidered. Railway electrification using 25 kV, 50 Hz AC has become an international standard. There are two main standards that define the voltages of the system: EN 50163:2004 - "Railway applications. Supply voltages of traction systems" IEC 60850 - "Railway Applications. Supply voltages of traction systems"
A 2 x 25kV autotransformer system is considered which is the “modern” system (State of the art) used widely e.g. for the Gautrain/ZA, in Algeria, India, France, for Germany High speed lines, etc.). Energy losses can be reduced with such a system and the dis-tance between substations may be extended up to approximately 50km which is a major advantage for this case.
0. Zero Volts tapping 1. Supply transformer 2. Power supply 3. Overhead line 4. Running rail 5. Feeder line 6. Pantograph 7. Locomotiv trans-
former 8. Overhead line 9. Autotransformer 10. Running rail Figure 6.10: Autotransformer system
In an autotransformer system, the current is mainly carried between the overhead line and a feeder instead of the rail. The voltage between the overhead line and the feeder line is 50 kV but the voltage between the overhead line and the running rails remains at 25 kV which is the voltage supplied to the train. Due to the behavior of the autotrans-former the electromagnetic interference and the current in the running rails are reduced which is a further advantage.

190 591.10
118 Kenya Railways Corporation KRC Mombasa Commuter Railways Feasibility Study KRC/PLM/40/2011 Final Report
Pöyry Switzerland Ltd.
6.5.3 Substations For the railway development considered in this study an estimated 9 to 10 substations are required. The substations shall be supplied from the 132 kV national grid (three-phase distribution system) and shall be utilized as redundant systems (high voltage and traction substation equipment).
At the grid substation, a transformer is connected across two of the three phases of the high-voltage supply. The transformer (autotransformer) lowers the voltage to 25 kV which is supplied to the switching stations located beside the tracks. In the switching stations electrical energy can be distributed to different feeding sections or feeding sec-tions can be energized or de-energized. In addition paralleling substations may be con-nected in parallel to the feeding stations.
6.5.4 Overhead contact wire system The electric power is supplied from the railway feeder station to an overhead line sys-tem (catenary system) constructed on poles (concrete, steel) along the track. The trains collect the traction power via a pantograph from the lowest wire of the overhead contact system, the contact wire. The pantographs are electrically conductive and allow current to flow through to the train back to the feeder station through the steel wheels on the running rails. Non-electric trains (diesels) may pass along these tracks without affecting the overhead line.
Figure 6.11: Overhead contact lines on individual supports using concret poles.
6.5.5 Remote control centre To operate the traction power supply system for the electrification it is obvious to in-clude a centralized remote control centre to which all stations are connected. In addition, it is recommended that substations are manned.
190 591.10
119 Kenya Railways Corporation KRC Mombasa Commuter Railways Feasibility Study KRC/PLM/40/2011 Final Report
Pöyry Switzerland Ltd.
6.5.6 Operation and maintenance For regular maintenance and troubleshooting trained maintenance and emergency ser-vice groups are required and have to be scheduled in the operation plans. Special maintenance vehicles and equipment is useful and recommended.
6.5.7 Risks, mitigation Electrical (overhead line) systems imply additional accident risks if not treated respect-fully and with the necessary care. Especially in rural areas the population may not be aware of the risks and danger and have to be informed and advised. Overhead contact lines and electrical substation equipment mainly consist of copper or aluminium conductors and cables and steel structures, materials which are attracting and inviting for theft, a worldwide well known and increasing problem. To keep resulting accidents and damages within a limit, it might be necessary to look for special precau-tions, e.g. fencing along the track. Video surveillance (CCTV) cannot avoid but may help to reduce such incidents and the resulting breakdowns and damages.
6.6 Rolling stock
6.6.1 General The new commuter rail system envisaged for the city and region of Mombasa should ideally support both urban and regional travel, i. e. trips made within the city over short distances and also trips between the city and regional towns and settlements. The system will accordingly comprise corridors in the built-up environment of Mombasa, and po-tentially other urban areas, as well as typical mainline railway alignments in the coun-tryside.
6.6.2 Train configuration It is assumed that the rolling stock will be based on diesel multiple units (DMUs) or electric multiple units (EMUs). These cars have multiple prime movers (either diesel engines or electric motors) for each car, i.e. the same car that carries passengers also has the motive power, as opposed to conventional trains where the passengers are in coach-es that are not self-propelling and a locomotive hauls the train. DMUs and EMUs are used as single units, or in multiple train operation. DMU length starts at single unit of 22 to 26 metres length, whereas EMUs are hardly shorter than 70 to 100 m, equivalent to 3 to 5 coaches / modules.
Maximum train length is in both cases around 12 to 16 coaches.

190 591.10
120 Kenya Railways Corporation KRC Mombasa Commuter Railways Feasibility Study KRC/PLM/40/2011 Final Report
Pöyry Switzerland Ltd.
Figure 6.12: Typical configuration schema of rolling stock for commuter rail
6.6.3 Capacity Capacities of up to 200 passengers per coach are achievable, under crush loading condi-tions. Total capacity of a train with 15 coaches may be up to 3,000 passengers. The capacity of the same train in the regional network would be only around half of the above, as crush loading would only be acceptable over short distances (e. g. for inner-city travel).
With train intervals not shorter than 10 minutes, maximum train length and crush load-ing, the achievable line capacity could theoretically arrive at ~18,000 passengers per hour per direction on one track. The initial fleet size will be derived from the expected patronage figures which will be estimated at a later stage.
6.6.4 Vehicle dimensions and characteristics It is proposed that the commuter rail vehicles for Mombasa will be low floor (at least 70%) and bi-directional.
The vehicle dimensions shall be aligned with the surrounding mainline railway system, unless the commuter network is fully separate.
Passenger train length would be limited by the shortest platform in the network. Width would also be in line with the mainline railway system. If multiple units with short body modules (Jacobs’s bogies) are used, vehicle bodies may be slightly wider than those of longer coaches (smaller inside throw in curves) as long as this is compati-ble with existing platform edges.
6.6.5 Entry and floor height If the commuter rail system is fully integrated with mainline rail, similar platform and entry height shall be used.
Current railway infrastructure in and around Mombasa comprises low platforms. The standard level of the platform is 450mm above rail level.
It is proposed to adopt low platforms and low entry vehicles for the new commuter rail system. This will allow level boarding or at the most with a climb of one step.

190 591.10
121 Kenya Railways Corporation KRC Mombasa Commuter Railways Feasibility Study KRC/PLM/40/2011 Final Report
Pöyry Switzerland Ltd.
It is proposed that the floor height will not exceed 600 mm.
6.6.6 Acceleration and speed A maximum speed of commuter rolling stock is typically between 120 and 160 km/h, similar to line speeds above. Some systems with shorter distances use 100 km/h. For Mombasa’s commuter rail system a maximum speed of 120 km/h is proposed.
Acceleration requirements will strongly depend on distances between stations; where these are short a higher acceleration may be preferable.
6.6.7 Propulsion and traction Both diesel and electric propulsion would be applicable toMombasa’s commuter rail system. As existing railway lines are diesel operated, diesel propulsion may be consid-ered at least for the initial phase(s).
The rolling stock traction capacity shall be commensurate with the line characteristics, which assume a maximum gradient of 25 ‰..

190 591.10
122 Kenya Railways Corporation KRC Mombasa Commuter Railways Feasibility Study KRC/PLM/40/2011 Final Report
Pöyry Switzerland Ltd.
7 PRELIMINARY ENVIRONMENTAL AND SOCIAL IMPACT ANALYSIS
7.1 Introduction As part of the Feasibility Study both a preliminary Environmental Impact Assessment and a Preliminary Social Impact Assessment were to be conducted. These were pre-pared together as a preliminary Environmental and Social Impact Assessment (ESIA), in the form of the present Screening Report that meets the requirements of the National Environment Management Authority (NEMA). The full report is presented in Annex 4 to the Final Report. The Preliminary ESIA was carried out in compliance with national policies and legisla-tion and international standards (World Bank Operational Policies and international pol-icies and treaties ratified by Kenya).
The Screening Report includes the following parts: General basis of the study, sections 1 to 5 (Introduction, Project description, Study
area, Methodology, Legislative and regulatory framework) Sectoral studies, sections 6 to 8 (physical, natural and socio-economic environ-
ments: current baseline in the project area, identification of impacts and recom-mended mitigation measures)
Analysis of social context, sections 9 to 11 (Socio-economic Survey, Resettlement Planning, Consultation and Public Participation).
Synopsis, section 12 (summary of project impacts, evaluation of project alternatives, Environmental and Social Management Plan).
To identify sensitive environmental or socio-economic areas and advise railway engi-neers on alternative corridor alignments, as well as maintain flexibility to update the en-vironmental and socio-economic assessment based on changes in corridor alignment, Geographic Information Systems (GIS) were used extensively. The results are repre-sented in the following mapbooks: Environmental Mapbook: includes important environmental features for the entire
study area (excl. Mombasa – Mazeras – Voi Corridor), as well as a land use / land cover analysis for the study area between Waa and Gongoni Stations.
Socio-economic Mapbook: includes important socio-economic infrastructure for the entire study area.
7.2 General basis of the study The project area considered in the preliminary ESIA includes all the railway corridors considered in the Feasibility Study (see section 4 of the Feasibility Study). The railway engineers designed the alignment of these corridors by integrating recommendations made by the environmental and social experts during the entire course of the Feasibility Study. In the present Screening Report, the impacts of the project were evaluated based on the latest version of these corridor alignments.

190 591.10
123 Kenya Railways Corporation KRC Mombasa Commuter Railways Feasibility Study KRC/PLM/40/2011 Final Report
Pöyry Switzerland Ltd.
Three levels of study were used to explore the environmental and socio-economic im-pacts of the project, with according degrees of detail:
1. Construction area: the area of direct and irreversible impacts of the railway corridor, between 15 and 60 m wide depending on the topography. This is the area in which detailed data analyses were performed.
2. Influence area: the area of potentially high but at least in part reversible impacts of the railway. To screen for project impacts, a 1 km wide influence area was used, centered on the railway line.
3. Study area: the larger area encompassing all railway corridors for the Mombasa commuter railway. The considered study area corresponds to the Kenyan coast-line between Ramisi and Lamu, extending about 80 km inland. This is the area in which the regional baseline and issues at stake are being investigated.
At this project stage, no information is available yet on the exact location and design of stations, maintenance facilities and temporary structures. Therefore, these were included as part of the study area. Their impacts were analysed with the information available, i.e. standard impacts expected as part of the construction and operation of a railway giv-en the local conditions.
7.3 Sectoral studies
7.3.1 Physical environment The climate in the study area is influenced by the monsoon winds, resulting in a long rainy season between March and May, and short rains between October and December. Average daily temperature is 26°C, and the average daily maximum and minimum tem-peratures are 30°C and 20°C, respectively. Kenya is vulnerable to climate change, and the effect of increasingly irregular and unpredictable weather events are felt on the coast in the form of flooding, extensive mangrove forest die-back and coral reef bleaching. The project is expected to have an overall positive impact on the climate, by offering a sustainable alternative to road traffic. However, during the construction phase, construc-tion vehicles will lead to a temporary increase in the emission of greenhouse gases. Three different coastal types are recognised along the Kenyan coast: the fringing reef shoreline of southern Kenya, the deltaic shoreline of Sabaki and the Tana Rivers, and the ancient delta area of the Lamu Archipelago. Inland, behind the coral rocks, low-lying clays and shales are found. The diverse geomorphology consists of sandy beaches, dunes, creeks, muddy tidal flats and rocky shores bordered by cliffs. The sedimentary origin of the parent rocks has mostly given rise to soils of low fertility with a high pro-portion of sand. The alluvial deposits from major rivers have however led to patches of highly productive soils. The main impacts expected from the project are the moving of large amounts of soil and rock to build the track, the pollution of soils, increased erosion and contribution to coastal erosion. Water resources concerned by the project include rivers, lakes, tidal creeks and groundwater. The railway will cross two major permanent rivers (Tana River and Athi-Sabaki River), several seasonal rivers and numerous estuaries (Mombasa creeks,

190 591.10
124 Kenya Railways Corporation KRC Mombasa Commuter Railways Feasibility Study KRC/PLM/40/2011 Final Report
Pöyry Switzerland Ltd.
Mtwapa Creek, Takaungu Creek, Kilifi Creek, Mida Creek, Lamu River Delta). The high sediment load of water bodies draining towards the Indian Ocean, caused largely by poor land-use practices upstream, threatens the sustainability of coastal habitats. The project’s main impacts on water resources will be pollution and increased sedimenta-tion, as well as the physical alteration of water bodies which could lead to a modifica-tion of drainage patterns. In the study area, air quality in areas of urban/industrial land use and along roads with heavy road traffic is expected to be poor and ambient noise levels are expected to be high. This is particularly the case in Mombasa City. In areas of agricultural land use and natural areas on the other hand, air quality is expected to be high and ambient noise lev-els are expected to be low. During the construction phase, the project will lead to in-creased noise levels and vibrations, as well as a degradation of air quality due to exhaust and dust emissions. During the operation phase however, the overall impact on the study area will be positive due to a reduction in road traffic, except in the direct vicinity of the railway. Here, disturbances due to increased noise and vibrations and reduced air quality are expected mainly in residential and wildlife areas.
7.3.2 Natural environment The study area is located in the “Coastal Forests of Eastern Africa” biodiversity hotspot, and is also part of the “Northern Zanzibar-Inhambane Coastal Forest Mosaic” ecore-gion, one of the 200 global most outstanding and representative areas of biodiversity. This rich biological diversity is due to the varied habitats which, starting from the oce-anic side, include deep waters comparatively close inshore, coral reefs, seagrass mead-ows, sandy beaches, rocky shores, mangrove swamps, estuarine mudflats, lowland coastal forests, and coastal hill forests which give way to savannah plains inland. The main impacts of the project on landscapes will be: Fragmentation of continuous landscapes due to the linear nature of the railway. Permanent modification of landscapes through the introduction of new elements. Decreased value of exceptional and/or unique landscape features (Lamu Archipelago,
Tana River Delta, Sabaki River Mouth and Watamu-Malindi Ecosystem).
The impact of the project in terms of area cleared for the railway can be found in the following table. It will be highest on natural landscapes that are currently continuous and not interrupted by roads or other developments, such as coastal forests, wetlands, mangroves and water bodies.
Table 7.1: Elements of the landscape affected between Waa Station and Gongoni Station
Land use / land cover type Construction area (ha)
Construction area (%)
Severity of impact
(land use map only)
Severity of im-pact (including missing sec-
tions) Forest 159.9 19.0 High High
Shrubs 500.6 59.3 Medium Medium
Wetlands 0.0 0.0 Low High

190 591.10
125 Kenya Railways Corporation KRC Mombasa Commuter Railways Feasibility Study KRC/PLM/40/2011 Final Report
Pöyry Switzerland Ltd.
Land use / land cover type Construction area (ha)
Construction area (%)
Severity of impact
(land use map only)
Severity of im-pact (including missing sec-
tions) Mangrove 8.7 1.0 Medium High
Sand / other land 33.0 3.9 Low Low
Salt pans 0.0 0.0 Low Low
Water 10.4 1.2 High High
Urban / settlement area 73.4 8.7 Medium Medium
Sisal plantations 22.2 2.6 Medium Medium
Annual cropland 16.4 1.9 Medium Medium
No data (clouds, shadows) 19.0 2.3 N/A N/A
Total 843.6 100
The vegetation of the “Northern Zanzibar-Inhambane Coastal Forest Mosaic” ecoregion is characterised by high diversity and high levels of endemism (more than 4 500 plant species, about 900 endemics). The majority of species are woody but there are also climbers, shrubs, herbs, grasses and sedges. The main impacts of the project on the veg-etation include permanent clearing and fragmentation, as well as degradation due to the edge effect. These impacts will have more severe consequences in vegetation types that have a high value for conservation (coastal forests, mangroves and wetlands).
Kenya’s coast is also a key area for wildlife, including many endemic and/or threatened species in different taxonomic groups. At least 158 species of mammals are known from the ecoregion. In the study area, 10 threatened mammal species are known to occur, as well as five strict endemics (Ader’s duiker, golden-rumped sengi, Tana River Red colo-bus, Tana River Crested Mangabey and the rodent Grammomys caniceps). More than 450 bird species are found on the Kenyan coast (41% of the birds recorded in Kenya), as it provides a number of habitats for migrating and local birds. Among the numerous endemic birds, most are forest specialists and are confined to the remaining patches of coastal forest. The diversity and endemism of reptiles and amphibians is also high. The threatened mammals and birds found in the study area are mostly found in forested areas (coastal forests and gallery forests) and wetlands, and a large portion of their pop-ulations is restricted to protected or sensitive areas, that were established amongst others to protect them. The protected areas from the Watamu-Malindi area and the Tana River Delta especially stand out. Major threats are habitat loss and fragmentation, as the re-maining patches of forests are increasingly fragmented and/or destroyed, and wetlands are destroyed or modified through new development projects. The main impacts of the commuter railway project on wildlife are expected to be further loss and degradation of habitat, fragmentation of populations either side of the railway corridor, interruption of migration corridors, disturbance due to construction work and train operation, and mor-tality through collisions.

190 591.10
126 Kenya Railways Corporation KRC Mombasa Commuter Railways Feasibility Study KRC/PLM/40/2011 Final Report
Pöyry Switzerland Ltd.
The freshwater ecosystems of the Kenyan coast are part of the “Tana, Athi & Coastal Drainages” Freshwater Ecoregion. The coastal rivers of this ecoregion, with their asso-ciated swamps, floodplains and lakes, host a relatively depauperate fish fauna which in-cludes a number of endemic species, as well as a rich avifauna and herpetofauna. The main impacts of the project on freshwater ecosystems are due to impacts on water bod-ies, i.e. loss of habitat due to physical modifications, and mortality or degradation of health condition of aquatic species and terrestrial species depending on aquatic ecosys-tems due to negative impacts on water quality. Marine ecosystems found in the study area include estuaries, mangrove forests, seagrass beds, soft-bottom habitats, rocky shores and coral reefs, which are all closely inter-linked. They harbour high levels of biodiversity, including many threatened species. Coastal flagship species include marine turtles, which nest on Kenyan beaches, and du-gongs, which live in shallow waters and sheltered bays and lagoons. The railway corri-dors will cross numerous brackish and marine ecosystems, such as creeks, estuaries and mangrove forests. The project is likely to impact both these ecosystems and sensitive ecosystems towards which they drain. The main consequences will be loss of habitat through physical modifications, destruction and degradation of marine ecosystems, and mortality or degradation of health of marine species due to pollution. These impacts are especially critical for marine ecosystems of high conservation value such as coral reefs and mangroves, and for threatened species (e.g. marine turtles, dugongs, endangered fish and corals).
Due to the high levels of biodiversity on the Kenyan coast, both terrestrial and marine, the project is located in an area with an exceptionally high value for conservation. This is reflected by the number of protected areas found in the study area. There are 11 na-tional parks (NP) and national reserves (NR), of which five are located in the construc-tion and/or influence area of the railway corridors: Watamu Marine NP, Malindi-Watamu NR, Arabuko-Sokoke NR, Gede Ruins National Monument and Tsavo East NP. There are also a large number of sensitive areas, i.e. areas that have been recog-nised nationally or internationally as exceptional and/or unique because of the ecosys-tems and/or species they harbour, but that are not officially protected (e.g. Ramsar sites, Important Bird Areas).
Although protected and sensitive areas were avoided wherever possible during the de-sign of the corridor alignment, in a few instances this was not possible due to geograph-ical constraints. These critical areas, where the train passes close to or even through protected and/or sensitive areas, are: Watamu-Malindi Ecosystem Tana River Delta Ecosystem Tsavo East National Park
In these critical areas, the impacts of the project are expected to be very high both dur-ing the construction and operation phases. There is also a considerable risk that this will ensue in delays in the project approval and licensing process.

190 591.10
127 Kenya Railways Corporation KRC Mombasa Commuter Railways Feasibility Study KRC/PLM/40/2011 Final Report
Pöyry Switzerland Ltd.
7.3.3 Socio-economic environment This section deals with the socio-economic environment and in large the human popula-tion and its economic activities in the counties of interest where the railway corridors are proposed. Within these counties, termed as the project area, with emphasis on the proposed railway corridors, various issues are analysed based on both desk studies and sample surveys. The issues include: population densities, settlement types, economic ac-tivities, health, water, energy, land and land use; existing social and economic infra-structure, and cultural heritage. Of importance is the mitigation of adverse or unintend-ed aspects that the project has on the population and economy within the project area. Where positive effects are projected, enhancement of these to provide a framework to manage social change should be the aim. The sampled areas within the corridors have been presented in three main steps: (1) description of the prevailing situation and the ex-isting environmental conditions, (2) identification of possible social impacts, and (3) the formulation of compensation and mitigation measures. The highlighted issues have all been dealt with in this chapter following the three main steps.
The Mombasa Commuter Rail Network has been proposed to traverse Mombasa and its environs via the following corridors: Mombasa – Moi International Airport – Likoni – Ramisi; Mombasa – Mazeras – Voi; Mombasa – Mtwapa – Kilifi – Malindi; Likoni Fer-ry – Bamburi; and Mazeras – Kaloleni – Takaunga.
The area between Mombasa Central Station and Moi International Airport is very densely settled, with settlements comprising commercial, residential and a combination of the two; settlements are both formal and informal. After the airport crossing the ocean to Dongo Kundu, settlement is sparse and becomes dense at Dongo Kundu; mov-ing towards Likoni, dense mixed settlements (formal and informal) are observed around Likoni; moving away towards Magaoni the corridor passes through farmland with sparse settlements. From Tiwi to Ukunda, the corridor passes through dense mixed set-tlements; the settlements are most dense in Ukunda. From Mwabungu, through Gazi, Msambweni to Ramisi, the corridor passes through farmland with sparse populations save for around the commercial centres that are the proposed railway stations.
Mombasa – Mazeras – Voi, originating at the Main Station following the old railway route depicts the most densely settled area housing both commercial and residential set-tlements. The last section into Voi, the corridor traverses Tsavo National Park with set-tlements restricted to the highway towns, the proposed stations and immediate environs. Voi is a vibrant, major transit town with dense settlements in the town centre. Mombasa – Mtwapa – Kilifi – Malindi; this entire corridor up to Mwamba is densely settled with both commercial and residential structures. The tourism establishment is well represented, especially within and adjacent to Mombasa city. Between Mwamba and Takaungu farmland is travesrsed with settlements becoming dense again on ap-proaching Kilifi town. Watamu is mainly farmland with sparse settlements, while Ma-lindi is densely settled. The latter two towns play a vital role in tourism. Likoni Ferry – Bamburi: the entire line passes through extremely dense settlements hav-ing both commercial and residential structures.

190 591.10
128 Kenya Railways Corporation KRC Mombasa Commuter Railways Feasibility Study KRC/PLM/40/2011 Final Report
Pöyry Switzerland Ltd.
Mazeras – Kaloleni – Takaungu: this corridor passes towns densely populated but the environs comprise farmland. Mombasa city, surrounding areas and commercial centres within the corridor are dense with both commercial and residential structures; while outside the county the settle-ments are sparse, especially areas surrounded by the Tsavo game reserve land and Shimba Hills. The corridors have varied settlements criss-crossed by farmland as the railway line moves away from the growing towns. The densely settled areas (towns and city) point towards need for carrying out a full-fledged Resettlement Action Plan (RAP) as people will need to be resettled or compensated. The more densely settled the area, the more likelihood for compensation and relocation.
The population and settlement location is indicative of where the commuter train will have more impact, both negative and positive.
7.4 Analysis of social context First the basic findings of the socio-economic sample survey carried out within the rail-way corridor in the counties of interest are presented. This is based on questionnaires that were designed for households, businesses and key informant interviews. Public par-ticipation fora were also held. The results of the survey are combined to cover all the four counties of interest. In total 577 household and business respondents were inter-viewed. Generally the people are pleased with the proposed commuter rail project but stress the issue of land (their agricultural land) as most of it is ancestral land and dis-placing them would raise the question of where they would go to continue their daily businesses. Project Affected Persons (PAPs) in the coastal region are suspicious and al-beit their chiefs seeing the positive aspects of the project, more thorough consultations with the people is called for. The issue of land which is very emotive put them on guard. A more thorough investigation will be required to bring on board all the PAPs. The so-cio-economic sample survey points towards the need for a full-fledged Resettlement Action Plan (RAP) to ensure that all PAPs and their assets are identified within the railway corridor and compensation accorded as will be spelled out in the RAP.
Subsequently the basics of resettlement planning are presented. These are necessarily based on the findings of the sample survey carried out from 11th – 23rd April, 2013. Leg-islation on legal conditions for expropriation and resettlement are presented. The World Bank’s OP 4.12, which spells out the internationally accepted basic elements of the Bank’s resettlement policy, is summarised. What needs to be done as the next step for carrying out a full-fledged RAP is also presented.
Public Participation and Consultation is an ongoing process and this should continue in the following phases of the project. The continued community consultations would pro-vide a firm basis from which to commence the development of the Resettlement Action Planning. The consultations carried out during this study are also briefly presented with emphasis on the need for continuation of public consultation.

190 591.10
129 Kenya Railways Corporation KRC Mombasa Commuter Railways Feasibility Study KRC/PLM/40/2011 Final Report
Pöyry Switzerland Ltd.
7.5 Synopsis
7.5.1 Overall impact per corridor section
7.5.1.1 Analysis Screening the different features of the physical, natural and socio-economic environ-ment in the study area allowed determining variable sensitivities to project impacts ac-cording to the corridor section considered. This is due to the high diversity of ecosys-tems as well as the unequal distribution of population along the Kenyan coast.
To obtain an overview of these findings, a preliminary evaluation of the overall impact of each future railway corridor section on key features of the physical, natural and so-cio-economic environment was conducted and is recapitulated in the following table.
Table 7.2: Preliminary evaluation of overall project impacts per corridor section
Corri
dor s
ectio
n
From To
Leng
th (k
m)
Prio
rity
Feas
ibilit
y Stu
dy Overall project im-
pact
Phys
ical a
nd
natu
ral e
nvi-
ronm
ent
Socio
-ec
onom
ic en
vi-ro
nmen
t
1.1 Makupa Moi International Airport 7.1 2 Low to medium High
1.2 Moi International Airport Likoni 20.8 5 High Low to medium
1.3 Likoni Ramisi 58.1 8 High High
2.1 Mombasa Main Station Mtwapa 16.4 3 High Very high
2.2 Mtwapa Kilifi 38.0 7 High Very high
2.3 Kilifi Malindi 59.3 10 Very high High
3.1 Mombasa Main Station Mazeras 19.3 1 Low to medium High
3.2 Mazeras Samburu 41.0 6 Low to medium
Low to medium
3.3 Samburu Voi 92.4 9 High Low to medium
4 Likoni Ferry Bamburi 14.8 4 High Very high
5 Mazeras Takaungu 51.7 11 High Low to medium
6 Malindi Hindi 204.9 12 Very high High

190 591.10
130 Kenya Railways Corporation KRC Mombasa Commuter Railways Feasibility Study KRC/PLM/40/2011 Final Report
Pöyry Switzerland Ltd.
7.5.1.2 Results for the physical and natural environment: The key features of the physical and natural environment considered in the evaluation were: water resources, landscapes, vegetation, wildlife, freshwater ecosystems, marine ecosystems, and protected and sensitive areas. The corridor sections could be separated in three categories: Corridor sections that are expected to have a very high overall impact: mostly due to
the presence and extent of many protected and sensitive ecosystems. Corridor sections that are expected to have a high overall impact: due to numerous
variable reasons according to each corridor section (e.g. presence of sensitive ecosys-tems, vegetation types, wildlife, freshwater or marine ecosystems).
Corridor sections that are expected to have a low to medium overall impact: due mostly to their passing through areas that are already heavily impacted by urban de-velopments, and do not harbour sensitive ecosystems.
7.5.1.3 Results for the socio-economic environment: The key features of the socio-economic environment considered in the evaluation were: population and settlement, land and land use, infrastructure, cultural heritage and job oppoprtunities. The corridor sections could be separated in three categories: Corridor sections that are expected to have a very high overall impact: mostly due to
population and settlements, land and land use, and infrastructure. This is especially an issue in Mombasa City, where there is no more land that is unoccupied.
Corridor sections that are expected to have a high overall impact: mainly due to pop-ulation and settlements, land and land use, and in certain cases infrastructure.
Corridor sections that are expected to have a low to medium overall impact: mostly in areas that are sparsely inhabited. The land and land use variable still plays an im-portant role however.
7.5.2 Conclusion The challenges of urbanisation and climate change call for sustainable transport solu-tions. Therefore, the development of the Mombasa commuter railway project is ex-pected to have an overall positive impact on the natural and socio-economic environ-ment, as railway transport is a sustainable alternative to increasing motorised vehicle traffic. However, based on the screening conducted in this Preliminary ESIA, the impacts of the project on many different aspects of the physical, natural and socio-economic environ-ment will be considerable, due to: The extensive scale of the area traversed by the railway corridors. The large variety of land uses it crosses, including:
Densely inhabited urban areas that will require the resettlement of a large num-ber of people.
Areas of exceptional biodiversity (including protected areas), that will require extensive stakeholder involvement to identify appropriate mitigation measures.

190 591.10
131 Kenya Railways Corporation KRC Mombasa Commuter Railways Feasibility Study KRC/PLM/40/2011 Final Report
Pöyry Switzerland Ltd.
The Consultant is therefore the opinion that a full ESIA and RAP will need to be con-ducted in the next project stage. Furthermore, in the corridor sections for which a very high overall project impact has been identified, the following specific recommendations apply: Kilifi-Malindi corridor: given the sensitivity of the Watamu-Malindi Ecosystem and
the number of protected and sensitive areas located in this ecosystem, KRC should consider developing the corridor as a separate project with its own ESIA.
Malindi-Hindi corridor: given the extreme sensitivity and relatively pristine state of the Tana River Delta Ecosystem, as well as the sparse population of the area, the de-velopment of a commuter railway on this corridor is not recommended from an envi-ronmental perspective. Should KRC nonetheless choose to include this corridor in the Detailed Design stage, the corridor should be developed as a separate project with its own ESIA to avoid delays in project approval and licensing for the other corridors that have a lesser impact.
Likoni-Ramisi corridor: very densely populated on approaching Likoni and several houses will be grazed, while in Ukunda the aerodrome and airport will be interfered with, as they lie within the corridor. KRC should be prepared to have high expenses in compensation after verification from RAP exercise, should the present proposed route be maintained.
Mtwapa – Kilifi corridor: the extensive stretch of sisal plantations is a great contribu-tor to the economy and employment of the region. While the Mnarani Club and other resorts within the corridor, which are all private, are not only contributors to the tour-ist industry (economy and employment), but Mnarani Club and Beach area extends right up to the creek, where the private beach is surrounded by a coral reef. More dis-turbances to the creek and coral ought to be minimised. Should the proposed corridor be approved, then KRC should start early to negotiate land acquisition for the pro-ject, bearing in mind that the cost will be colossal.
Likoni Ferry – Bamburi corridor: this has extremely dense settlements both commer-cial and residential structures. As there is no land that is unoccupied here, alternative land for resettlement will have to be sought; it is not known how many settlements will willingly move to Junda where there appears to be land. It would be advisable to do a separate and thorough RAP for this corridor.
7.5.3 Environmental and Social Management Plan Based on the project impacts and mitigation measures identified in this Preliminary ESIA, an Environmental and Social Management Plan (ESMP) was prepared. The ESMP covers: The impact The project components causing this impact The proposed mitigation measures Responsibility for implementation Costs Timeframe of implementation

190 591.10
132 Kenya Railways Corporation KRC Mombasa Commuter Railways Feasibility Study KRC/PLM/40/2011 Final Report
Pöyry Switzerland Ltd.
The ESMP was prepared for the planning, construction and operation phases. The plan-ning phase ESMP will be crucial in the preparation of the Detailed Design, as the need for and/or extent of many mitigation measures recommended for the construction and operation phases can be reduced or made redundant by applying the recommended planning phase measures. Therefore, it is essential that the preliminary ESIA and espe-cially the ESMP be made available to the detailed design engineers and the consultant preparing the ESIA and the RAP.
The mitigation measures recommended for the planning phase are presented in the table below.
Table 7.3: Impacts and mitigation measures identified for the planning phase
Impacts Impacts
Soils: erosion
- ESIA: detailed geological and soil survey - Plan appropriate drainage structures - Plan infrastructures to protect from rock fall - Adapt size of bridges and culverts to large floods - Avoid passing too close to shoreline - Avoid passing through mangrove forests
Water resources: modifi-cation of physical envi-ronment and degradation of water quality
- ESIA: detailed evaluation of water resources with field evaluations of water body and catchment area status to define the sensitivity of the water bodies concerned
- Following survey, where possible, avoid sensitive water resources - Plan environmental and water protection management system - Plan construction sites and large-scale facilities away from water bodies - Design bridges instead of embankments in mangrove forests, wetlands and flood-
plains - Plan crossing of permanent waterways where banks are stable and waterway is the
narrowest - Plan construction activities across seasonal rivers during dry season
Noise: pollution - ESIA: noise mapping in urban areas - ESIA: noise pollution modelling - Plan noise protection measures in sensitive areas based on findings from noise
mapping and modelling Landscapes: permanent modification
- Railway corridor should follow existing road corridors - Avoid passing through unique and/or exceptional landscape features - Avoid passing through continuous natural landscapes such as coastal forests,
mangroves and wetlands - Plan temporary structures in areas that are already impacted by human presence
Vegetation: destruction, fragmentation, degrada-tion
- ESIA: refine land cover analysis through ground-truthing to further distinguish dif-ferent vegetation types and their sensitivity
- ESIA: evaluate land cover between Gongoni and Malindi as well as Waa and Ra-misi
- Avoid passing through highly sensitive vegetation types (coastal forests, man-groves, wetlands)
- Railway corridor should follow existing road corridors whenever possible, and espe-cially through sensitive vegetation types
- Plan temporary structures in areas where the vegetation is already impacted by human presence and in low sensitivity vegetation categories

190 591.10
133 Kenya Railways Corporation KRC Mombasa Commuter Railways Feasibility Study KRC/PLM/40/2011 Final Report
Pöyry Switzerland Ltd.
Impacts Impacts
- Integrate communities as stakeholders depending on forest resources Mangroves and wet-lands: destruction
- ESIA: refine land cover analysis through ground-truthing to evaluate exact man-grove and wetland location
- ESIA: perform land cover analysis between Gongoni and Lamu as well as Waa and Ramisi to determine exact location of mangroves and wetlands
- Avoid mangrove areas and wetlands - Design bridges instead of embankments in mangrove and wetland areas
Wildlife: disturbance, fragmenta-tion, mortality
- ESIA: further identify species present in project area, especially threatened and endemic species
- ESIA: identify wildlife migration corridors - Avoid cutting through wildlife migration corridors, if impossible design under- or
overpasses so they are appropriate for species concerned - Maintain corridors of forest open to allow movement of species. Where fragmenta-
tion of key habitats cannot be avoided, design under- or overpasses in the form of green corridors and appropriate for species concerned
- Design bridges instead of embankments - Avoid or minimise any impacts on protected and sensitive areas
Freshwater ecosystems: degradation
- ESIA: detailed survey of freshwater ecosystems crossed by corridors - Following survey, where possible, avoid sensitive freshwater ecosystems - All measures for water resources, vegetation and soils
Marine ecosystems: deg-radation
- ESIA: detailed survey of marine ecosystems crossed by corridor (creeks, man-groves, etc.)
- All measures for water resources, vegetation and soils - Avoid passing close to turtle nesting beaches
Protected and/or sensi-tive areas: destruction, degradation
- Avoid protected or sensitive areas - ESIA: if impossible to avoid, involve all stakeholders likely to be affected to agree
on appropriate compensation measures, and obtain written consent letters giving authority for implementation of project
- In particularly critical areas (Watamu-Malindi Ecosystem, Tana River Delta Ecosys-tem), the development of the corridors concerned as separate projects with their own ESIA should be considered
- ESIA: evaluate movement of animals between Arabuko-Sokoke Forest and Mida Creek
- Watamu-Malindi corridor: follow existing road passing through plantation area of Arabuko-Sokoke along the northern side of said road, design appropriate over- or underpasses for species concerned
- Tana River Delta ecosystem: railway should not be built on an embankment in mangrove and wetlands areas, but follow the recommended bridge design
- Tsavo East National Park: reevaluate measures of SGR ESIA with increased traffic and construction of new stations once more information becomes available on traf-fic and exact location of stations, if necessary propose additional measures
Land acquisition and involuntary resettlement / displace-ment of persons
- PAPs (those losing land, crops, houses and other assets) be relocated or stay if more than 60 m from the railway tracks. Must be compensated first before the land is taken into use.
- Carry out full-fledged RAP to ensure capturing all directly affected PAPs and ascer-tain owners of land that may be expropriated; engage local communities and their

190 591.10
134 Kenya Railways Corporation KRC Mombasa Commuter Railways Feasibility Study KRC/PLM/40/2011 Final Report
Pöyry Switzerland Ltd.
Impacts Impacts
leaders, Ministry of Lands and National Land Commission on all issues to do with land.
- Continue public consultations and engage PAPs in all aspects of project, especially when RAP starts.
- In accordance with OP 4.12 and Kenyan legislation on land acquisition, draw up agreements with affected and compensate them before any land take occurs.
Loss of access to and livelihood from land; land use
- Carry out RAP and identify access to and livelihoods from land whether titled or not. Identify all categories of land use.
- Compensate as will be spelt out in RAP. - Alternative livelihood strategy
Loss of property and assets
- Carry out full-fledged RAP to mark structures within corridor that will be destroyed. Also includes social infrastructure (schools, health centres, mosques, churches, etc.)
- Where commercial and residential structures affected, owners to be compensated as required by Kenyan legislation and WB’s OP 4.12. For social infrastructure, re-place these at new sites for continued use by community.
Traffic diversions and risk to existing buildings
- Provide safe alternative, temporary access for those portions of roads and other infrastructure (bridges, etc.)
Interference with Sisal, tea, fruits (mangoes, co-conuts, palms, bananas, etc.) Plantations and Tree Research Plots
- RAP: Where corridors cannot be re-aligned, ascertain owners of plantations that might be interfered with and compensate owners for loss of crops and trees.
- Engage PAPs and local leaders work out modalities for compensation and compen-sate before destruction of plantations.
Disturbances to bore holes, water piping and storage systems
- RAP: Together with local communities and technical staff at county level, ascertain sites of water pipes, boreholes and storage and secure and protect these.
- Carry out a full-fledged RAP Destruction of social in-frastructure
- RAP: Ascertain social infrastructure to be affected in railway corridor e.g. Waa Dis-pensary in Waa Kwale District and Taqwa Muslim School in Likoni.
- SRG: check Samburu-Voi corridor: Ensure McKinnon Road Mosque and Ndonivyo Primary school not impacted.
- If impossible to avoid destruction, ensure assets replaced at new site for continued use by community.
Cultural Heritage - RAP: Carry out an indepth comprehensive study and demarcation of entire corri-dors required.
- Use communities’ knowledge for the heritage site identification and re-route railway to avoid destruction of such sites.
- Where burial sites and sacred sites are affected, relocate these and perform neces-sary rituals and project pays for relocation.
Population and social network
- Do not fragment family units, special attention to be given to vulnerable groups as identified during RAP.
- Relocation to areas similar to those relocated from.

190 591.10
135 Kenya Railways Corporation KRC Mombasa Commuter Railways Feasibility Study KRC/PLM/40/2011 Final Report
Pöyry Switzerland Ltd.
8 PRELIMINARY COST ESTIMATES
8.1 General The preliminary cost estimates present the total investment and operation costs for the sections and the total length of the lines. They correspond to the routes and alignments described in Section 4 and reflect the state of definition of the project. It is assumed that the project will be realised according to the Time Line presented in Figure 4.33. Two scenarios are considered for the implementation of the project. The first alternative assumes a total implementation of the project by the end of 2030, and the second a reduced implementation by 2027, leaving out sections 5 Mazeras – Kalole-ni – Takaunga and 6 Malindi – Hindi.
The prices are given in KES (Kenyan Shillings) and USD (US Dollar), reflecting the share of local and imported supplies and services.
They correspond to 2013 prices and do not take into account inflation and the cost of in-terests.
The investment cost items are grouped in the following categories: A. Land acquisition
B. Civil works for the sections excl. stations (Earthworks, bridges, tunnels, cul-verts)
C. Rail facilities (Trackwork, signalling, TC & communication, electrification) D. Stations
E. Maintenance facilities (Workshop, equipment, vehicles) and yard F. Ancillary works (Streets, crossings, utilities, landscaping, costs of Environmen-
tal and Social Management Plan (ESMP) and Resettlement Action Plan (RAP)). G. Rolling stock (incl. spare parts)
H. Engineering services (Project management, design, construction supervision and commissioning)
The main operation costs items are station and maintenance staff, infrastructure and train operation.
8.2 Unit costs and total cost calculation principles The unit costs for local supplies are average values obtained in Kenya during the field study. Those for imported supplies are average international prices obtained from simi-lar projects.
Measurable items are priced on the basis of volumes, areas, lengths or number of units, whereas those which cannot yet be defined (e.g. utilities, environmental and social miti-

190 591.10
136 Kenya Railways Corporation KRC Mombasa Commuter Railways Feasibility Study KRC/PLM/40/2011 Final Report
Pöyry Switzerland Ltd.
gation measures) are given a flat price. Engineering services, comprising project man-agement, project design, construction supervision and commissioning, are estimated on a percentage basis of the total investment cost.
A breakdown of the investment costs for all sections is included in Annex 7. The operation costs are based on station and light maintenance staff costs, infrastructure operations costs and train operations costs. The yearly station staff costs are based on 5 personnel categories and staff numbers commensurate to the 5 station categories. The yearly light maintenance staff costs are based on 5 personnel categories and assumed staff numbers for workshop & depot, workshop extension and infrastructure service point. The infrastructure operation costs cover the depreciation, maintenance and replacement costs for the infrastructure over 30 years run time, taking into account the life spans of the various items. The train operation costs are made up of staff costs, fuel costs and depreciation, mainte-nance and replacement costs for the rolling stock with a life span of 30 year, over 30 years run time.
8.3 Cost estimation of capital costs It is assumed that certain additional capital costs will be necessary after the completion of the system in 2030 (or 2027 for the second alternative) to cope with the increased traffic. To increase the capacity of the system certain stations will need to be provided with a second track to allow the trains to cross, and certain line sections might require a second track. These additional capital costs are applied linearly from 2030 (or 2027) to 2045. Additional rolling stock will also be required, and their costs will also be applied linear-ly. The total investment costs for each section and for the total length of the lines is pre-sented in Table 8.1. The yearly global and sectional investment costs are shown in Table 8.2. The cost chart in Figure 8.1 shows the yearly and accrued investment costs for the initial system implementation and later upgrading.
8.4 Cost estimation of operation costs The operations costs due to additional rolling stock and additional yearly mileage will also increase from 2030 (or 2027) and these costs will be applied linearly up to 2045.
The yearly and accrued operation costs for each section are presented in chart form in Figure 8.2.
An overview of the yearly operation costs for each section and for the total length of the lines is presented in Annex 8.

190 591.10
137 Kenya Railways Corporation KRC Mombasa Commuter Railways Feasibility Study KRC/PLM/40/2011 Final Report
Pöyry Switzerland Ltd.
Table 8.1: Cost estimation of capital costs
All C
osts
in:[
mn
KES]
Shar
e of
Tot
al C
osts
No
Corr
idor
Leng
thSu
b To
tal C
osts
per
Cos
t Gro
upTo
tal
Cost
loca
lfo
reig
nSe
ctio
nfr
omto
AB
CD
EF
GH
Cost
s p
er k
m[m
n KE
S][m
n US
D]
1.1
Mom
basa
- Ai
rpor
t - Li
koni
- Ra
mis
i6.
5 km
358
691
440
153
4340
41'
564
465
4'11
863
42'
082
23.9
6M
akup
a - A
irpor
t2.
5 km
9.0
km
1.2
Mom
basa
- Ai
rpor
t - Li
koni
- Ra
mis
i20
.8 k
m73
719
'665
1'11
918
826
981
1'42
03'
335
27'4
701'
321
24'1
1239
.51
Airp
ort -
Liko
ni9.
0 km
29.8
km
1.3
Mom
basa
- Ai
rpor
t - Li
koni
- Ra
mis
i58
.1 k
m47
71'
391
3'09
146
829
233
61'
420
987
8'46
214
64'
809
42.9
8Li
koni
- Ra
mis
i29
.8 k
m87
.9 k
m
2.1
Mom
basa
-Mtw
apa
- Kili
fi - M
alin
di
16.4
km
937
12'0
6793
249
517
1'16
12'
899
2'47
920
'986
1'28
013
'059
93.2
6M
omba
sa -
Mtw
apa
0.0
km16
.4 k
m
2.2
Mom
basa
-Mtw
apa
- Kili
fi - M
alin
di
38.0
km
317
5'60
71'
944
306
4334
31'
275
1'33
611
'171
294
5'74
463
.85
Mtw
apa
- Kili
fi16
.4 k
m54
.4 k
m
2.3
Mom
basa
-Mtw
apa
- Kili
fi - M
alin
di
59.3
km
456
4'44
33'
062
369
309
409
1'56
41'
428
12'0
4120
36'
268
67.9
1Ki
lifi -
Mal
indi
54.4
km
113.
7 km
3.1
Mom
basa
- M
azer
as -
Voi
19.3
km
342
1'00
51'
043
529
662
553
3'39
21'
013
8'53
944
23'
708
56.8
3M
omba
sa -
Maz
eras
0.0
km19
.3 k
m
3.2
Mom
basa
- M
azer
as -
Voi
41.0
km
28
245
216
903
6998
634
12'
770
6886
922
.36
Maz
eras
- Sa
mbu
ru19
.3 k
m60
.3 k
m
3.3
Mom
basa
- M
azer
as -
Voi
92.4
km
314
386
369
923
1'47
932
02'
602
2869
622
.43
Sam
buru
- Vo
i60
.3 k
m15
2.7
km
4Li
koni
Fer
ry -
Bam
buri
14.8
km
917
7'76
379
434
217
955
1'91
31'
655
14'3
5597
07'
659
78.7
7Li
koni
Fer
ry -
Bam
buri
0.0
km14
.8 k
m
5M
azer
as -
Kalo
leni
- Ta
kaun
gu51
.7 k
m63
36'
550
2'70
527
951
442
986
1'56
413
'210
256
10'1
7235
.74
Maz
eras
- Ta
kaun
gu0.
0 km
51.7
km
6M
alin
di -
Lam
u20
4.9
km1'
171
11'3
1610
'214
279
456
880
2'46
53'
626
30'4
0714
821
'043
110.
16M
alin
di -
Lam
u0.
0 km
204.
9 km
Tota
l Cos
ts62
3.2
km6'
348
70'5
2225
'976
3'99
42'
826
6'55
621
'361
18'5
4815
6'13
125
110
0'22
165
7.76
Cost
Gro
ups
ALa
nd A
cqui
sitio
nE
Mai
nten
ance
faci
litie
sB
Civi
l Wor
ksF
Anci
llary
wor
ksC
Rail
Faci
litie
sG
Rolli
ng st
ock
DSt
atio
nsH
Engi
neer
ing
Serv
ices

190 591.10
138 Kenya Railways Corporation KRC Mombasa Commuter Railways Feasibility Study KRC/PLM/40/2011 Final Report
Pöyry Switzerland Ltd.
Table 8.2: Yearly global and sectional investment costs
NoCo
rrido
rSta
rt / D
uration
[mon
th]Co
stsInv
estme
nt co
sts pe
r yea
r [mn K
ES]
Secti
onPla
nning
Cons
tructio
nOp
era.[
mn KE
S]20
1320
1420
1520
1620
1720
1820
1920
2020
2120
2220
2320
2420
2520
2620
2720
2820
2920
30To
tal co
sts
3.1M
omba
sa - M
azer
as - V
oi1'0
1363
253
253
254
190
1'013
Mom
basa
- M
azer
as10
/1318
04/15
3010
/177'5
262'2
563'0
142'2
567'5
26
1.1M
omba
sa - A
irpor
t - Li
koni
- Ram
isi46
572
143
143
107
465
Mak
upa -
Airp
ort
07/14
1510
/1524
10/17
3'653
455
1'829
1'369
3'653
2.1M
omba
sa -M
twap
a - Ki
lifi -
Mali
ndi
2'479
366
367
368
367
367
367
277
2'479
Mom
basa
- M
twap
a01
/1427
04/16
5410
/2018
'507
3'085
4'109
4'109
4'109
3'096
18'50
7
4Lik
oni F
erry
- Bam
buri
1'655
226
301
301
301
301
226
1'655
Likon
i Fer
ry - B
ambu
ri04
/1618
10/17
4810
/2112
'700
791
3'173
3'173
3'181
2'382
12'70
0
1.2M
omba
sa - A
irpor
t - Li
koni
- Ram
isi3'3
3511
947
747
647
647
647
747
635
73'3
35Ai
rpor
t - Li
koni
10/15
2410
/1760
10/22
24'13
61'2
034'8
244'8
244'8
384'8
243'6
2224
'136
3.2M
omba
sa - M
azer
as - V
oi34
128
114
114
8534
1M
azer
as - S
ambu
ru10
/1912
10/20
2410
/222'4
2930
31'2
1491
22'4
29
2.2M
omba
sa -M
twap
a - Ki
lifi -
Mali
ndi
1'336
179
356
356
356
901'3
36M
twap
a - Ki
lifi
07/20
1510
/2130
04/24
9'835
980
3'932
3'932
991
9'835
1.3M
omba
sa - A
irpor
t - Li
koni
- Ram
isi98
713
226
326
326
466
987
Likon
i - Ra
misi
07/21
1510
/2230
04/25
7'475
745
2'988
2'997
745
7'475
3.3M
omba
sa - M
azer
as - V
oi32
027
107
107
8032
0Sa
mbu
ru - V
oi10
/2112
10/22
2410
/242'2
8228
41'1
3985
82'2
82
2.3M
omba
sa -M
twap
a - Ki
lifi -
Mali
ndi
1'428
191
381
380
380
951'4
28Ki
lifi -
Mali
ndi
07/23
1510
/2430
04/27
10'61
31'0
594'2
474'2
471'0
5910
'613
5M
azer
as - K
alole
ni - T
akau
ngu
1'564
8734
834
734
734
787
1'564
Maz
eras
- Tak
aung
u10
/2318
04/25
3604
/2811
'646
2'912
3'879
3'879
978
11'64
6
6M
alind
i - La
mu
3'626
100
403
403
404
403
403
403
404
403
302
3'626
Mali
ndi -
Lam
u10
/2130
04/24
7810
/3026
'782
3'091
4'118
4'118
4'118
4'129
4'118
3'091
26'78
2
Tota
l Cos
ts15
6'131
6369
13'5
929'3
9511
'169
13'25
013
'278
12'76
510
'831
11'06
59'4
6510
'563
13'21
713
'374
9'900
5'598
4'520
3'393
156'1
31
Engin
eerin
g Serv
ice co
sts (m
anag
emen
t, des
ign, su
pervis
ion, c
omiss
ioning
)Co
nstru
ction
costs
(incl.
Land
acqu
isition
and r
olling
stock
)

190 591.10
139 Kenya Railways Corporation KRC Mombasa Commuter Railways Feasibility Study KRC/PLM/40/2011 Final Report
Pöyry Switzerland Ltd.
Figure 8.1: Yearly and accrued investment cost for each section
all c
osts
in[m
n KE
S]
050'0
00
100'
000
150'
000
200'
000
250'
000
0
2'00
0
4'00
0
6'00
0
8'00
0
10'0
00
12'0
00
14'0
00
16'0
00
18'0
00
2013
2014
2015
2016
2017
2018
2019
2020
2021
2022
2023
2024
2025
2026
2027
2028
2029
2030
2031
2032
2033
2034
2035
2036
2037
2038
2039
2040
2041
2042
2043
2044
2045
Upg
radi
ng R
olli
ng S
tock
Upg
radi
ng In
frast
ruct
ure
Syst
em Im
plem
enta
tion
Tota
l Inv
estm
ents

190 591.10
140 Kenya Railways Corporation KRC Mombasa Commuter Railways Feasibility Study KRC/PLM/40/2011 Final Report
Pöyry Switzerland Ltd.
Figure 8.2: Yearly and accrued operation costs for each section
all c
osts
in[m
n KE
S]
050'0
00
100'
000
150'
000
200'
000
250'
000
300'
000
0
2'00
0
4'00
0
6'00
0
8'00
0
10'0
00
12'0
00
14'0
00
16'0
00
18'0
00
20'0
00
2013
2014
2015
2016
2017
2018
2019
2020
2021
2022
2023
2024
2025
2026
2027
2028
2029
2030
2031
2032
2033
2034
2035
2036
2037
2038
2039
2040
2041
2042
2043
2044
2045
Mal
indi
- Hi
ndi
Maz
eras
- Ta
kaun
gu
Liko
ni F
erry
- Ba
mbu
ri
Kilif
i - M
alin
di
Mtw
apa
- Kili
fi
Mom
basa
Mai
n St
atio
n - M
twap
a
Liko
ni -
Ram
isi
MO
I Int
erna
tiona
l Airp
ort -
Liko
ni
Mak
upa
- MO
I Int
erna
tiona
l Airp
ort
Sam
buru
- Vo
i
Maz
eras
- Sa
mbu
ru
Mom
basa
Mai
n St
atio
n - M
azer
as
Tota
l Ope
ratio
n Co
sts

190 591.10
141 Kenya Railways Corporation KRC Mombasa Commuter Railways Feasibility Study KRC/PLM/40/2011 Final Report
Pöyry Switzerland Ltd.
8.5 Cost estimation reduced project The reduced project is based on the Road Map for development of the total project as described in section 4.5, but excludes those sections which have the most unfavourable relation between traffic volume, investment and operation costs. The reduced project is to be completed in 2027.
The reduced scenario includes only the sections with priority 1 to 10 (refer to section 4.5):
Table 8.3: Road Map for development, sections of the reduced project Cor. Sec. from mileage to mileage length
1 Mombasa - Airport - Likoni - RamisiCorridor
1.1 Makupa km 2.5 Kibos km 9.0 6.5 km
1.2 Airport km 9.0 Muhoroni km 29.8 20.8 km
1.3 Likoni km 29.8 Ramisi km 87.9 58.1 km
2 Mombasa -Mtwapa - Kilifi - Malindi Corridor
2.1 Mombasa km 0.0 Mtwapa km 16.4 16.4 km
2.2 Mtwapa km 16.4 Kilifi km 54.4 38.0 km
2.3 Kilifi km 54.4 Malindi km 113.7 54.4 km
3 Mombasa - Mazeras – Voi Corridor
3.1 Mombasa km 0.0 Mazeras km 19.3 19.3 km
3.2 Mazeras km 19.3 Samburu km 60.3 41.0 km
3.3 Samburu km 60.3 Voi km 152.7 92.4 km
4 Likoni Ferry – Bamburi Corridor
4 Likoni Ferry km 0.0 Bamburi km 14.8 14.8 km
Table 8.4: Cost estimation of capital costs for the reduced project
Cost Groups Total Costs (mn KES)
A Land Acquisition 4'545 B Civil Works 52'656 C Rail Facilities 13'056 D Stations 3'436 E Maintenance facilities 2'317 F Ancillary works 5'233 G Rolling stock 17'910 H Engineering Services 13‘359
Total
112'514
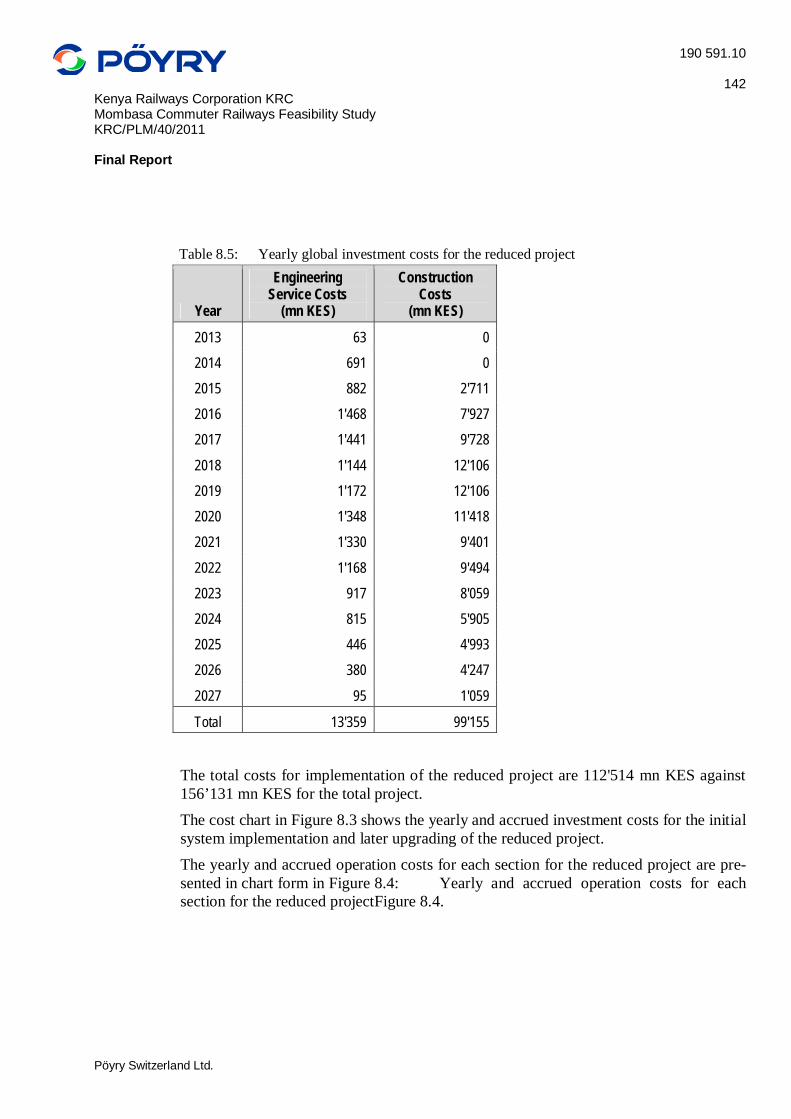
190 591.10
142 Kenya Railways Corporation KRC Mombasa Commuter Railways Feasibility Study KRC/PLM/40/2011 Final Report
Pöyry Switzerland Ltd.
Table 8.5: Yearly global investment costs for the reduced project
Year
Engineering Service Costs
(mn KES)
Construction Costs
(mn KES)
2013 63 0 2014 691 0 2015 882 2'711 2016 1'468 7'927 2017 1'441 9'728
2018 1'144 12'106 2019 1'172 12'106 2020 1'348 11'418 2021 1'330 9'401
2022 1'168 9'494 2023 917 8'059 2024 815 5'905 2025 446 4'993 2026 380 4'247
2027 95 1'059
Total 13'359 99'155
The total costs for implementation of the reduced project are 112'514 mn KES against 156’131 mn KES for the total project. The cost chart in Figure 8.3 shows the yearly and accrued investment costs for the initial system implementation and later upgrading of the reduced project. The yearly and accrued operation costs for each section for the reduced project are pre-sented in chart form in Figure 8.4: Yearly and accrued operation costs for each section for the reduced projectFigure 8.4.

190 591.10
143 Kenya Railways Corporation KRC Mombasa Commuter Railways Feasibility Study KRC/PLM/40/2011 Final Report
Pöyry Switzerland Ltd.
Figure 8.3: Yearly and accrued investment cost for the reduced project
all c
osts
in[m
n KE
S]
020'0
00
40'0
00
60'0
00
80'0
00
100'
000
120'
000
140'
000
160'
000
180'
000
200'
000
0
2'00
0
4'00
0
6'00
0
8'00
0
10'0
00
12'0
00
14'0
00
2013
2014
2015
2016
2017
2018
2019
2020
2021
2022
2023
2024
2025
2026
2027
2028
2029
2030
2031
2032
2033
2034
2035
2036
2037
2038
2039
2040
2041
2042
2043
2044
2045
Upg
radi
ng R
olli
ng S
tock
Upg
radi
ng In
frast
ruct
ure
Syst
em Im
plem
enta
tion
Tota
l Inv
estm
ents

190 591.10
144 Kenya Railways Corporation KRC Mombasa Commuter Railways Feasibility Study KRC/PLM/40/2011 Final Report
Pöyry Switzerland Ltd.
Figure 8.4: Yearly and accrued operation costs for each section for the reduced project
all c
osts
in[m
n KE
S]
050'0
00
100'
000
150'
000
200'
000
250'
000
0
2'00
0
4'00
0
6'00
0
8'00
0
10'0
00
12'0
00
14'0
00
16'0
00
2013
2014
2015
2016
2017
2018
2019
2020
2021
2022
2023
2024
2025
2026
2027
2028
2029
2030
2031
2032
2033
2034
2035
2036
2037
2038
2039
2040
2041
2042
2043
2044
2045
Liko
ni F
erry
- Ba
mbu
ri
Kilif
i - M
alin
di
Mtw
apa
- Kili
fi
Mom
basa
Mai
n St
atio
n - M
twap
a
Liko
ni -
Ram
isi
MO
I Int
erna
tiona
l Airp
ort -
Liko
ni
Mak
upa
- MO
I Int
erna
tiona
l Airp
ort
Sam
buru
- Vo
i
Maz
eras
- Sa
mbu
ru
Mom
basa
Mai
n St
atio
n - M
azer
as
Tota
l Ope
ratio
n Co
sts

190 591.10
145 Kenya Railways Corporation KRC Mombasa Commuter Railways Feasibility Study KRC/PLM/40/2011 Final Report
Pöyry Switzerland Ltd.
9 ECONOMIC APPRAISAL
9.1 Introduction The key question in economic evaluation is if a project or a policy intervention is worthwhile from an overall social point of view. The main purpose of project economic analysis is to help design and select projects that contribute to the welfare of a country. It is most useful when used early in the project cycle, and has very limited use when used solely as a single figure hoop through which projects must jump once prepared. According to the Guideline of the World Bank, the following questions will be an-swered as a result of this report.
a) What is the objective of the project?
b) What is the project’s social, environmental and economic impact? c) Is the project worthwhile?
d) Is this a risky project? Most of these questions must be answered during a wide discussion process of the in-volved stakeholders. This analysis aims to provide a basis for such a discussion and sets values and data which help to argument in one or another direction.
The general approach is the comparison between a Do-Nothing Scenario, which is de-fined as the current transport distribution in which no railway system is existent and most of the private and public transport will be done as described in chapter 2. The overall transport volume will increase dramatically due to increasing population expec-tations and will cause significant problems in the catchment area and its surroundings. It can be expected that neither the existing public transport systems nor the existing and planned traffic infrastructure will have sufficient capability to satisfy the upcoming pas-senger transport demand. Changes between the modes are quite moderate and it can be expected that especially the Matatu system will reach the limits of its capacity. The case which is compared to the Do-Nothing Scenario is the railway project as de-scribed in this study. Costs are clearly defined as described in chapter 8. The expected economic benefits are listed in this chapter and are related to the costs caused by the project. Most of the benefits are generated by shifted passenger trips from other transport modes to the railway system as described in chapter 2. These benefits usually base on standard unit values connected to the quantity of shifted trips. Western European, Asian and Northern American countries have proven values for the economic evaluation of transport projects. In Kenya, and in most of the comparable Af-rican countries, these data do not exist and no scientific research has been made in re-cent times. Accordingly, no specific local values for economic evaluations are on hand. In this case values of other countries were adopted or assumptions were made to gener-ate a reliable analysis.

190 591.10
146 Kenya Railways Corporation KRC Mombasa Commuter Railways Feasibility Study KRC/PLM/40/2011 Final Report
Pöyry Switzerland Ltd.
9.2 Methodology The methodology of this appraisal follows common structures of economic evaluations like the World Bank or the European Union uses for transport projects. The following figure shows the basic structure of the methodology. This appraisal follows this struc-ture where applicable and differs where no data or values were available.
Source: A framework for the economic evaluation of transport projects, World Bank 2005 Figure 9.1: Transport Economic Appraisal Structure
In accordance with generally accepted economic principles, this study applies the meth-odology of a Socio-Economic Cost Benefit Analysis (CBA) for the Economic Analysis. The CBA looks at the broad effects of a project to society as a whole, hence encompass-ing more than the financial picture.
The CBA compares Do-nothing scenario (transport development without implementing a commuter rail
system) and

190 591.10
147 Kenya Railways Corporation KRC Mombasa Commuter Railways Feasibility Study KRC/PLM/40/2011 Final Report
Pöyry Switzerland Ltd.
With-project scenario with parameters as described below
Contrary to the financial analysis, the economic analysis is based on welfare impacts on national level. This means that transfer payment as well as taxes, e.g. VAT must be tak-en out of the assessment.
In addition to the monetized benefits, a lot of further advantages will be gained by the project and need to be weighed up against the costs and disadvantages of the project.
In the economic appraisal are e.g. not or only partly considered: Creation of employment opportunities, which are not direct connected to the railway
system (only included in relation to the station area development further possible job creation should be discussed within the stakeholders)
Growth and improvement of infrastructure around the railway line Opportunity for women to get access to a safe and reliable mode of transport Improve quality of public transport for all potential users Increase the accessibility to hospitals, schools and public institutions Structuring the urban development of urban as well as rural areas
9.3 Indicators for the economic appraisal The CBA takes into account the following items which determine the economic value: The costs of the project, being the required investments and reinvestments for the
project, and the incremental operational expenditures for the railway system reduced by saved investments and operational costs in the existing transport system (mostly roads).
The direct impact, being: the economic value of travel time reduction. passenger revenues
The external effects of the improvement of the railway system, being: reduction of accidents; reduction of noise; creation of new jobs and local economic development reduction of emission (local air pollution and greenhouse gas emissions);
The effects are considered over the period 2015 to 2045 and discounted to a present value for the year 2013. The residual value of the investments is also taken account into account, in order to re-flect that the investments still have an economic value after 2045. The discount rate should reflect the opportunity cost of capital in Kenya.
Table 9.1: Parameters for the Economic Appraisal Element Value/ Assumption
Method Cost-benefit analysis in market prices Planning horizon 30 years after start of construction

190 591.10
148 Kenya Railways Corporation KRC Mombasa Commuter Railways Feasibility Study KRC/PLM/40/2011 Final Report
Pöyry Switzerland Ltd.
Element Value/ Assumption Starting year 2015 Discount rate 12% Year of result (NPV value) 2045 Price level 2013 Time value passengers Chapter 9.5.1 Valuation of externalities Chapter 9.5.4 Cost of accidents Chapter 9.5.6 Saved vehicle km Chapter 2 Traffic volumes Chapter 2
9.4 Input data
9.4.1 Cost estimation (direct and externalities)
9.4.2 Investment costs This chapter includes the cost estimations based on 2013 cost structures divided into groups and adopted to the Kenyan prices as described in chapter 8.
For the economic analysis the construction costs for the project implementation period (30 years) without depreciation and engineering services (as shown in chapter 8) were converted into accounting (shadow) prices which reflects the ”social value” by multi-plying the costs with a factor of 0.75.
This factor which reflects a reduction of actual and local market impacts on the prices the exclusion of direct and indirect taxes
All costs were converted into mn KES and summarised in the EA table in Annex 7 and can be seen in the figure below.
Figure 9.2: Investment cost (economic values)
0
2'000
4'000
6'000
8'000
10'000
12'000
2015
2016
2017
2018
2019
2020
2021
2022
2023
2024
2025
2026
2027
2028
2029
2030
2031
2032
2033
2034
2035
2036
2037
2038
2039
2040
2041
2042
2043
2044
2045
Converted Investment Costs in mn KES

190 591.10
149 Kenya Railways Corporation KRC Mombasa Commuter Railways Feasibility Study KRC/PLM/40/2011 Final Report
Pöyry Switzerland Ltd.
9.4.3 Operational expenditures Operational cost includes all items as mentioned above like maintenance, train services and staff costs. Depreciation costs for the infrastructure are excluded.
Data were taken from chapter 8 (Cost estimation) and adapted to the requirements of the economic appraisal.
9.5 Benefit estimation Implementing a new railway system usually brings several benefits for the general pub-lic but only some of them can be converted and expressed in money. Other benefits like social advantages can only be evaluated in a descriptive way.
Monetary benefits included in the Cost-Benefit Analysis are: Time savings of passengers travelling with the railway system instead of using other
modes Road traffic avoided (Vehicle operating and maintenance costs) Prevented Accidents (Road Traffic Accidents) Job Creation due to station area development Externalities (mainly reduced environmental pollution caused by road traffic) Revenues by train operation Residual value
9.5.1 Travel time benefits The amount of time savings, for each category of traffic, has therefore been calculated at network level. The value of time has been assessed the following way:
Average value of times for different trip purposes have been adopted from European unit data with a base year 2007 (Source: JASPERS).
Converting European to Kenyan values a factor was established related to the average yearly wage in both regions.
Average yearly salary: Europe: 19’219 USD
Kenya: 1’600 USD Converting factor: 0.083 (Source: Opendata, Eurostat)

190 591.10
150 Kenya Railways Corporation KRC Mombasa Commuter Railways Feasibility Study KRC/PLM/40/2011 Final Report
Pöyry Switzerland Ltd.
This leads to the following 2015 data for Kenya:
Table 9.2: Values for travel times short distance - rail KES per hour USD per hour
business 146.16 1.61 commuting 56.25 0.62
others 47.26 0.52
Assuming a distribution of trip purposes this results in an average value per trip: Business: 30% Commuting: 50% Others: 20%
Average value per trip hour: 81.42 KES (0.92 USD) By multiplying the time savings in passenger hours with those unit values, a monetary value of time savings can be obtained. Time savings were calculated by multiplying assumed reduced trip times due to shifting from other modes to the railway system. BodaBoda: 3min/trip Motorbike: 3 min/trip Private car: 5 min/trip Matatu: 5 min/trip Bus: 10 min/trip
These results in overall time savings:
Table 9.3: Time savings
short distance - rail 2018 2021 2030 2045
Saved trips 9’164 16’872 234’289 594’383 Saved hours 4’753 8’661 116’546 280’326 Travel time benefits KES 387’012 705’167 9’489’179 22’824’160 Travel time benefits mn USD 0.004 0.01 0.11 0.26
9.5.2 External impacts Avoided road traffic is the major impact which brings positive aspects to the project. The following benefits can be summarized under this topic.
9.5.2.1 Vehicle operating costs (VOC) For each vehicle km of different modes, a vehicle operating cost has been considered. The values have been taken from the International Roughness Index (IRI), for the situa-tion “plain and very good condition”, that is the situation in which vehicle operating

190 591.10
151 Kenya Railways Corporation KRC Mombasa Commuter Railways Feasibility Study KRC/PLM/40/2011 Final Report
Pöyry Switzerland Ltd.
costs are the lowest (using therefore a conservative approach). These unit values, pre-sented in the following table, are constant over the study period.
Table 9.4: Vehicle operating costs for road traffic
Car Matatu Bus
Cost for roughness IRI: 6; USD) 0.329 0.345 0.728
RUC Component (con-sumables) in USD 0.313 0.318 0.635
Total KES per km 54.76 56.55 116.27 Total USD per km 0.642 0.663 1.363
Source: International Roughness Index
For motorbikes and BodaBoda 30% of the VOC for cars were assumed. For walking and bicycle traffic no VOC were calculated.
Multiplying the above listed cost units with the saved vehicle kilometres results in the following values:
Table 9.5: Saved VOC Costs
2018 2021 2030 2045 Saved trips (all modes) 9’164 16’872 234’289 594’383 Saved vehicle km (relevant modes) 102’969 189’526 2’629’701 6’662’976 VOC benefits mn KES 5.77 10.62 146.85 370.24 VOC benefits mn USD 0.067 0.12 1.72 4.33
9.5.3 Job Creation In the consequence of land area development around the station areas it can be expected that the local economy will be pushed and several business will allocate. First plans were made for big stations in Kenya like Mombasa where shopping malls and business centres have been foreseen. This will result in an increased offer of new jobs with a long term influence on the local economy. For three categories of stations a yearly amount of value for new created jobs were as-sumed. Category I: 160 mn KES Category II: 40 mn KES Category III: 4 mn KES
After finalizing the whole network a total number of 3 cat I, 18 cat II and 16 cat III sta-tions will be implemented.

190 591.10
152 Kenya Railways Corporation KRC Mombasa Commuter Railways Feasibility Study KRC/PLM/40/2011 Final Report
Pöyry Switzerland Ltd.
9.5.4 Externalities Externalities include noise, air pollution, and climate change, which can be saved by shifting passengers to the railway system.
For the With-Project Case, the total rail passenger km were calculated. For the same traffic, the corresponding amount of road passenger km has been calculated.
The Consultant has then used the results of the Infras-IWW study dated 2004 in order to assess the cost of externalities (air pollution, climate change and noise) per passenger km and ton km on road and rail.
Table 9.6: Infras-IWW unit costs – Euro for base year 2000 Average costs in
2000 - EA 17 Average cost (EUR / 1000 pkm)
Road Rail
Car Bus
Noise 5.2 1.3 3.9
Air pollution 12.7 20.7 6.9
Climate change 17.6 8.3 6.2
Total EA 17 35.5 30.3 17 Source: Infras-IWW study dated 2004
The above table shows the unit costs defined by Infras-IWW for the EA 17 (EU 15 plus Switzerland and Norway) for the base year 2000. These unit costs have been transferred to Kenyan values on the basis of the GDP/capita expressed in USD. This transfer has been made by calculating a transfer coefficient which adopts European GDP to Kenyan GDP in 2000 and increases the coefficient to the year 2012 in the same relation like the GDP growth..
Table 9.7: Transfer coefficients based on GDP/capita
GDP (mn USD) Population (1’000) USD/capita transfer coeffi-
cient EA 17 (EU 15 + Switzerland + Nor-way) 2000 8’645’360 389’634 22’188
Kenya 2000 12’000 31’254 384 0.018
Kenya 2012 37’229 43’178 862 0.038 Source: AMECO, Opendata
The total value of externalities for rail passenger km as well as for road passenger km has been calculated and their difference is the savings of externalities linked with the avoidance of road traffic.

190 591.10
153 Kenya Railways Corporation KRC Mombasa Commuter Railways Feasibility Study KRC/PLM/40/2011 Final Report
Pöyry Switzerland Ltd.
Table 9.8: Yearly savings from externalities
2018 2021 2030 2045
Saved pax km 598’758 1’092’590 14’769’353 35’808’768 Benefits mn KES 30.20 55.19 749.01 1’828.81 Benefits mn USD 0.35 0.65 8.76 21.38
9.5.5 Safety / Accidents Prevention of death and injuries accidents caused by road is worldwide the highest group of potential costs reduction. About 60% of cost reduction per vehicle km is a common value.
For Kenya no specific studies or data basis is available. Due to this European values were taken, adopted to local conditions and multiplied with the quantities of this project.
Non-government organisations like the International Road Federation (IRF) published studies where rough figures for Kenya were taken from. It can be remarked that the ac-cident rate in Kenya is quite high and the effects of the accidents are relatively serious due to missing safety regulations and bad road and vehicle conditions.
Table 9.9: Road Accidents in Kenya per year (rough figure)
Type of Accident Number of accidents per 100’000 people per year
fatalities 10
severe injuries 30
light injuries 100 Source: Consultants estimation based on several studies
For calculating the total numbers of saved accident costs by the railway project a per-centage of 7% of the inhabitants in the catchment areas was assumed to be influenced by the project. According to the population forecast in chapter 2 the total number of prevented accidents was calculated.
Values for accident costs were taken from European Standards and converted into Ken-yan values by comparing the national GDP for Kenya and the EU-27.
Table 9.10: Values for saved accidents
Accident values Value for saved ac-cidents in Europe
(EUR)
Value for saved ac-cidents in Kenya
(USD)
Value for saved ac-cidents in Kenya
(KES)
fatalities 1’000’000 239’400 20’349’000
severe injuries 58’119 9’276 788’442
light injuries 4’219 673 57’235 Source: Guide to cost-benefit analysis of investment projects, EA Commission
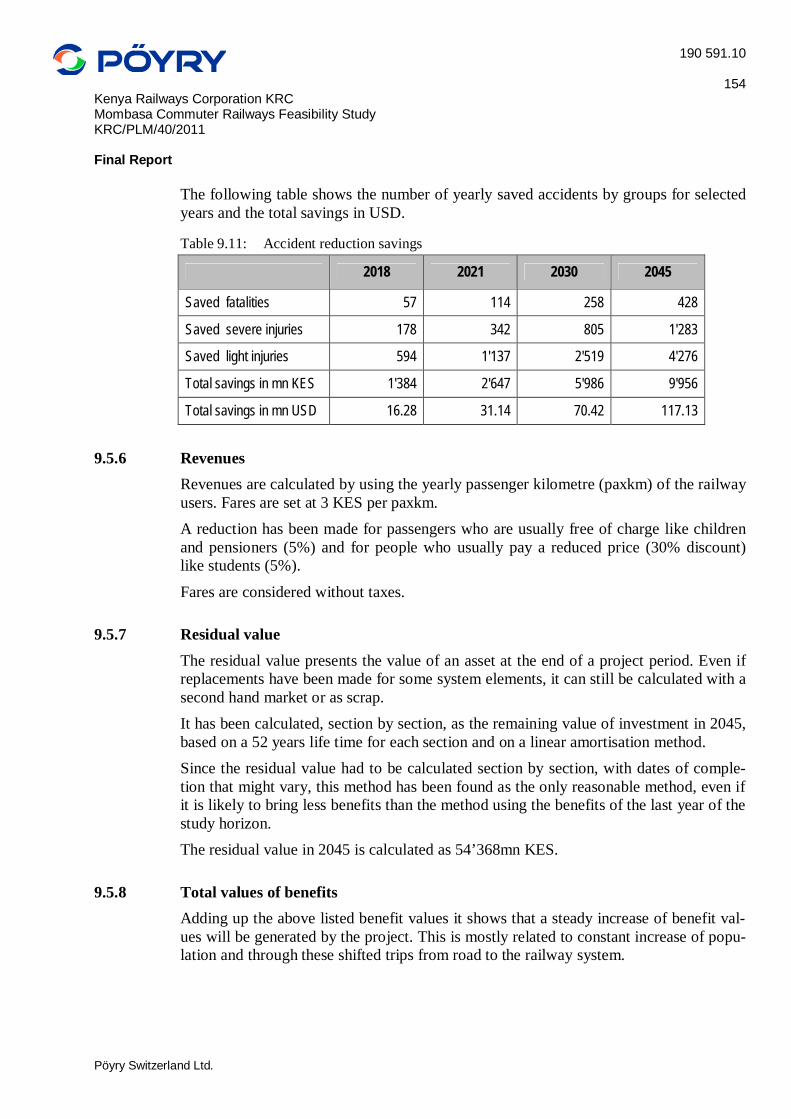
190 591.10
154 Kenya Railways Corporation KRC Mombasa Commuter Railways Feasibility Study KRC/PLM/40/2011 Final Report
Pöyry Switzerland Ltd.
The following table shows the number of yearly saved accidents by groups for selected years and the total savings in USD.
Table 9.11: Accident reduction savings
2018 2021 2030 2045
Saved fatalities 57 114 258 428
Saved severe injuries 178 342 805 1'283
Saved light injuries 594 1'137 2'519 4'276
Total savings in mn KES 1'384 2'647 5'986 9'956
Total savings in mn USD 16.28 31.14 70.42 117.13
9.5.6 Revenues Revenues are calculated by using the yearly passenger kilometre (paxkm) of the railway users. Fares are set at 3 KES per paxkm. A reduction has been made for passengers who are usually free of charge like children and pensioners (5%) and for people who usually pay a reduced price (30% discount) like students (5%).
Fares are considered without taxes.
9.5.7 Residual value The residual value presents the value of an asset at the end of a project period. Even if replacements have been made for some system elements, it can still be calculated with a second hand market or as scrap. It has been calculated, section by section, as the remaining value of investment in 2045, based on a 52 years life time for each section and on a linear amortisation method. Since the residual value had to be calculated section by section, with dates of comple-tion that might vary, this method has been found as the only reasonable method, even if it is likely to bring less benefits than the method using the benefits of the last year of the study horizon. The residual value in 2045 is calculated as 54’368mn KES.
9.5.8 Total values of benefits Adding up the above listed benefit values it shows that a steady increase of benefit val-ues will be generated by the project. This is mostly related to constant increase of popu-lation and through these shifted trips from road to the railway system.

190 591.10
155 Kenya Railways Corporation KRC Mombasa Commuter Railways Feasibility Study KRC/PLM/40/2011 Final Report
Pöyry Switzerland Ltd.
Figure 9.3: Project benefit development
Additional benefits which are listed in chapter 9.2 will not be monetised and must be evaluated in a separate stakeholder discussion.
9.6 Calculation of the economic internal rate of return (EIRR) The economic analysis has been performed by assembling the investments costs and the value of the effects, year by year, over the study period. This results in a yearly curve of the cash flow and into overall values of the economic analysis. The results can be summarised as per the following tables/figures.
Figure 9.4: Cash Flow Curve of economic values
0
5'000
10'000
15'000
20'000
25'000
30'000
2018
2019
2020
2021
2022
2023
2024
2025
2026
2027
2028
2029
2030
2031
2032
2033
2034
2035
2036
2037
2038
2039
2040
2041
2042
2043
2044
Developement of project benefits in mn KES
-20'000
0
20'000
40'000
60'000
80'000
100'000
120'000
2015
2016
2017
2018
2019
2020
2021
2022
2023
2024
2025
2026
2027
2028
2029
2030
2031
2032
2033
2034
2035
2036
2037
2038
2039
2040
2041
2042
2043
2044
2045
Cash flow in mn KES

190 591.10
156 Kenya Railways Corporation KRC Mombasa Commuter Railways Feasibility Study KRC/PLM/40/2011 Final Report
Pöyry Switzerland Ltd.
Table 9.12: Economic analysis – details
Econ
omic
anal
ysis
20
1520
1620
1720
1820
1920
2020
2120
2220
2320
2420
2520
2620
2720
2820
2920
30
Inves
tmen
ts co
sts-2
'033
-5'94
6-7
'296
-9'08
0-9
'080
-8'97
1-7
'051
-7'64
8-6
'933
-6'74
1-9
'433
-10'6
99-6
'783
-5'23
0-3
'670
-4'59
7Op
erati
on co
sts0
00
-964
-964
-964
-1'78
6-2
'318
-3'28
3-3
'757
-4'89
6-4
'896
-5'55
2-8
'127
-8'12
7-8
'127
Road
traffic
avoid
ed0
00
66
611
1432
4489
9311
513
714
214
7Ti
me s
aving
s0
00
00
01
12
36
68
99
9Ac
ciden
ts sa
vings
00
01'3
841'4
411'4
972'6
473'0
773'6
794'0
344'5
484'7
335'2
285'5
915'7
895'9
86Ex
terna
lities
00
030
3132
5575
164
226
460
478
592
701
725
749
Job C
reati
on0
00
480
480
480
612
932
944
996
1'052
1'052
1'108
1'128
1'128
1'128
Reve
nues
00
014
015
717
465
51'0
081'5
092'1
482'4
723'0
583'5
033'8
444'1
524'4
72Re
sidua
l valu
e0
00
00
00
00
00
00
00
0
total
costs
-2'03
3-5
'946
-7'29
6-1
0'044
-10'0
44-9
'934
-8'83
6-9
'966
-10'2
16-1
0'498
-14'3
29-1
5'595
-12'3
35-1
3'357
-11'7
98-1
2'725
total
effec
ts0
00
2'040
2'114
2'188
3'981
5'107
6'330
7'451
8'627
9'419
10'55
411
'411
11'94
512
'490
Cash
flow
-2'03
3-5
'946
-7'29
6-8
'003
-7'92
9-7
'746
-4'85
5-4
'859
-3'88
6-3
'047
-5'70
2-6
'176
-1'78
2-1
'946
147
-234
Econ
omic
anal
ysis
20
3120
3220
3320
3420
3520
3620
3720
3820
3920
4020
4120
4220
4320
4420
45
Inves
tmen
ts co
sts-3
'226
-2'46
4-2
'295
-3'08
1-1
'961
-1'92
1-1
'658
-4'52
2-7
25-3
'272
-4'33
7-3
'426
-3'02
8-6
'409
-3'62
2Op
erati
on co
sts-1
0'152
-10'4
39-1
0'737
-11'0
46-1
1'367
-11'7
01-1
2'047
-12'4
08-1
2'782
-13'1
71-1
3'575
-13'9
94-1
4'431
-14'8
84-1
5'355
Road
traffic
avoid
ed22
823
724
525
426
327
326
329
330
431
432
533
634
835
937
0Ti
me s
aving
s15
1516
1617
1718
1819
2020
2122
2223
Accid
ents
savin
gs6'2
486'4
796'7
106'9
417'1
727'4
357'6
997'9
628'2
268'4
898'7
839'0
769'3
699'6
639'9
56Ex
terna
lities
1'160
1'202
1'244
1'286
1'328
1'376
1'424
1'471
1'519
1'566
1'619
1'672
1'724
1'777
1'829
Job C
reati
on1'3
041'3
041'3
041'3
041'3
041'3
041'3
041'3
041'3
041'3
041'3
041'3
041'3
041'3
041'3
04Re
venu
es5'6
986'1
386'5
977'0
707'5
608'1
068'6
729'2
549'8
5610
'478
11'15
811
'861
12'58
313
'328
14'09
2Re
sidua
l valu
e0
00
00
00
00
00
00
010
4'609
total
costs
-13'3
78-1
2'902
-13'0
32-1
4'126
-13'3
28-1
3'622
-13'7
06-1
6'929
-13'5
07-1
6'443
-17'9
12-1
7'420
-17'4
59-2
1'293
-18'9
77tot
al eff
ects
14'65
315
'374
16'11
516
'871
17'64
418
'511
19'37
920
'302
21'22
822
'171
23'20
924
'270
25'35
026
'453
132'1
83Ca
sh flo
w1'2
742'4
723'0
842'7
444'3
164'8
895'6
733'3
737'7
215'7
285'2
976'8
497'8
915'1
5911
3'205

190 591.10
157 Kenya Railways Corporation KRC Mombasa Commuter Railways Feasibility Study KRC/PLM/40/2011 Final Report
Pöyry Switzerland Ltd.
Table 9.13: Overview of economic analysis result
Key figure Value NPV in 2014 (5.50%) -10'521
EIRR in 2014 4.31%
B/C 1.53
Present value of investment -80'037
Present value of effects 122'229
Following table shows the share of effects caused by the project. Biggest effects result from saved accident costs and the residual value which gives the asset value at the end of the project.
Table 9.14: Share of effects in total present value Present values Share of Benefits
Savings of road VOC 5'254 1.0% Time savings 333 0.1% Accidents savings 169'837 33.5% Externalities 26'515 5.2% Job Creation 31'080 6.1% Revenues 169'742 33.5% Residual value 104'609 20.6% total 507'369 100.0%
9.7 Risk and sensitivity analysis
9.7.1 Risk Analysis The risk analysis is presented in chapter 11. It shows different influences on the project costs as well as on the benefits and possible measures to avoid negative results.
9.7.2 Sensitivity Analysis As shown in the risk analysis, there is a certain possibility that influence factors will change during further phases of the project. This will have influence on the investment costs as well as on benefits. For analysing changes in the economic results, variations were analysed with increased costs and benefits to show the sensitivity of the project value.
In following sensitivity calculation, increased costs of the infrastructure of 20% have been assumed, which gives the following results:

190 591.10
158 Kenya Railways Corporation KRC Mombasa Commuter Railways Feasibility Study KRC/PLM/40/2011 Final Report
Pöyry Switzerland Ltd.
Table 9.15: Economic analysis results with increased investment costs
Key Figure Value NPV in 2014 (5.50%) -22'888 EIRR in 2014 3.30% B/C 1.27 Present value of investment -96'045 Present value of effects 122'229
Not surprisingly, the net present value calculation deceased to a more negative result and the EIRR has decreased its value for about 1%. In the next sensitivity calculation, all benefits (vehicle operating costs, time savings, ac-cident savings, job creation and saved externalities) are increased by 20% each.
Table 9.16: Economic analysis results with increased benefit values
Key Figure Value NPV in 2014 (5.50) 14'919 EIRR in 2014 7.10% B/C 1.83 Present value of investment -80'037 Present value of effects 146'675
The net present value of the turned to positive and the EIRR as well as the B/C in-creased significantly.
9.7.3 Scenario with reduced sections Analysing a reduced scenario in which only the ten most important sections of the net-work are built shows a significant change in the economic results. These changes can be explained by a high reduction of investment and operation costs and only slightly reduc-tions of benefits due to lower population density and traffic volumes in these sections.
The base case has already a positive NPV and the variant with increased benefits shows a considerable growth of the EIRR.
Table 9.17: Economic analysis results with increased benefit values
Key figure Value base case + 20% Invest Costs + 20% Benefits
NPV in 2014 (5.50%) 6'671 -3'766 31'548
EIRR in 2014 6.32% 5.10% 9.13%
B/C 1.81 1.50 2.17
Present value of investment -66'219 -79'462 -66'219
Present value of effects 119'531 119'531 143'437

190 591.10
159 Kenya Railways Corporation KRC Mombasa Commuter Railways Feasibility Study KRC/PLM/40/2011 Final Report
Pöyry Switzerland Ltd.
The following table shows the share of effects caused by the project. Most significant effects result from the revenue incomes and from the residual value which is the asset value at the end of the project in 2045.
Table 9.18: Share of effects of the Reduced Projekt in total present value Present values
(mn KES) Share of Benefits
Savings of road VOC 5'200 1.1%
Time savings 330 0.1%
Accidents savings 165'982 35.0%
Externalities 26'241 5.5%
Job Creation 27'016 5.7%
Revenues 168'021 35.5%
Residual value 81'094 17.1%
total 473'884 100.0%

190 591.10
160 Kenya Railways Corporation KRC Mombasa Commuter Railways Feasibility Study KRC/PLM/40/2011 Final Report
Pöyry Switzerland Ltd.
Table 9.19: Economic analysis of the reduced projekt – details (all values in mn KES)
Econ
omic
anal
ysis
20
1520
1620
1720
1820
1920
2020
2120
2220
2320
2420
2520
2620
2720
2820
2920
30
Inves
tmen
ts co
sts-2
'033
-5'94
6-7
'296
-9'08
0-9
'080
-8'97
1-7
'051
-7'64
8-6
'933
-4'42
9-4
'169
-4'70
9-7
94-1
'408
-590
-2'28
5Op
erati
on co
sts0
00
-964
-964
-964
-1'78
6-2
'318
-3'28
3-3
'757
-4'89
6-4
'896
-5'55
2-7
'553
-7'55
3-7
'553
Road
traffic
avoid
ed0
00
66
611
1432
4489
9311
513
514
014
5Ti
me s
aving
s0
00
00
01
12
36
68
99
9Ac
ciden
ts sa
vings
00
01'3
841'4
411'4
972'6
473'0
773'6
794'0
344'5
484'7
335'2
285'4
235'6
185'8
13Ex
terna
lities
00
030
3132
5575
164
226
460
478
592
693
717
741
Job C
reati
on0
00
480
480
480
612
932
944
996
1'052
1'052
1'052
1'052
1'052
1'052
Reve
nues
00
014
015
617
365
51'0
081'5
082'1
462'4
713'0
583'5
043'7
984'1
044'4
21Re
sidua
l valu
e0
00
00
00
00
00
00
00
0
total
costs
-2'03
3-5
'946
-7'29
6-1
0'044
-10'0
44-9
'934
-8'83
6-9
'966
-10'2
16-8
'185
-9'06
5-9
'606
-6'34
6-8
'960
-8'14
3-9
'838
total
effec
ts0
00
2'040
2'113
2'187
3'981
5'107
6'328
7'449
8'626
9'419
10'49
911
'110
11'63
912
'181
Cash
flow
-2'03
3-5
'946
-7'29
6-8
'003
-7'93
0-7
'747
-4'85
6-4
'859
-3'88
8-7
36-4
39-1
864'1
532'1
493'4
962'3
43
Econ
omic
anal
ysis
20
3120
3220
3320
3420
3520
3620
3720
3820
3920
4020
4120
4220
4320
4420
45
Inves
tmen
ts co
sts-3
'226
-2'46
4-2
'295
-3'08
1-1
'961
-1'92
1-1
'658
-4'52
2-7
25-3
'272
-4'33
7-3
'426
-3'02
8-6
'409
-3'25
6Op
erati
on co
sts-7
'842
-8'11
7-8
'403
-8'70
0-9
'009
-9'33
0-9
'665
-10'0
12-1
0'374
-10'7
50-1
1'142
-11'5
49-1
1'972
-12'4
13-1
2'871
Road
traffic
avoid
ed22
523
424
225
126
027
026
029
030
131
132
233
334
535
536
6Ti
me s
aving
s15
1516
1617
1718
1819
2020
2122
2223
Accid
ents
savin
gs6'0
416'2
696'4
986'7
266'9
557'2
167'4
777'7
398'0
008'2
618'5
538'8
449'1
369'4
279'7
19Ex
terna
lities
1'145
1'187
1'228
1'270
1'312
1'360
1'407
1'454
1'502
1'549
1'602
1'655
1'707
1'760
1'812
Job C
reati
on1'0
521'0
521'0
521'0
521'0
521'0
521'0
521'0
521'0
521'0
521'0
521'0
521'0
521'0
521'0
52Re
venu
es5'6
226'0
606'5
136'9
837'4
698'0
108'5
719'1
509'7
4710
'364
11'04
111
'739
12'45
713
'197
13'95
8Re
sidua
l valu
e0
00
00
00
00
00
00
081
'094
total
costs
-11'0
68-1
0'580
-10'6
98-1
1'780
-10'9
70-1
1'252
-11'3
23-1
4'534
-11'1
00-1
4'022
-15'4
79-1
4'975
-15'0
01-1
8'822
-16'1
27tot
al eff
ects
14'10
014
'817
15'54
916
'298
17'06
417
'925
18'78
519
'702
20'62
121
'556
22'58
923
'643
24'71
825
'813
108'0
24Ca
sh flo
w3'0
324'2
364'8
514'5
186'0
956'6
737'4
625'1
689'5
217'5
347'1
108'6
689'7
186'9
9291
'897

190 591.10
161 Kenya Railways Corporation KRC Mombasa Commuter Railways Feasibility Study KRC/PLM/40/2011 Final Report
Pöyry Switzerland Ltd.
10 FINANCIAL ASESSMENT
10.1 Introduction
10.1.1 Context: financial appraisal vs. economic appraisal The Financial viability assessment of the rail project differs from the Economic assess-ment with regards to its scope and context:
The Economic Appraisal covers Macro-economic environment, costs and externali-ties/indirect gains, to assess the economic surplus generated by its implementation from a National taxpayers and Authorities perspective; The Financial Appraisal considers the Micro-economic context of the project itself, fo-cusing on identification of the financial gap or surplus from construction and operations and the financing resources required to execute it.
The illustration below shows the interaction and differences between these two apprais-al tools, and the respective focus of Public and Private sectors (if any):
Figure 10.1: Socio-Economic vs. Financial appraisal (source RebelGroup)
Therefore, when performing the financial appraisal, only direct monetary costs and rev-enues (i.e. the operating, investment and financial cash flows) are taken into account to test the efficiency of use of capital invested and identify an operating gap or surplus, expressed in the form of a financial Internal Rate of Return (fIRR). Additionally, the fi-nancial appraisal can be used to test whether the project can sustain its own external fi-nancing and if not, the equivalent Funding Gap existing and that needs to be covered by the beneficiaries of the project (being the recipient of the overall economic benefits).
Public Perspective Socio-economic, environmen-tal and other external effects
Socio-Economic Value Financial or Corporate Value
Private perspective Inv, Ops and Financial costs and revenues

190 591.10
162 Kenya Railways Corporation KRC Mombasa Commuter Railways Feasibility Study KRC/PLM/40/2011 Final Report
Pöyry Switzerland Ltd.
10.1.2 The Distinction between Funding and Financing or the project The terms of Funding and Financing are often interchangeably used as the same term, and although they are closely interconnected fundamentally they relate to 2 different perspectives. Within this financial analysis, we make the following distinction which we believe is essential: Funding relates to a cash inflow to the project from the tickets sales, any govern-
mental contribution (such as operating or investment grants/subsidies), sale or leas-ing of KRC or state properties and use the proceeds to pay for the commuter rail pro-ject or any surplus from commercial activities that may be directed to the funding of the operations of the system. Therefore, Funding is the long-term cash inflow that pays for the realisation of the project, and is in nature partially or fully disconnected from its actual physical implementation (i.e. the construction/investment phase). The funding stream is primarily generated by the users of the system, through the price of the ticket; should this funding source is not sufficient to pay for the project, comple-mentary sources are needed (operating subsidy form the GoK or the Dis-tricts/Municipalities that benefits from the rail system for example). Funding is sized proportionally to the benefits by users willing to pay for.
Financing is the sourcing of capital, either long or short term, to pay for the imple-mentation of a specific project and bridging the time lag between an upfront need for resources (paying for construction) and the materialisation of any funding inflow in the future. Financing is therefore a temporary provision of resource, and would be expected to be paid back in a given time from the cash flow surplus resulting from the project funding. Such repayment also includes returns to the financiers in the form of interest (next to the principal repaying the funds borrowed), rent or dividends on the basis of future cash flows (funding) generated over the lifetime of a project. This also requires to assess the project on a life-cycle basis rather than looking just at the construction period. For the Mombasa Commuter Rail project financing is rele-vant to “pre-funding” of the system in expectations of future benefits from an en-hanced urban mode of transport.
In the illustration below, we present the distinction and interaction between Funding and Financing. The figure takes into account the project over its whole life-cycle, expressed in Net Present Value (NPV) terms:

190 591.10
163 Kenya Railways Corporation KRC Mombasa Commuter Railways Feasibility Study KRC/PLM/40/2011 Final Report
Pöyry Switzerland Ltd.
Figure 10.2: Financing Gap vs. Funding Gap (source RebelGroup)
One of the main objective in performing the financial appraisal of the Mombasa Com-muter Rail project is therefore to 1- identify the financing gap and 2-establish the fund-ing gap/surplus and 3- test the efficiency of the investment by calculating the IRR. Us-ing the financial model specifically design for the project (see chapter 3), the cash flows are forecasted on the overall project lifetime, assuming a minimum of 30 years mini-mum for each section.
10.2 Methodology and approach – cash flow engineering concepts
10.2.1 Defining the project cash flows As indicated above the financial appraisal relies on direct monetary cash flows, being cash inflows (revenues and subsidies) or cash outflows (costs and expenses). These are:
a. Operational Cash Flow: the operational cash flow of the project is the net ag-gregated value of all revenues (operating subsidies, revenue from ticket sales, revenue from commercial concessions if any) minus all operating costs incurred to run the commuter rail system (salaries, energy, consumption and maintenance costs, taxes, etc.). Depreciation is not included as it is a non-cash elements, that has an impact on tax calculation, and is by nature not relevant in the operational cash flow (except to estimate tax payments).
b. Investment Cash Flow: the investment cash flow is composed of the invest-ment costs (capital expenditures) incurred during the implementation of the rail system, which is split per section as the project is built in stages. A positive in-vestment cash flow is any form of investment grant or subsidy injected in the project (either from the GoK, KRC or any donor) which is earmarked for in-vestment and non-redeemable.
Revenue from sale of tickets
Repayment of Fi-nancing sources used for investment (such
as debt)
Financing Costs
Operating and Main-tenance Costs
Construction Period
Taxes
Who covers the cash flow gap?
Financing Gap
Who finances the construction?
Funding Gap
Operating Period
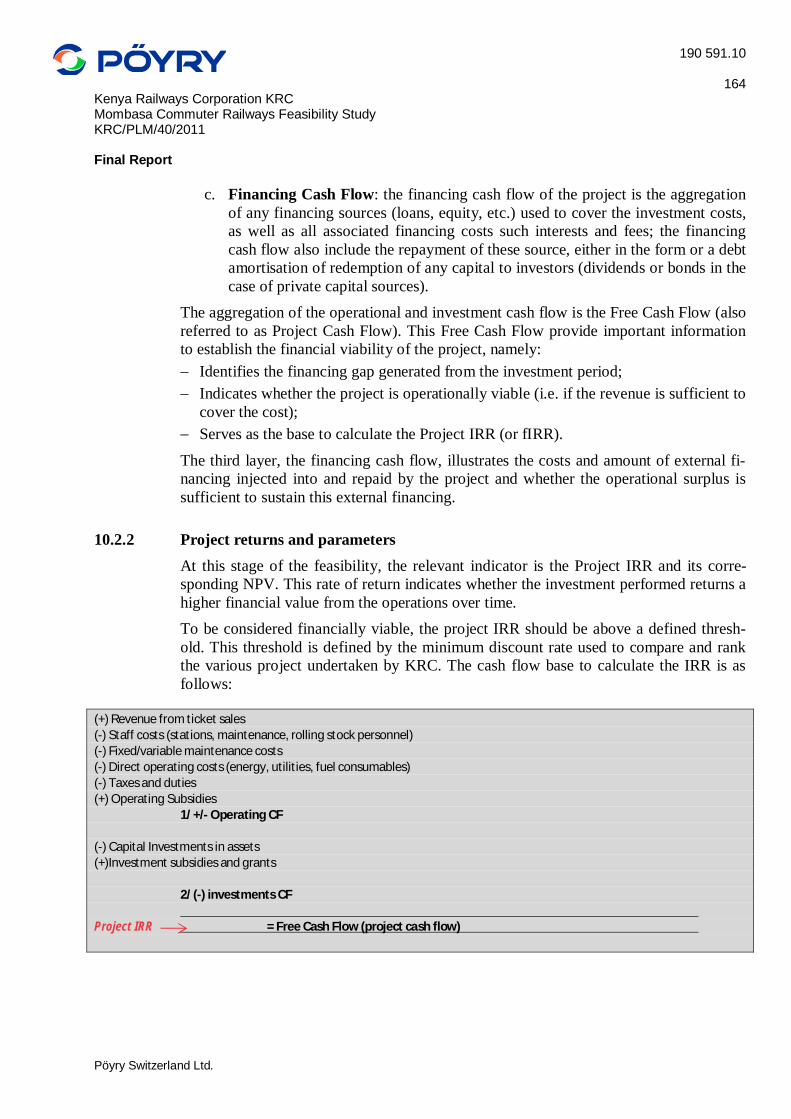
190 591.10
164 Kenya Railways Corporation KRC Mombasa Commuter Railways Feasibility Study KRC/PLM/40/2011 Final Report
Pöyry Switzerland Ltd.
c. Financing Cash Flow: the financing cash flow of the project is the aggregation of any financing sources (loans, equity, etc.) used to cover the investment costs, as well as all associated financing costs such interests and fees; the financing cash flow also include the repayment of these source, either in the form or a debt amortisation of redemption of any capital to investors (dividends or bonds in the case of private capital sources).
The aggregation of the operational and investment cash flow is the Free Cash Flow (also referred to as Project Cash Flow). This Free Cash Flow provide important information to establish the financial viability of the project, namely: Identifies the financing gap generated from the investment period; Indicates whether the project is operationally viable (i.e. if the revenue is sufficient to
cover the cost); Serves as the base to calculate the Project IRR (or fIRR).
The third layer, the financing cash flow, illustrates the costs and amount of external fi-nancing injected into and repaid by the project and whether the operational surplus is sufficient to sustain this external financing.
10.2.2 Project returns and parameters At this stage of the feasibility, the relevant indicator is the Project IRR and its corre-sponding NPV. This rate of return indicates whether the investment performed returns a higher financial value from the operations over time. To be considered financially viable, the project IRR should be above a defined thresh-old. This threshold is defined by the minimum discount rate used to compare and rank the various project undertaken by KRC. The cash flow base to calculate the IRR is as follows:
(+) Revenue from ticket sales (-) Staff costs (stations, maintenance, rolling stock personnel) (-) Fixed/variable maintenance costs (-) Direct operating costs (energy, utilities, fuel consumables) (-) Taxes and duties (+) Operating Subsidies
1/ +/- Operating CF
(-) Capital Investments in assets (+)Investment subsidies and grants 2/ (-) investments CF Project IRR = Free Cash Flow (project cash flow)

190 591.10
165 Kenya Railways Corporation KRC Mombasa Commuter Railways Feasibility Study KRC/PLM/40/2011 Final Report
Pöyry Switzerland Ltd.
10.2.3 Identifying the Financing Required and the Funding gap The estimation of the amount required in financing is established over the construction period of the corridors. It is composed of: Investment costs in infrastructures, superstructures and rolling stock Any financing costs incurred on external financing sources.
Available investment subsidies for investment are allocated to capital expenditures, and therefore comes in deduction of the required external financing necessary to complete the construction. On this basis, the financing required is equal to:
a. The cumulated capital expenditure (infra and rolling stock), after use of any in-vestment subsidies;
b. the financing costs during the financing disbursement period and capitalised with underlying assets.
The Funding Gap is assessed on the overall project lifespan, and expressed in Net Pre-sent Value to reflect the life-cycle perspective. It is the aggregation (in NVP terms) of:
a. Net operational cash flows + b. Net Investment cash flows
In other terms, the funding gap is the net present value of all free cash flow over the project’s life-cycle (i.e. 30 years after completion of the last segment). The discount rate used for discounting cash flow is the reference rate as applied in the Economic Apprais-al.
10.3 Financial model structure and input assumptions
10.3.1 Format and methodology The financial model is a custom-build spreadsheet model (Microsoft Excel). Its purpose is to forecasts the projects cash flows (operational, investment, funding inflows and fi-nancing cash flows) over the project analysis period. The model is designed following the FAST Standard8 and applies best-practices modelling principles such as: Segregation of input assumptions, in a specific input module. Left-to-right formula consistency over the calculation range. Compilation of main output and user interface in a custom made module (the dash-
board). Specific marking of input, imports and exports. No use of hardcoded value in calculation formulas.
8 www.fast-standard.org. FAST is an industry recognised, license-free modelling convention designed to standardise the construction of spreadsheet models in a transparent and comprehensive manner, using a set of structural and visual conventions enhancing robustness and reliability.

190 591.10
166 Kenya Railways Corporation KRC Mombasa Commuter Railways Feasibility Study KRC/PLM/40/2011 Final Report
Pöyry Switzerland Ltd.
10.3.2 Model Structure
10.3.2.1 Model logical structure and modules The financial model is structured as follows:
Figure 10.3: Mechanics of the spreadsheet financial model
Combining the capital expenditures, operating expenditures, ridership volumes and a proposed ticket pricing, the first step is to assess the viability of the system at operating level, taking into account the hard costs, revenues and amortisation of the investment realised. This already indicates whether the project can sustain its own financing or whether additional funding is required, primarily from KRC’s own resources or a Gov-ernmental subsidy. The Financing module is set to estimate a consolidated cost of fi-nancing over the project lifetime using an annual interest rate of 3% for the cost of the finance disbursed and repaid. Detailed quantitative assumptions are presented in the fol-lowing sections.
10.3.2.2 Accounting rules and implicit assumptions The financial model’s forecasting of cash flows and production of Financial statements (Profit&Loss, Balance Sheet and Cash Flow Statements) is based on the following structural specifications: The cash flows are aggregated at Commuter System level, in the form a KRC-owned
operating entity consolidating the overall system; assets are aggregated on a single, system-wide balance sheet;
The operational life-cycle for each sections is a minimum of 30 years from comple-tion of construction; this implies that the ultimate date of analysis (project end date) is 30 years after the implementation of the last section, namely 2060 (following the implementation of corridor 6). This results in the fact that some corridors are as-sessed on a longer period, from their respective implementation until the 30th operat-ing year of the last section. Please refer to the Chapter 4.5 and Figure 4.33 for details of implementation planning.
Financial Statements
Non Time-Based As-sumptions
Time-Based Assumptions
Traffic and Revenue
Capital Ex-penditures
Financing Module
NPV & IRR Output
Operating Expenditures
Dashboard
Timing and indexation
Calculation engine

190 591.10
167 Kenya Railways Corporation KRC Mombasa Commuter Railways Feasibility Study KRC/PLM/40/2011 Final Report
Pöyry Switzerland Ltd.
The Mombasa Commuter Rail system operating entity is subject to a 30% corporate tax, and allowed to carry losses forward for a maximum of 5 years. Taxes are as-sumed to be paid the same year they are due.9
The fixed assets are presented on the Balance Sheet at Book Value, assuming a Line-ar depreciation starting with the respective operating periods, using depreciation rates specific to each asset class on basis of the economic lifetimes indicated in Chapter 10.3.4.1 hereafter.
Net Present Value(s) are based on an annual Discount Rate of 5%. Figures are presented in Millions KES(otherwise specified). Currency exchange rate
from USD to KES is 1 USD = 85 KES. The model timeline is an annual resolution, and values stated at End of Period (i.e.
each columns is a period of 12 calendar months). Inflation rates are as follows, with reference date as of 1/1/2014 (except ticket price
which is escalated from 2018 onwards): CPI (Consumer Price Index) 2.5%, annual Salary costs inflation CPI + 0.5%, annual Ticket Price escalation 3% every 24 months
Working Capital: Creditors payment term of 45 days and Debtor term of 0 days.
10.3.3 Revenue input assumptions
10.3.3.1 Volumes / traffic forecasts The traffic forecasts is expressed in daily trips between 2 stations pairs (please refer to the list of stations in Chapter 4.4 and methodology of traffic forecasting). The financial model restates the daily ridership forecasts into an annual volume of passengers, on a 328 operating days basis. The volume forecasts is produced up to 2050. For operating period analysis beyond this period, volumes in operating periods post-2050 are capped at the same level following that date. For details of the ridership volume projections for the period 2017-2050, please refer to Chapter 3.4.
10.3.3.2 Revenue assumptions For the purpose of the feasibility analysis, the methodology selected is an estimate of the annual revenue at consolidated system level (incremental with the continuous im-plementation of the sections until the network is fully built) expressed in revenue per km/trip. The revenue benchmark selected is KES 3 / km, on basis of a benchmark pric-ing observed in Nairobi for similar services (i.e. commuter rail between the JK Airport and the Nairobi main station).
9 Ignoring the usual delay in time between calculation of Taxes on basis of previous year results and actual payment, often occurring within the following financial year. This convention is chosen for an more accurate calculation of ratios and cash flows.

190 591.10
168 Kenya Railways Corporation KRC Mombasa Commuter Railways Feasibility Study KRC/PLM/40/2011 Final Report
Pöyry Switzerland Ltd.
The revenue per sections is calculated as follows:
3 KES/km x distance of Section x daily trip per section x 300 days It is then summed for all sections per corridors and all corridors together. Considering that tickets are bought at the time of the travel or prepaid (in the case of cards), the Debtor payment term is 0 days (all revenue booked in the P&L is collected at the same period, without any working capital effects). Details of ridership forecasts are presented in Chapter 3.4.
10.3.4 Cost Estimates input assumptions
10.3.4.1 Capital expenditures assumptions The cost estimates for capital expenditures are defined per section, as detailed in chapter 8. The various items are grouped by nature, under the following categories. The detail per category is necessary for the ability to classify investment in different Fixed Asset types, each with a specific economic life time; this economic life time is the base to es-timate accounting depreciations in the profit and loss : Land – 80 years Civil Works – 80 years Stations buildings – 40 years Maintenance facilities – 40 years Ancillary works – 60 years Rolling Stock – 30 years Engineering and Construction supervision – 5 years (being Project Development
costs, it is assumed they can be capitalised separately and amortised over a shorter period)
Rail Equipment and structures: Substructures – 80 years Superstructures – 40 years Signalling – 20 years Communication equipment, passenger information – 20 years Electrification and Power Supply – 60 years
To be reported in the forecasted Balance Sheet, these items are combined in 6 different asset classes, each with a common economic life time for depreciation and renewal. Meanwhile, due to the prospective time span of analysis or due to their nature, some as-sets are not renewed and continue to be operated after full amortisation. Only the rolling stock and equipment are replaced. Other assets are considered to be continuously main-tained (as part of the O&M costs, see Annex 8) rather being physically replaced (which occurs after the analysis period in any case).
The capital expenditures assumptions are presented in Chapter 8.3. For model simulations, an annual inflation rate of 2.5% (different from 3% for costs and revenues in the operating phase) is applied to construction costs during the construction

190 591.10
169 Kenya Railways Corporation KRC Mombasa Commuter Railways Feasibility Study KRC/PLM/40/2011 Final Report
Pöyry Switzerland Ltd.
period, the total consolidated investments for the 6 corridors (including additional in-vestments during the operating phase to meet forecasted increases in service level and replacement of materials) in Nominal terms is KES 214,446 Mln (KES 214,5 Bln).
With regards to Rolling Stock investments, the unit cost for a 4 cars train set is USD 9,2 Mln (KES 782 Mln). The investment is calculated per corridor rather than sections, as each corridors has an incremental investment in rolling stock following the combination of volume growth and implementation of extensions (second and third sections for cor-ridors 1, 2 and 3) and corresponding to an increase of units in operation to maintain scheduled services. The implementation of rolling stock/train sets, rolled out in the peri-od 2017 to 2045 in line with expected traffic volume increase is presented in Annex 7. Similar to the construction costs, rolling stock investment costs are calculated in real terms and corrected an annual CPI indexation of 2.5% p.a. is applied on actual spending (as from 1/Jan/2014). Total investment in rolling stock amounts to KES 132 Bln in Nominal costs until 2045.
10.3.5 Operating and Maintenance Expenditures
10.3.5.1 Staff costs The staff costs are the salary and personnel expenses for Service staff (In stations), Maintenance staff (of network) and Train operations staff (driver and controllers). Depending on respective facilities, staff is organised in different crew mixes which
varies in nature and headcount. For rolling stock operations, a standard crew is assumed including drivers, conduc-
tors, attendants and a security officers. Services are operated during 16h, in 8h shifts; to cater for this service level, train op-
erating crews are based 2.5 FTE (Full time equivalent) for each position (1 FTE per position x 2 shifts + 0.5 FTE for reserve)
The monthly salary costs (on a 12 months per year basis) and crew/gang mixes are pre-sented in the tables hereafter:
Table 10.1: Monthly Staff Costs and crew mixes- Stations
Monthly Costs (KES)
Crew type 1 (FTE)
Crew type 2 (FTE)
Crew type 3 (FTE)
Crew type 4 (FTE)
Crew type 5 (FTE)
station manager 108,000 1 - - - - assistant /deputy 84,000 1 1 1 1 - office staff 60,000 10 8 6 4 3 technician 60,000 2 1 1 1 security staff 24,000 12 10 8 6 6 Total (Monthly) Cost 1,200,000 864,000 696,000 528,000 324,000
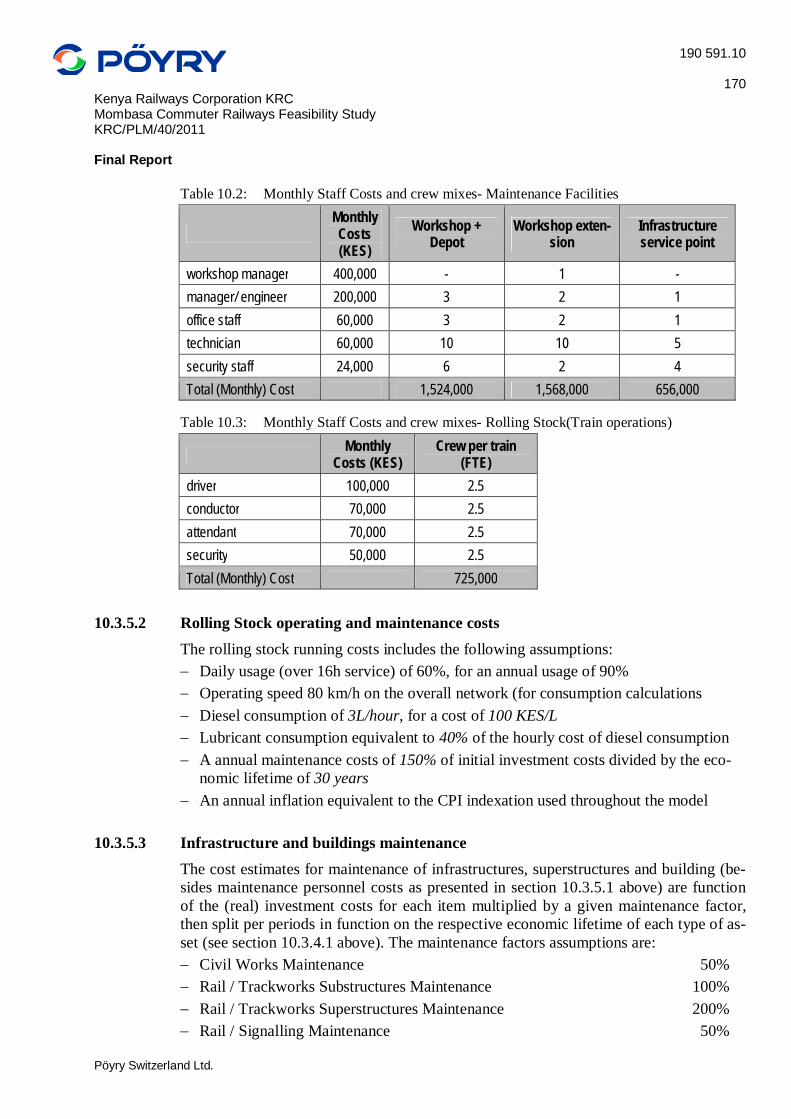
190 591.10
170 Kenya Railways Corporation KRC Mombasa Commuter Railways Feasibility Study KRC/PLM/40/2011 Final Report
Pöyry Switzerland Ltd.
Table 10.2: Monthly Staff Costs and crew mixes- Maintenance Facilities
Monthly Costs (KES)
Workshop + Depot
Workshop exten-sion
Infrastructure service point
workshop manager 400,000 - 1 - manager/ engineer 200,000 3 2 1 office staff 60,000 3 2 1 technician 60,000 10 10 5 security staff 24,000 6 2 4 Total (Monthly) Cost 1,524,000 1,568,000 656,000
Table 10.3: Monthly Staff Costs and crew mixes- Rolling Stock(Train operations)
Monthly Costs (KES)
Crew per train (FTE)
driver 100,000 2.5 conductor 70,000 2.5 attendant 70,000 2.5 security 50,000 2.5 Total (Monthly) Cost 725,000
10.3.5.2 Rolling Stock operating and maintenance costs The rolling stock running costs includes the following assumptions: Daily usage (over 16h service) of 60%, for an annual usage of 90% Operating speed 80 km/h on the overall network (for consumption calculations Diesel consumption of 3L/hour, for a cost of 100 KES/L Lubricant consumption equivalent to 40% of the hourly cost of diesel consumption A annual maintenance costs of 150% of initial investment costs divided by the eco-
nomic lifetime of 30 years An annual inflation equivalent to the CPI indexation used throughout the model
10.3.5.3 Infrastructure and buildings maintenance The cost estimates for maintenance of infrastructures, superstructures and building (be-sides maintenance personnel costs as presented in section 10.3.5.1 above) are function of the (real) investment costs for each item multiplied by a given maintenance factor, then split per periods in function on the respective economic lifetime of each type of as-set (see section 10.3.4.1 above). The maintenance factors assumptions are: Civil Works Maintenance 50% Rail / Trackworks Substructures Maintenance 100% Rail / Trackworks Superstructures Maintenance 200% Rail / Signalling Maintenance 50%

190 591.10
171 Kenya Railways Corporation KRC Mombasa Commuter Railways Feasibility Study KRC/PLM/40/2011 Final Report
Pöyry Switzerland Ltd.
Rail / Electrification & power supply 150% Rail / Communication Maintenance 50% Rail / Passenger Information Maintenance 50% Stations Maintenance 100% Maintenance Facilities Maintenance 150% Ancillary Works Maintenance 50%

190 591.10
172 Kenya Railways Corporation KRC Mombasa Commuter Railways Feasibility Study KRC/PLM/40/2011 Final Report
Pöyry Switzerland Ltd.
10.4 Overview of financing and procurement options
10.4.1 Project’s financing strategy To formulate a financing strategy for the Mombasa Commuter Rail system, feasibility and nature of generic private and public instruments is reviewed, in function of the con-sidered timing, objective and degree of implementation achieved.
10.4.1.1 Public vs. Private financing instruments The ability to structure and close a specific source of financing, in particular pri-vate/commercial financing, is strongly driven by Timing and level of complexity of specifications. As the implementation of the first section (starting with detailed design) is currently planned to start immediately after the feasibility study is finalised, arranging finance for the initial phase of the project is highly constrained by time. In essence, such initial financing should be already available or at least secured. Considering this, only public or budgetary resources, KRC’s own financing and specifically earmarked subsi-dies (either from the GoK or an international institutions such as the World Bank) can be realistically made available to support the first stage of development.
On a longer term, there are two main sources of financed that can be considered for the project: A Public/Sovereign source, arranged by KRC as borrower (most likely with a cer-
tain Guarantee from the GoK) or directly the Government of Kenya. Sovereign bor-rowing in the form of an ODA Loan could be considered at State level and directly allocated to finance Mombasa’s rail system, sourced from a partner country with an objective of supporting Economic development. IFI such as the World Bank group or the AfDB can be approached to provide either additional lending to the GoK or KRC, or alternatively enhance the overall rating of the project by providing addition-al guarantee products (e.g. via MIGA) and facilitate sourcing of external finance.
A private financing source, in the form of equity and debt, for future development stages of the project. Private finance in the rail sector remains meanwhile very scarce at global scale, as the risk profile of rail infrastructure is considered difficult to man-age for private lenders, or at a cost to the Authority exceeding the benefits sought from sourcing external capital. Private finance could be considered in the future stag-es of development and targeted at rolling stock, which risk profile is more ring-fenced to operations and easier to predict; various instruments / lease construction have been commonly applied for Rolling Stock worldwide. Exemple of private fi-nancing for infrastructure are limited to:
Infrastructure concessions for High Speed Track projects in Western Europe, with a full Demand guarantee by the Authority in the form of an availability payment (regardless of actual traffic). Only few projects in France and Spain have been considered at full demand risk and have almost failed to close due to the risk profiles;
This model is also commonly applied in Benelux for urban tram system, alt-hough being Light Rail, capital investment is substantially lower and can be
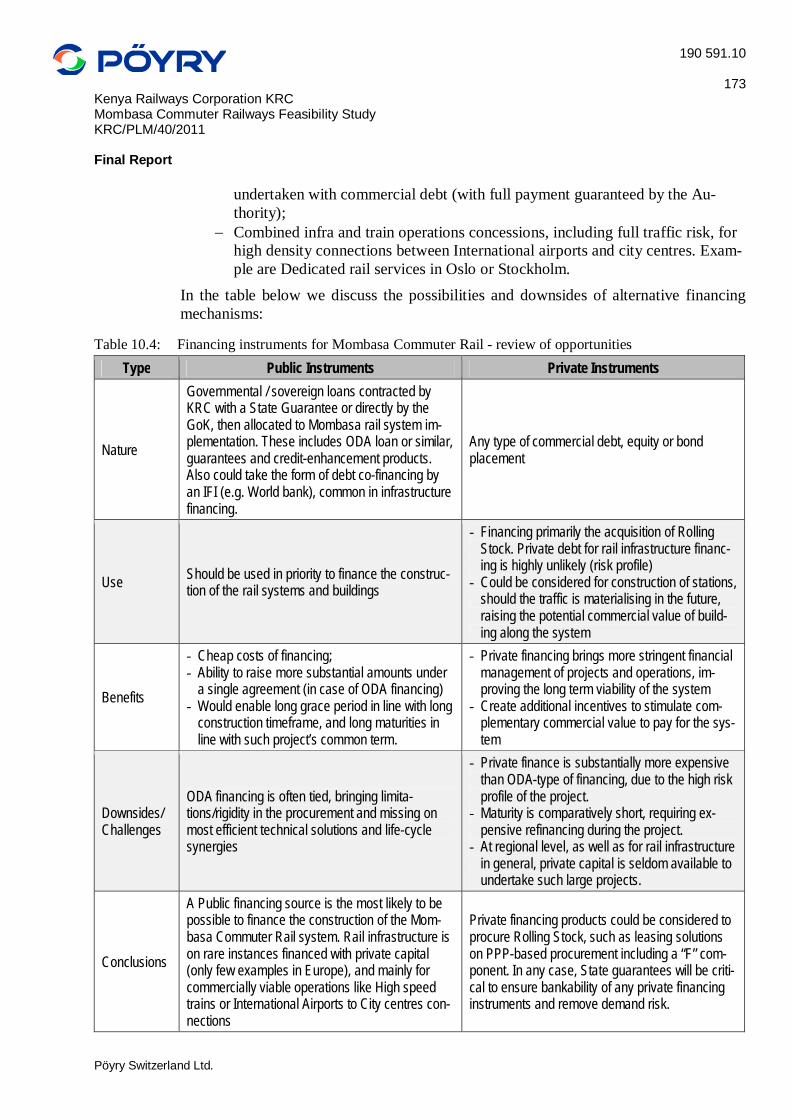
190 591.10
173 Kenya Railways Corporation KRC Mombasa Commuter Railways Feasibility Study KRC/PLM/40/2011 Final Report
Pöyry Switzerland Ltd.
undertaken with commercial debt (with full payment guaranteed by the Au-thority);
Combined infra and train operations concessions, including full traffic risk, for high density connections between International airports and city centres. Exam-ple are Dedicated rail services in Oslo or Stockholm.
In the table below we discuss the possibilities and downsides of alternative financing mechanisms:
Table 10.4: Financing instruments for Mombasa Commuter Rail - review of opportunities Type Public Instruments Private Instruments
Nature
Governmental / sovereign loans contracted by KRC with a State Guarantee or directly by the GoK, then allocated to Mombasa rail system im-plementation. These includes ODA loan or similar, guarantees and credit-enhancement products. Also could take the form of debt co-financing by an IFI (e.g. World bank), common in infrastructure financing.
Any type of commercial debt, equity or bond placement
Use Should be used in priority to finance the construc-tion of the rail systems and buildings
- Financing primarily the acquisition of Rolling Stock. Private debt for rail infrastructure financ-ing is highly unlikely (risk profile)
- Could be considered for construction of stations, should the traffic is materialising in the future, raising the potential commercial value of build-ing along the system
Benefits
- Cheap costs of financing; - Ability to raise more substantial amounts under
a single agreement (in case of ODA financing) - Would enable long grace period in line with long
construction timeframe, and long maturities in line with such project’s common term.
- Private financing brings more stringent financial management of projects and operations, im-proving the long term viability of the system
- Create additional incentives to stimulate com-plementary commercial value to pay for the sys-tem
Downsides/ Challenges
ODA financing is often tied, bringing limita-tions/rigidity in the procurement and missing on most efficient technical solutions and life-cycle synergies
- Private finance is substantially more expensive than ODA-type of financing, due to the high risk profile of the project.
- Maturity is comparatively short, requiring ex-pensive refinancing during the project.
- At regional level, as well as for rail infrastructure in general, private capital is seldom available to undertake such large projects.
Conclusions
A Public financing source is the most likely to be possible to finance the construction of the Mom-basa Commuter Rail system. Rail infrastructure is on rare instances financed with private capital (only few examples in Europe), and mainly for commercially viable operations like High speed trains or International Airports to City centres con-nections
Private financing products could be considered to procure Rolling Stock, such as leasing solutions on PPP-based procurement including a “F” com-ponent. In any case, State guarantees will be criti-cal to ensure bankability of any private financing instruments and remove demand risk.

190 591.10
174 Kenya Railways Corporation KRC Mombasa Commuter Railways Feasibility Study KRC/PLM/40/2011 Final Report
Pöyry Switzerland Ltd.
10.4.1.2 Context of Mombasa Commuter Rail system The project is currently considering to start design of the initial section by the end of 2013, and start construction within 2 years. This timing already reduces the ability to consider private financing, which would require: Time to structure and arrange a workable/bankable solution, including required State
guarantees , Leave the design specifications open – output specifications – for private procure-
ment to be considered and create benefits from technological innovation Considering this planning, the initial phase of the implementation will have to be al-ready be secured and available from a public source. Moreover, there have been limited recent examples of private financing solutions for large scale rail infrastructure in OECD countries, let alone in East Africa (see section 10.4.1.1). The recent High Speed Rail private financing project in France and Spain have face large delays due to the high risk level, and the project in Netherlands / Bel-gium (HSL South) took almost 10 years to be completed on basis of multiple PPP con-tracts for the various parts. These projects are based on Availability Payment mecha-nisms, therefore eventually paid by the beneficiary Authority and without any Traffic risk on the private financiers. This implies a high rating of the underlying State agency to enable competitive private financing sources. A market-risk based solutions has been briefly considered for example in Turkey in 2007/2008 for high speed rail connection from Istanbul to Ankara, and have proven unrealistic for any private contractor to be able to step in. Only few individual connections, between airport and city centres (with high traffic and high willingness to pay) have proven so far viable to be undertaken by private develop-ers and investors. Additionally, the planned various complementary components such as causeway and bridges represent additional risks and capital requirements, increasing the already high level of uncertainty, which is virtually impossible to package in an overall private financing solution of this size. The nature of the project, to provide affordable urban transport, is by nature not seeking to charge commercial tariffs, reducing the attractiveness of the project for commercial developers. This would therefore only work using an Availability concept, as regularly used for Light Rail system in Europe. Considering the current sovereign credit rating of Kenya, further detailed studies are required to establish whether such construction is eventually more economical for KRC.
10.4.2 Considerations with regards to PPP-based procurement and packaged financing solutions
10.4.2.1 Infrastructure vs. Operations We approach the project on two main levels:
1. Infrastructure: Implementation / construction of the infrastructure, including rail tracks and systems, bridges/tunnels and buildings (stations, maintenance

190 591.10
175 Kenya Railways Corporation KRC Mombasa Commuter Railways Feasibility Study KRC/PLM/40/2011 Final Report
Pöyry Switzerland Ltd.
sheds, etc.). the O&M components of the infrastructure can be analysed as a separate component (in other words can be packaged separately, although such segregation also reduces synergies between D&B and O&M Phase).
2. Service Operations: Acquisition and operations of the Rolling Stock and com-muter services operations (including maintenance/renewal). This is potentially an area where private schemes may be further explored.
As identified above, a project of the size and risk level of the Mombasa Commuter Rail system should primary seek Public financing solutions for the Infrastructure component, more realistically in line with the amount of capital required, the time frame of the reali-sation and the affordability. For the second, alternative procurement routes (packaged with a private financing solu-tion) can be considered with regards to: Design and procurement of the Rolling Stock, including long term maintenance con-
tracts. Management of train services and operations, including of stations. The regulation of
the network is meanwhile likely to remain under authority of KRC, for safety and in-terface risk reasons.
10.4.2.2 Procurement and financing of rolling Stock Private procurement of rolling stock is rather common. Various leasing or vendor fi-nancing solutions have been used often enough to avoid complexities which may delay the implementation of the overall project.
Under this approach, a long term contract for procurement (with maintenance services) of the rolling stock could be taken by KRC with a manufacturer, which would include the pre-financing provided under the same contract. Various options are possible: The choice of a unique provider. There are direct benefits are from large volume en-
abling better pricing and long term integrated framework with a manufacturer. Multiple contracts, renewed or retendered in connection with sizable upgrade of the
existing fleet. While lower volumes results in less bargaining power to negotiate pricing, flexibility can potentially offset the downsides by bringing more competition in tendering and leverage on future technological development and modernisation of trains.
The benefits and downsides should further be investigated to test a-the feasibility and value for money benefits from leasing/vendor financing b-the choice of a single long term contract or multiple contracts. Considering the large investment required in terms of Rolling Stock and the lengthy period on which they are performed, such integrated solutions present advantages to a classic debt financing in terms of implementation and suitability to the project planning.

190 591.10
176 Kenya Railways Corporation KRC Mombasa Commuter Railways Feasibility Study KRC/PLM/40/2011 Final Report
Pöyry Switzerland Ltd.
10.4.2.3 Private sector involvement in operations – Concession structures An alternative financing and procurement route for rolling stock and operations is the use of a packaged concession contract for train operations services, under and integrated procurement and management contract (DBFMO). The prospective scope could be: Design, Build & Finance the fleet of train sets required to meet the frequency and ca-
pacity targets Ensure train operations and maintenance (O&M), under a contractual performance
framework in terms of punctuality, maintenance and availability of the rolling stock and quality of service.
There are common models of DBFMO constructions in public transport concessions ei-ther in rail, light rail or ferry system available and potentially applicable. Meanwhile, due to the nature of the system of Public transport, such concession can likely not be subject to full market risk, unlike freight transport which is by nature a commercially driven activity and already subject to private concessions in East Africa. Availability-based or subsidised operations in exchange of guaranteed level of quality and financing and transfer of operational risks are the only viable scheme to make a pri-vate DBFMO concession bankable. Additionally, there are limited regional benchmark example to assess the feasibility of this option without further detailed PPP suitability assessment.
10.4.3 Proposed financing structure for the feasibility study
10.4.3.1 Assumptions In consideration of the various instruments available, the economic nature of the Mom-basa Commuter Rail system, shear size of the necessary investment and prospective planning for implementation, the financial appraisal is structured around the following financing scheme:
1. An initial Public subsidy of KES 10 Bln, estimated to be available from the KES 22 Bln already allocated by the State in the current budget and complementary grants from the World Bank10, and to be used in priority of any external financ-ing to initiate the implementation of the system. This subsidy is primarily allo-cated to project development and the capital investment in infrastructure.
2. A recurring annual subsidy of totalling KES 10 Bln on the period 2015-2017 (respectively KES 5 Bn, KES 2,5 Bln and KES 2,5 Bln), based on share of fore-casted funds generated by the newly introduced Rail Development Levy (RDL) reserved for the Mombasa Commuter Rail. This is based on an annual 8% growth of imports on which the RDL is computed (being 1.5% of value of im-ports)
10 To finance the detailed design of the first section as confirmed by KRC.

190 591.10
177 Kenya Railways Corporation KRC Mombasa Commuter Railways Feasibility Study KRC/PLM/40/2011 Final Report
Pöyry Switzerland Ltd.
3. The remainder of the financing requirement is covered by and ODA-type of debt financing, arranged through the Ministry of Finance for the purpose of financing the construction. It is based on the following generic terms:
a. 3% annual interest rate (typically lower but including a premium to cover currency fluctuations)
b. 40 years maturity, annuity repayment profile c. 10 years grace period on the repayments
d. Interest paid annually (not rolled up). 4. With regards to point 3.c, the prospective construction period is foreseen to
starch over 14 years. This imply that the ODA financing may be secured in 2 stages, to cater for longer disbursement period. For purpose of simplification, it is assumed that this structure is implicit and the first repayment of the first tranche carried out by the GoK, and not accounted for in the cash flow of the project.
10.4.3.2 Definition of the Financing Gap The financing Gap is defined as follows: (-) Aggregated Total investment costs
(-) Aggregated Financing costs incurred during the disbursement of a credit line availa-ble (mainly ODA loan, see above)
(+) Investment subsidies
= Financing Gap (2016-2030) Note: with the availability of budget allocated to KRC for rail development, and the share reserved for the Mombasa Commuter Rail, the requirement for availability of ex-ternal financing is delayed until 2016; prior to this, capital expenditures can be funded out of the cash reserved constituted by injection of investment subsidies.
10.4.3.3 Results: level of financing required for Mombasa Commuter Rail system imple-mentation On basis of a-the capital investments and implementation planning, b-the estimate of subsidies that can be allocated to the project and c-a generic ODA-type of loan and terms described above, the following Financing Gap is calculated:
Table 10.5: Financing Gap and ODA Loan disbursement for construction financing in Billion KES 2017 2018 2019 2020 2021 2022 2023 2024
Total Disbursement 5.5 12.6 13.4 19.1 19.0 19.4 15.4 21.9 of which Annual Interest 0.2 0.5 0.9 1.5 2.1 2.7 3.1 Repayments - - - - - - - -

190 591.10
178 Kenya Railways Corporation KRC Mombasa Commuter Railways Feasibility Study KRC/PLM/40/2011 Final Report
Pöyry Switzerland Ltd.
in Billion KES 2025 2026 2027 2028 2029 2030 Total Total Disbursement 19.8 26.3 33.0 13.5 12.6 24.8 256.3 of which Annual Interest 3.8 4.4 5.2 6.2 6.6 6.9 44.1 Repayments - - - - - - -
Over the construction period, the total financing gap is KES 256.3 Bln. This includes the financing of interests during construction of KES 44.1 Bln (at 3% annual rate, all inclu-sive). This amount of financing required is based on the underlying assumptions that no re-payments is made by KRC until the completion of the full construction in 2030. In prac-tice it is expected that ODA type of financing allow a maximum of 10 years grace peri-od11. It is assumed that an ODA financing being contracted at Sovereign state level will be structured separately (and possibly more than one loan). For the purpose of the feasi-bility assessment, the consultant has only included repayment of external financing to be borne by the project in the Operating period to estimate the overall Funding Gap (see section 10.5.2).
11 The grace period is the period (starting at first availability of funds) in which the lender does not require repayment of the principal but is still entitled interests over the total sum disbursed under the loan.

190 591.10
179 Kenya Railways Corporation KRC Mombasa Commuter Railways Feasibility Study KRC/PLM/40/2011 Final Report
Pöyry Switzerland Ltd.
10.5 Project Scenarios returns and viability gap assessment
10.5.1 Computation of financial feasibility parameters With the use of the financial model, we assess the viability surplus or gaps and critical parameters for KRC’s to establish the project’s viability. These key outputs are:
1. The financial Internal Rate of Return (fIRR), on basis of the project’s free cash flow (see Section 10.2.2 above)
2. The Net Present Value of the Project, by discounting the same free cash flow
3. The Funding Gap over the full project period (also in NPV Terms) 4. The Financing Gap over the construction period, to be addressed by external
sources 5. The level of support to the project’s viability, expressed in the amount of operat-
ing subsidies required for the operations to break-even (excluding repayment of external financing sources, see section 10.5.2 below)
The Funding Gap is defined as the aggregated amount of free cash flow necessary to cover operations and repay external financing (including financing costs).
10.5.2 Base Case scenario The base case is following the capital investment plan and implementation calendar of the 12 sections and rolling stock as presented above and in chapter [8]. Under the base case, the construction of the first section starts in 2014 (with detailed design) and as completed sections become operational, additional sections are implemented (following the priority ranking) for full completion in 2030.
The respective operational periods span at minimum over 30 years life-cycle for the last section to become operational (Corridor 6), resulting in a longer operational period for all sections implemented before this date pro rata of their period of completion. The maximum operating period is therefore 44 years, related to the first section (3.1 Mom-basa - Mazeras) implemented. In the base case scenario, operating and maintenance costs and tickets pricing are in-dexed according to the inflation rates presented in section 10.3.2.2 above. Equipment and structures are replaced according to their specified economic lifetime, requiring ad-ditional capital investment during operating periods. This imply that the project will continue operating after the project period of analysis.
Under this Base Case, the following results are calculated:
Table 10.6: Base Case Financial Feasibility Results In Billion KES Base Case
Project IRR n/a12
12 A project IRR can not be computed on an aggregated set of negative cash flow. N/A refers to a case where an IRR is not mathematically relevant and can not be computed.

190 591.10
180 Kenya Railways Corporation KRC Mombasa Commuter Railways Feasibility Study KRC/PLM/40/2011 Final Report
Pöyry Switzerland Ltd.
In Billion KES Base Case Project NPV (@ 5%), Excl Public Subsidies* (250.7) Project NPV (@ 5%), Incl Public Subsidies* (145.8) Funding Gap (until 2045) 937.9 Funding Gap (discounted @ 5 %) 358.8 External Financing Required 256.3 Operating Subsidy Required (to break-even) 245.5
* investment and operating subsidies Values in brackets are (-) negative values
As presented in the table above, the project is not financially sustainable in light of the ticket sales only. The primary reasons is the disconnected pricing of tickets compared to the cost of building and operating the system. In order to run at break even, KRC will require a total subsidy (until 2045) of KES 245.6 Bln (KES 86.3 Bln in NPV terms), which is an average yearly operating subsidy of KES 8.5 Bln13.
10.5.3 Sensitivity analysis
10.5.3.1 Alternative development = Reduced investment scenario An alternative scenario considered is the development of corridors 1 to 4 without the implementation of corridor 5 and 6 (Mazeras - Kaloleni - Takaungu and Malindi – Lamu). Under this alternative scenario, the capital investment are significantly reduced for the 2 corridors presenting the lowest prospective ridership volumes.
The result of the reduced investment scenario are presented in the following table:
Table 10.7: Reduced Investment Financial Feasibility Results
In Billion KES Reduced investment (no Cor. 5 and 6)
Project IRR n/a14 Project NPV (@ 5%), Excl Public Subsidies* (-201.9) Project NPV (@ 5%), Incl Public Subsidies* (-112.4) Funding Gap (until 2045) 674.1 Funding Gap (discounted @ 5 %) 278.9 External Financing Required 160.5 Operating Subsidy Required (to break-even) 194.2
* investment and operating subsidies Values in brackets are (-) negative values
13 Average over of operations period of the system from completion of the first corridor until the year 2045. 14 A project IRR can not be computed on an aggregated set of negative cash flow. N/A refers to a case where an IRR is not mathematically relevant and can not be computed.

190 591.10
181 Kenya Railways Corporation KRC Mombasa Commuter Railways Feasibility Study KRC/PLM/40/2011 Final Report
Pöyry Switzerland Ltd.
The reduced investment scenario as a significant impact on the funding gaps consider-ing: The required capital investment is reduced by 34% for infrastructure and track and
by 7.5% for rolling stock (on the period until 2045) While the equivalent reduction in revenue is only -1%, due to the relatively lower
ridership volumes compared to corridors 1 to 4. These 2 corridors also being realised at later stage, not implementing them results in shortening the financing period, which adds to the cost saving potential for the KRC in this scenario.
10.5.3.2 Sensitivity parameters tested The following Sensitivity analysis are performed: Sensitivities on capital costs : +/- 20% on construction (infra) and +/- 20% on rolling
stock purchase, both performed separately Sensitivities on operations & maintenance costs : +/- 20% on infra O&M costs and
+/- 20% on rolling stock O&M costs, both performed separately Sensitivities on volumes : +/- 20% on ridership, for all corridors Sensitivities on planning : construction timing + 6 months for all 12 corridors (ex-
cluding the design and preparation period)
10.5.4 Results Results of the sensitivity analysis are presented in the table below:
Table 10.8: Sensitivtiy Analysis Results
in Billion KES CapEx -20
CapEx +20
RS -20% RS +20 OpEx -
20 OpEx -
20 OpEx RS -
20 OpEx
RS +20 Vol -
20 Vol +20
Cons + 6m
Project IRR n/a n/a n/a n/a n/a n/a n/a n/a n/a n/a n/a Project NPV (Excl. Subsidies) (229.0) (272.3) (239.3) (262.0) (244.6) (256.7) (221.7) (279.7) (268.7) (232.7) (248.8)
Project NPV (Incl. Subsidies) (124.0) (167.6) (134.4) (157.2) (145.8) (145.8) (145.8) (145.8) (145.8) (145.8) (144.9)
Funding Gap (until 2060) 838.2 1,037.6 889.1 986.7 919.3 956.5 848.6 1,027.2 997.0 878.8 935.6
Funding Gap (dis-counted @ 5 %) 318.6 399.0 341.3 376.3 352.7 364.9 329.8 387.8 376.8 340.8 356.2
External Financing Required 214.0 298.6 241.5 271.1 256.3 256.3 256.3 256.3 256.3 256.3 256.1
Operating Subsidy Required (to break-even)
245.7 245.4 245.6 245.5 227.0 264.2 156.2 334.9 304.6 186.5 244.1
Operating Subsidy Required (NPV) 86.5 86.3 86.4 86.3 80.3 92.4 57.3 115.3 104.3 68.3 85.4

190 591.10
182 Kenya Railways Corporation KRC Mombasa Commuter Railways Feasibility Study KRC/PLM/40/2011 Final Report
Pöyry Switzerland Ltd.
in Billion KES CapEx -20
CapEx +20
RS -20% RS +20 OpEx -
20 OpEx -
20 OpEx RS -
20 OpEx
RS +20 Vol -
20 Vol +20
Cons + 6m
Average Annual Ops subsidy 8.5 8.5 8.5 8.5 7.8 9.1 5.4 11.5 10.5 6.4 8.4
10.5.5 Cash Flow Prognoses of the Base Case Simulation The cash flow prognosis of the Base Case simulation is presented in the following ta-bles.
Table 10.9 presents the projections over the D&B Period (until completion of the last corridor)
Table 10.10 presents the projections over the operating Period (when all 12 corridors are completed)

190 591.10
183 Kenya Railways Corporation KRC Mombasa Commuter Railways Feasibility Study KRC/PLM/40/2011 Final Report
Pöyry Switzerland Ltd.
Table 10.9: Cash Flow prognoses – D&B Phase
Table 10.10: Cash Flow prognoses – Operating Phase until 2045
CASH FLOW STATEMENT Total 2013 2014 2015 2016 2017 2018 2019 2020 2021 2022 2023 2024 2025 2026 2027 2028 2029 2030 Pre-Fcst devt devt devt devt dvt+ops dvt+ops dvt+ops dvt+ops dvt+ops dvt+ops dvt+ops dvt+ops dvt+ops dvt+ops dvt+ops dvt+ops dvt+ops
Operational Revenue Collected CF Mln KES 295,383 - - - - - - 140 156 178 696 1,103 1,700 2,468 2,919 3,767 4,391 5,010 5,590 6,202 Target Operating Subsidy Required PL&CF Mln KES 245,555 - - - - - - 1,656 1,933 1,955 2,098 2,962 3,614 3,800 5,195 4,825 5,583 8,305 8,592 8,359 Stations Ops Total Staff Costs PL&CF Mln KES (21,935) - - - - - - (93) (96) (99) (181) (242) (295) (333) (448) (482) (536) (594) (622) (640) Maintenance Hubs Total Staff Costs PL&CF Mln KES (1,379) - - - - - - - - - - - - - (19) (22) (32) (36) (37) (38) Rolling Stock Total Staff Costs PL&CF Mln KES (24,163) - - - - - - (78) (81) (83) (139) (176) (227) (269) (349) (360) (409) (579) (596) (614) Operational Expenditure Paid CF Mln KES (492,238) - - - - - - (1,267) (1,479) (1,519) (2,473) (3,647) (4,793) (5,665) (7,297) (7,728) (8,998) (12,106) (12,927) (13,269) Net Operating Cash Flow Before Tax Mln KES 1,223 - - - - - 357 433 433 - - - - - - - - - -
Corporate Tax Paid CF Mln KES (1,223) - - - - - - (357) (433) (433) - - - - - - - - - - Net Operating Cash Flow After Tax Mln KES - - - - - - - - - - - - - - - - - - -
Total FA Capital Expenditures CF Mln KES (169,665) - - (660) (1,902) (6,602) (9,598) (12,470) (12,812) (13,636) (11,876) (13,491) (9,829) (11,743) (15,976) (16,670) (12,779) (7,342) (6,063) (6,215) Total Rolling Stock Nominal Costs CF Mln KES (132,725) - - - - - (6,737) - - (4,534) (5,577) (3,811) (2,930) (7,007) - (5,259) (15,092) - - (11,609) Asset Class-Land&Infra Reinvestment, Nominal CF Mln KES - - - - - - - - - - - - - - - - - - - - Asset Class-Power Supply & Ancillaries Reinvestment, Nominal CF Mln KES - - - - - - - - - - - - - - - - - - - - Asset Class-Superstructures&Buildings Reinvestment, Nominal CF Mln KES - - - - - - - - - - - - - - - - - - - - Asset Class-Rolling Stock Reinvestment, Nominal CF Mln KES - - - - - - - - - - - - - - - - - - - - Asset Class-Signalling&Communication Reinvestment, Nominal CF Mln KES (2,384) - - - - - - - - - - - - - - - - - - - Asset Class-Development Costs Reinvestment, Nominal CF Mln KES - - - - - - - - - - - - - - - - - - - - Investment During Operational Phase Nominal CF Mln KES (42,397) - - - - - - - - - - - - - - - - - - - Investment Subsidy Received CF Mln KES 20,000 - - 10,000 7,500 2,500 - - - - - - - - - - - - - - Free Cash Flow Mln KES (327,171) - 9,340 5,598 (4,102) (16,335) (12,470) (12,812) (18,171) (17,453) (17,302) (12,759) (18,751) (15,976) (21,929) (27,871) (7,342) (6,063) (17,824)
Equity Injection CF Mln KES - - - - - - - - - - - - - - - - - - - - SubDebt Amount Disbursed CF Mln KES - - - - - - - - - - - - - - - - - - - - ODA Senior Debt Disbursement CF Mln KES 256,296 - - - - - 5,500 12,635 13,356 19,115 18,971 19,390 15,428 21,882 19,764 26,310 33,041 13,504 12,630 24,769 Upfront Fee Paid CF Mln KES - - - - - - - - - - - - - - - - - - - - Commitment Fee Paid CF Mln KES - - - - - - - - - - - - - - - - - - - - Cash Flow Available for Debt Service Mln KES (70,875) - 9,340 5,598 (4,102) (10,836) 165 544 945 1,518 2,087 2,669 3,132 3,788 4,381 5,171 6,162 6,567 6,946
ODA Senior Debt Interest Paid CF Mln KES (132,497) - - - - - - (165) (544) (945) (1,518) (2,087) (2,669) (3,132) (3,788) (4,381) (5,171) (6,162) (6,567) (6,946) ODA Senior Debt Linear Repayment CF Mln KES (256,296) - - - - - - - - - - - - - - - - - - - Cash Flow Available for Subordinated Debt Mln KES (459,668) - 9,340 5,598 (4,102) (10,836) (0) 0 0 0 (0) - 0 0 0 0 (0) - (0)
Subordinated Debt Interest Paid CF Mln KES - - - - - - - - - - - - - - - - - - - - Subordinated Debt Sculpted Repayment CF Mln KES - - - - - - - - - - - - - - - - - - - - Cash Flow Available for Equity Mln KES (459,668) - 9,340 5,598 (4,102) (10,836) (0) 0 0 0 (0) - 0 0 0 0 (0) - (0)
Equity Redeemed CF Mln KES - - - - - - - - - - - - - - - - - - - - Cash Flow Available for Dividends Mln KES (459,668) - 9,340 5,598 (4,102) (10,836) (0) 0 0 0 (0) - 0 0 0 0 (0) - (0)
Dividends Declared&Paid PL&CF Mln KES - - - - - - - - - - - - - - - - - - - - Net Cash Movement over the Period Mln KES (459,668) - 9,340 5,598 (4,102) (10,836) (0) 0 0 0 (0) - 0 0 0 0 (0) - (0)
Cash Balance BEG Mln KES - - 9,340 14,938 10,836 - (0) 0 0 0 (0) (0) (0) 0 0 0 (0) (0) Plus: Net Cash Movement over the Period - Mln KES (459,668) - - 9,340 5,598 (4,102) (10,836) (0) 0 0 0 (0) - 0 0 0 0 (0) - (0)
Cash Balance Mln KES - 9,340 14,938 10,836 - (0) 0 0 0 (0) (0) (0) 0 0 0 (0) (0) (0)
CASH FLOW STATEMENT Total 2031 2032 2033 2034 2035 2036 2037 2038 2039 2040 2041 2042 2043 2044 2045 ops ops ops ops ops ops ops ops ops ops ops ops ops ops ops
Operational Revenue Collected CF Mln KES 295,383 - 8,138 9,031 9,995 11,035 12,154 13,422 14,787 16,255 17,832 19,524 21,417 23,448 25,624 27,954 30,446 Target Operating Subsidy Required PL&CF Mln KES 245,555 - 9,789 10,294 10,400 11,170 11,348 11,372 11,768 12,503 12,226 12,575 13,128 13,703 13,412 13,581 14,271 Stations Ops Total Staff Costs PL&CF Mln KES (21,935) - (722) (767) (815) (866) (921) (980) (1,042) (1,109) (1,180) (1,256) (1,337) (1,424) (1,517) (1,616) (1,721) Maintenance Hubs Total Staff Costs PL&CF Mln KES (1,379) - (54) (57) (60) (63) (66) (70) (73) (77) (82) (86) (91) (96) (101) (107) (113) Rolling Stock Total Staff Costs PL&CF Mln KES (24,163) - (777) (829) (885) (974) (1,036) (1,100) (1,185) (1,309) (1,366) (1,463) (1,604) (1,732) (1,825) (1,964) (2,153) Operational Expenditure Paid CF Mln KES (492,238) - (16,375) (17,672) (18,635) (20,301) (21,478) (22,644) (24,255) (26,263) (27,430) (29,293) (31,513) (33,900) (35,594) (37,850) (40,730) Net Operating Cash Flow Before Tax Mln KES 1,223 - - - - - - - - - - - - - - -
Corporate Tax Paid CF Mln KES (1,223) - - - - - - - - - - - - - - - - Net Operating Cash Flow After Tax Mln KES - - - - - - - - - - - - - - - -
Total FA Capital Expenditures CF Mln KES (169,665) - - - - - - - - - - - - - - - - Total Rolling Stock Nominal Costs CF Mln KES (132,725) - (2,380) (2,439) (6,251) (2,563) (2,627) (5,385) (6,900) (1,414) (5,799) (7,430) (7,616) (3,123) (6,401) (9,842) - Asset Class-Land&Infra Reinvestment, Nominal CF Mln KES - - - - - - - - - - - - - - - - - Asset Class-Power Supply & Ancillaries Reinvestment, Nominal CF Mln KES - - - - - - - - - - - - - - - - - Asset Class-Superstructures&Buildings Reinvestment, Nominal CF Mln KES - - - - - - - - - - - - - - - - - Asset Class-Rolling Stock Reinvestment, Nominal CF Mln KES - - - - - - - - - - - - - - - - - Asset Class-Signalling&Communication Reinvestment, Nominal CF Mln KES (2,384) - - - - - - - (883) - - (158) (140) (352) - (491) (360) Asset Class-Development Costs Reinvestment, Nominal CF Mln KES - - - - - - - - - - - - - - - - - Investment During Operational Phase Nominal CF Mln KES (42,397) - (4,867) (3,200) (2,789) (1,236) (1,870) (1,683) - (3,689) - (1,621) (3,725) (1,807) (5,646) (4,102) (6,162) Investment Subsidy Received CF Mln KES 20,000 - - - - - - - - - - - - - - - - Free Cash Flow Mln KES (327,171) (7,247) (5,639) (9,040) (3,799) (4,496) (7,068) (7,783) (5,103) (5,799) (9,209) (11,481) (5,281) (12,047) (14,435) (6,522)
Equity Injection CF Mln KES - - - - - - - - - - - - - - - - - SubDebt Amount Disbursed CF Mln KES - - - - - - - - - - - - - - - - - ODA Senior Debt Disbursement CF Mln KES 256,296 - - - - - - - - - - - - - - - - Upfront Fee Paid CF Mln KES - - - - - - - - - - - - - - - - - Commitment Fee Paid CF Mln KES - - - - - - - - - - - - - - - - - Cash Flow Available for Debt Service Mln KES (70,875) (7,247) (5,639) (9,040) (3,799) (4,496) (7,068) (7,783) (5,103) (5,799) (9,209) (11,481) (5,281) (12,047) (14,435) (6,522)
ODA Senior Debt Interest Paid CF Mln KES (132,497) - (7,689) (7,433) (7,176) (6,920) (6,664) (6,407) (6,151) (5,895) (5,639) (5,382) (5,126) (4,870) (4,613) (4,357) (4,101) ODA Senior Debt Linear Repayment CF Mln KES (256,296) - (8,543) (8,543) (8,543) (8,543) (8,543) (8,543) (8,543) (8,543) (8,543) (8,543) (8,543) (8,543) (8,543) (8,543) (8,543) Cash Flow Available for Subordinated Debt Mln KES (459,668) (23,479) (21,615) (24,759) (19,262) (19,703) (22,019) (22,477) (19,541) (19,981) (23,134) (25,150) (18,694) (25,203) (27,335) (19,166)
Subordinated Debt Interest Paid CF Mln KES - - - - - - - - - - - - - - - - - Subordinated Debt Sculpted Repayment CF Mln KES - - - - - - - - - - - - - - - - - Cash Flow Available for Equity Mln KES (459,668) (23,479) (21,615) (24,759) (19,262) (19,703) (22,019) (22,477) (19,541) (19,981) (23,134) (25,150) (18,694) (25,203) (27,335) (19,166)
Equity Redeemed CF Mln KES - - - - - - - - - - - - - - - - - Cash Flow Available for Dividends Mln KES (459,668) (23,479) (21,615) (24,759) (19,262) (19,703) (22,019) (22,477) (19,541) (19,981) (23,134) (25,150) (18,694) (25,203) (27,335) (19,166)
Dividends Declared&Paid PL&CF Mln KES - - - - - - - - - - - - - - - - - Net Cash Movement over the Period Mln KES (459,668) (23,479) (21,615) (24,759) (19,262) (19,703) (22,019) (22,477) (19,541) (19,981) (23,134) (25,150) (18,694) (25,203) (27,335) (19,166)
Cash Balance BEG Mln KES (0) (23,479) (45,094) (69,853) (89,115) (108,818) (130,837) (153,314) (172,856) (192,837) (215,971) (241,121) (259,816) (285,019) (312,354) Plus: Net Cash Movement over the Period - Mln KES (459,668) - (23,479) (21,615) (24,759) (19,262) (19,703) (22,019) (22,477) (19,541) (19,981) (23,134) (25,150) (18,694) (25,203) (27,335) (19,166)
Cash Balance Mln KES (23,479) (45,094) (69,853) (89,115) (108,818) (130,837) (153,314) (172,856) (192,837) (215,971) (241,121) (259,816) (285,019) (312,354) (331,520)

190 591.10
184 Kenya Railways Corporation KRC Mombasa Commuter Railways Feasibility Study KRC/PLM/40/2011 Final Report
Pöyry Switzerland Ltd.
11 CONCLUSIONS AND RECOMMENDATIONS
11.1 Technical concept For the further planning of the project a detailed programme of all necessary studies and project definitions required must be established. Update of maps and planning information is essential. This includes topographical, geo-technical and hydrological studies and field surveys. With the updated project basis a further optimisation of the design is possible, which will limit the risks of the invest-ment costs. The project definitions include the determination of applicable railway standards, in par-ticular with regards to minimum clearance outline, technical parameters for the align-ment, and permissible axle loads.
The location of the city of Mombasa on the island requires a couple of large bridges for the connection of the railway to the mainland and to cross the long creeks northern to Mombasa. These bridges have a high impact on the costs of the project:
Table 11.1: Large bridges of the Corridor 1: Mombasa – Likoni – Ramisi Name Structure Mileage from - to Length Costs (mn KES)
Mwache Creek Bridge km 12.5 km 13.3 800 m 3’456 Tsunza Viaduct Bridge km 13.3 km 15.8 2’500 m 6’912 Bombo Creek Bridge km 19.1 km 20.7 1’600 m 7’200
Table 11.2: Large bridges of the Corridor 2: Mombasa – Kilifi – Malindi Name Structure Mileage from - to Length Costs (mn KES)
Mombasa City Viaduct Bridge km 0.6 km 2.2 1'600 m 4’608 Mombasa Harbour Bridge km 2.2 km 3.0 800 m 4’896 Mtwapa Creek Bridge km 14.9 km 15.3 350 m 2’142 Takaungu Creek Bridge km 48.4 km 48.7 300 m 1’836 Kilifi Creek Bridge km 53.3 km 53.9 550 m 3’366 Mida Creek Bridge km 87.6 km 88.2 600 m 3’672
Table 11.3: Large bridges of the Corridor 4: Likoni Ferry – Junda – Bamburi Name Structure Mileage from - to Length Costs (mn KES)
Junda Creek Bridge km 6.4 km 7.3 900 m 7’344
The consultant recommends to create an in-depth feasibility study for these bridge struc-tures to verify the feasibility and the estimated costs as well as for limitation of the risks before detailed planning is started.

190 591.10
185 Kenya Railways Corporation KRC Mombasa Commuter Railways Feasibility Study KRC/PLM/40/2011 Final Report
Pöyry Switzerland Ltd.
11.2 Environmental and social impact The development of the Mombasa commuter railway is expected to have an overall pos-itive impact on the environment, as railway transport is a sustainable alternative to in-creasing motorised vehicle traffic. However, the impacts of the project on many differ-ent aspects of the physical, natural and socio-economic environment will be considera-ble, due to:
The extensive scale of the area traversed by the railway corridors. The large variety of land uses it crosses, including densely inhabited urban areas, a
very high number of small parcels of land, and areas of high biodiversity. The Consultant therefore recommends:
Carrying out a full ESIA and RAP in the next project stage Making the Preliminary ESIA and especially the planning phase ESMP available
to the detailed design engineers: the need for and/or extent of many mitigation measures recommended for the construction and operation phases can be reduced or made redundant by applying the recommended planning phase measures.
A strong focus on continued stakeholder involvement throughout the next project phases.
11.3 Economic appraisal The economic analysis for the total project concludes that this project is not recom-mendable in total. The benefit/cost factor is above one but the net present value of the total project is negative and the economic internal rate of return is below 5.5%. The corridor 6: Malindi – Lamu is not recommended to be included in the Mombasa commuter railway network. The passenger traffic which is forecasted for this corridor is very low with an only slight increase up to 2045. This corridor should be examined by a new study with the focus freight transport in conjunction with the Lamu port project. The corridor 5 Mazeras – Takaungu shall be included to this freight traffic study, repre-senting a bypass to Mombasa for freight trains from Lamu to Nairobi. The focus to heavy freight traffic to be considered on this line requires different standards than for commuter railways and the alignment which is developed for commuter railway in cor-ridor 5 will not match the requirements for heavy freight transport.
The consultant recommends to proceed the project including the corridors 1 – 4. The re-duced project without corridors 5 and 6 has an enhanced benefit/cost factor, the net pro-ject value is positive and the economic internal rate of return is above 5.5%. However, the socio-economic analysis is not the only factor used to justify the choice of a project and it is up to the KRC, the Kenyan authorities and other stakeholders to dis-cuss further effects and advantages which were not put into comparable values and eco-nomic calculation methods. Furthermore, the risk analysis and the sensitivity analysis show that the results of the calculation change when the input value differ from those used in this study.

190 591.10
186 Kenya Railways Corporation KRC Mombasa Commuter Railways Feasibility Study KRC/PLM/40/2011 Final Report
Pöyry Switzerland Ltd.
It is therefore recommended to conduct further design studies and traffic demand inves-tigations (e.g. including freight traffic demand) for the purpose of obtaining more pre-cise cost and benefit assumptions.
11.4 Financial assessment On basis of the above analysis, with regards to the financial viability and feasibility of the Mombasa Commuter Rail project, we can draw the following conclusions and rec-ommendations:
1. Considering the primary objective of the project to enhance mobility of popula-tion and provide a competitive, safe, reliable and sustainable alternative mode of transport in the Mombasa and surrounding urban centres, the level of the ticket price charged to users is in essence disconnected from the economic cost of the project, in order to achieve other wider economic benefits.
2. Acknowledging this core objective, the Mombasa Commuter Rail project is not considered financially viable and able to sustain its own financing, as the cost of running the services exceeds the actual direct revenue to be expected from rid-ership. Operations will require an operating subsidy to break-even, which should at minimum equal the economic (direct and indirect) gains expected from the project’s implementation. This is illustrated by the fact that the NPV of the pro-ject is negative over the considered project period, for which a financial IRR cannot be computed. The Funding Gap on the overall project period amount to KES 358,8 Bln (in Net Present Value terms over the period 2014-2060, dis-counted at 5% p.a.).
3. Pursuant to point 2., the project cannot sustain its own external financing, neces-sary in addition to Publicly-sourced investment subsidies already identified to support rail projects in Kenya; requirement for external financing to pay for in-vestments shall be sought at Sovereign level or directly on KRC’s balance sheet, although eventually fully guaranteed by the GoK.
4. The reduced investment scenario, under which corridors 5 and 6 are not imple-mented, significantly reduces public resources required. As the reduction of rev-enue is relatively minor compared to the savings in capital investments, the funding gap is 30% lower for KRC.
5. It is highly unlikely that private financing sources can be found to support the design and construction of the project, particularly acknowledging that detailed design is already scheduled by KRC for the initial stage, which further lowers prospective Value-for-Money gains theoretically arising from integrated private contracting and financing (input vs. output-specifications-driven procurement). Only with full recourse on the GoK could private financing be feasible, which would in the render this source more expensive than public financing and cancel the Value-for-Money benefits necessary to justify private sector involvement.
6. Potential involvement of Private Sector may be sought at the operational level of the project. Such involvement should achieve a higher price-quality ratio for KRC in Maintenance and Operations, by partially transferring the operational

190 591.10
187 Kenya Railways Corporation KRC Mombasa Commuter Railways Feasibility Study KRC/PLM/40/2011 Final Report
Pöyry Switzerland Ltd.
risk on experienced international private operator(s), except the key Demand risk which by nature can only be supported by KRC or the GoK in recognition of the substantial (indirect) economic benefits gained from the project’s imple-mentation (being a public service). Such involvement may include specific fi-nancing instruments for parts of the project, particularly an integrated DBFM(O) concession for rolling stock and train operations, with full demand risk support-ed by KRC/GoK. It is strongly recommended to carry out further detailed Value for Money assessment studies and analysis, with the realisation of a PPC and a PSC, to confirm the level of benefits of private concession of operations and jus-tify further PPP-based life-cycle procurement and financing package.
7. Considering the nature of the project, public financing sources in the form of ODA-type of lending provided by Sovereign partners is the most likely route (with or without complementary support from IFIs such as the World Bank and the African Development Bank), which by nature provides for very long term maturities, large facilities to undertake project of this size and low long term in-terest rates. Meanwhile, it is important to highlight that ODA financing is often tied to prescribed procurement rules from the lending State which in itself may impact the overall cost and calendar of procuring the project.
11.5 Road Map The Road Map for the implementation of the project, as described in section 4.5 may be shifted by one year to be base for the implementation of the reduced project, leaving out the corridors 5 and 6. According to the intermediate results obtained during its deve-lopment the project may be adjusted by acceleration or deceleration of the rate of devel-opment.

190 591.10
188 Kenya Railways Corporation KRC Mombasa Commuter Railways Feasibility Study KRC/PLM/40/2011 Final Report
Pöyry Switzerland Ltd.
12 REVIEW OF ASSUMPTIONS, CHANCES AND RISKS
12.1 Introduction The Final Report brings an update of the risk analysis presented in the Inception Report with the findings of the study. It concentrates on those items which are essential for the future realisation of the project.
12.2 General Although KRC requires risk assessments throughout the Project, we would like to un-derline that it is not our intention to merely reduce this to a subject with a “negative per-ception”. Clearly, we wish to address it as a “Chances and Risks” issue, because all of us want to work out the Project as a “positive” one. In our philosophy, chances must be taken and risk must be controlled; very often, how-ever we meet the primary focus on risk mitigation, with the identification of chances be-ing subordinate to it.
In the following, Sections 12.3 through 12.8 refer to external aspects that would affect the implementation and operation of the Project.
The following tables indicate the understanding of each risk as well as measures to be taken for its control and mitigation. The key issue is the on-time identification of the risks and taking of preventive measures to avoid them. In any case for all the risks that are identified corrective measures should also be foreseen.
12.3 Political Risks
Risk Action to be taken
Lack of support to the project by politi-cal institutions
During all phases: Ensure early involvement of all political institutions affected
Lack of Approval from Environmental Authorities
During the planning and development phases: Preventive Measures: - Environmental studies prepared and in-clusion of necessary modifications Corrective Measures: - Division of the works contracts in lots and preparing the tender documents for works contracts for those sections that are not affected by the lack of approval - Search of alternative solutions for the in-feasible part of the projects

190 591.10
189 Kenya Railways Corporation KRC Mombasa Commuter Railways Feasibility Study KRC/PLM/40/2011 Final Report
Pöyry Switzerland Ltd.
Risk Action to be taken
Kenya Wildlife Service: KWS has until now been absent from the stakeholder meetings, and has in-formally communicated to the local environmental experts that they had not been involved in the project sufficiently early. NEMA will consult KWS before ap-proving the Project, hence there is a strong risk of lack of approval if KWS is not actively involved as soon as pos-sible.
During the planning and development phases: It is strongly recommended that the Client engage with KWS as soon as possible to ensure that the project is approved by NEMA.
Changes to the regulatory and statutory frameworks set out for the Project. It is assumed that this “skeleton” re-mains largely unchanged.
During all project phases: Close monitoring of trends and eventual upcoming changes would facilitate early adjustments of the Project and could re-duce the impact of such changes
It can be difficult for the local authori-ties and NGOs to accept proposed measures
During the planning, development and construction phases: Early involvement and communication
The new infrastructure operation and methods of maintenance could be diffi-cult to accept for the respective entities
During all project phases: Early involvement and communication. Recruitment and training of staff.
12.4 Economic Risks
Risk Action to be taken
Uncertainties related to the general de-velopment of the Kenyan economy
During all project phases: Risk outside KRC’s control, but KRC should monitor the changes to the Kenyan economy in so far it could affect the Pro-ject, and adjust its implementation accord-ingly.

190 591.10
190 Kenya Railways Corporation KRC Mombasa Commuter Railways Feasibility Study KRC/PLM/40/2011 Final Report
Pöyry Switzerland Ltd.
Risk Action to be taken
A perception that the project will kill other players in the passenger transport sector
During all project phases: KRC is encouraged to handle the Project with the public involved. It might be useful to share opinions and experience with oth-er railway or transportation system provid-ers in neighbouring countries which re-cently passed through the same develop-ment. Build up an integrated transport system which brings advantages to all participants and the overall welfare for Kenya..
A weak population data base will lead to greater uncertainties in passenger demand.
During the planning, development and construction phases: The current population forecast are based on United Nation data. Updates should be monitored and the project should be, if necessary, adapted to new developments. A step-wise implementation of the Project allows surveying the behaviour of travel-lers and adjusting the traffic forecasts for the further implementation.
12.5 Legal Framework
Risk Action to be taken
Kenya has a new constitution which is still being rolled out
During all project phases: This is an external risk which is outside the sphere of influence of KRC.
Most of the legislative framework cov-ering rail infrastructure has not yet been developed
During all project phases: This risk is outside KRC’s control, but KRC could exert influence on the lawmak-ers through lobbying.
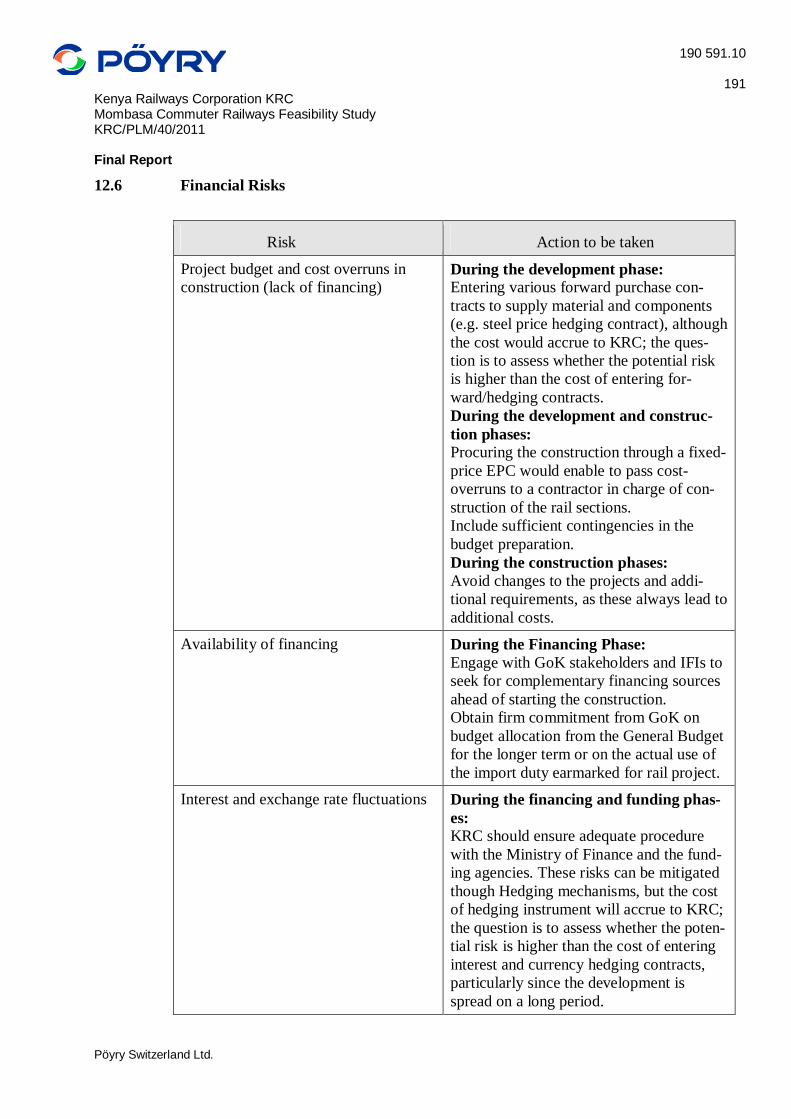
190 591.10
191 Kenya Railways Corporation KRC Mombasa Commuter Railways Feasibility Study KRC/PLM/40/2011 Final Report
Pöyry Switzerland Ltd.
12.6 Financial Risks
Risk Action to be taken
Project budget and cost overruns in construction (lack of financing)
During the development phase: Entering various forward purchase con-tracts to supply material and components (e.g. steel price hedging contract), although the cost would accrue to KRC; the ques-tion is to assess whether the potential risk is higher than the cost of entering for-ward/hedging contracts. During the development and construc-tion phases: Procuring the construction through a fixed-price EPC would enable to pass cost-overruns to a contractor in charge of con-struction of the rail sections. Include sufficient contingencies in the budget preparation. During the construction phases: Avoid changes to the projects and addi-tional requirements, as these always lead to additional costs.
Availability of financing During the Financing Phase: Engage with GoK stakeholders and IFIs to seek for complementary financing sources ahead of starting the construction. Obtain firm commitment from GoK on budget allocation from the General Budget for the longer term or on the actual use of the import duty earmarked for rail project.
Interest and exchange rate fluctuations During the financing and funding phas-es: KRC should ensure adequate procedure with the Ministry of Finance and the fund-ing agencies. These risks can be mitigated though Hedging mechanisms, but the cost of hedging instrument will accrue to KRC; the question is to assess whether the poten-tial risk is higher than the cost of entering interest and currency hedging contracts, particularly since the development is spread on a long period.

190 591.10
192 Kenya Railways Corporation KRC Mombasa Commuter Railways Feasibility Study KRC/PLM/40/2011 Final Report
Pöyry Switzerland Ltd.
Risk Action to be taken
Income from ticket sales and marketing activities is uncertain
During the planning, development, fi-nancing and funding phases: A robust tariff system which is well proved in Kenya and reflects the local economic conditions in the catchment areas could mitigate this risk. Additional revenue could be generated through the introduction of freight transport. Implementation of automatic/centralized fare collection systems to enhance the level of collection of fare, enhance transparency of the system and reduce effects of free riders.
Unrealistic terms for the concession of operations could result in a failure to obtain serious bids.
During the planning, development, fi-nancing and funding phases: The tender for a concession should not be issued before the scope of the services is clearly defined.
12.7 Technical Risks
Risk Action to be taken
Kenya lacks unified rail industry stand-ards.
During the planning and development phases: KRC should establish common technical standards and guidelines for all railway projects in Kenya.
The lack of a safety philosophy to run the railway system hinders the choice of a suitable signalling and train control system
During the planning and development phases: KRC should establish one common safety philosophy for all railway projects in Ken-ya
Need for technical changes during the project development due to insufficient or inaccurate project data (cartography, geo-logy, hydrology)
During the planning and development phases: Define which studies are required and en-sure that their results are obtained in time

190 591.10
193 Kenya Railways Corporation KRC Mombasa Commuter Railways Feasibility Study KRC/PLM/40/2011 Final Report
Pöyry Switzerland Ltd.
12.8 Operational Risks
Risk Action to be taken
Lack of skills by management and op-erations and maintenance staff
During the development and construc-tion phases: Establish training and qualification re-quirements for such staff at an early stage and ensure that the responsibilities for their implementation are defined and binding for the parties concerned
The difference between line capacity and the future demand
During the planning and development phases: Include options for additional rolling stock units in procurement contract. During the planning, development and construction phases: Additional infrastructure elements should be foreseen to have the possibility of up-grading the offered train services (e.g. double tracks in stations and on certain sections, stabling facilities).

190 591.10
194 Kenya Railways Corporation KRC Mombasa Commuter Railways Feasibility Study KRC/PLM/40/2011 Final Report
Pöyry Switzerland Ltd.
13 ANNEXES
13.1 Annex 1: Corridor Study Mapbook
13.2 Annex 2: Population Mapbook
Table 13.1: Content of Corridor Study and Population Mapbook Page Corridor 1/38 Overview
2/38
Corridor 1: Mombasa - Ramisi 1/5 Corridor 2: Mombasa -Mtwapa - Kilifi - Malindi 1/7 Corridor 3: Mombasa - Mazeras - Voi 1/9 Corridor 4: Likoni Ferry - Bamburi
3/38 Corridor 2: Alternative Ras Makawaiwa Bridge Corridor 4: Alternative Polytechnic University
4/38 Corridor 1: Alternative Airport Tunnel 5/38 Corridor 1: Alternative Port Reitz 1/2 6/38 Corridor 1: Alternative Port Reitz 2/2 7/38 Corridor 1: Mombasa - Ramisi 2/5 8/38 Corridor 1: Mombasa - Ramisi 3/5 9/38 Corridor 1: Mombasa - Ramisi 4/5
10/38 Corridor 1: Mombasa - Ramisi 5/5 11/38 Corridor 2: Mombasa -Mtwapa - Kilifi - Malindi 2/7 12/38 Corridor 2: Mombasa -Mtwapa - Kilifi - Malindi 3/7 13/38 Corridor 2: Mombasa -Mtwapa - Kilifi - Malindi 4/7 14/38 Corridor 2: Mombasa -Mtwapa - Kilifi - Malindi 5/7 15/38 Corridor 2: Mombasa -Mtwapa - Kilifi - Malindi 6/7
16/38 Corridor 2: Mombasa -Mtwapa - Kilifi - Malindi 7/7 Corridor 6: Malindi - Lamu 1/12
17/38 Corridor 2: Alternative Gede
18/38 Corridor 3: Mombasa - Mazeras - Voi 2/9 Corridor 5: Mazeras - Kaloleni - Takaungu 1/3
19/38 Corridor 3: Mombasa - Mazeras - Voi 3/9 20/38 Corridor 3: Mombasa - Mazeras - Voi 4/9 21/38 Corridor 3: Mombasa - Mazeras - Voi 5/9 22/38 Corridor 3: Mombasa - Mazeras - Voi 6/9 23/38 Corridor 3: Mombasa - Mazeras - Voi 7/9 24/38 Corridor 3: Mombasa - Mazeras - Voi 8/9

190 591.10
195 Kenya Railways Corporation KRC Mombasa Commuter Railways Feasibility Study KRC/PLM/40/2011 Final Report
Pöyry Switzerland Ltd.
Page Corridor 25/38 Corridor 3: Mombasa - Mazeras - Voi 9/9 26/38 Corridor 5: Mazeras - Kaloleni - Takaungu 2/3 27/38 Corridor 5: Mazeras - Kaloleni - Takaungu 3/3 28/38 Corridor 6: Malindi - Lamu 2/12 29/38 Corridor 6: Malindi - Lamu 3/12 30/38 Corridor 6: Malindi - Lamu 4/12 31/38 Corridor 6: Malindi - Lamu 5/12 32/38 Corridor 6: Malindi - Lamu 6/12 33/38 Corridor 6: Malindi - Lamu 7/12 34/38 Corridor 6: Malindi - Lamu 8/12 35/38 Corridor 6: Malindi - Lamu 9/12 36/38 Corridor 6: Malindi - Lamu 10/12 37/38 Corridor 6: Malindi - Lamu 11/12 38/38 Corridor 6: Malindi - Lamu 12/12
13.3 Annex 3: Longitudinal Sections Mapbook
Table 13.2: Content of Longitudinal Sections Mapbook Page Corridor 1/16 Corridor 1: Mombasa - Ramisi 1/5 2/16 Corridor 1: Mombasa - Ramisi 2/5 3/16 Corridor 1: Mombasa - Ramisi 3/5 4/16 Corridor 1: Mombasa - Ramisi 4/5 5/16 Corridor 1: Mombasa - Ramisi 5/5 6/16 Corridor 2: Mombasa -Mtwapa - Kilifi - Malindi 1/7 7/16 Corridor 2: Mombasa -Mtwapa - Kilifi - Malindi 2/7 8/16 Corridor 2: Mombasa -Mtwapa - Kilifi - Malindi 3/7 9/16 Corridor 2: Mombasa -Mtwapa - Kilifi - Malindi 4/7
10/16 Corridor 2: Mombasa -Mtwapa - Kilifi - Malindi 5/7 11/16 Corridor 2: Mombasa -Mtwapa - Kilifi - Malindi 6/7 12/16 Corridor 2: Mombasa -Mtwapa - Kilifi - Malindi 7/7 13/16 Corridor 5: Mazeras – Kaloleni – Takaungu 1/3 14/16 Corridor 5: Mazeras – Kaloleni – Takaungu 2/3 15/16 Corridor 5: Mazeras – Kaloleni – Takaungu 3/3 16/16 Corridor 4: Likoni Ferri – Bamburi 1/1

190 591.10
196 Kenya Railways Corporation KRC Mombasa Commuter Railways Feasibility Study KRC/PLM/40/2011 Final Report
Pöyry Switzerland Ltd.
13.4 Annex 4: Preliminary Environmental and Social Impact Assessment
13.5 Annex 5: Environment Mapbook
13.6 Annex 6: Socio-Economic Mapbook
Table 13.3: Content of Environment and Socio-economic Mapbook Page Corridor 1/32 Overview
2/32
Corridor Mombasa Ring 1/1 Corridor Mikindani Connection 1/1 Corridor Moi International Airport Alternative 1/1 Corridor Mombasa - Mtwapa - Kilifi - Malindi 1/9 Corridor Mombasa - Airport - Ramisi 1/7 Corridor Port Reitz Alternative 1/3
3/32 Corridor Mombasa - Mtwapa - Kilifi - Malindi 2/9 4/32 Corridor Mombasa - Mtwapa - Kilifi - Malindi 3/9
5/32 Corridor Mombasa - Mtwapa - Kilifi - Malindi 4/9 Corridor Mazeras - Kaloleni - Takaunga 3/3
6/32 Corridor Mombasa - Mtwapa - Kilifi - Malindi 5/9 7/32 Corridor Mombasa - Mtwapa - Kilifi - Malindi 6/9
8/32 Corridor Mombasa - Mtwapa - Kilifi - Malindi 7/9 Gede Alternative 1/2
9/32 Corridor Mombasa - Mtwapa - Kilifi - Malindi 8/9 Gede Alternative 2/2
10/32 Corridor Mombasa - Mtwapa - Kilifi - Malindi 9/9 11/32 Corridor Malindi - Lamu 1/14 12/32 Corridor Malindi - Lamu 2/14 13/32 Corridor Malindi - Lamu 3/14 14/32 Corridor Malindi - Lamu 4/14 15/32 Corridor Malindi - Lamu 5/14 16/32 Corridor Malindi - Lamu 6/14 17/32 Corridor Malindi - Lamu 7/14 18/32 Corridor Malindi - Lamu 8/14 19/32 Corridor Malindi - Lamu 9/14 20/32 Corridor Malindi - Lamu 10/14 21/32 Corridor Malindi - Lamu 11/14 22/32 Corridor Malindi - Lamu 12/14 23/32 Corridor Malindi - Lamu 13/14 24/32 Corridor Malindi - Lamu 14/14 25/32 Corridor Mazeras - Kaloleni - Takaunga 1/3 26/32 Corridor Mazeras - Kaloleni - Takaunga 2/3 27/32 Corridor Mombasa - Airport - Ramisi 2/7

190 591.10
197 Kenya Railways Corporation KRC Mombasa Commuter Railways Feasibility Study KRC/PLM/40/2011 Final Report
Pöyry Switzerland Ltd.
Page Corridor Corridor Port Reitz Alternative 2/3
28/32 Corridor Mombasa - Airport - Ramisi 3/7 Corridor Port Reitz Alternative 3/3
29/32 Corridor Mombasa - Airport - Ramisi 4/7 30/32 Corridor Mombasa - Airport - Ramisi 5/7 31/32 Corridor Mombasa - Airport - Ramisi 6/7 32/32 Corridor Mombasa - Airport - Ramisi 7/7
13.7 Annex 7: Cost Estimation Investment Costs
13.8 Annex 8: Cost Estimation Operation Costs
190 591.10
198 Kenya Railways Corporation KRC Mombasa Commuter Railways Feasibility Study KRC/PLM/40/2011 Final Report
Pöyry Switzerland Ltd.
Internal document control Client Kenya Railways Corporation KRC Title Final Report Project KRC/PLM/40/2011 Mombasa Commuter Railways
Feasibility Study Phase A Project No. 190 591.30 Classification Drawing/Reg./Serial No. File name 190591.10 Mombasa FR bec 140527.docx File location System Microsoft Word 14.0 External distribution Internal distribution Contribution Responsible BU Revisions: Original Date of document 28.05.2014 Author/position/signature Christian Bergerhoff, Project Manager Date of control Checked by/position/signature Johan Dehli, Senior Engineer A Date of document Author/position/signature Date of control Checked by/position/signature B Date of document Author/position/signature Date of control Checked by/position/signature