moment-rotation characteristics of semi-rigid steel beam ... · pdf fileof semi-rigid steel...
TRANSCRIPT

•I
,PB83-145318 NSFjCEE-82044
STRUCTURAL RESEARCH STUDIESDepartment of Civil Engineering
MOMENT-ROTATION CHARACTERISTICS
OF SEMI-RIGIDSTEEL BEAM-COLUMN CONNECTIONS
byW.G. Altman, Jr.
A. AzizinaminiJ.H. Bradburn
andJ.B. Radziminski
A REPORT OF AN INVESTIGATION CONDUCTED
by
THE DEPARTMENT OF CIVIL ENGINEERINGUNIVERSITY OF SOUTH CAROLINA
Supported by
EARTHQUAKE HAZARD MITIGATION PROGRAMDIVISION OF CIVIL AND ENVIRONMENTAL ENGINEERING
NATIONAL SCIENCE FOUNDATIONGrant No. PFR - 7923520
UNIVERSITY OF SOUTH CAROLINACOLUMBIA, SOUTH CAROLINA
JUNE, 1982
INFORMATION RESOURCESNATIONAL SCI.ENCE FOUNDATION
REPRODUCED BY
NATIONAL TECHNICALINFORMATION SERVICE
u.s. DEPARTMENT Df COMMERCESPRINGfiElD. VA. 22161


Final Report
OF
SEMI-RIGID STEEL BFAM-COLUMN CONNECl'ICNS
by
w. G. Altman, Jr.A. AzizinaminiJ. H. Bradburn
andJ. B. Radziminski
A Report of an Investigation Conductedby
The Civil Engineering DepartmentUniversity of South Carolina
supported byEarthquake Hazards Mitigation Program
Division of Civil and Environmental EngineeringNational Science Foundation
Grant NO. PFR-79-23520
University of South CarolinaColumbia, South Carolina
June 1982
Any opinions, findings, conclusionsor recommendations expressed in thispublication are those of the author(s)and do not necessarily reflect the viewsof the National Science Foundation.


50272 '101
REPORT ~~MENTATION 11. RENS?/CE'E_82044 I~
63-163. Recipient's Accession No.
PBSJ 14531 84. Title Ind Subtitle
Moment-Rotation Characteristics of Semi-Rigid SteelBeam-Column Connections, 1982 Final Report
7. Author(s)
~.G. ~ltman, Jr., A. Azizinamini, J.H. Bradburn, J.B. Radziminski
5. Report Dlte
June 1982
a. Performina Oraanizetion Rept. No.
11. Contrect(C) or Grent(G) No.
10. Project/Task/Work Unit No.9. Performin, 0ralnization Nlme Ind Address
University of South CarolinaDepartment of Civil EngineeringColumbia, SC 29208 (C)
(G)PFR7923520
------------- --- ---
1~ Sponsorina O....nlz.tion N.me .nd Address
Directorate for Engineering (ENG)National Science Foundation1800 G Street, N.W.Washington, DC 2055015. Supplement.ry Notes
Submitted by: Communications Program (OPRM)National Science FoundationWashington, DC 20550------
13. Type of Report & Period Covered
14.
-- --- -----.---------f-ISo Abstrlct (Limit: 200 words)
The potential of semi-rigid beam-to-column connections in contributing to the integrity of steel frame building structures in an earthquake was evaluated. Experimentalstudies were conducted of bolted connections comprised of top and seat beam flangeangles and double web angles to determine moment-rotation behavior under staticloading and to measure energy absorption capability under cyclic loading. The cyclictests consisted of subjecting the beam-column connections to several stages of fullreversa 1, controll ed ampl itude di splacements of progressi vely i ncreas i ng magnitude.The connections exhibited ductile behavior, with generally stable moment-rotationhysteresis loops being established at each displacement amplitude up to the time thattesting was discontinued. The tests culminated in the formation and subsequent propagation of fatigue cracks at the toe of the fillet in one or more of the beam flangeangles. The cycle tests have demonstrated that the effectiveness of beam-to-columnconnections under seismically induced loading may be limited by low-cycle fatigue ofthe connection elements.
17. Document An.lysls e. Descriptors
EarthquakesBuildingsBeams (supports)Columns (supports)
Joints (junctions)FlangesSteel construction
Earthquake resistant structuresCyclic loadsStructural analysis
b. Identlfiers/Open·Ended Terms
Gound motion
Co COSATI Field/Group
II. AVlnlbllity St.tement
J.B. Radziminski, /PI
19. security Cllss (This Report) 21. No. of Pa,es
NTIS1-------------+---------
20. security Class (This PI,e)
(See ANSI-Z3US) See InstructIons em Revers. OPTIONAL FORM 272 (4-77)(Formerly NTI5-3S)Department of Commerce


ABSTRACT
The plrpose of the investigation has been to evaluate the .PJtential of
semi-rigid beam to column <X>nnections in contributing to the integrity of
steel frame building structures in an earthquake environment. Experimental
studies were oonducted of bolted oonnections canprised of top and seat beam
flange angles, and double web angles, to determine manent-rotation behavior
under roonotonic (static) loading, and to measure energy absorption
caPability under cyclic loading. Fran the static tests, geanetric
Parameters which affect <x>nnection performance have been quantified, and
cx:mpared with analytical models formulated to predict the initial stiffness
and canplete non-linear res.PJnse of the oonnections.
The cyclic tests consisted of subjecting the beam-column connections
to several stages of full reversal, controlled amplitude displacements of
progressively increasing magni tude. The connections exhibited ductile
behavior, with generally stable manent-rotation hysteresis loops being
established at each displacement amplitude up to the time that testing was
disoontinued. The tests culminated in the formation and subsequent
propagation of fatigue cracks at the toe of the fillet in one or more of
the beam flange angles. The cyclic tests have demonstrated that the
effectiveness, under seismically induced loading, of connections of the
type studied herein may be limited by low-cycle fatigue of the connection
elements.
, ,II


TABLE OF CONTENI'S
page
I. ~~IOO•••••.•••...•••••.•••.•••••••••.•••.• 1
1.1 Background, Research Objectives•••••••••••••11.2 Scope of Investigation•••••••••••••••••••••• 21.3 Acknow1edgements ••••••••••••••••••••••••••••4
II. DESCRIPT!ON OF TEST PBOGRAM••••••••••••••••••••••6
2.1 Materials •••••••••••••••••••••••••••••••••••62.2 Description of Test SPeCimens ••••••••••••••• 62.3 Testing Equipment and Test Procedures •••••••8
2.3.12.3.2
Static Tests •••••••••••••••••••••••••9Cyclic Tests •.•••••••..••••.•••••••• 11
III.~ INVESTIGATION••••••••••••••••••••••14
3.1 Static Tests" 14
3.1.13.1.23.1.33.1.4
Scope of Investigation••••••••••••••14Tests Results •••••••••••••••••••••••15Discussion of static Test Results •••19Summary of Static Test Results •••••• 27
3.2 Cyclic Tests ••••••••••••••••••••••••••••••• 28
3.2.13.2.2
SCope of Investigation•••••••••••••• 28Test Results •••••••••••••••••••••••• 28
3.2.2.13.2.2.23.2.2.33.2.2.4
Specimen 14C1•••••••••••••• 30Specimen 14C2•••••••••••••• 31Specimen 8C1 ••••••••••••••• 32Specimen 8C2 ••••••••••••••• 33
3.2.3 Discussion of Manent-RotationHysteresis Loops •••••••••••••••••• 34
3.2.4 Connection Hysteretic EnergyCa-pa.city•••••••••••••••••••••••••• 39
TV. ANALY'l'ICAL INVESTIGATION••••••••••••••••••••••••• 41
4.1 static Tests •••••••••••••••••••••••••••••.• 41
4.1.1 Models ofBe~olumnConnections••••••.••••••••••••••• 41
iii

4.1.1.1 Beam Models forInitial Stiffness •••••••••••••••• 4l
4.1.1.2 Modified Beam Modelsfor Canplete Manent-RotationPrediction••••••••••••••••••••••• 46
4.1.1.3 Two Dimensional FiniteElement Model •••••••••••••••••••• 48
4.1.1.44.1.1.5
Dual Spring Model •••••••••• 49Three Dimensional Finite
Element Model •••••••••••••••••••• 504.1.1.6 Empirical Model ••••••••••••5l
4.1.2 Prediction of Manent--RotationBehavior ••••••••••••••••••••••••• 54
4.1.2.14.1.2.2
Initial Stiffness •••••••••• 54Post-Elastic Behavior •••••• 55
4.2 Cyclic Tests••.•.•.•...•••.•.•.•..•.•••..•. 60
4.2.1 Spring-Rigid Region Model forCyclic M~ Curve ••••••••••••••••••60
4.2.2 Tri-Linear Model for Cyclicl\1-<P eur:ve .••...••....••...•••...•.62
v. SOMMARY AND OONCLUSIONS ••••••••••••••••.••••••••••64
5.15.2
static Tests ••••••••••••••••••••.••••••.••• 64Cyclic Tests ••••• e·••••••••••• '••••••••••••• • 66
~ ••.••.•...•••••••••...•••••.••.•.•••••..••. 69
APPENDIX A Nanenclature•••••••••••••••••••••••••••••73
APPENDIX B Three Dimensional Finite Element ModeL ••77
'IMI.ES•••••••••••••••••••••••••••••••••••••••••••••• •81
FICIJRFS. • • • • • • • • • • • • • • • • • • • • • • • • • • • • • • • • • • • • • • • • • • • • •91
iv

LIST OF 'mELES
Table Page
2.1 Mechanical Properties of Test Material •••••••••8l
2.2 Schedule of Test Specimens ••••••••••••••••••••• 82
3.1 Summary of Static Test Results •••••••••••••••••83
3.2 Summary of Cyclic Test Results -Specimen 14Cl.•••...•...•.•••.•.•.••...•••.•.. 84
3.3 SUJmIary of Cyclic Test Results -Specimen 14C2•••••••••••••••••••••••••••••••••86
3.4 SUJmIary of Cyclic Test Results -Specimen SCI••••.•..••...••••••.••....•••.••••88
3.5 Summary of Cyclic Test Results -Specimen 8C2•••••••••••••••••••••••••••••••••• 89
4.1 Comparison of Initial Stiffness predictedby Model II with Test Results •••••••••••••••••90
v

Figure
2.12.22.32.42.52.62.72.82.92.10
2.112.12
3.1
3.2
3.3
3.4
LIST OF FIGURES
Page
General Configurations of Test Specimens ••••••••91Details of Connection for waX21 Beam••••••••••••92Details of Connection for Wl4X38 Beam••••••••••• 93SChematic of Loading System for Test Beams••••••94Beam Supports for Test Specimens ••••••••••••••••95Lateral Support System for Test Specimens•••••••96Loading Frame and Test set-Up•••••••••••••••••••97Close-up of Test Connection•••••••••••••••••••••97Schematic of Testing and Recording Equipment••••98Location of Strain Gages on Tension Flange
.Angles ••••••••••••••••••••••••••••••••••••••• 99LVDT Mounting Apparatus ••••••••••••••••••••••••100Typical Time-Displacement History for
Cyclic Tests •••••••••.•••••••••••••••••.•••• l01Canparison of Manent-Rotation Curves
Obtained fran LVDT Measurementswith Curve Obtained fran ActuatorDisplacements ••••••••••••••••••••••••••••••• l02
Data fran strain Gage Recordings -Spec~n .1452•••••••••••••••••••••••••••••••103
Rotation of Beam Relative to Stub Column -Static Loading••••••••••.••••••••••••••••••• l04
Deformation Patterns in Bearn-ColurnnConnection Elements •••••••••••••••••••••••••105
3.5 Flange .Angle fran specimen 14S2 After Test••••• l063.6 Web .Angles fran Specimen 14S2 After Test •••••••1063.7 Effect of Flange .Angle Thickness on
Static Manent-Rotation Behavior -Wl4X38 Beam Connection•••••••••••••••••••••• 107
3.8 Effect of Web .Angle Thickness on StaticMcment-Rotation Behavior -Wl4X38 Beam Connection•••••••••••••••••••••• l08
3.9 Effect of Web .Angle Length on StaticManent-Rotation Behavior -Wl4X38 Beam Connection••••••••••••••••••••••109
3.l0a Effect of Flange Angle Thickness on StaticManent-Rotation Behavior -waX21 Beam Connection(Angle Gage = 2") •••••••••••••••••••••••••••110
3.l0b Effect of Flange Angle Thickness on StaticManent-Rotation Behavior -waX21 Beam Connection(Angle Gage = 2 1/2") •••••••••••••••••••••••111
3.lla Effect of Flange Angle Gage on Static .Manent-Rotation Behavior waX21 Beam Connection(Angle Thickness = 3/8") ••••••••••••••••••••112
vi

3.llb Effect of Flange Angle Gage on StaticManent-Rotation Behavior -waX2l Beam Connection(Angle Thickness = 5/16") •••••••••••••••••••113
3.12 Effect of Flange Angle Length on StaticManent-Rotation Behavior -waX2l Beam Connection•••••••••••••••••••••••114
3.13 Canparison of Static Manent-RotationBehavior of Wl4X38 and waX2lBecun Connections ••••••••••••••••••••••••••••115
3.14 Flange Angle fram Specimen l4Cl afterCyclic Test•••••••••••••••••••••••••••••••••116
3.15 Flange and Web Angles fran Specimen 14Clafter Cyclic Test•••••••••••••••••••••••••••117
3.16 Stable Hysteresis Loops for Specimen l4Cl ••••••1183.17 Stable Hysteresis Loops for specimen l4C2•••••• ll93.18 Stable Hysteresis Loops for specimen SCl•••••••1203.19 Stable Hysteresis Loops for Specimen SC2••••••• l2l3.20 Typical Manent-Rotation Hysteresis Loop -
Cyclic Tests ••••••••••••••••••••••••••••••••1223.21 Typical Time - Actuator Displacement Cycle •••••1223.22 Configurations of Connection During
One-Half Cycle••••••••••••••••••••••••••••••1234.la Assumed Behavior of Beam-to-Column Connection••1244.lb Beam MOdel for Web Angles ••••••••••••••••••••••1254.2a Idealized Beam Model for Flange Angle 1264.2b Idealized Beam Model for Web Angles ••••••••••••1264.3 Refined Beam MOdel for Flange Angle••••••••••••1274.4 Refined Beam Model for Web Angles •••••••••••••• 1274.5 Assumed Material Behavior for MOdel III ••••••••1284.6 Model IV - Plane Stres Finite Element Model ••••1284.7 Load Versus Displacement Curve for
Flange Angle for Model IV•••••••••••••••••••1294.8 Model V - Dual Spring Madel ••••••••••••••••••••1294.9 Half MOdel of Beam-to-Column Connection
Model '1I ••••••••••••••••••••••••••••••••._•••1304.10 Moment-Rotation Curves for T\«> Values of
The Paranteter Pi ••••••••••••••••••••••••••••1314.11 Relationship Between Beam Shear, F, and
Relative End Displacement, t:, ,forFlange and Web Angles •••••••••••••••••••••••13l
4.12 Canpar ison of Model III and Model IV withTest Results for Specimen 1452••••••••••••••132
4.13 Results of Model V Analysis ofSpecimen l4S2 Flange Angle••••••••••••••••••133
4.14 Overall Connection Model using Model V forAnalysis by ANSYS •••••••••••••••••••••••••••134
4.15 Canparison of Test Results withManent-Rotation Behavior Predictedby Model V••••••••••••••••••••••••••••••••••135
vii

4.16 Canparison of Test Results withManent-Rotation Behavior Predictedby ~ooel VI ••••••••••••••••••••••••••••••.•• 135
4.17a Canparison of Mooel \~I with Test Resultsfor Specimen 1451•••••••••••••••••••••••••••136
4.17b Canpar ison of Mooel VII with Test Resultsfor Specimen 1452•••••••••••••••••••••••••••137
4.17c Canpar ison of Model VII with Test Resultsfor Specimen 1454•••••••••••••••••••••••••••138
4.17d Canpar ison of Mooel VII with Test Resultsfor Specimen 8S1••••••••••••••••••••••••••••139
4.17e Canparison of Merlel VII with Test Resultsfor Specimen 852 ••••••••••••••••••••••••••••140
4.17f Canpar ison of Mooe1 VII with Test Resultsfor Specimen 853 ••••••••••••••••••••••••••••141
4.179 Canpar ison of Mooe1 VII with Test Resultsfor Specimen 857••••••••••••••••••••••••••••142
4.17h Canparison of Mooe1 VII with Test Resultsfor Spec~en 885 ••••••.•••••••••••••••••••••143
4.17i Canparison of Model VII with Test Resultsfor Spec~en 886••••••••••••••••••••••••••••144
4.18 Tri-Linearized Manent-Rotation Hysteresis!JCX)p•••••••••••••••••••••••••••••••••••••••• 145
4.19 Comparison of Tri-1inearized Hysteresis !JCX)pwith 5pecimen 14C2 Test Results •••••••••••••146
viii

I. IN1'roDUCTICN
1.1 Background, .Research Objectives
The satisfactory performance of ductile, manent-resisting steel frame
building structures in an earthquake environment has been well established.
The integrity of such structures is dependent upon the ability of the
beam-to-column connections to provide the rigid frame behavior and
attendant energy absorption capacity necessary to resist the seismically
induced lateral forces. Considerable experimental evidence has been
generated on the static and cyclic manent-rotation characteristics of rigid
connections, (1-31) which has demonstrated that they provide adequate
strength and ductility to insure the required performance of the structural
system. Similar documentation is available on the behavior of flexible
connections (32-35) ccmnonly referred to as "simple framing."
It is carmJn practice, Particularly in certain low seismic risk areas
of the United States, to utilize A.I.S.C. Type 2 construction in building
design. The beam-column connections are considered, for design purposes,
to be flexible under gravity loading, and are required to develop only
enough rocment capacity to provide resistance to lateral forces (36). It is
easily recognized, however, that such framing systems may be appropriately
considered as being canprised of "semi-rigid" connections, which
continuously transfer both shear and rocment as loading progresses.
Recently, concern has been expressed regarding the adequacy of buildings
constructed with this framing scheme if subjected to a moderate or severe
earthquake.
Interest has been expressed (37-41), also, in the applicability of
semi-rigid beam-column connections for providing a quantifiable degree of
energy absorption dur ing seismic loading, whether used in new construction
(perhaps to assist a braced frame system after yield) or in retrofitting
2
older structures built to less stringent earthquake code provisions than
those rt::M in force or proposed for the future. several recent studies have
been reported (41-49) which are devoted to examination of the effect of
connection flexibility on the static and seismic response of complete
structural systems. The analytical predictions of frame behavior are
typically based on asstnned non-linear mathematical models of the
beam-rolumn oonnectioos. However, there has been a notable lack of
eXPerimental data available to substantiate the appropriateness of the
mathematical models used for semi-rigid connections, particularly those
utilizing high-strength bolted connection elements.
The objective of the research program reported herein has been to
experimentally determine the manent-rotation performance of semi-rigid
bolted beam-column oonnections under static (monotonic) and cyclic
loadings. Specifically, the effect of varying the stiffnesses of the
var ious connection elements on the static response of the connections, and
on their hysteretic response under cyclic controlled displacement loading,
has been studied. Fran these tests, the significant material and geanetric
parameters affecting the connection behavior are identified, and used to
formulate models of the non-linear connection manent-rotation response.
1.2 S~ of Investigation
The connections tested in this investigation have consisted of top and
seat angles belted to the flanges of the beams and supporting column stub,
together with web angles bolted to the beam web and colUIm flange. This
type of semi-rigid connection was selected because of the inherent
ductility offered by the flexural deformation capabilities of both the
flange and web angles in the legs attached to the column.
The top and seat angles were the same for a given test, and the web

3
angles were centered on the beam~ thus symmetrical behavior of the
connection was pranoted in the full reversal cyclic tests. AS'lM A36 steel
was used for the members and connection elements ~ the fasteners were
3/4-inch diameter, ASTM A325 high-strength bolts. A pair of duplicate
specimens was tested simultaneously by framing the beams into a
centrally-loaded stub column.
A total of 11 members were tested under monotonic loading to obtain
static moment-rotation relationships. Four of these test members were
framed to Wl4X38 beam sections and a Wl2X96 stub column~ the remaining
seven specimens were bolted to waX2l beam sections and a Wl2X58 column
stub. For the top and seat (flange) angles, the thickness, length, and
gage (in the legs attached to the column flange) were varied, together with
beam depth, to effect connections of varying stiffness. Variations in the
thickness and length of the web angles were investigated also. The results
of these tests were used to quantify the effect of the test variables on
the non-linear manent-rotation behavior of the connections, and to
establish semi-empirical models of connection response. The data are
cx:mpared also, to predictions of manent-rotation behavior using finite
element models of the connections.
A total of four members were tested under cyclic (quasi-static)
loading~ two of the specimens included the Wl4X38 beam sections and two
members used the waX2l sections. For each of the beam sizes, two
thicknesses of the top and bottom flange angles were tested. The cyclic
tests were conducted using full reversal of controlled displacement to
approximate the rrnnent reversals that may be exhibited by beam-column
connections during an earthquake. The test procedure consisted of cycling
sinusoidally between gradually increasing limits of controlled displacement
in a block loading pattern. The hysteretic responses of the connections

4
were roni tored locally using Lwrs mounted between the beam flanges, and
ccmpared wi th . manent-rotation curves calculated fran overall
load-displacment data. Stabilized cyclic hysteresis loops for each
displacement amplitude are reported and ccmpared for the test members
investigated. For the cyclic studies, testing was discontinued with the
appearance of extensive fatigue cracking in the flange angles and
corresponding gradual loss of connection load-carrying capability.
1.3 Acknowledgements
The tests reported in this study are fran an investigation conducted
in the Civil Engineering DePartment of the University of South Carolina,
Columbia, SOuth Carolina. This material is based upon \\Ork supported by
the National Science Foundation under Grant No. PFR-79-23520. Any
opinions, findings, and conclusions or reccmnendations expressed in this
publication are those of the authors and do not necessarily reflect the
views of the National Science Foundation.
The investigation was conducted under the supervision of Dr. J. B.
Radziminski, Professor, and Dr. J. H. Bradburn, Associate Professor, of
the Civil Engineering DePartment. The testing programs and associated
research studies were conducted by W. G. Altman, Jr., A. Azizinamini,
and T. Koudelka, Research Assistants in Civil Engineering.
Guidance in the direction of the testing program was provided by an
advisory cxmnittee ccmprised of T. C. Carson, Jr., A. K. Courtney, and
R. L. Whitaker, practicing structural engineers in South Carolina.
Additional advice concerning the scope of the investigation, provided by
Dr. J. B. SCalzi of the National Science Foundation and Dr. E. P.
Popov of the university of California, Berkeley, is gratefully
acknowledged •

5
The authors wish to express their appreciation to H. Mullinax, G.
D<:::Mdey, and B. Ward, laboratory technicians in the College of Engineering,
for the fabrication of the beam supports used in the testing program, for
help in the machining of the test members, and for the fabrication of
instrumentation devices used in data acquisition. Special thanks are
extended to Ms. M. Buttenvorth for the careful typing of this final
report.

6
II. DESCRIPTICN OF TEST PRC'GRAM
2.1 Materials
The material' for all of the test specimens, including beam sections,
stub columns, and framing angles, was specified to be AS'IM A36 steel,
supplied by two local fabricators. The mechanical properties obtained fran
selected coupon specimens for material supplied by each of the fabricators
is given in Table 2.1. All of the beam-column connections were made using
3/4-inch diameter, AS'IM A325 heavy hex high-strength bolts, and A325
hardened washers. No tests of the mechanical properties of the fasteners
were conducted.
2.2 Description of Test Specimens
The specimens consisted of a pair of beam sections attached to a
centrally positioned stub column using the particular flange and web angles
to be investigated in a given test. The connections contained top and seat
angles bolted to the flanges of the beams and supporting stub column,
together with double web angles bolted to the beam web and column flange.
Two beam sizes, W8X2l and W14X38, have been used in the testing
program. Each of these sections has a flange width to thickness ratio of
6.6, typical of that encountered in building applications. For the W1.4X38
sections, the overall test beam length was 20 feet, and for the W8X2l
sections, 12 feet, so that the span-to-depth ratios were slightly less than
20 in each case. The stub column for the waX2l beams was a Wl2X58 section,
and a Wl2X96 column section was used wi th the Wl4X38 beams. Heavy coltnnn
sections were selected to eliminate column panel zone distress as a
contributing behavioral factor, thereby confining the mcment-rotation
interaction to the connection elements. It is noted here that the same
stub column sections were used repeatedly throughout the testing program

7
without exhibiting any evidence of inelastic behavior. The general
configurations of typical test members using the 14-inch and 8-inch deep
beams are shown in Figures 2.1a, and 2.1b, respectively.
The web angles were centered on the beam web and proportioned
initially for shears equal to 1-1/2 times the end reactions the member
would experience at its A.I.S.C. allowable uniform load as a simply
supported beam with a span equal to the length of the test beam. The
lightest web angles used would thus be adequate, also, for shear forces
corresponding to the increased loads that would be permitted if end
connections had been used that were capable of developing one-half the beam
allowable manent at working load.
The top and bottom flange angles were of the same size in a particular
test specimen. Because the connections were to experience manent
reversals, it was felt that a syrrmetric arrangement would reduce the
parameters influencing the manent-rotation behavior, yet still represent a
realistic design configuration. For each of the two beam sizes, two
different thicknesses of the top and bottom angles were tested. Initial
angle thicknesses were selected approximately equal to the flange thickness
of . the beam being supported. It was reasoned that these sizes, together
with the use of standard gages in the legs of the angles attached to the
column flange, would provide the bending flexibility required of semi-rigid
connection response. At the same time, the connections would be expected
to exhibit sufficient rocment capacity (and energy absorption capability) to
contribute significantly to the resistance of a structural frame subject to
earthquake induced loads.
The details of the connection angles used to frame the waX2l and
W14X38 beams to the stub columns are shown in Figures 2.2 and 2.3,
respectively. For the W14X38 beam test, 3/8-inch and 1/2-inch thick top
8
and seat angles were used~ these angles were of 5/16-inch and 3/8-inch
thickness for the waX21 beam tests. For the 14-inch deep beams, the length
and thickness of the web angles were varied for the static roc:ment-rotation
parameter studies. In addition, the length of flange angle, and the gage
and bolt spacing on the leg attached to the column flange were varied in
one static test series of waX21 beam specimens. Dimensions of the various
connection elements are presented in the test specimen schedule, Table 2.2.
Belting of the connection elements was accanplished with an air wrench
using the standard turn-of-the-nut method. (36) A325 flat hardened washers
were used under the turned elements in all of the connections. The holes
were all of standard size, 13/16-inch diameter, for the 3/4-inch diameter
bolts.
2.3 Testing Equipnent and Test Procedures
A pair of duplicate SPecimens was tested simultaneously by framing the
beams into the centrally loaded stub column using the arrangement shown
schematically in Figure 2.4. The beam sectiqns are supported at the ends
by roller-type seats located at the beam mid-depth, and designed to allCM
longitudinal J1Dvement so that no direct axial forces would be introduced as
the SPecimen deflects. The height of the beam supports is adjustable to
acccmodate the mounting of beams of different depth in the structural
loading frame~ photographs of the supports are shown in Figure 2.5.
Adjust~le roller-type guides were used to insure vertical J1Dvement of
the stub column and, consequently, to prevent torsional displacements at
the beam-column interface. The guides are canprised of rollers mounted on
channels attached to the top and bottan of the stub column~ the rollers
ride against the flanges of the actuator supporting columns of the main
structural loading frame. Photographs of the roller guides are shown in

9
Figure 2.6. The rollers were oiled and checked periodically to permit
freedan of novement in the vertical direction along the loading frame
support colUJ'lU"l.s. photographs of the canplete test set-up, including
loading frame, beam supports, and roller guides are shown in Figures 2.7
and 2.8.
A 55 kip, servo-controlled, hydraulically actuated ram was used to
apply load to the test members through the stub column, Figure 2.4. Local
monitoring of the actuator displacement was accanplished through an X-Y
plotter. In addition, the output data fran the various measuring devices,
described later, were transferred directly to the College of Engineering
VAX 11/780 ccmputer system for subsequent retrieval and graphic display;
the basic elements of the recording system are illustrated schematically in
Figure 2.9.
Using the test arrangement and loading system illustrated in Figure
2.4, the connections were subjected to canbined shear and bending memento
For both the static and cyclic tests the controlled input variable was the
rate and magnitude of actuator movement and, corresp::>ndingly, the
displacement of the stub column. Displacement control was imposed to avoid
the p:>Ssibility of instantaneous collapse of the test member should
ccmplete separation occur in any of the connecting elements during testing.
2.3.1 Static Tests
For each of the static tests, the beam sections were first mounted in
the end supports and then bolted to the stub column, which had been blocked
in the loading frame to effect a centered, level specimen. The erection
sequence proceeded as follows. For each beam size the actuator load cell
was initialized to a load equal in magnitude and opposite in sense to the
total weight of the specimen (beams plus stub colmnn) less one-half the

10
weight of the beams. Having thus established the initial load cell
reading, the actuator was next attached to the top of the stub column. The
bolts were then loosely inserted in all of the connection elements. Power
was supplied to the actuator to maintain the specimen in a level position
as the supporting blocks were removed fran beneath the stub column. The
bolts in the legs of the angles attached to the column flanges were then
tightened, fol1CMed by tightening of the remaining bolts in the
ang1e-to-beam connections. At this point the load on the specimen caused
by fit-up (recorded by the load cell) was removed by adjusting the position
of the stub column. Thus, the average static manent at the beam-column
interface, resulting fran the erection operations, was essentially null.
This established the point of origin for the subsequent load-displacement
(and rocment-rotation) plots1 the static manents thereafter calculated fran
the load-ce11 output thus excluded the weight of the specimen fran the
measured rocment-rotation response of the connection.
It should be noted that, as a result of member configuration
tolerances and slight misaligrnnent of the connection elements, local
residual stresses were introduced during the erection operations. AllI
specimens were prepared by area fabricators using standard shop practice,
so that the fit-up stresses would be of the order encountered during normal
field erection.
For a select number of test specimens (14S1, 14S2, and 8S1) strain
gages were IIDunted on both faces of the leg of the top flange angle
attached to the column to determine local strains introduced during the
bolting operation, and to IIDnitor the surface conditions as testing
progressed. The IX'sitions of the strain gages are shown in Figure 2.10.
In addition, for all tests, LVUl's were mounted to each flange of the beam
sections on either side of the stub column, and seated against the flanges

11
of the colUllUl. The device used to seat the LVf1r probe and to accanodate
the rotations developed during a test is illustrated in Figure 2.11. The
data fran a pair of LVIJI's mounted on one beam section were used to
determine the angle of rotation of the connection as testing progressed.
The LVf1r data were cempared, also, to rotations calculated fran the
actuator displacement readings.
Besides the direct strain measurements and LVIJI' displacements, light
gage aluminum channel-shaped devices with attached strain gages were used
to detect slip between the top and bottan flange angles and the elements to
which they were connected. These devices (slip monitors) were intended
only to record the presence of major slip, not the magnitude thereof.
After a specimen had been mounted in the loading frame and the
displacernent- measuring devices attached, the test was undertaken using an
actuator displacement rate of 1.0 in./min. for the 14-inch deep beams, and
0.75 in./min. for the 8-inch beams (except for specimen 887, for which a
rate of 1.0 in./min. was used). The upward (downward for specimen 884)
movement of the actuator (and stub colUllUl) was continuous, with load,
displacement, LVIJI', strain gage, and slip indicator output each being
sampled two times per second. In addition, the actuator load and
displacement were recorded locally on an X-Y plotter to allow continuous
visual nonitoring of the system behavior. A test was concluded when the
actuator displacement reached 4 inches for the 20-foot long Wl4X38 beam
specimens, and 3 inches for the l2-foot long waX2l beams.
2.3.2 CYClic Tests
The preparation and installation of the specimens in the cyclic tests
was the same as that used for the static loading, described above. During
mounting of a test member in the loading frame, the initial load setting

12
was established to exclude the contribution of the weight of the specimen
to the static rranent at the connection in the manner described above for
the static tests. For specimens 14C2, 8Cl, and 8C2, strain gages were
mounted on the top flange angle using the patterns shown in Figure 2.10.
In addition, the same arrangement of LVIJI's and slip mnitors as in the
static tests was employed for measuring joint rotations and determining
slip in the flange angles, respectively.
For the cyclic studies, an initial range of actuator displacement of
0.4 inches was selected, approximately 10 percent of the total displacement
used in the static tests of the l4-inch beams. The initial displacement
amplitude was intended to produce a hysteresis loop representing minimal
non-linear response (estimated from the corresp:mding static rnanent
rotation curveS). In all tests, the full range of controlled displacement
was set to provide equal displacement amplitudes about the initial
horizontal beam position. Full reversal of displacement was chosen to
provide the synmetry required for ccmpar ison of test data fran beams of
different depth, and to approximate the reversals that might be exhibited
under extreme conditions during seismic loading.
The first displacement cycle in each test was applied sinusoidally
using a frequency of 0.10 Hz. This relatively slow rate of actuator
IroVell1ent was selected to allow visual mnitoring of the load-displacement
relationship, to insure that the strain and displacement measuring devices
were recording properly, and to check the alignment of the lateral support
devices. Additional individual cycles were then applied using a frequency
of 0.10 Hz or 0.25 Hz until a stable hysteresis loop was established:
usually this occurred within a few cycles after the initial cycle had been
run. To ccmplete the sequence, ten additional cycles were applied
continuously at a frequency of 0.25 HZ, so that a total of 12 to 15

13
ccmplete cycles were normally imposed at one displacement amplitude. The
displacement range was then increased to 0.8 inches and the above procedure
repeated~ i.e., several individual cycles followed by a continuous run of
10 cycles at a•25 Hz. Each sequence was followed by an increase of 0.4
inches in the displacement range and the process repeated, resulting in
displacement-time histories typified by the block arrangement illustrated
in Figure 2.12.
The cyclic tests were terminated when observed fatigue cracking had
progressed partially across the faces of the flange angles at the toe of
the fillet on the leg bolted to the column flange (see following discussion
of test results). This progression of fatigue cracking was usually
acccmpanied by only IOOdest loss of maximum manent at the time a test was
discontinued. No test was extended to the p:Jint of canplete fracture of a
connection element.

14
III. EXPERIMEm'AL INVESTlGATICN
3.1 Static Tests
3.1.1 Scope of Investigation
Eleven specimens were tested in the static test investigation. The
purpose of this phase of the study was twofold: (I) to quantify the static
manent- rotation behavior of the semi-rigid beam-coll1IlU'1 connections; and
(2) to identify and measure the effect of various geanetric parameters on
the oonnection behavior. The static tests were intended, also, to serve as
a frame of reference against which the cyclic hysteresis behavior of the
oonnections CX>U1d be canpared.
The geanetric variables that were altered in the parametric study
included: the depth of the beam sections (W8X2l and Wl4X38 sections), the
thickness and length of the top and bottcm beam flange angles, the gage and
spacing of 001ts in the leg of the flange angles connected to the coll1IlU'1
flange, and the thickness and length of the web angles. All belting was
acccmplished using 3/4-inch diameter, A325 high-strength bolts tightened by
the turn-of-the-nut method. It was recognized that the size of bolt could
significantly affect the connection stiffness, by altering the clamping
force in the oonnection, by changing the clear distance between the bolt
head (and washer) and the toe of the fillet in the leg of the angle, and by
changing the clear distance between the two belts on the coll1IlU'1 gage line.
However, because of econcmic constraints ,the same stub coll1IlU'1 sections
(one each for the 8-inch and l4-inch beams) were used throughout the
testing program; similarly, the same beam sections were used for several
tests, to be replaced only if evidence of inelastic deformation was found
after a test. Thus, these sections were all drilled to 13/16-inch holes,
as described earlier. An attempt was made to simulate one effect of bolt
size by changing the gage on the legs of the angles framed to the coll1IlU'1

15
flange.
As discussed subsequently, slip occurred in both legs of the top and
bottan angles in one of each of the Wl4X38 section and waX2l section tests,
demonstrating the inability of the 3/4-inch diameter bolts to maintain
sufficient clamping for the stiffer connections through the full range of
inelastic response. Consequently, 7/8-inch diameter bolts are to be used
with these heavier sections in a future investigation, which is to include
both static and cyclic (fatigue) testing.
3.1.2 Test Results
A sUI'll'llaI'y of the test results for the static test investigation is
presented in Table 3.l~ details of the corresponding specimen geometries
are reported in Table 2.2. Table 3.1 includes the initial stiffness of the
connections (initial slope of the rnanent-rotation curve). The slope was
measured tangent to the rnanent-rotation (M-</» curve at the origin as the
derivative of a second degree polynanial fit through the first several data
points. Table 3.1 also lists: (1) the slope and intercept rnanent of a
secant line fran the origin and intersecting the M-</> curve at a rotation of
4.0XlO-3 radians~ and (2) the slope tangent to the M-</> curve at 24XlO-3
radians, a rotation achieved in all of the static tests. Although the
latter slope offers a measure of the degradation of connection stiffness as
the applied m:ment increases, it should not be interpreted as a constant or
final slope for a specific connection. In sane tests, the connections
continued to RsoftenR as the mcment increased, never actually reaching a
constant M-</> slope at the conclusion of loading. The tangent slope at the
rotation of 24XlO - 3 radians does, hCMever, allCM canpar isons to be made
among the var ious Connections at a carmon point, as well as quantifying the
degree of connection softening in a Particular test. Similarly, the secant

16
slope offers an additional indication of the early stiffness of the
connection. In sane respects the secant slope may be more representative
than the initial tangent slope, because the latter is highly sensitive to
any irregularities in the first few data points fran which it was
calculated•
The rocments repJrted in Table 3.1 (and the figures to follow) were
calculated directly fran the actuator load cell readings. To obtain the
corresponding ¢ values, initially the displacements measured by the LVUl's
mounted to each flange of the beam were converted to relative rotations
between the flange of the stub coll.lI11I1 and the end of the beam. The
rotations were also independently calculated using the actuator
displacement and the beam span by considering rigid body movement of each
beam segment and correcting for elastic curvature fran bending of the beam.
Because of the high stiffness of the stub column, and the transfer of load
in friction between the connecting elements (except for the slip
encountered in two tests) the beam did rotate essentially as a rigid body
with respect to the column flange, which was maintained in a vertical
position by the lateral support system.
A typical ccmpa.rison of the M-</J relationship obtained fran LVIJI' data
with the results obtained frcm the displacement measurements is shown in
Figure 3.1. The curves labeled East and west represent the data fran
individual pairs of Lvurs mounted on the flanges of each of the two beam
segments framing into the central stub column. It can be seen fran Figure
3.1 that the LVIJI' data obtained fran each of the two connections in the
test member were very close, and consistent with the M-<j> curve calculated
using the actuator displacements. Consequently, the data repJrted in Table
3.1, and plotted in the figures to follow, use rotations calculated fran
actuator displacernents~ the results may thus be considered to represent an

17
"average" of the behavior exhibited by the connections attached to each
face of the stub column.
Foil stain gages, l/8-inch gage length, were mounted initially on a
trial specimen adjacent to the toe of the fillet on the leg of the top
flange angle mounted on the stub column. These gages peeled fran the
angles during the operation of bolting the angles to the column, indicating
that large strains were introduced at the angle fillet during bolt
installation. Subsequently, the strain gages on SPecimens 14Sl, 14S2 and
8S1 were placed at the locations shown in Figure 2.10 ~ the gages mounted
approximately mid-way between the angle fillet and the bolt line were
positioned at the anticipated inflection point for bending during static
loading. Gages were placed at the same position on both faces of the angle
to distinguish between the axial and flexural camponents of strain as
loading progressed. It was hoped that this information on local conditions
of strain ~uld prove useful both in monitoring the progression of the
connection non-linear response, and to aid in establishing appropriate
analytical trodels to predict static behavior.
A typical plot ccmparing the axial and bending canponents of surface
strain in the angle (calculated fran strain gage data) with specimen
displacement is shown in Figure 3.2, for specimen 14S2. These data
illustrate the increase in both flexural strain and axial strain as the
distortion of the vertical leg of the top (tension) flange angle increases.
At an actuator displacement of 1.6 inches, the surface' strains at gage
locations "BF" and "RB" (see Figure 2.l0a) on the opposite faces of the
angle leg had exceeded two times the naninal yield strain of the material.
It should be noted that the plots shown in Figure 3.2 do not include the
effects of connection installation which, as noted earlier, were also found
to introduce significantly large surface strains, particularly near the toe

18
of the fillet on the angle.
Although the measurements shown in Figure 3.2 are indicative of the
strain patterns expected on the surfaces of the tension flange angle, there
was considerable inconsistency in the strain data observed among the three
specimens on which gages were mounted. 'J'he canparisons served to
illustrate the sensitivity of local response to minor variations in angle
geanetry, installation procedure, etc.. Consequently, the strain data were
not used to quantify the mcments and axial forces in the angle for purposes
of direct a:mparison with the analytical predictions. Rather, the data
were used simply to indicate trends which were useful in helping to
describe overall connection response and to suggest possible models for the
an~lytical studies.
For each of the static tests, the beams were observed to rotate, with
respect to the stub column, essentially as rigid members by pivoting about
a }X)int near the surface of the beam canpression flange, as illustrated in
Figures 3.3 and 3.4. photographs of typical deformation patterns observed
in the oonnection flange and web angles are shown in Figures 3.5 and 3.6,
respectively. With the exception of specimens l4S2 and 8S2, }X)st-test
inspection revealed no apparent inelastic deformation in either the flanges
or the web of the beams. Similarly, no distress was evident in the stub
oolumns, because, as discussed previously, intentionally heavy sections
were selected to confine the study to the res}X)nse of the beams and their
oonnection elements.
In the testing of specimen 14S2, major slip first occurred when
approximately one-half the final actuator displacement had been reached.
After the specimen had been dismantled, the holes in both legs of the
tension flange angle and in the beam flange were elongated, as were the
holes in the beam web. The plastically deformed steel formed a protruding

19
lip on the bear ing surface of each of the elements exhibiting the elongated
holes. Post-test inspection of specimen 882 indicated the same pattern of
distress in the connection elements as that in specimen 1482.
At the conclusion of each of the. static tests, there was no rupture,
nor were there any cracks observed by visual inspection in any of the
fasteners or connected elements.
3.1.3 Discussion of Static Test Results
The m:ment-rotation curves for the tests reported in Table 3.1 are
plotted in Figures 3.7 through 3.13. The figures provide comparisons of
the initial stiffness and non-linear connection behavior for test members
in which individual geometric parameters were altered. General
observations with respect to these test results are discussed in the
follO\tling paragraphs.
Fran practical design considerations, one of the most apparent means
of increasing the initial stiffness and total moment transfer capability in
a connection of the type studied herein is to increase the thickness of the
angles attached to the top and bottan flanges of the supported beam. This
flange angle dimension was, therefore, one of the principal variables
investigated in both the static and cyclic test series.
Figure 3.7 presents the rocment-rotation curves for two Wl4X38 beam
specimen tests, one (1481) with flange angles of 3/8-inch thickness, and
the other (1482) with 1/2-inch thick flange angles. Both the initial
stiffness and the rocment developed at comparable rotations are greater for
specimen 1482. For example, at a rotation of 24X10-3 radians, specimen
l4S2 developed a connection mcment of about 950 k-in., or aJ.rrost 1-1/2
times the 668 k-in. mcment of specimen 1481. The rotation of 24XlO-3
radians has been used for purposes of canparison aIrong the test members in

20
Table 3.1 and in this discussion because it was a number easily reached in
all of the static tests. The rotation corresponds to a deflection of
approximately 2-3/4 inches for the l4-inch beam tests, or approximately
four times the mid-span deflection a Wl4X38 beam, 20 feet long, would
exhibit as a simply supported member at its AI8C allowable uniform load
(assuming full lateral support)*. This deflection was considered to be
reasonably representative of a severe ductility demand, even under seismic
loading conditions.
SPecimen 1482 exhibited major slip in the leg of the tension flange
angle bolted to the beam (and in the legs of the web angles attached to the
beam web) at a rotation of approximately 12XlO -3 radians, followed by slip
in the leg of the flange angle bolted to the colunm face at approximately
20XlO-3 radians. For the static tests, in which the rate of actuator
movement was the controlled input variable, slip as indicated in Figure 3.7
corrresponds to a gradual drop in manent until bearing is achieved in the
connected elements. with bearing established, the stiffness of the
connection prior to slip is regained, with no anticipated permanent
degradation in the capacity of the connection (barring premature bolt shear
failure or tear-out in the connected Parts). As noted earlier, future
tests in a continuing investigation will utilize 7/8-inch diameter bolts in
the heavier connections to delay the occurrence of slip during cyclic
(fatigue) loading.
For specimens l4Sl and 1482 (and each of the other sPecimens
* For the 8-inch beam tests, a rotation of 24XlO -3 radians corresponds to
a deflection of about 1.6 inches, four times the deflection, at allowable
load, of a l2-foot long simply supported beam using the waX2l sections.
21
investigated in the static test series), the connections exhibited a
mcment-rotation response which becanes non-linear relatively early in the
loading sequence. This non-linearity is contributed to, in part, by local
yielding and eventual plastic hinge formation at each toe of the fillet in
the flange angle attached to the tension flange of the beam. Another hinge
develops in the vicinity of the I::x>lt line in the leg of the flange angle
attached to the column, together with progressive plastic hinging in the
outstanding legs of the web angles. It is of interest to note, however,
that each of the connections developed a manent greater than two times the
capacity that would be predicted by simple plastic hinging mechanisms in
the leg of the tension flange angle attached to the column flange and in
the legs of the web angles ~ further analysis of this post-elastic
connection resp:>nse is presented below.
In Figure 3.7, it can be seen that specimens 1451 and 1452 were able
to develop increasing mcments through the full range of rotations imposed
during the test. In fact, a nearly constant or slightly decreasing M-<j>
slope was observed during the latter stages of loading for each of the
specimens tested in the static test investigation (with the exception of
specimen 852, discussed later). It is believed that this nearly constant
stiffness at large deformations can be attributed in part to material
strain hardening, and to the consequences of significant changes in the
geometries of the connecting angles. The increasing deflection of the
tension flange angle at large connection rotations produces a continuous
change in the internal force distribution in the legs of the angle, with
axial tension beccming an increasingly larger factor (relative to bending)
as the angle progressively "flattens out." A gradual transition fram a
predaninantly flexural to a cx::mbined flexural-axial response in the tension
flange angle, with the acccmpanying strain hardening, can thus be eXPected

22
to oontribute to the ability of the oonnection to achieve a oonsiderably
greater rocment capacity than that predicted by a simple plastic-hinge
mechanism, as noted above.
In oontrast to the influence of flange angle thickness on the
rocment-rotation behavior of the l4-inch beam specimens, moderate changes in
the size of the web angles did not as significantly affect the connection
performance. Figures 3.8 and 3.9 show the effect of web angle thickness
and length, respectively, on the M-~ relationships for Wl4X38 sections with
3/8-inch thick flange angles. For example, increasing the thickness of the
web angle by 50 percent, from l/4-inch to 3/8-inch (specimens 1481 and
1454), produced a corresponding increase in rocment, at a rotation of
24XlO-3 radians, of approximately 25 percent, fran 668 k-in. to 822 k-in.
An apparently lesser influence on post-elastic rocment capacity was
exhibited by a change in the length of the web angles, as canpar ison of
specimens 1451 and 1483, Figure 3.9, indicates. At a rotation of 24XlO-3
radians, specimen 1483, with web angles having a length of 5-1/2 inches,
developed a nanent of 652 k-in., sane 17 k-in. less than the 668 k-in.
manent of specimen 1481, which had the standard 8-1/2 inch long web angles.
It should be noted that specimen 1483 had the only non-synmetrical
connection in the test series, with the legs of the web angles attached to
the beam and oolUIIU1 stub each using two bolts placed in the upper two holes
of the standard detail, Figure 2.3. In this location, with the web angles
closer to the beam tension flange, they would be expected to contribute
differently to the manent transfer caPability of the connection than if
they had been posi tioned at mid-depth, closer to the pivot point of the
connection. The arrangement used is of practical importance, however, in
that it represents a normal positioning of web angles designed for shear
transfer in beams using simple (flexible) framing.

23
The influence of flange angle thickness on mcment-rotation behavior
was examined also for the waX2l beam s-pecimens, the results of which are
shown in Figures 3.l0a and 3.l0b. Figure 3.l0a presents a comparison of
the M- cj> curves for specimen 881, with a flange angle thickness of
S/16-inch, and SPeCimen 882, with a 3/8-inch thick flange angle. The gage
in the legs of the flange angles attached to the stub column was 2 inches,
and the angle length was 6 inches in both of these s-pecimens. Although
canparison of the initial portion of the rnanent-rotation relationships
indicated a considerably stiffer connection for SPecimen 882 ccmpared to
that of 881 (123.4Xl03 k-in./radian vs. 66.7)Cl03 k-in./radian), and
correspondingly greater mcment transfer caPability, SPecimen 882 exhibited
major slip in the connection elements at a rotation of approximately
l6XlO-3 radians. Unlike specimen 1482, in which slip also occurred during
static loading, SPecimen 882 did not regain nor approach the stiffness it
had maintained prior to slip. The stiffness continued to degrade with
continued loading, the slope of the M-cj> curve reducing to only l.SXl03
k-in./radian at a rotation of 24XlO-3 radians. As there were no cracks or
other geometric irregularities observed in the connection elements of
specimen 882, either during testing or upon post-test visual ins-pection, no
explanation is offered for the singular behavior of this specimen. As with
the stiffer connections in the 14-inch deep beams, it is eXPected that slip
in SPecimen 882 ~uld have been delayed or obviated had larger bolts been
used in the ronnection elements.
In Figure 3.10b, the mc:ment-rotation curves for specimens 886
(S/16-inch flange angle thickness) and 887 (3/8-inch angle thickness) are
canpared. In these SPecimens, the gage in the legs of the flange angles
attached to the column was 2-1/2 inches, and the angle length was 6-inches.
As with the 14-inch deep beam tests, both the initial stiffness and the

24
manents developed at camllon rotations were greater for the waX2l !:::leam
connection having the heavier flange angles. For example, the 1/16-inch
increase in flange angle thickness of specimen 857 over that of specimen
8S6 effected a greater than 50 percent increase in manent (381 k-in. vs.
244 k-in.) at a connection rotation of 24XlO~3 radians. As no slip
occurred in either of these two tests, the canparative !:::lehavior of the two
specimens, shown in Figure 3.10b, may !:::le considered representative of
similar connections framing the 8-inch deep !:::learns. Note again the early
non-linearity of the M-<P curve, followed by a continuing increase in manent
transfer capability, with only gradual decrease in stiffness, toward the
latter stages of loading. Further, as with the Wl4X38 beam tests, the
waX2l !:::leam connections examined in this study easily achieved manents in
excess of twice the capacity that would !:::le predicted by a simple plastic
hinging mechanism in the tension flange angle and in the web angles.
The effect of varying the gage in the leg of the flange angle attached
to the column flange was examined in the waX2l beam test series. With an
angle thickness of 3/8-inch, gages of 2, 2-1/2, and 4-1/2 inches were used
in specimens 852, 857, and 854, respectively. TO aceamodate the 4-1/2 inch
gage in specimen 854, a 6X6X3/8 angle was used in place of the smaller
6X3-l/2X3/8 and 6X4X3/8 angles used in the other two specimens. Specimens
8Sl and 8S6, with flange angles of S/16-inch thickness, had gages of 2
inches and 2-1/2 inches, respectively. Canplete details of the dimensions
for these specimens are presented in Table 2.2.
The static test results for these five specimens are summarized in
Table 3.1. For the three members having 3/8-inch thick flange angles, the
manent-rotation curves are plotted in Figure 3.lla~ the curves for the two
specimens with flange angles of 5/16-inch thickness are ccmpared in Figure
3.llb. Although the intent of these tests specifically was to quantify the
25
effect of the flange angle gage on the stiffness of the connection, the
results also maybe considered indicative, qualitatively, of. the effect of
varying the bolt diameter on the initial connection stiffness. Increasing
the bolt diameter ~u1d be expected to have a similar effect on initial
connection stiffness as decreasing the flange angle gage, as the clear span
for bending in the angle would be decreased in both cases. The analogy is
not a cx:mplete one, of course, because differences in initial clamping
force, distribution of stress in the angle betweeen bolts, and post-elastic
prying action ~uld accanpany changes in bolt size, and thereby affect the
cx:mplete rocment-rotation behavior of the connections.
As expected, changes in flange angle gage had a pronounced effect on
both the initial slope of the M-1> curve, and on the manent capacity of the
connection at large displacements. For example, with the 3/8-inch thick
flange angles, the initial connection stiffness decreased fran l23.4Xl03
k-in./radian to l5.3Xl03
k-in./radian as the angle gage was changed fran 2
inches to 4-1/2 inches (S]?eCllnens 8S2 and 8S4). Specimen 8S7, with a gage
of 2-1/2 inches, exhibited an initial M-1> slope of 48.0 k-in./radian,
intermediate in stiffness between those of the other t~ members. At a
rotation of 24XlO-3 radians, specimen 8S7 achieved a manent of
approximately 380 k-in., 1'I'Ore than twice the 165 k-in. manent of specimen
8S4 at that rotation. It should be noted again, that specimen 8S2
sustained slip at about l6XlO-3
radians, after which its manent-rotation
3curve reduced to a slope of only 1.5XlO k-in./radian at a rotation of
-324XlO radians. This behavior is not considered indicative of the
performance expected of the connection had slip not occurred:
consequently, cemparison of specimen 882 with the other two members at
large displacements is not appropriate.
The two connections with 5/16-inch thick flange angles exhibited the

26
same relative response as those with 3/8-inch angles~ Le., decreasing the
gage resulted in an increase in initial connection stiffness and subsequent
mcment capacity at large displacements. For SPeCimen 851 (2-inch gage),
the initial slope of the M-4> curve was 66.7XI03
k-in./radian, alrrost double
the 39.5XlO 3 k-in./radian slope for specimen 856 with a 2-1/2 inch gage.
Similarly, at a connection rotation of 24X10...;3 radians, specimen 851
developed a m::ment of 329 k-in., significantly higher than the 244 k-in.
manent in specimen s..C:;6.
For the waX21 beam sections, the effect of changing the length of the
flange angle was examined. As indicated in Table 2.2, with all other
connection dimensions remaining the same, a flange angle length of 6 inches
was used for specimen 851, and a length of 8 inches used for specimen 853.
The one-third increase in flange angle length resulted in a corresponding
increase of about one-third in the initial connection stiffness (104. 7Xl03
k-in./radian vs. 66.7X10³
k-in./radian), and the developnent of higher
mcments at large displacements (422 k-in. vs. 329 k-in. at a rotation of
24X10-3 radians). The ccmplete rnanent rotation curves for specimens 851
and 8S3 are plotted in Figure 3.12.
Finally, in Figure 3.13, a ccmparison is made between a W14X38 section
specimen (1451) and a waX21 SPeCimen (8S5) in which the dimensions of all
of the connection elements were the same except for the length of the web
angle (8-1/2 inches for 1481, and 5-1/2 inches for 855). As seen from the
M-</> curves of Figure 3.13 and the data recorded in Table 3.1, the initial
slope of the rnanent-rotation curve is increased significantly, fran
76.7Xl03
k-in./radian to 195.0Xl03
k-in./radian, for the Wl4X38 specimen in
ccmparison to the waX2l member. Similarly, the manent develOPed at 24X10-3
radians was 668 k-in. for specimen 14S1, about double the 337 k-in.
mcment of specimen 8S5. The increase in initial connection stiffness and

27
roc.ment developnent capability are to be expected, as the deeper beam
section provides, at canparable rotations, a larger displacement of the
tension flange angle (and larger force in the angle) together with a larger
roc.ment arm fran the position of the tension flange angle to the pivot J.X>int
of the oonnection in the vicinity of the canpression flange.
3.1.4 Sunmary of Static Test Results
In sunmary of the static test results, it has been found that the
geanetric parameters that most significantly affect the static
moment-rotation performance of the semi-rigid connections investigated
were: the depth of the beam section to which the oonnection elements were
framed; the thickness of the flange angles; and the gage in the leg of
the flange angles attached to the column flange. (As noted earlier,
although not considered in this study, changes in bolt diameter would be
expected to affect connection res:p'onse, at least initially, in a manner
similar to altering the flange angle gage; i.e., an increase in bolt
diameter would decrease the effective SPan for bending of the angle, as
would a decrease in angle gage). Variations in the length of the flange
angles, and in the length and thickness of the web angles, had a less
pronounced effect on connection response than the Parameters listed above.
Several analytical models have been proposed to establish the initial
stiffness of semi-rigid connections of the type oonsidered in the study.
Canparisons of the predicted stiffnesses with the experimental data fran
this static test investigation are presented in Section 4.1. Further,
using the results of the Parametric study, a semi-empirical analytical
model has been developed to generate canplete non-linear moment-rotation
curves for the connections; the results of this phase of the study are
reported also in Section 4.1.
28
3.2 Cylic Tests
3.2.1 Scope of Investigation
The {Xlrpose of this phase of the investigation was threefold: (1) to
quantify the cyclic manent-rotation behavior of the semi-rigid beam-column
connections 7 (2) to determine the energy absorption capabilities under
complete reversal of manent7 and (3) to qualitatively describe the
characteristics of the hysteresis loops obtained.
Four specimens, l4Cl, l4C2, SCI, and 8C2 were tested under cyclic
loading. Two of the sPecimens used the Wl4X38 beam sections7 the other
two used the waX2l sections. For each of the beam depths, SPecimens having
two different flange angle thicknesses were tested. These four specimens
were identical to four of the static specimens, l4Sl,14S2,8Sl, and 852,
respectively. Consequently, the two variables investigated in the cyclic
test series were the depth of the beam section and the thickness of the
flange angles.
The intent of the cyclic tests was to examine the connection response
to nrment reversals, not the behavior of a complete subassernblage under
seismic loading. Consequently, the rate of loading in the cyclic tests was
"quasi-static", and was not intended to suggest that the loading would be
the direct result of actual earthquake induced ground roc>tions.
3.2.2 Test Results
A summary of the cyclic test results is presented in Tables 3.2
through 3.57 details of the test specimens are reported in Table 2.2.
Tables 3.2 through 3.5 include the actuator displacement amplitude,
the number of cycles at each amplitude and test frequency, and the
cumulative number of test cycles. For each displacement amplitude, the
range of rotation (peak-to-peak) and the range of manent is given for the

29
hysteresis loops. The area enclosed by a single hysteresis loop is given
as 'Well as the cumulative loop area.
As discussed previously, all of the cyclic test SPeCimens were
subjected to a:rnplete displacement reversal to facilitate canparison of the
hystersis loops generated for beams of different depth. The initial
displacement amplitude was 0.2 inches, which produced a nearly linear
manent-rotation curve. The initial loading consisted of a single cycle,
applied at a frequency of 0.10 Hz, to allow visual monitoring of the
sPecimen behavior. Additional individual cycles (usually two) were applied
using the same frequency of 0.10 Hz, followed by two or three cycles at
0.25 Hz (SPeCimens l4Cl and 14C2 only), until a relatively stable
load-displacment hysteresis loop was established. Ten additional cycles
were then applied continuously at a frequency of 0.25 Hz. 't'he displacement
amplitude was next increased by 0.2 inches to 0.4 inches, and the above
procedure repeated. Each sequence was followed by an increase of 0.2
inches in the displacement amplitude and the process repeated. The cyclic
tests were terminated when observed fatigue cracking had progressed
Partially across the faces of the flange angles. At that time, none of the
cracks in the angles had propagated canpletely through the angle thickness.
No test was extended to the point of canplete rupture of a connection
element. No slip was observed during the cyclic tests.
Figure 3.14 shows front and rear views of a top flange angle from
sPecimen l4Cl after the test was stopped. It can be seen that cracking had
progressed over IIDSt of the width at the toe of the fillet on the leg
bolted to the colUIIm flange. This crack pattern is typical of those
observed in both of the 14-inch deep beam test specimens~ for the 8-inch
beam specimens, cracking initiated at the toe of the fillet on the leg
bolted to the beam flange.

30
After disassembly of test specimen 14CI, it was discovered that
significant cracking had progressed in the vicinity of the bolt hole under
the washer. Although the formation of fatigue cracks had an observable
effect on the load-displacement hysteresis loops, the decrease in maximum
load was usually a small percentage of the maximum load for the stabilized
loops at the time the tests were discontinued. The permanent distortions
shown in the flange and web angles of SPecimen 14Cl, Figure 3.15, give an
indication of the large deformations experienced by the connection angles
dur ing the cyclic tests.
As mentioned previously, the specimens were intended to simulate,
within reason, actual connections in situ. During the erection procedure,
it would be natural to seat the beam on the bottan flange angle for
support, thereby aligning the bottan angle as required at the expense of
the top angle. As a consequence, the top angle would be subjected to the
greater initial strains resulting fran any lack of fit during the bolting
procedure. This same erection sequence was followed in the the test
program, and is believed to explain the tendency of the top angle to form
the first cracks in rrost of the cyclic tests. Also, as seen in Figures
3.16 through 3.19, the hysteresis loops tend to exhibit signs of stiffness
degradation first in the negative manent region, corresponding to tension
in the top flange angle.
3.2.2.1 Specimen 14CI
The cyclic rocment-rotation hysteretic loops of specimen 14CI, Figure
3.16, show a consistent performance under ccmplete manent reversal. An
increase in displacement amplitude resulted in a corresponding increase in
the range of rocment and area of the hysteresis loop. Subsequent cycles at
the same amplitUde generated nearly the same range of manent as the first

31
cycle. As the connection response stabilized, a slight softening was noted
corresponding to an increase in the range of rotation and a decrease in the
area of the loop. The mcment range of the final stabilized hysteresis loop
was usually within 5 per cent of the initial value. At larger displacement
amplitudes, the negative manent :i.s seen, in Figure 3.16, to remain nearly
constant as the displacement amplitude was increased. This suggests the
presence of sane irreversible damage (cracking) in the tension angle that
corresponds to the negative rnc:ment quadrant of Figure 3.16 ~ however, no
cracking was observed visually at this time. It is significant that the
loops were able to stabilze even though the stiffness of sane of the
connecting elements appears to have been ccmpranised. The hysteresis loops
are generally distinguished by a smooth curve, except at the ends, which
exhibit a pinched appearance corresponding to an appreciable change in
connection stiffness. This change in stiffness will be discussed in detail
later.
No degradation of the overall connection stiffness attributed to
impending failure was noted until the last block of 10 cycles at the
conclusion of the test. In the last 6 cycles, at a displacement amplitude
of 2.0 inches, the load-displacement plots indicated a gradually decreasing
stiffness, unlike the previous loops, which had stabilized by this time.
Examination of the specimen during this latter stage of loading revealed
the presence of the fatigue cracking described in Section 3.2.2. The
locations of the cracks correspond to the locations where the tensile
strains resulting fran bending and axial force are additive. The test was
then stopped before ccmplete separation of the flange angle occurred.
3.2.2.2 Specimen 14C2
Specimen 14C2 was identical to specimen 14CI in all details except for

32
3.2~2.3 Specimen SCI .
Specimen BCl had the thinner flange angles of the two connections with
a-inch deep beams. The rnanent-rotation behavior of specimen aCl was
noticably different fran the behavior of specimens l4Cl and l4C2, which can
be seen by comparing Figures 3.16, 3.17, and 3.lB.
The hysteresis loops for SPeCimen BCl did not exhibit the stability
encountered in the 14 inch specimens. At each increase in displacement

33
amplitude, the connection exhibited a continual, though minor, softening
for each additional cycle~ however, the loops were similar in appearance.
In addition, for larger displacement amplitudes, the m::ment-rotation plots
are inconsistent with regard to the maximum m::ments achieved at each
amplitude. A decrease appears in the negative rocment region of the loop,
suggesting the presence of a crack in the corresponding tension flange
angle not detected by visual examination.
Failure occurred by the abrupt, nearly simultaneous propagation of
cracks almost cx:mpletely across the width of both top flange angles, along
the root of the radius on the leg bolted to the beam flange. The observed
crack had not extended to the sheared edge on one side, indicating that the
crack (or cracks) had originated at sane interior point along the width of
the angle (see discussion of specimen 8C2 results). Post-test examination
of specimen 8Cl showed that the angle had undergone severe bending at the
location of the crack, where the angle was in bearing at the end of the
beam flange. Testing was discontinued before canplete rupture occurred in
any of the flange angles.
3.2.2.4 Specimen SC2
This specimen had thicker flange angles than specimen SCI, but was
otherwise identical~ hence larger ranges of mcment were generated for
canparable ranges of rotation. Note the lack of pinching in the hysteresis
loops of specimen 8C2, Figure 3.19, canpared to the behavior of specimen
8Cl, Figure 3.18. Like specimen SCI, the hysteresis loops of 8C2 exhibited
a slight softening with progressive cycles at a constant displacement
amplitude. This is attributed to changing connection stiffness, the cause
of which is uncertain. It is possible that the initation of cracks in the
connection angles during the latter stages of loading may be one reason.

34
The sensitivity of the overall connection behavior to the stiffness of the
connection elements will be examined later.
Toward the end of the test, cracks appeared in specimen 8C2 along the
toe of the fillet on the leg of a top flange angle bolted to the beam
flange, similar in location to the crack observed in specimen 8CI. ~
cracks formed, each located in the rrost highly strained areas of the flange
angle, between the bolt in the colUllU'1 flange leg and the first
corresponding hoIt in the beam flange leg. It is probable that the
combination of severe bending caused by the angle in bearing on the beam
flange and the tension forces in the line of the co1Ul1U'1 and beam bolts
precipitated the initiation of cracking at these locations. It is likely
that failure of the angle would have been similar to the abrupt extension
of the cracks across the entire width of the angle as in specimen SCI, had
the test been continued.
3.2.3 piscussion of Moment-Rotation Hysteresis LoOPS
The shape of the hysteretic loops of specimens 14Cl, l4C2, 8CI and 8C2
can be described in terms of the changes in the geanetry of the connection
as the rocment is reversed. Consider one half of a typical loop, shown as a
solid line in Figure 3.20. Point 1 in Figure 3.20 corresponds to one
extreme of the actuator m::>vement (Point I in Figure 3.21, actuator
displacement vs. time). The portion of the rocment-rotation curve that is
generated as the actuator moves fran Point 1 to Point 3 can be divided into
three regions based on the configuration of the connection; these regions
are labeled I, II, and III in Figure 3.20.
The initial loading of the connection in a cycle, culminating in the
attainment of maximum negative nanent, causes the connection to assume the
configuration shown in Figure 3.22a. In this configuration the beam is

35
pivoting about a p::>int near BFA, the current canpression angle. The
remaining connection angles are pulled away from the column flange,
generating the tension forces which establish the corresponding resisting
mcment at the beam-column interface. With the bottom angle in full bearing
on the column flange, the stiffness of the connection is now at a relative
maximum. The canpletion of this initial loading is indicated as Point I in
Figure 3.20.
Reversal of the direction of actuator movement, with the specimen in
the configuration shown in Figure 3.22a, effects a period of essentially
elastic unloading at a slope CC'l'l'\P&able to the initial slope of a
statically loaded connection. This is identified as Region I in Figure
3.20.
Region II is a transition stage. During this time, the geanetry of
the oonnection is undergoing significant change. The canpression force in
BFA, which bears on the column face in Region I, decreases and eventually
converts to a tension force as the mcment is reversed; hence, the angle
moves away fran the column face (see Figure 3.22b).
The force in the top flange angle, TFA, changes from tension to
canpression in Region II, causing the angle to move toward the column face.
As a result, the center of rotation of the connection moves (reflecting the
redistribution of forces taking place) and eventually maintains a p::>sition
near the top of the beam. During the time when both flange angles are
temporarily bent away from the column face, the connection stiffness is at
a minimum. The stiffness of Region II is not a constant for all loading
histories. The initiation of yield in the flange angles is affected by the
residual stresses present. The resp:>nse of the connection in Region II is
analogous to a rigid beam on an elastic-plastic foundation, where the
foundation is represented by springs with changing stiffnesses. The

36
relative stiffnesses of the springs depend on the magni tude of the
oonnection rotation at the previous reversal of m::::ment. As a result of
this behavior, it is hypothesized that unloading fran the central range of
Region II will not be at a slope equal to that of Region I. Rather, the
slope will lie between the limits established fram the Region I response
and the Region II slope inmediately preceding unloading. This has not been
experimentally verified in the present investigation but will be tested in
a future study. The end of Region II is reached when angle TFA has folded
back upon the column face in canpression. The behavior of the connection
in Region II occurs only in cyclic loading, and hence cannot be ccmpared to
a monotonic static test.
Region III can be considered geometrically the reverse of the
configuration existing in Region Ie As shown in Figure 3.22c, the
cx::mpression angle in bearing against the column face is ncM '!'FA, whereas
flange angle BFA and the web angles are now pried in tension fram the
column. The center of rotation is again stationary, located near the top
flange of the beam. The stiffness of the connection is ccmparable to a
statically loaded oonnection at large rotations. The change in stiffness
as the oonfiguration changes fran that of Figure 3.22b to the one in Figure
3.22c can be determined by noting the difference in the slope of the
manent-rotation curve. The magnitude of this change depends on the
connection details, as discussed below.*
Canparing the change in slope between Regions II and III of specimens
* The same type of "pinching" behavior has been observed, also, by other
investigators (50) in tests of similar connections framed to smaller beam
sections.

37
l4Cl and l4C2 (Figures 3.16 and 3.17, respectively), it can be seen that
the change is oo~e pronounced in specimen l4Cl. This difference can be
attributed to the thicker flange angles of specimen l4C2, the web angles
being identical for the two specimens. Assuming the angles behave as
beams, an analogy may be drawn between a span-to-depth ratio for a beam and
the ratio of the gage length to the thickness of the angle, g/t, for the
leg of the flange angle oounted to the column flange. For specimen l4Cl,
g/t is 6.7 and, for specimen l4C2, g/t is 5.0, indicating a stiffer beam in
bending for the flange angles of specimen l4C2. During the transition
phase of Region II the stiffer flange angles of specimen l4C2 offer oore
resistance to oovement than the flange angles of specimen l4Cl. Thus, when
the cx:mpression flange angle goes into bearing, the change in stiffness is
greater in specimen l4Cl than the corresponding change in stiffness of
specimen l4C2. Canpar ing the mcment-rotation curves of specimens 8Cl and
8C2, Figures 3.18 and 3.19, the same arguments apply. The change in slOPe
fran Region II to Region III is more pronounced in specimen SCI, with a 9/t
ratio of 6.4, than for specimen 8C2, with g/t of 5.3.
The contribution of the flange angle stiffness to the overall
connection stiffness warrants further examination. Consider specimens l4Cl
and 8C2, each with a flange angle thickness of 3/8 inch. The resisting
mcment of the connection can be calculated by surrming the contributions of
each oonnecting angle to the total manent. In Region III, the manent arm
is approximately equal to the depth of the beam, 14 inches for specimen
l4Cl, and 8 inches for specimen 8C2. With the center of rotation fixed,
increasing rotation results in an increase in displacement of the flange
angle proportional to the depth of the beam, and a corresponding increase
in the force in the angle. In this situation, specimen l4Cl would be
expected to have a signifigantly higher stiffness, due to both the larger

38
manent arm and the larger angle displacement. Thus, in Region III, the
effect of the depth of the beam contributes in two distinct ways to the
overall <X>nnection stiffness.
The <X>nnection stiffness in Region II is largely dependent upon the
flexural stiffness of the individual elements, since neither flange angle
is in bearing. The forces in the top and bottan angles should be
approximately equal and much less than the oanpression force possible in
bearing. The difference in stiffness of the two specimens, l4Cl and 8C2,
in Region II is not as great as in Region III, the influence of the depth
of the beam being felt primarily in its <X>ntribution through the manent
arm. As a result, the Region II stiffness of the a-inch deep beam is a
higher percentage of its Region III stiffness than that of the 14 inch
beam, suggesting a more pronounced change in manent-rotation behavior
(pinching) for the 14 inch beam going fran Region II to Region III.
Canpar ison of the manent-rotation curves for the four cyclic tests shows
that the change in slope fran Region II to Region III is indeed more
pronounced for the l4-inch beams than for the a-inch deep beams. In fact,
the change in slope for specimen 8C2 is hardly noticeable.
Assuming that the stiffness in Region II is predaninately due to the
stiffness of the flange angles, represented by t/g, and that the Region III
stiffness is influenced predaninately by the depth of the beam, d, for a
given specimen, the ratio of the two stiffnesses can be represented by the
parameter d/(t/g). For the four cyclic test specimens, this ratio is 93.3,
70, 51.2 and 42.7 for specimens 14CI, l4C2, SCI and 8C2, respectively.
These values show a trend which corresponds to the degree of pinching
observed in the hysteretic manent-rotation loops. Specimen 8C2, with the
least degree of pinching observed has the lowest value of the ratio
d/ (t/g), 42.7. The other specimens show an increase in the degree of

39
pinching as the parameter dl (t/g) increases, with specimen 14C1 showing the
most pronounced pinching and having the highest value, 93.3.
3.2.4 Connection Hysteretic Energy Capacity
The "average" hysteresis loop area at each displacement amplitude, and
the total hysteretic energy accumulated at the termination of testing, is
presented in Tables 3.2 through 3.5 for the four cyclic tests. The results
indicate that, with the exception of the initial cycle following an
increase in displacement amplitude, the hysteretic energy absorbed per
cycle remained reasonably constant at each amplitude for the four
specimens. Further, the ductile behavior of the connections is
demonstrated by the increase in hysteresis loop area with each succeeding
increase in displacement amplitude (and connection rotation) through the
full range of testing, even with pinching evident at the larger amplitudes.
The total hysteretic energy accumulated in each of the connections
framed to the Wl4X38 sections was approximately the same, 520 k-in. for
specimen 14Cl and 527 k-in. for specimen 14C2. It may be noted, also,
that the displacement-time history was about the same for the two tests,
with specimen 14C1 subjected to 149 total cycles and a final displacement
amplitude of 2.0 inches, while specimen 14C2 achieved 130 cycles and the
same 2.0 inch final displacement amplitude before testing was terminated.
The accumulated hysteretic energy of each of the two specimens framed
to the waX21 sections was also quite similar. For specimen SC1, with
5/16-inch thick flange angles, the cumulative area of the hysteresis loops
was 195 k-in.; specimen 8C2, with 3/8-inch flange angles, achieved a
cumulative hysteresis loop area of 243 k-in. For both specimens, the
displacement-time histories consisted of cycling to a maximum displacement
amp1itude of 1.4 inches, and the total mnnber of cycles sustained was about
40
the same, 78 cycles for specimen SCI and 76 cycles for 8C2_
As a consequence of the general stability of the connections at large
rotations, and of the ductility of the connection elements, it is
reasonable that the energy absorption capaci ties of like connections ~u1d
increase directly with the depth of the beam sections to which they are
framed_ This is evident by cemparing the data for specimens 14CI and 8C2,
both of which contained the 3/8-inch thick flange angles_ For specimen
14Cl, the total accumulated hysteresis loop area was 520 k-in_, lOOre than
double the 243 k-in. achieved by specimen 8C2_ Because of the limited
number of tests conducted to date, however, no quantified conclusions are
drawn with regard to the e:ffect of varying connection geanetries on the
hysteretic energy resp'nse of specimens of the same depth, nor for
specimens subjected to loading histories different frcm the block-type
increasing displacements used in the current program_ In a subsequent
investigation, constant amplitude cyclic tests are to be conducted with
similar connections, to obtain benchmark fatigue data, and to obtain
additional measurements of energy absorption capacity for canparison with
the results of this study. The goal of the future program will be to
consider the applicability of various fatigue damage models to the cyclic
behavior of the connections, and, if possible, to relate hysteretic energy
accumulation to fatigue life.

41
IV. ANALYTICAL INVESTIGATIOO
The analytical investigation of this project was oonducted with the
objective of establishing procedures caPable of describing the behavior of
semi-rigid beam-to-oolumn connections, yet retain sufficient simplicity to
be used as a design tooL Because of the ccmplex behavior of the subject
connections, obtaining a simple analytical procedure with both accurate
prediction capability and simple design applicability was not feasible.
Several analytical m::rlels are presented which develop a logical progression
fran simple linear elastic m::rlels of the oonnection to more ccmplicated
models which account for both geanetric and material nonlinear behavior.
The analytical investigation oonsidered separately the static and
cyclic behavior with the hypothesis that a clear understanding of static
behavior is prerequisite to the understanding of cyclic performance.
4.1 Static Tests
4. L 1 Models of Beam-column Connections
4.1.1.1 Beam MOdels for Initial stiffness
In an attempt to predict the inital stiffness of semi-rigid
beam-oolumn oonnections, a model was developed under the assmnptions that
material behavior is linearly elastic, that displacements are small, and
that the angles oonnecting the beam to the oolumn could be represented by
beam behavior. The precedent for such models has been established in
earlier investigations (47,51).

42
The assumed behavior for this IOOdel, Model I, is presented in Figure
4.la,* where
tJ. = horizontal displacement of heel of
flange angle
</l = rotation of beam at the connection
For Model I, it is assumed that the vertical leg of the flange angle
can be represented by a single beam with cross-sectional area, t x L, and
assumed beam length, A, as shown in Figures 4.la and 4.2a, where
~B = manent at end A of beam AB
~A = manent at end B of beam AB
F = shear force in beam (ncminal bolt force)
It is assumed that the outstanding legs of the web angles may be
represented by three seParate bearns, as shown in Figures 4.lb and 4.2b,
where
Ac = assumed beam length
Pc = beam width, L /3
tJ.. = d. </lei = 1, 2, 3), displacement of heel of web1 1
angle for beam i
* - See, also, ncmenclature and corresponding Figure Al.
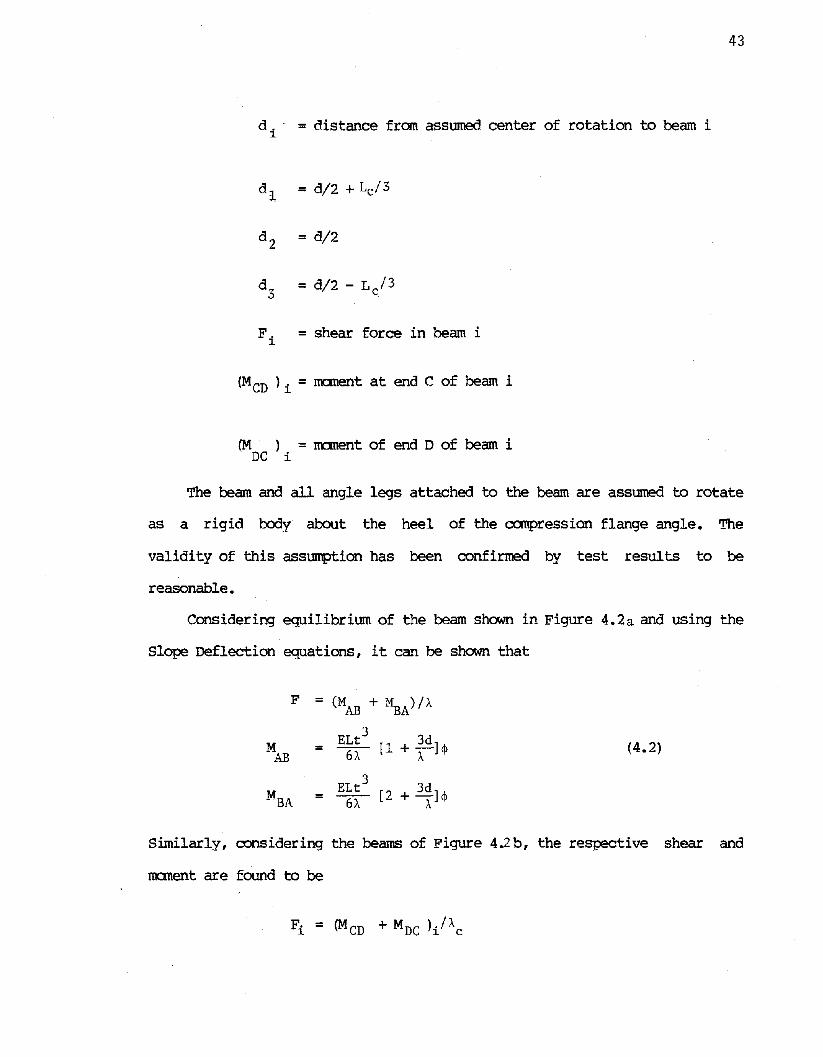
43
d.· = distance fran assumed center of rotation to beam i1.
d 1 = d/2 + Lc/3
d 2 = d/2
d3
= d/2 - L e /3
F. = shear force in beam i1.
(MCD ) i = m:ment at end C of beam i
(M ) = nmtent of end D of beam iDC i
The beam and all angle legs attached to the beam are assumed to rotate
as a rigid body about the heel of the canpression flange angle. The
validity of this assumption has been confirmed by test results to be
reasonable.
Considering equilibrium of the beam shown in Figure 4. 2a and using the
Slope Deflection equations, it can be shown that
F = (MAB + ~A)/A
MELt
3[1 + 3d]q> (4.2)=~AB A
MBAELt
3[2 + 3d]q>=~ A
Similarly, considering the beams of Figure 4.2b, the respective shear and
m:ment are found to be
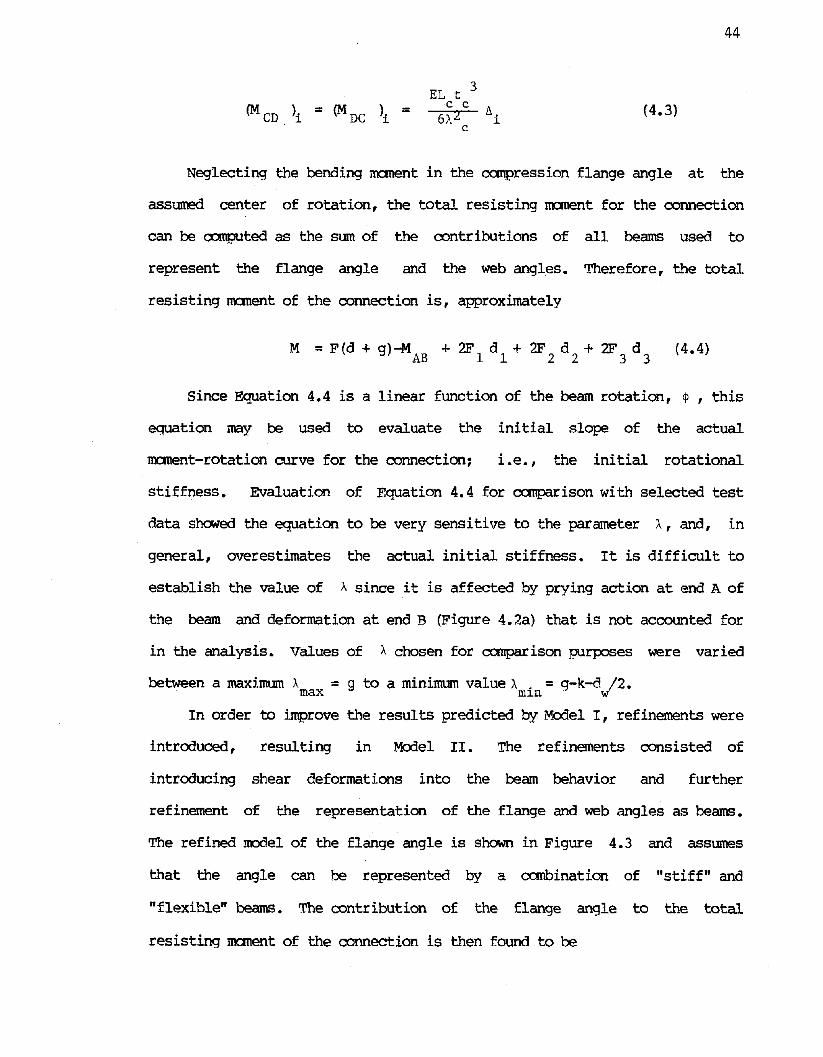
EL t 3c c
6\2 ~ic
(4.3)
44
Neglecting the bending mcment in the canpression flange angle at the
assumed center of rotation, the total resisting mcment for the oonnection
can be o:mputed as the sum of the oontributions of all beams used to
represent the flange angle and the web angles. Therefore, the total
resisting mcment of the oonnection is, approximately
M = F(d +g}-MAB
+ 2F1
d1
+ 2F2
d2
+ 2F3
d3
(4.4)
Since Equation 4.4 is a linear function of the beam rotation, ep , this
equation may be used to evaluate the initial slope of the actual
mcment-rotation curve for the oonnection; i •e. , the initial rotational
stiffness. Evaluation of Equation 4.4 for comparison with selected test
data showed the equation to be very sensitive to the parameter A, and, in
general, overestimates the actual initial stiffness. It is difficult to
establish the value of \ since it is affected by prying action at end A of
the beam and deformation at end B (Figure 4. 2a) that is not acoounted for
in the analysis. Values of \ chosen for comparison purposes were varied
between a maximum \ = 9 to a minimum value \ . = g-k-d /2.max mJ.n· w'
In order to improve the results predicted by Model I, refinements were
introduced , resulting in MOdel II. The refinements consisted of
introducing shear deformations into the beam behavior and further
refinement of the representation of the flange and web angles as beams.
The refined model of the flange angle is shown in Figure 4.3 and assumes
that the angle can be represented by a canbination of "stiff" and
"flexible" beams. The contr ibution of the flange angle to the total
resisting mcment of the oonnection is then found to be

1
6E11 ZD 6E1ZD Z-rz IMf = Z [~ + 1]+ 3. [1 - 4+r
Z] (D + B)
b (1+r1) B (1+rZ)
where1ZE1
1 1ZE1Z
r = Z r z =1 ZAS1
Gb AsZGB
AS1= Z/3 tm1 ASZ = Z/3tmz
3 3I = m
1t /lZ 1Z = mzt /lZ1
m = (no. of bolts)x d mz = L - m1 w 1
45
(4.5)
The refined model of the web angle is shown in Figure 4.4, also
assuming the angle to be the sum of stiff and flexible beams. Based on
this definition, the contribution of the web angles to the total resisting
manent of the connection is found to be
where
M = M (stiff) + M (flexible)c c c
M (fleXible) =c
(4.6)
r. =~
lZE1.~
ZGAS·A.
~ ~
1 3I. = -Z P.t~ ~ c i = 3, 4, 5
Pj = '\.i1
P 4 = 2(Lc - dw - ZPc
)
P 5 = Pc - dw
A = b3 c
A = B4 c

46
e = (dw + p 4) /2
f = P /2c .
4.1.1.2 MOdified Beam Models for Complete Moment-Rotation Prediction
In an attempt predict the canp1ete IOCIllent versus rotation relationship
for the beam-to-co1UIlU'1 connection, Model I was modified by introducing
inelastic material behavior into the beam definition of both the flange and
web angles. This will be referred'to as Model III; the specific nature of
the modifications is shown in Figure 4.5, where
j = percentage of the beam depth that remains elastic
cr = stress at initial yieldy
E =strain at initial yieldy
ESth = slope of stress-strain curve beyond initial yield
y =distance from neutral axis
Based on these assumptions, the resisting m::ment on the beam cross
section may be calculated as
M = [j2E (E-E th)+EE h]S +b y s st
where
(cr-EE h)(1-j2)Zy y st (4.7)
S = elastic section modulus, Lt2/6
Z = plastic section modulus, Lt2/4
In order to obtain a usable solution for MOdel III, it was necessary
to introduce the approximation that the beam stiffness does not vary over
the length of the beam, permitting the integration of the governing beam
equation:
47
For a fixed-fixed beam subject to relative end translation, /), , this
integration produces
wherex = distance from end of beam
>.. = length of beam
~ = moment in beam representing angle, at x
leff = effective moment of inertia of beam
v = lateral beam displacement
(4.8)
Assuming a linear variation of strain across the beam depth, the familiar
relationship
(4.9)
is obtained, and the stress in the elastic core of the beam may be c:x::mtpUted
fran Hooke's Law and Equation 4.9 as
(J = Ee (4.10)
Canbining Equations 4.8 and 4.10, letting (J = (Jy = ~y / I eff at
y = !jt/2, and rearranging
j(J >..2
= I -LEt 6x I < 1/),(3- -)
A
(4.11)
Equations 4.7 and 4.11 are used to compute the internal resisting
m:ment at any point along the beam and, in Particular, at the ends of the
beam. Once the end m::ments are known the shear force in the beam is
determined fran Equation 4.2. Both the flange angle and web angle beams
48
were assumed to behave according to the preceding developnent. Points on
the IOCment-rotation curve were then established using Equation 4.4.
4.1.1.3 TwO Dimensional Finite Element MOdel
This model, MOdel IV, is similar to Model III with the exception that
the beam behavior of Model III is replaced with two dimensional plane
stress behavior. The plane stress behavior was obtained for specific
examples, such as shown in Figure 4.6, by employing a finite element
analysis. In Figure 4.6, u and v represent the horizontal and vertical
displacement field variables, and y is a dimension arbitrarily chosen to
be one inch for };Xlrposes of analysis. The finite element analysis was
performed using the general purpose ANSYS (52) canputer program and the
constant stress tr iangular element to model the angle cross-section. The
material model assumed was the bilinear, strain hardening type of Model
III, shown in Figure 4-Sd, and was applied according to the kinematic
hardening technique employed by ANSYS (53). Load was applied by imposing
a tmiform horizontal displacement along Section A-A, Figure 4.6, and a
nonlinear analysis was achieved as follows. First a linear analysis was
performed to determine the point of maximum stress and the load level
necessary to cause yielding at this point. Small increments of
displacement were then added and subsequent nonlinear analyses performed at
the new load level. Values of horizontal force, F, were determined for
each value of total horizontal displacement, thus establishing the force
versus displacement, t:,., relationship at Section A-A. A typical plot of F
vs. t:. is shown in Figure 4.7, and indicates that the curve can be
replaced by a bi-linear relationship with little error.
The web angles for Model IV were assumed to be represented by three
segments, as in Model III, and a force deformation curve established for

49
each segment similar to that described above for the flange angle.
Angle displacement, !:J., is assumed to be related to joint rotation,
</>, as indicated by Equations 4.1 and 4.3, and the connection resisting
manent CXIllPuted using the equation
where d i is defined as in Mcx:1els I and III. The manent versus rotation
curve for the connection is now established as follows: specify </> ,
calculate !:J. and !:J.. fran geometry, obtain F and F. fran established curves,~ ~
and a:mpute the manent fran Equation 4.12.
4.1.1.4 Dual Spring Mcx:1el
In order to investigate the effects of large displacements and axial
tension in the vertical leg of the flange angle on the m::ment-rotation
relationship, Mcx:1el V was developed. Model V utilizes the
force-deformation relationships developed for Model IV to represent the
beam behavior of the angle, and adds to this behavior the axial stiffness
of the angle. Model V is shown in Figure 4.8, where
Kb =bi-linear beam stiffness of vertical leg of the flange angle
A = cross section area = t x L
g = length of axial member
The material nodel for the axial element was assumed to be of the
bi-linear strain hardening type shown in Figure 4.5d. This nodel was
analyzed assuming the displacement, !:J., to be finite when ccmpared to the
length, g~ thus both material and geometric nonlinearity are included in

50
this rrodel.
4.1.1.5 Three Dimensional Finite Element Model
In order to investigate the validity of the concept of treating
connecting angles in a connection as a canbination of beams, a three
dimensional, finite element model, Model VI, was developed. The canplete
connection of specimen 1482, Figure 2.3, including all connecting angles
and the beam, was rrodeled with nonlinear triangular and quadrilateral shell
elements and gap elements. These elements are STIF63, STIF48, STIF52, and
STIFl2 in the a:mputer program ANSY8.
The finite element model consisted of a total of 125 nodes and 203
elements (see Appendix B, Figures BI-B3), and utilized the plane of
symnetry about the midplane of the beam web (line A-A, Figure 4.9). All
nodes in the plane of symmetry were restrained against translation
perpendicular to the symmetry plane and against rotation about both
orthogonal axes contained in the plane.
The beam web was roodeled with quadrilateral shell elements, and the
beam flanges were rrodeled with triangular shell elements. Triangular
elements were required to rrodel the flange in order to eliminate fictitious
node forces associated with out-of-plane warping in quadrilateral elements.
A seven-inch length of beam was modeled to allow attachment of the
connecting angles.
The flange angles were modeled with triangular elements, with the
vertical leg of the angle restrained against translation but not against
rotation in the vicinity of the bolt. Nodes along the bolt line not in the
region encx:mpassed by the canpression zone of the washer were not
restrained. Nodes along line B-B, shown in Figure 4.9, were restrained
against rotation about line B-B and against translation in the direction

51
perpendicular to line B-B (z-direction) in order to effect sane degree of
restraint intermediate between fixed and pinned about the I:x:>lt line. The
horizontal leg of the flange angle was discontinued at the second I:x:>lt line
fran the colmm face and was attached to the beam flange at the interface
between the angle and the flange. Attachment was accanplished by assigning
the same nodes to elements in the flange and elements in the angle. The
short section of the angle between the colmm face and the end of the beam
was not attached.
Web angles were modeled with triangular shell elements and attached to
the beam web along the I:x:>lt line by defining elements of the beam web and
elements of the web angle along the line by the same node number.
Canpression forces transmitted between the web angle and beam web were
represented by gap elements connecting nodes of one region to nodes of the
other. Gap elements were also used to connect the web angle to the colt.mm
face in regions where separation could occur.
The material model assumed for Model VI was the bilinear strain
hardening type defined in Figure 4.5d.
Loading of the model was accanplished by applying a couple to the beam
in the form of a tension force in the top flange and a canpression force in
the bottan flange. Shearing forces were not considered. To achieve a
nonlinear analysis, the couple was applied in small increments with
iteration being performed at each load level. Beam rotation at each load
level was determined by considering the horizontal displacement of the ends
of the top and I:x:>ttan flanges of the beam.
4.1.1.6 Empirical Model
An empirical model, Model VII, was developed to
mcment-rotation behavior of the be~to-colt.mm connections ~
predict the
it is based on

52
the original work by Sarmer (34). In this model, it is assumed that the
relationship between manent, M, and rotation, ~, can be expressed in the
form
(4.13)
where
C. = coefficients to be determined1.
<XP n
n
Pi = parameters affecting relationship between M and </>.
<X. = exponents to be determined.1.
The technique for determining <x. is as follows. The relationship1.
between M and ~ is obtained from experiment for two values of the
parameter, p. , while holding all other parameters constant, as indicated1.
by Figure 4.10. For some arbitrary rotation, ~o ' Equation 4.13 may be used
to obtain the relationship
fran which <x. may be determined as1.
(4.14)
Because the value of <Xi calculated fran Equation 4.14 is dependent on the
choice for ~0' the average value of <Xi must be determined by considering
values of ~ 0 over the applicable range of the equation. Once the average

53
values for all the </> are known, the coefficients C. may be determinedo l
through a statistical analysis applied to known test data.
Scmner assumed that the relative values of all other parameters did
not affect the determination of Cti
in the previously described technique,
permitting the use of the linear least-squares method for determining the
A Jrore attractive approach would be to determine both Ct. and C.l l
statistically~ however, a nonlinear approach is required. If a nonlinear
least-squares technique is employed, the problem of determining the correct
solution fran an infinite number of local optimum solutions is encountered.
In this investigation Sarmer 's method was used to obtain initial
values for Ct.l
and C. for use in a subsequent nonlinear least-squares1
analysis. Using this technique, the ability to predict the experimental
M- </> curves was improved in ccmpar ison to the 5cmner method.
Five parameters, Pi' were chosen for consideration in this
investigation:
P = t1
P = d2
Ps = b + t/2
The parameter L was not included because the test data (tests 1451 ande
1453) indicated that its effect was small. Application of Model VII
indicates that good correlation with test data performance may be expected
for a range of .6 to .75 for the ratio Le/d. This choice of parameters for

54
the test data of the current investigation resulted in values for the
quantities Cl. • and C. which are presented Section 4.1.2.2.l. l.
4.1.2 Prediction of Manent-Rotation Behavior
4.1.2.1 Initial Stiffness
The initial stiffness of the manent-rotation curve predicted by Model
I was always larger than that determined fran test results, even when the
beam lengths were assumed to be maximum. The maximum beam lengths were
taken to be (A ) max = g and (Ac) max = g c for the flange angle and the
web angle, respectively. That Model I predicts too large an initial
stiffness is attributed to the fact that the model assumes uniform behavior
across the length, L, of the angle. Model II was developed in order to
overcane this inadequacy.
Table 4.1 presents a ccmparison between Model II and test results for
the initial slope of the manent-rotation curve. The test results presented
in this table are taken fran Table 3.1. Results are presented for Model II
for roth inclusion and exclusion of shear stiffness. The canparison
indicates that Model II does, in general, predict reasonable values for the
initial stiffness for the connections of this investigation. Table 4.1
also indicates that the effect of shear in Model II is relatively small but
significant as a parameter, and predicts a lower initial stiffness for the
connection.
A deficiency in Model II is that the stiff beam portion of the angle
is assumed to be a function of the washer diameter, d w ' only. As a
refinement to the model, the effective width of the stiff beam zone could
be considered a function also of the length, L, of the angle, and the
spacing, p, of the belts in the angle.

55
4.1.2.2 Post-Elastic Behavior
The analysis. procedure, described in Section 4.1.1.2 as Model III, was
applied to test sPeCimen l4S2 which had one-half inch thick flange angles
and one-quarter inch thick web angles. The analysis was performed by first
evaluating Equations 4.2, 4.7 and 4.11 to obtain a relationship between the
shear, F, in the beam and the displacement, !1 , for the given angle
dimensions (see Figure 4.11). Equation 4.11 was evaluated for values of x
oorresponding to the end points of the beam. The relationship between F
and !1 is shCMIl in Figure 4.11 for several canbinations of beam
dimensions. In order to establish the manent-rotation, M- ~, relationship
for the connection, the individual F-!1 relationships for the beams
representing the angles must be related to M and ~. M is related to the
F':s by Equation 4.4 and ~ is related to the !1 's as described in Section
4.1.1.1. The M-~ relationship fran Model III for SPeCimen 1452 is shCMIl
in Figure 4.12, together with the experimentally determined relationship.
As can be seen in Figure 4.12, Model III underestimates the strength
of the oonnection by approximately fifty percent. This inadequacy in Model
III might be attributed to various individual factors or a canbination of
these factors. Such factors include: inadequacy of flexure alone to model
the angle, inappropriate selection of the length of the beam, inaccurate
material rrodel, and geanetrically nonlinear behavior.
In order to investigate the ability of flexural behavior to represent
the angle legs, as in Models I through III, Model TV (two-dimensional
finite element model) was also used to analyze connection 1452. The
force-displacement relationship is shCMIl in Figure 4.11 and the
mcment-rotation relationship is shCMIl in Figure 4.12. It should be noted
that the results fran Model III indicated that the contribution of the web
angles to the total manent resisting capacity of the oonnections considered

56
herein was small and could reasonably be neglected. The contribution of
the web angles was thus neglected in Model IV because its effect was again
considered to be relatively small, as in Model III, and in light of the
effort required to include it.
Although Model TIl does represent an increase in strength prediction of
the connection over Model III, the increase is not so large as to rule out
bending alone of the angle leg as a valid model. Also, the source of the
larger m:ment carrying capacity of the connection was left unanswered by
Model IV.
As indicated earlier, Model \7 was developed to investigate the
gecmetrically nonlinear behavior of the subject connections. Results were
obtained using Model V for connection 1452 for ccmparison with other
models. The bilinear beam stiffness, Kb ' was determined using the curve
shown in Figure 4.11 for Model D7~ Kb was found to be 2300 k/in. for the
initial slope and 33.33 k/in. for the second slope. Axial stiffness for
Model V was rrodeled assuming the cross-sectional area to be L x t and the
length, A , taken to be equal to g, 2.5 inches. The material model for the
axial stiffness was assumed to be linearly elastic, perfectly plastic with
an initial IlDdulus, E = 29000 ksi.
The analysis with Model v was achieved through the ANSYS (52) program
for four different assumptions with respect to material properties and
connection displacements. Condition A assmned linearly elastic behavior
for all material, using the initial slope, and small displacement theory.
Condition B assumed nonlinear material behavior and small displacement
theory. Condition C assumed nonlinear material behavior and large
displacement theory without stress stiffening. Condition D assumed
nonlinear material behavior and large displacement theory with stress
stiffening. Eliminating the obviously unrealistic Condition A, the results

57
shown in Figure 4.13 indicate that Condition D predicts the greatest
strength for the angle.
Condition D was selected to represent the behavior of both the flange
angles and the web angles in a subsequent analysis of the entire connection
in order to establish the manent-rotation relationship for the connection.
Since the analysis of the connection required the use of the canputer
(ANSYS), it was necessary to create an overall IOOdel of the connection.
This overall IOOdel is shown in Figure 4.l4~ it simulates the same type
connection behavior asst.nned for Models I through IV. However, this IOOdel
does penni t the location of the center of rotation of the connection to
vary. GAP* elements were used at the top and bottan flanges to allow the
behavior of the IOOdel to determine the center of rotation.
Results of the analysis using Condition D of Model V indicated that
the center of rotation is near the bottan flange of the beam: therefore,
the results fran Model V are ccmparable to Models I through IV. Results
were obtained both including web angles and excluding web angles, and are
shown in Figure 4.15.
Figure 4.15 indicates that Model V, with Condition D assumptions, is
in general capable of predicting the M- q, relationship much better than
Models I through IV, and that the primary effect of the web angles is to
"smooth out" the curve. The results fran this IOOdel are questionable
however, because the analysis indicates the existence of a very large
tension force in the vertical leg of the flange angle. It is difficult to
conceive of a mechanism in the actual connection capable of developing such
* An element which models compression with an infinite stiffness and
tension with zero stiffness (see Ref. 52).

58
large tensile forces. In addition, it is the opinion of the authors that
this analysis procedure produces a model that is too stiff.
The objective of Model VI was to model and analyze as accurately as
possible the beam-to-column connection for ccmparison with the simpler
models. The results of the analysis using Model VI applied to connection
l4S2, along with test results for the same connection, are shown in Figure
4.16. Canparison of the results shows that Model VI predicts well the
actual behavior for this connection for the range of results given.
Results are not shown for larger values of <I> because of the enormous
amount of computer time required to produce a single point on the curve. A
significant finding of this model, for the range of results available, is
that the very large axial forces in the vertical leg of the flange angle
predicted by Model V are unrealistic.
Model VII was canpleted by using test data to determine the unknown
quantities in the model. Test data from tests 1451, 14S2, 1484, 8Sl, 8S3,
8S5, and 8S6 was used to determine the ai
and C i for Model VII. A direct
application of Sarmer's method, as described in Section 4.1.1.6, resulted
in the values
a1 = - 1.22
a2 =- 1.37
a 3 =- .387
a4 = - 1.148
as = 1.141
C1 = - .2245865

59
C = .00301236Z
C3 =- .000002071785
These values for Cl.i and Ci were then used as initial values for the
nonlinear, least-squares analysis technique, which resulted in the values
Cl.1 = - 1.12808769
Cl.z = - 1.2870455
Cl.3 = - .41454097
Cl.4 = - .69412158
Cl.S = 1.34994572
C1 = .02232429
Cz = .00001850728
C3 = .000000003188976
Equation 4.13 was used, with these values of Cl. i and Ci' to predict
the rocment-rotation curves for connections having the same geometries as
those of SPectmens 1451, 1452, 1454, 851, 852, 853, 855, 856, and 857~ the
results are compared in Figures 4.17a - 4.17i with the test data for those
sPecimens. This comparison between Model VII and the test data shows that
Model VII produces satisfactory predictions of mcment-rotation behavior for
the range of geanetric Parameters under consideration.
Canparisons were not made between Model VII and test SPeCtmens 1453
and 854. The 4-1/2-inch gage in the vertical leg of the flange angle of
854 was considered to be unrealistically large for practical applications:
60
thus, the data fran this test were not included in determining the a.. and1.
C. terms for Model VII, nor were the data used to test the efficacy of the1.
model.
As noted earlier, the test data indicated that moderate changes in the
length of the web angle, L , did not appreciably affect the manentc
rotation behavior of the connections. Thus, for simplicity, L was notc
included as one of the parameters in the expression for K; rather a
limitation was imposed on the range of the ratio L / dc
for which the
empirically determined Model VII was considered valid (see Section
4.1.1.6). For Specimen l4S3, the L /d ratio was 0.39, less than the 0.6c
minimum considered applicable to the model, and the data fran the specimen
were not included in the a.. and c. determinations.1. 1.
4.2. Cyclic Tests
4.2.1. Spring-Rigid Region Model for Cyclic !:t:2 Curve
The I:X1I"p:>Se of this model is to understand the important factors which
dictate the behavior of the flange and web angle type semi-rigid connection
under investigation in this study. As will be discussed subsequently, a
tri-linear curve model, appropriately modified, ~u1d be used in the
analysis of a structure.
The model of the connection, referred to as the spring-rigid region
model, consists of ~ separate phases, similar to Model V discussed in
Section 4.1. First, the constituent angles are analyzed individually to
determine their force-displacement relations. Second, the ccmplete
connection is modeled, replacing the angle with springs which have the
force-displacement characteristics of the actual angles. The beam is
modeled as a rigid region (infinitely stiff relative to the springs). Gap
elements are used at the locations of the flange angle springs to simulate
61
bearing or separation.
The flange and web angles are simulated by an axial element
representing the bending stiffness of the angle. The membrane force in the
angle will not be considered, because of the unrealistically large forces
generated, as discussed in Section 4.1.2.2.
Analysis of the flange angles in Section 4.1 assmned two dimensional
behavior, which is obviously unrealistic. The restraints of the angle on
the oolumn leg are localized around the bolts rather than fixed along the
bolt line. Prediction of the ~ behavior fran a two dimensional analysis
of the angle was initially too stiff and, with the formation of a hinge,
lacked sufficient strength to generate the large manents found in the test
results.
A three-dimensional analysis of the angles with solid elements should
alleviate both of the problems encountered with the two dimensional beam
IOOdel. The 3-D IOOdel will be sanewhat more flexible, wi t:h a more realistic
displaced shape of the angle possible, hence decreasing the initial
stiffness. The spread of plastic regions should also be more realistic
than a single plastic hinge, resulting in a smoother transition fran
elastic to plastic response.
Hardening of the material in the regions of large strain, around the
column bolt and at the toe of the fillet, should proceed at a faster rate
because of the inclusion of shear in the solid element. The increase in
the rate of hardening and the more realistic restraints should increase the
strength of the angle with respect to its force-displacement curve.
Large displacement effects are not oonsidered in the 3-D analysis of
the angle. The membrane tension forces will not be considered explicitly
because it is believed the restraint necessary to generate the membrane
tension force does not exist in the angle to beam flange connection.

62
Static tests show the initial unloading portion of the curve to have the
same slope as the initial portion of the loading curve, suggesting that the
change in configuration does not significantly affect the
force-displacement behavior of the flange angles. Large strains must be
considered, however.
The contribution of the web angles to the overall connection behavior
is small cc:mpared to that of the flange angles. Consequently, the web
angles do not warrant as extensive an analysis as the flange angles.
Knowing the force-displacement properties of the connecting angles,
the analysis of the <Xmplete connection is straightforward. The connection
model is similar to Figure 4.14, with the exception of the "axialn
elements. The type of analysis is non-linear material and small
displacement. The changing status of the gap elements will require
reformulation of the stiffness matrix upon change in loading direction and
during the transition period. This allows the center of rotation to adjust
and to enable this model to predict the pinching effect, discussed in
Section 3.2.3.
Analysis of the connection as a spring-rigid region is currently under
investigation.
4.2.2. Tri-Linear Model for Cyclic M- cj> Curve
In previous investigations of the behavior of connections, empirical
models capable of predicting cyclic manent-rotation behavior have been
devised. In one such study (42) , the static manent-rotation curve is
tri-linearized by defining an initial slope ~' an elastic limit manent,
Mel' a secondary slope,. K2
, a yield manent, My' and a final slope, K3
• The
tr i-linear nanent-rotation curve is then used as a skeleton curve in the
modeling of cyclic behavior.

63
TO predict cyclic behavior with the tri-linear model, a constant
strength envelope is assumed. Also, upon unloading, the connection is
assumed to behave elastically for a manent range equal to 2Mel . After
reaching the limit of the elastic moment range, the response continues at a
slope of k2 until intersection with the constant strength envelope,
whereupon the slope changes to k3
(see Figure 4.18).
A serious drawback of this tri-linear model, when applied to the type
of connection considered in this investigation, is the inability to predict
the pinching observed in the test results, as illustrated in Figure 4.19.
This deficiency is attributed to the use of the static M-4> curve as the
skeleton curve. Upon entering Region II, the connection behaves in a mode
not present in static loading, as described in Section 3.2.3.
A simple modification would be to ignore the I<z stiffness and simply
connect the elastic limit, Point A, to the extreme point predicted by the
tri-linear model, Point B, Figure 4.19. This modification predicts the
Region II slope rather well. This suggests replacing the skeleton curve
with a cyclic moment-rotation curve after the initial loading.
Unfortunately, the stiffness in Region II is not a constant, as discussed
in Section 3.2.3 (see Figures 3.16 through 3.19). Modifications to the
tri-linear curve model are currently under investigation.
64
v. stJl.t1ARY AND CONCLUSICN8
5.1 Static Tests
A total of 11 members were tested under monotonic loading to generate
static nnnent-rotation relationships for the test connections. The
connections consisted of top and seat angles bolted to the flanges of beam
sections and a supporting stub column, together with double web angles
bolted to the beam web and column flange. Four of the test connections
were framed to Wl4X38 beams ~ the remaining seven specimens were framed to
waX21 sections. For the top and seat flange angles, the thickness, length,
and gage (in the leg attached to the column flange) were varied, together
with the beam depth, to effect connections of varying stiffness. The
thickness and length of the web angles were varied also.
In all of the static test specimens, the connections exhibited a
nnnent- rotation response that became non-linear relatively early in the
loading sequence. This is attributed, primarily, to local yielding and
eventual plastic hinge formation at each toe of the fillet in the angle
attached to the tension flange of the beam. Another hinge developed in the
vicinity of the bolt line in the leg of the flange angle attached to the
column, together with progressive plastic hinging in the outstanding legs
of the web angles.
with the exception of specimens 882 and 1482, all of the test members
and their connections were able to develop continually increasing nnnents
through the full range of rotations imposed dur ing the tests. (The maximum
rotations corresponded to deflections exceeding four times the deflection,
at allCMable load, of simply supported beams having the same section and
span as those in the test program.) During the latter perioo of loading, a
nearly constant or only very gradually decreasing positive slope of the
nnnent-rotation curve was exhibited by each of the specimens (except 882) •

65
This nearly oonstant stiffness at large deformations has been attributed to
material strain· hardening, and to the oonsequences of progressive changes
in the geanetries of the oonnecting angles. The increasing deflection of
the tension flange angle at large connection rotations produces a
rontinuous change in the internal force distribution in the legs of the
angle, with axial tension becaning an increasing factor as the angle
progressively "flattens out." The gradual transition fran a predaninately
flexural resp:>nse to a canbined flexural-axial resp:>nse, with the
acoanpanying strain hardening, can thus account for the ability of the
ronnections to achieve considerably greater manent capacities, by a factor
of at least two, than those predicted by a simple flexural plastic hinge
mechanism.
Specimens 882 and 1482 exhibited slip in the connection angles during
the rourse of testing~ these were the stiffer connections for each beam
size, thereby developing the larger manents (and, corresp:>ndingly, larger
bolt shear forces) in each test group. In a subsequent investigation,
7/8-inch diameter bolts will be used in the heavier connections in place of
the 3/4-inch bolts used exclusively in this investigation, to obviate or
delay the occurrence of slip during testing.
The static tests have shown that the geanetric Parameters that most
significantly affect the initial stiffness and static moment-rotation
performance of the connections investigated are: the depth of the beam
section to which the ronnections are framed~ the thickness of the flange
angles ~ and the gage in the leg of the flange angles attached to the
rolumn. Although not ronsidered in this study, an increase in bolt
diameter would be expected to affect connection resp:>nse, at least
initially, in a manner similar to the effect of decreasing the angle gage.
Variations in the length of the flange angles, and the length and thickness

66
of the web angles, had a less pronounced effect on connection response than
the other parameters.
Several analytical models are proposed to predict the initial
stiffness and complete moment-rotation relationship for semi-rigid
connections of the type considered in this study. These include:
segmental "beam" models (representing the leqs of the flange and web angles
attached to the colUllU'l), a dual spring representation of the flexural and
axial stiffness of the connection elements, and twcr and three-dimensional
finite element models of the flange and web angles. In additional, a
direct empirical model was considered, with the requisite parametric
constants being generated from a statistical analysis of the test data.
The ability of the analytical models to predict the ini tial slope and
complete m:ment-rotation curve for the test connections varied in direct
relation to the complexity of the model, with the sophisticated (and most
canputationally time-consuming) three-dimensional finite element model
offering the best correlation with the experimental results. However, the
empirical model, with further refinements to be gained from additional test
data, offers the greatest iI1lllediate promise as a practical means of
describing the non-linear static response of the semi-rigid connections.
5.2 Cyclic Tests
Four specimens, with geometries cemparable to those of the static test
series, were tested under cyclic (quasi-static) loading. Two of the
specimens were framed to the Wl4X38 beam sections, the other two framed to
the waX2l beams. For each of the beam sizes, t\\U thicknesses of the top
and seat flange angles were tested. The tests were conducted using full
reversal of controlled displacement to generate data indicative of the

67
displacement extremes to which the connections could be subjected under
seismic loading.. The test procedure consisted of cycling sinusoidally
between progressively increasing limits of displacement, while monitoring
the range in rnanent and local displacements (rotations) develOPed during
each cycle. The displacement-time histories followed a sequential block
loading pattern, with a total of 12-15 cycles applied in each block before
the amplitude was increased. The stabilized cyclic hysteresis loops at
each displacement amplitude are reported for the four test members.
Stable hysteresis loops were established, for the 14 inch test
sPecimens, within a few cycles after an increase amplitude was imposed
relative to the preceding displacement under the block-type loading
pattern. For the a-inch deep connections, a continual, though small,
softening (loss of rnanent) was noted for each progressive cycle at a
constant displacement amplitude~ however, the hysteresis loops were
otherwise similar in appearance.
For each of the four test SPecimens, the rnanent-rotation behavior was
characterized by loops of continUally decreasing slope for relatively small
displacements in the non-linear range. In contrast, the hysteresis loops
exhibited a "pinching" effect at larger amplitudes, the degree of pinching
being lOOre pronounced in the Wl4X38 beam connections than in the waX2l
members. This increase in connection stiffness observed toward the tip of
each hysteretic loop may be attributed, in large measure, to the changing
geanetry of the connection dur ing each half cycle of loading. As rotation
progresses, following a reversal in the direction of the rnanent at the
connection, there is a period when both flange angles are drawn away fran
the column. with the connection in this configuration, the slope of the
rnanent-rotation curve decreases as rotation proceeds. Eventually, the
vertical leg of canpression flange angle folds back into full bearing on

68
the oolumn flange, with the oonnection exhibiting a concurrent increase in
relative stiffness (pinching of the M-t curve).
Each of the cyclic tests culminated in the formation and subsequent
propagation of fatigue cracks at the toe of the fillet in one or more of
the beam flange angles. The tests were terminated when cracking had
progressed at least partially across the face of the angle at the fillet~
no tests were extended to the point of rupture of a oonnection element.
The oonnections maintained ductile behavior dur ing the full extent of the
cyclic tests, and exhibited only modest loss of maximum m:ment fran the
time fatigue cracking was noticed to the termination of the test. No slip
was observed during the cyclic tests, nor was there any local buckling of
the oonnection elements.
The block-type cyclic tests have demonstrated the general stability of
the semi-rigid oonnections under large amplitude displacements, and enabled
quantification of the cyclic energy absorption capacities of these
oonnections. The tests have shown, also, that unless general frame
instability intervenes under multiple excursions of lateral displacement
typical of seismic loading, the effectiveness of connections of the type
studied herein may be limited by low cycle fatigue of the oonnection
elements. Additional data are needed with which to assess the acetmtulation
of fatigue damage in these connections ~ this is to be addressed in a
subsequent investigation.

69
1. Popov, E. P., and pinkney, R. B., "Cyclic Yield Reversal in SteelBuilding Connections," Journal of the Structural Division, ASCE, Vol.95, No. ST3, Prac. Paper 6441, March 1969.
2. Naka, T., Kato, B., Watabe, M., and Nakao, M., "Research on theBehavior of Steel Beam-to-Column Connections on Earthquake Engineering,vol. II, Santiago, Chile, January 1969.
3. Popov, E. P. , and pinkney, R. B. , "Reliability of SteelBeam-to-Column Connections under Cyclic Loading," Prac. of the Fourth~r1d Conference on Earthquake Engineering, vol. II, Santiago, Chile,January 1969.
4. Bertero, V. V., "Seismic Behavior of Steel Beam-to-Colurnn ConnectionSubassemblages," Prac. of the Fourth World Conference on EarthquakeEngineering, Vol. II, Rantiago, Chile, January 1969.
s. Naka, T., Kato, B., Watabe, M., Tanaka, A., and Sasaki, T., "Researchon the Behavior of Steel Beam-to-Colurnn Connections Subjected toLateral Force," Report No.3, Trans. of the Architectural Inst. ofJapan, Vol. 103, October 1964.
6. Roeder, C. W., and Popov, E. P., "Eccentically Braced Steel Framesfor Earthquakes," Journal of the Structural Division, ASCE, vol. 104,No. ST3, Proc. Paper 13619, ~..arch 1978.
7. Johnston, B. G., and Deits, G. R. , "Tests of Miscellaneous WeldedBuilding Connections," Welding Journal, January 1942.
8. Beedle, L. S., and Christopher, R., "Tests ofConnections," Engineering Journal, AISC, Vol. 1, No.
Steel Manent3, October 1964.
9. PC>p:)v, E. P., and stephen, R. M., "Cyclic Loading of Full-Sized SteelConnections," Bulletin No. 21, AISI, February 1972.
10. Rathbun, J. C. , "Elastic properties of Riveted Connections,"':I:'ransactions, ASCE, Vol. 101, 1936.
11. "Second Report of the Steel Structures Research Carmittee, " GreatBritain, Dept. Sci. Ind. Res., London, 1934.
12. Galambos, T. V., "Deformation and Energy Absorption Capacity of SteelStructures in the Inelastic Range," Bulletin No.8, AISI, March 1968.
13. Hanson, R. D., "Characteristics of Steel Members and Connections, "Prac. of the U.S. Nat. Conference on Earthquake Engineering, EERI,Ann Aroor, Michigan, June 1975.

70
14. Hanson, R. D., "Canparison of Static and Dynamic Hysteresis Curves,"Journal of the Engr. Mech. Div., MeE, vol. 92, No. EMS, Pree.Paper 4949, OCtober 1966.
IS. Krishnamurthy, N., Juang, H.-T., and Jeffrey, "Analytical M-e Curvesfor End-Plate Connections., Journal of the Structural Division, ASCE,Vol. 105, No. STl, Pree. Paper 14294, January 1979.
16. Douty, R. T. , and McGuire, W. , "High Strength BeltedConnections," Journal of the Structural Division, MeE, Vol.ST2, Pree. Paper 4298, April 1965.
Manent91, No.
17. POJX)v, E. P., and Bertero, V. V., "Cyclic Loading of Steel Beams andConnections," Journal of the structural Division, ASCE, vol. 99, No.ST6, Pree. Paper 9790, June 1973.
18. Carpenter, L. D., and Ly, L.-W., "Reversed and Repeated Load Tests ofFull-Scale Steel Frames," Bulletin No. 24, AISI, April 1973.
19 • parfi tt, J. , Jr • , and Chen, W. F. , "Tests of Welded SteelBeam-tO-Column Manent Connections, "Journal of the structural Division,ASCE, Vol. 102, No. STl, Pree. Paper 11854, January 1976.
20. Degenkolb, H.J., "Design of Earthquake Resistant Structures - SteelFrame Structures," in Earthquake Engineering, R. L. Wiegel, ed.,Prentice-Hall, Inc., Englewood Cliffs, N. J., 1970.
21. Grundy, P., Thanas, I. R., and Bennetts, D. , "Beam-to-Column ManentConnections," Journal of the Structural Division, ASCE, vol. 106, No.STl, Pree. paper 15108, January 1980.
22. Rentschler, G. P., Chen, fliT. F. , and Driscoll, G. C. , "Tests ofBeam-to-Column Web Manent Connections," Journal of the StructuralDivision, ASCE, Vol. 106, No. STs, Pree. Paper 15386, May 1980.
23. Kato, B., "Beam-to-Column Connection Research in Japan," Journal of thestructural Division, ASCE, vol. 108, No. ST2, Pree. Paper 16852,February 1982.
24. Krawinkler, H. and Popov, E. P. , "Seismic Behavior of ManentConnections and Joints," Journal of the Structural Division, ASCE, Vol.108, No. ST2, Pree. paper 16865, February 1982.
25. Rentschler, G. P., Chen, W. F., and Driscoll, G. C., "Beam-to-ColumnWeb Connection Details," Journal of the Structural Division, ASCE, Vol.108, No. ST2, Pree. Paper 16880, February 1982.
26. Witteveen, J., Startk, J. W. B., Bij1aard, F. S. K., andzoetemeijer, P. , "Welded and Belted Beam-to-Column Connections, "Journal of the Structural Division, MCE, vol. 108, No. ST2, Pree.Paper 16873, February 1982.
27. Krishnamurthy, N. "A Fresh Look at Bolted End-Plate Behavior andDesign," Engineering Journal, AISC, vol. IS, No.2, 1978.
71
28. Krawinkler, H., "Shear in Bearn-Column Joints in Seismic Design of SteelFrames, Engineering Journal, AISC, Vol. 15, No.3, 1978.
29. Popov, E. P., Bertero, V. V., and Chandramouli, S., "HystereticBehavior of Steel Columns," Report No. EERC 75-11, University ofCalifornia, Berkeley, California, September 1975.
30. Bertero, V. V., Krawinkler, H. and Popov, E. P., "Further Studies onSeismic Behavior of Steel Bearn-Column Subassemblies," Report No. EERC73-27, University of California, Berkeley, California, December 1973.
31. Krawinkler, H., Bertero, V. V., and Popov, E. P., "Inelastic Behaviorof Steel Beam-tO-Column Subassemblies," Report No. EERC 71-7,University of California, Berkeley, California, October 1971.
32. Lewitt, C. W., Chesson, E., and Munse, w. H., "RestraintCharacteristics of Flexible Riveted and Bolted Beam-tO-ColumnConnections," Bulletin No. 500, Universi ty of Illinois, College ofEngineering, Engr. Exp. Station, January 1969.
33. Kennedy, D. J. L. , "Manent-Rotation Characteristics of ShearConnections," Engineering Journal, AISC, Vol. 6, No.4, October 1969.
34. Sanner, W. H., "Behavior of Welded Header Plate Connections," Master'sThesis, University of Toronto, Toronto, Ontario, 1969.
35. Yura, J. A., Birkemoe, P. C., and Ricles, J. M., "Beam Web ShearConnections, an Experimental Study," Journal of the StructuralDivision, ASCE, Vol. 108, Pree. Paper 16848, February 1982.
36. Specification for the Design, Fabrication and Erection of StructuralSteel for BuiIdings, American Instituteof Steel Construction, NewYork, 1969.
37. "Sumnary of Earthquake Conference," University of California, Berkeley,California, April 13-14, 1977.
38. Hanson, R. D., "Repair, Strengthening and Rehabilitation of BuildingsRecamnendations for Needed Research," University of Michigan,
Department of CiviI Engineering, UMEE: 77R4, October 1977.
39. Donovan, N. C., "Report on a study of Needs in Earthquake EngineeringResearch," Vol. 12, NO.1, Newsletter, Earthquake EngineeringResearch Institute, Berkeley, California, January 1978.
40. Monograph.2!! Planning and Design of Tall Buildings, vol. SB, Americansociety of Civil Engineers, 1979.
41. Ackroyd, M. H., and Gerstle, K. H., "Behavior of Type 2 SteelFrames," Paper No.8, Preprint 80-179, ASCE Convention, April 1980.
42. Moncarz, P. D., and Gerstle, K. H., "Steel Frame with NonlinearConnections," Journal of Structural Division, ASCE, Vol. 107, No.ST8, Pree. Paper 16440, August 1981.

72
43. Frye, M. H., and Morris, G. A., "Analysis of Flexibly Connected SteelFrames," Can. J. Civil Engineering, vol. 2, 1975.
44. Lathrop, R.. P. , Onderdonk, A. B. , and Cael, J. , "End PlateConnections in Plastically Designed Structures," Engineering Journal,AISC, Vol. 1, No.1, January 1964.
45. Disque, R. 0., "Wind Connection with Simple Framing," EngineeringJournal, AISC, vol. 1, No.3, July 1964.
46. Abolitz, A. L., and Warner, M. E.,Connections," Engineerng Journal, AISC, Vol.
"Bending Under Seated2, No.1, January 1965.
47. Lathers, J. E., Advanced Design in structural Steel, Prentice-Hall,Inc., Englewood Cliffs, NJ. 1960-.
48. Monforton, G.R., and Wu, T. S., "Matrix Analysis of Semi-RigidlyConnected Frames," Journal of Structural Division, ASCE, vol. 89, No.ST6, Prcx::. Paper 3713, December 1963.
49. Ronstad, K. M., and Sabramanian, C. V., "Analysis of Frames withpartial Connectin Rigidity," Journal of Structural Division, ASCE, Vol.96, No. STll, Prac. Paper 7664, November 1970 •
.50. Marley, M. H., "Analysis and Tests of F1exibly-Connected SteelFrames," Report to AISI under project No. 199, Dept. of Civil,Environmental, and Architectural Engineering, University of Colorado,Boulder, Colorado, March 1982.
51. Gaylord, E. H., and Gaylord, C. N., Design of Steel Structures,McGraw-Hill Book Canpany, NY, 1972.
52. Desalvo, G. J. and Swanson, J. A., ANSYS Engineering Analysis SystemUser's Manual (Revision lL, Swanson Analysis Systems, Inc., July 1979.
53. Kohnke, P. C., ANSYS Engineering Analysis System Theoretical Manual,swanson Analysis Systems, Inc., November 1977.
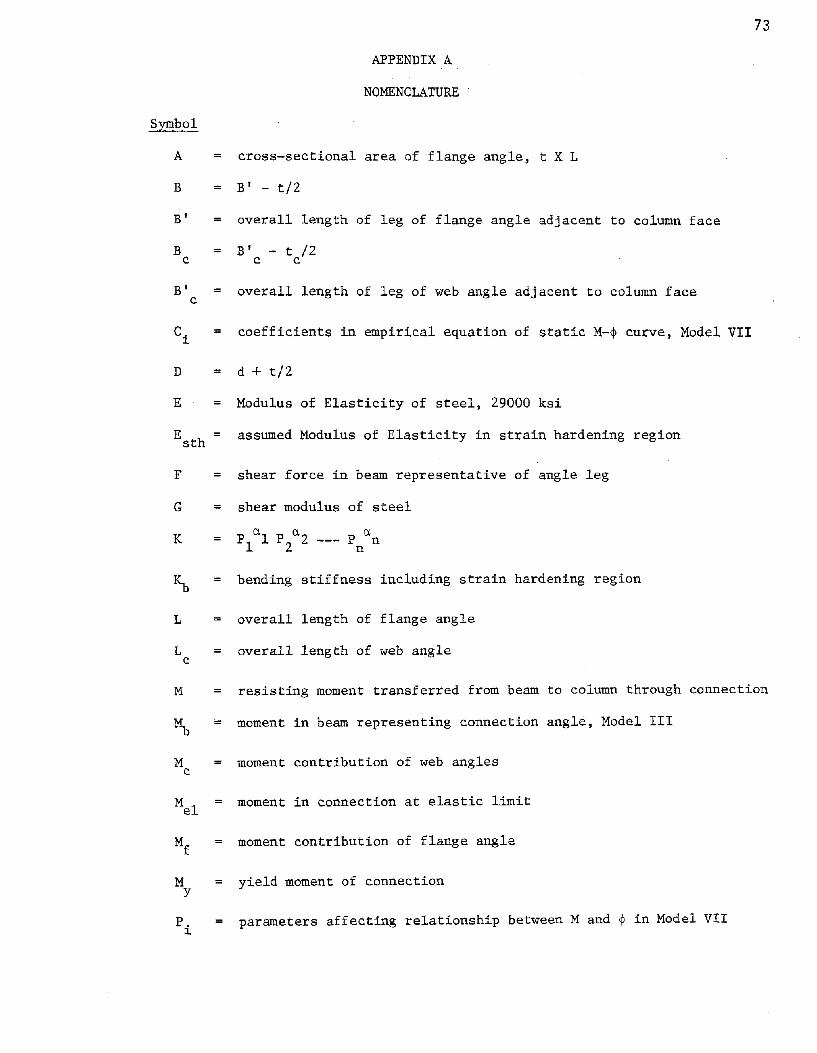
73
APPENDIX A
NOMENCLATURE
Symbol
A
B
=
=
cross-sectional area of flange angle, t X L
B' - t/2
B' overall length of leg of flange angle adjacent to column face
B = B' - t /2c c c
B' = overall length of leg of web angle adjacent to column facec
C. = coefficients in empirical equation of static M-~ curve, Model VII~
D = d + t/2
E Modulus of Elasticity of steel, 29000 ksi
ESth = assumed Modulus of Elasticity in strain hardening region
F shear force in beam representative of angle leg
G = shear modulus of steel
K
L
Lc
M
Mc
bending stiffness including strain hardening region
overall length of flange angle
overall length of web angle
resisting moment transferred from beam to column through connection
moment in beam representing connection angle, Model III
moment contribution of web angles
moment in connection at elastic limit
moment contribution of flange angle
M = yield moment of connectiony
P. = parameters affecting relationship between M and ~ in Model VII~

74
NOMENCLATURE (Con'd)
Symbol
S = elastic section modulus
Z = plastic section modulus
a 9 k
b . 9 db
/2 - t/2
bc 9c - db /2 - tc
/2
d depth of beam
db diameter of bolt
dh = diameter of bolt hole
d = diameter of washerw
9 gage in flange angle; from heel of angle to center of bolt hole
in leg adjacent to column face
9c = gage in web angle; from heel of angle to center of bolt hole
in leg adjacent to column face
k distance from heel of angle to toe of fillet, flange angle
k = distance from heel of angle to toe of fillet, web anglec
P pitch, center-to-center spacing of bolts in leg of flange angle
adjacent to column face
P pitch, center-to-center spacing of bolts in each leg of web anglec
t thickness of flange angle
t thickness of web anglec
a. exponents in empirical equation of static M-~ curve, Model VII~
y = length of flange angle used in finite element analysis
~ displacement of heel of flange angle
E strain at initial yielding in connection anglesy

Symbol
A
NOMENCLATURE (Con' d)
length of beam representative of flange angle leg adjacent to
column face
75
A = length of beam representative of web angle leg adjacent toc
column face
cr = stress at initial yielding in connection anglesy
¢ = rotation of end of beam with respect to column face
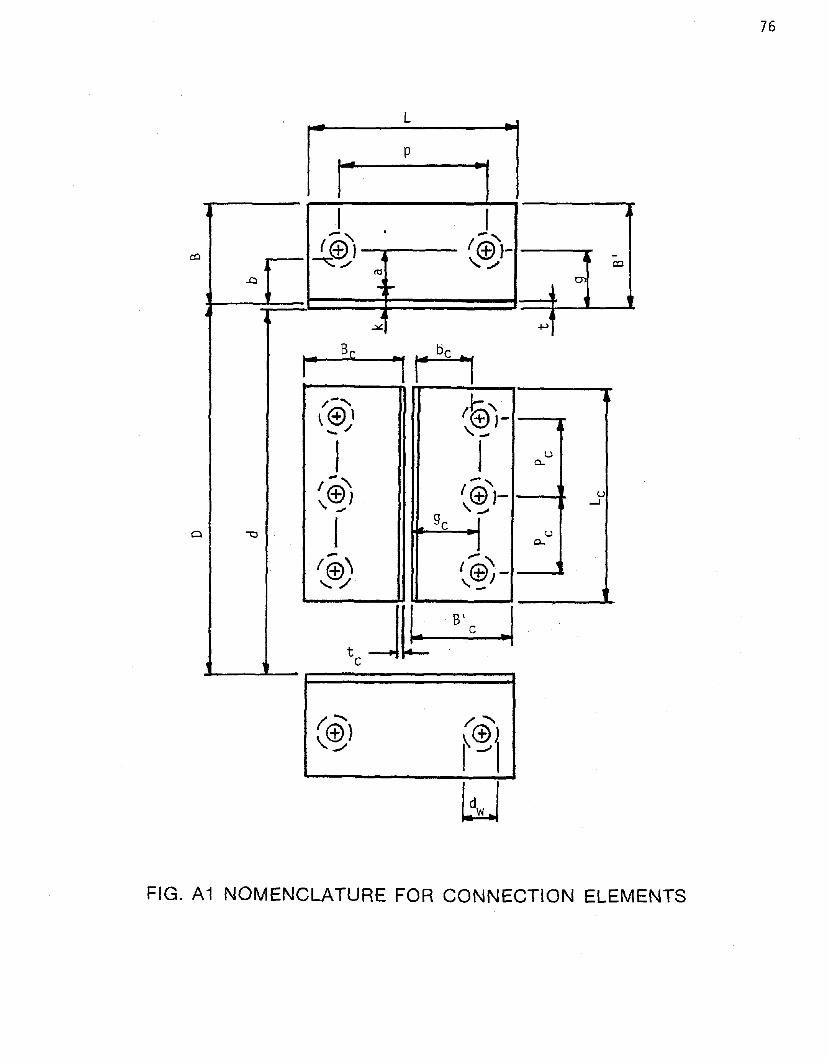
76
lp
L
rr »
J I I j
-, . -,....--- f{±)J
4I$l-
I --:;::: ./ , ...... CO(\j
-0 en..; l-
4 4~ ~
Be 0I· 1M
/- ..... (I:: '"\@l @,-•_/ \" ....
J Ju
0-
... :,\ -,I<f)) I@J- u
' .... '- ~
(9c i
""t:)
1u
0-- -:\I@~ I (f)-..... / \, I ,-tJ~
B1
~C
~ C
FIG. A1 NOMENCLATURE FOR CONNECTION ELEMENTS

APPENDIX B
THREE DIMENSICl\fAL
FINITE ELEMENT.' MJDEL
77

a 78
e _----t----.."
9 , hWeb Angle, Beam Leg
d
j
c
/ "-./ "-
"- /"- /
/ "-/ "-
//
g ~---~_--.,;~h--___4_---_I
elr- --\-__~--_\_---___l
1
Beam Web, and Centerlinesof Flange Angles
View - y Normal to Page
FIG. B1 MODEL VI FINITE ELEMENT MESH - BEAM ELEVATION
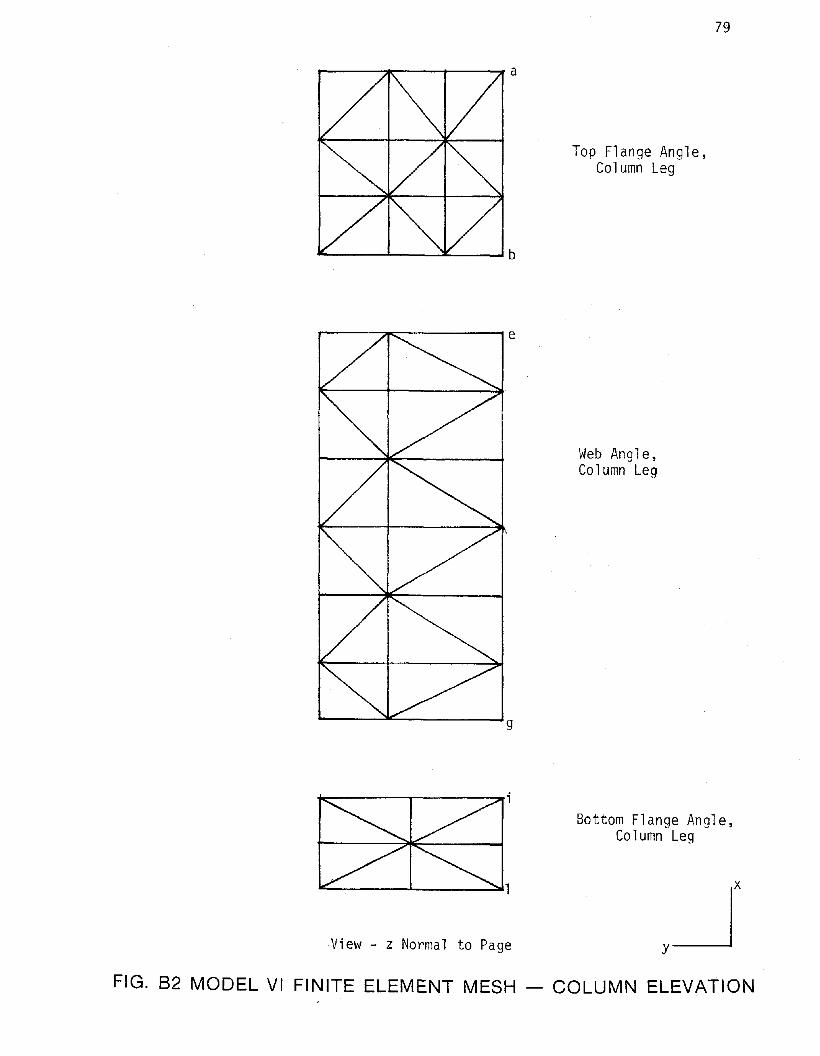
79
---~---t--_ a
Top Flange Angle,Column Leg
L-__...t...-_----:ll~_....Jb
r----~----__t e
Web Angle,Column Leg
g
View - z Normal to Page
Bottom Flange Angle,Column Leg
~xy
FIG. 82 MODEL VI FINITE ELEMENT MESH - COLUMN ELEVATION
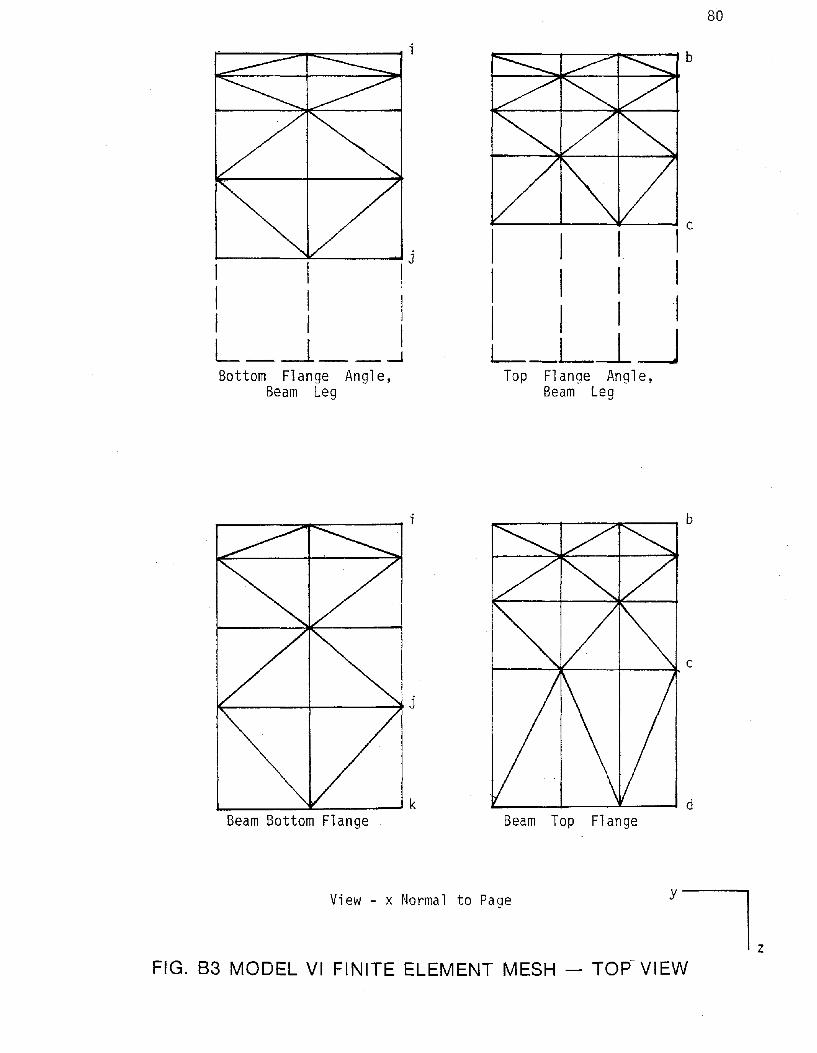
,j
I I II I IL_-l__ ~
Bottom Flange Angle,Beam Leg
~-----i~-----:Jt j
Beam Bottom Flange
---~--¥-----4C
I I f II I I II I I IL-_L--l-J
Top Flange Angle,Beam Leg
~--...3JIr-----+----).C
'--__~---1--____ld
Beam Top Flange
80
View - x Normal to Page
FIG. 83 MODEL VI FINITE ELEMENT MESH - TO~ VIEW

TABL
E2
.1
MEC
HANI
CAL
PRO
PER
TIES
OFTE
STM
ATE
RIA
L
Mec
han
ical
Pro
pert
ies
Ste
el
!Des
ign
atio
n
AST
MA
36
Yie
ldS
tress
(ksi
)
42
.8
42
.9
39
.3
37
.6
53*
Ult
imat
eS
tren
gth
(ksi
)
69
.9
67
.9
68
.0
67
.9
80*
Elo
ng
atio
nin
2-i
nch
Gag
eL
eng
th(p
erc
en
t)
23
.8
22
.9
32
.5
31
.9
*F
lan
ge
ang
lem
ate
rial,
spec
imen
1482
00 -

TABL
I-:2
.2
SCH
EDU
LEO
FTE
STSP
ECIM
ENS
Top
and
Bot
tom
Fla
ng
eA
ng
les*
Web
Ang
les*
Spe
cim
enT
ype
of
Bea
mA
ngle
Len
gth
."L
"G
age
inL
egon
Col
umn
Bo
ltS
pac
ing
inL
egon
Ang
leL
engt
h"L
"N
o.T
est
Sele
cti
on
(in
ches
)F
lan
ge.
"g"
(in
ches
)C
ol.
Fla
ng
e."p
"(i
nch
es)
(in<
7h~s
)c
14S
1S
tati
cW
14X
38L
6X4X
3/8
82~
5~
2L4X3~X!t;
8~
14S2
Sta
tic
W14
X38
L6X4X~
82~
5~
2L4X3~X!t;
8~
1483
Sta
tic
W14
X38
L6X
4X3/
88
2~
5~
2L4X3~X!t;
5~t
l4S
4S
tati
cW
l4X
38L
6X4X
3/8
82~
5~
2L4X3~X3/8
8~
BSl
Sta
tic
W8X
2lL6X3~XS/16
62
3~
2L4X3~X!t;
5~
BS2
Sta
tic
W8X
2lL6X3~X3/H
62
3~
2L4X3~X!t;
S~
BS3
Sta
tic
W8X
2lL6X3~X5/l6
82
3~
2L4X3~X!t;
5~
8S4
Sta
tic
W8X
2lL
6X6X
3/8
64~
3~
2L4X3~X!t;
5~
BS5
Sta
tic
W8X
2lL
6X4X
3/8
82~
S~
2L4X3~X!t;
5~
BS6
Sta
tic
WBX
2lL
6X4X
5/l6
62~
3~
2L4X3~X!t;
S~
BS7
Sta
tic
WBX
2lL
6X4X
3/8
62~
3~
2L4X3~X!t;
5~
l4C
lC
ycl
icW
l4X
38L
6X4X
3/B
82~
5~
2L4X3~X!t;
8~
l4C
2C
ycl
icW
l4X
38L6X4X~
82~
5~
2L4X3~X!t;
8~
BC
lC
ycl
icW
BX2l
L6X
4X5/
l66
23~
2L4X3~X!t;
5~
BC2
Cy
clic
WBX
2lL6
X4X
3/B
62
3~
2L4X3~X!t;
5~
* See
No
men
clat
ure
,A
ppen
dix
A.
tTw
ob
olt
sat
3-i
nch
spac
ing
.m
ount
edin
top
two
ho
les
onst
ub
colu
mn.
Fig
.2
.3.
ex>
N
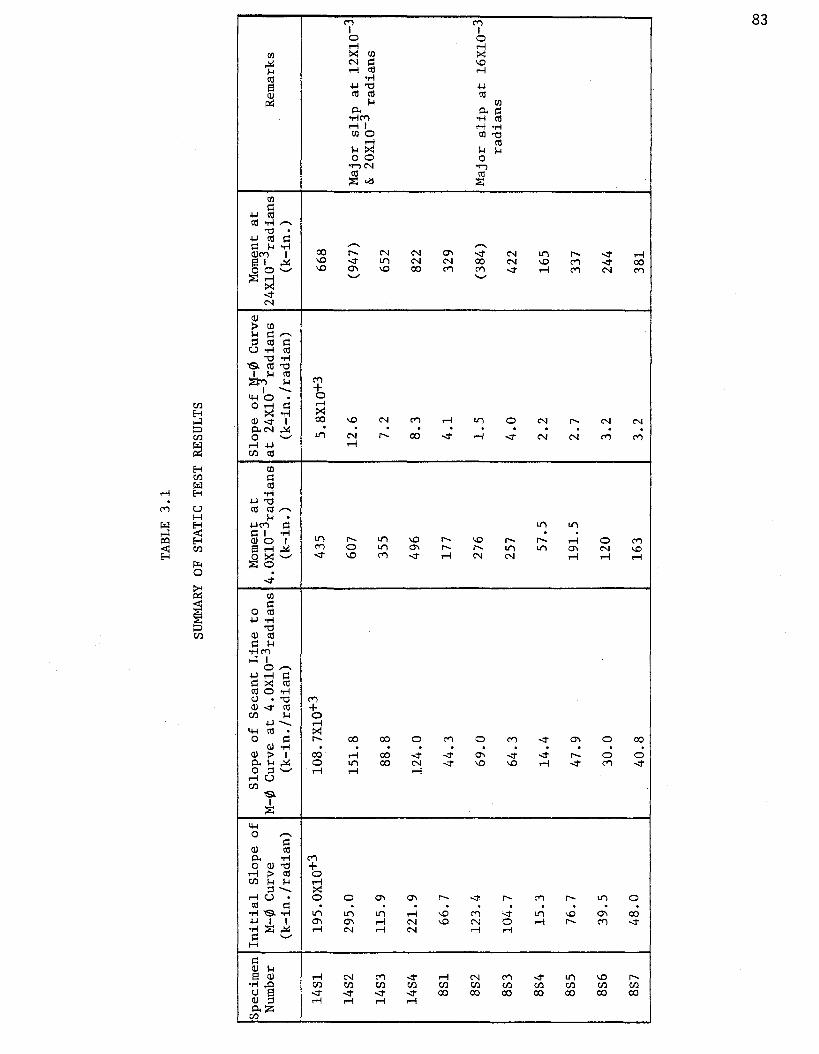
TABL
E3
.1
SUM
MAR
YO
FST
ATI
CTE
STR
ESU
LTS
Spe
cim
enIn
itia
lS
lop
eo
fS
lop
eo
fS
ecan
tL
ine
toM
omen
tat
Slo
pe
of_~-0
Cur
veM
omen
tat
Num
ber
M-0
Cur
veM
-0C
urve
at
4.0
X1
0-3
rad
ian
s4.
0XlO
-3ra
dia
ns
at
24X
10ra
dia
ns
24X
10-3
rad
ian
sR
emar
ks(k
-in
./ra
dia
n)
(k-i
n./
rad
ian
)(k
-in
.)(k
-in
./ra
dia
n)
(k-i
n.
)
14S
119
5.0X
10+
310
8.7X
10+
343
55.
8X10
+3
668
14S
22
95
.01
51
.860
71
2.6
(947
)M
ajor
sli
pat
12X
10-3
&20
X10
-3ra
dia
ns
14S
31
15
.98
8.8
355
7.2
652
14S
42
21
.91
24
.049
68
.382
2
8S1
66
.74
4.3
177
4.1
329
8S2
12
3.4
69
.027
61
.5(3
84)
Maj
orsli
pat
16X
10-3
rad
ian
s8S
31
04
.76
4.3
257
4.0
422
8S4
15
.31
4.4
57
.52
.216
5
8S5
76
.74
7.9
19
1.5
2.7
337
8S6
39
.53
0.0
120
3.2
244
8S7
48
.04
0.8
163
3.2
381
co w

TABL
E3
.2
SUM
MAR
YO
FC
YC
LIC
TEST
RESU
LTS
-SP
ECIM
EN14
C1
Act
uat
or
Fre
qu
ency
Num
ber
Ran
geo
fR
ange
of
Are
ao
fC
um
ula
tiv
eC
um
ula
tiv
eD
isp
lace
men
t(H
z)
of
Ro
tati
on
Mom
ent
aS
ing
leA
rea
of
Num
ber
Rem
arks
Am
pli
tud
eC
ycl
es(r
ad
ian
s(k
ip-i
nch
es)
Hy
stere
sis
Hy
stere
sis
of
Cy
cles
(in
ch
es)
X10
00)
Loo
p*L
oops
(kip
-in
ch
es)
(kip
-in
ch
es)
0.2
.05
4-
--
-4
No
Dat
a.1
12
.20
43
5.8
00
51
2.0
84
41
.50
06
.51
2.1
04
28
.50
07
102
.34
43
9.2
00
170
.4.1
14
.75
74
5.0
.29
6.2
96
181
4.8
77
38
.5.1
23
.419
191
4.8
97
41
.5.1
11
.53
020
.25
14
.91
74
2.5
.06
9.5
9921
14
.77
73
7.1
.06
4.6
63
2210
5.0
475
1.7
.06
91
.35
332
0.6
.11
7.8
49
31
.3.7
34
2.08
733
17.
779
34
.9.4
19
2.5
06
341
7.8
59
33
.2.3
20
2.8
26
35.2
51
7.7
89
24
.9.2
83
3.1
09
361
7.8
89
22
.0.2
79
3.3
88
3710
8.0
89
32
.2.2
82
6.2
08
470
.8.1
11
1.1
010
681
.60
87
.81
648
11
0.9
910
46.9
98
8.8
14
491
10
.86
1031
.82
49
.63
850
.25
11
0.9
510
32.8
12
10
.45
051
11
1.0
310
34.8
31
11
.28
152
101
1.2
310
42.8
29
19
.57
162
1.0
.11
14
.44
1142
2.4
52
2.0
21
631
14
.32
1105
1.9
12
23
.93
364
11
4.3
711
021
.87
525
.808
65.2
51
14
.49
1095
1.8
18
27.6
2666
11
4.2
810
941
.83
29
.45
667
101
4.7
011
091
.78
47.2
5677
*F
or
mu
ltip
lecy
cle
s,th
eare
ao
fo
ne
loo
pis
com
pute
das
the
aver
age
of
the
firs
tan
dla
st
loo
pare
as.
Co
nti
nu
ed-
00
-l::o

TABL
E3
.2(c
on
tin
ued
)
SUM
MAR
YO
FC
YC
LIC
TEST
RES
ULT
S-
SPEC
IMEN
14C
1
0:
U'!
ast
loo
pare
as.
gp
py
Act
uat
or
Fre
qu
ency
Num
ber
Ran
geo
fR
ange
of
Are
ao
fC
um
ula
tiv
eC
um
ula
tiv
e
Dis
pla
cem
ent
(Hz)
of
Ro
tati
.on
Mom
ent
aS
ing
leA
rea
of
Num
ber
Rem
arks
Am
pli
tud
eC
ycl
es(r
ad
lan
s(k
ip-i
nch
es)
Hy
stere
sis
Hy
stere
sis
of
Cy
cles
(in
ches
)X
1000
)L
oop*
Loo
ps(k
ip-i
nch
es)
(kip
-in
ch
es)
1.2
.11
17
.73
1185
3.7
47
51
.00
378
11
7.6
411
463
.37
25
4.3
879
11
7.7
811
423
.39
57
.77
80.2
51
17
.67
1139
3.2
78
61
.04
811
17
.70
1140
3.2
41
64
.28
8210
17
.94
1140
3.1
93
96
.21
921
.4.1
12
1.1
212
075
.48
01
01
.69
931
21
.17
1183
5.2
30
10
6.9
941
21.3
611
735
.23
21
12
.295
.25
121
.22
1171
5.0
91
17
.296
12
1.1
811
695
.03
31
22
.397
1021
.73
1170
4.9
81
72
.110
71
.6.1
12
4.5
112
767
.09
21
79
.210
81
24
.65
1250
6.7
04
18
5.9
109
12
4.6
812
386
.57
71
92
.511
01
24
.83
1230
6.5
94
19
9.0
111
.25
12
4.5
212
176
.58
20
5.6
112
12
4.6
012
196
.53
72
12
.211
310
25
.11
1217
6.5
07
277
.212
31
.8.1
12
8.3
012
619
.02
86
.212
41
28
.42
1232
8.9
12
29
5.1
125
I'2
8.3
112
138
.73
43
03
.912
6.2
51
28
.17
1213
8.6
15
31
2.5
127
12
8.2
212
038
.60
32
1.1
128
102
8.5
512
068
.41
54
05
.213
82
.0.1
13
1.8
112
571
1.0
41
6.2
139
131
.76
1225
10
.87
42
7.1
140
13
2.1
712
201
0.7
75
43
7.9
141
.25
1--
----
----
----
----
--h
alf
cycl
e1
31
.85
1193
10
.55
44
8.4
142
13
1.9
011
981
0.4
74
45
8.9
143
63
2.4
611
971
0.2
65
20
.514
9cr
ack
sdetected~th
cycl
e-
--
--
-)(

TABL
E3
.3
SmlM
ARY
OF
CY
CU
CTE
STR
ESU
LTS
-SP
ECIM
EN14
C2
-A
ctu
ato
rF
req
uen
cyN
umbe
rR
ange
of
Ran
geo
fA
rea
of
Cu
mu
lati
ve
Cu
mu
lati
ve
Dis
pla
cem
ent
(Hz)
of
Ro
tati
on
Mom
ent
aS
ing
leA
rea
of
Num
ber
Rem
arks
Am
pli
tud
eC
ycl
es(r
ad
ian
s(k
ip-i
nch
es)
Hy
stere
sis
Hy
stere
sis
of
Cy
cles
(in
ches
)X
1000
)L
oop*
Loo
ps(k
ip-i
nch
es)
(kip
-in
ch
es)
0.2
.11
2.1
64
72
.30
1.2
51
2.1
24
78
.10
21
2.0
94
74
.20
310
2.3
74
88
.70
013
.4.1
14
.47
85
0.7
.23
8.2
38
14.2
51
4.4
58
31
.1.1
52
.39
015
14
.54
85
7.0
.13
5.5
25
1610
4.4
3**
.211
**2
.63
526
.6.1
17
.07
1132
.72
53
.36
027
Inv
erte
dcy
c1e*
**.2
51
7.0
1143
.40
43
.76
428
Inv
erte
dcy
cle
17
.111
39.3
10
4.0
74
29In
ver
ted
cycl
e10
7.3
111
54.3
04
7.1
14
39.8
.11
10
.12
1357
1.4
69
8.5
83
401
9.9
513
45.8
78
9.4
61
41In
ver
ted
cycl
e1
9.8
713
451
.03
81
0.4
99
42In
ver
ted
cycl
e.2
51
10
.08
1334
.74
81
1.2
4743
19
.82
1331
.92
81
2.1
75
4410
10
.09
1332
.91
92
1.3
65
541
.0.1
11
3.1
214
902
.80
92
4.1
74
55.2
51
12
.98
1477
2.4
37
26
.61
156
11
3.2
614
662
.26
22
8.8
73
5710
13
.43
1465
2.1
97
50
.84
367
1.2
.11
16
.28
1571
4.5
63
55
.40
668
.25
11
6.3
115
484
.23
75
9.6
43
691
16
.18
1541
4.1
01
63
.74
470
101
6.7
015
364
.01
21
03
.86
80*F
orm
ult
iple
cy
cle
s,th
eare
ao
fon
elo
op
isco
mpu
ted
asth
eav
erag
eo
fth
efi
rst
and
last
loo
pare
as.
**
Qu
esti
on
able
data
.**
*Loa
dcy
cle
inv
ert
ed
from
norm
alsi
ne
wav
e,F
ig.
3.2
1.
Co
nti
nu
ed-
CX>
O"'l

TABL
E3
.3(c
on
tin
ued
)
SUM
MAR
YO
FC
YC
LIC
TEST
RES
ULT
S-
SPEC
IMEN
14C
2
Act
uat
or
Fre
qu
ency
Num
ber
.R
ange
of
Ran
geo
fA
rea
of
Cu
mu
lati
ve
Cu
mu
lati
ve
Dis
pla
cem
ent
(Hz)
of
Ro
tati
on
Mom
ent
aS
ing
leA
rea
of
Num
ber
Rem
arks
Am
pli
tud
eC
ycle
R(r
ad
ian
s(k
ip-i
nch
es)
Hy
stere
sis
Hy
stere
sis
of
Cy
cles
(in
ch
es)
X1
00
0)
too
p*
Loo
ps(k
ip-i
nch
es)
_(k
ip-i
nch
es)
1.4
.11
19
.79
1637
6.8
37
11
0.7
081
.25
11
9.9
616
086
.48
11
17
.18
821
19
.80
1590
6.3
89
12
3.5
783
0.5
.11
6.9
26
60
.4.4
51
12
4.0
284
Insp
ecti
on
for
crac
ks
0.5
16
.83
662
.23
41
24
.26
851
.4.1
11
9.8
015
796
.20
61
30
.46
861
19
.89
1577
6.4
28
13
6.8
987
12
0.1
515
604
.59
51
41
.49
88In
ver
ted
cyc1
e**
11
9.9
515
596
.36
31
47
.85
89In
ver
ted
cycl
e.2
510
20
.21
1562
6.2
42
10
.25
99In
ver
ted
cycl
e1
.6.1
12
3.3
916
537
.93
32
18
.18
100
12
3.5
216
229
.06
92
27
.25
101
.25
12
3.4
416
158
.79
23
6.0
410
21
23
.30
1613
8.7
49
24
4.7
910
310
23
.78
1606
8.5
59
33
0.3
811
31
.8.1
12
6.7
816
701
1.4
8734
1.87
114
.25
12
6.8
616
471
1.2
96
35
3.1
611
51
27
.05
1636
11
.11
33
64
.28
116
102
7.2
016
331
0.7
77
47
2.0
512
6C
rack
det
ecte
d2
.0.1
13
0.4
816
871
4.0
32
48
6.0
812
71
30
.37
1659
13
.87
1·4
99
.95
128
13
0.5
416
431
3.7
22
51
3.6
712
91
30
.60
1623
13
.52
95
27
.20
130
*For
mu
ltip
lecy
cle
s,th
eare
ao
fon
elo
op
isco
mpu
ted
asth
eav
erag
eo
fth
efi
rst
and
last
loo
pare
as.
**L
oad
cycl
ein
vert
ed
from
no
rmal
sin
ew
ave,
Fig
.3
.21
.
ex> "

TABL
E3
.4
SUM
MAR
YO
FC
YC
LIC
TEST
RES
ULT
S-
SPEC
IMEI
i8C
l,
Actu
ato
rFr~quency
Num
ber
Ran
geo
fRan~e
of
Are
ao
fC
um
ula
tiv
eC
um
ula
tiv
eIH
spla
cen
len
t(H
z)
of
Ro
tati
onM
omen
t*
aS
ing
leA
rea
of
Num
ber
Rem
arks
Am
pli
tud
eC
ycl
es(r
ad
Ian
s(k
ip-i
nch
es)
Hy
stere
sis
Hy
stere
sis
of
Cy
cles
(in
ch
es)
X1
00
0)
Loo
p**
Loo
ps(k
ip-i
nch
es)
(kip
-in
ch
es)
--0
.2.1
14
.33
23
1.2
.04
5.0
45
1.2
510
4.2
72
33
.8.0
37
.41
511
.4.1
19
.11
39
9.7
.37
0.7
85
121
8.9
63
94
.9.2
47
1.0
32
13.2
510
9.5
44
22
.2.1
62
2.6
52
23.6
.11
13
.81
49
5.9
1.0
89
3.7
41
241
13
.98
48
8.4
.87
14
.61
225
11
4.1
14
85
.3.8
21
5.4
33
26.2
51
01
4.5
04
84
.0.7
74
13
.17
336
.8.1
12
0.2
25
38
.62
.30
31
5.4
76
371
19
.80
52
3.5
2.2
99
17
.77
538
11
9.9
85
00
.22
.34
22
0.1
17
391
20
.18
49
5.9
2.4
17
22
.53
440
.25
102
0.5
49
0.1
2.3
61
46
.14
450
1.0
.11
26
.03
51
1.6
4.1
88
50
.33
251
12
6.3
65
16
.24
.22
25
4.5
54
521
26
.23
49
0.8
4.1
54
58
.70
853
12
7.2
04
90
.94
.43
16
3.1
39
54.2
510
28
.00
49
9.7
4.2
83
10
5.9
69
641
.2.1
13
2.3
55
21
.36
.13
01
12
.10
651
32
.71
51
3.9
6.3
20
11
8.4
266
.25
53
2.8
25
05
.76
.11
81
49
.01
715
32
.55
48
0.5
6.0
04
17
9.0
376
1.4
.11
38
.94
49
8.2
7.9
23
18
6.9
577
13
9.0
54
78
.67
.62
61
94
.58
78
--
--
--
Hal
fcy
cle
,ab
rup
tcra
ck
form
atio
n*E
xtre
me
valu
es
rep
ort
ed
.**
For
mu
ltip
lecy
cle
s,th
eare
ao
fon
elo
op
isco
mpu
ted
asth
eav
erag
eo
fth
efi
rst
and
last
loo
pare
as.
00
00

TABL
E3
.5
SUM
HARY
OF
CY
CLI
CTE
STR
ESU
LTS
-SP
ECIM
EN8C
2--
f----.
Ac.
tuat
or
Fre
qu
ency
Num
ber
Ran
geo
fR
ange
of
Are
ao
fC
um
ula
tiv
eC
um
ula
tiv
eD
isp
lace
men
t(8
4)
of
Ro
tati
on
Mom
ent*
aS
ing
leA
rea
of
Num
ber
Rem
arks
Am
plit
ud
eC
ycl
es(r
ad
ian
s(k
ip-i
nch
es)
Hy
stere
sis
Hy
stere
sis
of
Cy
cles
(in
ch
es)
X10
00)
Loo
p**
Loo
ps(k
ip-i
nch
es)
(kh
>-i
nch
es)
0.2
.11
4.1
32
52
.2.0
62
.06
21
.25
104
.39
26
8.9
.31
73
.23
211
.4.1
18
.39
43
9.3
.45
43
.68
612
18
.05
45
4.0
.307
3.9
93
13.2
510
8.4
94
53
.8.2
54
6.5
33
23.6
.11
13
.43
56
4.3
1.4
38
7.9
71
241
13
.29
55
6.0
1.2
72
9.2
43
25.2
510
13
.85
55
4.5
1.2
65
21
.89
35.8
.11
19
.00
60
5.2
3.1
12
25
.01
361
19
.12
60
1.5
3.0
39
28
.04
371
18
.80
58
9.6
2.8
86
30
.93
38.2
510
19
.89
59
2.9
2.9
03
59
.96
481
.0.1
12
5.0
26
16
.05
.20
26
5.1
649
12
5.3
26
19
.45
.22
70
.38
50.2
510
25
.75
61
1.1
4.9
56
11
9.9
601
.2.1
13
0.7
86
35
.07
.26
51
27
.261
13
1.1
26
37
.17
.30
31
34
.562
.25
103
2.1
76
50
.27
.06
32
05
.172
Cra
cks
det
ecte
d-b
tm.
ang
le1
.4.1
13
7.2
96
63
.79
.70
42
14
.873
13
6.8
96
59
.19
.64
72
24
.574
.25
23
7.2
16
53
.29
.44
92
43
.476
Cra
cks
dete
cte
d-t
op
ang1e~
*Ext
rem
ev
alu
esre
po
rted
**F
orm
ult
iple
cy
cle
s,th
eare
ao
fon
elo
op
isco
mpu
ted
asth
eav
erag
eo
fth
efi
rst
and
last
loo
pare
as.
co 1.0

TABLE 4.1
COMPARISON OF INITIAL CONNECTION STIFFNESS
PREDICTED BY MODEL II WITH TEST RESULTS
INITIAL SLOPE (k-in./radian)
SPECIMEN TEST MODEL II
INCLUDING EXCLUDINGSHEAR SHEAR
14S1 195000 152871 172020
14S2 295000 328695 409842
14S3 115900 150442 169461
1484 221900 212206 240919
881 66700 62134 72279
882 123400 103170 128971
8S3 104700 63300 73455
884 15300 12513 13032
8S5 76700 52850 59673
886 39500 31748 34547
8S7 48000 51429 58238
90

+
Holes for Attachmentto Load Actuator
Web Angle
W 14 X 38
Hole for Mountingto Support Frame
~Ir
+
91
20'-0'"'4-----1 r--------------------t'l rl----~~
a. W 14 X 38 BEAM-TEST SPECIMEN
W 12 X 58
+ ~ ~ W 8 X 21 [ [;] W 8 X 21 ~
12'-0"• 1'" ....
+
b. W 8 X 21 BEAM TEST SPECIMEN
FIG. 2.1 GENERAL CONFIGURATIONS OF TEST SPECIMENS

N "- - o . I
t- x co ll) X N .- ~
I £3
/4"
Pla
te2
1/4
"2
1/2
"
L,si
zeva
ria
ble
2L
-4X
31
/2X
1/4
X0
'-5
1/2
"
W8
X21
\.
IeL,
size
varl
ab
2"
.., ~ - CXl
" ll) N M " ... ~
10
rrr;
~~~sl
11
1I
II
II
II
II
II I
II
II I
III :I
II I. Ii I,
Not
e:B
olt
sa
reA
32
5-3
/4"¢
FIG
.2.
2D
ET
AIL
SO
FC
ON
NE
CT
ION
FOR
W8
X21
BE
AM
1.0 N

N " o .... , - ..... x w en X "" $
r <t3
/4"
Pla
te2
1/4
"2
1/2
"
L-6
X4
X0
'-8
"/
thic
knes
sva
riabl
e
2L
-4X
31
/2X
0'-
81
12
"
------t
hic
kne
ssva
ria
ble
W1
4X
38
\L
-6X
4X
0'-
8"
thic
kne
ssva
ria
ble
2"
.~ CD ... "...
1'-
0-1
/8"
r5
1/2
"l
,-rI.
3112
';J,
" II
Not
e:B
olt
sa
reA
32
5-3
/4"
{6
FIG
.2.
3D
ET
AIL
SO
FC
ON
NE
CT
ION
FOR
W1
4X
38
BE
AM
~D
W

Bea
mS
up
po
rt\
~1
---
~
Rol
ler
Gu
ide
s
• • •• • •
'!s:"
\ &
FIG
.2
.4S
CH
EM
AT
ICO
FL
OA
DIN
GS
YS
TE
MFO
RT
ES
TB
EA
MS
W -I=:a

FIG. 2.5 BEAM SUPPORTS FOR TEST SPECIMENS
95

96
FIG. 2.6 LATERAL SUPPORT SYSTEM FOR TEST SPECIMENS

FIG. 2.7 LOADING FRAME AND TEST SET-UP
FIG. 2.8 CLOSE-UP OF TEST CONNECTION
97

Dis
plac
emen
tor
Load
Contro~l~,~
with
Dig
ital
ir
i
Rea
dout -}~
XVP
lott
er
MTS
Con
trol
XVP
lott
er(L
oad
vs.
Dis
plac
emen
t}to
Mic
roco
mpu
ter
55-k
ipH
ydra
ulic
Act
uato
rw
ithLV
DTan
dL
oadc
ell
Tes
tSp
ecim
en
Str
ain
Gag
ean
dLV
DTD
ata
toC
ompu
ter
20C
hann
elV
olta
geC
ondi
tion
eran
dA
mpl
ifie
r Mot
orol
a68
00M
icro
com
pute
rw
ith32
Cha
nnel
Ana
log
toD
igit
alC
onve
rsio
n
Dig
ital
Dat
ato
VAX
for
Sto
rage
and
Pro
cess
ing
FIG
.2.
9S
CH
EM
ATI
CO
FT
ES
TIN
GA
ND
RE
CO
RD
ING
EQ
UIP
ME
NT
VAX
11/7
80
t.D co

P/2
""'"..
••
I !illB
FlID
CF
TI
,a.
TY
PIC
AL
PO
SIT
ION
SO
FS
TR
AIN
GA
GE
SF
OR
W1
4X
38
BE
AM
S
PI2
•I lID
CB
mJB
BI
P/2
""'"..
••
IliD
CF
Irn~
Ui.
' I' L.=::
J--=
==.-
E~">
b.T
YP
ICA
LP
OS
ITIO
NS
OF
ST
AIN
GA
GE
SFO
RW
8X
21B
EA
MS
• I•
(ij]C
BI
FIG
.2
.10
LO
CA
TIO
NO
FS
TR
AIN
GA
GE
SO
NT
EN
SIO
NF
LA
NG
EA
NG
LE
S
1.0 1.0

100
Bar Attaching LVOTto Beam Flanges
11 "114-~---~
Jx:1----1i:::::I=:J/LVDT
W 14 X 381======1========1
W 8 X 21
Bar f(~H Attachment
to Stub Column
Aluminum
Position of W 8 X 21with respect to LVOT s
Position of W 14 X 38
with respect to LVOTs
"aJ
aJ "'--"'- ...-('oj
15/16"
3/16 "
Flexible Rod
Threaded Holefor LVOT Probe
11/16
FIG. 2.11 LVDT MOUNTING APPARATUS

yCIe
s(t
yp.)
yCle
s(t
yp
t-
10
sec.
4.se
c.
z W
L...
..le
i~
......
w1
0se
c.4
sec.
u ::5I~
..~
a..~
..C
/) £5
~a:
~
~ « :J t- U «
TIM
E
~
~2
-3...
I~1
2-1
3C
ycle
s(t
yp.)
....
...
2-3
....
...
12
-13
Cyc
les
(typ
.)....
~..
r...
.~
....I
FIG
.2
.12
TY
PIC
AL
TIM
E-D
ISP
LA
CE
ME
NT
HIS
TO
RY
FO
RC
YC
LIC
TE
ST
S
o ....

102
'---+- LVDT DataiWest Connection
IJII
/
\I
Specimen 14S4
LVDT DataEast Connection
ococo
r--..
0¢1.0
I./
0/;
LO j(/)Q).c
,Iuc:
,#.- 0a. co~<::j-
..-c: g(1)0EO<::j-
~I )
0 IN I(V) I
/0<::j-N
01.0r-
oco
o~--~---,.----r---..,.,----r-. --"""--"j"')--",,---~-__,~o 4 8 12 16 20 24 28 32 36 40 .
Rotation, radians (X1000)
FIG. 3.1 COMPARISON OF MOMENT-ROTATION CURVES OBTAINED FROMLVDT MEASUREMENTS WITH CURVE OBTAINED FROM ACTUATOR
DISPLACEMENTS

103
2000
BENDING1500
Ii
c j
11000~~ I
500
.6 .7 .8 .9 1.0
Actuator Displacement. inches
FIG. 3.2 DATA FROM STRAIN GAGE RECORDINGS - SPECIMEN 1482

tItt
A
See Fig. 3.4a
104
FIG. 3.3 ROTATION OF BEAM RELATIVE TOSTUB COLUMN- STATIC LOADING

I~
a. DETAILS OF FLANGE ANGLE DEFORMATION
Section A-A, Fig. 3.3
b. DETAILS OF WEB ANGLE DEFORMATION
FIG. 3.4 DEFORMATION PATIERNS IN BEAM-COLUMNCONNECTION ELEMENTS
105

106
FIG. 3.5 FLANGE' ANGLE FROM SPECIMEN 14S2 AFTER TEST
FIG. 3.6 WEB ANGLES FROM SPECIMEN 14S2 AFTER TEST

107
ooo
~.,....---------------------------------ooo
oooc.....,
coom
cocro
14S2t = ~II
Connection Details
Flange Angles: thickness variablegage on col. = 2~1I
length = 0 1 -8 11
Web Angles: 2L-4x3~x~XOI_8~1I
Ctil 'Q)O.!: 0(,) C'C",Cl.
~c::...;0COQ)tD
Eo~c
ooLJJ
ooo::r
coc(l)
cooC'J
coo.....,
14S1t = 3/8 11
oc~.-----r---"T""'---,...------r---r----.,.....--..,..---.,..----,.----J
4.00 8.00 12.00 16.00 20.00 24.00 28.00 32.00 36.00 40.00Rotation, radians (X1000)
FIG. 3.7 EFFECT OF FLANGE ANGLE THICKNESS ON STATICMOMENT-ROTATION BEHAVIOR - W14X38 BEAM CONNECTION

108
ooCD __----------------------------------,OJ
ccOJOJ
1454t = 3/8"
c
oocco
c
oC\JC'-
1451t = ~"c
oo:::rCD
oCIl •
m O.s:::CD() LJ:C
"
.90.0::c: .
_ C
-co~ :::rEo~o
oo:::r
oo:::rC\J
ooCD
ooOJ
Connection Details
Flange Angles: L-6x4x3/8xO'-8"
Web Angles: thickness variablegage on col. = 2~"
length = 0'-8~"
12.00 16.00 20.00 24.00 28.00 32.00 36.00 40.00Rotation, radians (X1000)
8.004.00O ...--.....,..---r----"'T"'""--.....,..---r----"'T"'""--.....,..---r----"'T"'""--.....,......c .
FIG. 3.8 EFFECT OF WEB ANGLE THICKNESS ON STATICMOMENT-ROTATION BEHAVIOR - W14X38 BEAM CONNECTION

109
C
C
~r-----------------------------------
C
CCDco
C
oCco
1451Lc = 8~"
C
C=rill
1453L =5~"c
C(/l •
Q)C.;;:LD(.)IFc:I
Q..- C:::s::: .
• CccY::Q) =rEo~c
CC::T
C
C::T.::'J
C
CLD
C
CCD
Connection Details
Flange Angles: L-6x4x3/8xO ' -8"
Web Angl es: thi ckness = ~'I
gage on col. = 2~"
length variable
40.0036.0028.00 32.0012.00 16.00 20.00 24.00Rotation, radians (X1000)
Cc-.---I'"---r----,r----!"'---r----r-----,.---r---.....----.-J
FIG. 3.9 EFFECT OF WEB ANGLE LENGTH ON STATIC MOMENT-ROTATIONBEHAVIOR - W14X38 BEAM CONNECTION

110
oo
~,...--------------------------------'"'I
ooo:::r
852t=3/8"
oow(Y)
oo('\I(Y)
(/)0(1) ,
.cO'-'coC('\I",Q.
~o
"":0C:::r(1)('\1
Eo~c
oo('\I
ooCD~
oCco
C
o:::r
Connection Details
Flange Angles: thickness variablegage on col. = 2"length = 01 -6"
Web Angles: 2L-4x3~x~XOI_5~"
!2.no IG.nO 20.00 24.00 28.00 32.00 36.00 40.00Rotation, radians (X1000)
3.no4,00
C"~ ....,..__---,~__.,.-__-,-__....,..__--r ,...-__.,.....__"""""C
FIG. 3.10a EFFECT OF FLANGE ANGLE THICKNESS ON STATICMOMENT-ROTATION BEHAVIOR - W8X21 BEAM CONNECTION
(ANGLE GAGE = 2")

111
C
C
~.,....--------------------------------....C
C::r::r
coc::r
857t = 3/8"
co(\J0'l
(f)C
~cu roc:(\J",a.:::c:c
856t = 5/16"
Co(\J
C
oCD~
C
Cro
C
o::r
Connection Details
Flange Angles: thickness variablegage on col. = 2~"
length = 01 -6"
Web Angles: 2L-4x3~x~XOI-5~"
12.00 16.DO 20.00 24.00 28.00 32.00 35.00 40.00Rotation, radians (X1000)
B.OO4.00
c ...__....,...__.....,. r--__-r-__...,....__....,..__--, ,-__"'j"""__....,.....
c
FIG. 3.1Gb EFFECT OF FLANGE ANGLE THICKNESS ON STATICMOMENT-ROTATION BEHAVIOR - W8X21 BEAM CONNECTION
(ANGLE GAGE = 2%")

112
co
~T---------------------------------
cc::r::r
coc::r
co1O(r)
ooC\J(r)
852g = 211
854g = 4!z1l
Connection Details
Flange Angles: thickness = 3/8 11
gage on col. variablelength = 01 -6 11
Web Angles: 2L-4x3!zx!;q:xO I -5!z1l
O ..----r----r---r----.,.---..,.---....,.----r---,....--..,...--...,...,
coC\J--<
coLJ--<
coOJ
o(/) ,Q)o~OJ()C\JCIa.~o
";0c::::rQ)C\J
Eo~o
oGC\J
o
°::r
4.00 8.00 12.00 16.00 20.00 24.00 28.00 32.00 36.00 40.00Rotation, radians (X1000)
FIG. 3.11a EFFECT OF FLANGE ANGLE GAGE ON STATICMOMENT-ROTATION BEHAVIOR - W8X21 BEAM CONNECTION
(ANGLE THICKNESS = ¥a")

113
~..,....----------------------------------r
(J) 0Q) •.cou COC N
"
a.~O...;- .COQ):=1'
ENo~
Connection Details
Web Angles: 2L-4x3~x~XOI_5~"
Flange Angles: thickness = 5/16"gage on col. variablelength = 01 -6"
co:=1'
ooc..:J
ooCD
ooN
oooN
c0-1·---,..---..,....---r---....,..--.....,---,.....--..,---..,...--....,.---r--I
4.00 8.00 12.00 16.00 20.00 24.Do 28.00 32.00 36.00 40.00Rotation, radians (X1000)
FIG. 3.11b EFFECT OF FLANGE ANGLE GAGE ON STATICMOMENT-ROTATION BEHAVIOR - W8X21 BEAM CONNECTION
(ANGLE THICKNESS - 5/16")

114
oc
~r-~------""'------------------------"'"
oo::T::T
ooC::T
853Lc = 811
ool.O(Y)
o
CN(Y)
851L = 611
C
(J)C
~cU coc: N
"
Q.
~o
-"0C:::T
~No~c
ooN
C
CLJ
ooN
o
oco
co::T
Connection Details
Flange Angles: thickness = 5/16 11
gage on col. = 211
length variable
Web Angles: 2L-4x3~x~XOI_5~1I
12.00 16.00 20.00 24. 00 28.00 32.00 36. 00 40.00Rotation, radians (X1000)
8.00
oc-$----r"---r---""I----r'---r----"'T"'""------r----~--..,...---.J
4.00
FIG. 3.12 EFFECT OF FLANGE ANGLE LENGTH ON STATICMOMENT-ROTATION BEHAVIOR - W8X21 BEAM CONNECTION

115
cc
~I---------------------------------
c
cOJOJ
C
GCOJ
G
o0J
'"
l4SlW14x38
o
°::rill
en 0Q) ,.r:,O() CDC u;
"
a.::20COQ)CGE::1'o:2:
0
oo::r
8S5W8X2l
oo0J(Y)
oo::r0J
o
oill
ooco
Connection Details
Flange Angles: thickness = 3/8"gage on col. = 2~"
length = 01 -8"
Web Angles: 2L-4x3~x~
B.no4,nocc ....--..,..---r----"'i"""--..,..---r----"'i"""--....,...--......,~--..,----.J
FIG. 3.13 COMPARISON OF STATIC MOMENT-ROTATION BEHAVIOROF W14X38 and W8X21 BEAM CONNECTIONS

116
a. FRONT VIEW
b. REAR VIEW
FIG. 3.14 FLANGE ANGLE FROM SPECIMEN 14C1 AFTER CYCLIC TEST

a. FLANGE ANGLE - END VIEW
b. WEB ANGLES - END VIEW
FIG.3.15 FLANGE AND WEB ANGLES FROM SPECIMEN 14C1AFTER CYCLIC TEST.
117

118
Rotation, Radians (X1000)
Connection Details
1510
Web Angles: 2L-4x3~x~XOI_8~"
Flange Angles: thickness = 3/8"gage on col. :::: 2~"
length = 01 -8 11
-600
-500
-300
-400
-200
~ r700
.¥ L 600
400
-15
:IG. 3.16 STABLE HYSTERESIS LOOPS FOR SPECIMEN 14C1

119
-800 Web Angles: 2L-4x3~x!aXOI_8~"
Flange Angles: thickness = ~"
-700 gage on col. = 2~'1
length = 0 1 -8"
-15
If) 900Q.J..c(.)cI 800Q.
.::s:.
+"
700c<DE0~
I- 600I!i
~ 500
-300
-400
-500
-600 Connection Details
15
FIG. 3.17 STABLE HYSTERESIS LOOPS FOR SPECIMEN 14C2

Ul(j)..c
300(,)
CI
Cl...:.t.
.....C(j)
E0~
20
-200Connection Details
Flange Angles: thickness = 5/16"gage on col. = 2"length = 0'-6"
-300 l~eb Angles: 2L-4x3~x~xO'-5~"
FIG. 3.18 STABLE HYSTERESIS LOOPS FOR SPECIMEN 8C1
120

-200
(/)
<D;;::.
300uc.,Q.
~
...:-c<DE0~
-300
121
Connection Details
Flange Angles: thickness = 3/811
gage on col. = 211
length = 0'-6"
Web Angles: 2L-4x3~x~XOI_5~1I
FIG. 3.19 STABLE HYSTERESIS LOOPS FOR SPECIMEN 8C2

122
MOMENT
3
I/
//
//
/
//0,4
----.,~-+---+----- ROTATION
REGION III
REGION II
FIG. 3.20 TYPICAL MOMENT-ROTATION HYSTERESIS LOOPCYCLIC TESTS
ACTUATOR
DISPLACEMENT
° ..... ---- 4-- TIME
3
FIG. 3.21 TYPICAL TIME-ACTUATOR DISPLACEMENT CYCLE

rTF
A0
--- I I
I
)I
l-..
lJ.1
JI I
(.
I
rI
~I
\
I'(
'-
BFA
LI I
a.R
EG
ION
IC
ON
FIG
UR
AT
ION
b.R
EG
ION
IIC
ON
FIG
UR
AT
ION
c.R
EG
ION
III
CO
NF
IGU
RA
TIO
N,
FIG
.3.
22C
ON
FIG
UR
AT
ION
SO
FC
ON
NE
CT
ION
DU
RIN
GO
NE
-HA
LF
CY
CL
E
--'
N W

Vertical Leq of TensionFlange Angle
II
<tI
I
124
Outstanding Leg of Web Angle
/1-/----,}-!.
•
•
,,----i-- WSecti on Beam
Flange Angle
Center of Rotation
FIG.4.1a ASSUMED BEHAVIOR OF BEAM TO COLUMN CONNECTION
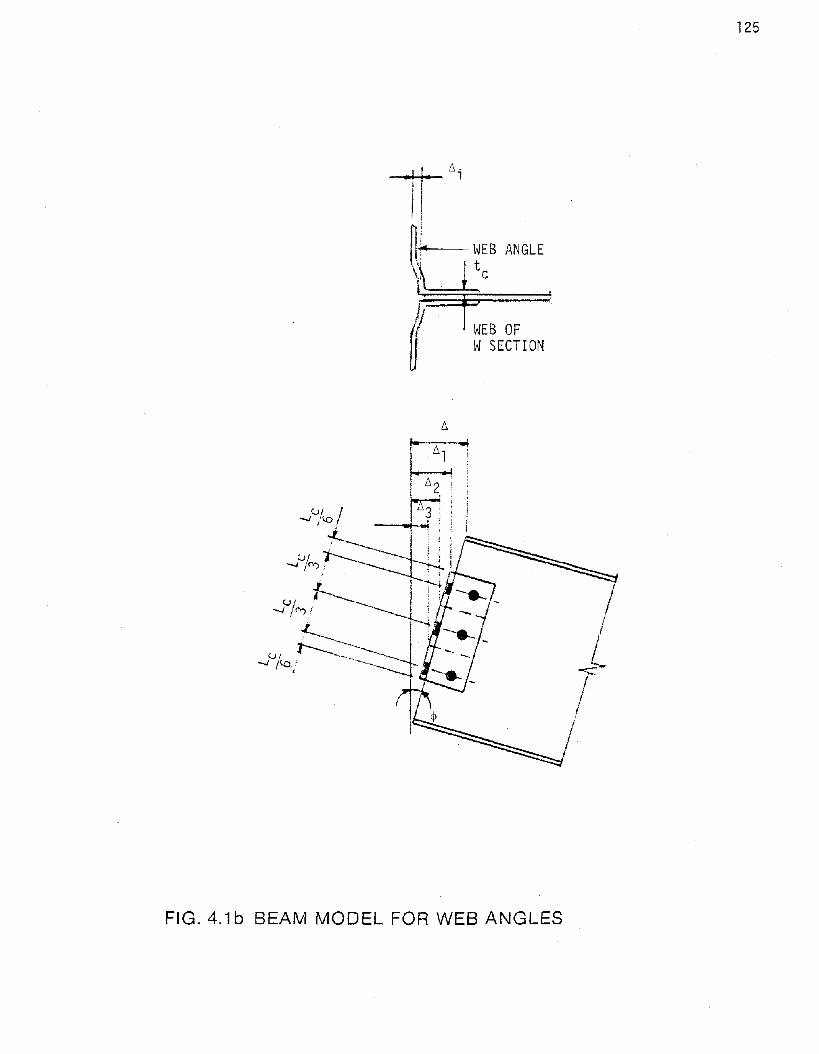
lI"i~~WEB ANGLE
\i . I t c\kf i
II~EB OF~ WSECTION
FIG. 4.1 b BEAM MODEL FOR WEB ANGLES
/~L/
i
125

J_--
FIG. 4.2a IDEALIZED BEAM MODEL FOR FLANGE ANGLE
126
1\"\.
\'\.
\
\
\F.
1
FIG. 4.2b IDEALIZED BEAM MODEL FOR WEB ANGLES
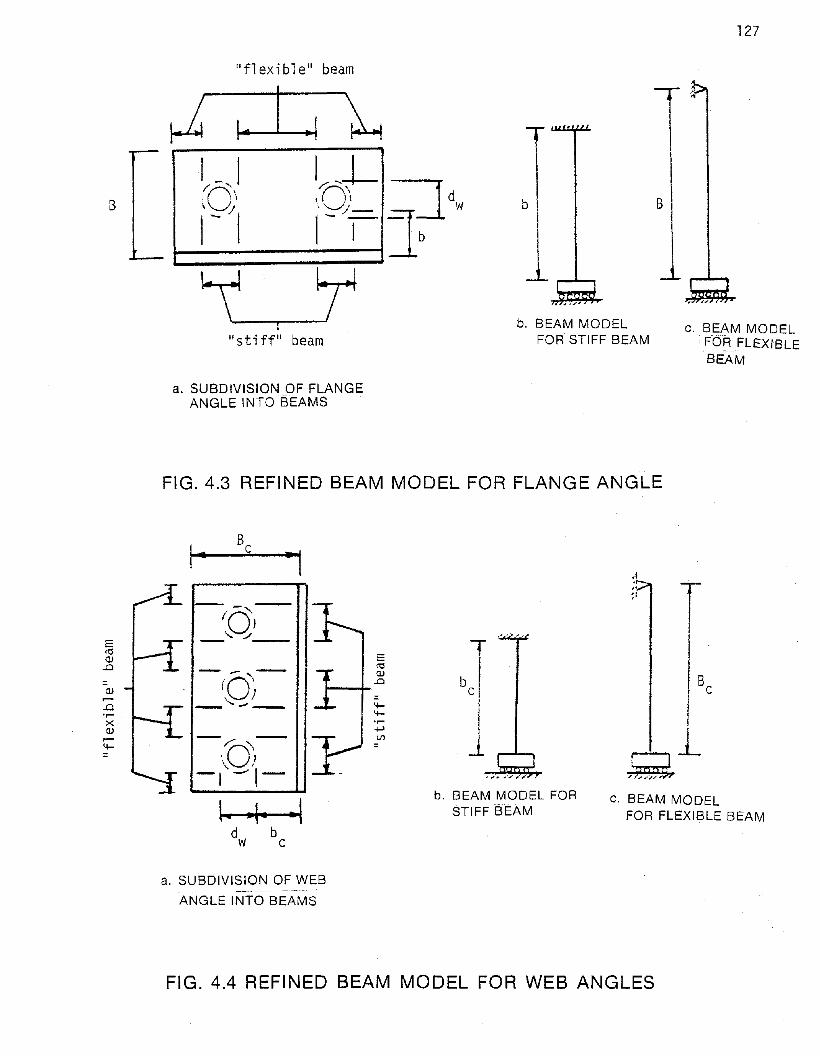
127
B
"flexible" beam
."stiff" beam
a. SUBDIVISION OF FLANGEANGLE INTO BEAMS
1b. BEAM MODEL
FOR--sTIFF BEAM
l'I
B
1c. BEAM MODEL
F-O~ FLEXIBLEBEAM
FIG. 4.3 REFINED BEAM MODEL FOR FLANGE ANGLE
E<0OJ
..Cl
-OJr-..Cl.r-><OJr-4-::
~I
-/01-
-'/_-
-b~--1-1-
~d bw c
b. BEAM MODEL FORSTIFF BEAM
c. BEAM MODELFOR FLEXIBLE BEAM
a. SUBDIVISION OF WEB-~-~_._----
ANGLE INTO BEAMS
FIG. 4.4 REFINED BEAM MODEL FOR WEB ANGLES

128
a. BEAM CROSS-SECTION
1
b. ASSUMED LINEAR STRAINDISTRIBUTION - s
1 Esth - .02E
c. STRESSDISTRIBUTION -'0
d. ASSUMED STRESS (0 )vs.STRAIN (f: ) MODEL
FIG. 4.5 ASSUMED MATERIAL BEHAVIOR FOR MODEL III
9
BOLT~, ~""
Lu=v=o(fixed boundary)
A
I u = ~.----.~
.F
y, vI
x,u
L = thickness of planestress model
I. y .1A
FIG. 4.6 MODEL IV - PLANE STRESS FINITE ELEMENT MODEL

129
Load. F. kips
---
~l
0.240.200.16O. .120.080.04.-+t----.........-------.------r-----,-------,--------i
co: 00Displacement, t:, , inches
FIG. 4.7 LOAD VERSUS DISPLACEMENT CURVE FOR FLANGE ANGLE FORMODEL IV.
~A,E 9
FIG. 4.8 MODEL V - DUAL SPRING MODEL

130
A
I IL--_--l
--_....._l----l---iCompression FlangeAngle
0 i
Web jI,ngle0 L-
a +-
~-- Not Model ed
-
...---- Beam
Tension Flanae________ Angle " 1
----- ine -------------f~-I--1.8i I
-- Not Model ed , , 1
t---l_-:"_
I II IW
~Bolt L....-- - -
i--.,~
J
,
II j
Ii
- -0
- -0 -------- -0
II IIII
T__ .JI I ,
W~
\.,
Not To Scale
y
FIG. 4.9 HALF MODEL OF BEAM TO COLUMN CONNECTION
MODEL VI

131
Moment, MSecond value of Pi = Pi2
First value of Pi = Pil
Rotation, cP
FIG. 4.10 MOMENT-ROTATION CURVES FOR TWO VALUES OF THEPARAMETER Pi
Beam shear, F, kips
Mode 1 II It= 1/2") L = 8") \= 9 = 2.5"
Model I II"'-t:: 3/8", L = 8", \:: 9 = 2.5"
Model I IIt =1/4"L/3=3" \ =g=2.625",/ c 'c 'cc,
Model IV
~""
co
:::r-j(,J I
1 JI{,~ ·tu..J --.---<. I
II,,\Iij
/'
O. 1 0.2 n Jv .. .:.I" ~u . .-J
Relative Displacement, t,
FIG. 4.11 RELATIONSHIP ~ETWEEN BEAM SHEAR, F, AND RELATIVE ENDDISPLACEMENT, 6. ,FOR FLANGE AND WEB ANGLES

132
,oo:::t'-r------------------------------....-;
ooC'.J.--'.
000..-;
(/)(j).co 'cO';&'O~CXJ-
I2......c(j)EO /°02<..0
30.20.10·~ .5.
Model IV, neglectingweb ang1es-1
1r__-:;::::::""---
,.-r----,.----,.----,----..,...---.......,----,..~c .O.
,cCN
,CC:::::r'
Rotation, ~ Radians (X1000)
FIG. 4.12 COMPARISON OF MODEL III AND MODEL IV WITH TEST RESULTSFOR SPECIMEN 14S2
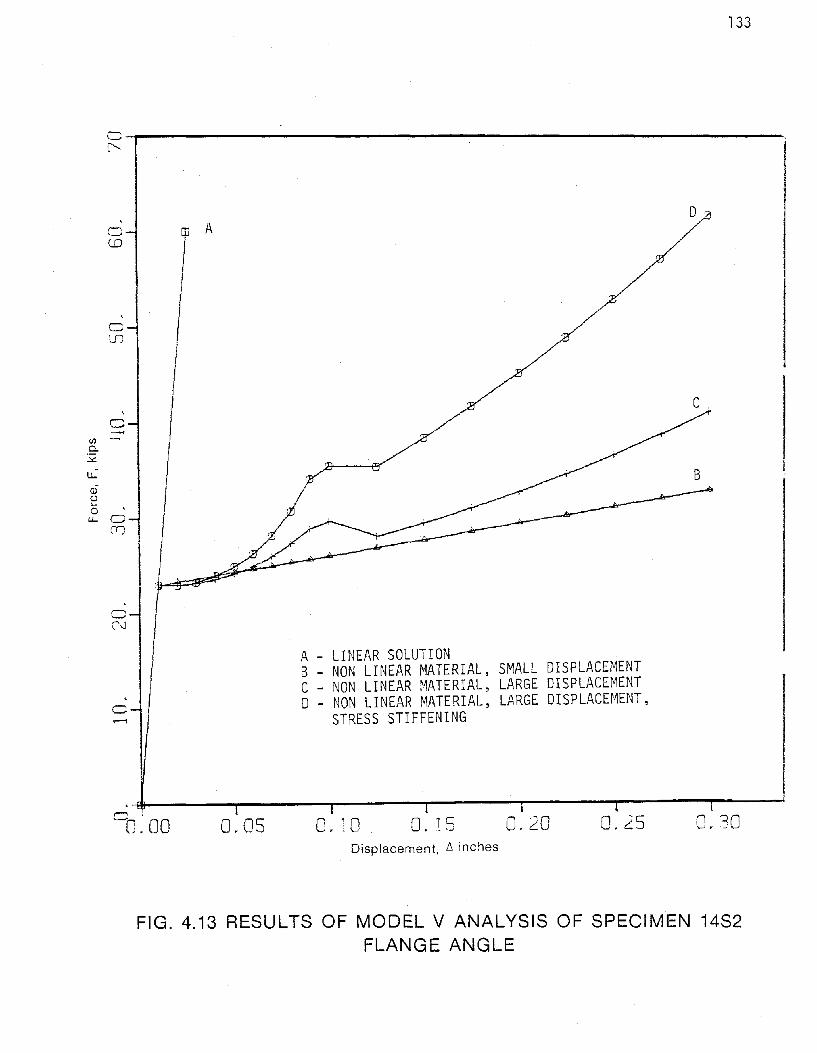
133
D .~
C<.0
,ClJ)
C,C
Ul :::ra..~
u..
<D()>- ,0
u.. C(T)
A - LINEAR SOLUTIONB - NON LINEAR MATERIAL, SMALL DISPLACEMENTC - NON LINEAR MATERIAL, LARGE DISPLACEMENTo - NON LINEAR MATERIAL, LARGE DISPLACEMENT,
STRESS STIFFENING
0.300.25
,-4- --.. ...- --r- --,_----r------r----lI
cO~OO 0.05 0.10 0.15 0.20Displacement. !::. inches
FIG. 4.13 RESULTS OF MODEL V ANALYSIS OF SPECIMEN 14S2FLANGE ANGLE

134
Model V
I I
Web Bending
I Axi al'
FIG. 4.14 OVERALL CONNECTION MODEL USING MODEL V FOR ANALYSISBY ANSYS

Moment, M., Kip-inches
,ooN
,ooCD
,oo::r
~MOd~l V neglecting~eb angles
Test,specimen 1452
135
40.032.024.016.08.0,-¥-------,----...-----,-------r------,---!
°0.0Rotation, ¢' radians (X1000)
FIG. 4.15 COMPARISON OF TEST RESULTS WITH MOMENT-ROTATIONBEHAVIOR PREDICTED BY MODEL V.
Moment, M., Kip-inches
ooN
,o
°CD
oo:::r
Model VI
.-----...-~ -1II
Test,specimen 1452
40.032.024.016.08.0,.--f-------,-----,..------.-------,.------.----
°0.0Rotation, cP, radians (X1000)
FIG. 4.16 COMPARISON OF TEST RESULTS WITH MOMENT-ROTATIONBEHAVIOR PREDICTED BY MODEL VI

136
oo
~1""'-----------------------------------
ooCDm
ooom
ooNI'-
oo~
ill
Predicted
Test
m O
(J)o~LDglJ1"
0..~O
-" 0em(J)~
Eo~o
oo.~
cor"'\l(TJ
ooCJ
o
oCD
Connection Details
Flange Angles: L-6x4x3/8xO f -8"gage on col. = 2V'
Web Angles: 2L-4x3~x~XO'_8~"
oc-+---....,.---.,...--...,..---,----..,..---r----...,...----r---"I---....,....J4.00 8.00 12.00 16.00 20.00 24.00 28.00 32.00 36.00 40.00
Rotation, radians (X1000)
FIG. 4.17a COMPARISON OF MODEL VII WITH' TEST RESULTS FORSPECIMEN 1481

137
co
~I-----------------------------------cC1o~
cooo
cooOl
coG.co
Predicted Test
cCIl •Q) 0.coC) ["C",a.~c:....- 0C 0Q) ill
Eo~o
ooLn
c
oo::r
coo('ll
c
ooN
coo
Connection Details
Flange Angles: L-6x4x!:2xO ' -8"gage on col. = 2!:2"
Web Angles: 2L-4x3!:2x~xO'_8!:2"
cc+---....,.---~--....,..----r----r----r----..,...--.....,----r----.,...J
4.00 8.00 12.00 16.00 20.00 24.00 28.00 32.00 36.00 40.00Rotation, radians (X1000)
FIG. 4.17b COMPARISON OF MODEL VII WITH TEST RESULTS FORSPECIMEN 14S2
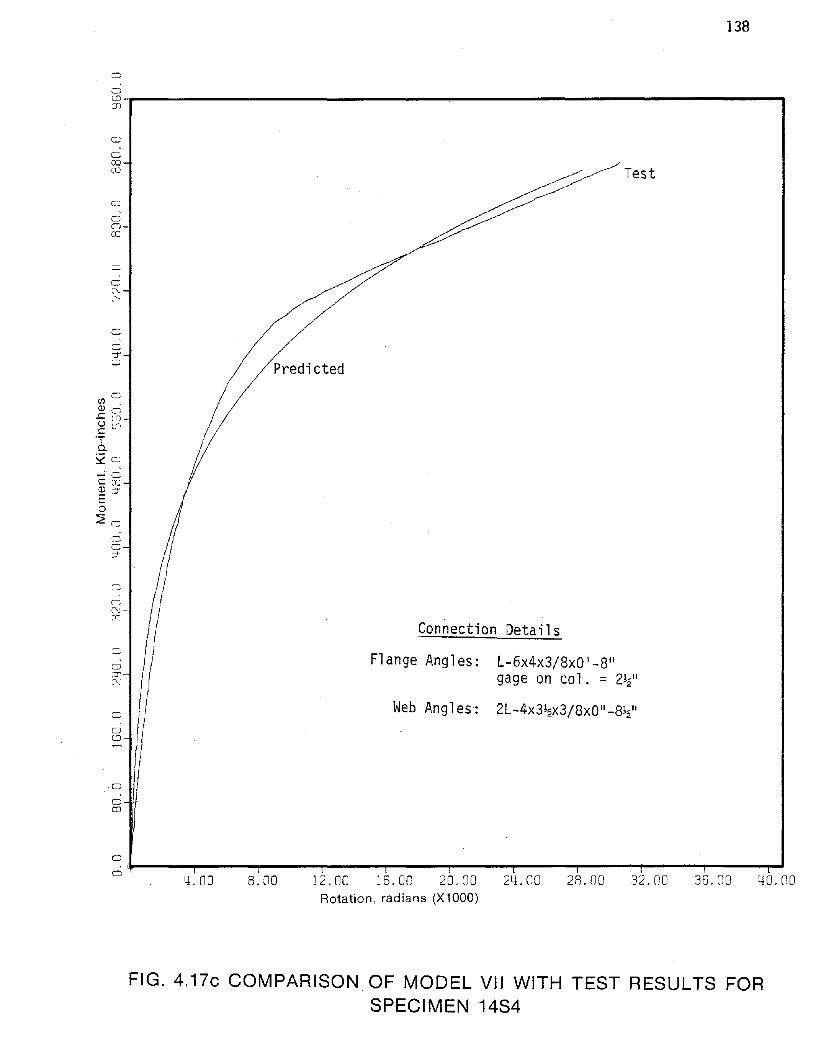
138
c
~------------------------------------.,m
ccOJCD Test
C
CoOJ
oc-:rl.O
(/)0
Q)e~lD
~LI:"
Q.
::::C:::C
~cCeoQ)::rEo~o
oo::r
oc('J
rr
oc::r0C
Connection Details
Flange Angles: L-6x4x3/8xO ' -8"gage on col. = 2~"
Web Angles: 2L-4x3~x3/8xOI-8~"
,0
cco
12.00 16.00 20.00 24,00 2R.OO 32.00
Rotation, radians (X1000)
8.(104,[]0C+---~----r---.,..----r----""'T'---r---""'----'---'T'""----r-C '
FIG. 4.17c COMPARISON, OF MODEL VII WITH TEST RESULTS FORSPECIMEN 14S4

139
c
;55 __-----------------------------------,:::r
cc:::r.-:T
ooG:::r
ooLO(Y)
PredictedTest
o
o\\J(Y)
o(/l •
(l) 0.>= OJ(J \\Jc
"T0-
:;z~"';0c :::r(l)\\J
Eo20
oo\\J
coLO
oo\\J
coOJ
co:::r
Connection Details
Flange Angles: L-6x~x5/l6xOI-611gage on col. = 2"
Web Angles: 2L-4x3~x!;rXOI-5~1I
12.00 16.00 20.00 24.00 28.00 32.00 36.00 40.00Rotation, radians (X1000)
8.004.00c ..--.....,.---..,....--.....,.---.,.....---r----,.--_-,-__....., -r-__-,........o
FIG. 4.17d COMPARISON OF MODEL VII WITH TEST RESULTS FORSPECIMEN 8S1

140
c
cClJ_._-----------------------------------...,::r
c
c.~
::r
Predicted
coc::r Test
c
oc(\J
coCJ Connection Details
co(\J
Fl ange Angl es: L-6x 3~x3/8xO I -6"gage on col. = 211
Web Angles: 2L-4x3~x~XOI-5~1I
c
cCD
co::r
LIO.no36,0032,0028.0024,00J2,[][] 16,00 20.nORotation, radians (X1000)
8,no4.no
C
-&-----.--------_--....,..---..,..---~---"'T'""--__,---...,..---,....lc·
FIG. 4.17e COMPARISON OF MODEL VII WITH TEST RESULTS FORSPECIMEN 8S2

141
c
i55 __-----------------------------------...,::T
cC.::T::T
coc::r Test
cCL:J(Y) Predicted
cc(\J(Y)
ccOJ
(/) (\J
CD.c()c c
" .0. C
~ F.;-cQ)
E co c~ 0
(\J
col:J
co(\J
coOJ
Connection Details
Flange Angles: L-6x3~x5/l6xO'-8"
gage on col. = 2"
Web Angles: 2L-4x3~x~XO'-5~"
co::T
12.00 16.00 20.00 24.00 28.00 32,00 36.00 40.00Rotation, radians (X1000)
8,004,00c ..--.....,.---.,....----,.---or-----,----,----...,..----,----r-__-r...Jc
FIG.4.17f COMPARISON OF MODEL VII WITH TEST RESULTS FORSPECIMEN 8S3

142
o
&5,... ..,::J'
o
o::f::J'
Connection Details
o
oo.::f
o
ol:J(Y)
oo-:'\)(Y;
or.n .(1)0.em(..)\\1C1a.~c:~O
C::J'(1)N
Eo~O
Co\\J
oo\\J
ccm
oo::J'
Flange Angles:
Web Angles:
Test
Predicted
L-6x4x3/8xO'-6"gage on col. = 2~"
2L-4x3~x\xO I -5V'
co~.---.,...--...,..---,----r"'---r_--.,..--.....,---.,_--...,.---,....
4.00 8.00 12.00 16.00 20.00 24.00 28.00 32.00 36.00 40.00Rotation, radians (X1000)
FIG. 4. 179 COMPARISON OF MODEL VII WITH TEST RESULTS FORSPECIMEN 8S7

143
0 __-------------------------- -,o.:1':::1'
ooo::r
ooill(11
o
oN(11
Predicted
Test
ooOJ
(/)\\1<D
.J::(.)
.:: 0I •
Q.o
~~-C<DEoo .~g
\\I
coill
coC'J
ooOJ
c
o::r
Connection Details
Flange Angles: L-6x4x3/8xO'-8 1l
gage on col. = 2~1I
Web Angles: 2L-4x3~x~xO'-5~1I
12.00 15.00 20.00 24.00 28.00 32.00 lC.OO 40.00Rotation. radians (X1000)
8.00'-1. 00
0-4------,.--_..,...__....,.. ,--__"""'T"" r--__..,-__...., I"__-,.....c
FIG. 4.17h COMPARISON OF MODEL VII WITH TEST RESULTS FORSPECIMEN 8S5

144
o
oaJ;- .;..., ....,
::r
o
c::r::r
ooo::r
o
oL:Jrr:
co~
rr:
en O<D •.cOUffiC NIQ.
~C
"";0C::r<DC'\!Eo~c
Predicted
co.'.!
c
CL:J
co"\I
c
ffi
oo::r
Connection Details
Flange Angles: L-6x4x5/l6xO ' -6"gage on col. = 2!:2"
Web Angles: 2L-4x3!:2x~xO'-5!:2"
40.0036.0032.0028.00]2.00 16.00 20.00 24.00Rotation, radians (X1000)
8.00
oc-$.---,..-----r---r---""T---r-----r------,r-----r-----r---.,..J
4.00
FIG. 4.17i COMPARISON OF MODEL VII WITH TEST RESULTS FORSPECIMEN 8S6

- ---
M
_t
---
145
ConstantStrengthEnvel ope
FIG. 4.18 TRI-L1NEARIZED MOMENT-ROTATION HYSTERESIS LOOP

146
MB
Tri-Linear Prediction
FIG. 4.19 COMPARISON OF TRI-L1NEARIZED HYSTERESIS LOOP WITHSPECIMEN 14C2 TEST RESULTS