momentum and value: some lessons from recent experience · pdf file ·...
TRANSCRIPT

MOMENTUM AND VALUE: SOME
LESSONS FROM RECENT EXPERIENCE
Narasimhan Jegadeesh
Goizueta Business School, Emory University
Outline
• Evidence – 1964 to 2011
• Time varying market risk
• Does hedging market risk improve performance?
• Market conditions and profitability
• When do momentum and value signals work?
• Some suggestions

Evidence
• Momentum strategy
based on past 2 to 12
months
• Value strategy based on
Book to market ratio
• Momentum much weaker
in the new millennium
• Value weaker more
recently
Momentum Value
1964-
2011 Average 8.56 4.52
Std. Dev. 15.01 10.17
Sharpe 0.57 0.44
2001-
2007 Average 2.42 9.96
Std. Dev. 20.05 10.18
Sharpe 0.12 0.98
2007-
2011 Average -1.94 -3.75
Std. Dev. 22.13 10.01
Sharpe -0.09 -0.37
Based on data from Ken French website

Issues
• Are these signals still alive?
• Yes, but use them selectively
• Time varying market risk
• Does hedging market risk improve performance?
• When do momentum and value signals work?
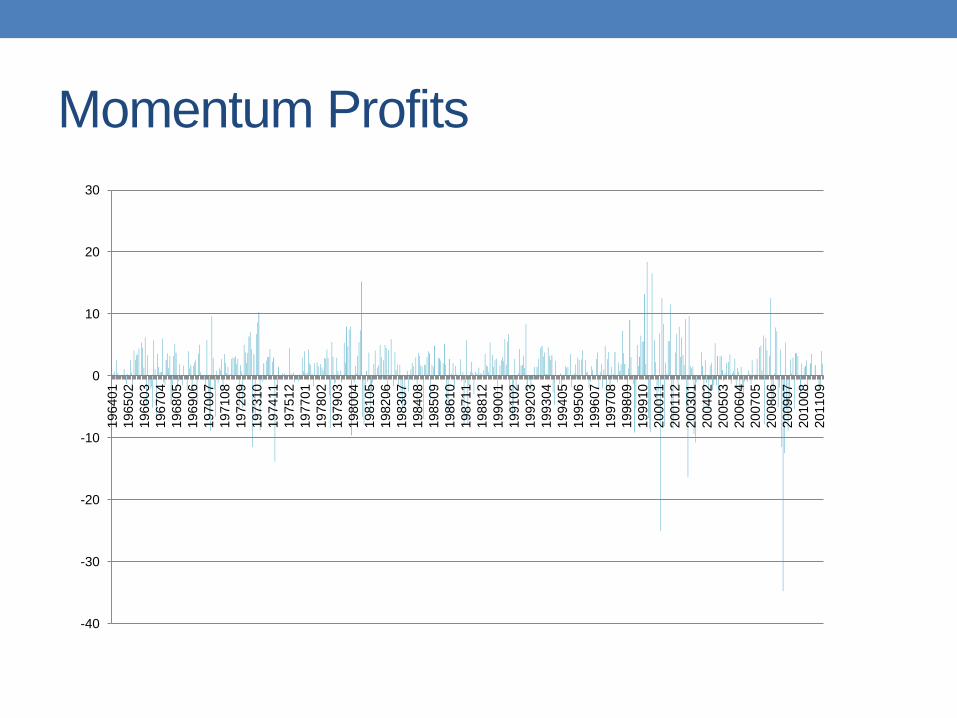
Momentum Profits
-40
-30
-20
-10
0
10
20
30
196401
196502
196603
196704
196805
196906
197007
197108
197209
197310
197411
197512
197701
197802
197903
198004
198105
198206
198307
198408
198509
198610
198711
198812
199001
199102
199203
199304
199405
199506
199607
199708
199809
199910
200011
200112
200301
200402
200503
200604
200705
200806
200907
201008
201109
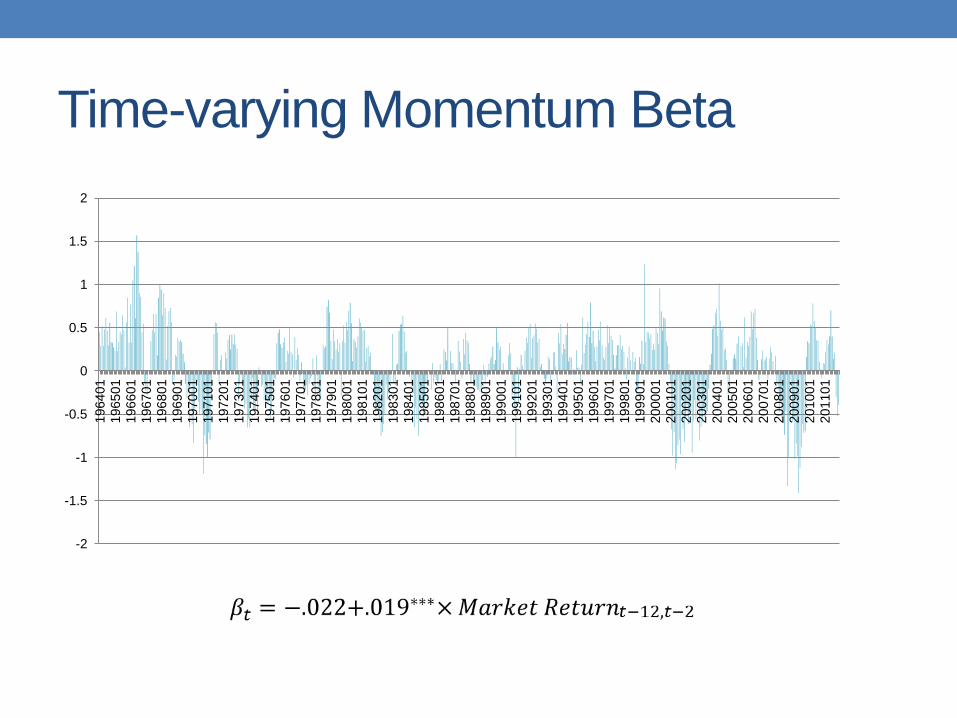
Time-varying Momentum Beta
-2
-1.5
-1
-0.5
0
0.5
1
1.5
2
196401
196501
196601
196701
196801
196901
197001
197101
197201
197301
197401
197501
197601
197701
197801
197901
198001
198101
198201
198301
198401
198501
198601
198701
198801
198901
199001
199101
199201
199301
199401
199501
199601
199701
199801
199901
200001
200101
200201
200301
200401
200501
200601
200701
200801
200901
201001
201101

Time-varying Value Beta
-1.5
-1
-0.5
0
0.5
1
196401
196501
196601
196701
196801
196901
197001
197101
197201
197301
197401
197501
197601
197701
197801
197901
198001
198101
198201
198301
198401
198501
198601
198701
198801
198901
199001
199101
199201
199301
199401
199501
199601
199701
199801
199901
200001
200101
200201
200301
200401
200501
200601
200701
200801
200901
201001
201101

Hedged Returns
Momentum Value
Unhedged Hedged Unhedged Hedged
1964-2011 Average 8.56 8.04 4.52 5.34
Std. Dev 15.01 12.44 10.17 8.91
Sharpe 0.57 0.65 0.44 0.60
2000-2007 Average 2.42 -4.23 9.96 7.77
Std. Dev 20.05 15.41 10.18 8.49
Sharpe 0.12 -0.27 0.98 0.91
2007-2011 Average -1.94 -1.20 -3.75 -4.79
Std. Dev 22.13 16.64 10.01 9.45
Sharpe -0.09 -0.07 -0.37 -0.51

Some Observations
• The volatility of market risk hedged portfolio is about 15%
smaller than that of unhedged portfolio
• Momentum returns in this millennium is small for hedged
portfolio as well
• Does momentum still work?

Momentum Profits
-40
-30
-20
-10
0
10
20
30
196401
196502
196603
196704
196805
196906
197007
197108
197209
197310
197411
197512
197701
197802
197903
198004
198105
198206
198307
198408
198509
198610
198711
198812
199001
199102
199203
199304
199405
199506
199607
199708
199809
199910
200011
200112
200301
200402
200503
200604
200705
200806
200907
201008
201109

Market Conditions and Profitability 1) Normal vs. Bear market
Bear Market Dummy = 1 if previous 3-year market excess return <0; and =0 otherwise;
2) Lagged market volatility
Market Volatility Dummy = 1 if last month volatility in the top decile; and =0 otherwise;
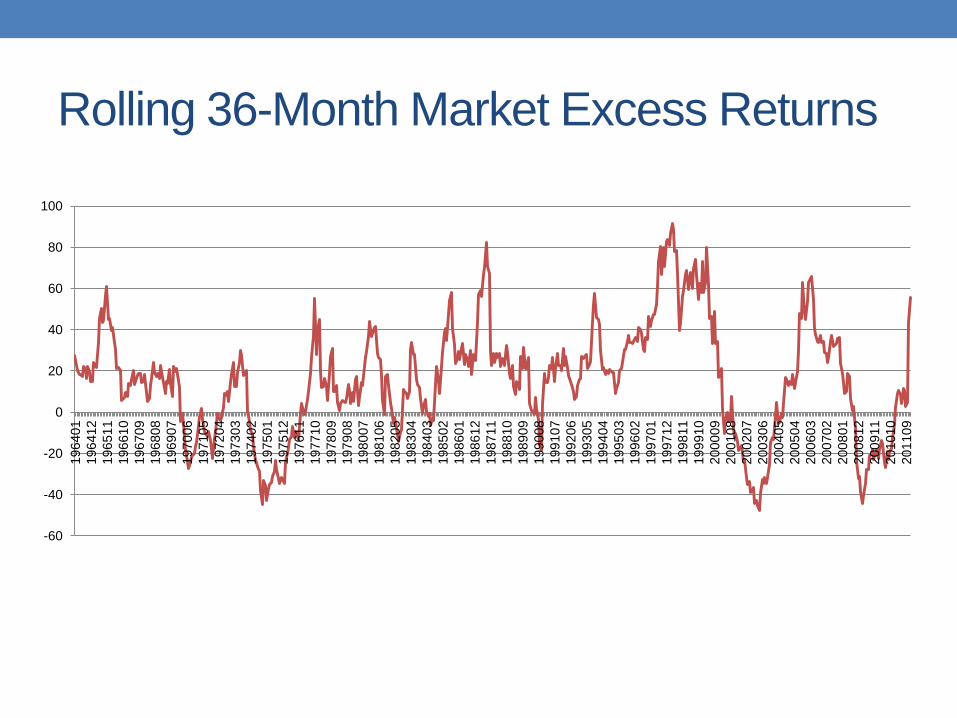
Rolling 36-Month Market Excess Returns
-60
-40
-20
0
20
40
60
80
100
196401
196412
196511
196610
196709
196808
196907
197006
197105
197204
197303
197402
197501
197512
197611
197710
197809
197908
198007
198106
198205
198304
198403
198502
198601
198612
198711
198810
198909
199008
199107
199206
199305
199404
199503
199602
199701
199712
199811
199910
200009
200108
200207
200306
200405
200504
200603
200702
200801
200812
200911
201010
201109
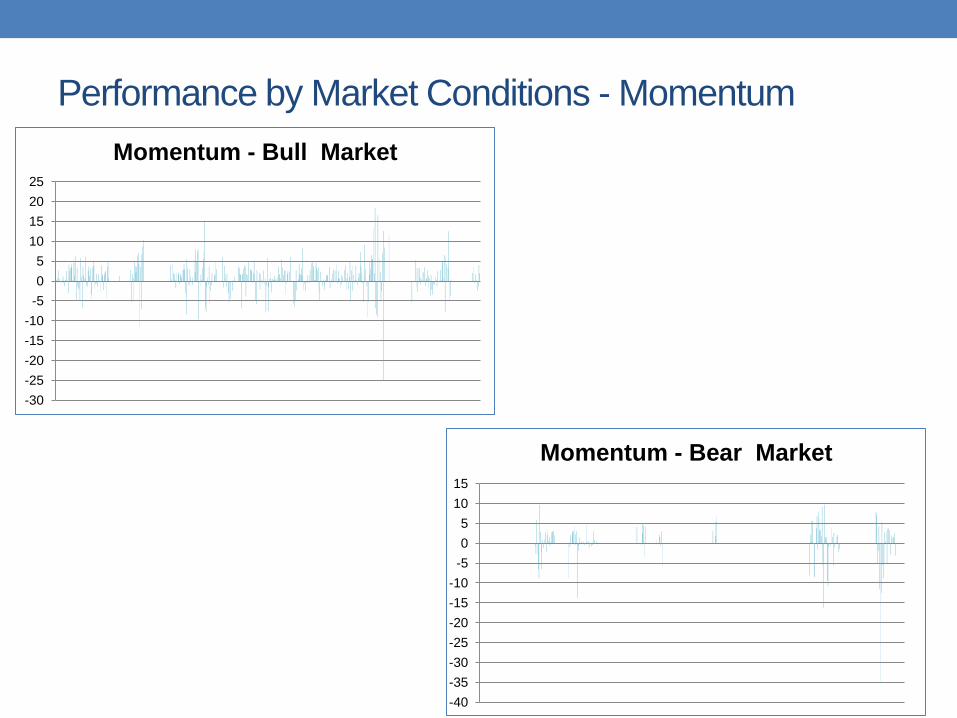
Performance by Market Conditions - Momentum
-30
-25
-20
-15
-10
-5
0
5
10
15
20
25
Momentum - Bull Market
-40
-35
-30
-25
-20
-15
-10
-5
0
5
10
15
Momentum - Bear Market
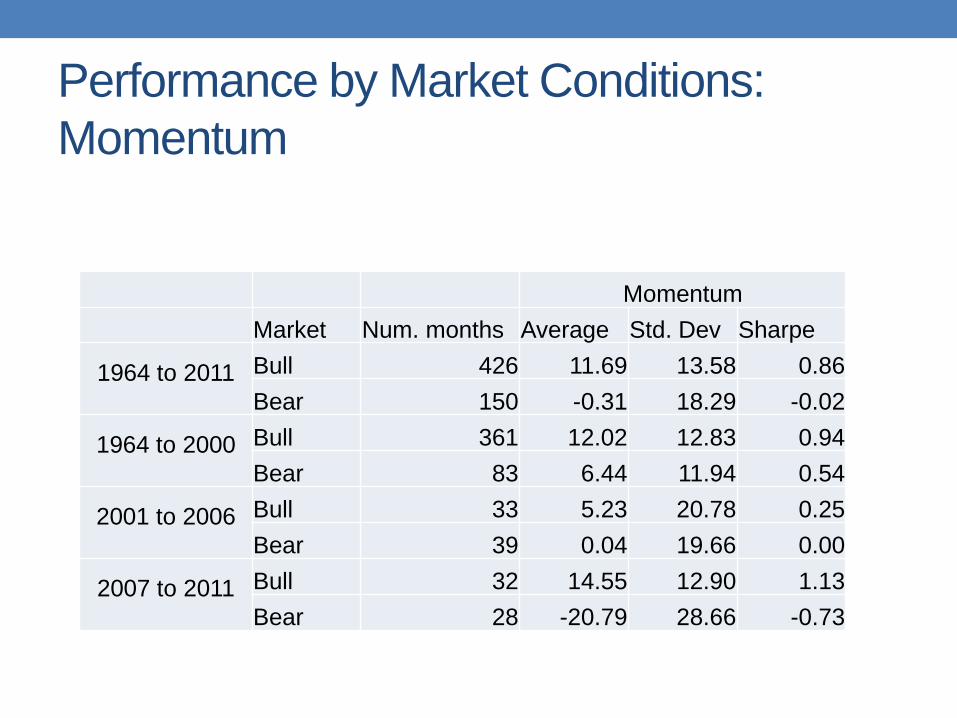
Performance by Market Conditions:
Momentum
Momentum
Market Num. months Average Std. Dev Sharpe
1964 to 2011
Bull 426 11.69 13.58 0.86
Bear 150 -0.31 18.29 -0.02
1964 to 2000
Bull 361 12.02 12.83 0.94
Bear 83 6.44 11.94 0.54
2001 to 2006
Bull 33 5.23 20.78 0.25
Bear 39 0.04 19.66 0.00
2007 to 2011
Bull 32 14.55 12.90 1.13
Bear 28 -20.79 28.66 -0.73

Observations
• Underweight momentum signal in bear markets
• Correlation between momentum and value is -.16
• Can Value signals help in bear markets?

Performance by Market Conditions - Value
-15
-10
-5
0
5
10
15
20
196401
196510
196707
196904
197101
197210
197407
197604
197801
197910
198107
198304
198501
198610
198807
199004
199201
199310
199507
199704
199901
200010
200207
200404
200601
200710
200907
201104
Value - Bull market
-15
-10
-5
0
5
10
196401
196510
196707
196904
197101
197210
197407
197604
197801
197910
198107
198304
198501
198610
198807
199004
199201
199310
199507
199704
199901
200010
200207
200404
200601
200710
200907
201104
Value - Bear market
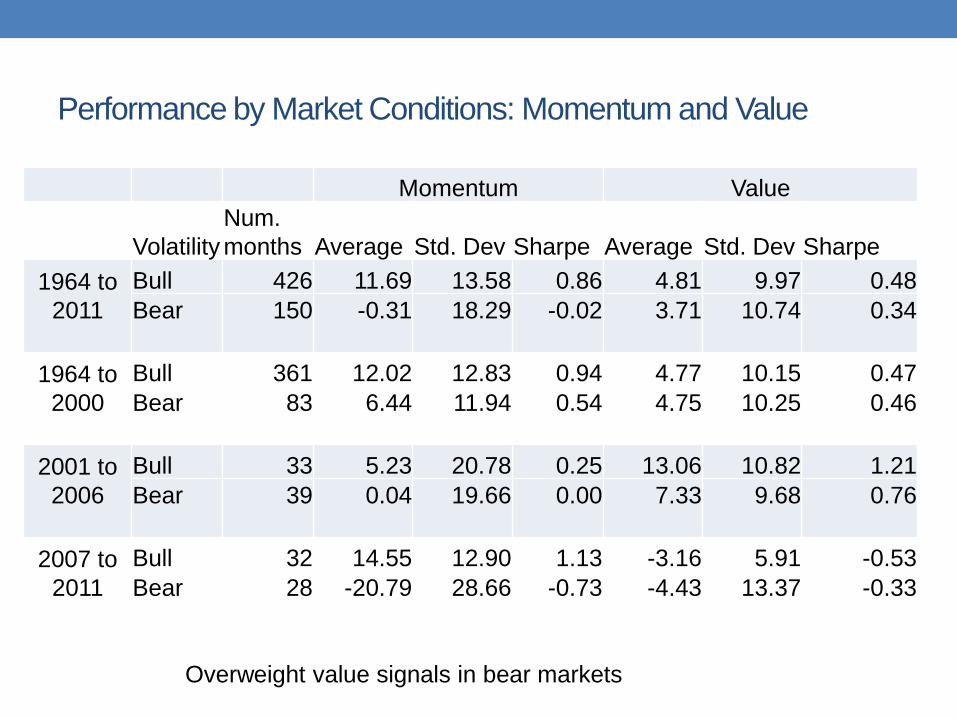
Performance by Market Conditions: Momentum and Value
Momentum Value
Volatility
Num.
months Average Std. Dev Sharpe Average Std. Dev Sharpe
1964 to
2011
Bull 426 11.69 13.58 0.86 4.81 9.97 0.48
Bear
150
-0.31
18.29
-0.02
3.71
10.74
0.34
1964 to
2000
Bull 361 12.02 12.83 0.94 4.77 10.15 0.47
Bear
83
6.44
11.94
0.54
4.75
10.25
0.46
2001 to
2006
Bull 33 5.23 20.78 0.25 13.06 10.82 1.21
Bear
39
0.04
19.66
0.00
7.33
9.68
0.76
2007 to
2011
Bull 32 14.55 12.90 1.13 -3.16 5.91 -0.53
Bear
28
-20.79
28.66
-0.73
-4.43
13.37
-0.33
Overweight value signals in bear markets
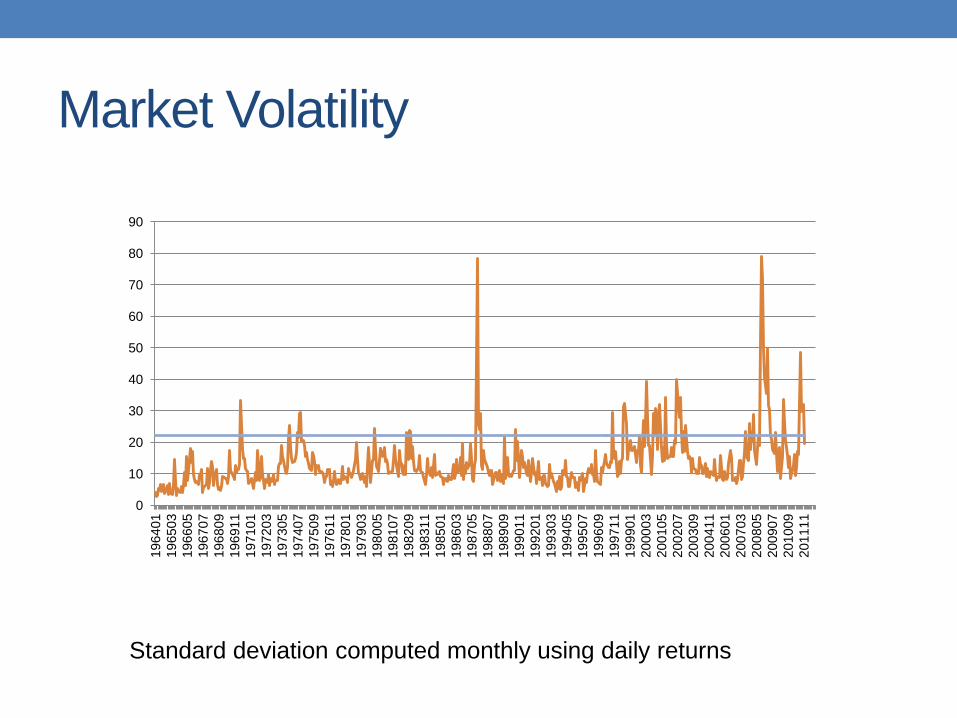
Market Volatility
Standard deviation computed monthly using daily returns
0
10
20
30
40
50
60
70
80
90
196401
196503
196605
196707
196809
196911
197101
197203
197305
197407
197509
197611
197801
197903
198005
198107
198209
198311
198501
198603
198705
198807
198909
199011
199201
199303
199405
199507
199609
199711
199901
200003
200105
200207
200309
200411
200601
200703
200805
200907
201009
201111

Momentum and Market Volatility
-40
-30
-20
-10
0
10
20
30
196401
196510
196707
196904
197101
197210
197407
197604
197801
197910
198107
198304
198501
198610
198807
199004
199201
199310
199507
199704
199901
200010
200207
200404
200601
200710
200907
201104
Momentum - High Volatility
-20
-15
-10
-5
0
5
10
15
20
196401
196510
196707
196904
197101
197210
197407
197604
197801
197910
198107
198304
198501
198610
198807
199004
199201
199310
199507
199704
199901
200010
200207
200404
200601
200710
200907
201104
Momentum - Low Volatility
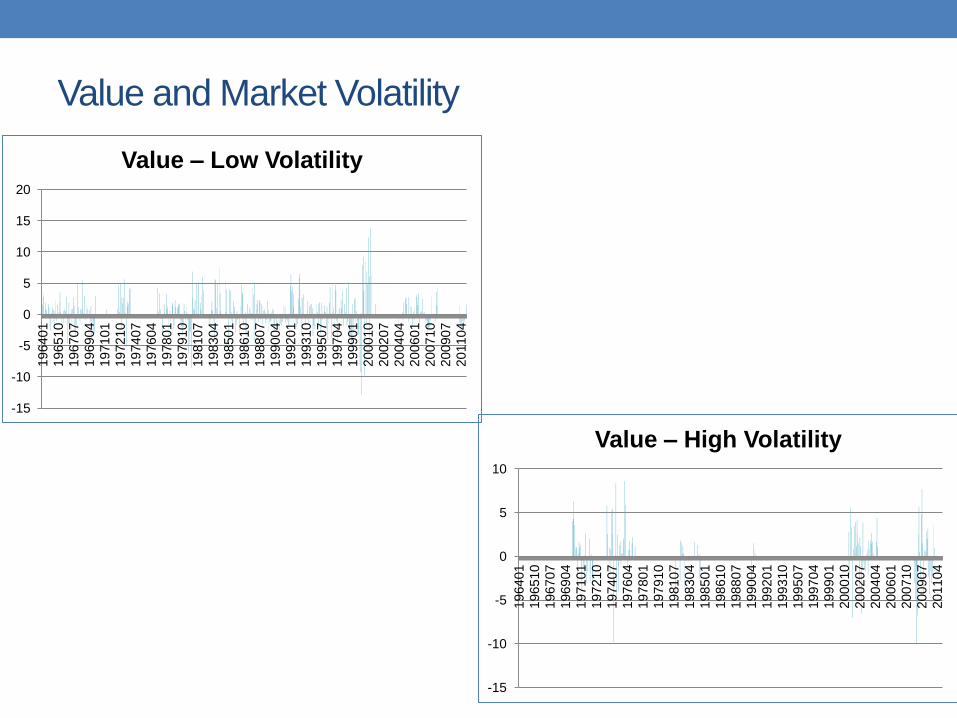
Value and Market Volatility
-15
-10
-5
0
5
10
15
20
196401
196510
196707
196904
197101
197210
197407
197604
197801
197910
198107
198304
198501
198610
198807
199004
199201
199310
199507
199704
199901
200010
200207
200404
200601
200710
200907
201104
Value – Low Volatility
-15
-10
-5
0
5
10
196401
196510
196707
196904
197101
197210
197407
197604
197801
197910
198107
198304
198501
198610
198807
199004
199201
199310
199507
199704
199901
200010
200207
200404
200601
200710
200907
201104
Value – High Volatility
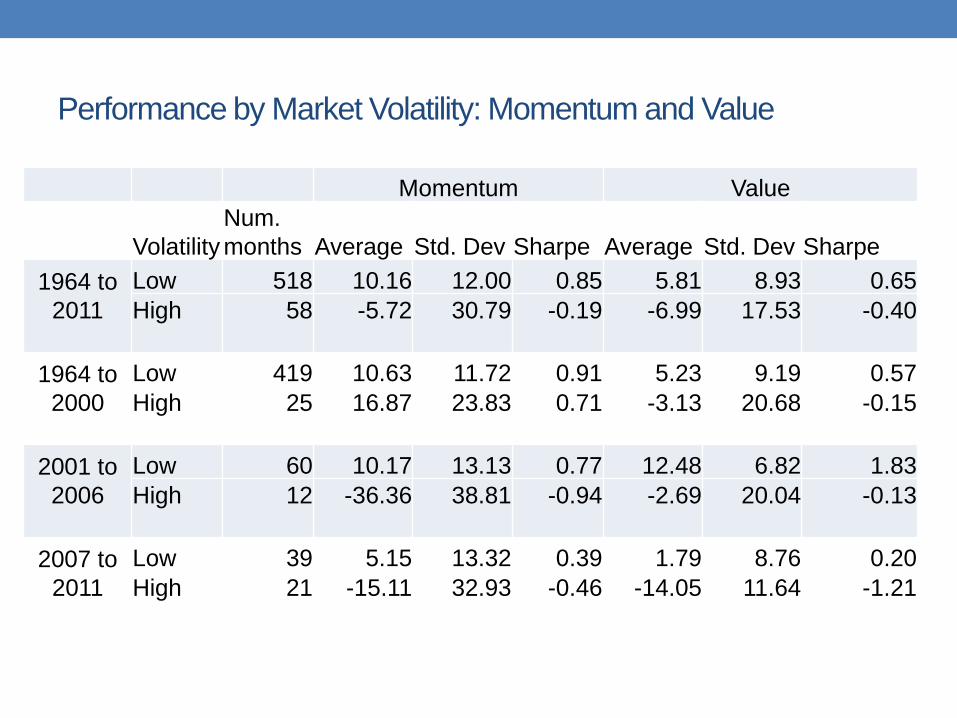
Performance by Market Volatility: Momentum and Value
Momentum Value
Volatility
Num.
months Average Std. Dev Sharpe Average Std. Dev Sharpe
1964 to
2011
Low 518 10.16 12.00 0.85 5.81 8.93 0.65
High
58
-5.72
30.79
-0.19
-6.99
17.53
-0.40
1964 to
2000
Low 419 10.63 11.72 0.91 5.23 9.19 0.57
High
25
16.87
23.83
0.71
-3.13
20.68
-0.15
2001 to
2006
Low 60 10.17 13.13 0.77 12.48 6.82 1.83
High
12
-36.36
38.81
-0.94
-2.69
20.04
-0.13
2007 to
2011
Low 39 5.15 13.32 0.39 1.79 8.76 0.20
High
21
-15.11
32.93
-0.46
-14.05
11.64
-1.21

Conclusion
• Momentum signal is strong in recent periods when bear
markets are excluded
• Underweight momentum signal and overweight value
signals in bear markets
• Overweight momentum signals in high volatility periods if
it is not a bear market