monetary management and financial intermediation chapter
TRANSCRIPT
CHAPTER
04Monetary Management and Financial Intermediation
Given the unprecedented shock of COVID-19 pandemic, monetary policy was significantly eased from March 2020 onwards. The repo rate has been cut by 115 bps since March 2020, with 75 bps cut in first Monetary Policy Committee (MPC) meeting in March 2020 and 40 bps cut in second meeting in May 2020. The policy rates were kept unchanged in further meetings, but the liquidity support was significantly enhanced. Systemic liquidity in 2020-21 remained in surplus so far. RBI undertook various conventional and unconventional measures like Open Market Operations, Long Term Repo Operations, Targeted Long Term Repo Operations etc. to manage liquidity situation in the economy. The financial flows to the real economy however remained constrained on account of subdued credit growth by both banks and Non-Banking Financial Corporations. The higher reserve money growth did not fully translate into commensurate money supply growth due to the lower (adjusted) money multiplier reflecting large deposits by banks with RBI under reverse repo. Credit growth of banks slowed down to 6.7 per cent as on January 1,2021. The credit offtake from banking sector witnessed a broad based slowdown in 2020-21. Gross Non Performing Assets ratio of Scheduled Commercial Banks decreased from 8.21 per cent at the end of March 2020 to 7.49 per cent at the end of September 2020. However, this has to be seen in conjunction with the asset classification relief provided to borrowers on account of the pandemic. Capital to risk-weighted asset ratio of Scheduled Commercial Banks increased from 14.7 per cent to 15.8 per cent between March 2020 and September 2020 with improvement in both Public and Private sector banks. This year saw improvement in transmission of policy repo rates to deposit and lending rates, as reflected in the decline of 94 bps and 67 bps in Weighted Average Lending Rate on fresh rupee loans and outstanding rupee loans respectively from March 2020 to November 2020. Similarly, the Weighted Average Domestic Term Deposit Rate declined by 81 bps during the same period. Nifty50 and S&P BSE Sensex reached record high closing of 14,644.7 and 49,792.12 on January 20,2021 respectively during 2020-21. The recovery rate for the Scheduled Commercial Banks through IBC (since its inception) has been over 45 per cent. In view of COVID-19 pandemic, initiation of Corporate Insolvency Resolution Process (CIRP) was suspended for any default arising on or after March 25, 2020 for a period of 6 months. This was further extended twice for 3 months on September 24, 2020 and December 22, 2020. The suspension along with continued clearance has allowed a small decline in accumulated cases.
MONETARY DEVELOPMENTS DURING 2020-21 4.1 TheMonetaryPolicyCommittee(MPC)oftheReserveBankmetfivetimessinceMarch2020.InviewoftheCOVID-19pandemic,theMPCadvanceditsfirsttwomeetingsof2020-21fromfirstweekofApriltoendMarchandfromfirstweekofJunetoMay,20-22.TheAugust
124 Economic Survey 2020-21 Volume 1
andtheDecember2020meetingswereheldasperschedule,whiletheOctobermeetingwaspostponed by a week as new external members were onboarded to the MPC. Since March 27,2020,thepolicyreporatehasbeenreducedby115basispoints(bps)from5.15percentto4.0percentsofar(Table1).Themonetarypolicyresponsesduringtheyear2020-21werenecessitatedbytheextraordinarysituationprevailingduetoCOVID-19.
Table 1: Revision in Policy Rates
Effective Date Repo Rate (per cent)
Reverse Repo Rate (per cent)
Cash Reserve Ratio (per cent
of NDTL)
Statutory Liquidity Ratio
(per cent of NDTL)
Bank Rate/ MSF Rate (per cent)
06-02-2020 5.15 4.9 4.0 18.25 5.427-03-2020 4.4 4.0 4.0 18.25 4.6528-03-2020 4.4 4.0 3.0 18.25 4.6517-04-2020 4.4 3.75 3.0 18.0 4.6522-05-2020 4.0 3.35 3.0 18.0 4.25
Source:RBINote:NDTL:Netdemandandtimeliabilities
4.2 Initsfirstbi-monthlymonetarypolicystatementofMarch27,2020,theMPCdecidedtoreducethepolicyreporateby75bpsfrom5.15percentto4.40percent.Alongside,thereversereporatewasreducedby90bpsto4.0percent,thuscreatinganasymmetricalcorridortomakeitunattractive forbanks topassivelydeposit fundswith theReserveBankandnudge themtousethesefundsforon-lendingtoproductivesectorsoftheeconomy.TheMPCdecidedtocontinuewiththeaccommodativestanceaslongasitisnecessarytorevivegrowthandmitigatetheimpactofCOVID-19ontheeconomy.InthesecondmeetinginMay2020,MPCreducedthe policy repo rate by 40 bps to 4.0 per cent based on the assessment that the macroeconomic impactofthepandemicwasturningouttobemoreseverethaninitiallyanticipated.
4.3 MPCdecidedtokeepthepolicyrateunchangedinitsAugust,OctoberandDecember2020meetings.Whiletheinflationhoveredabovethetolerancezoneforafewmonths,thecommitteewasof theviewthat theunderlyingfactorskeepinginflationelevatedwereessentiallysupplyshocksthatshoulddissipateovertimeastheeconomyunlocks,supplychainsrestoreandactivitynormalises.RBIinitslatestMPCmeetingrevisedupwardstheprojectedtheGDPgrowthfrom(-)9.5percentto(-)7.5percentin2020-21.
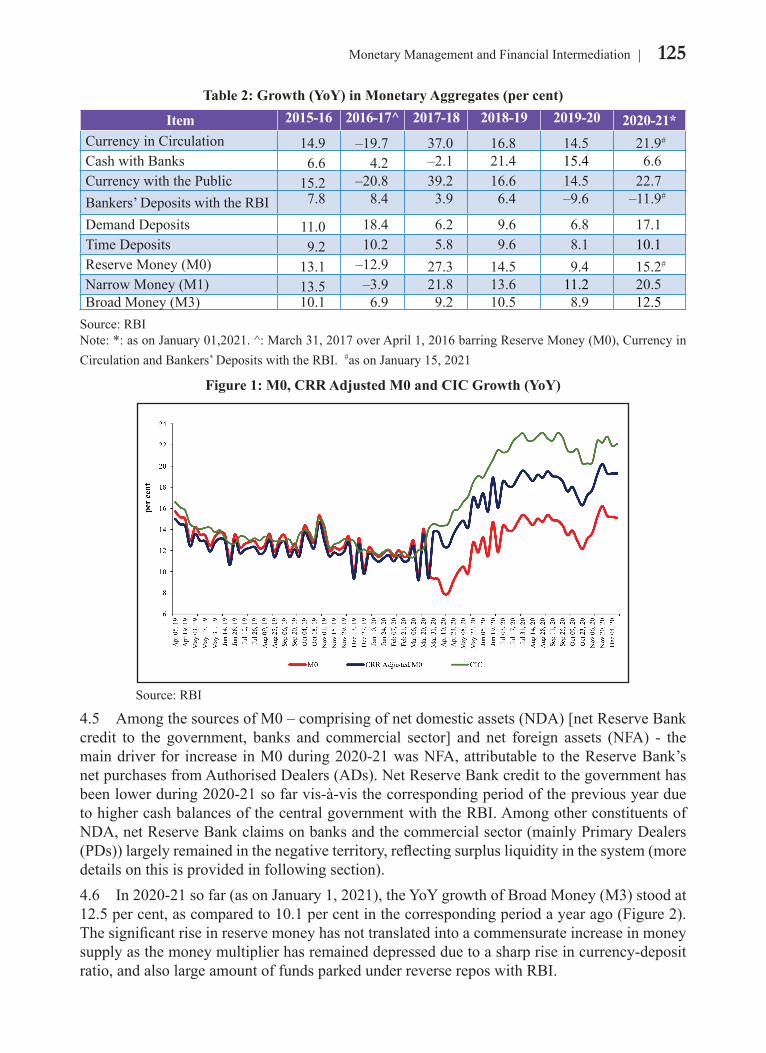
4.4 During2020-21,thegrowthofmonetaryaggregateswitnessedhighergrowthascomparedtopreviousfewyearsonaccountofhigherliquidityintheeconomy.In2020-21sofar,Reservemoney(M0)recordedaYearonYear(YoY)growthof15.2percentasonJanuary15,2021ascomparedto11.4percentayearago.However,M0adjustedforthefirst-roundimpactofchangesin theCRRrecordedanevenhighergrowth(YoY)of19.2percentascomparedto11.0percentayearago(Figure1).ExpansioninM0during2020-21wasdrivenbycurrencyincirculation(CIC)fromthecomponentside,whichwitnessedasurgeinthepost-COVID-19pandemic period.The growth (YoY) in CICwas 21.9 per cent as on January 15, 2021, ascomparedto11.6percentinthecorrespondingperiodofpreviousyear(Table2)..
125Monetary Management and Financial Intermediation
Table 2: Growth (YoY) in Monetary Aggregates (per cent)
Item 2015-16 2016-17^ 2017-18 2018-19 2019-20 2020-21*CurrencyinCirculation 14.9 –19.7 37.0 16.8 14.5 21.9#
Cash with Banks 6.6 4.2 –2.1 21.4 15.4 6.6CurrencywiththePublic 15.2 –20.8 39.2 16.6 14.5 22.7Bankers’ Deposits with the RBI 7.8 8.4 3.9 6.4 –9.6 –11.9#
Demand Deposits 11.0 18.4 6.2 9.6 6.8 17.1Time Deposits 9.2 10.2 5.8 9.6 8.1 10.1Reserve Money (M0) 13.1 –12.9 27.3 14.5 9.4 15.2#
Narrow Money (M1) 13.5 –3.9 21.8 13.6 11.2 20.5Broad Money (M3) 10.1 6.9 9.2 10.5 8.9 12.5Source:RBINote:*:asonJanuary01,2021.^:March31,2017overApril1,2016barringReserveMoney(M0),CurrencyinCirculationandBankers’DepositswiththeRBI.#asonJanuary15,2021
Figure 1: M0, CRR Adjusted M0 and CIC Growth (YoY)
Source:RBI
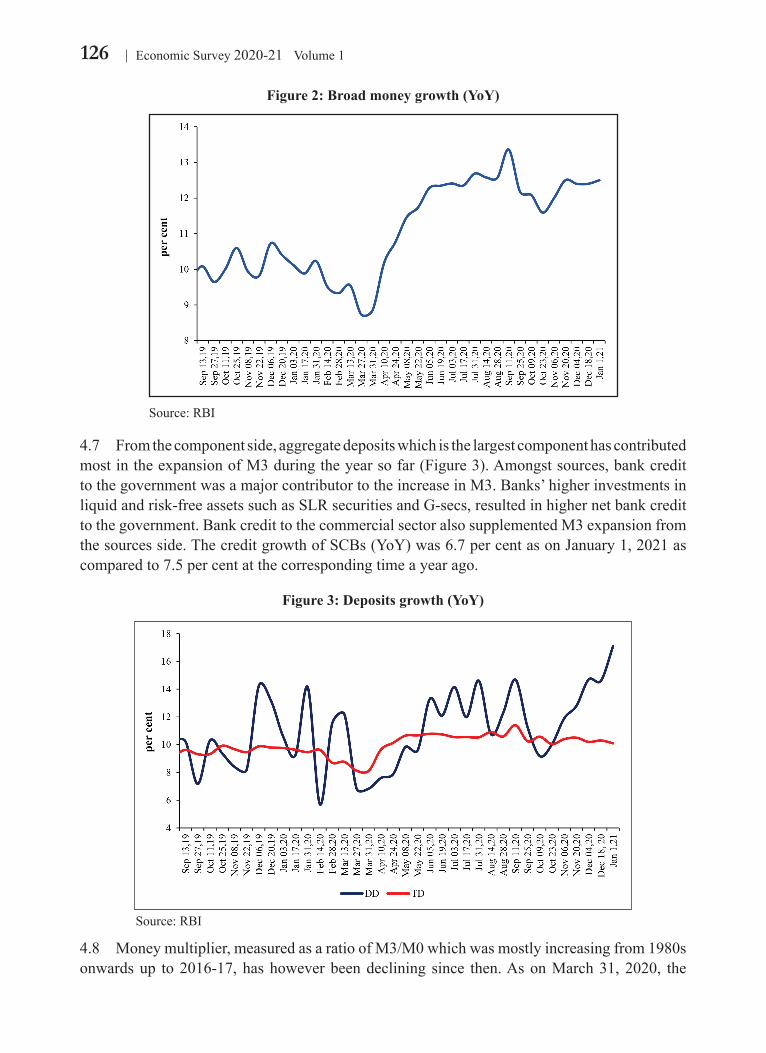
4.5 AmongthesourcesofM0–comprisingofnetdomesticassets(NDA)[netReserveBankcredit to the government, banks and commercial sector] and net foreign assets (NFA) - themaindriverfor increaseinM0during2020-21wasNFA,attributableto theReserveBank’snetpurchasesfromAuthorisedDealers(ADs).NetReserveBankcredittothegovernmenthasbeenlowerduring2020-21sofarvis-à-visthecorrespondingperiodofthepreviousyearduetohighercashbalancesofthecentralgovernmentwiththeRBI.AmongotherconstituentsofNDA,netReserveBankclaimsonbanksandthecommercialsector(mainlyPrimaryDealers(PDs))largelyremainedinthenegativeterritory,reflectingsurplusliquidityinthesystem(moredetailsonthisisprovidedinfollowingsection).4.6 In2020-21sofar(asonJanuary1,2021),theYoYgrowthofBroadMoney(M3)stoodat12.5percent,ascomparedto10.1percentinthecorrespondingperiodayearago(Figure2).Thesignificantriseinreservemoneyhasnottranslatedintoacommensurateincreaseinmoneysupplyasthemoneymultiplierhasremaineddepressedduetoasharpriseincurrency-depositratio,andalsolargeamountoffundsparkedunderreversereposwithRBI.
126 Economic Survey 2020-21 Volume 1
Figure 2: Broad money growth (YoY)
Source:RBI
4.7 Fromthecomponentside,aggregatedepositswhichisthelargestcomponenthascontributedmostintheexpansionofM3duringtheyearsofar(Figure3).Amongstsources,bankcredittothegovernmentwasamajorcontributortotheincreaseinM3.Banks’higherinvestmentsinliquidandrisk-freeassetssuchasSLRsecuritiesandG-secs,resultedinhighernetbankcredittothegovernment.BankcredittothecommercialsectoralsosupplementedM3expansionfromthesourcesside.ThecreditgrowthofSCBs(YoY)was6.7percentasonJanuary1,2021ascomparedto7.5percentatthecorrespondingtimeayearago.
Figure 3: Deposits growth (YoY)
Source:RBI
4.8 Moneymultiplier,measuredasaratioofM3/M0whichwasmostlyincreasingfrom1980sonwardsup to2016-17,hashoweverbeendeclining since then.AsonMarch31,2020, the
127Monetary Management and Financial Intermediation
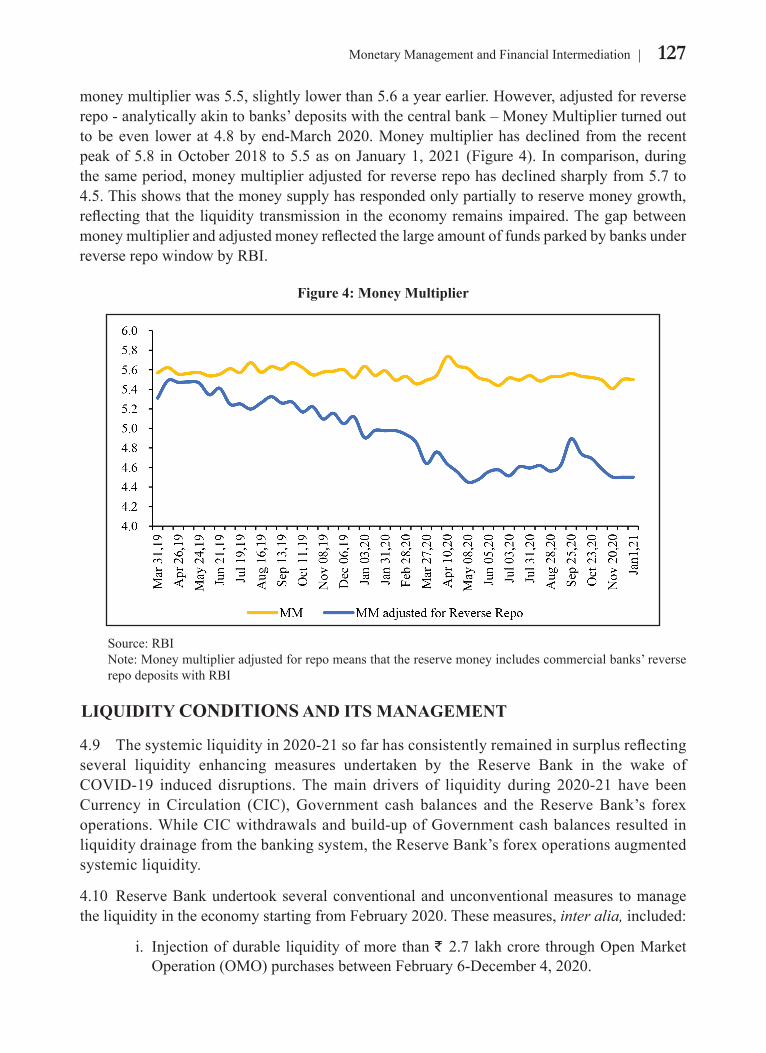
moneymultiplierwas5.5,slightlylowerthan5.6ayearearlier.However,adjustedforreverserepo-analyticallyakintobanks’depositswiththecentralbank–MoneyMultiplierturnedouttobeeven lowerat4.8byend-March2020.Moneymultiplierhasdeclined from the recentpeakof5.8 inOctober2018 to5.5asonJanuary1,2021(Figure4). Incomparison,duringthesameperiod,moneymultiplieradjustedforreverserepohasdeclinedsharplyfrom5.7to4.5.Thisshowsthatthemoneysupplyhasrespondedonlypartiallytoreservemoneygrowth,reflectingthat the liquidity transmissionin theeconomyremains impaired.Thegapbetweenmoneymultiplierandadjustedmoneyreflectedthelargeamountoffundsparkedbybanksunderreverse repo window by RBI.
Figure 4: Money Multiplier
Source:RBI Note: Moneymultiplieradjustedforrepomeansthatthereservemoneyincludescommercialbanks’reverse
repo deposits with RBI
LIQUIDITY CONDITIONS AND ITS MANAGEMENT
4.9 Thesystemicliquidityin2020-21sofarhasconsistentlyremainedinsurplusreflectingseveral liquidity enhancing measures undertaken by the Reserve Bank in the wake ofCOVID-19 induced disruptions.Themain drivers of liquidity during 2020-21 have beenCurrency inCirculation (CIC),Government cash balances and theReserveBank’s forexoperations.WhileCICwithdrawalsandbuild-upofGovernmentcashbalancesresultedinliquiditydrainagefromthebankingsystem,theReserveBank’sforexoperationsaugmentedsystemicliquidity.
4.10 ReserveBankundertookseveralconventionalandunconventionalmeasures tomanagetheliquidityintheeconomystartingfromFebruary2020.Thesemeasures,inter alia,included:
i. Injectionofdurableliquidityofmorethan` 2.7lakhcrorethroughOpenMarketOperation(OMO)purchasesbetweenFebruary6-December4,2020.
128 Economic Survey 2020-21 Volume 1
ii. OMOsinStateDevelopmentLoans(SDLs)asaspecialcasewerealsointroducedduringthecurrentfinancialyear.TheOMOswereconductedforabasketofSDLscomprisingsecurities issuedbystates.Aggregate liquidity to the tuneof` 30,000 crore was injected through three OMO purchase auctions (October 22, 2020,November5,2020andDecember23,2020)underthisfacility.
iii. TargetedLongTermRepoOperations(TLTROs)ofup to threeyears’ tenorforatotal amount of ` 1.13 lakh crore for investment in corporate bonds, commercial papers,andnon-convertibledebentures,inadditiontoinjectionof` 1.25lakhcrorethroughLongTermRepoOperations(LTROs)conductedinFebruary-March2020.
iv. Reduction in theCRR requirement of banks from4 per cent of net demand andtimeliabilities(NDTL)to3percentwitheffectfromMarch28,2020augmentingprimaryliquidityinthebankingsystembyabout` 1.37 lakh crore.
v. Raisingbanks’limitforborrowingovernightundertheMSFbydippingintotheirStatutoryLiquidityRatio(SLR)to3percentofNDTLfrom2percent,allowingthebankingsystemtoavailanadditional` 1.37croreofliquidity.
vi. SpecialLiquidityFacilityformutualfundsfor` 50,000crore;and vii. Refinance facility worth ` 75,000 crore for all India financial institutions i.e.,
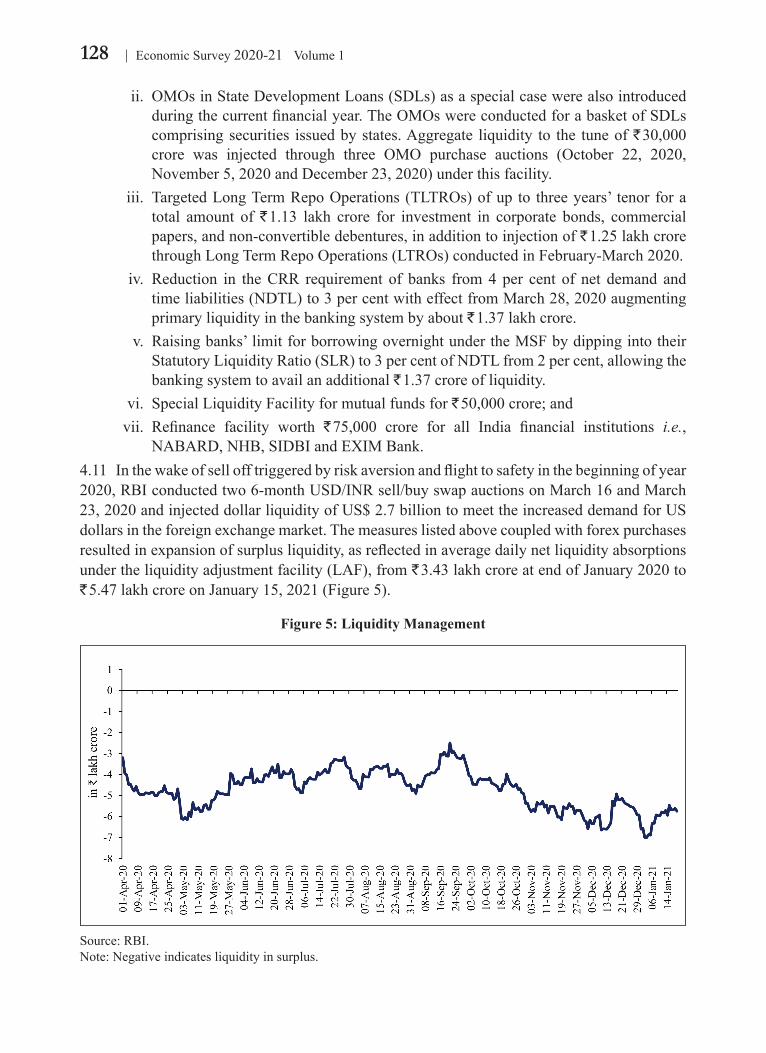
NABARD,NHB,SIDBIandEXIMBank.4.11 Inthewakeofsellofftriggeredbyriskaversionandflighttosafetyinthebeginningofyear2020,RBIconductedtwo6-monthUSD/INRsell/buyswapauctionsonMarch16andMarch23,2020andinjecteddollarliquidityofUS$2.7billiontomeettheincreaseddemandforUSdollarsintheforeignexchangemarket.Themeasureslistedabovecoupledwithforexpurchasesresultedinexpansionofsurplusliquidity,asreflectedinaveragedailynetliquidityabsorptionsundertheliquidityadjustmentfacility(LAF),from` 3.43lakhcroreatendofJanuary2020to` 5.47lakhcroreonJanuary15,2021(Figure5).
Figure 5: Liquidity Management
Source:RBI.Note:Negativeindicatesliquidityinsurplus.
129Monetary Management and Financial Intermediation
4.12 The increasedgovernmentspendingduringApril-May2020alsoaddedto the liquiditysurplus.However,theGovernment’scashbalancesturnedintosurplusinJune2020andJuly2020.InQ2of2020,althoughsurplusliquidityconditionsstillexisted,therewasmoderationascomparedtoQ1.Asaresult,averagedailynetabsorptionundertheLAFdecreasedto 3.95lakhcroreinJuly2020asaverageGovernment cashsurplusincreasedto` 95,942crore.Thereafter,daily net absorption increased to ` 4.03lakhcroreinAugust2020,whichagainmoderatedto` 3.68lakhcroreinSeptember2020.Thismoderationcouldbeattributedtotheabsorptionofbankingsectorliquiditytothetuneof` 1.24lakhcroreundertheoptiongiventobankstoreturnthefundsavailedunderLTROfacilitybeforematurity.Themoderationinliquidityabsorption,however,wasreversedinfollowingmonthsasaveragedailynetabsorptionundertheLAFagainincreased to 4.47 lakh crore and 5.64lakhcroreinthemonthofOctoberandNovember2020.Thisispartlyareflectionofpickupingovernmentspending.
4.13 In order to ensure better monetary transmission through a more even distribution ofliquidity across tenors, 14 simultaneous sale-purchaseOMOauctions for` 10,000 crore each wereconductedinthefinancialyear2020-21
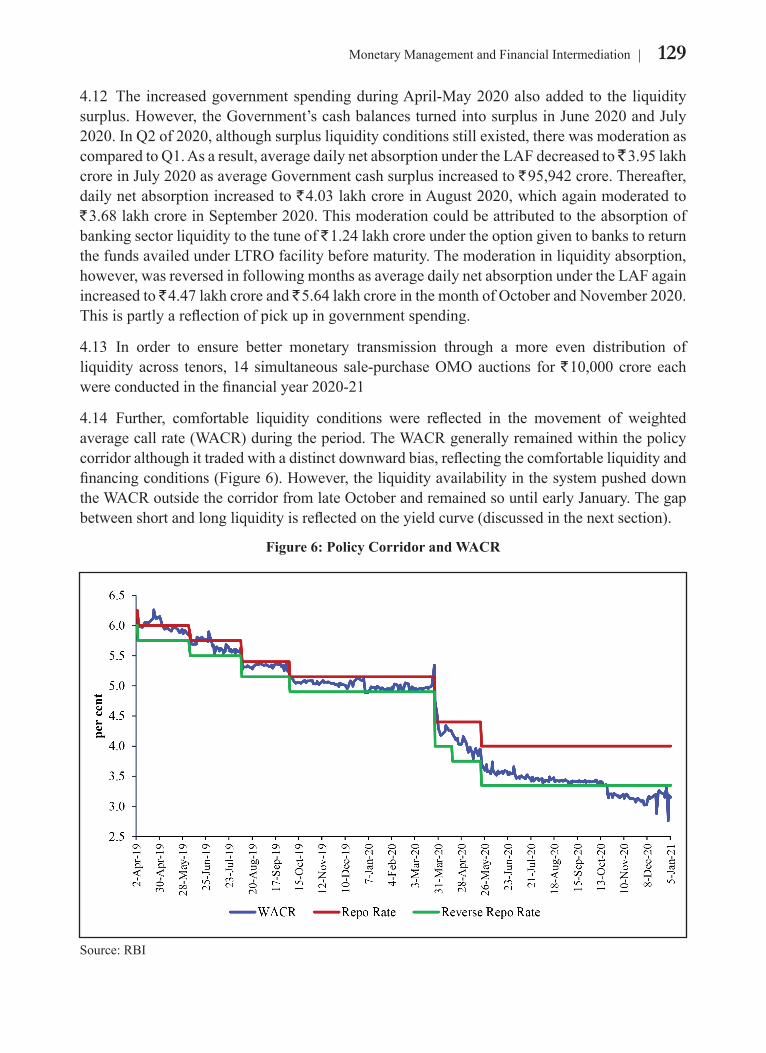
4.14 Further, comfortable liquidity conditions were reflected in the movement of weightedaveragecallrate(WACR)duringtheperiod.TheWACRgenerallyremainedwithinthepolicycorridoralthoughittradedwithadistinctdownwardbias,reflectingthecomfortableliquidityandfinancingconditions(Figure6).However,theliquidityavailabilityinthesystempusheddowntheWACRoutsidethecorridorfromlateOctoberandremainedsountilearlyJanuary.Thegapbetweenshortandlongliquidityisreflectedontheyieldcurve(discussedinthenextsection).
Figure 6: Policy Corridor and WACR
Source:RBI

130 Economic Survey 2020-21 Volume 1
DEVELOPMENTS IN THE G-SEC MARKETS4.15.Duringthefirsthalfof2020-21,the10-yearbenchmarkG-secyieldtradedwithasofteningbias(Figure7)trackinglowerpolicyrates,subduedcrudeoilpricesandsurplusliquidity.The10-yearbenchmarkG-secyieldwhichwasaround6.4-6.5percentinApril2020touchedalowof5.73percentinmidMay2020.
Figure 7: India 10-Year Benchmark G-sec Yield
Source:Bloomberg.
4.16 Inthefirstquarterof2020-21,theyieldson10yearbenchmarkG-secshowedadecliningtrend.TheyieldshardenedduringthefirstfortnightofApril2020duetolowtradingvolumesamidthecountrywidelockdownandreducedmarkethours,sellingpressurebyForeignPortfolioInvestors (FPIs) along with the upward movement of US treasury yields. However, yieldssoftenedinthesecondhalfofthemonth,reflectingtheimpactofasharpdeclineincrudeoilprices,theannouncementbytheFederalOpenMarketCommittee(FOMC)tokeepthetargetrangeoftheFedFundsrateunchangedat0-0.25percentandalowerCPIreadingforMarch2020relativetothatforFebruary2020.Theyieldon10-yearbenchmarksecurityopenedat6.20percentonApril3,2020andclosedat5.89percentonJune30,2020.
4.17.Theyieldscontinued toharden, trackinghigher thanexpectedCPIprint for July2020and a pause in rate cut byMPC. Subsequently, the benchmark yield drew comfort from aseriesof specialOMOsandoutrightOMOcarriedoutby theReserveBank.Further,OMOonSDLs,increaseofOMOamountto` 20,000croreandextensionofheld-to-maturitybenefitforSLRsecuritiesbyonemoreyeartoMarch31,2022providedsupporttothebondmarket.Subsequently,new10-yearbenchmarkyield toucheda three-month lowof5.79per centonOctober26,2020.However,theyieldonbenchmarkbonddriftedupagainslightlyandstoodat5.92percentonJanuary20,2021.
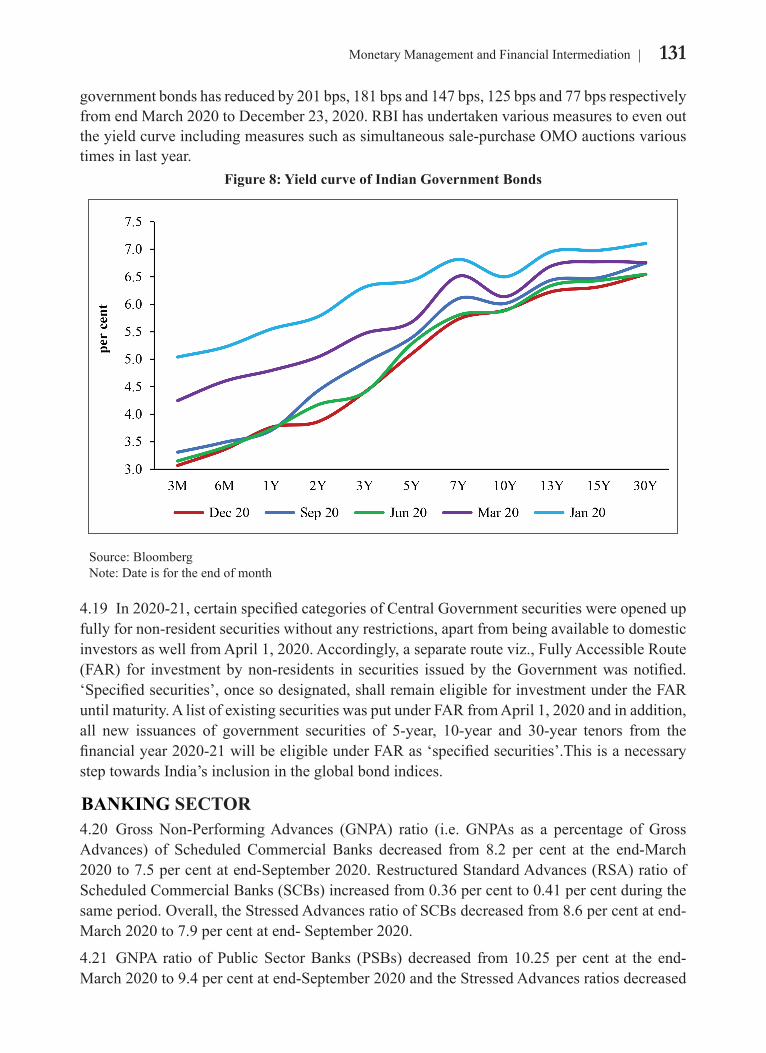
4.18 Incomparison,theyieldsonshortertermgovernmentsecuritiesfelldownsharplyin2020-21 (Figure 8).This is seen clearly in the shape of yield curve,where the gap haswidenedsharplyattheshorterendofthecurve.Theyieldson3month,6month,1year,3yearand5year
131Monetary Management and Financial Intermediation
governmentbondshasreducedby201bps,181bpsand147bps,125bpsand77bpsrespectivelyfromendMarch2020toDecember23,2020.RBIhasundertakenvariousmeasurestoevenouttheyieldcurveincludingmeasuressuchassimultaneoussale-purchaseOMOauctionsvarioustimes in last year.
Figure 8: Yield curve of Indian Government Bonds
Source:Bloomberg Note:Dateisfortheendofmonth
4.19 In2020-21,certainspecifiedcategoriesofCentralGovernmentsecuritieswereopenedupfullyfornon-residentsecuritieswithoutanyrestrictions,apartfrombeingavailabletodomesticinvestorsaswellfromApril1,2020.Accordingly,aseparaterouteviz.,FullyAccessibleRoute(FAR) for investmentbynon-residents in securities issuedby theGovernmentwasnotified.‘Specifiedsecurities’,oncesodesignated,shallremaineligibleforinvestmentundertheFARuntilmaturity.AlistofexistingsecuritieswasputunderFARfromApril1,2020andinaddition,all new issuances of government securities of 5-year, 10-year and 30-year tenors from thefinancialyear2020-21willbeeligibleunderFARas‘specifiedsecurities’.ThisisanecessarysteptowardsIndia’sinclusionintheglobalbondindices.
BANKING SECTOR4.20 GrossNon-PerformingAdvances (GNPA) ratio (i.e. GNPAs as a percentage ofGrossAdvances) of Scheduled Commercial Banks decreased from 8.2 per cent at the end-March2020to7.5percentatend-September2020.RestructuredStandardAdvances(RSA)ratioofScheduledCommercialBanks(SCBs)increasedfrom0.36percentto0.41percentduringthesameperiod.Overall,theStressedAdvancesratioofSCBsdecreasedfrom8.6percentatend-March 2020 to 7.9 per cent at end- September 2020.
4.21 GNPA ratio ofPublicSectorBanks (PSBs) decreased from10.25per cent at the end-March2020to9.4percentatend-September2020andtheStressedAdvancesratiosdecreased
132 Economic Survey 2020-21 Volume 1
from10.75percentto9.96percentduringthesameperiod.NetNPAratiosalsodeclinedandstoodat2.1percentforSCBsand2.85percentforPSBsasatend-September2020.
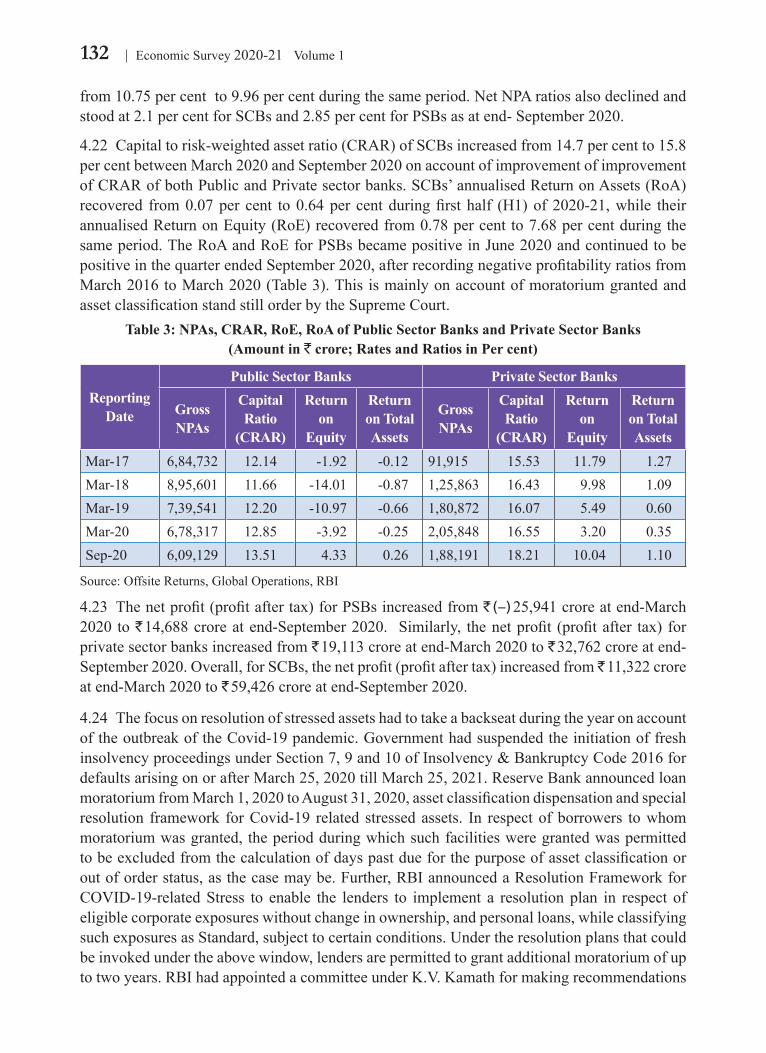
4.22 Capitaltorisk-weightedassetratio(CRAR)ofSCBsincreasedfrom14.7percentto15.8percentbetweenMarch2020andSeptember2020onaccountofimprovementofimprovementofCRARofbothPublicandPrivatesectorbanks.SCBs’annualisedReturnonAssets(RoA)recovered from0.07per cent to0.64per centduringfirsthalf (H1)of2020-21,while theirannualisedReturnonEquity(RoE)recoveredfrom0.78percentto7.68percentduringthesameperiod.TheRoAandRoEforPSBsbecamepositiveinJune2020andcontinuedtobepositiveinthequarterendedSeptember2020,afterrecordingnegativeprofitabilityratiosfromMarch2016toMarch2020(Table3).ThisismainlyonaccountofmoratoriumgrantedandassetclassificationstandstillorderbytheSupremeCourt.
Table 3: NPAs, CRAR, RoE, RoA of Public Sector Banks and Private Sector Banks (Amount in ` crore; Rates and Ratios in Per cent)
Reporting Date
Public Sector Banks Private Sector Banks
Gross NPAs
Capital Ratio
(CRAR)
Return on
Equity
Return on Total Assets
Gross NPAs
Capital Ratio
(CRAR)
Return on
Equity
Return on Total Assets
Mar-17 6,84,732 12.14 -1.92 -0.12 91,915 15.53 11.79 1.27Mar-18 8,95,601 11.66 -14.01 -0.87 1,25,863 16.43 9.98 1.09Mar-19 7,39,541 12.20 -10.97 -0.66 1,80,872 16.07 5.49 0.60Mar-20 6,78,317 12.85 -3.92 -0.25 2,05,848 16.55 3.20 0.35Sep-20 6,09,129 13.51 4.33 0.26 1,88,191 18.21 10.04 1.10
Source:OffsiteReturns,GlobalOperations,RBI
4.23 Thenetprofit(profitaftertax)forPSBsincreasedfrom` (–) 25,941croreatend-March2020 to ` 14,688croreatend-September2020. Similarly, thenetprofit (profitafter tax) forprivate sector banks increased from ` 19,113 crore at end-March 2020 to ` 32,762 crore at end-September2020.Overall,forSCBs,thenetprofit(profitaftertax)increasedfrom` 11,322 crore at end-March 2020 to ` 59,426croreatend-September2020.
4.24 ThefocusonresolutionofstressedassetshadtotakeabackseatduringtheyearonaccountoftheoutbreakoftheCovid-19pandemic.GovernmenthadsuspendedtheinitiationoffreshinsolvencyproceedingsunderSection7,9and10ofInsolvency&BankruptcyCode2016fordefaultsarisingonorafterMarch25,2020tillMarch25,2021.ReserveBankannouncedloanmoratoriumfromMarch1,2020toAugust31,2020,assetclassificationdispensationandspecialresolution framework forCovid-19 related stressedassets. In respectofborrowers towhommoratoriumwasgranted,theperiodduringwhichsuchfacilitiesweregrantedwaspermittedtobeexcludedfromthecalculationofdayspastdueforthepurposeofassetclassificationoroutoforderstatus,asthecasemaybe.Further,RBIannouncedaResolutionFrameworkforCOVID-19-relatedStress to enable the lenders to implement a resolutionplan in respect ofeligiblecorporateexposureswithoutchangeinownership,andpersonalloans,whileclassifyingsuchexposuresasStandard,subjecttocertainconditions.Undertheresolutionplansthatcouldbeinvokedundertheabovewindow,lendersarepermittedtograntadditionalmoratoriumofuptotwoyears.RBIhadappointedacommitteeunderK.V.Kamathformakingrecommendations
133Monetary Management and Financial Intermediation
ontherequiredfinancialparameterstobefactoredinresolutionplans.Also,MSMEaccountsclassifiedasStandardwhere theaggregateexposureofbanksandNBFCswas` 25croreorbelow as onMarch 1, 2020,were permitted to be restructuredwithout a downgrade in theassetclassification,subjecttocertainconditions.Notably,theSupremeCourtissuedaninterimorderdatedSeptember3,2020specifyingthat“theaccountswhichwerenotdeclaredNPAtill31.08.2020shallnotbedeclaredNPAtillfurtherorders”.4.25 Theabovemeasures,whichprovidedassetclassificationreliefstoborrowers,wouldaffectthetruerecognitionoffinancialstressontheborroweraccounts.However,thelargerobjectiveof financial stability in thewake of pandemic demanded prudential forbearancewhichwasexercisedthroughclearboundariesanddisincentivesembeddedintheabovereliefs.Moreover,the risk recognitionhasnotbeencompletely suspendedas the lenders are required tomakeprovisionsofat least10percent in respectofaccountswhichavailedofassetclassificationbenefitsundertheabovereliefs.
MONETARY POLICY TRANSMISSION4.26 RBIhasreducedreporateby250bpssinceFebruary2019(thecurrenteasingcycle).Thetransmissionofpolicyreporatechangeshasbeenweakonquantityofcredit.However,therehasbeenimprovedtransmissiononratestructureandtermstructure.
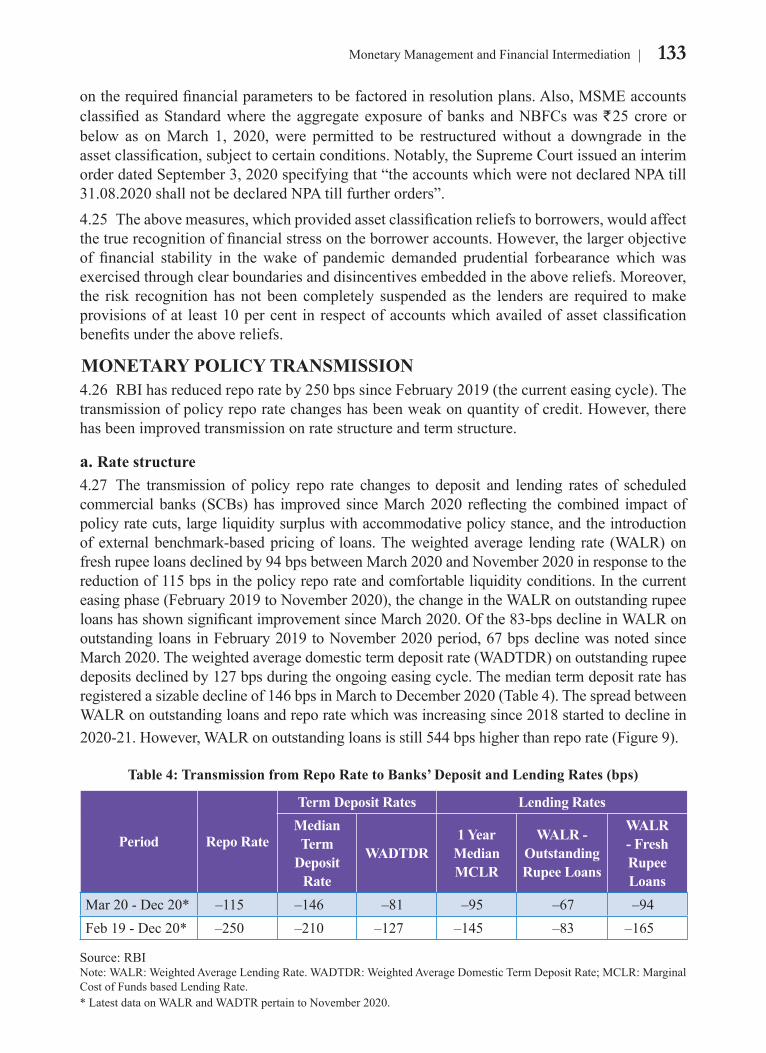
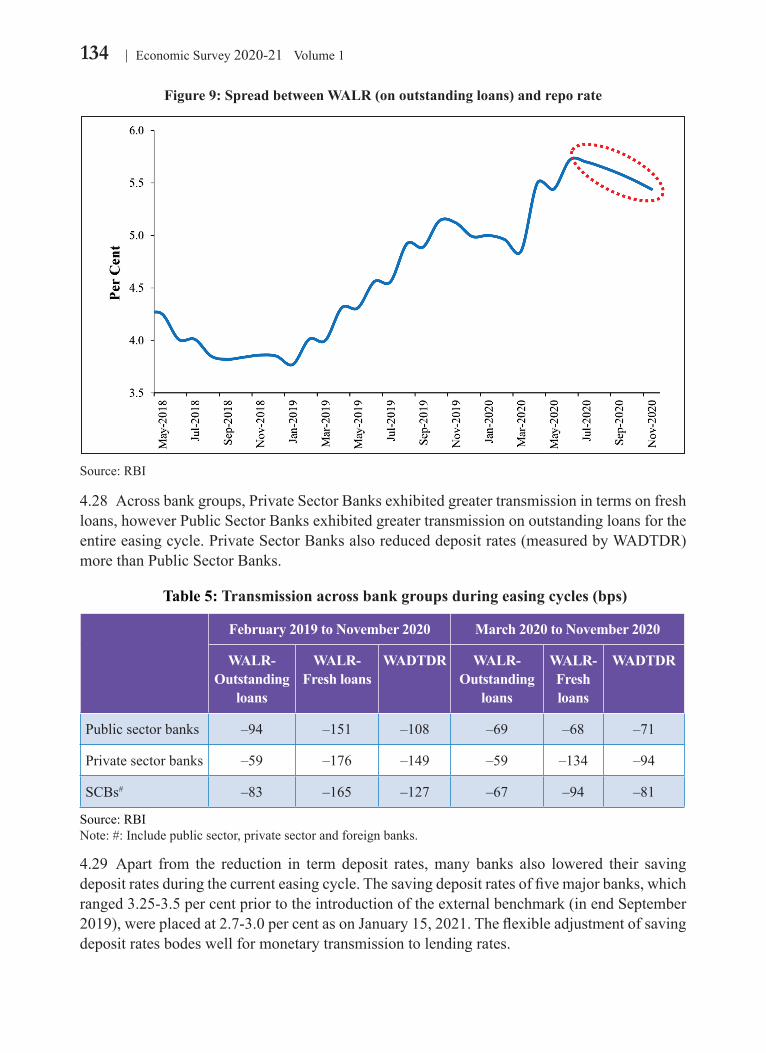
a. Rate structure4.27 The transmission of policy repo rate changes to deposit and lending rates of scheduledcommercialbanks (SCBs)has improved sinceMarch2020 reflecting thecombined impactofpolicyratecuts,largeliquiditysurpluswithaccommodativepolicystance,andtheintroductionofexternalbenchmark-basedpricingof loans.Theweightedaverage lending rate (WALR)onfreshrupeeloansdeclinedby94bpsbetweenMarch2020andNovember2020inresponsetothereductionof115bpsinthepolicyreporateandcomfortableliquidityconditions.Inthecurrenteasingphase(February2019toNovember2020),thechangeintheWALRonoutstandingrupeeloanshasshownsignificantimprovementsinceMarch2020.Ofthe83-bpsdeclineinWALRonoutstandingloansinFebruary2019toNovember2020period,67bpsdeclinewasnotedsinceMarch2020.Theweightedaveragedomestictermdepositrate(WADTDR)onoutstandingrupeedepositsdeclinedby127bpsduringtheongoingeasingcycle.Themediantermdepositratehasregisteredasizabledeclineof146bpsinMarchtoDecember2020(Table4).ThespreadbetweenWALRonoutstandingloansandreporatewhichwasincreasingsince2018startedtodeclinein2020-21.However,WALRonoutstandingloansisstill544bpshigherthanreporate(Figure9).
Table 4: Transmission from Repo Rate to Banks’ Deposit and Lending Rates (bps)
Period Repo Rate
Term Deposit Rates Lending Rates Median Term
Deposit Rate
WADTDR 1 Year
Median MCLR
WALR - Outstanding Rupee Loans
WALR - Fresh Rupee Loans
Mar20-Dec20* –115 –146 –81 –95 –67 –94Feb19-Dec20* –250 –210 –127 –145 –83 –165
Source:RBINote: WALR:WeightedAverageLendingRate.WADTDR:WeightedAverageDomesticTermDepositRate;MCLR:MarginalCostofFundsbasedLendingRate.*LatestdataonWALRandWADTRpertaintoNovember2020.
134 Economic Survey 2020-21 Volume 1
Figure 9: Spread between WALR (on outstanding loans) and repo rate
Source:RBI
4.28 Acrossbankgroups,PrivateSectorBanksexhibitedgreatertransmissionintermsonfreshloans,howeverPublicSectorBanksexhibitedgreatertransmissiononoutstandingloansfortheentireeasingcycle.PrivateSectorBanksalsoreduceddepositrates(measuredbyWADTDR)morethanPublicSectorBanks.
Table 5: Transmission across bank groups during easing cycles (bps)
February 2019 to November 2020 March 2020 to November 2020
WALR-Outstanding
loans
WALR-Fresh loans
WADTDR WALR-Outstanding
loans
WALR-Fresh loans
WADTDR
Publicsectorbanks –94 –151 –108 –69 –68 –71
Private sector banks –59 –176 –149 –59 –134 –94
SCBs# –83 –165 –127 –67 –94 –81
Source:RBINote:#:Includepublicsector,privatesectorandforeignbanks.
4.29 Apart from the reduction in term deposit rates,many banks also lowered their savingdepositratesduringthecurrenteasingcycle.Thesavingdepositratesoffivemajorbanks,whichranged3.25-3.5percentpriortotheintroductionoftheexternalbenchmark(inendSeptember2019),wereplacedat2.7-3.0percentasonJanuary15,2021.Theflexibleadjustmentofsavingdepositratesbodeswellformonetarytransmissiontolendingrates.
135Monetary Management and Financial Intermediation
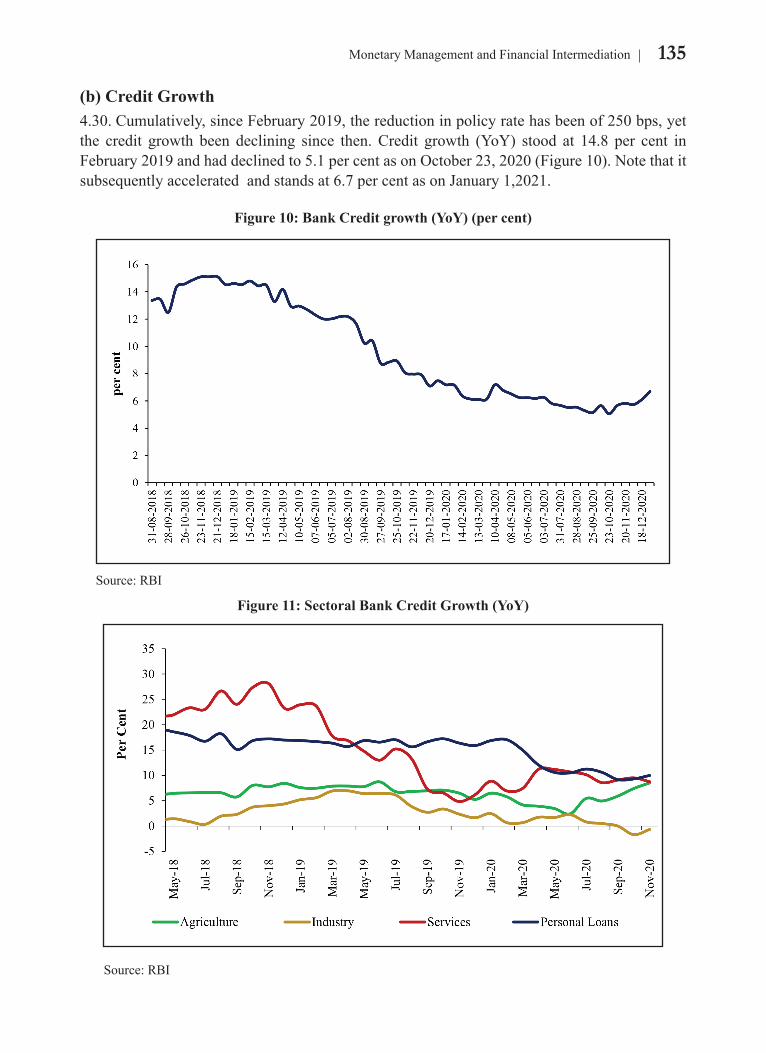
(b) Credit Growth4.30.Cumulatively,sinceFebruary2019,thereductioninpolicyratehasbeenof250bps,yetthe credit growth been declining since then.Credit growth (YoY) stood at 14.8 per cent inFebruary2019andhaddeclinedto5.1percentasonOctober23,2020(Figure10).Notethatitsubsequentlyacceleratedandstandsat6.7percentasonJanuary1,2021.
Figure 10: Bank Credit growth (YoY) (per cent)
Source:RBI
Figure 11: Sectoral Bank Credit Growth (YoY)
Source:RBI
136 Economic Survey 2020-21 Volume 1
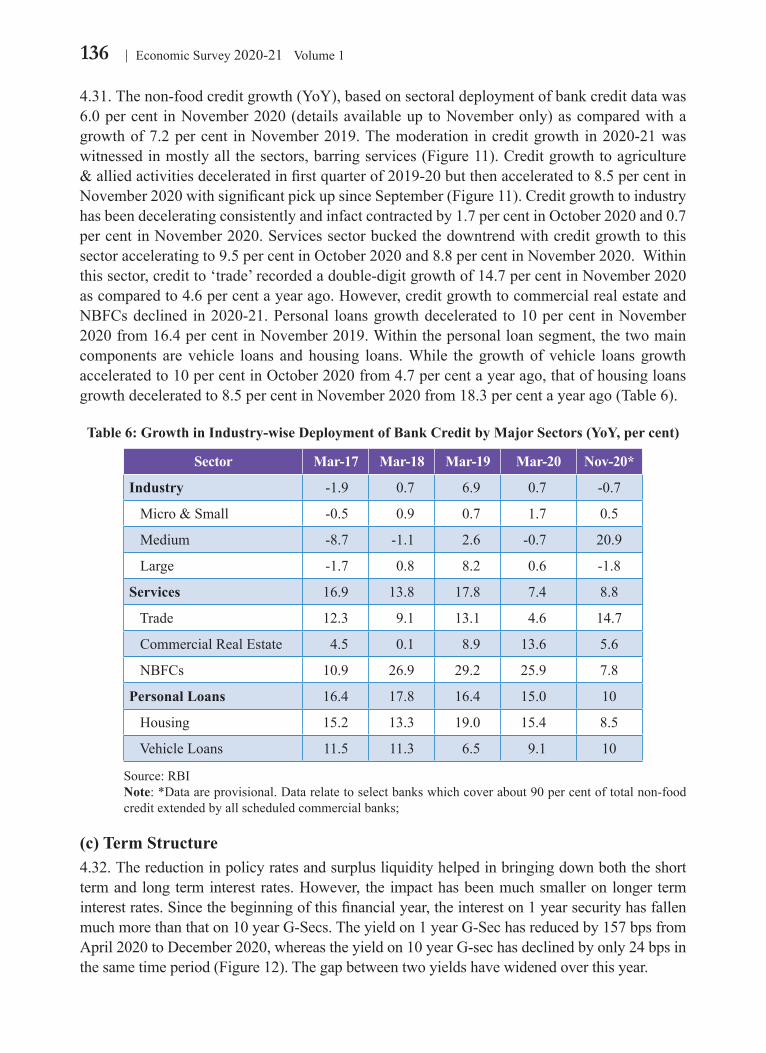
4.31.Thenon-foodcreditgrowth(YoY),basedonsectoraldeploymentofbankcreditdatawas6.0percent inNovember2020(detailsavailableuptoNovemberonly)ascomparedwithagrowthof7.2percent inNovember2019.Themoderation increditgrowth in2020-21waswitnessedinmostlyallthesectors,barringservices(Figure11).Creditgrowthtoagriculture&alliedactivitiesdeceleratedinfirstquarterof2019-20butthenacceleratedto8.5percentinNovember2020withsignificantpickupsinceSeptember(Figure11).Creditgrowthtoindustryhasbeendeceleratingconsistentlyandinfactcontractedby1.7percentinOctober2020and0.7percentinNovember2020.Servicessectorbuckedthedowntrendwithcreditgrowthtothissectoracceleratingto9.5percentinOctober2020and8.8percentinNovember2020.Withinthissector,creditto‘trade’recordedadouble-digitgrowthof14.7percentinNovember2020ascomparedto4.6percentayearago.However,creditgrowthtocommercialrealestateandNBFCsdeclined in2020-21.Personal loansgrowthdecelerated to10percent inNovember2020from16.4percentinNovember2019.Withinthepersonalloansegment,thetwomaincomponents arevehicle loans andhousing loans.While thegrowthofvehicle loansgrowthacceleratedto10percentinOctober2020from4.7percentayearago,thatofhousingloansgrowthdeceleratedto8.5percentinNovember2020from18.3percentayearago(Table6).
Table 6: Growth in Industry-wise Deployment of Bank Credit by Major Sectors (YoY, per cent)
Sector Mar-17 Mar-18 Mar-19 Mar-20 Nov-20*
Industry -1.9 0.7 6.9 0.7 -0.7
Micro&Small -0.5 0.9 0.7 1.7 0.5
Medium -8.7 -1.1 2.6 -0.7 20.9
Large -1.7 0.8 8.2 0.6 -1.8
Services 16.9 13.8 17.8 7.4 8.8
Trade 12.3 9.1 13.1 4.6 14.7
CommercialRealEstate 4.5 0.1 8.9 13.6 5.6
NBFCs 10.9 26.9 29.2 25.9 7.8
Personal Loans 16.4 17.8 16.4 15.0 10
Housing 15.2 13.3 19.0 15.4 8.5
VehicleLoans 11.5 11.3 6.5 9.1 10
Source:RBI Note:*Dataareprovisional.Datarelatetoselectbankswhichcoverabout90percentoftotalnon-food
creditextendedbyallscheduledcommercialbanks;
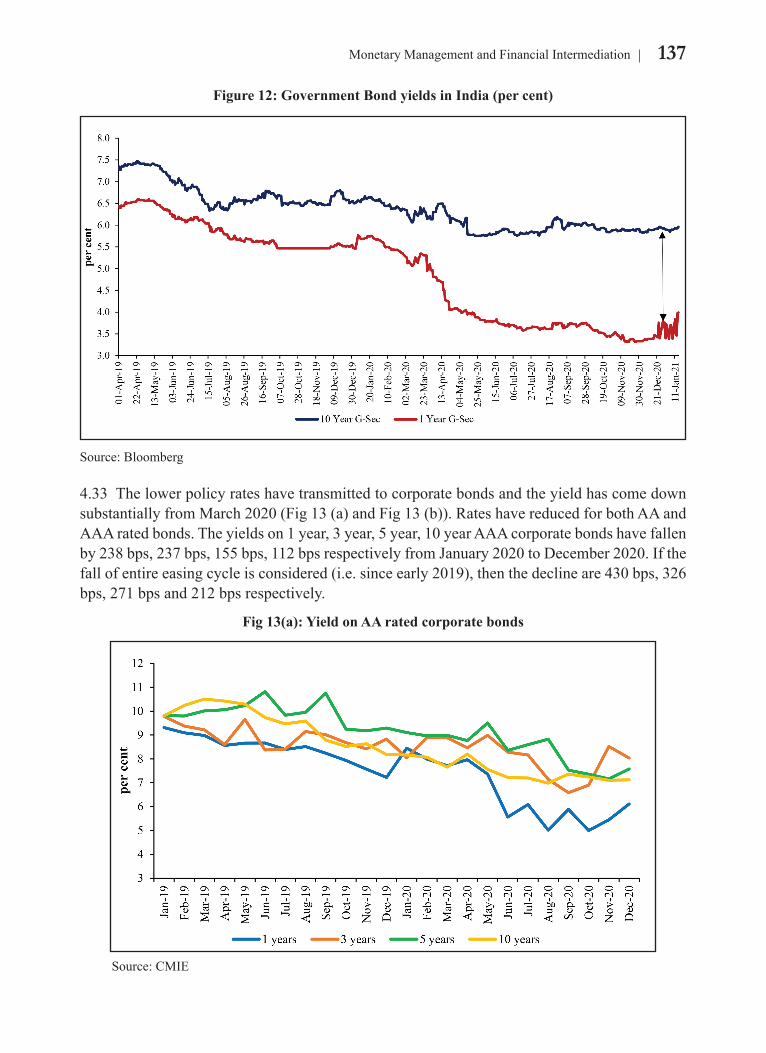
(c) Term Structure4.32.Thereductioninpolicyratesandsurplusliquidityhelpedinbringingdownboththeshorttermandlongterminterest rates.However, the impacthasbeenmuchsmalleron longer terminterestrates.Sincethebeginningofthisfinancialyear,theintereston1yearsecurityhasfallenmuchmorethanthaton10yearG-Secs.Theyieldon1yearG-Sechasreducedby157bpsfromApril2020toDecember2020,whereastheyieldon10yearG-sechasdeclinedbyonly24bpsinthesametimeperiod(Figure12).Thegapbetweentwoyieldshavewidenedoverthisyear.
137Monetary Management and Financial Intermediation
Figure 12: Government Bond yields in India (per cent)
Source:Bloomberg
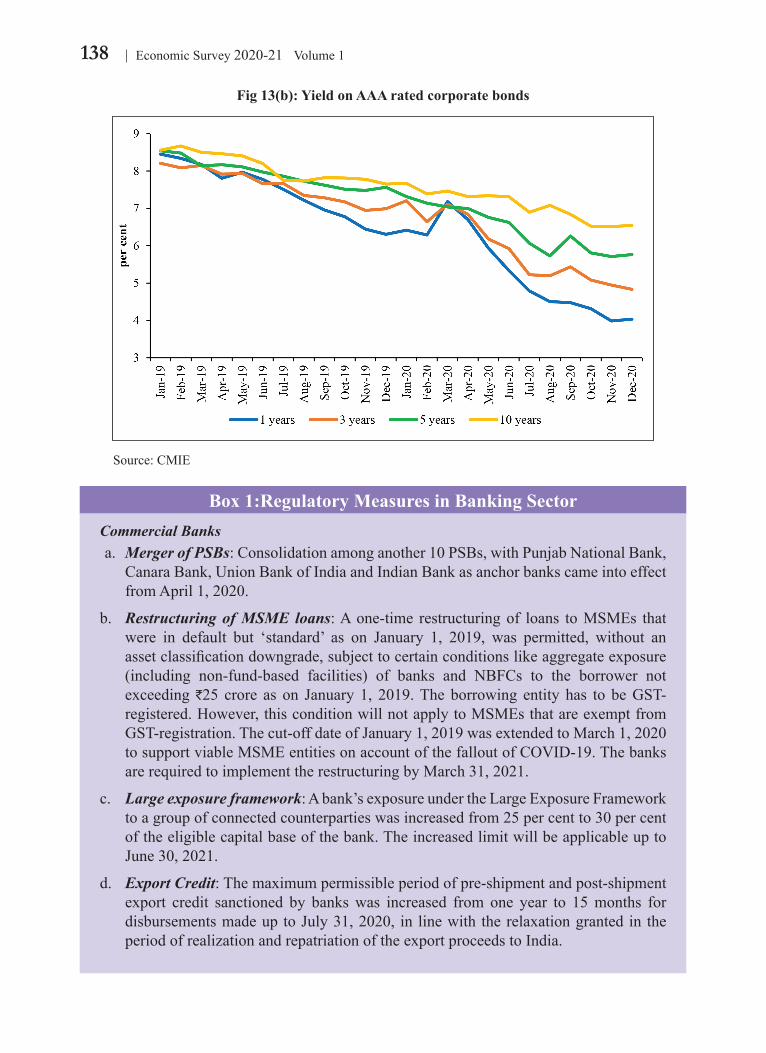
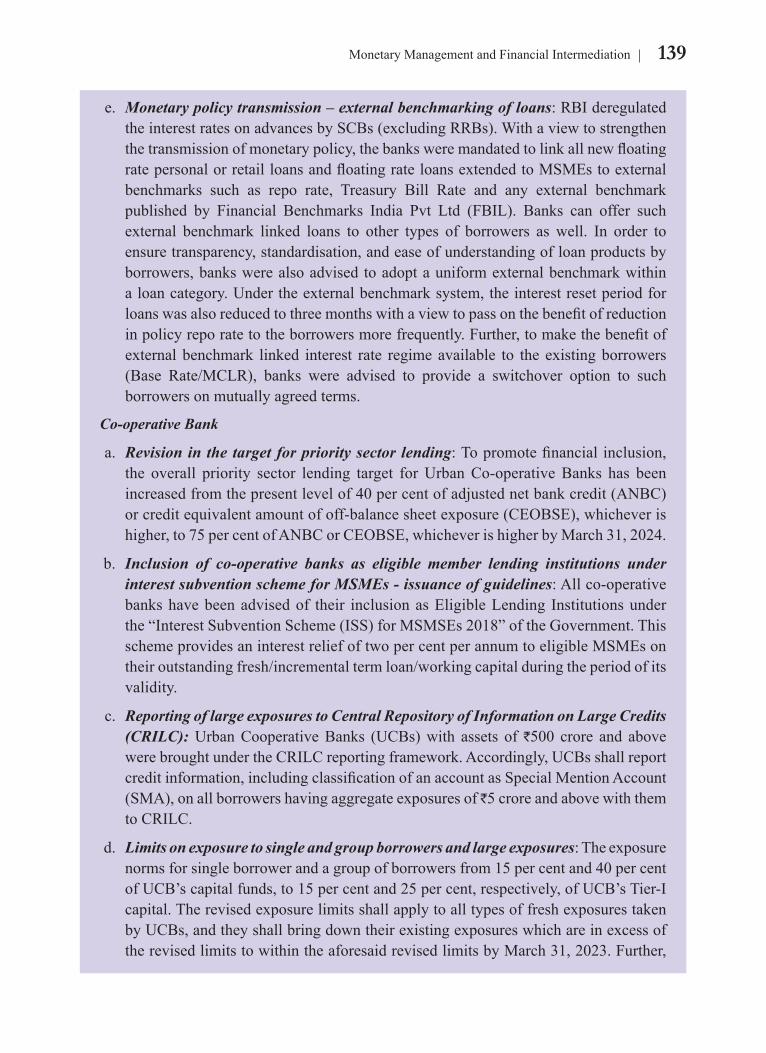
4.33 The lower policy rates have transmitted to corporate bonds and the yield has come down substantiallyfromMarch2020(Fig13(a)andFig13(b)).RateshavereducedforbothAAandAAAratedbonds.Theyieldson1year,3year,5year,10yearAAAcorporatebondshavefallenby238bps,237bps,155bps,112bpsrespectivelyfromJanuary2020toDecember2020.Ifthefallofentireeasingcycleisconsidered(i.e.sinceearly2019),thenthedeclineare430bps,326bps, 271 bps and 212 bps respectively.
Fig 13(a): Yield on AA rated corporate bonds
Source:CMIE
138 Economic Survey 2020-21 Volume 1
Fig 13(b): Yield on AAA rated corporate bonds
Source:CMIE
Box 1:Regulatory Measures in Banking SectorCommercial Banks a. Merger of PSBs:Consolidationamonganother10PSBs,withPunjabNationalBank,
CanaraBank,UnionBankofIndiaandIndianBankasanchorbankscameintoeffectfromApril1,2020.
b. Restructuring of MSME loans:Aone-time restructuringof loans toMSMEs thatwere in default but ‘standard’ as on January 1, 2019, was permitted, without anassetclassificationdowngrade,subjecttocertainconditionslikeaggregateexposure(including non-fund-based facilities) of banks and NBFCs to the borrower notexceeding `25 crore as on January1, 2019.Theborrowing entity has to beGST-registered.However,thisconditionwillnotapplytoMSMEsthatareexemptfromGST-registration.Thecut-offdateofJanuary1,2019wasextendedtoMarch1,2020tosupportviableMSMEentitiesonaccountofthefalloutofCOVID-19.ThebanksarerequiredtoimplementtherestructuringbyMarch31,2021.
c. Large exposure framework:Abank’sexposureundertheLargeExposureFrameworktoagroupofconnectedcounterpartieswasincreasedfrom25percentto30percentoftheeligiblecapitalbaseofthebank.TheincreasedlimitwillbeapplicableuptoJune30,2021.
d. Export Credit:Themaximumpermissibleperiodofpre-shipmentandpost-shipmentexport credit sanctioned by bankswas increased from one year to 15months fordisbursementsmadeuptoJuly31,2020, in linewith therelaxationgrantedin theperiodofrealizationandrepatriationoftheexportproceedstoIndia.
139Monetary Management and Financial Intermediation
e. Monetary policy transmission – external benchmarking of loans:RBIderegulatedtheinterestratesonadvancesbySCBs(excludingRRBs).Withaviewtostrengthenthetransmissionofmonetarypolicy,thebanksweremandatedtolinkallnewfloatingratepersonalorretailloansandfloatingrateloansextendedtoMSMEstoexternalbenchmarks such as repo rate, Treasury Bill Rate and any external benchmarkpublished by Financial Benchmarks India Pvt Ltd (FBIL). Banks can offer suchexternal benchmark linked loans to other types of borrowers as well. In order to ensuretransparency,standardisation,andeaseofunderstandingofloanproductsbyborrowers,bankswerealsoadvisedtoadoptauniformexternalbenchmarkwithinaloancategory.Undertheexternalbenchmarksystem,theinterestresetperiodforloanswasalsoreducedtothreemonthswithaviewtopassonthebenefitofreductioninpolicyreporatetotheborrowersmorefrequently.Further,tomakethebenefitofexternalbenchmark linked interest rate regimeavailable to the existingborrowers(Base Rate/MCLR), banks were advised to provide a switchover option to suchborrowersonmutuallyagreedterms.
Co-operative Bank
a. Revision in the target for priority sector lending:Topromotefinancialinclusion,the overall priority sector lending target forUrbanCo-operativeBanks has beenincreasedfromthepresentlevelof40percentofadjustednetbankcredit(ANBC)orcreditequivalentamountofoff-balancesheetexposure(CEOBSE),whicheverishigher,to75percentofANBCorCEOBSE,whicheverishigherbyMarch31,2024.
b. Inclusion of co-operative banks as eligible member lending institutions under interest subvention scheme for MSMEs - issuance of guidelines:Allco-operativebankshavebeenadvisedof their inclusionasEligibleLending Institutionsunderthe“InterestSubventionScheme(ISS)forMSMSEs2018”oftheGovernment.ThisschemeprovidesaninterestreliefoftwopercentperannumtoeligibleMSMEsontheiroutstandingfresh/incrementaltermloan/workingcapitalduringtheperiodofitsvalidity.
c. Reporting of large exposures to Central Repository of Information on Large Credits (CRILC):UrbanCooperativeBanks (UCBs)with assets of `500 crore and abovewerebroughtundertheCRILCreportingframework.Accordingly,UCBsshallreportcreditinformation,includingclassificationofanaccountasSpecialMentionAccount(SMA),onallborrowershavingaggregateexposuresof 5croreandabovewiththemtoCRILC.
d. Limits on exposure to single and group borrowers and large exposures:Theexposurenormsforsingleborrowerandagroupofborrowersfrom15percentand40percentofUCB’scapitalfunds,to15percentand25percent,respectively,ofUCB’sTier-Icapital.TherevisedexposurelimitsshallapplytoalltypesoffreshexposurestakenbyUCBs,andtheyshallbringdowntheirexistingexposureswhichareinexcessoftherevisedlimitstowithintheaforesaidrevisedlimitsbyMarch31,2023.Further,
140 Economic Survey 2020-21 Volume 1
UCBsshallhaveatleast50percentoftheiraggregateloansandadvancescomprisingloans of not more than `25lakhor0.2percentoftheirtierIcapital,whicheverishigher,subjecttoamaximumof`1 crore, per borrower.
e. Submission of returns under Section 31 (read with section 56) of the Banking Regulation Act, 1949 - Extension of time:InviewofthedifficultiesfacedbyUCBsinsubmissionofthereturnsduetotheongoingCOVID-19pandemic,thetimelineforthefurnishingofthereturnsforthefinancialyearendedonMarch31,2020,wasfirstextendedbythreemonths,i.e.,tillSeptember30,2020andthenfurthertoDecember31,2020.
f. Amendments to the Banking Regulation Act, 1949: Banking Regulation (Amendment) Act, 2020: The Banking RegulationAct has been amended by theBanking Regulation (Amendment)Act, 2020. The key changes in the regulatoryregimeofUCBspursuanttotheBankingRegulation(Amendment)Act,2020areasunder:
• TheReserveBankhasbeengivenpowersoverthemanagementoftheUCBs,owingtowhich it can issue directions relating to themanagement ofUCBs includingapprovalforappointmentofChairman/MD/CEO,removalandremunerationofMD/CEO.Further,theBoardofUCBswouldberequiredtohavenotlessthan51percentmembershavingspecialknowledge/practicalexperienceinspecifiedareas.
• Thestatutoryrestrictionongrantofdirector-relatedloans/advanceshasbeenwidenedand common directorship across banks shall be prohibited as per the provisions of the amendedAct.
• TheReserveBankhasbeenvestedwithpowersofapprovalof theappointment /removalofstatutoryauditorsofUCBs.
• ProvisionsoftherevisedActwillenableUCBstoraisecapitalbyissueofequity/preference/special shares and debentures/bonds/like securities subject to suchconditions as the Reserve Bank may specify in this behalf.
• TheReserveBankhasbeenempoweredtosupersedetheBoardofDirectorsofaUCB;thoughincaseofaUCBhavingoperationsconfinedtoasingleState,inconsultationwiththeconcernedStateGovernment.
• TheReserveBankhasbeenempoweredtosanctionvoluntary/compulsoryamalgamationandtoprepareschemeforreconstructionofaUCBwiththeapprovaloftheCentralGovernment.
TheamendedActprovidesforwindingupofaUCBbyHighCourtattheinstanceoftheReserve Bank.
141Monetary Management and Financial Intermediation
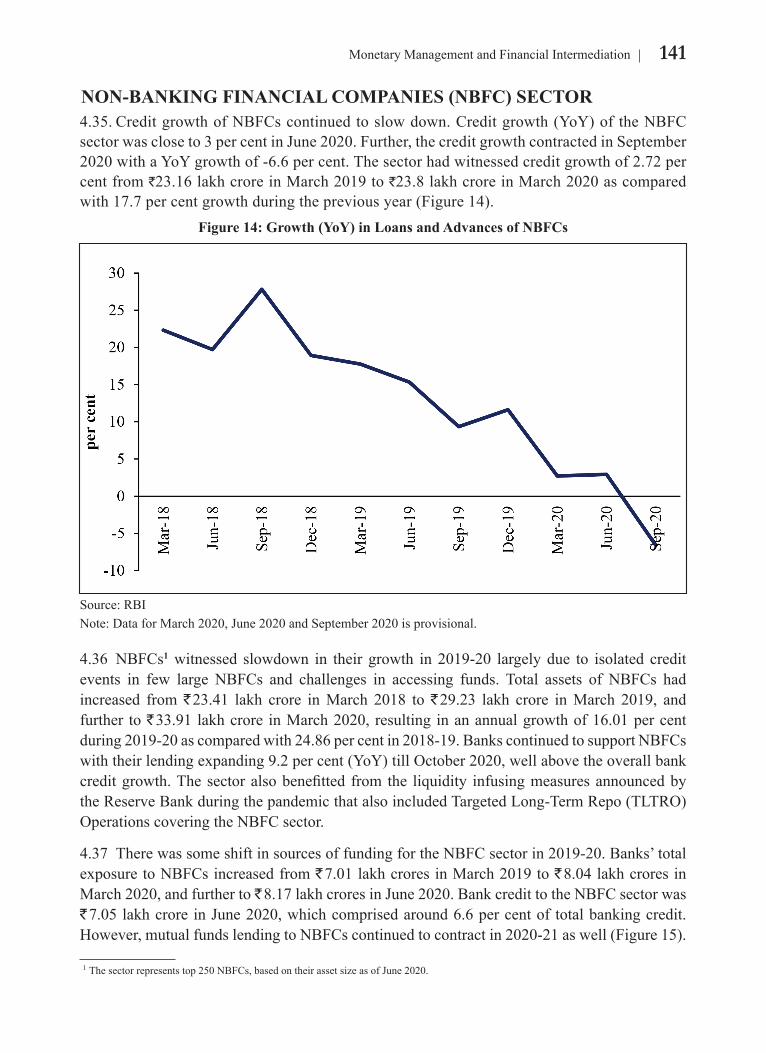
NON-BANKING FINANCIAL COMPANIES (NBFC) SECTOR4.35.CreditgrowthofNBFCscontinuedtoslowdown.Creditgrowth(YoY)oftheNBFCsectorwascloseto3percentinJune2020.Further,thecreditgrowthcontractedinSeptember2020withaYoYgrowthof-6.6percent.Thesectorhadwitnessedcreditgrowthof2.72percent from `23.16 lakh crore in March 2019 to `23.8 lakh crore in March 2020 as compared with17.7percentgrowthduringthepreviousyear(Figure14).
Figure 14: Growth (YoY) in Loans and Advances of NBFCs
Source:RBINote:DataforMarch2020,June2020andSeptember2020isprovisional.
4.36 NBFCs1witnessed slowdown in their growth in2019-20 largelydue to isolated creditevents in few large NBFCs and challenges in accessing funds. Total assets of NBFCs hadincreased from ` 23.41 lakh crore in March 2018 to ` 29.23 lakh crore in March 2019, and further to` 33.91lakhcrore inMarch2020,resulting inanannualgrowthof16.01percentduring2019-20ascomparedwith24.86percentin2018-19.BankscontinuedtosupportNBFCswiththeirlendingexpanding9.2percent(YoY)tillOctober2020,wellabovetheoverallbankcreditgrowth.Thesectoralsobenefitted from the liquidity infusingmeasuresannouncedbytheReserveBankduringthepandemicthatalsoincludedTargetedLong-TermRepo(TLTRO)OperationscoveringtheNBFCsector.
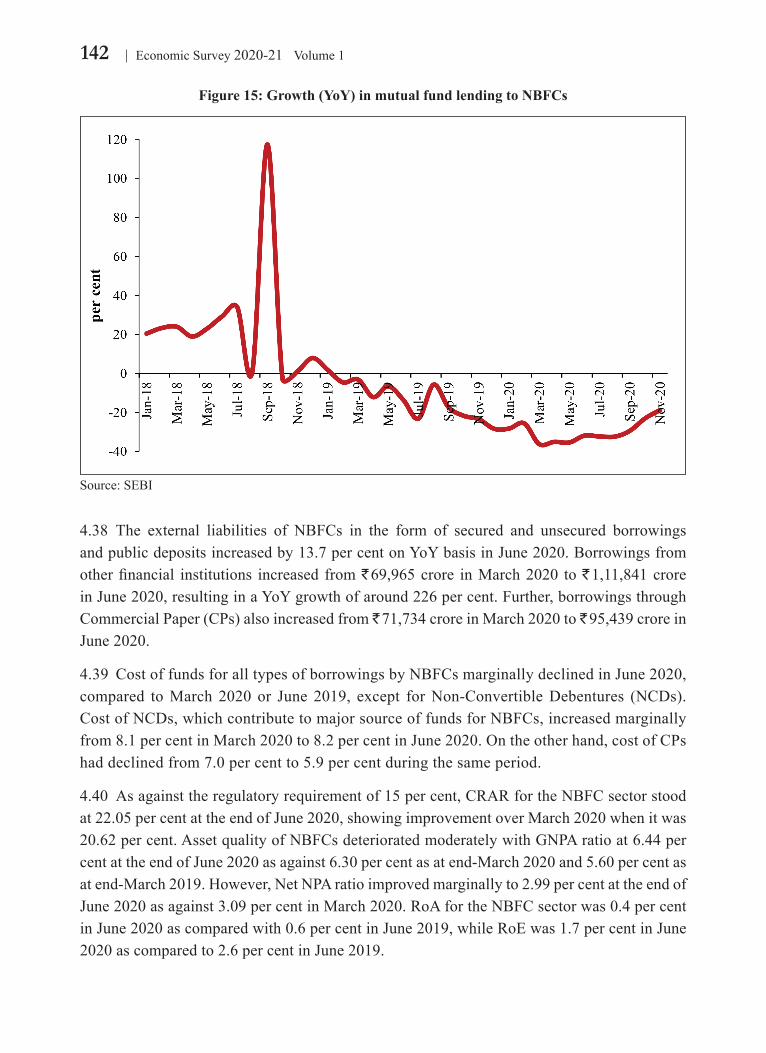
4.37 TherewassomeshiftinsourcesoffundingfortheNBFCsectorin2019-20.Banks’totalexposuretoNBFCsincreasedfrom` 7.01 lakh crores in March 2019 to ` 8.04 lakh crores in March2020,andfurtherto` 8.17lakhcroresinJune2020.BankcredittotheNBFCsectorwas` 7.05lakhcroreinJune2020,whichcomprisedaround6.6percentof totalbankingcredit.However,mutualfundslendingtoNBFCscontinuedtocontractin2020-21aswell(Figure15).
1 Thesectorrepresentstop250NBFCs,basedontheirassetsizeasofJune2020.
142 Economic Survey 2020-21 Volume 1
Figure 15: Growth (YoY) in mutual fund lending to NBFCs
Source:SEBI
4.38 The external liabilities of NBFCs in the form of secured and unsecured borrowingsandpublicdepositsincreasedby13.7percentonYoYbasisinJune2020.Borrowingsfromotherfinancial institutions increased from` 69,965crore inMarch2020 to` 1,11,841 crore inJune2020,resultinginaYoYgrowthofaround226percent.Further,borrowingsthroughCommercial Paper (CPs) also increased from ` 71,734 crore in March 2020 to ` 95,439croreinJune2020.
4.39 CostoffundsforalltypesofborrowingsbyNBFCsmarginallydeclinedinJune2020,compared toMarch 2020or June 2019, except forNon-ConvertibleDebentures (NCDs).CostofNCDs,whichcontributetomajorsourceoffundsforNBFCs,increasedmarginallyfrom8.1percentinMarch2020to8.2percentinJune2020.Ontheotherhand,costofCPshaddeclinedfrom7.0percentto5.9percentduringthesameperiod.
4.40 Asagainsttheregulatoryrequirementof15percent,CRARfortheNBFCsectorstoodat22.05percentattheendofJune2020,showingimprovementoverMarch2020whenitwas20.62percent.AssetqualityofNBFCsdeterioratedmoderatelywithGNPAratioat6.44percentattheendofJune2020asagainst6.30percentasatend-March2020and5.60percentasatend-March2019.However,NetNPAratioimprovedmarginallyto2.99percentattheendofJune2020asagainst3.09percentinMarch2020.RoAfortheNBFCsectorwas0.4percentinJune2020ascomparedwith0.6percentinJune2019,whileRoEwas1.7percentinJune2020 as compared to 2.6 per cent in June2019.
143Monetary Management and Financial Intermediation
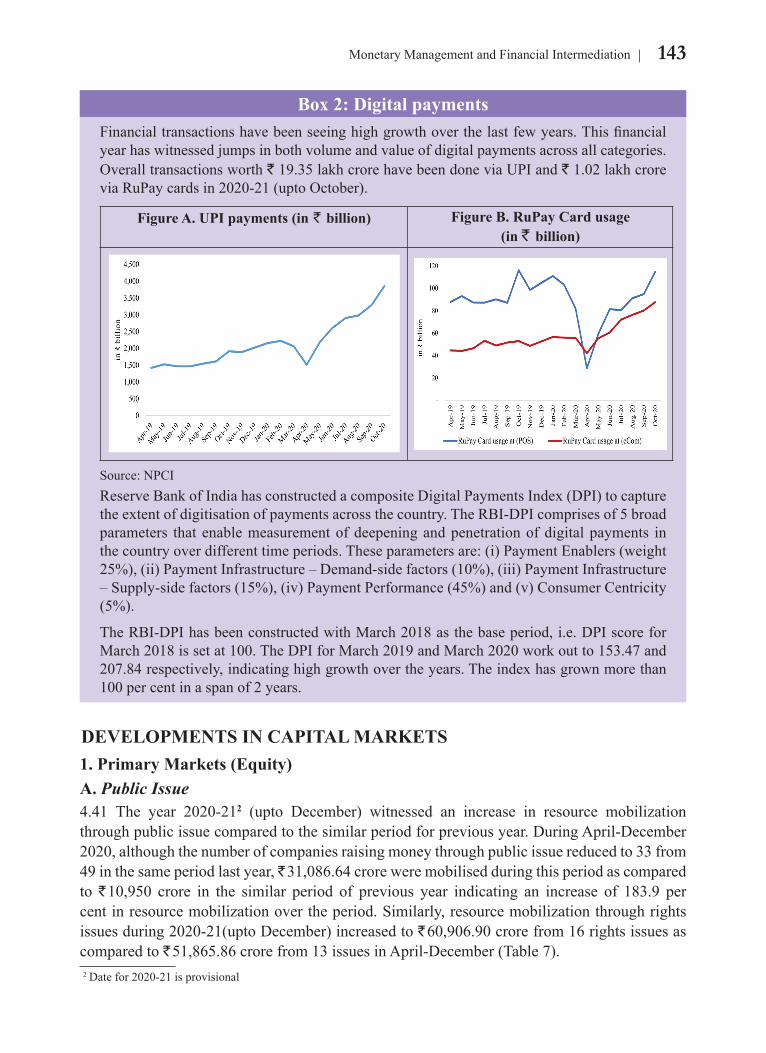
Box 2: Digital paymentsFinancialtransactionshavebeenseeinghighgrowthoverthelastfewyears.Thisfinancialyearhaswitnessedjumpsinbothvolumeandvalueofdigitalpaymentsacrossallcategories.Overall transactions worth `19.35lakhcrorehavebeendoneviaUPIand` 1.02 lakh crore viaRuPaycardsin2020-21(uptoOctober).
Figure A. UPI payments (in ` billion) Figure B. RuPay Card usage (in ` billion)
Source:NPCIReserveBankofIndiahasconstructedacompositeDigitalPaymentsIndex(DPI)tocapturetheextentofdigitisationofpaymentsacrossthecountry.TheRBI-DPIcomprisesof5broadparameters thatenablemeasurementofdeepeningandpenetrationofdigitalpayments inthecountryoverdifferenttimeperiods.Theseparametersare:(i)PaymentEnablers(weight25%),(ii)PaymentInfrastructure–Demand-sidefactors(10%),(iii)PaymentInfrastructure–Supply-sidefactors(15%),(iv)PaymentPerformance(45%)and(v)ConsumerCentricity(5%).
TheRBI-DPIhasbeenconstructedwithMarch2018asthebaseperiod,i.e.DPIscoreforMarch2018issetat100.TheDPIforMarch2019andMarch2020workoutto153.47and207.84respectively,indicatinghighgrowthovertheyears.Theindexhasgrownmorethan100 per cent in a span of 2 years.
DEVELOPMENTS IN CAPITAL MARKETS1. Primary Markets (Equity)A. Public Issue4.41 The year 2020-212 (upto December) witnessed an increase in resource mobilizationthroughpublicissuecomparedtothesimilarperiodforpreviousyear.DuringApril-December2020,althoughthenumberofcompaniesraisingmoneythroughpublicissuereducedto33from49 in the same period last year, 31,086.64croreweremobilisedduringthisperiodascomparedto ` 10,950 crore in the similar period of previous year indicating an increase of 183.9 percentinresourcemobilizationovertheperiod.Similarly,resourcemobilizationthroughrightsissuesduring2020-21(uptoDecember)increasedto` 60,906.90crorefrom16rightsissuesascompared to ` 51,865.86crorefrom13issuesinApril-December(Table7). 2 Date for 2020-21 is provisional
144 Economic Survey 2020-21 Volume 1
Table 7: Primary Market Resource Mobilization through Public and Rights Issues
Issue Type2019-20 (upto December) 2020-21 (upto December)
No. of IssuesAmount (` crore)
No. of IssuesAmount (` crore)
PublicIssue(Equity) 49 10,949.99 33 31,086.64
RightsIssue(Equity) 13 51,865.86 16 60,906.90
TotalPublicIssue 62 62,815.85 49 91,993.54
Source:BSE,NSEandSEBI
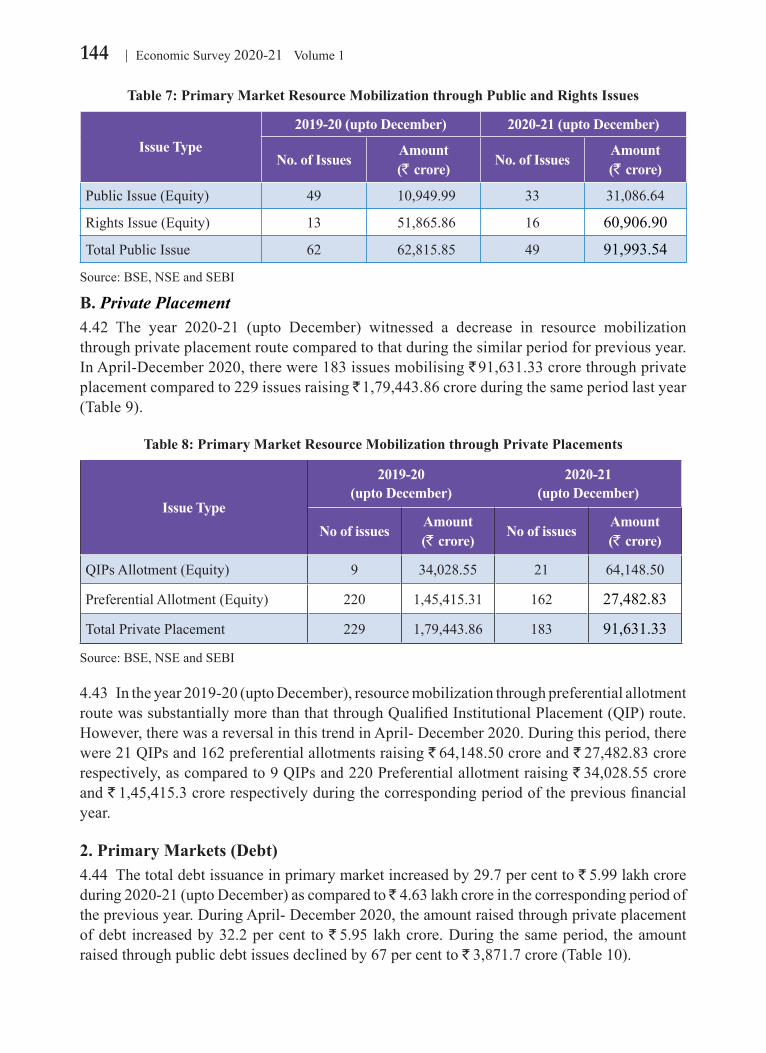
B. Private Placement 4.42 The year 2020-21 (upto December) witnessed a decrease in resource mobilizationthroughprivateplacementroutecomparedtothatduringthesimilarperiodforpreviousyear.InApril-December2020,therewere183issuesmobilising` 91,631.33crorethroughprivateplacementcomparedto229issuesraising` 1,79,443.86croreduringthesameperiodlastyear(Table 9).
Table 8: Primary Market Resource Mobilization through Private Placements
Issue Type
2019-20 (upto December)
2020-21 (upto December)
No of issuesAmount (` crore)
No of issuesAmount (` crore)
QIPsAllotment(Equity) 9 34,028.55 21 64,148.50
PreferentialAllotment(Equity) 220 1,45,415.31 162 27,482.83
Total Private Placement 229 1,79,443.86 183 91,631.33
Source:BSE,NSEandSEBI
4.43 Intheyear2019-20(uptoDecember),resourcemobilizationthroughpreferentialallotmentroutewassubstantiallymorethanthatthroughQualifiedInstitutionalPlacement(QIP)route.However,therewasareversalinthistrendinApril-December2020.Duringthisperiod,therewere21QIPsand162preferentialallotmentsraising` 64,148.50croreand` 27,482.83crorerespectively,ascomparedto9QIPsand220Preferentialallotmentraising` 34,028.55croreand ` 1,45,415.3crorerespectivelyduringthecorrespondingperiodofthepreviousfinancialyear.
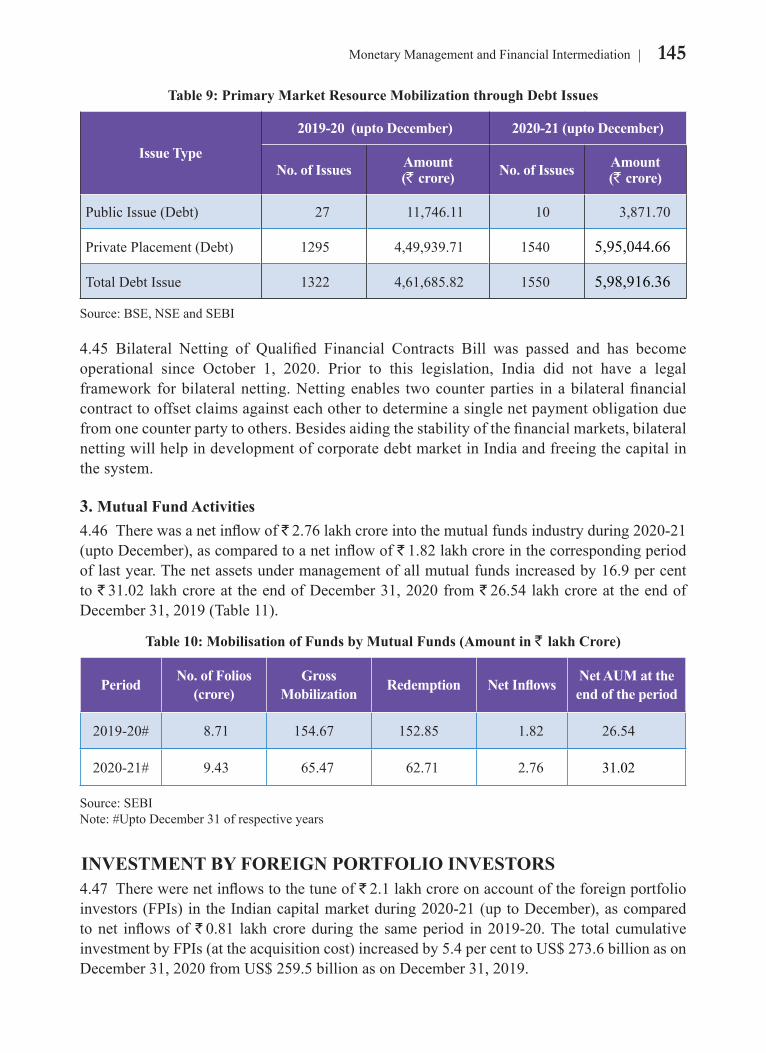
2. Primary Markets (Debt)4.44 Thetotaldebtissuanceinprimarymarketincreasedby29.7percentto` 5.99lakhcroreduring2020-21(uptoDecember)ascomparedto 4.63lakhcroreinthecorrespondingperiodofthepreviousyear.DuringApril-December2020,theamountraisedthroughprivateplacementof debt increased by 32.2 per cent to ` 5.95 lakhcrore.During thesameperiod, theamountraisedthroughpublicdebtissuesdeclinedby67percentto` 3,871.7crore(Table10).
145Monetary Management and Financial Intermediation
Table 9: Primary Market Resource Mobilization through Debt Issues
Issue Type
2019-20 (upto December) 2020-21 (upto December)
No. of Issues Amount (` crore) No. of Issues Amount
(` crore)
PublicIssue(Debt) 27 11,746.11 10 3,871.70
Private Placement (Debt) 1295 4,49,939.71 1540 5,95,044.66
TotalDebtIssue 1322 4,61,685.82 1550 5,98,916.36
Source:BSE,NSEandSEBI
4.45 Bilateral Netting of Qualified Financial Contracts Bill was passed and has becomeoperational since October 1, 2020. Prior to this legislation, India did not have a legalframeworkforbilateralnetting.Nettingenables twocounterparties inabilateralfinancialcontracttooffsetclaimsagainsteachothertodetermineasinglenetpaymentobligationduefromonecounterpartytoothers.Besidesaidingthestabilityofthefinancialmarkets,bilateralnettingwillhelpindevelopmentofcorporatedebtmarketinIndiaandfreeingthecapitalinthe system.
3. Mutual Fund Activities4.46 Therewasanetinflowof` 2.76lakhcroreintothemutualfundsindustryduring2020-21(uptoDecember),ascomparedtoanetinflowof` 1.82lakhcroreinthecorrespondingperiodoflastyear.Thenetassetsundermanagementofallmutualfundsincreasedby16.9percentto ` 31.02lakhcroreat theendofDecember31,2020from` 26.54lakhcroreat theendofDecember 31, 2019 (Table 11).
Table 10: Mobilisation of Funds by Mutual Funds (Amount in ` lakh Crore)
Period No. of Folios (crore)
Gross Mobilization Redemption Net Inflows Net AUM at the
end of the period
2019-20# 8.71 154.67 152.85 1.82 26.54
2020-21# 9.43 65.47 62.71 2.76 31.02
Source:SEBINote:#UptoDecember31ofrespectiveyears
INVESTMENT BY FOREIGN PORTFOLIO INVESTORS 4.47 Therewerenetinflowstothetuneof` 2.1lakhcroreonaccountoftheforeignportfolioinvestors(FPIs)intheIndiancapitalmarketduring2020-21(uptoDecember),ascomparedtonet inflowsof` 0.81 lakhcroreduring the sameperiod in2019-20.The total cumulativeinvestmentbyFPIs(attheacquisitioncost)increasedby5.4percenttoUS$273.6billionasonDecember31,2020fromUS$259.5billionasonDecember31,2019.
146 Economic Survey 2020-21 Volume 1
Table 11: Investment by Foreign Portfolio Investors
Period
Gross Purchase Gross Sales Net
InvestmentNet
InvestmentCumulative Net
Investment
(` crore) (US $ mn.)
2019-20# 13,79,888 12,99,141 80,746 11,465 2,59,581
2020-21# 16,65,483 14,54,050 2,11,433 28,543 2,73,618
Source:NSDLNote:#UptoDecember31ofrespectiveyears
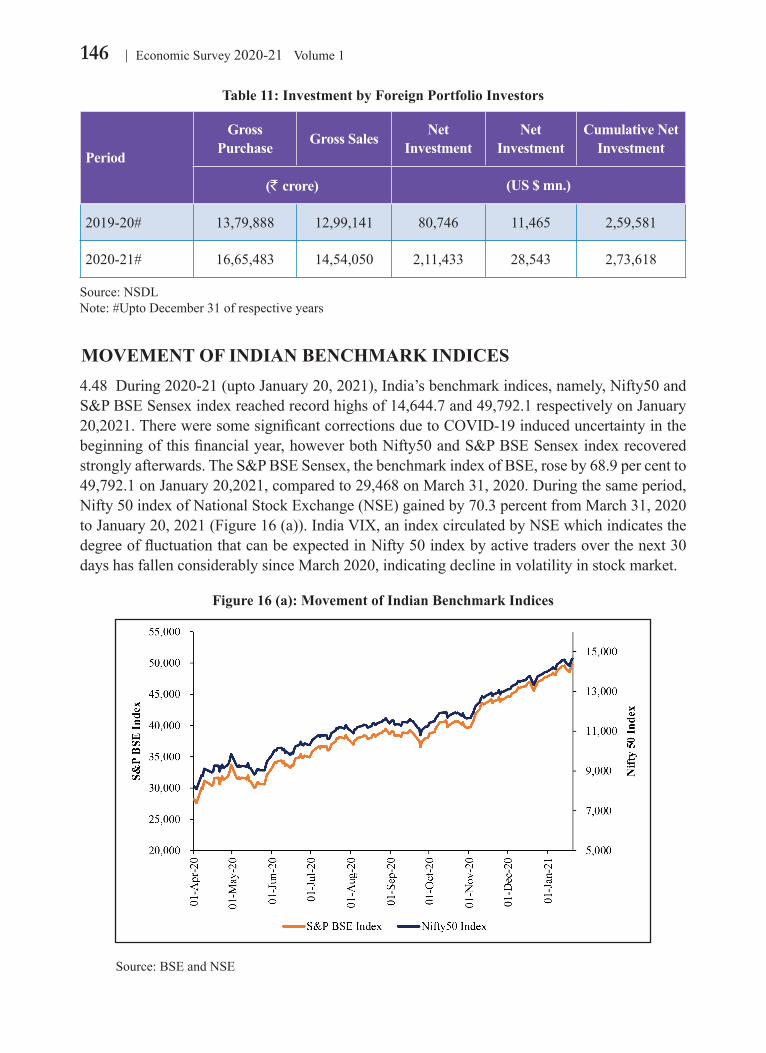
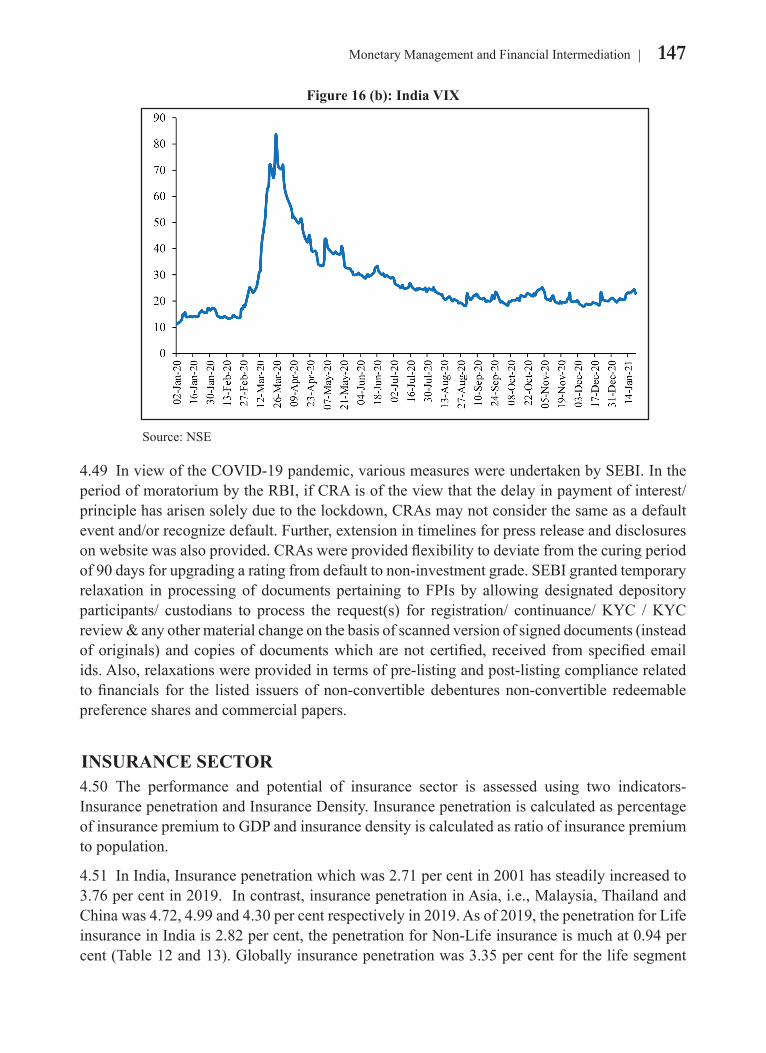
MOVEMENT OF INDIAN BENCHMARK INDICES4.48 During2020-21(uptoJanuary20,2021),India’sbenchmarkindices,namely,Nifty50andS&PBSESensexindexreachedrecordhighsof14,644.7and49,792.1respectivelyonJanuary20,2021.ThereweresomesignificantcorrectionsduetoCOVID-19induceduncertaintyinthebeginningofthisfinancialyear,howeverbothNifty50andS&PBSESensexindexrecoveredstronglyafterwards.TheS&PBSESensex,thebenchmarkindexofBSE,roseby68.9percentto49,792.1onJanuary20,2021,comparedto29,468onMarch31,2020.Duringthesameperiod,Nifty50indexofNationalStockExchange(NSE)gainedby70.3percentfromMarch31,2020toJanuary20,2021(Figure16(a)).IndiaVIX,anindexcirculatedbyNSEwhichindicatesthedegreeoffluctuationthatcanbeexpectedinNifty50indexbyactivetradersoverthenext30dayshasfallenconsiderablysinceMarch2020,indicatingdeclineinvolatilityinstockmarket.
Figure 16 (a): Movement of Indian Benchmark Indices
Source:BSEandNSE
147Monetary Management and Financial Intermediation
Figure 16 (b): India VIX
Source:NSE
4.49 InviewoftheCOVID-19pandemic,variousmeasureswereundertakenbySEBI.IntheperiodofmoratoriumbytheRBI,ifCRAisoftheviewthatthedelayinpaymentofinterest/principlehasarisensolelyduetothelockdown,CRAsmaynotconsiderthesameasadefaulteventand/orrecognizedefault.Further,extensionintimelinesforpressreleaseanddisclosuresonwebsitewasalsoprovided.CRAswereprovidedflexibilitytodeviatefromthecuringperiodof90daysforupgradingaratingfromdefaulttonon-investmentgrade.SEBIgrantedtemporaryrelaxation inprocessingof documents pertaining toFPIs by allowingdesignateddepositoryparticipants/ custodians to process the request(s) for registration/ continuance/KYC /KYCreview&anyothermaterialchangeonthebasisofscannedversionofsigneddocuments(insteadoforiginals)andcopiesofdocumentswhicharenotcertified, receivedfromspecifiedemailids.Also,relaxationswereprovidedintermsofpre-listingandpost-listingcompliancerelatedtofinancials for the listed issuersofnon-convertibledebenturesnon-convertible redeemablepreference shares and commercial papers.
INSURANCE SECTOR4.50 The performance and potential of insurance sector is assessed using two indicators-InsurancepenetrationandInsuranceDensity.InsurancepenetrationiscalculatedaspercentageofinsurancepremiumtoGDPandinsurancedensityiscalculatedasratioofinsurancepremiumtopopulation.
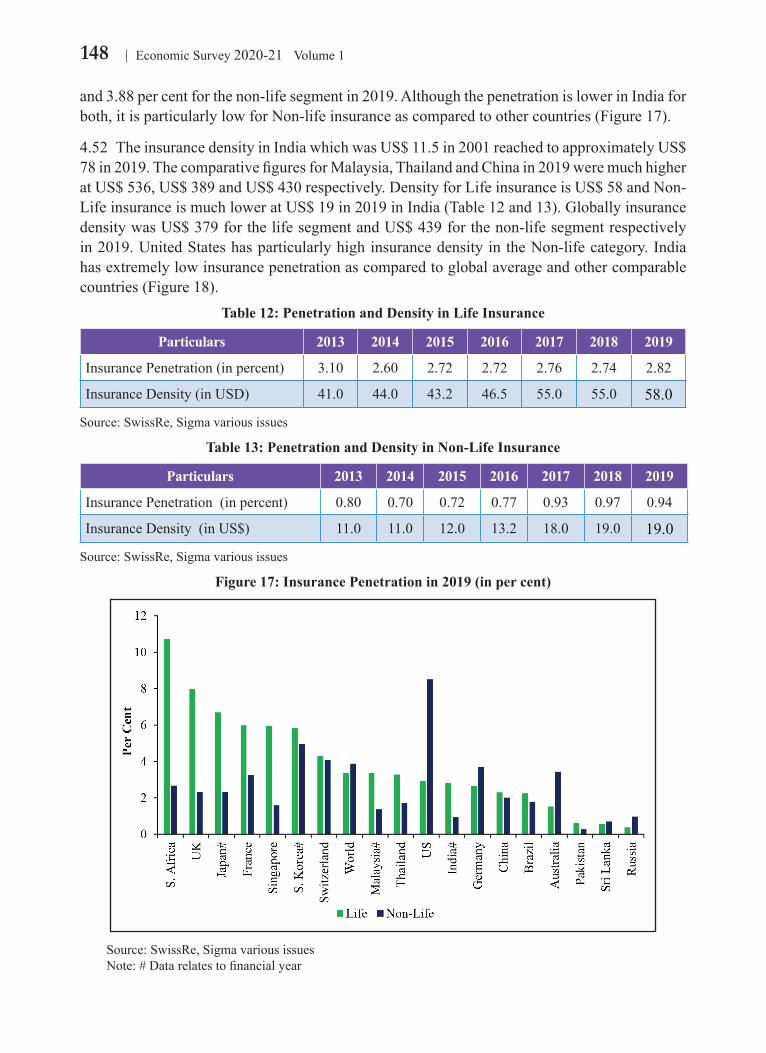
4.51 InIndia,Insurancepenetrationwhichwas2.71percentin2001hassteadilyincreasedto3.76percentin2019.Incontrast,insurancepenetrationinAsia,i.e.,Malaysia,ThailandandChinawas4.72,4.99and4.30percentrespectivelyin2019.Asof2019,thepenetrationforLifeinsuranceinIndiais2.82percent,thepenetrationforNon-Lifeinsuranceismuchat0.94percent(Table12and13).Globallyinsurancepenetrationwas3.35percentforthelifesegment
148 Economic Survey 2020-21 Volume 1
and3.88percentforthenon-lifesegmentin2019.AlthoughthepenetrationislowerinIndiaforboth,itisparticularlylowforNon-lifeinsuranceascomparedtoothercountries(Figure17).
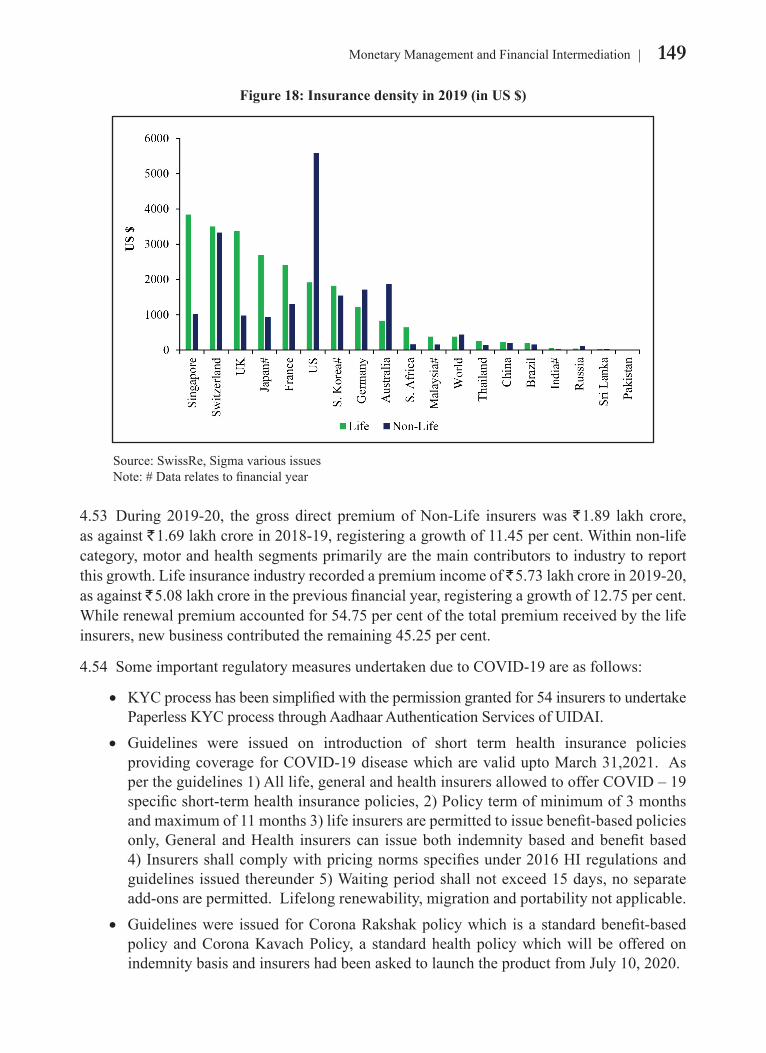
4.52 TheinsurancedensityinIndiawhichwasUS$11.5in2001reachedtoapproximatelyUS$78in2019.ThecomparativefiguresforMalaysia,ThailandandChinain2019weremuchhigheratUS$536,US$389andUS$430respectively.DensityforLifeinsuranceisUS$58andNon-LifeinsuranceismuchloweratUS$19in2019inIndia(Table12and13).GloballyinsurancedensitywasUS$379forthelifesegmentandUS$439forthenon-lifesegmentrespectivelyin2019.UnitedStateshasparticularlyhighinsurancedensityintheNon-lifecategory.Indiahasextremelylowinsurancepenetrationascomparedtoglobalaverageandothercomparablecountries(Figure18).
Table 12: Penetration and Density in Life Insurance
Particulars 2013 2014 2015 2016 2017 2018 2019
InsurancePenetration(inpercent) 3.10 2.60 2.72 2.72 2.76 2.74 2.82
InsuranceDensity(inUSD) 41.0 44.0 43.2 46.5 55.0 55.0 58.0
Source:SwissRe,Sigmavariousissues
Table 13: Penetration and Density in Non-Life Insurance
Particulars 2013 2014 2015 2016 2017 2018 2019
InsurancePenetration(inpercent) 0.80 0.70 0.72 0.77 0.93 0.97 0.94
InsuranceDensity(inUS$) 11.0 11.0 12.0 13.2 18.0 19.0 19.0
Source:SwissRe,Sigmavariousissues
Figure 17: Insurance Penetration in 2019 (in per cent)
Source:SwissRe,Sigmavariousissues Note:#Datarelatestofinancialyear
149Monetary Management and Financial Intermediation
Figure 18: Insurance density in 2019 (in US $)
Source:SwissRe,Sigmavariousissues Note:#Datarelatestofinancialyear
4.53 During2019-20, thegross direct premiumofNon-Life insurerswas` 1.89 lakh crore, asagainst` 1.69lakhcrorein2018-19,registeringagrowthof11.45percent.Withinnon-lifecategory,motorandhealthsegmentsprimarilyarethemaincontributorstoindustrytoreportthisgrowth.Lifeinsuranceindustryrecordedapremiumincomeof 5.73lakhcrorein2019-20,asagainst` 5.08lakhcroreinthepreviousfinancialyear,registeringagrowthof12.75percent.Whilerenewalpremiumaccountedfor54.75percentofthetotalpremiumreceivedbythelifeinsurers,newbusinesscontributedtheremaining45.25percent.
4.54 SomeimportantregulatorymeasuresundertakenduetoCOVID-19areasfollows:
• KYCprocesshasbeensimplifiedwiththepermissiongrantedfor54insurerstoundertakePaperlessKYCprocessthroughAadhaarAuthenticationServicesofUIDAI.
• Guidelines were issued on introduction of short term health insurance policiesprovidingcoverageforCOVID-19diseasewhicharevaliduptoMarch31,2021. Aspertheguidelines1)Alllife,generalandhealthinsurersallowedtoofferCOVID–19specificshort-termhealthinsurancepolicies,2)Policytermofminimumof3monthsandmaximumof11months3)lifeinsurersarepermittedtoissuebenefit-basedpoliciesonly,GeneralandHealth insurerscan issueboth indemnitybasedandbenefitbased4)Insurersshallcomplywithpricingnormsspecifiesunder2016HIregulationsandguidelinesissuedthereunder5)Waitingperiodshallnotexceed15days,noseparateadd-onsarepermitted.Lifelongrenewability,migrationandportabilitynotapplicable.
• Guidelineswere issued forCoronaRakshakpolicywhich isastandardbenefit-basedpolicyandCoronaKavachPolicy, a standardhealthpolicywhichwillbeofferedonindemnitybasisandinsurershadbeenaskedtolaunchtheproductfromJuly10,2020.
150 Economic Survey 2020-21 Volume 1
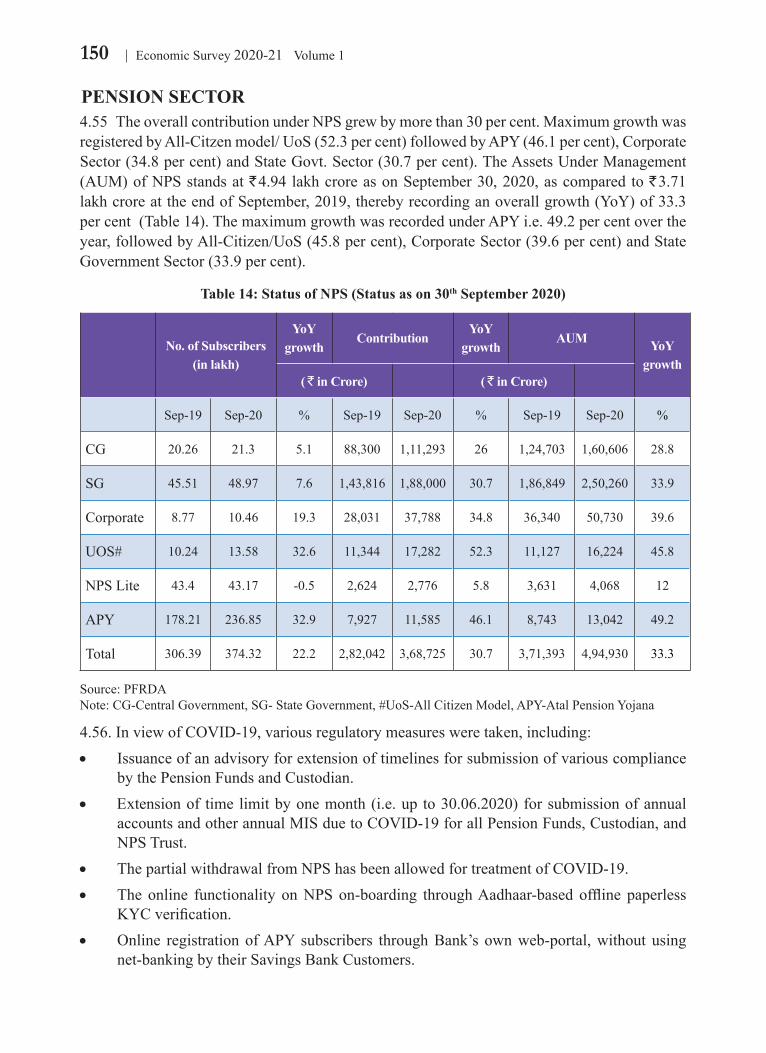
PENSION SECTOR4.55 TheoverallcontributionunderNPSgrewbymorethan30percent.MaximumgrowthwasregisteredbyAll-Citzenmodel/UoS(52.3percent)followedbyAPY(46.1percent),CorporateSector(34.8percent)andStateGovt.Sector(30.7percent).TheAssetsUnderManagement(AUM)ofNPSstandsat` 4.94 lakh crore as on September 30, 2020, as compared to ` 3.71 lakhcroreattheendofSeptember,2019,therebyrecordinganoverallgrowth(YoY)of33.3percent(Table14).ThemaximumgrowthwasrecordedunderAPYi.e.49.2percentovertheyear,followedbyAll-Citizen/UoS(45.8percent),CorporateSector(39.6percent)andStateGovernmentSector(33.9percent).
Table 14: Status of NPS (Status as on 30th September 2020)
No. of Subscribers(in lakh)
YoY growth
ContributionYoY
growthAUM YoY
growth( ` in Crore) ( ` in Crore)
Sep-19 Sep-20 % Sep-19 Sep-20 % Sep-19 Sep-20 %
CG 20.26 21.3 5.1 88,300 1,11,293 26 1,24,703 1,60,606 28.8
SG 45.51 48.97 7.6 1,43,816 1,88,000 30.7 1,86,849 2,50,260 33.9
Corporate 8.77 10.46 19.3 28,031 37,788 34.8 36,340 50,730 39.6
UOS# 10.24 13.58 32.6 11,344 17,282 52.3 11,127 16,224 45.8
NPSLite 43.4 43.17 -0.5 2,624 2,776 5.8 3,631 4,068 12
APY 178.21 236.85 32.9 7,927 11,585 46.1 8,743 13,042 49.2
Total 306.39 374.32 22.2 2,82,042 3,68,725 30.7 3,71,393 4,94,930 33.3
Source:PFRDANote:CG-CentralGovernment,SG-StateGovernment,#UoS-AllCitizenModel,APY-AtalPensionYojana
4.56.InviewofCOVID-19,variousregulatorymeasuresweretaken,including:• Issuanceofanadvisoryforextensionoftimelinesforsubmissionofvariouscompliance
bythePensionFundsandCustodian.• Extensionof timelimitbyonemonth(i.e.up to30.06.2020)forsubmissionofannual
accountsandotherannualMISduetoCOvID-19forallPensionFunds,Custodian,andNPSTrust.
• The partial withdrawal from NPS has been allowed for treatment of COvID-19.• Theonline functionality onNPSon-boarding throughAadhaar-based offline paperless
KYCverification.• Online registrationofAPYsubscribers throughBank’sownweb-portal,without using
net-bankingbytheirSavingsBankCustomers.
151Monetary Management and Financial Intermediation
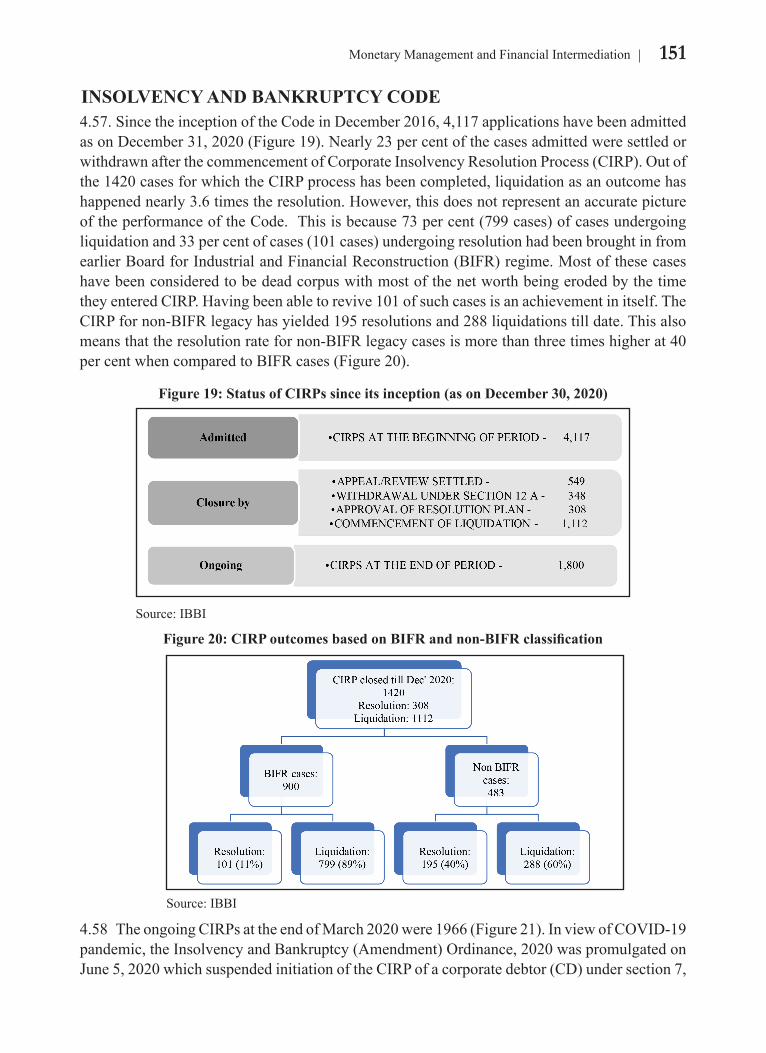
INSOLVENCY AND BANKRUPTCY CODE4.57.SincetheinceptionoftheCodeinDecember2016,4,117applicationshavebeenadmittedasonDecember31,2020(Figure19).Nearly23percentofthecasesadmittedweresettledorwithdrawnafterthecommencementofCorporateInsolvencyResolutionProcess(CIRP).Outofthe1420casesforwhichtheCIRPprocesshasbeencompleted,liquidationasanoutcomehashappenednearly3.6timestheresolution.However,thisdoesnotrepresentanaccuratepictureoftheperformanceoftheCode.Thisisbecause73percent(799cases)ofcasesundergoingliquidationand33percentofcases(101cases)undergoingresolutionhadbeenbroughtinfromearlierBoardforIndustrialandFinancialReconstruction(BIFR)regime.MostofthesecaseshavebeenconsideredtobedeadcorpuswithmostofthenetworthbeingerodedbythetimetheyenteredCIRP.Havingbeenabletorevive101ofsuchcasesisanachievementinitself.TheCIRPfornon-BIFRlegacyhasyielded195resolutionsand288liquidationstilldate.Thisalsomeansthattheresolutionratefornon-BIFRlegacycasesismorethanthreetimeshigherat40percentwhencomparedtoBIFRcases(Figure20).
Figure 19: Status of CIRPs since its inception (as on December 30, 2020)
Source:IBBI
Figure 20: CIRP outcomes based on BIFR and non-BIFR classification
Source:IBBI
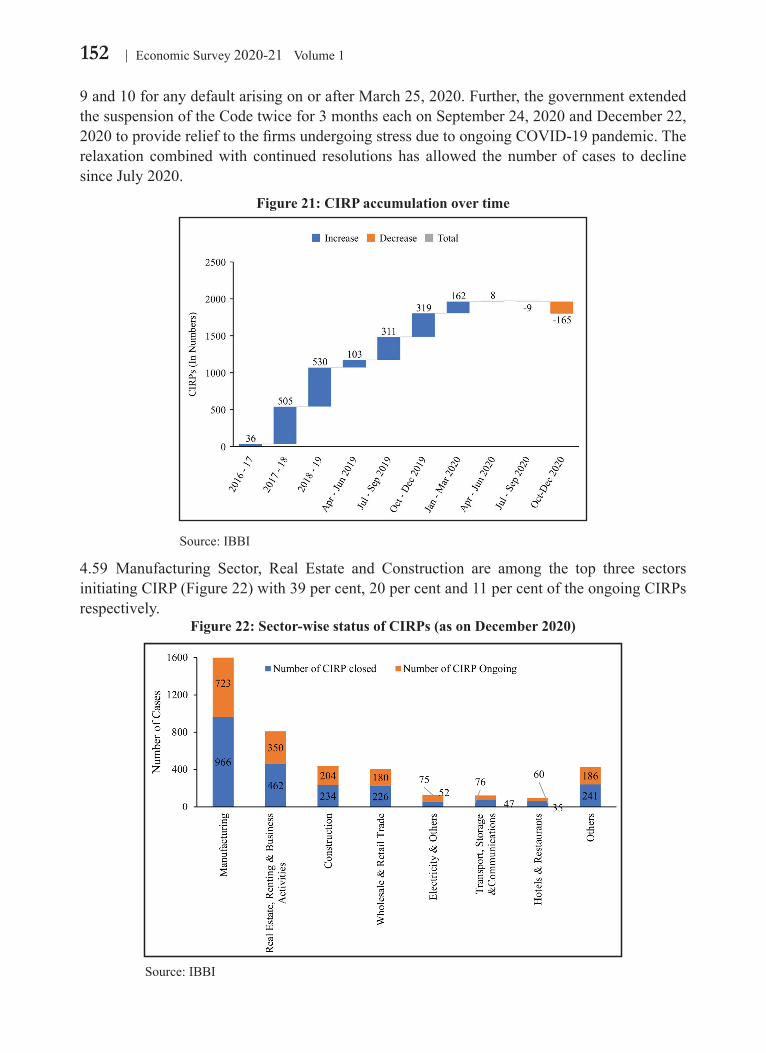
4.58 TheongoingCIRPsattheendofMarch2020were1966(Figure21).InviewofCOVID-19pandemic,theInsolvencyandBankruptcy(Amendment)Ordinance,2020waspromulgatedonJune5,2020whichsuspendedinitiationoftheCIRPofacorporatedebtor(CD)undersection7,
152 Economic Survey 2020-21 Volume 1
9and10foranydefaultarisingonorafterMarch25,2020.Further,thegovernmentextendedthesuspensionoftheCodetwicefor3monthseachonSeptember24,2020andDecember22,2020toproviderelieftothefirmsundergoingstressduetoongoingCOVID-19pandemic.Therelaxation combinedwith continued resolutions has allowed the number of cases to declinesinceJuly2020.
Figure 21: CIRP accumulation over time
Source:IBBI
4.59 Manufacturing Sector, Real Estate and Construction are among the top three sectorsinitiatingCIRP(Figure22)with39percent,20percentand11percentoftheongoingCIRPsrespectively.
Figure 22: Sector-wise status of CIRPs (as on December 2020)
Source:IBBI
153Monetary Management and Financial Intermediation
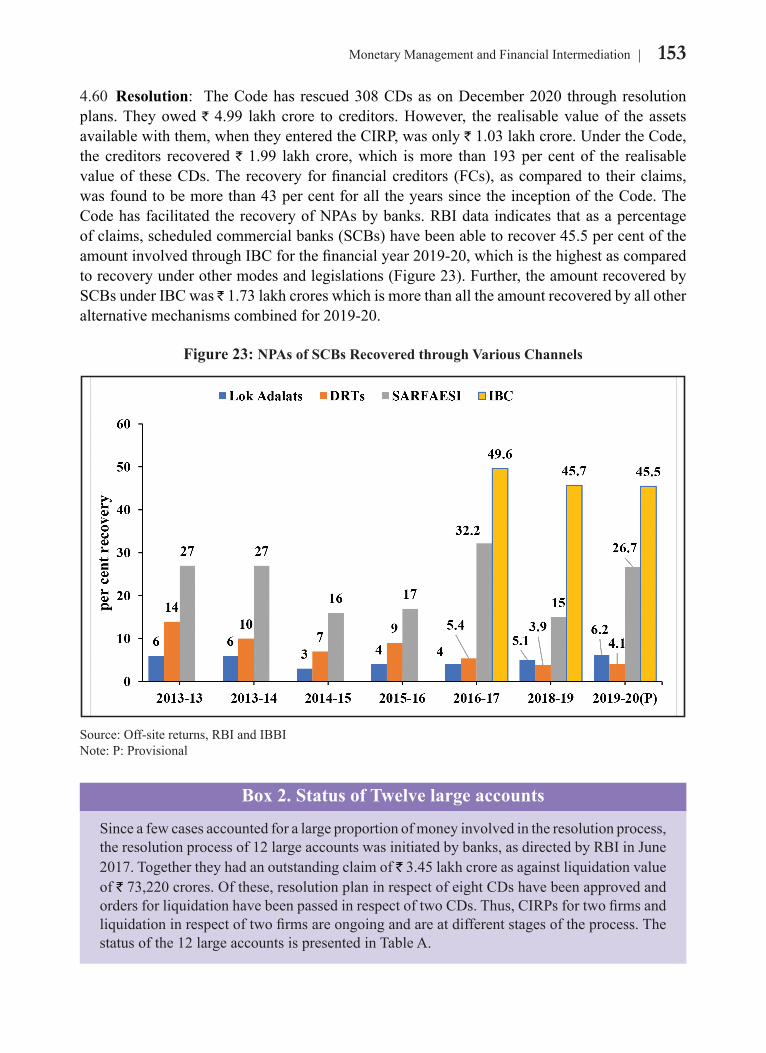
4.60 Resolution: TheCodehas rescued308CDsasonDecember2020 throughresolutionplans. They owed ` 4.99 lakhcrore to creditors.However, the realisablevalueof theassetsavailable with them, when they entered the CIRP, was only `1.03lakhcrore.UndertheCode,the creditors recovered ` 1.99 lakh crore, which is more than 193 per cent of the realisable valueof theseCDs.The recovery forfinancialcreditors (FCs),ascompared to theirclaims,wasfoundtobemorethan43percentforalltheyearssincetheinceptionoftheCode.TheCodehasfacilitatedtherecoveryofNPAsbybanks.RBIdata indicates thatasapercentageofclaims,scheduledcommercialbanks(SCBs)havebeenabletorecover45.5percentoftheamountinvolvedthroughIBCforthefinancialyear2019-20,whichisthehighestascomparedtorecoveryunderothermodesandlegislations(Figure23).Further,theamountrecoveredbySCBsunderIBCwas 1.73lakhcroreswhichismorethanalltheamountrecoveredbyallotheralternative mechanisms combined for 2019-20.
Figure 23: NPAs of SCBs Recovered through Various Channels
Source:Off-sitereturns,RBIandIBBINote:P:Provisional
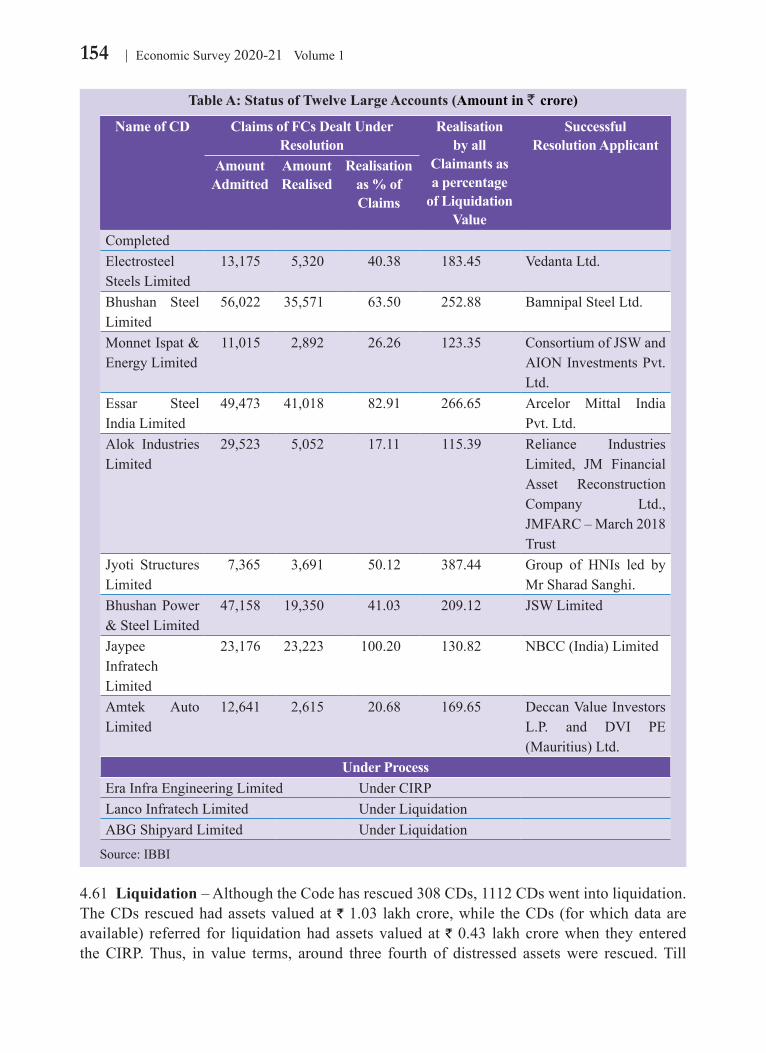
Box 2. Status of Twelve large accounts
Sinceafewcasesaccountedforalargeproportionofmoneyinvolvedintheresolutionprocess,theresolutionprocessof12largeaccountswasinitiatedbybanks,asdirectedbyRBIinJune2017.Togethertheyhadanoutstandingclaimof`3.45lakhcroreasagainstliquidationvalueof `73,220crores.Ofthese,resolutionplaninrespectofeightCDshavebeenapprovedandordersforliquidationhavebeenpassedinrespectoftwoCDs.Thus,CIRPsfortwofirmsandliquidationinrespectoftwofirmsareongoingandareatdifferentstagesoftheprocess.Thestatusofthe12largeaccountsispresentedinTableA.
154 Economic Survey 2020-21 Volume 1
Table A: Status of Twelve Large Accounts (Amount in ` crore)
Name of CD Claims of FCs Dealt Under Resolution
Realisation by all
Claimants as a percentage
of Liquidation Value
SuccessfulResolution Applicant
Amount Admitted
Amount Realised
Realisation as % of Claims
CompletedElectrosteelSteelsLimited
13,175 5,320 40.38 183.45 VedantaLtd.
Bhushan SteelLimited
56,022 35,571 63.50 252.88 BamnipalSteelLtd.
MonnetIspat&EnergyLimited
11,015 2,892 26.26 123.35 ConsortiumofJSWandAIONInvestmentsPvt.Ltd.
Essar SteelIndiaLimited
49,473 41,018 82.91 266.65 Arcelor Mittal IndiaPvt.Ltd.
Alok IndustriesLimited
29,523 5,052 17.11 115.39 Reliance IndustriesLimited, JM FinancialAsset ReconstructionCompany Ltd.,JMFARC–March2018Trust
Jyoti StructuresLimited
7,365 3,691 50.12 387.44 Group of HNIs led byMrSharadSanghi.
BhushanPower&SteelLimited
47,158 19,350 41.03 209.12 JSWLimited
JaypeeInfratech Limited
23,176 23,223 100.20 130.82 NBCC(India)Limited
Amtek AutoLimited
12,641 2,615 20.68 169.65 DeccanValueInvestorsL.P. and DVI PE(Mauritius)Ltd.
Under ProcessEraInfraEngineeringLimited UnderCIRPLancoInfratechLimited UnderLiquidationABGShipyardLimited UnderLiquidation
Source:IBBI
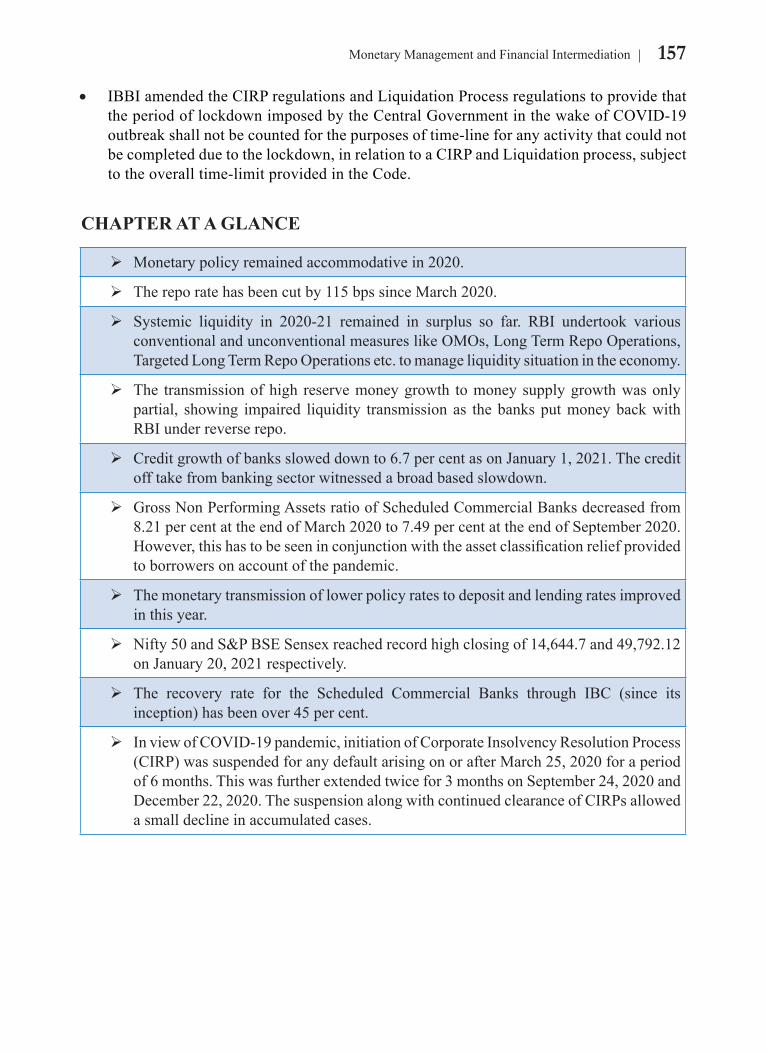
4.61 Liquidation–AlthoughtheCodehasrescued308CDs,1112CDswentintoliquidation.TheCDsrescuedhadassetsvaluedat` 1.03 lakh crore, while the CDs (for which data are available) referred for liquidationhadassetsvaluedat` 0.43 lakh crore when they entered theCIRP.Thus, in value terms, around three fourth of distressed assetswere rescued.Till
155Monetary Management and Financial Intermediation
December31,2020,181CDshavebeencompletelyliquidatedwhichhadoutstandingclaimsof `26,251crores,buttheassetsvaluedat`598crores.` 607croreswererealisedthroughtheliquidationofthesecompanies.
4.62 Time–The308CIRPs,whichhaveyielded resolutionplans by the endofDecember2020,tookonaverage441daysfortheconclusionoftheprocess.Similarly,the1112CIRPs,whichendedupinordersforliquidation,tookonaverage328daysfortheconclusion.Further,181liquidationprocesses,whichhaveclosedbysubmissionoffinalreportstillDecember31,2020, took on average 380 days for closure. Similarly, 352 voluntary liquidation processes,whichhaveclosedbysubmissionoffinalreports,tookonaverage370daysforclosure.
4.63 Cost–Outofthetotal308CIRPshaveyieldedresolutionplansuntilDecember2020,thecostdetailsareavailableinrespectof260CIRPs.Thecostworksoutonaverage0.79percentofliquidationvalueand0.42percentofresolutionvalue.
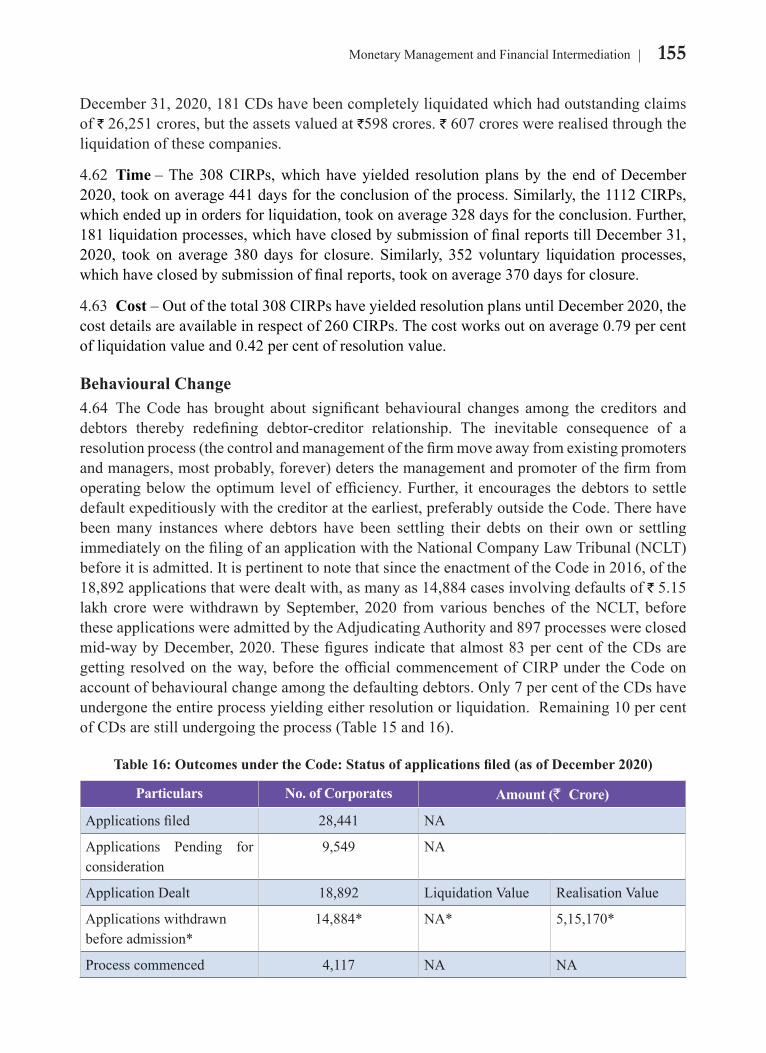
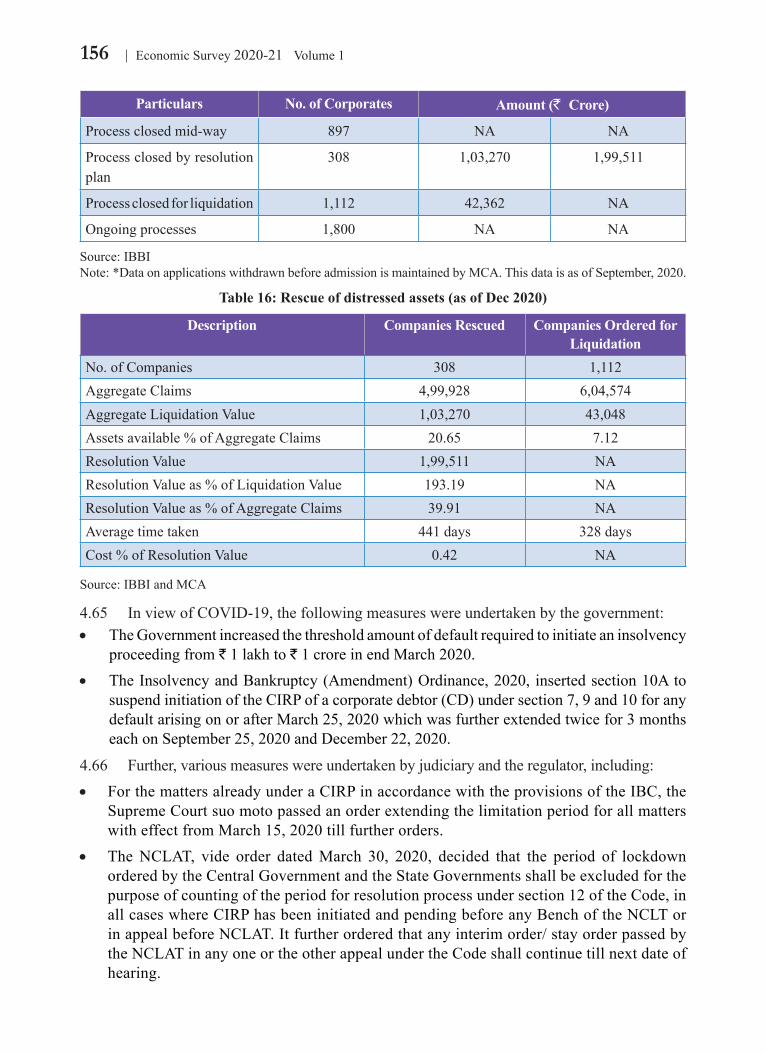
Behavioural Change4.64 TheCodehasbrought about significantbehavioural changes among the creditors anddebtors thereby redefining debtor-creditor relationship. The inevitable consequence of aresolutionprocess(thecontrolandmanagementofthefirmmoveawayfromexistingpromotersandmanagers,mostprobably,forever)detersthemanagementandpromoterofthefirmfromoperatingbelowtheoptimumlevelofefficiency.Further, itencouragesthedebtorstosettledefaultexpeditiouslywiththecreditorattheearliest,preferablyoutsidetheCode.Therehavebeenmany instanceswhere debtors have been settling their debts on their own or settlingimmediatelyonthefilingofanapplicationwiththeNationalCompanyLawTribunal(NCLT)before it is admitted. It is pertinent to note that since the enactment of the Code in 2016, of the 18,892applicationsthatweredealtwith,asmanyas14,884casesinvolvingdefaultsof`5.15lakhcrorewerewithdrawnbySeptember,2020 fromvariousbenchesof theNCLT,beforetheseapplicationswereadmittedbytheAdjudicatingAuthorityand897processeswereclosedmid-waybyDecember,2020.Thesefiguresindicatethatalmost83percentof theCDsaregettingresolvedon theway,before theofficialcommencementofCIRPunder theCodeonaccountofbehaviouralchangeamongthedefaultingdebtors.Only7percentoftheCDshaveundergonetheentireprocessyieldingeitherresolutionorliquidation.Remaining10percentofCDsarestillundergoingtheprocess(Table15and16).
Table 16: Outcomes under the Code: Status of applications filed (as of December 2020)
Particulars No. of Corporates Amount (` Crore)
Applicationsfiled 28,441 NA
Applications Pending forconsideration
9,549 NA
ApplicationDealt 18,892 LiquidationValue RealisationValue
Applicationswithdrawnbeforeadmission*
14,884* NA* 5,15,170*
Process commenced 4,117 NA NA
156 Economic Survey 2020-21 Volume 1
Particulars No. of Corporates Amount (` Crore)
Process closed mid-way 897 NA NA
Processclosedbyresolutionplan
308 1,03,270 1,99,511
Processclosedforliquidation 1,112 42,362 NA
Ongoingprocesses 1,800 NA NA
Source:IBBINote:*DataonapplicationswithdrawnbeforeadmissionismaintainedbyMCA.ThisdataisasofSeptember,2020.
Table 16: Rescue of distressed assets (as of Dec 2020)
Description Companies Rescued Companies Ordered for Liquidation
No. of Companies 308 1,112AggregateClaims 4,99,928 6,04,574AggregateLiquidationValue 1,03,270 43,048Assetsavailable%ofAggregateClaims 20.65 7.12ResolutionValue 1,99,511 NAResolutionValueas%ofLiquidationValue 193.19 NAResolutionValueas%ofAggregateClaims 39.91 NAAveragetimetaken 441 days 328 daysCost%ofResolutionValue 0.42 NA
Source:IBBIandMCA
4.65 InviewofCOVID-19,thefollowingmeasureswereundertakenbythegovernment:• TheGovernmentincreasedthethresholdamountofdefaultrequiredtoinitiateaninsolvency
proceedingfrom` 1 lakh to ` 1 crore in end March 2020.• TheInsolvencyandBankruptcy(Amendment)Ordinance,2020, insertedsection10Ato
suspendinitiationoftheCIRPofacorporatedebtor(CD)undersection7,9and10foranydefaultarisingonorafterMarch25,2020whichwasfurtherextendedtwicefor3monthseachonSeptember25,2020andDecember22,2020.
4.66 Further,variousmeasureswereundertakenbyjudiciaryandtheregulator,including:• ForthemattersalreadyunderaCIRPinaccordancewiththeprovisionsoftheIBC,the
SupremeCourtsuomotopassedanorderextendingthelimitationperiodforallmatterswitheffectfromMarch15,2020tillfurtherorders.
• TheNCLAT, vide order datedMarch 30, 2020, decided that the period of lockdownorderedbytheCentralGovernmentandtheStateGovernmentsshallbeexcludedforthepurposeofcountingoftheperiodforresolutionprocessundersection12oftheCode,inallcaseswhereCIRPhasbeeninitiatedandpendingbeforeanyBenchoftheNCLTorinappealbeforeNCLAT.Itfurtherorderedthatanyinterimorder/stayorderpassedbytheNCLATinanyoneortheotherappealundertheCodeshallcontinuetillnextdateofhearing.
157Monetary Management and Financial Intermediation
• IBBIamendedtheCIRPregulationsandLiquidationProcessregulationstoprovidethattheperiodoflockdownimposedbytheCentralGovernmentinthewakeofCOVID-19outbreakshallnotbecountedforthepurposesoftime-lineforanyactivitythatcouldnotbecompletedduetothelockdown,inrelationtoaCIRPandLiquidationprocess,subjectto the overall time-limit provided in the Code.
CHAPTER AT A GLANCE
Monetary policy remained accommodative in 2020.
Thereporatehasbeencutby115bpssinceMarch2020.
Systemic liquidity in 2020-21 remained in surplus so far. RBI undertook variousconventionalandunconventionalmeasureslikeOMOs,LongTermRepoOperations,TargetedLongTermRepoOperationsetc.tomanageliquiditysituationintheeconomy.
The transmissionofhigh reservemoneygrowth tomoneysupplygrowthwasonlypartial, showing impaired liquidity transmissionas thebanksputmoneybackwithRBIunderreverserepo.
Creditgrowthofbankssloweddownto6.7percentasonJanuary1,2021.Thecreditofftakefrombankingsectorwitnessedabroadbasedslowdown.
GrossNonPerformingAssetsratioofScheduledCommercialBanksdecreasedfrom8.21 per cent at the end of March 2020 to 7.49 per cent at the end of September 2020. However,thishastobeseeninconjunctionwiththeassetclassificationreliefprovidedtoborrowersonaccountofthepandemic.
Themonetarytransmissionoflowerpolicyratestodepositandlendingratesimprovedin this year.
Nifty50andS&PBSESensexreachedrecordhighclosingof14,644.7and49,792.12onJanuary20,2021respectively.
The recovery rate for the Scheduled Commercial Banks through IBC (since itsinception)hasbeenover45percent.
InviewofCOVID-19pandemic,initiationofCorporateInsolvencyResolutionProcess(CIRP)wassuspendedforanydefaultarisingonorafterMarch25,2020foraperiodof6months.Thiswasfurtherextendedtwicefor3monthsonSeptember24,2020andDecember22,2020.ThesuspensionalongwithcontinuedclearanceofCIRPsallowedasmalldeclineinaccumulatedcases.
158 Economic Survey 2020-21 Volume 1
ANNEXURE 1
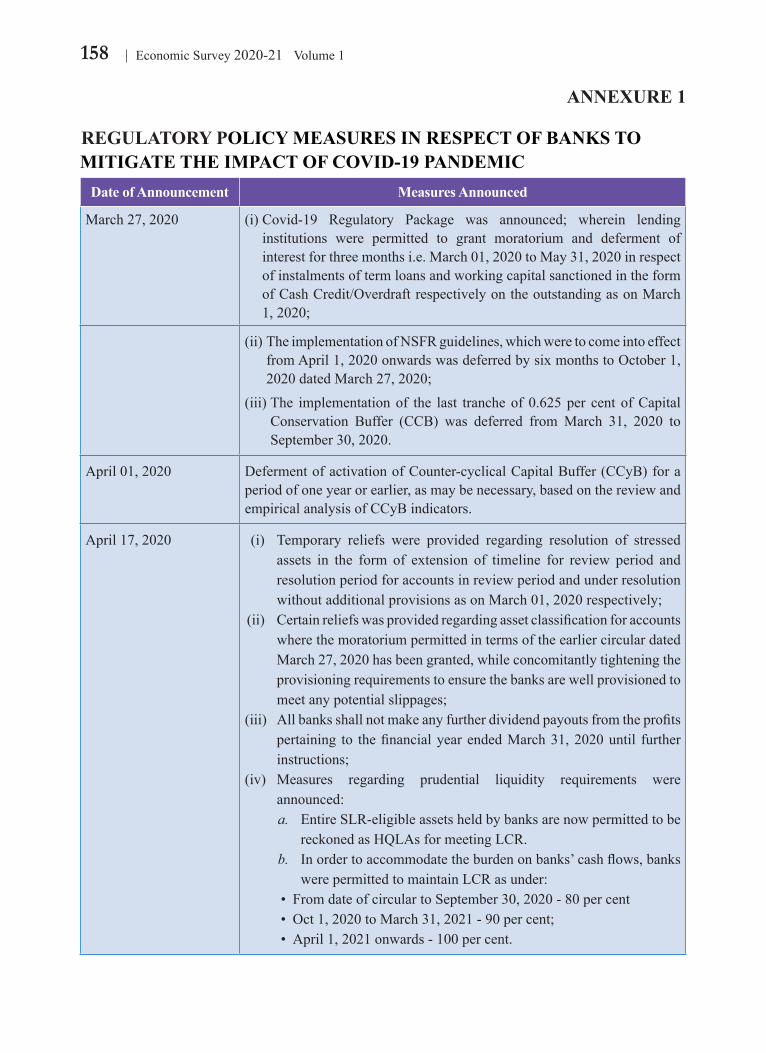
REGULATORY POLICY MEASURES IN RESPECT OF BANKS TO MITIGATE THE IMPACT OF COVID-19 PANDEMIC
Date of Announcement Measures Announced
March 27, 2020 (i)Covid-19 Regulatory Package was announced; wherein lendinginstitutions were permitted to grant moratorium and deferment ofinterest for three months i.e. March 01, 2020 to May 31, 2020 in respect ofinstalmentsoftermloansandworkingcapitalsanctionedintheformofCashCredit/OverdraftrespectivelyontheoutstandingasonMarch1,2020;
(ii)TheimplementationofNSFRguidelines,whichweretocomeintoeffectfromApril1,2020onwardswasdeferredbysixmonthstoOctober1,2020datedMarch27,2020;
(iii)The implementationof the last trancheof0.625per centofCapitalConservation Buffer (CCB) was deferred fromMarch 31, 2020 toSeptember 30, 2020.
April01,2020 DefermentofactivationofCounter-cyclicalCapitalBuffer(CCyB)foraperiod of one year or earlier, as may be necessary, based on the review and empirical analysis of CCyB indicators.
April17,2020 (i) Temporary reliefs were provided regarding resolution of stressedassets in the form of extension of timeline for review period and resolutionperiodforaccountsinreviewperiodandunderresolutionwithoutadditionalprovisionsasonMarch01,2020respectively;
(ii) CertainreliefswasprovidedregardingassetclassificationforaccountswherethemoratoriumpermittedintermsoftheearliercirculardatedMarch27,2020hasbeengranted,whileconcomitantlytighteningtheprovisioningrequirementstoensurethebanksarewellprovisionedtomeetanypotentialslippages;
(iii) Allbanksshallnotmakeanyfurtherdividendpayoutsfromtheprofitspertaining to thefinancialyearendedMarch31,2020until furtherinstructions;
(iv) Measures regarding prudential liquidity requirements wereannounced:
a. EntireSLR-eligibleassetsheldbybanksarenowpermittedtobereckonedasHQLAsformeetingLCR.
b. Inordertoaccommodatetheburdenonbanks’cashflows,bankswerepermittedtomaintainLCRasunder:
• FromdateofcirculartoSeptember30,2020-80percent • Oct1,2020toMarch31,2021-90percent; • April1,2021onwards-100percent.
159Monetary Management and Financial Intermediation
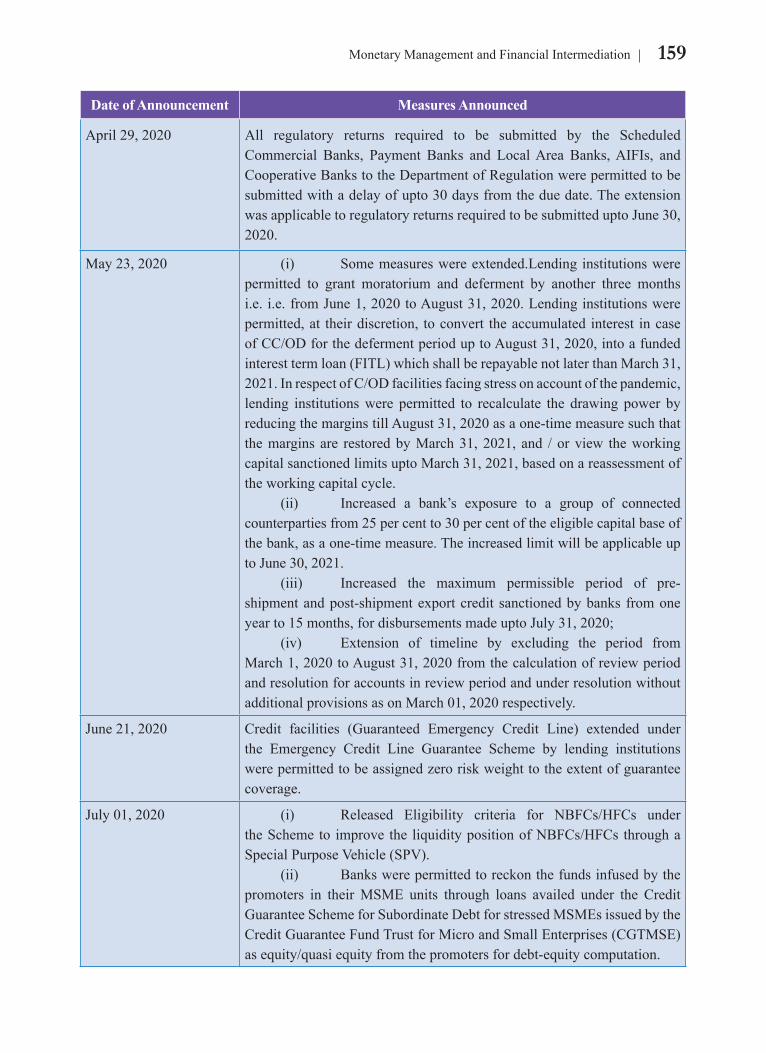
Date of Announcement Measures Announced
April29,2020 All regulatory returns required to be submitted by the ScheduledCommercial Banks, Payment Banks and LocalArea Banks,AIFIs, andCooperativeBankstotheDepartmentofRegulationwerepermittedtobesubmittedwithadelayofupto30daysfromtheduedate.TheextensionwasapplicabletoregulatoryreturnsrequiredtobesubmitteduptoJune30,2020.
May 23, 2020 (i) Somemeasureswereextended.Lendinginstitutionswerepermitted to grant moratorium and deferment by another three monthsi.e.i.e.fromJune1,2020toAugust31,2020.Lendinginstitutionswerepermitted,at theirdiscretion, toconvert theaccumulated interest incaseofCC/ODforthedefermentperioduptoAugust31,2020,intoafundedinteresttermloan(FITL)whichshallberepayablenotlaterthanMarch31,2021.InrespectofC/ODfacilitiesfacingstressonaccountofthepandemic,lending institutionswere permitted to recalculate the drawing power byreducingthemarginstillAugust31,2020asaone-timemeasuresuchthatthemargins are restoredbyMarch31,2021, and /orview theworkingcapitalsanctionedlimitsuptoMarch31,2021,basedonareassessmentoftheworkingcapitalcycle. (ii) Increased a bank’s exposure to a group of connectedcounterpartiesfrom25percentto30percentoftheeligiblecapitalbaseofthebank,asaone-timemeasure.TheincreasedlimitwillbeapplicableuptoJune30,2021. (iii) Increased the maximum permissible period of pre-shipment and post-shipment export credit sanctioned by banks from one yearto15months,fordisbursementsmadeuptoJuly31,2020; (iv) Extension of timeline by excluding the period fromMarch1,2020toAugust31,2020fromthecalculationofreviewperiodandresolutionforaccountsinreviewperiodandunderresolutionwithoutadditional provisions as on March 01, 2020 respectively.
June21,2020 Credit facilities (Guaranteed Emergency Credit Line) extended underthe Emergency Credit Line Guarantee Scheme by lending institutionswerepermittedtobeassignedzeroriskweighttotheextentofguaranteecoverage.
July01,2020 (i) Released Eligibility criteria for NBFCs/HFCs undertheSchemeto improve the liquiditypositionofNBFCs/HFCsthroughaSpecialPurposeVehicle(SPV). (ii) Bankswerepermittedtoreckonthefundsinfusedbythepromoters in theirMSME units through loans availed under the CreditGuaranteeSchemeforSubordinateDebtforstressedMSMEsissuedbytheCreditGuaranteeFundTrustforMicroandSmallEnterprises(CGTMSE)asequity/quasiequityfromthepromotersfordebt-equitycomputation.
160 Economic Survey 2020-21 Volume 1
Date of Announcement Measures Announced
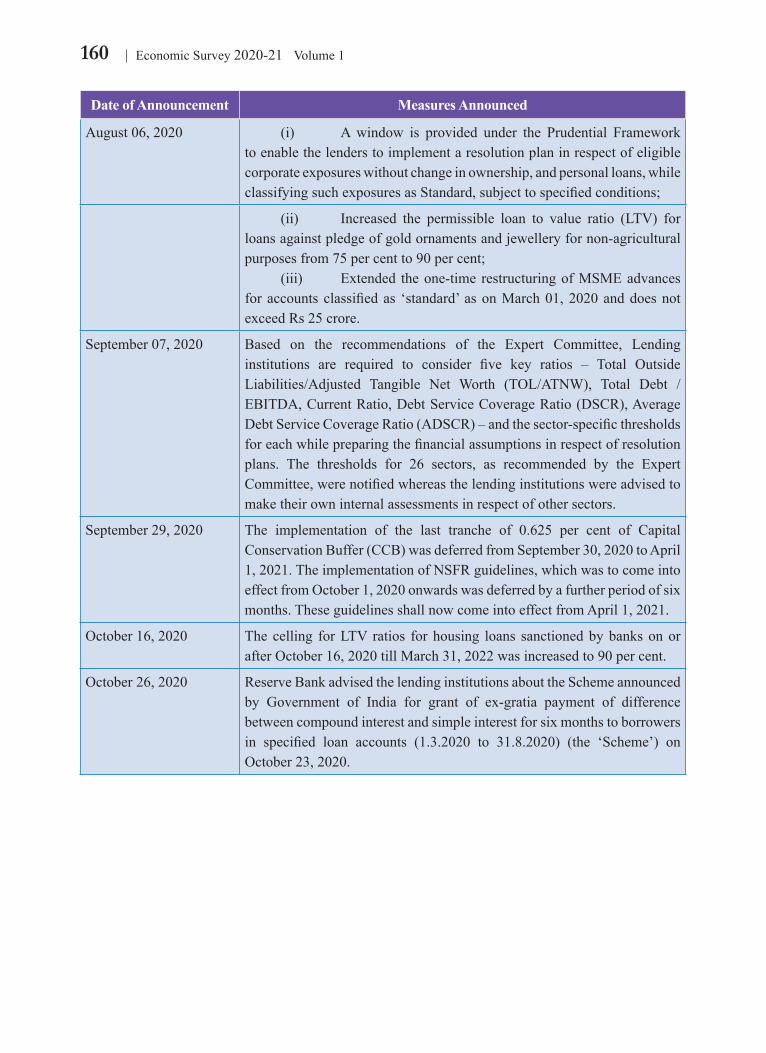
August06,2020 (i) Awindow is provided under the Prudential Frameworktoenablethelenderstoimplementaresolutionplaninrespectofeligiblecorporateexposureswithoutchangeinownership,andpersonalloans,whileclassifyingsuchexposuresasStandard,subjecttospecifiedconditions;
(ii) Increased the permissible loan to value ratio (LTV) forloansagainstpledgeofgoldornamentsandjewelleryfornon-agriculturalpurposesfrom75percentto90percent; (iii) Extended theone-time restructuringofMSMEadvancesforaccountsclassifiedas ‘standard’asonMarch01,2020anddoesnotexceedRs25crore.
September 07, 2020 Based on the recommendations of the Expert Committee, Lendinginstitutions are required to consider five key ratios – Total OutsideLiabilities/Adjusted Tangible Net Worth (TOL/ATNW), Total Debt /EBITDA,CurrentRatio,DebtServiceCoverageRatio(DSCR),AverageDebtServiceCoverageRatio(ADSCR)–andthesector-specificthresholdsforeachwhilepreparingthefinancialassumptionsinrespectofresolutionplans. The thresholds for 26 sectors, as recommended by the ExpertCommittee,werenotifiedwhereasthelendinginstitutionswereadvisedtomake their own internal assessments in respect of other sectors.
September 29, 2020 The implementation of the last tranche of 0.625 per cent of CapitalConservationBuffer(CCB)wasdeferredfromSeptember30,2020toApril1,2021.TheimplementationofNSFRguidelines,whichwastocomeintoeffectfromOctober1,2020onwardswasdeferredbyafurtherperiodofsixmonths.TheseguidelinesshallnowcomeintoeffectfromApril1,2021.
October 16, 2020 Thecelling forLTV ratios forhousing loans sanctionedbybanksonorafter October 16, 2020 till March 31, 2022 was increased to 90 per cent.
October 26, 2020 ReserveBankadvisedthelendinginstitutionsabouttheSchemeannouncedby Government of India for grant of ex-gratia payment of differencebetweencompoundinterestandsimpleinterestforsixmonthstoborrowersin specified loan accounts (1.3.2020 to 31.8.2020) (the ‘Scheme’) onOctober 23, 2020.