monetary policy, central banks, and money...
TRANSCRIPT

Monetary Policy, Central Banks,and Money Markets
Topic 5
1 Macroeconomics 309 - Lecture 5

Macroeconomics 309 - Lecture 52
Goals of Topic 5Goals of the Lecture
Introduction to the Money Market.
Money Supply: Central Bank and the Banking sector.
Role of the Banking System and Monetary Policy.
Money Demand: Portfolio Decision (how to allocate wealth across asset markets).
Derive the Equilibrium on the Asset market - derive LM curve. Equilibrium in the money MKT. (It is going to help us pin down the price level in the economy – when we put everything together in Topic 6).
Macroeconomics 309 - Lecture 53
Definition of Money
We define Money as the Asset Used To Make Payments.
Money is a medium of exchange. (Legal tender in many countries – by law it cannot be refused in honoring a payment). Facilitates transactions (think of difficulties with barter).
Money is a unit of account. (Allows to compare heterogeneous goods and services).
Money is a store of value. (Allows intertemporal transfers of resources).
Macroeconomics 309 - Lecture 54
Definition of Liquidity
I would define liquidity as the cost –both in expenses and in time- of buying and selling an asset for cash.
William Dudley, President of the New York Federal Reserve, SIFMA Speech 9/30/2015

Macroeconomics 309 - Lecture 55
Monetary Aggregates
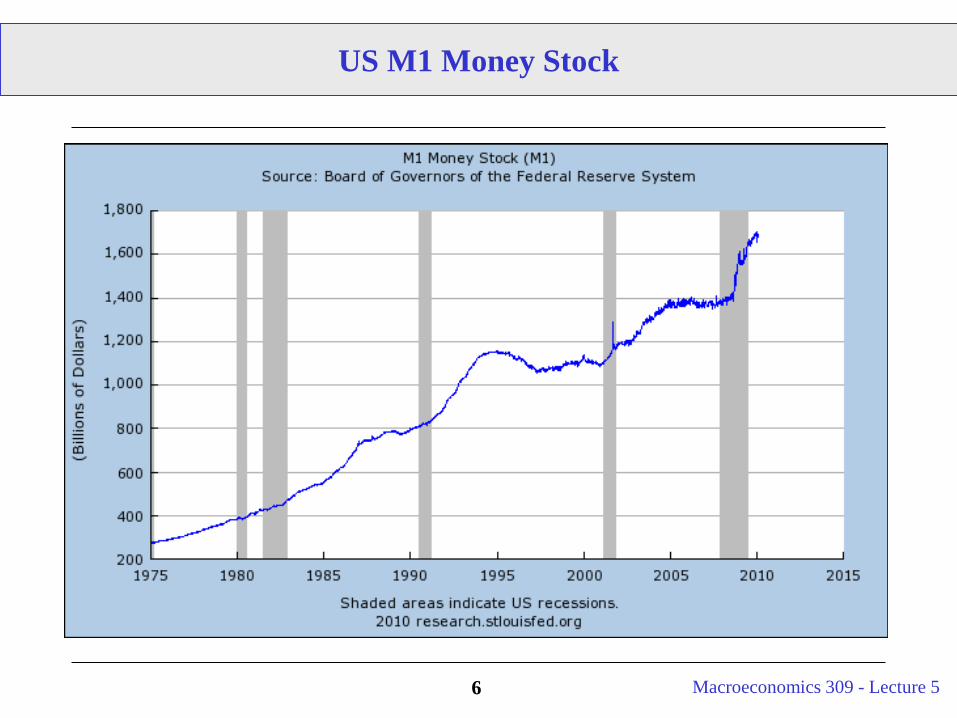
We measure Money in the economy through Monetary Aggregates.
They are the official measure of the money stock.
M1 = the most liquid aggregate. Includes Cash and Checking Accounts.
M2 = the second most liquid aggregate. Includes M1 and other less liquid assets like Money Market Instruments and some types of Saving Deposits.
Generally when we talk about Money we will mean M1.
Macroeconomics 309 - Lecture 56
US M1 Money Stock
Macroeconomics 309 - Lecture 57
Money Supply: Basics
The amount of money available in the economy is determined by the Central Bank (CB). The CB is the administrative unit of government in charge of monetary policy (setting the Money Supply).
The intuition of how the supply of money is directly affected by the CB:
To increase the money supply the central bank acquires certain goods or titles (e.g. government bonds) from a market to which the public has access (hence an OPEN MARKET) in exchange of currency (think of printing money for now). This increases the amount of M available in the economy.
To decrease the money supply the central bank sells certain assets (e.g. government bonds) in a market to which the public has access (hence an OPEN MARKET) in exchange of currency (taking back money). This decreases the amount of M available in the economy.

Macroeconomics 309 - Lecture 58
Money Supply: Basics (Cont.)
The CB also exerts influence by being the monopoly supplier of the reserves that back the supply of bank money.
Bank Reserves are liquid assets held by banks at the CB to meet the demand for withdrawals by depositors or to pay out checks.
By reducing the supply of reserves, it can cause the supply of bank money to fall—and market interest rates to rise.
Next slide on how this works.
Reading on the Economist (“Who needs money?”) about the plausibility of a decrease in importance of bank money and the role of Central Banks when non-bank money (credit cards, pension funds, insurers, and mutual funds) enters the picture. Ben Friedman at Harvard thinks so.
Macroeconomics 309 - Lecture 59
The Banking System: An Introduction
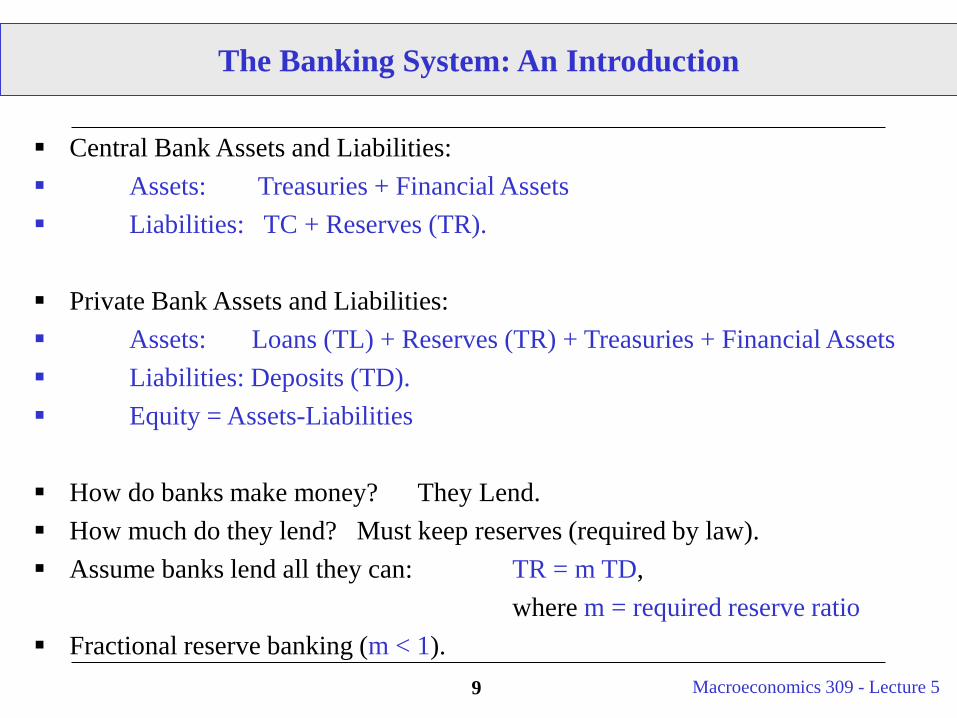
Central Bank Assets and Liabilities: Assets: Treasuries + Financial Assets Liabilities: TC + Reserves (TR).
Private Bank Assets and Liabilities: Assets: Loans (TL) + Reserves (TR) + Treasuries + Financial Assets Liabilities: Deposits (TD). Equity = Assets-Liabilities
How do banks make money? They Lend. How much do they lend? Must keep reserves (required by law). Assume banks lend all they can: TR = m TD,
where m = required reserve ratio Fractional reserve banking (m < 1).

Macroeconomics 309 - Lecture 510
The Banking System: An Introduction
Some Important Equations:
TD = TL + TR (money held within the banking system)
ΔTD = ΔTL + ΔTR
Ms = TC + TD Ms = Money SupplyTC = Total Currency in Circulation
(outside banking system)
Δ Ms = ΔTC + ΔTD
Δ Ms = ΔTC + ΔTR + ΔTL
Macroeconomics 309 - Lecture 511
The Banking System: An Example
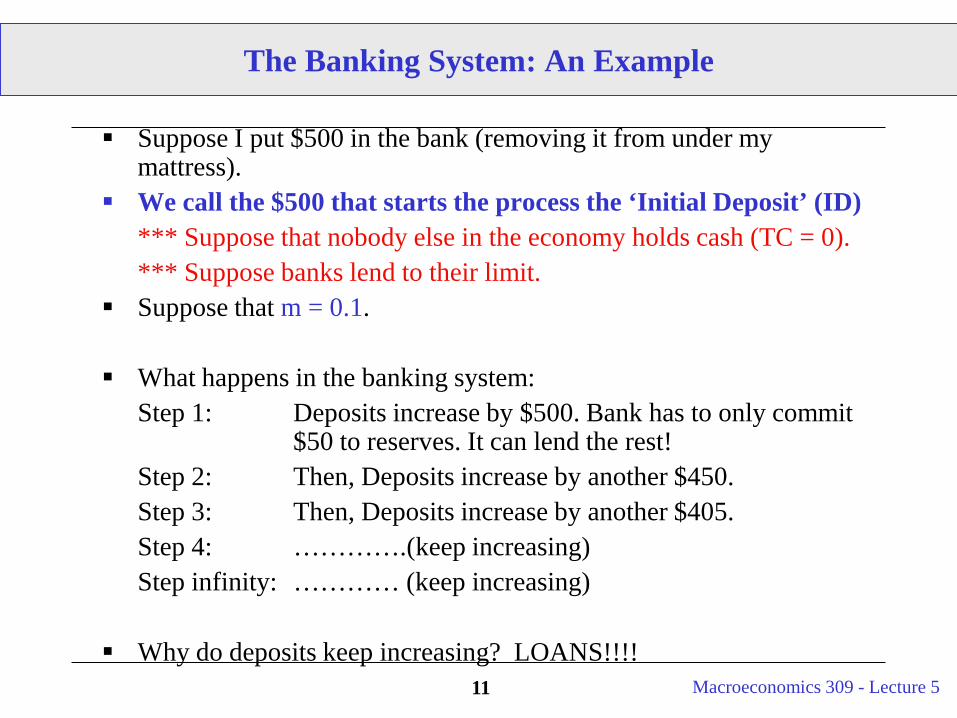
Suppose I put $500 in the bank (removing it from under my mattress).
We call the $500 that starts the process the ‘Initial Deposit’ (ID)*** Suppose that nobody else in the economy holds cash (TC = 0).*** Suppose banks lend to their limit.
Suppose that m = 0.1.
What happens in the banking system:Step 1: Deposits increase by $500. Bank has to only commit
$50 to reserves. It can lend the rest!Step 2: Then, Deposits increase by another $450.Step 3: Then, Deposits increase by another $405.Step 4: ………….(keep increasing)Step infinity: ………… (keep increasing)
Why do deposits keep increasing? LOANS!!!!

Macroeconomics 309 - Lecture 512
The Banking System: An Example
Step 1: Liabilities = 500 (TD) Assets = 450 (TL) + 50 (TR)
Step 2: Liabilities = 500 + 450 (TD)Assets = (450 + 405) (TL) + (50 + 45) (TR)
Step 3:Liabilities = 500 + 450 + 405 (TD)Assets (450 + 405 +364.5) (TL) + (50 + 45 + 40.5) (TR) …. How much do deposits increase by eventually? 5000 (= 500/0.1)

Macroeconomics 309 - Lecture 513
The Banking System: An Example
Step 1: Liabilities = 500 (TD) Assets = 450 (TL) + 50 (TR)
Step 2: Liabilities = 500 + 450 (TD)Assets = (450 + 405) (TL) + (50 + 45) (TR)
Step 3:Liabilities = 500 + 450 + 405 (TD)Assets (450 + 405 +364.5) (TL) + (50 + 45 + 40.5) (TR) …. How much do deposits increase by eventually? 5000 (= 500/0.1)
Initial increase ID
The banks lend out all the assets
in excess of reserve
requirements. Such assets are immediately re-
deposited.
Macroeconomics 309 - Lecture 514
The Money Multiplier
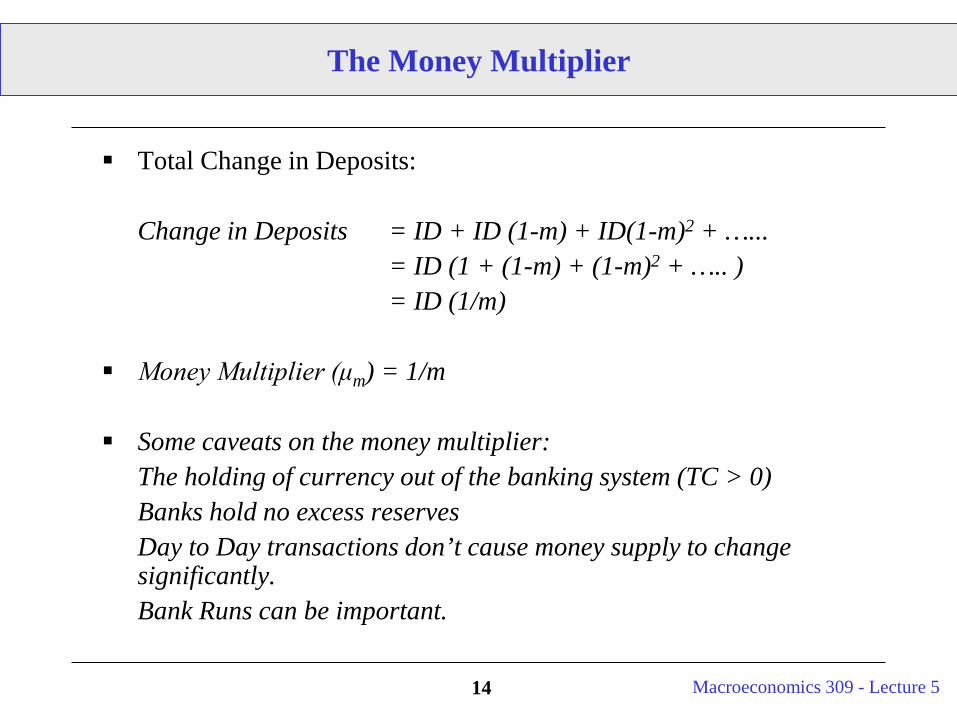
Total Change in Deposits:
Change in Deposits = ID + ID (1-m) + ID(1-m)2 + …...= ID (1 + (1-m) + (1-m)2 + ….. )= ID (1/m)
Money Multiplier (μm) = 1/m
Some caveats on the money multiplier:The holding of currency out of the banking system (TC > 0)Banks hold no excess reservesDay to Day transactions don’t cause money supply to change significantly.Bank Runs can be important.
Macroeconomics 309 - Lecture 515
The CB in the Banking System
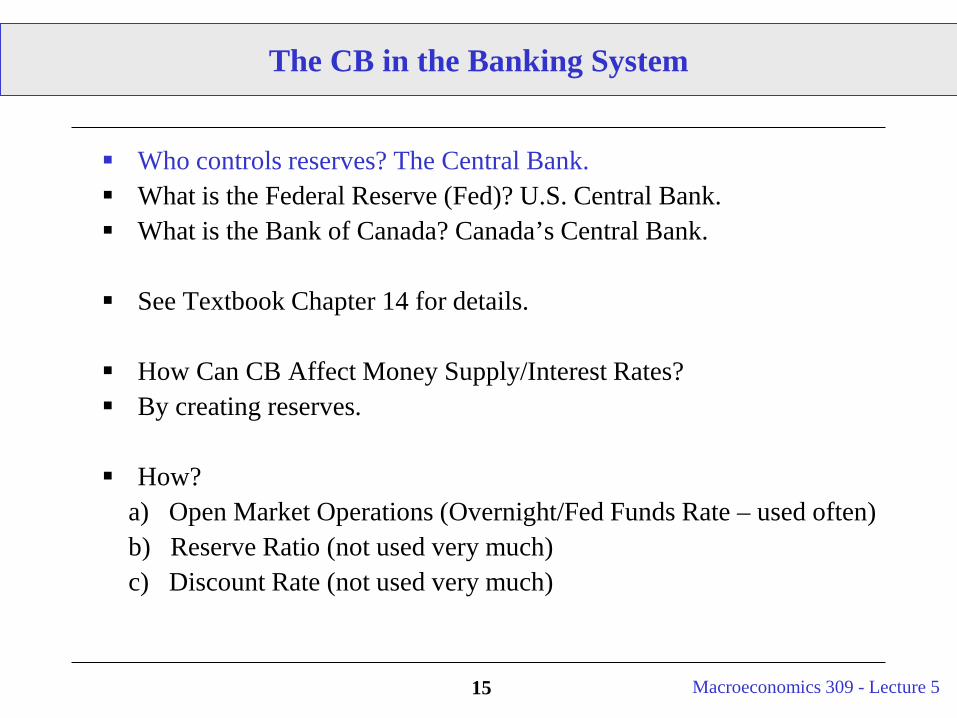
Who controls reserves? The Central Bank. What is the Federal Reserve (Fed)? U.S. Central Bank. What is the Bank of Canada? Canada’s Central Bank.
See Textbook Chapter 14 for details.
How Can CB Affect Money Supply/Interest Rates? By creating reserves.
How?a) Open Market Operations (Overnight/Fed Funds Rate – used often)b) Reserve Ratio (not used very much)c) Discount Rate (not used very much)

Macroeconomics 309 - Lecture 516
Notes on Central Banks
The Central Bank is The Banks’ Bank. The Central Bank operates a clearinghouse for bank checks. Each member bank has an account with the Central Bank. In the U.S. the deposits that banks have with the Fed are called federal funds. A closely related term, which is not specific to the U.S., is bank reserves (which consist of deposits with the Central Bank plus “vault cash”, or currency in the bank’s cash machines, teller drawers, and vault). A check written against private bank A and deposited with private bank B reduces bank A’s federal funds and increases bank B’s federal funds. Thus banks want federal funds so they can honor check withdrawals. They want vault cash to honor cash withdrawals. Upshot: banks need reserves to honor withdrawals.
Neither the Fed nor other major Central Banks (including BofC) target growth rates of the money supply (which consists of currency plus various measures of liquid assets like deposits). (This concept is very Friedman-esque)
The BofC targets the overnight rate. Fed targets the federal funds rate.
Macroeconomics 309 - Lecture 517
Notes on Central Banks
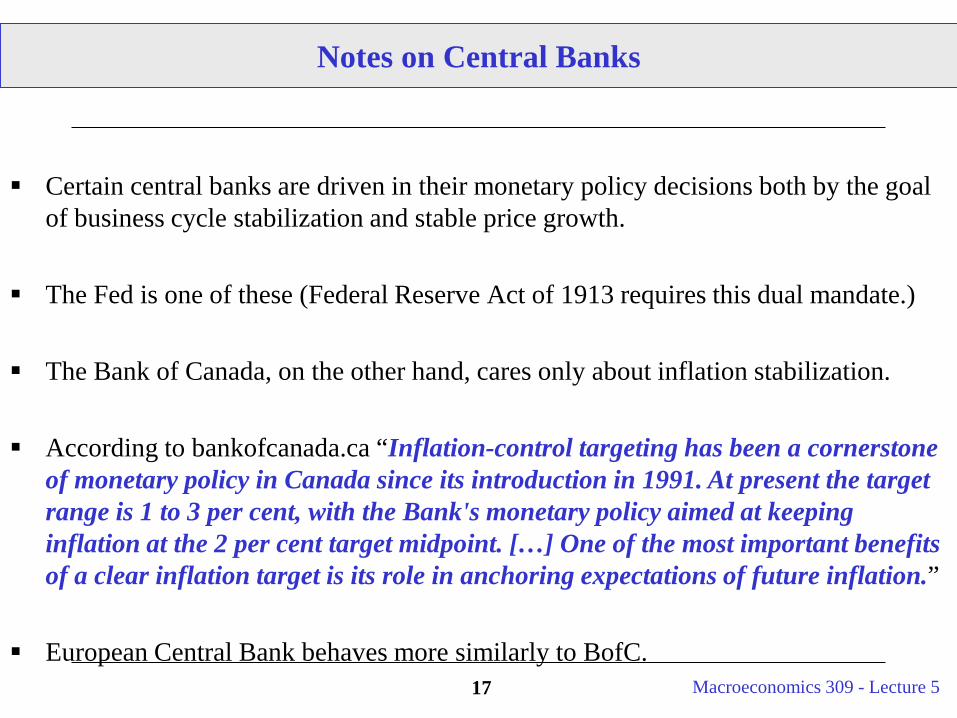
Certain central banks are driven in their monetary policy decisions both by the goal of business cycle stabilization and stable price growth.
The Fed is one of these (Federal Reserve Act of 1913 requires this dual mandate.)
The Bank of Canada, on the other hand, cares only about inflation stabilization.
According to bankofcanada.ca “Inflation-control targeting has been a cornerstone of monetary policy in Canada since its introduction in 1991. At present the target range is 1 to 3 per cent, with the Bank's monetary policy aimed at keeping inflation at the 2 per cent target midpoint. […] One of the most important benefits of a clear inflation target is its role in anchoring expectations of future inflation.”
European Central Bank behaves more similarly to BofC.

Macroeconomics 309 - Lecture 518
What is the overnight rate?
Reserves are the deposits of private banks with the CB.
The reserves market consists of private banks borrowing and lending their excess reserves amongst each other overnight.
The effective overnight rate is the interest rate on these overnight loans. It is set by supply and demand, not the CB.
The CB can change the supply of reserves through open market operations, exerting a powerful indirect effect on the overnight rate.
Macroeconomics 309 - Lecture 519
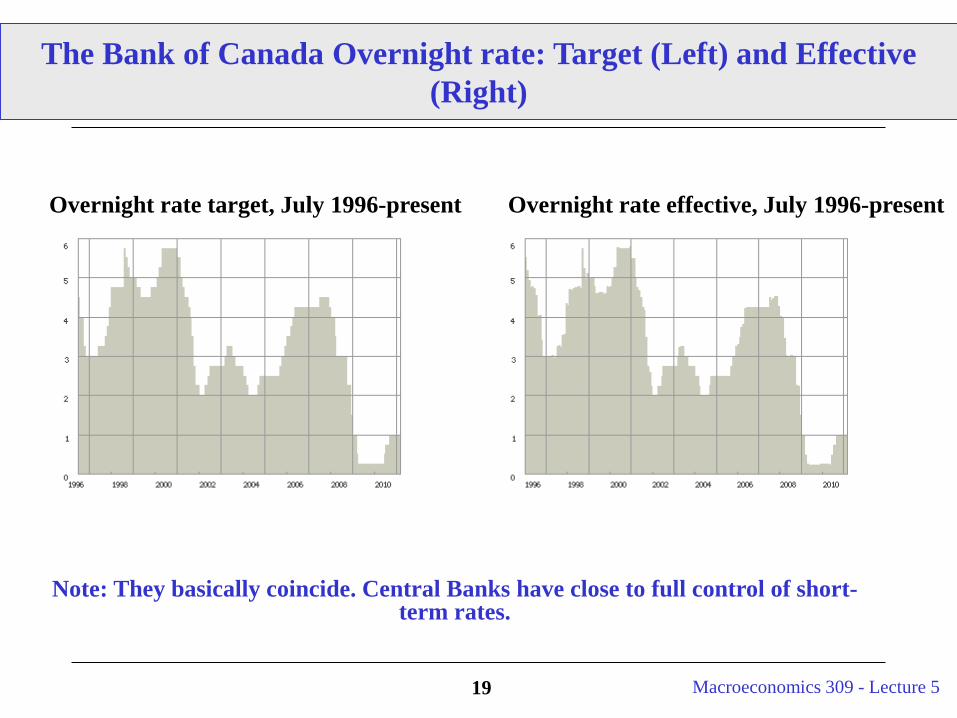
Overnight rate target, July 1996-present Overnight rate effective, July 1996-present
The Bank of Canada Overnight rate: Target (Left) and Effective (Right)
Note: They basically coincide. Central Banks have close to full control of short-term rates.

Macroeconomics 309 - Lecture 520
The US federal funds rate: Target (Blue) and Effective (Red)

Macroeconomics 309 - Lecture 521
The Overnight/Federal funds rate vs. the Discount rate
The discount rate is the interest rate on direct
loans from the CB to private banks. The CB sets
the discount rate. Discount window loans play a
minor role in CB policy.
The CoB targets the overnight rate. The Fed
targets the federal funds rate. This target changes
over time. The CB carries out open market
operations to keep the actual rate near the target
rate. This is the heart of monetary policy.

Macroeconomics 309 - Lecture 522
US FF and Discount rate (split into primary and secondary in 2003)
Macroeconomics 309 - Lecture 523
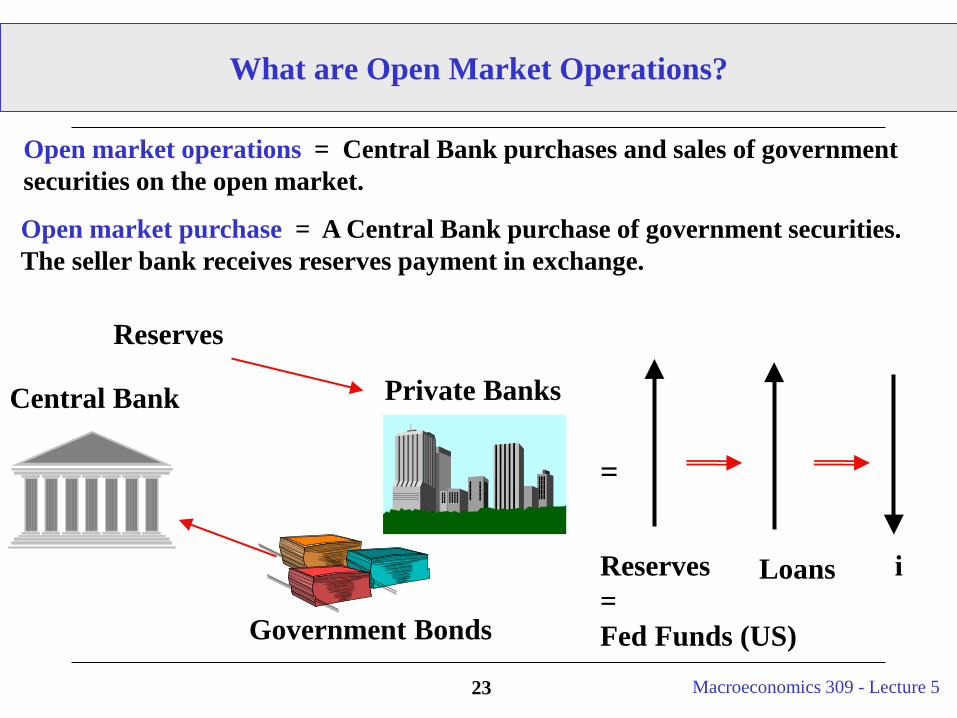
What are Open Market Operations?
Open market operations = Central Bank purchases and sales of government securities on the open market.
Open market purchase = A Central Bank purchase of government securities. The seller bank receives reserves payment in exchange.
Reserves
Government Bonds
Central Bank Private Banks
=
Reserves =Fed Funds (US)
Loans i
Macroeconomics 309 - Lecture 524
A CB Purchase of Government Securities …
Raises the supply of reserves. More reserves mean they are cheaper to borrow, so a lower overnight rate ensues. (An increase in the supply of federal funds lowers their “price”, the federal funds rate).
Drives up the price of those securities, which lowers their yield. A lower yield means a lower interest rate on government securities.
Leaves banks flush with reserves. Banks find it profitable to convert some of their new zero-interest-earning reserves into loans (which in turn creates more deposits, raising the money supply). To get people/firms to borrow more (take the new loans they are offering), banks lower the interest rate on the loans.
Bottom Line: CB purchases of government securities increase reserves and lower i.

Macroeconomics 309 - Lecture 525
The Federal funds rate and Prime rate

Macroeconomics 309 - Lecture 526
Government Securities Distributors
Bank of Montreal (treasury bills only)
Beacon Securities LimitedBMO Nesbitt Burns Inc. (marketable bonds only)
Canaccord Genuity Corp.Canadian Imperial Bank of Commerce
(treasury bills only)Casgrain & Company Limited
CIBC World Markets Inc. (marketable bonds only)
CTI Capital Securities Inc.Desjardins Securities Inc.
Deutsche Bank Securities LimitedHSBC Bank Canada(treasury bills only)
HSBC Securities (Canada) Inc.(marketable bonds only)
Laurentian Bank Securities Inc.Merrill Lynch Canada Inc.
National Bank Financial Inc.Ocean Securities Inc.
Odlum Brown LimitedPI Financial Corp.
RBC Dominion Securities Inc. Scotia Capital Inc.
The Toronto-Dominion Bank
Canadian Primary Dealers of Government Securities …
Macroeconomics 309 - Lecture 52727
What if the CB pays interest rate on Reserves?
Suppose banks are flush with reserves. Banks find it profitable to convert reserves into loans because they make money out of issuing loans (they transform low-yield into high-yield assets) .
However, for given amount of outstanding reserves (Fed Funds), if the Central Bank increases the interest rate on reserves, the incentive to issue new loans are lowered.
So the CB can control how many new loans private banks issue by decreasing their opportunity cost.
Part of the 2010 US monetary exit strategy to absorb excess liquidity pumped in during the crisis.
Macroeconomics 309 - Lecture 52828
What is Quantitative Easing?
Conventional Open Market operation: CB buys short-term Govmn’tBonds in exchange of reserves to increase money supply. This lowers short term rates because it affects the cost of reserves (fed funds overnight rate) and affects the yield of the short-term Treasuries (because their price increases due to CB’s demand).
QE: Unconventional monetary policy, CB buys (longer maturity) Financial Assets in exchange of reserves to increase money supply by a predetermined quantity of money. This lowers long-term rates because it affects the yield of the long-term assets purchased (because their price increases due to CB’s demand).
QE aims at moving the long end of the Yield curve. It works even when the short end is near zero.
Macroeconomics 309 - Lecture 529
What is the Shadow Banking System?
Money Market Funds (MMF) Assets and Liabilities: Assets: Commercial Paper (CP)+ Cash + Treasuries + Financial
Securities Liabilities: Funds Shares (Equity). Equity guarantee by Fund’s Sponsor. $1 Share cannot float below $1. If it
does the Sponsor makes cash injection (raising assets and boosting equity value). This makes the equity contract look more like a put option.
How do MMFs make money? They lend to corporations (CP is debt by large companies) or invest in interest bearing securities.
How much do they lend? All of it. No reserves. Very susceptible to runs. In the week after Lehman Bros. in 9/2008 MMFs lost ¼
of their value – $4 Trillion (many MMFs “broke the dollar” – sponsor could not uphold their share price floor guarantee).
Macroeconomics 309 - Lecture 530
Notes on FOMC directives
The Federal Reserve Open Market Committee (FOMC) meets every 6 weeks and issues a directive to the trading desk of the Federal Reserve Bank of New York.
Fed Time: the Desk carries out open market operations between 11:30 and 11:45 ET each trading day to keep the actual fed funds rate near the target.
The FOMC directive is also asymmetric or symmetric:• Symmetric:• No bias. Neutral stance (balance). Just as likely to raise as to
lower the target next.• Asymmetric:• A bias toward easing (more likely to lower than raise the target
next) or a bias toward tightening (more likely to raise than lower the target next).

Macroeconomics 309 - Lecture 531
Typical FOMC Policy Decision
Federal Reserve: FOMC Press Release Release Date: April 30, 2008
“For immediate releaseThe Federal Open Market Committee decided today to lower its target for the federal funds rate 25 basis
points to 2 percent.
Recent information indicates that economic activity remains weak. Household and business spending has been subdued and labor markets have softened further. Financial markets remain under considerable stress, and tight credit conditions and the deepening housing contraction are likely to weigh on economic growth over the next few quarters.
Although readings on core inflation have improved somewhat, energy and other commodity prices have increased, and some indicators of inflation expectations have risen in recent months. The Committee expects inflation to moderate in coming quarters, reflecting a projected leveling-out of energy and other commodity prices and an easing of pressures on resource utilization. Still, uncertainty about the inflation outlook remains high. It will be necessary to continue to monitor inflation developments carefully.
The substantial easing of monetary policy to date, combined with ongoing measures to foster market liquidity, should help to promote moderate growth over time and to mitigate risks to economic activity. The Committee will continue to monitor economic and financial developments and will act as needed to promote sustainable economic growth and price stability.

Macroeconomics 309 - Lecture 532
Sharp FOMC Policy Decisions

Macroeconomics 309 - Lecture 533
Notes on FOMC directives (Cont.)
The Federal Reserve Open Market Committee (FOMC)
The minutes of the FOMC meetings are not public until over 6 weeks after each meeting.
Look at the federal funds rate futures in the WSJ to see what the market thinks.
If interested, read the book Maestro by Bob Woodward (book is a biography of Alan Greenspan’s Fed - goes into the workings of the Fed in gory detail).
Macroeconomics 309 - Lecture 534
The CB receives interest on its assets (government securities, like treasuries).
The CB pays no interest on its liabilities (currency and reserves).
1997: Fed assets = $522 billion, on which it earned 5%, yielding $26 billion in interest income (called seignorage). Netting off the Fed’s $5 billion in expenses, the Fed made $21 billion.
The Fed is highly profitable (its profits equal 0.26% of GDP), which fosters its independence. The Fed returns its profits to the Treasury. In this way, the portion of the public debt held by the Central Bank has been monetized (converted into currency and reserves). The Treasury effectively pays no interest on this portion.
More notes on the CB’s Balance Sheet
Macroeconomics 309 - Lecture 535
Does the CB affect the real economy?
Overnight rates may affect the real economy (Y) through 3 main channels. See reading “A Blunt Tool” in the Economist:
Affects the cost of borrowing in the market which, if reduced, stimulates current consumption by individuals and investment by firms. Interest rates on short-term loans are positively correlated with the overnight rate. [Strongly dissenting view in Barro’s article.] C, I
Affects the prices of financial assets (equity prices). Lower interest rates lift share prices and this may boost consumer spending as private shareholders feel wealthier (income effect), or spur corporate investment by reducing the cost of capital. C, I
Affects the exchange rate. Looser monetary policy should push down the dollar, boosting net exports. (US goods are cheaper for other countries). NX
Note: Slow Monetary Transmission Mechanism (up to 2 yrs.).
Macroeconomics 309 - Lecture 536
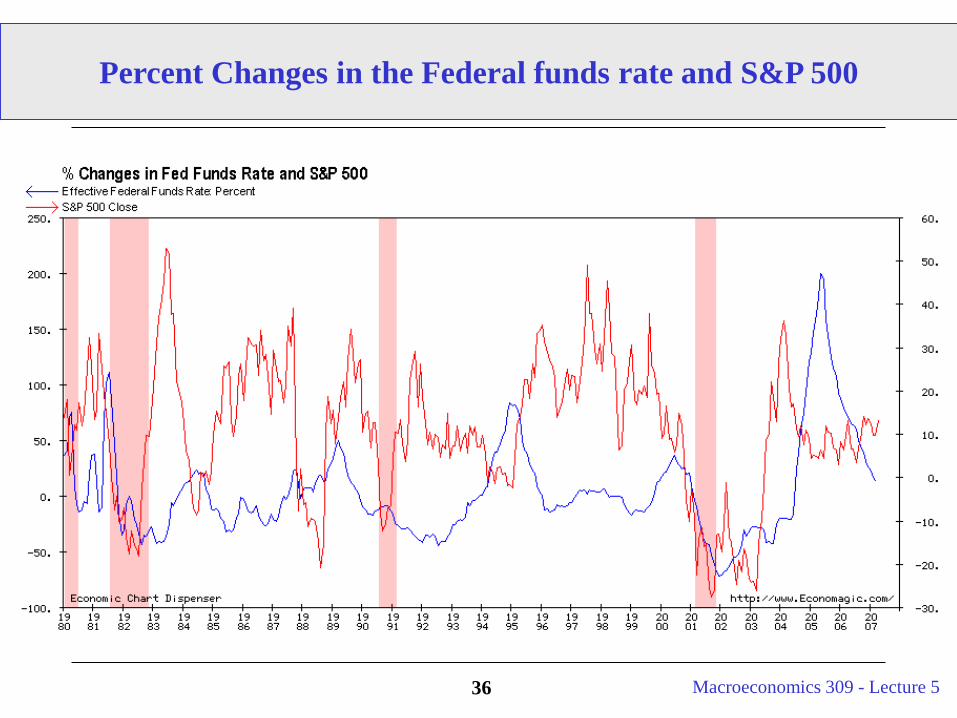
Percent Changes in the Federal funds rate and S&P 500

Macroeconomics 309 - Lecture 537
European Central Bank (ECB)
Sets Nominal Money Supply (Ms) in Euro Area.
Similar procedure to the Fed. The Rate on the Deposit Facility, which banks may use to make overnight deposits with the Eurosystem is the correspondent of fed funds rate. (now at 3%) and Marginal Lending Facility Rate (5%).
Main difference: on paper mainly focused on inflation (explicit inflation target 2%). No statutory concern for economic growth.
Economist’s reading on “Haughty Indifference”. Rates too high in Europe? Chocking investment and exports in a sluggish economy? Slower transmission mechanism than US due to less developed credit markets?

Macroeconomics 309 - Lecture 538
Websites with more info
Overview of the Bank of Canada: http://www.bankofcanada.ca
The Fed and District Banks (see the Board of Governors website for FOMC minutes and speeches and testimony of FOMC members): http://www.ny.frb.org/links.html
Foreign Central Banks: http://www.bog.frb.fed.us/centralbanks.htm
Fed Points (each explains something, e.g. how currency gets into circulation): http://www.ny.frb.org/pihome/fedpoint/
Details on how open market operations work: http://www.ny.frb.org/pihome/addpub/omo.html
Macroeconomics 309 - Lecture 539
Recap: Money Supply
Nominal Money Supply (Ms)
Affected by the Central Bank
Fed conducts monetary policy to modify Money Supply
- Open Market Operations - Change the Discount Rate - Change the Reserve Ratio
Macroeconomics 309 - Lecture 540
Money Demand
We are going to assume that in our economy there are only two types of assets. Monetary Assets (M) and Non-Monetary Assets (NM).
Monetary Assets (M) do not pay any nominal interest and Non-Monetary Assets (NM) pay nominal interest i.
The quantity of Monetary Assets that individuals choose to hold is the demand for nominal money balances (i.e. Money Demand).
Individuals decide to allocate their wealth between M and NM assets (it is a portfolio allocation decision). So for given wealth level if an agent decides how much M to hold, she is also deciding NM.
Macroeconomics 309 - Lecture 541
Money Demand: Determinants
We will not derive a Money Demand Schedule but for simplicity we will assume (a realistic) one.
Nominal money demand is determined by:
1) the Price Level;
2) Real Income;
3) Interest Rate.

Macroeconomics 309 - Lecture 542
Money Demand: Determinants (Cont.)
Nominal money demand is proportional to the price level. For example, if prices go up by 10% then individuals need 10% more money for transactions.
As Y increases, desired consumption increases and so individuals need more money for the increased number of desired transactions. This is the liquidity demand for money.
As the nominal interest rate on non-money assets (bonds), i, increases the opportunity cost of holding money increases and so the demand for nominal money balances decreases.
Since i = r + πe, we can decompose the effects on an increase in i into real interest rate increases (holding expected inflation fixed) and expected inflation increases (holding the real interest rate fixed).
Macroeconomics 309 - Lecture 543
Money Demand: Determinants (Cont.)
Other determinants of Money Demand that we could also want to think about are:
Inflation risk (if agents do not like risk holding money in their pockets when the risk of high inflation is elevated may decrease their demand for money).
Alternative payment technologies. If you can more easily do without money (electronic payments, direct deposits) money demand decreases.
Liquidity of NM Assets. If interest-bearing assets become more liquid (closer substitute to Money) people will want to hold less money.

Macroeconomics 309 - Lecture 544
Money Demand Model
Our model for the demand for nominal money balances takes the following form
Md = P·Ld(Y, i)
where:
Md = demand for nominal money balances (demand for M1) Ld = demand for liquidity function P = aggregate price level (CPI or GDP deflator) Y = real income (real GDP) i = nominal interest rate on non-money assets

Macroeconomics 309 - Lecture 545
Money Demand Model (Cont.)
The demand for real balances. Since the demand for nominal balances is proportional to the aggregate price level, we can divide both sides of the nominal money demand equation by P.
This gives the liquidity demand function or the demand for real balances function:
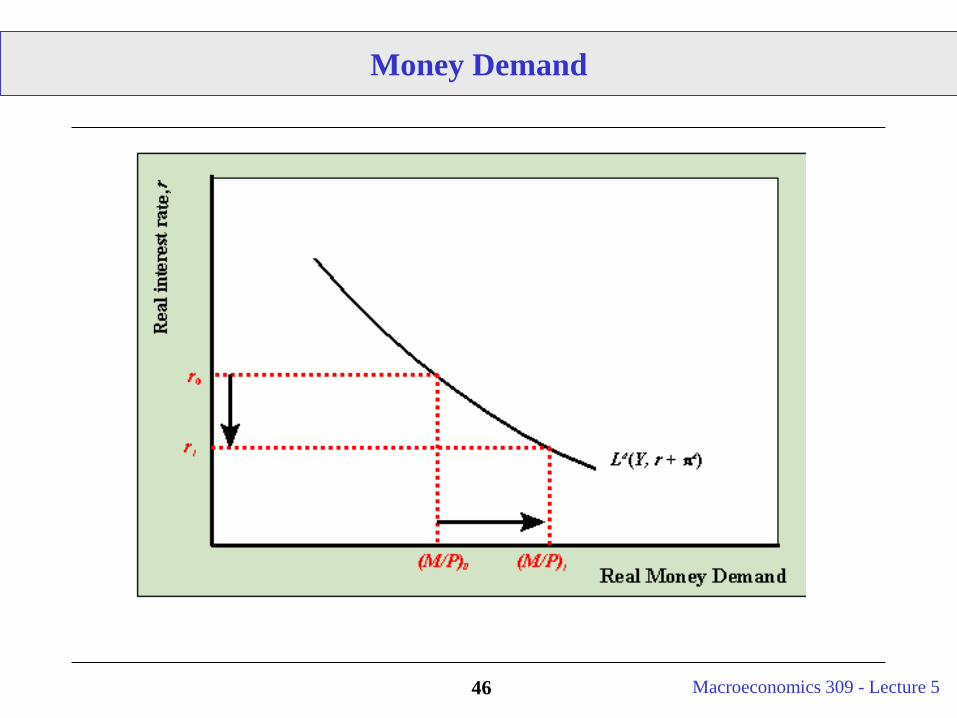
Md/P = Ld(Y, r + πe)
The left-hand-side of the above equation is the demand for nominal balances divided by the aggregate price level or the demand for real balances (the real purchasing power of money).
The right-hand side is the liquidity demand function. The demand for real balances is decomposed into a transactions demand for money (captured by Y) and a portfolio demand for money (captured by r and πe).
Macroeconomics 309 - Lecture 546
Money Demand

Macroeconomics 309 - Lecture 547
Money Demand/Money Supply Interactions
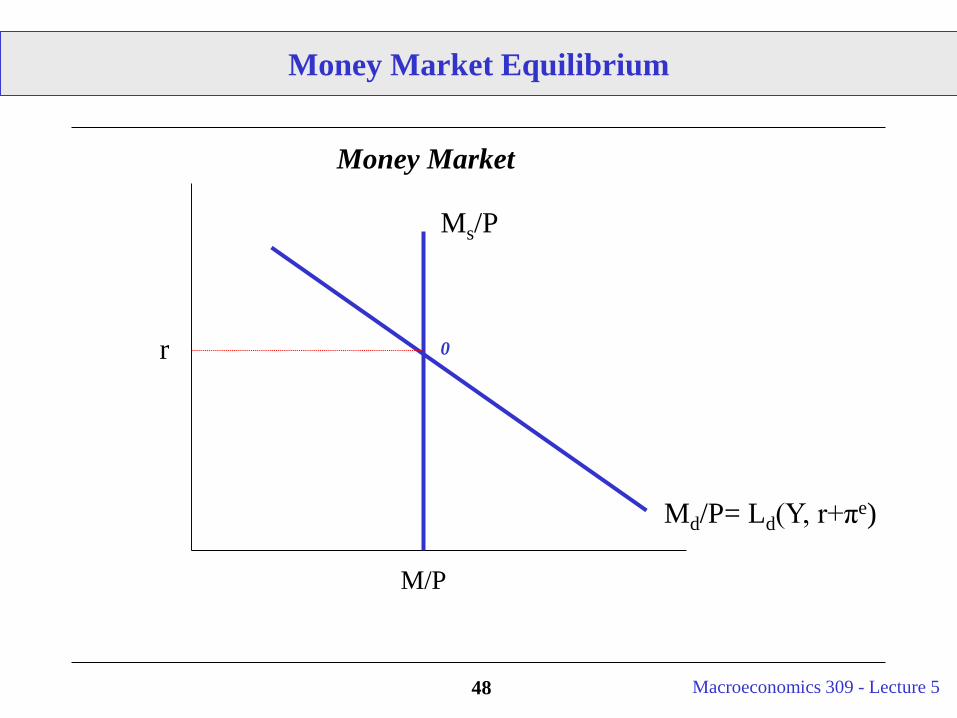
The Money Market is in Equilibrium when
Real Money Demand = Real Money Supply
where Real Money Supply = Ms/PReal Money Demand = Md/P = Ld(Y, r + πe)
Note: The money supply curve does not change with interest rates (it is vertical).
Important questions for tests:What shifts real money supply: M, PWhat shifts real money demand: Y, W, liquidity of NM, πe
Macroeconomics 309 - Lecture 548
Money Market Equilibrium
0
Md/P= Ld(Y, r+πe)
Ms/P
M/P
Money Market
r
Macroeconomics 309 - Lecture 549
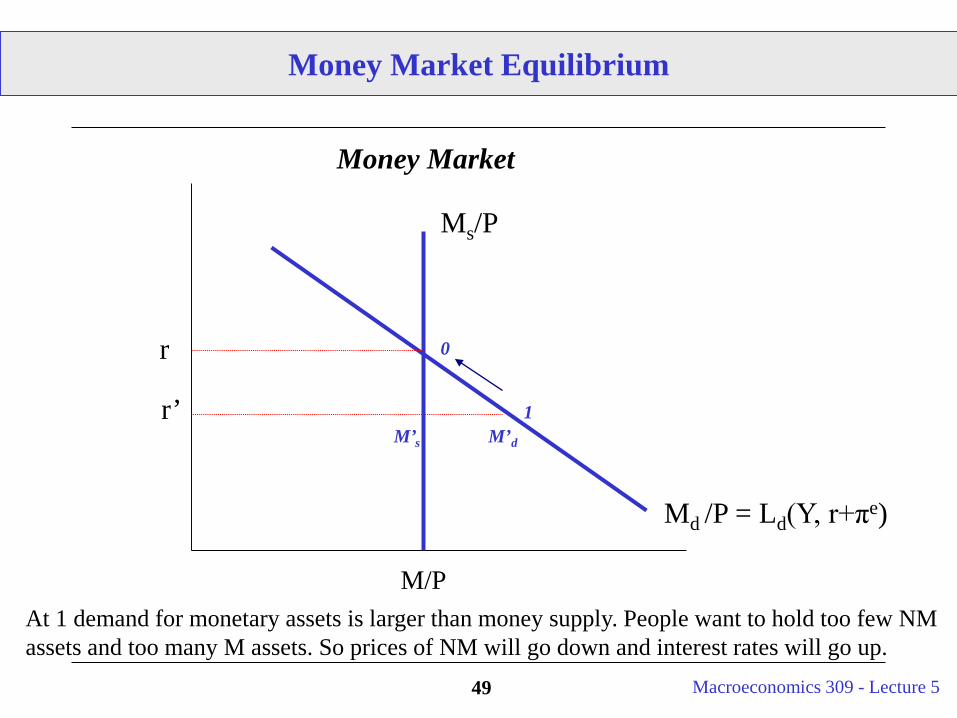
Money Market Equilibrium
0
At 1 demand for monetary assets is larger than money supply. People want to hold too few NM assets and too many M assets. So prices of NM will go down and interest rates will go up.
Md /P = Ld(Y, r+πe)
M/P
Money Market
r
M’d
r’M’s
1
Ms/P

Macroeconomics 309 - Lecture 550
Money Demand/Money Supply Interactions (Cont.)
The Money MKT equilibrium produces the equilibrium on the Non-Monetary Asset MKT as well.
Total Wealth = Total Assets in the EconomyTW = Ms + NMs = Md + NMd
Hence,Md = Ms => NMd = NMs

Macroeconomics 309 - Lecture 551
Interest Rates and Prices of NM Assets
Prices of Non-Monetary Assets and their Yields (i.e. the interest rate they pay) are negatively related.
Consider 2 zero coupon bonds that pay $100 in 1 year, issued by 2 different companies:
1. SuperSafe Inc (a very solid company that’s going to repay for sure);2. SuperJunk Corp (an extremely shaky enterprise that’s probably going to default).
SuperJunk needs to pay a higher interest rate than SuperSafe on the bond in order to compensate investors for the risk of default. So ij > is
How much are you willing to pay for the two bonds today? Pj = 100/(1+ij) and Ps= 100/(1+is).
It follows that since So ij > is., then Pj = 100/(1+ij) < Ps = 100/(1+is).

Macroeconomics 309 - Lecture 552
Money Market Equilibrium – Increasing Y
Suppose Y increases from Y to Y’ (Holding Money Supply fixed!)
0
Md/P = Ld(Y, r+πe)
M/P
Money Market
r
M’d/P = Ld(Y’, r+πe)
r’Ms/P

Macroeconomics 309 - Lecture 553
Positive Relationship Between Y and r (in Money Market)
Y Y’ Y
LM curve
r
r’

Macroeconomics 309 - Lecture 554
The LM (Liquidity-Money) Curve
LM Curve: (drawn in (Y, r) space) - represents the relationship of Y and r through the money market (specifically - Y’s affect on money demand).
For any level of output Y the LM curve shows the value of r for which the assets MKT is in Equilibrium.
The LM Curve relates real interest rates to real changes in output in the money market.
As Y increases - Md shifts upwards - causing real interest rates to rise (increase in transactions demand increases the demand for money).
Macroeconomics 309 - Lecture 555
Interest Rates and Output
This is the second curve expressing a relationship between real interest rates and output.
1) The IS curve. Topic 4.
2) The LM curve. The transaction motive for holding money (the monetary feedback mechanism). As Y increases, demand for money increases and r increases.Y increasing causes r to increase (positive relationship - the LM curve)

Macroeconomics 309 - Lecture 556
The LM (Liquidity-Money) Curve
What shifts the LM curve?
Money (M): Increasing Money Supply increases M/P causing the LM curve to the right.
Prices (P): Increasing Prices causes real Money Balances to fall shifting LM curve to the left.
π e: Increasing expected inflation causes returns on bonds (assets other than money) to increase making it less attractive to hold cash. Causes LM curve to shift right!
In general anything that increases demand for real balances will produce an increase in the price of real balances (r) and a shift of the LM curve up to the left.
Macroeconomics 309 - Lecture 557
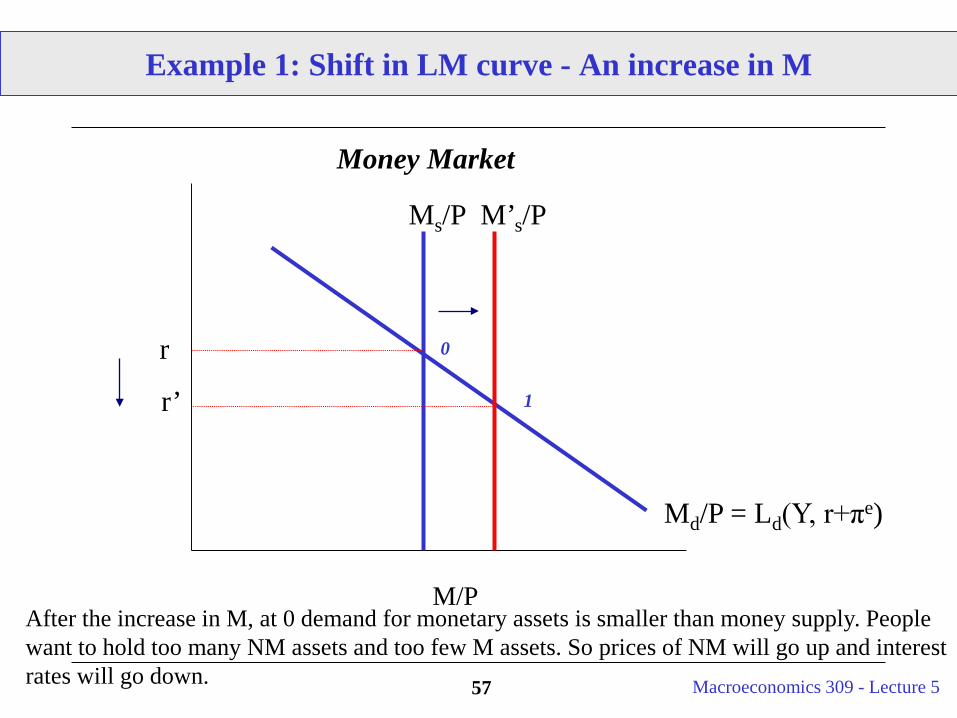
Example 1: Shift in LM curve - An increase in M
0
Md/P = Ld(Y, r+πe)
M/P
Money Market
r1r’
After the increase in M, at 0 demand for monetary assets is smaller than money supply. People want to hold too many NM assets and too few M assets. So prices of NM will go up and interest rates will go down.
Ms/P M’s/P
Macroeconomics 309 - Lecture 558
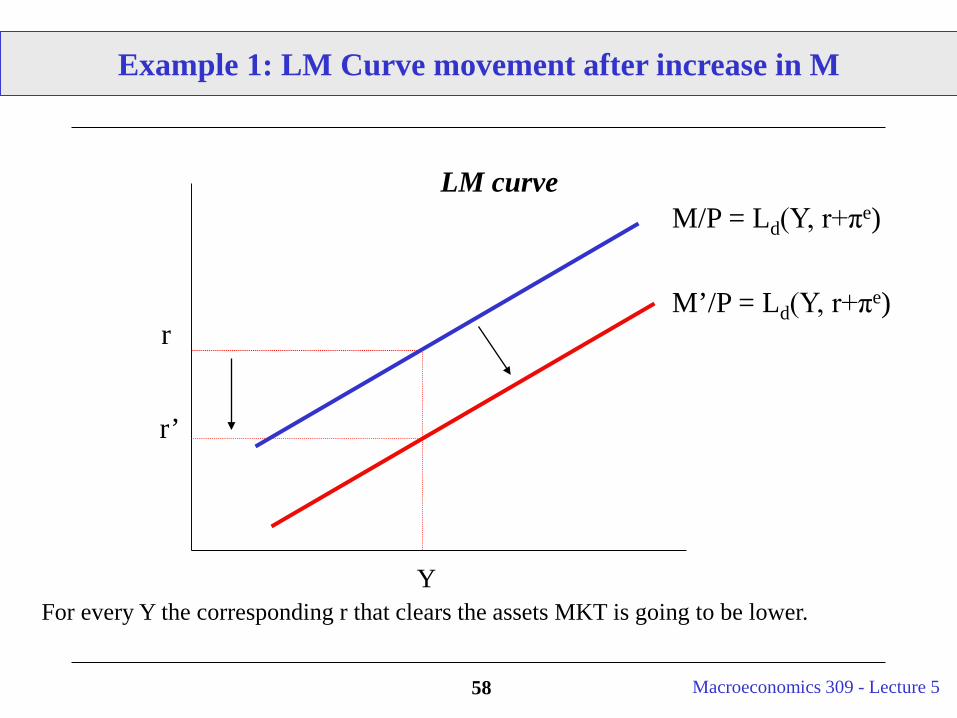
Example 1: LM Curve movement after increase in M
Y
LM curve
r’
rM’/P = Ld(Y, r+πe)
M/P = Ld(Y, r+πe)
For every Y the corresponding r that clears the assets MKT is going to be lower.
Macroeconomics 309 - Lecture 559
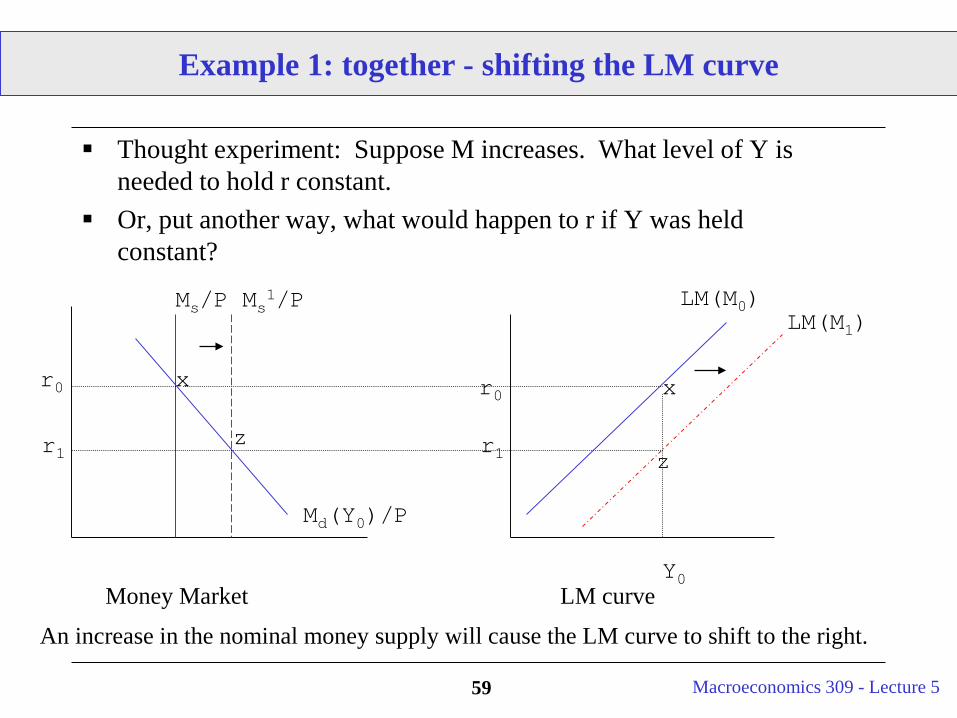
Example 1: together - shifting the LM curve
Thought experiment: Suppose M increases. What level of Y is needed to hold r constant.
Or, put another way, what would happen to r if Y was held constant?
Money Market LM curve
r0 r0x x
Md(Y0)/P
Y0
Ms/P Ms1/P
zr1 r1 z
LM(M0)LM(M1)
An increase in the nominal money supply will cause the LM curve to shift to the right.
Macroeconomics 309 - Lecture 560
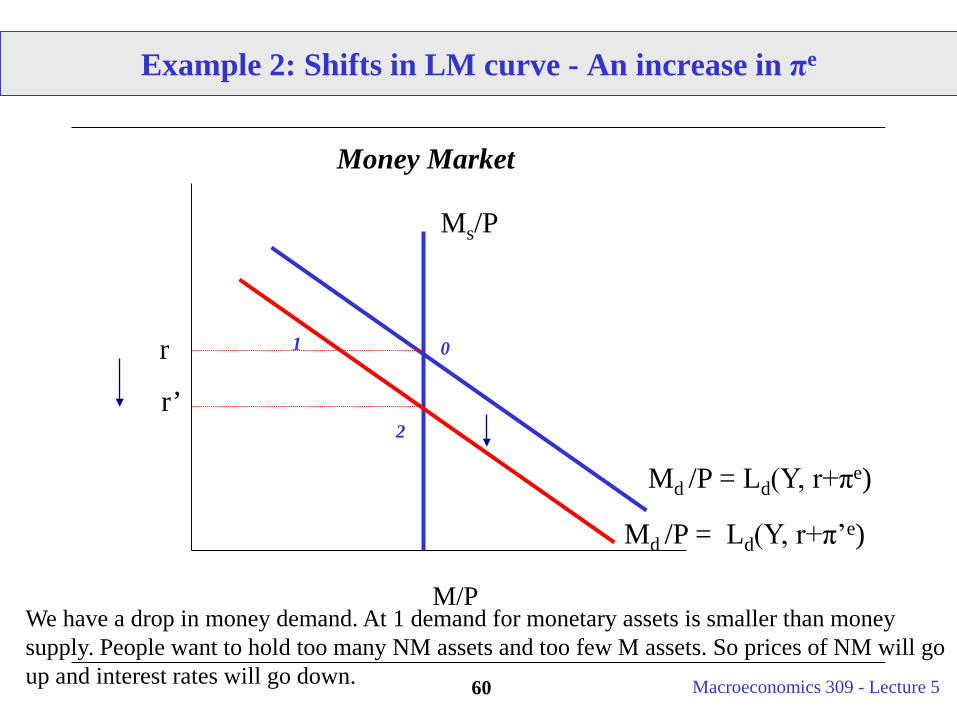
Example 2: Shifts in LM curve - An increase in πe
0
Md /P = Ld(Y, r+πe)
M/P
Money Market
r 1
r’
Md /P = Ld(Y, r+π’e)
2
We have a drop in money demand. At 1 demand for monetary assets is smaller than money supply. People want to hold too many NM assets and too few M assets. So prices of NM will go up and interest rates will go down.
Ms/P
Macroeconomics 309 - Lecture 561
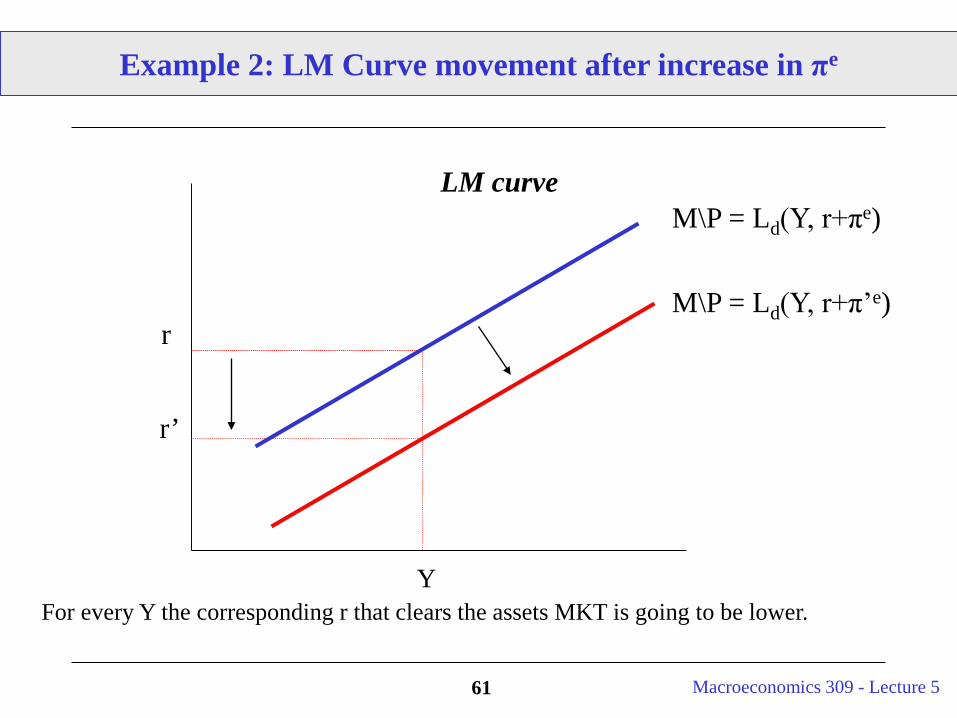
Example 2: LM Curve movement after increase in πe
Y
LM curve
r’
rM\P = Ld(Y, r+π’e)
M\P = Ld(Y, r+πe)
For every Y the corresponding r that clears the assets MKT is going to be lower.
Macroeconomics 309 - Lecture 562
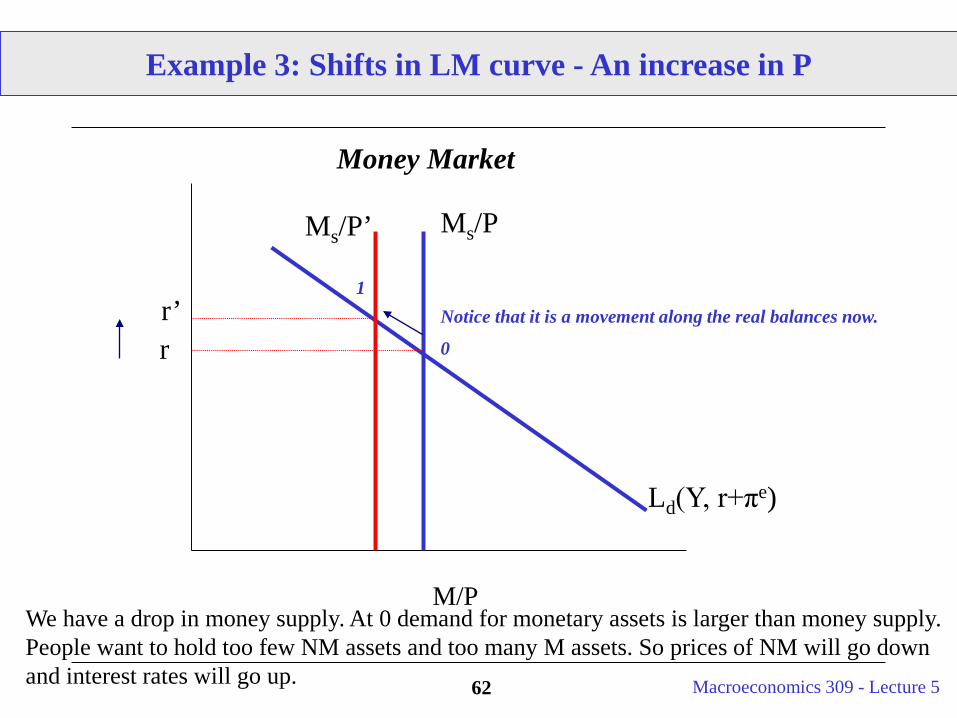
Example 3: Shifts in LM curve - An increase in P
0
Ld(Y, r+πe)
M/P
Money Market
rr’
1
We have a drop in money supply. At 0 demand for monetary assets is larger than money supply. People want to hold too few NM assets and too many M assets. So prices of NM will go down and interest rates will go up.
Ms/PMs/P’
Notice that it is a movement along the real balances now.

Macroeconomics 309 - Lecture 563
Example 3: LM Curve movement after increase in P
Y
LM curve
r’
r
M\P’ = Ld(Y, r+πe)
M\P = Ld(Y, r+πe)
For every Y the corresponding r that clears the assets MKT is going to be higher.

Macroeconomics 309 - Lecture 564
Example 3: LM Curve movement after increase in P
This exercise looks at changes in P. But for given r and Ms, the Money Market actually determines the equilibrium P.
P = Ms/Ld(Y, r + πe)
Note: This also gives a relationship between inflation rate, growth of nominal money supply, and growth of demand of real money balances.
π = ΔP/P = ΔMs/Ms - ΔLd(Y, r + πe)/ Ld(Y, r + πe)
Macroeconomics 309 - Lecture 565
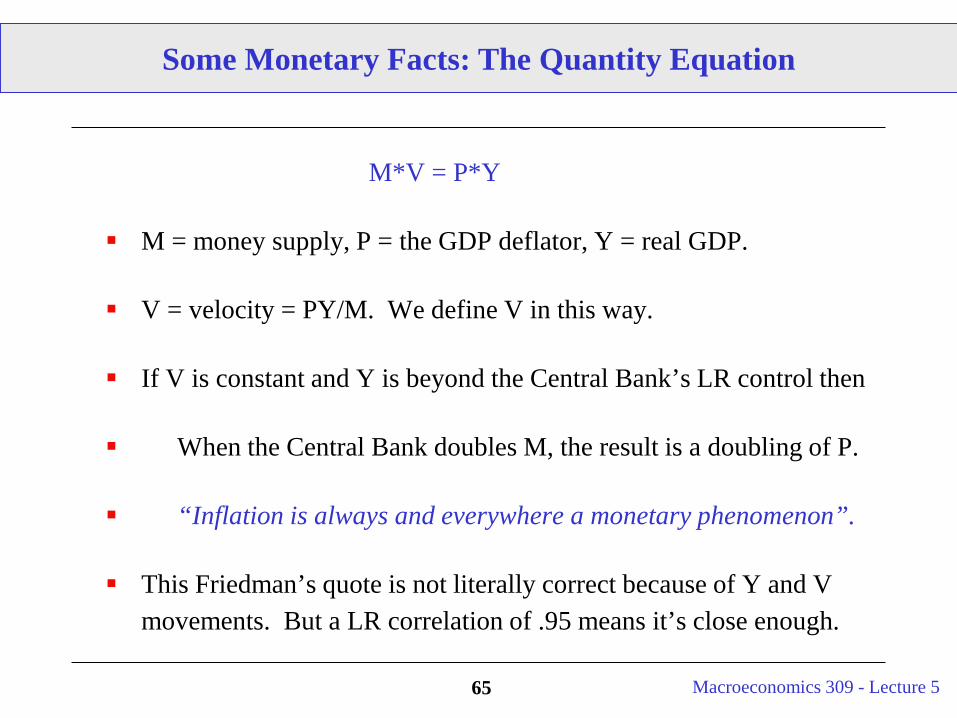
M*V = P*Y
M = money supply, P = the GDP deflator, Y = real GDP.
V = velocity = PY/M. We define V in this way.
If V is constant and Y is beyond the Central Bank’s LR control then
When the Central Bank doubles M, the result is a doubling of P.
“Inflation is always and everywhere a monetary phenomenon”.
This Friedman’s quote is not literally correct because of Y and V movements. But a LR correlation of .95 means it’s close enough.
Some Monetary Facts: The Quantity Equation

Macroeconomics 309 - Lecture 566
Money Growth and Inflation
Macroeconomics 309 - Lecture 567
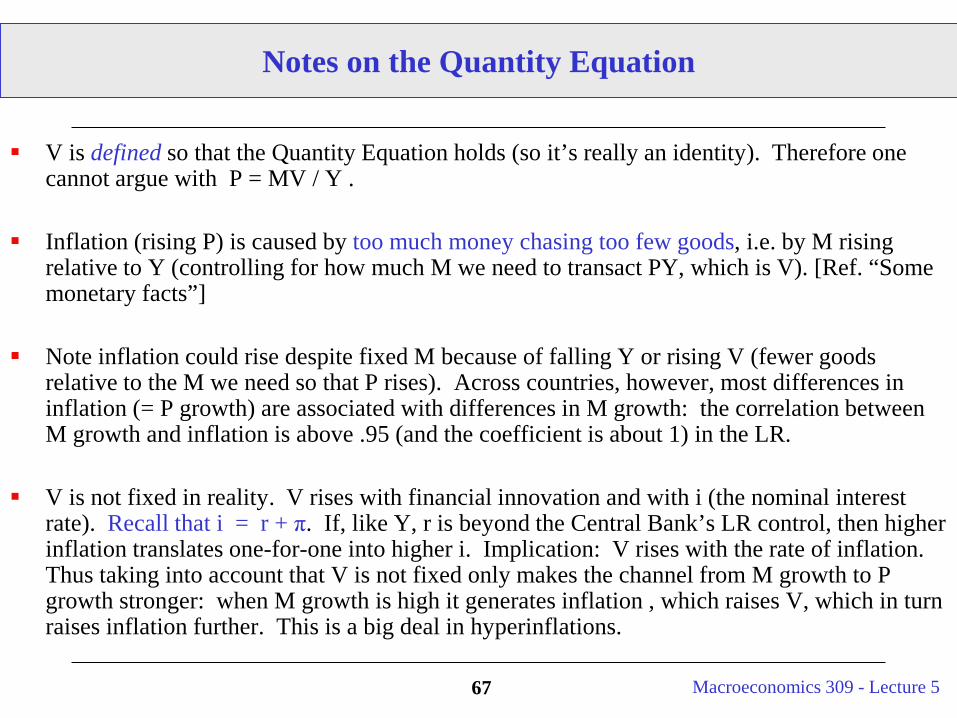
Notes on the Quantity Equation
V is defined so that the Quantity Equation holds (so it’s really an identity). Therefore one cannot argue with P = MV / Y .
Inflation (rising P) is caused by too much money chasing too few goods, i.e. by M rising relative to Y (controlling for how much M we need to transact PY, which is V). [Ref. “Some monetary facts”]
Note inflation could rise despite fixed M because of falling Y or rising V (fewer goods relative to the M we need so that P rises). Across countries, however, most differences in inflation (= P growth) are associated with differences in M growth: the correlation between M growth and inflation is above .95 (and the coefficient is about 1) in the LR.
V is not fixed in reality. V rises with financial innovation and with i (the nominal interest rate). Recall that i = r + π. If, like Y, r is beyond the Central Bank’s LR control, then higher inflation translates one-for-one into higher i. Implication: V rises with the rate of inflation. Thus taking into account that V is not fixed only makes the channel from M growth to P growth stronger: when M growth is high it generates inflation , which raises V, which in turn raises inflation further. This is a big deal in hyperinflations.

Macroeconomics 309 - Lecture 568
When public debt is growing faster than GDP, there is political pressure on the Central Bank to monetize some of the government debt b/c
• fixed nominal debt is easier to pay off the higher is P.• public debt pays interest, reserves do not.
Large budget deficits are the underlying cause of hyperinflations.The debt and deficit limits in Europe’s European Monetary Union are meant to prevent member countries from pushing for higher inflation.
Central Bank independence from fiscal authorities (the Government) can insulate it from pressure to monetize the public debt.
The Central Bank buys public debt with reserves.
Monetizing Government Debt

Macroeconomics 309 - Lecture 569
CB Independence & Inflation: More Independence, Less π
Macroeconomics 309 - Lecture 570
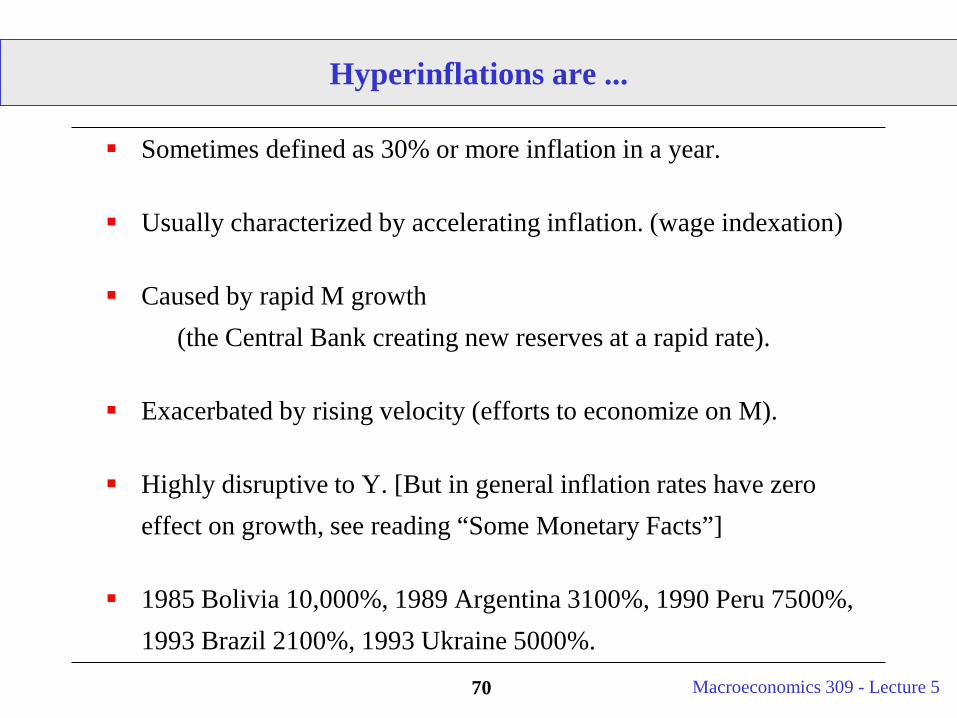
Hyperinflations are ...
Sometimes defined as 30% or more inflation in a year.
Usually characterized by accelerating inflation. (wage indexation)
Caused by rapid M growth(the Central Bank creating new reserves at a rapid rate).
Exacerbated by rising velocity (efforts to economize on M).
Highly disruptive to Y. [But in general inflation rates have zero effect on growth, see reading “Some Monetary Facts”]
1985 Bolivia 10,000%, 1989 Argentina 3100%, 1990 Peru 7500%, 1993 Brazil 2100%, 1993 Ukraine 5000%.

Macroeconomics 309 - Lecture 571
Why Do Governments Grow the Money Supply?
Short Term Political Gains - reduce unemployment (or raise output). If the economy is capacity constrained - prices must rise (however, this usually occurs with a lag!)
Accommodating Supply Shocks - The U.S. in the 70s! (as opposed to breaking the inflation cycle).
Financing Government Deficits by Printing Money!!!
We will deal with this more in future lectures!

Macroeconomics 309 - Lecture 572
Conclusions on the Money Market
Introduction to Money.
Introduction to the role of the Banking Sector. Advanced Class on Money and Banking.
Overview of the basics of Monetary Policy. Advanced Class on Monetary Policy and Central Banks.
LM Curve.