monetary policy report - bank of canadathe monetary policy report is a key element of this approach....
TRANSCRIPT
Monetary Policy ReportJuly 2018
Canada’s Inflation-Control Strategy1
Inflation targeting and the economy � The Bank’s mandate is to conduct monetary policy to promote
the economic and financial well-being of Canadians.
� Canada’s experience with inflation targeting since 1991 has shown that the best way to foster confidence in the value of money and to contribute to sustained economic growth, employment gains and improved living standards is by keeping inflation low, stable and predictable.
� In 2016, the Government and the Bank of Canada renewed Canada’s inflation-control target for a further five-year period, ending December 31, 2021. The target, as measured by the consumer price index (CPI), remains at the 2 per cent midpoint of the control range of 1 to 3 per cent.
The monetary policy instrument � The Bank carries out monetary policy through changes in the
target for the overnight rate of interest.2 These changes are transmitted to the economy through their influence on market interest rates, domestic asset prices and the exchange rate, which affect total demand for Canadian goods and services. The balance between this demand and the economy’s production capacity is, over time, the primary determinant of inflation pressures in the economy.
� Monetary policy actions take time—usually from six to eight quarters—to work their way through the economy and have their full effect on inflation. For this reason, monetary policy must be forward-looking.
� Consistent with its commitment to clear, transparent com-munications, the Bank regularly reports its perspective on the forces at work on the economy and their implications for inflation. The Monetary Policy Report is a key element of this approach. Policy decisions are typically announced on eight
pre-set days during the year, and full updates of the Bank’s outlook, including risks to the projection, are published four times per year in the Monetary Policy Report.
Inflation targeting is symmetric and flexible � Canada’s inflation-targeting approach is symmetric, which
means that the Bank is equally concerned about inflation rising above or falling below the 2 per cent target.
� Canada’s inflation-targeting framework is flexible. Typically, the Bank seeks to return inflation to target over a horizon of six to eight quarters. However, the most appropriate horizon for returning inflation to target will vary depending on the nature and persistence of the shocks buffeting the economy.
Monitoring inflation � In the short run, the prices of certain CPI components can be
particularly volatile. These components, as well as changes in indirect taxes such as GST, can cause sizable fluctuations in CPI.
� In setting monetary policy, the Bank seeks to look through such transitory movements in CPI inflation and focuses on a set of “core” inflation measures that better reflect the under-lying trend of inflation. In this sense, these measures act as an operational guide to help the Bank achieve the CPI inflation target. They are not a replacement for CPI inflation.
� The Bank’s three preferred measures of core inflation are CPI-trim, which excludes CPI components whose rates of change in a given month are the most extreme; CPI-median, which corresponds to the price change located at the 50th percentile (in terms of basket weight) of the distribution of price changes; and CPI-common, which uses a statistical procedure to track common price changes across categories in the CPI basket.
1 See Joint Statement of the Government of Canada and the Bank of Canada on the Renewal of the Inflation-Control Target (October 24, 2016) and Renewal of the Inflation-Control Target: Background Information—October 2016, which are both available on the Bank’s website.
2 When interest rates are at very low levels, the Bank has at its disposal a suite of extraordinary policy measures that could be used to provide additional monetary stimulus and/or improve credit market conditions. The Framework for Conducting Monetary Policy at Low Interest Rates, available on the Bank’s website, describes these measures and the principles guiding their use.
The Monetary Policy Report is available on the Bank of Canada’s website at bankofcanada.ca.
For further information, contact:
Public Information Communications Department Bank of Canada 234 Wellington Street Ottawa, Ontario K1A 0G9
Telephone: 613-782-8111; 1-800-303-1282 (toll-free in North America) Email: [email protected]; Website: bankofcanada.ca
ISSN 1201-8783 (Print) ISSN 1490-1234 (Online) © Bank of Canada 2018
Monetary Policy ReportJuly 2018
This is a report of the Governing Council of the Bank of Canada:
Stephen S. Poloz, Carolyn A. Wilkins, Timothy Lane, Lawrence Schembri, Lynn Patterson and Sylvain Leduc.

ContentsGlobal Economy . . . . . . . . . . . . . . . . . . . . . . . . . . . . . . . . . . . . . . . . . . . . . . . . . . . . . . . . . . . . 1
Financial conditions . . . . . . . . . . . . . . . . . . . . . . . . . . . . . . . . . . . . . . . . . . . . . . . . . . . . . . 2
United States . . . . . . . . . . . . . . . . . . . . . . . . . . . . . . . . . . . . . . . . . . . . . . . . . . . . . . . . . . . . 3
Other advanced economies . . . . . . . . . . . . . . . . . . . . . . . . . . . . . . . . . . . . . . . . . . . . . . 4
Emerging-market economies . . . . . . . . . . . . . . . . . . . . . . . . . . . . . . . . . . . . . . . . . . . . 4
Commodity prices . . . . . . . . . . . . . . . . . . . . . . . . . . . . . . . . . . . . . . . . . . . . . . . . . . . . . . . 5
Canadian Economy . . . . . . . . . . . . . . . . . . . . . . . . . . . . . . . . . . . . . . . . . . . . . . . . . . . . . . . . . 7
Recent developments . . . . . . . . . . . . . . . . . . . . . . . . . . . . . . . . . . . . . . . . . . . . . . . . . . . . 8
Capacity pressures and inflation . . . . . . . . . . . . . . . . . . . . . . . . . . . . . . . . . . . . . . . . . 9
Box 1: Key inputs to the base-case projection . . . . . . . . . . . . . . . . . . . . . . . . . . . 10
Economic outlook . . . . . . . . . . . . . . . . . . . . . . . . . . . . . . . . . . . . . . . . . . . . . . . . . . . . . . . 12
Box 2: The economic impact of the recent steel and aluminum tariffs . . . . . . . . . . . . . . . . . . . . . . . . . . . . . . . . . . . . . . . . . . . . . . . . . . . . 13
Household spending . . . . . . . . . . . . . . . . . . . . . . . . . . . . . . . . . . . . . . . . . . . . . . . . . . . . 14
Box 3: The impact of rising interest rates on mortgage holders . . . . . . . . . 15
Business investment . . . . . . . . . . . . . . . . . . . . . . . . . . . . . . . . . . . . . . . . . . . . . . . . . . . . 16
Exports . . . . . . . . . . . . . . . . . . . . . . . . . . . . . . . . . . . . . . . . . . . . . . . . . . . . . . . . . . . . . . . . . 17
Inflation outlook . . . . . . . . . . . . . . . . . . . . . . . . . . . . . . . . . . . . . . . . . . . . . . . . . . . . . . . . 18
Risks to the Inflation Outlook . . . . . . . . . . . . . . . . . . . . . . . . . . . . . . . . . . . . . . . . . . . . 21

Global EconomyGlobal economic growth remains solid, with the US economy showing par-ticular strength. The Bank estimates that growth in US real gross domestic product (GDP) in the first half of 2018 was even stronger than expected in the April Monetary Policy Report. In other advanced economies, economic growth is projected to pick up following temporary softness in the first quarter, but with less momentum than anticipated in April. Higher oil prices are expected to have a slightly negative net effect on global growth, with the impact varying across regions. The Bank expects the global economy will grow by about 3 3/4 per cent in 2018 before settling at around 3 1/2 per cent in 2019, similar to the April projection (Table 1).
Escalating trade tensions pose considerable risks to the outlook. The pro-jection incorporates actions taken since April by the United States to end exemptions on steel and aluminum tariffs for some of its largest trading partners and to implement previously announced tariffs on China. It also accounts for the ensuing countermeasures. More broadly, this escalation has heightened concerns about a more pronounced shift away from a multi-lateral, rules-based trading system. These concerns could dampen the out-look for global trade and investment growth (Chart 1). In response to these developments, the Bank’s base case now includes the measures that have already been implemented. It also considers somewhat greater adverse
Table 1: Projection for global economic growth
Share of real global GDP* (per cent)
Projected growth† (per cent)
2017 2018 2019 2020
United States 15 2.3 (2.3) 3.1 (2.7) 2.5 (2.7) 1.8 (2.0)
Euro area 12 2.6 (2.5) 2.2 (2.3) 1.6 (1.7) 1.4 (1.5)
Japan 4 1.7 (1.7) 0.9 (1.5) 0.9 (1.0) 0.2 (0.2)
China 18 6.9 (6.9) 6.5 (6.6) 6.2 (6.3) 6.0 (6.1)
Oil-importing EMEs‡ 33 4.4 (4.4) 4.5 (4.5) 4.2 (4.4) 4.2 (4.2)
Rest of the world§ 18 1.3 (1.4) 2.0 (2.0) 2.6 (2.4) 2.7 (2.7)
World 100 3.6 (3.6) 3.8 (3.8) 3.5 (3.6) 3.4 (3.4)
* GDP shares are based on International Monetary Fund (IMF) estimates of the purchasing-power-parity valuation of country GDPs for 2016 from the IMF’s October 2017 World Economic Outlook.
† Numbers in parentheses are projections used in the previous Report.
‡ The oil-importing emerging-market economies (EMEs) grouping excludes China. It is composed of large emerging markets from Asia, Europe, Latin Am erica, the Middle East and Africa (such as India, Brazil and South Africa), emerging and developing Europe, as well as newly industrialized economies (such as South Korea).
§ “Rest of the world” is a grouping of all other economies not included in the fi rst fi ve regions. It is composed of oil-exporting emerging markets (such as Russia, Nigeria and Saudi Arabia) and other advanced economies (such as Canada, the United Kingdom and Australia).
Source: Bank of Canada
Global EConoMy 1 banK oF CanaDa • MonEtaRy PoliCy REPoRt • July 2018

effects from uncertainty on investment, both globally and in North America. The actions and uncertainty effects are assumed to reduce the level of global GDP by 0.2 per cent by the end of 2020.
Global financial conditions remain accommodativeBond yields remain higher than in 2017 in some regions, reflecting actual and expected changes in monetary policy. Monetary policy normaliza-tion is occurring from different starting points and at different speeds. The European Central Bank has announced the conditional conclusion of its asset purchase program (quantitative easing) by the end of December 2018. The economic expansion in the United States is further along than it is in other advanced economies and is receiving a sizable boost from fiscal policy. The US Federal Reserve has continued to withdraw monetary stimulus, and markets are now expecting a faster pace of increases in the federal funds rate. Positive market sentiment about the near-term US out-look has also contributed to an appreciation of the US dollar and portfolio outflows from emerging-market economies (EMEs), exacerbating country-specific vulnerabilities (Chart 2). Equity prices have become more sensitive to trade policy developments. Overall, despite recent movements, global financial conditions are supportive of economic activity.
Chart 1: Global trade growth has softened, while investment growth has picked up Year-over-year percentage change, quarterly data
a. 2007Q1–18Q1 b. 2014Q1–18Q1
Global trade volume Global gross fi xed capital formation*
* Global gross fi xed capital formation is an aggregate of data from 48 advanced and emerging-market economies, accounting for around 84 per cent of global GDP by purchasing-power-parity weight.
Sources: Netherlands Bureau for Economic Policy Analysis, International Monetary Fund and national sources via Haver Analytics, and Bank of Canada calculations Last observation: 2018Q1
-20
-10
0
10
20
%
2007 2009 2011 2013 2015 2017
%
0
2
4
6
8
2014 2015 2016 2017 2018
b. 2014Q1–18Q1
2 Global EConoMy banK oF CanaDa • MonEtaRy PoliCy REPoRt • July 2018

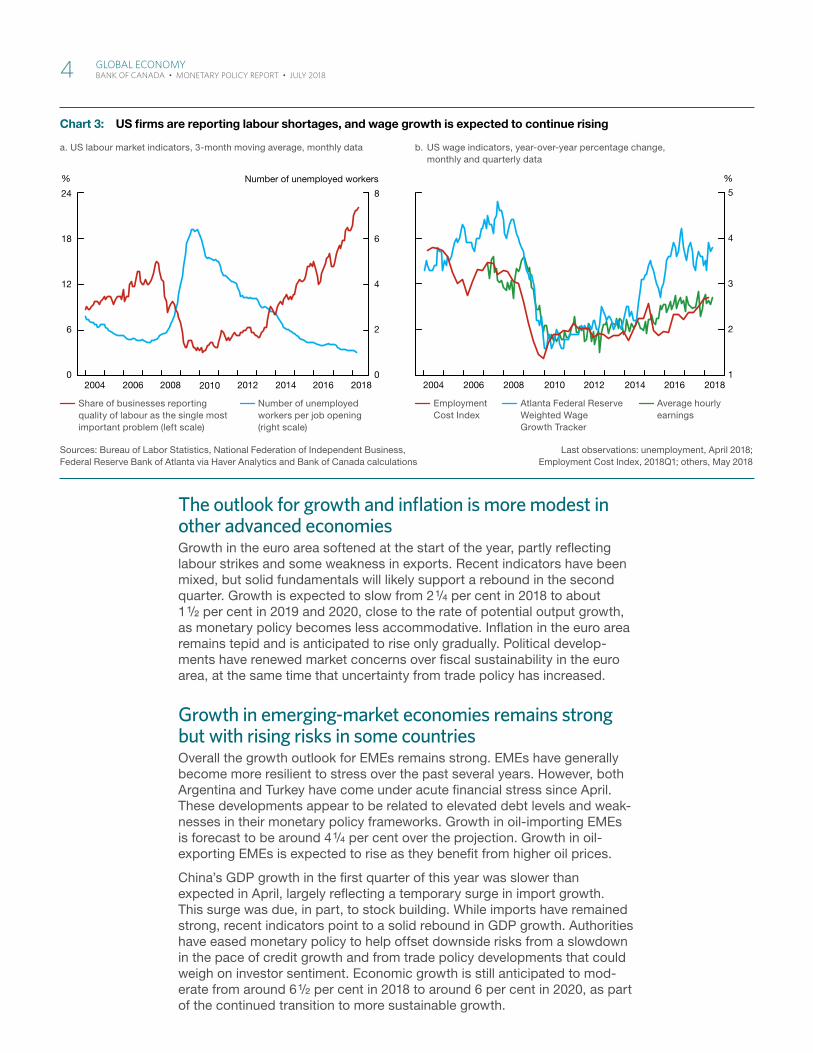
The US expansion remains robustThe US economy has been expanding at a solid pace, with recent data sig-nalling more momentum than anticipated in the April Report. Net exports have been unexpectedly robust, reflecting transitory factors, and business investment has been more solid than expected. Job gains continue to be elevated amid a tight labour market, and indicators of consumer sentiment remain high (Chart 3).
The US economy is forecast to expand by 3 per cent in 2018 and 2 1/2 per cent in 2019, well above the estimated rate of its potential output growth. Con-sumption is anticipated to rise at a healthy pace, underpinned by strong employment growth, past income tax cuts and elevated household net worth. Solid private demand and corporate tax cuts should drive robust business investment growth. GDP growth is projected to ease to around 2 per cent in 2020, close to potential output growth, as fiscal and monetary policy support diminishes.
US businesses are starting to report that trade policy uncertainty is damp-ening an otherwise upbeat outlook for investment, although this is not yet evident in the data. The current base-case projection for the US economy therefore incorporates some modest adverse effects of trade policy uncer-tainty on investment.
US core inflation has firmed as the effects of transitory factors, including past declines in telecommunication prices, have passed. Wage growth has been modest but is expected to pick up with a tightening labour market. With stronger wage growth and support from excess demand, core infla-tion is forecast to remain close to the Federal Reserve’s inflation target of 2 per cent.
Chart 2: Financial markets are reacti ng to US economic strength
a. Market expectations for overnight rates,* monthly data b. Nominal effective exchange rates, index: April 13, 2018 = 100, daily data
Canada United States Euro area Japan
* Historical rates refl ect the 3-month moving average of effective overnight rates. Expectations are derived from overnight index swaps.
Sources: J.P. Morgan and national sources via Last observations: historical overnight rates, June 2018;Haver Analytics and Bloomberg L.P., and Bank of Canada calculations exchange rates, July 6, 2018
-1
0
1
2
3
%
2017 2018 2019 202090
95
100
105
110
115
2017 2018
Index
Historical rates Expectations April Report
Global EConoMy 3 banK oF CanaDa • MonEtaRy PoliCy REPoRt • July 2018
The outlook for growth and inflation is more modest in other advanced economiesGrowth in the euro area softened at the start of the year, partly reflecting labour strikes and some weakness in exports. Recent indicators have been mixed, but solid fundamentals will likely support a rebound in the second quarter. Growth is expected to slow from 2 1/4 per cent in 2018 to about 1 1/2 per cent in 2019 and 2020, close to the rate of potential output growth, as monetary policy becomes less accommodative. Inflation in the euro area remains tepid and is anticipated to rise only gradually. Political develop-ments have renewed market concerns over fiscal sustainability in the euro area, at the same time that uncertainty from trade policy has increased.
Growth in emerging-market economies remains strong but with rising risks in some countriesOverall the growth outlook for EMEs remains strong. EMEs have generally become more resilient to stress over the past several years. However, both Argentina and Turkey have come under acute financial stress since April. These developments appear to be related to elevated debt levels and weak-nesses in their monetary policy frameworks. Growth in oil-importing EMEs is forecast to be around 4 1/4 per cent over the projection. Growth in oil-exporting EMEs is expected to rise as they benefit from higher oil prices.
China’s GDP growth in the first quarter of this year was slower than expected in April, largely reflecting a temporary surge in import growth. This surge was due, in part, to stock building. While imports have remained strong, recent indicators point to a solid rebound in GDP growth. Authorities have eased monetary policy to help offset downside risks from a slowdown in the pace of credit growth and from trade policy developments that could weigh on investor sentiment. Economic growth is still anticipated to mod-erate from around 6 1/2 per cent in 2018 to around 6 per cent in 2020, as part of the continued transition to more sustainable growth.
Chart 3: US fi rms are reporting labour shortages, and wage growth is expected to continue rising
a. US labour market indicators, 3-month moving average, monthly data
Share of businesses reporting quality of labour as the single most important problem (left scale)
Number of unemployed workers per job opening (right scale)
b. US wage indicators, year-over-year percentage change, monthly and quarterly data
Employment Cost Index
Atlanta Federal Reserve Weighted Wage Growth Tracker
Average hourly earnings
Sources: Bureau of Labor Statistics, National Federation of Independent Business, Last observations: unemployment, April 2018;Federal Reserve Bank of Atlanta via Haver Analytics and Bank of Canada calculations Employment Cost Index, 2018Q1; others, May 2018
0
2
4
6
8
0
6
12
18
24
2004 2006 2008 2010 2012 2014 2016 2018
% Number of unemployed workers
1
2
3
4
5
2004 2006 2008 2010 2012 2014 2016 2018
%
4 Global EConoMy banK oF CanaDa • MonEtaRy PoliCy REPoRt • July 2018

Oil prices have risen as a result of supply concernsCrude oil prices have been averaging about 15 per cent higher than assumed in the April Report. The increase in prices was partly driven by unplanned output declines in Venezuela and sanctions on exports from Iran, in a market where demand growth has been healthy and excess inventories are being drawn down (Chart 4). US shale drilling has also expanded by less than anticipated, reflecting higher costs and pipeline bottlenecks.
Risks to global oil prices are roughly balanced at current price levels. An important upside risk is that there could be further disruptions in oil supply from Iran and Venezuela. In contrast, production by members of the Organization of the Petroleum Exporting Countries (OPEC) could increase faster than expected as the previous agreement to reduce output expires. The possibility that US shale productivity growth could be stronger than expected provides another downside risk to prices. The spreads between West Texas Intermediate (WTI) and Western Canada Select (WCS) and between Brent and WTI have narrowed recently due to temporary fac-tors. These spreads are expected to widen again because of transportation bottlenecks. The Bank’s convention is to assume that oil prices stay at their recent average levels over the projection horizon (Box 1, page 10).
The Bank’s non-energy commodity price index is relatively unchanged since April. The prices received by Canadian lumber producers remain high, despite the duties imposed by the United States last year, partly as a result of brisk US home building. Base metal prices have recently declined as a result of the escalation in global trade tensions and market concerns over risks to GDP growth in China.
Chart 4: OPEC actions and supply disruptions are supporting higher oil prices
a. Reductions in OPEC* crude oil production relative to July 2016, monthly data
Unplanned Planned†
b. Crude oil prices, daily data
Western Canada Select West Texas Intermediate Brent
* OPEC refers to the Organization of the Petroleum Exporting Countries. Libya and Nigeria are excluded since they were not part of the November 2016 production-cut agreement.
† Planned reductions are consistent with the agreement between OPEC and non-OPEC countries to cut production.
Sources: International Energy Agency, exchange sources via Haver Analytics and Bloomberg L.P., and Bank of Canada calculations Last observations: crude oil production, May 2018; crude oil prices, July 6, 2018
-1
0
1
2
3
2016 2017 2018
Millions of barrels per day
20
30
40
50
60
70
80
2016 2017 2018
US$ per barrel
OPEC–non-OPEC production-cut agreement
Global EConoMy 5 banK oF CanaDa • MonEtaRy PoliCy REPoRt • July 2018

Many commodity-exporting economies, including Canada, have recently seen their currencies depreciate despite the rise in oil prices. The typical exchange rate appreciation associated with improving terms of trade is being offset by the combined effects of the broad-based appreciation of the US dollar and of rising trade tensions. Trade developments are important for these countries, given their considerable reliance on open trade and global economic growth. In this context, the Canadian dollar is assumed to remain close to its recent average of 76 cents US, compared with 78 cents US in April.
6 Global EConoMy banK oF CanaDa • MonEtaRy PoliCy REPoRt • July 2018

Canadian EconomyThe Canadian economy continues to operate close to full capacity, and GDP is expected to expand somewhat faster than potential. The composition of growth is shifting: the contribution from household spending is expected to be smaller than in 2017 while that from exports and business investment is anticipated to be larger.
In the Bank’s projection, economic activity will be supported by continuing solid foreign demand and accommodative financial conditions. While invest-ment and trade are projected to expand, they are being restrained by the US tariffs recently imposed on Canadian steel and aluminum imports and by uncertainty around trade policies. Since April, uncertainty has increased, reflecting delays in the progress of renegotiations of the North American Free Trade Agreement, as well as the broadening and unknown duration of tariffs.
Real GDP growth is projected to average 2.0 per cent over 2018 to 2020, similar to the outlook in the April Report (Table 2). In the first quarter of 2018, business investment and exports were more robust than anticipated. Stronger levels of spending are expected to persist over the projection horizon, partly reflecting higher oil prices, even with the larger impacts from both trade policy uncertainty and tariffs.
Table 2: Contributions to average annual real GDP growthPercentage points* †
2017 2018 2019 2020
Consumption 1.9 (2.0) 1.3 (1.5) 1.3 (1.2) 1.2 (1.0)
Housing 0.2 (0.2) 0.1 (0.0) 0.0 (0.0) -0.1 (-0.1)
Government 0.6 (0.6) 0.7 (0.6) 0.3 (0.3) 0.4 (0.4)
Business fi xed investment 0.3 (0.3) 0.7 (0.4) 0.2 (0.3) 0.2 (0.3)
Subtotal: � nal domestic demand 3.1 (3.1) 2.8 (2.5) 1.8 (1.8) 1.7 (1.6)
Exports 0.3 (0.3) 0.5 (0.0) 0.8 (0.9) 0.8 (0.8)
Imports -1.2 (-1.2) -1.2 (-0.5) -0.4 (-0.4) -0.6 (-0.6)
Subtotal: net exports -0.9 (-0.9) -0.7 (-0.5) 0.4 (0.5) 0.2 (0.2)
Inventories 0.8 (0.8) -0.1 (0.0) 0.0 (-0.2) 0.0 (0.0)
GDP 3.0 (3.0) 2.0 (2.0) 2.2 (2.1) 1.9 (1.8)
Memo items (percentage change)
Range forpotential output
1.4–2.0 (1.4–2.0)
1.5–2.1 (1.5–2.1)
1.4–2.2 (1.4–2.2)
1.3–2.3 (1.3–2.3)
Real gross domestic income (GDI) 4.0 (3.9) 2.6 (2.5) 2.3 (1.9) 2.0 (1.8)
CPI infl ation 1.6 (1.6) 2.4 (2.3) 2.2 (2.1) 2.1 (2.1)
* Numbers in parentheses are from the projection in the previous Report.
† Numbers may not add to total because of rounding.
CanaDian EConoMy 7 banK oF CanaDa • MonEtaRy PoliCy REPoRt • July 2018
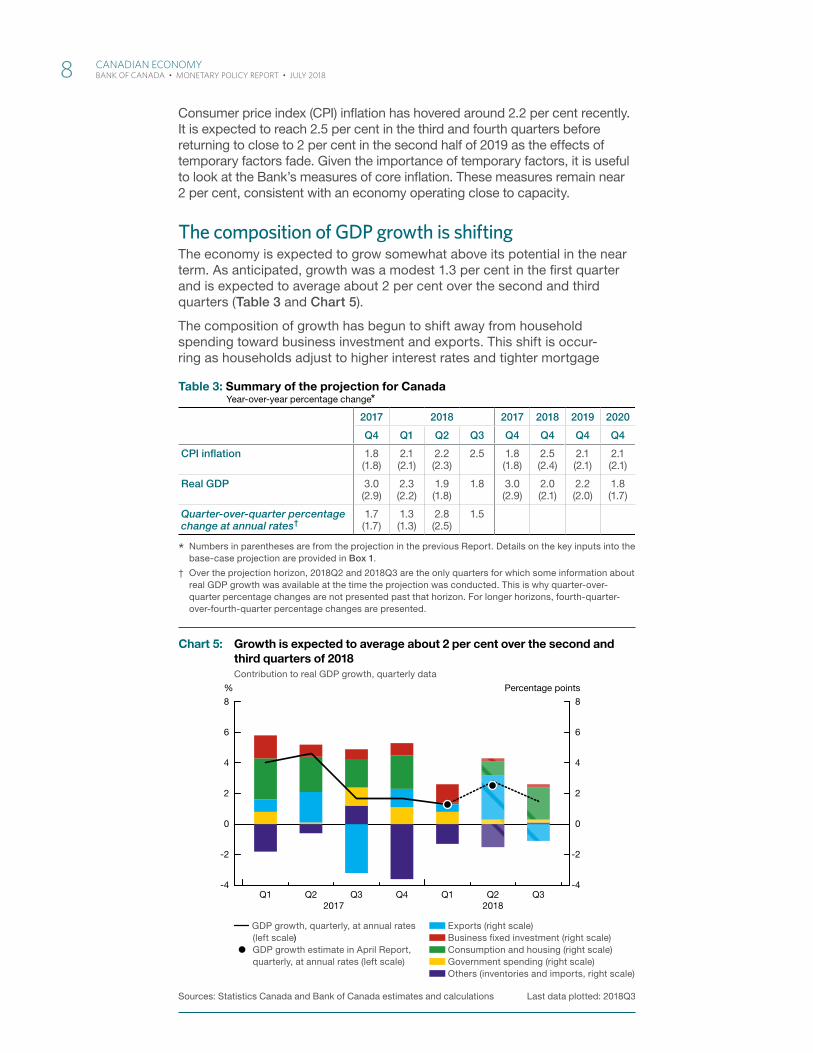
Consumer price index (CPI) inflation has hovered around 2.2 per cent recently. It is expected to reach 2.5 per cent in the third and fourth quarters before returning to close to 2 per cent in the second half of 2019 as the effects of temporary factors fade. Given the importance of temporary factors, it is useful to look at the Bank’s measures of core inflation. These measures remain near 2 per cent, consistent with an economy operating close to capacity.
The composition of GDP growth is shiftingThe economy is expected to grow somewhat above its potential in the near term. As anticipated, growth was a modest 1.3 per cent in the first quarter and is expected to average about 2 per cent over the second and third quarters (Table 3 and Chart 5).
The composition of growth has begun to shift away from household spending toward business investment and exports. This shift is occur-ring as households adjust to higher interest rates and tighter mortgage
Table 3: Summary of the projection for CanadaYear-over-year percentage change*
2017 2018 2017 2018 2019 2020
Q4 Q1 Q2 Q3 Q4 Q4 Q4 Q4
CPI infl ation 1.8 (1.8)
2.1 (2.1)
2.2 (2.3)
2.5 1.8 (1.8)
2.5 (2.4)
2.1 (2.1)
2.1 (2.1)
Real GDP 3.0 (2.9)
2.3 (2.2)
1.9 (1.8)
1.8 3.0 (2.9)
2.0 (2.1)
2.2 (2.0)
1.8 (1.7)
Quarter-over-quarter percentage change at annual rates†
1.7 (1.7)
1.3 (1.3)
2.8 (2.5)
1.5
* Numbers in parentheses are from the projection in the previous Report. Details on the key inputs into the base-case projection are provided in Box 1.
† Over the projection horizon, 2018Q2 and 2018Q3 are the only quarters for which some information about real GDP growth was available at the time the projection was conducted. This is why quarter-over-quarter percentage chang es are not presented past that horizon. For longer horizons, fourth-quarter-over-fourth-quarter percentage changes are presented.
Chart 5: Growth is expected to average about 2 per cent over the second and third quarters of 2018Contribution to real GDP growth, quarterly data
GDP growth, quarterly, at annual rates (left scale)
GDP growth estimate in April Report, quarterly, at annual rates (left scale)
Exports (right scale) Business fi xed investment (right scale) Consumption and housing (right scale) Government spending (right scale) Others (inventories and imports, right scale)
Sources: Statistics Canada and Bank of Canada estimates and calculations Last data plotted: 2018Q3
-4
-2
0
2
4
6
8
-4
-2
0
2
4
6
8
Percentage points%
Q1 Q2 Q3 Q1 Q2 Q3Q42017 2018
8 CanaDian EConoMy banK oF CanaDa • MonEtaRy PoliCy REPoRt • July 2018

rules (Guideline B-20).1 Growth of household credit has continued to slow and is now below the growth rate of household income; as a result, the ratio of household debt to disposable income is edging down (Chart 6). Consumption growth has been slowing since the middle of 2017, led by a pullback in spending on components sensitive to interest rates.2 While Guideline B-20 is improving the credit quality of new mortgages,3 its announcement and adoption led to a pull forward of housing resales into the fourth quarter of 2017, followed by a sharp drop in the first few months of 2018. As a result, residential investment in the first half of 2018 likely con-tracted. A partial rebound in resales is expected in the third quarter.
Meanwhile, firms are expanding their capacity in the face of solid demand. The Bank estimates that business investment and exports were stronger in the first half of 2018 than anticipated in the April Report. Spending on com-puter equipment, software, and research and development was particu-larly robust. Because the strength of export growth in the first two quarters mainly reflected a faster-than-expected rebound in oil exports after tem-porary pipeline shutdowns in late 2017, export growth in the third quarter is expected to slow.
The economy continues to operate near potential, with inflation close to 2 per centThe Bank judges that the output gap in the second quarter of 2018 was between -0.5 and +0.5 per cent (Box 1). The Bank has revised its esti-mates of potential output up modestly since April to reflect a higher level
1 The revisions to Guideline B-20 were announced by the Office of the Superintendent of Financial Institutions in October 2017 and took effect on January 1, 2018. The changes are designed to strengthen residential mortgage underwriting practices.
2 Components sensitive to interest rates are vehicle purchases; other transportation services; communi-cations; furniture; food, beverage and accommodation services; and dwelling maintenance. Moderately interest-rate-sensitive components are the operation of transport equipment; recreation and culture; clothing and footwear; insurance and financial services; education; and housing user costs.
3 See the June 2018 Financial System Review.
Chart 6: The ratio of household debt to disposable income is edging down as household credit growth continues to slowQuarterly data
Ratio of household debt to disposable income (left scale) Household credit growth, quarterly, at annual rates (right scale)
Sources: Statistics Canada and Bank of Canada calculations Last observation: 2018Q1
155
160
165
170
175
2012 2013 2014 2015 2016 20173.5
4.0
4.5
5.0
5.5
6.0
6.5%%
CanaDian EConoMy 9 banK oF CanaDa • MonEtaRy PoliCy REPoRt • July 2018
of investment from the first quarter of 2018 through the projection horizon. Investment could grow faster than anticipated in the base-case projection, further raising potential output.
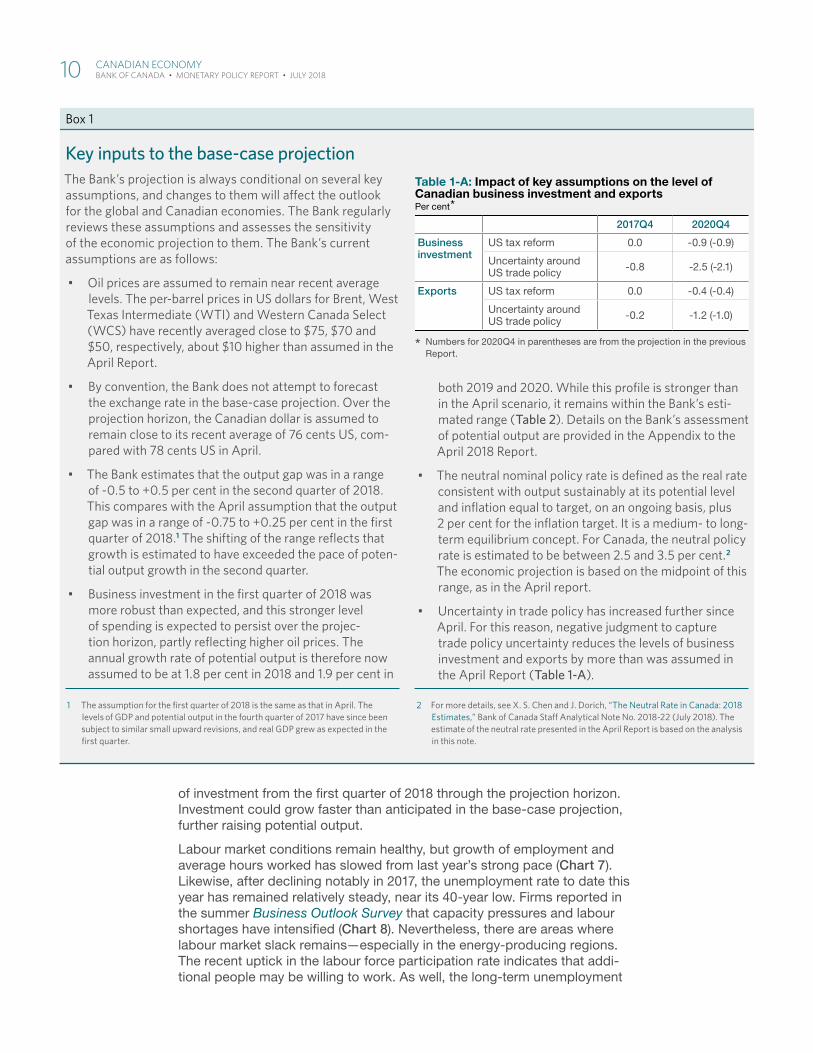
Labour market conditions remain healthy, but growth of employment and average hours worked has slowed from last year’s strong pace (Chart 7). Likewise, after declining notably in 2017, the unemployment rate to date this year has remained relatively steady, near its 40-year low. Firms reported in the summer Business Outlook Survey that capacity pressures and labour shortages have intensified (Chart 8). Nevertheless, there are areas where labour market slack remains—especially in the energy-producing regions. The recent uptick in the labour force participation rate indicates that addi-tional people may be willing to work. As well, the long-term unemployment
Key inputs to the base-case projectionThe Bank’s projection is always conditional on several key assumptions, and changes to them will aff ect the outlook for the global and Canadian economies . The Bank regularly reviews these assumptions and assesses the sensitivity of the economic projection to them . The Bank’s current assumptions are as follows:
• Oil prices are assumed to remain near recent average levels . The per-barrel prices in US dollars for Brent, West Texas Intermediate (WTI) and Western Canada Select (WCS) have recently averaged close to $75, $70 and $50, respectively, about $10 higher than assumed in the April Report .
• By convention, the Bank does not attempt to forecast the exchange rate in the base-case projection . Over the projection horizon, the Canadian dollar is assumed to remain close to its recent average of 76 cents US, com-pared with 78 cents US in April .
• The Bank estimates that the output gap was in a range of -0 .5 to +0 .5 per cent in the second quarter of 2018 . This compares with the April assumption that the output gap was in a range of -0 .75 to +0 .25 per cent in the fi rst quarter of 2018 .1 The shifting of the range refl ects that growth is estimated to have exceeded the pace of poten-tial output growth in the second quarter .
• Business investment in the fi rst quarter of 2018 was more robust than expected, and this stronger level of spending is expected to persist over the projec-tion horizon, partly refl ecting higher oil prices . The annual growth rate of potential output is therefore now assumed to be at 1 .8 per cent in 2018 and 1 .9 per cent in
1 The assumption for the fi rst quarter of 2018 is the same as that in April . The levels of GDP and potential output in the fourth quarter of 2017 have since been subject to similar small upward revisions, and real GDP grew as expected in the fi rst quarter .
both 2019 and 2020 . While this profi le is stronger than in the April scenario, it remains within the Bank’s esti-mated range (Table 2) . Details on the Bank’s assessment of potential output are provided in the Appendix to the April 2018 Report .
• The neutral nominal policy rate is defi ned as the real rate consistent with output sustainably at its potential level and infl ation equal to target, on an ongoing basis, plus 2 per cent for the infl ation target . It is a medium- to long-term equilibrium concept . For Canada, the neutral policy rate is estimated to be between 2 .5 and 3 .5 per cent .2 The economic projection is based on the midpoint of this range, as in the April report .
• Uncertainty in trade policy has increased further since April . For this reason, negative judgment to capture trade policy uncertainty reduces the levels of business investment and exports by more than was assumed in the April Report (Table 1-A) .
2 For more details, see X . S . Chen and J . Dorich, “The Neutral Rate in Canada: 2018 Estimates,” Bank of Canada Staff Analytical Note No . 2018-22 (July 2018) . The estimate of the neutral rate presented in the April Report is based on the analysis in this note .
Box 1
Table 1-A: Impact of key assumptions on the level of Canadian business investment and exportsPer cent*
2017Q4 2020Q4
Business investment
US tax reform 0.0 -0.9 (-0.9)
Uncertainty around US trade policy -0.8 -2.5 (-2.1)
Exports US tax reform 0.0 -0.4 (-0.4)
Uncertainty around US trade policy -0.2 -1.2 (-1.0)
* Numbers for 2020Q4 in parentheses are from the projection in the previous Report.
10 CanaDian EConoMy banK oF CanaDa • MonEtaRy PoliCy REPoRt • July 2018
rate is still relatively high, and the participation rate in the youth labour market remains subdued. Against this backdrop, underlying wage growth remains close to 2.3 per cent, indicating less wage pressure than would be expected in a labour market with no slack.4, 5
4 Measures of wage growth have diverged recently. The wage measure from the Labour Force Survey grew at a relatively strong pace of 3.6 per cent between June 2017 and June 2018. Recent releases of other wage measures from the Survey of Employment, Payrolls and Hours; the National Accounts; and the Productivity Accounts indicate that they have grown at a slower pace, in a range of 1.9 to 2.1 per cent.
5 The Bank constructs a wage measure that better captures underlying wage pressures and reflects the common trend across the alternative measures of labour compensation. For details on this measure, known as the “wage-common,” see D. Brouillette, J. Lachaine and B. Vincent, “Wages: Measurement and Key Drivers,” Bank of Canada Staff Analytical Note No. 2018-2 (January 2018).
Chart 7: Labour input growth is solid but has slowed since last year Year-over-year percentage change, monthly data
Employment Average hours worked Growth in total hours worked
Sources: Statistics Canada and Bank of Canada calculations Last observation: June 2018
-3
-2
-1
0
1
2
3
4
2015 2016 2017 2018
%
Chart 8: Both capacity pressures and labour shortages have intensifi edBalances of opinion,* quarterly data
Intensity of labour shortages Intensity of capacity pressures
* Percentage of fi rms responding to the Business Outlook Survey reporting more intense capacity pressures (or labour shortages) compared with 12 months ago minus the percentage of fi rms reporting less intense capacity pressures (or labour shortages)
Source: Bank of Canada Last observation: 2018Q2
-40
-30
-20
-10
0
10
20
30
40
50
2015 2016 2017 2018
%
CanaDian EConoMy 11 banK oF CanaDa • MonEtaRy PoliCy REPoRt • July 2018
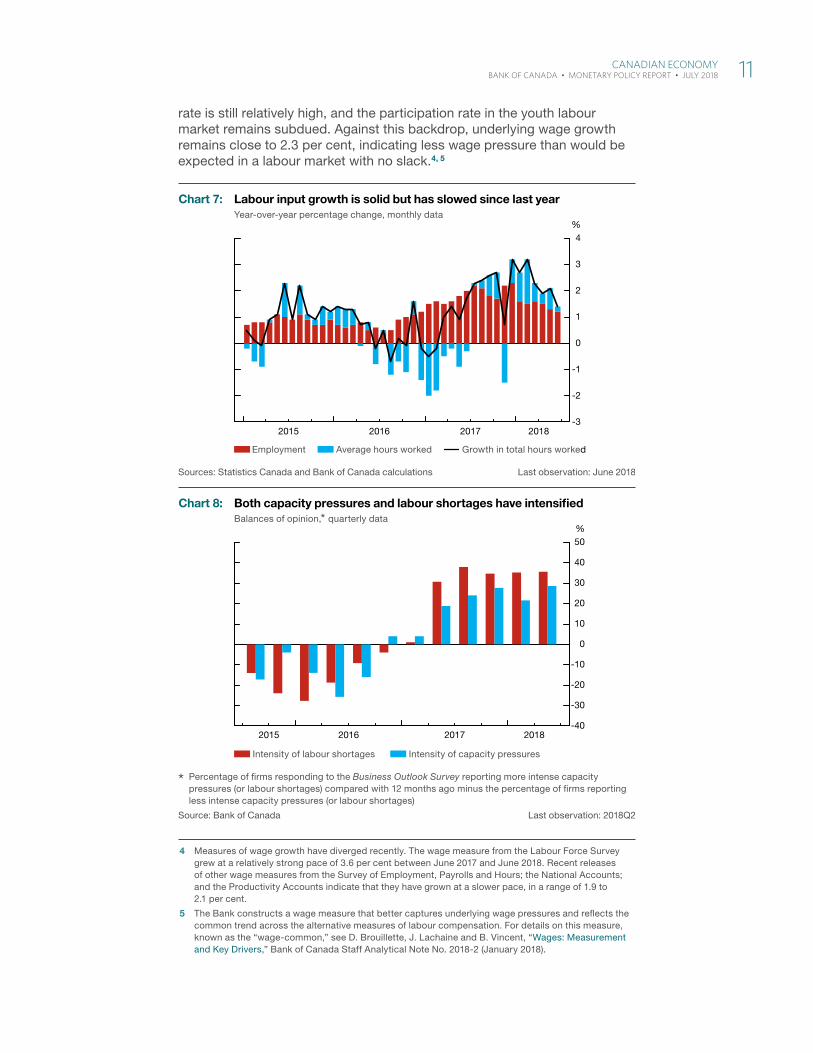
Consistent with an economy operating near potential, core inflation meas-ures remain close to 2 per cent (Chart 9). CPI inflation is slightly above 2 per cent, mainly reflecting temporary upward pressures from increases in gasoline prices and in the prices of services affected by recent rises in minimum wages.6
GDP growth is expected to average 2 per cent, but the outlook is clouded by trade issuesThe Bank expects that GDP will grow somewhat faster than potential output over the projection horizon. Consumption should be supported by solid gains in real gross domestic income. The combined contribution to growth of exports and investment will continue to be better than in recent years, even after incorporating the restraining effects of the US tariffs and the Canadian countermeasures (Box 2). Growth of government spending is projected to slow in 2019 and 2020 relative to the previous two years as the effects of the 2016 federal budget stimulus gradually dissipate.7
Following the Bank’s recent practice, the base-case projection incorpor-ates the impact of trade policy uncertainty (Box 1), as well as the effects of implemented tariffs (Table 4). These tariffs include previously imposed US tariffs on Canadian softwood lumber and newsprint, the new US tariffs on steel and aluminum imports from Canada, and Canadian countermeasures. The dampening effects associated with trade policy uncertainty and the implemented US tariffs subtract about 2/3 per cent from the level of GDP by the end of 2020. While this drag is larger than in the April Report, the incre-mental drag on projected GDP roughly balances the positive impact of higher oil prices.
6 The prices of certain services, such as restaurants; child care and housekeeping; and personal care services, have increased sharply in Ontario since the start of the year.
7 By convention, only announced federal and provincial budgets are incorporated into the projection for government spending. Without a budget from the new provincial government in Ontario, the assump-tion for spending by the Ontario government is unchanged from the April Report.
Chart 9: Core infl ation measures remain close to 2 per centYear-over-year percentage change, monthly data
CPI-trim CPI-median CPI-common Target
Sources: Statistics Canada and Bank of Canada Last observation: May 2018
2007 2008 2009 2010 2011 2012 2013 2014 2015 2016 2017 20180.5
1.0
1.5
2.0
2.5
3.0%
12 CanaDian EConoMy banK oF CanaDa • MonEtaRy PoliCy REPoRt • July 2018
Box 2
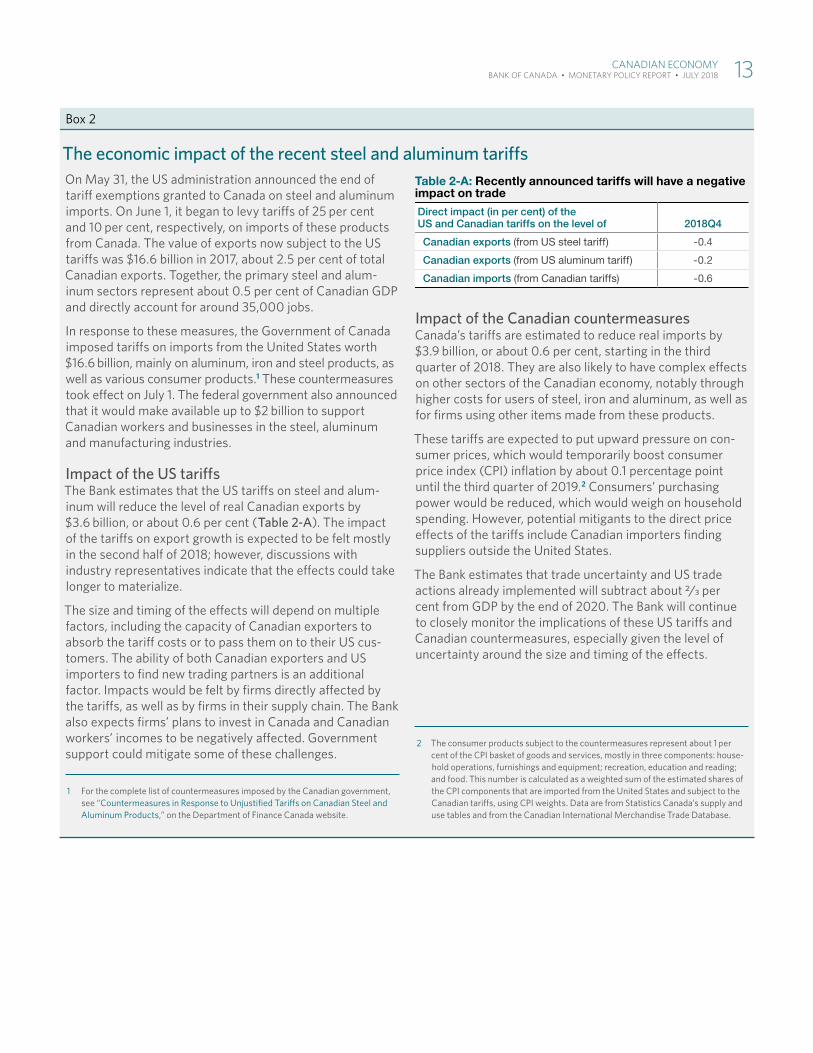
The economic impact of the recent steel and aluminum tariff sOn May 31, the US administration announced the end of tariff exemptions granted to Canada on steel and aluminum imports . On June 1, it began to levy tariff s of 25 per cent and 10 per cent, respectively, on imports of these products from Canada . The value of exports now subject to the US tariff s was $16 .6 billion in 2017, about 2 .5 per cent of total Canadian exports . Together, the primary steel and alum-inum sectors represent about 0 .5 per cent of Canadian GDP and directly account for around 35,000 jobs .
In response to these measures, the Government of Canada imposed tariff s on imports from the United States worth $16 .6 billion, mainly on aluminum, iron and steel products, as well as various consumer products .1 These countermeasures took eff ect on July 1 . The federal government also announced that it would make available up to $2 billion to support Canadian workers and businesses in the steel, aluminum and manufacturing industries .
Impact of the US tariff sThe Bank estimates that the US tariff s on steel and alum-inum will reduce the level of real Canadian exports by $3 .6 billion, or about 0 .6 per cent (Table 2-A) . The impact of the tariff s on export growth is expected to be felt mostly in the second half of 2018; however, discussions with industry representatives indicate that the eff ects could take longer to materialize .
The size and timing of the eff ects will depend on multiple factors, including the capacity of Canadian exporters to absorb the tariff costs or to pass them on to their US cus-tomers . The ability of both Canadian exporters and US importers to fi nd new trading partners is an additional factor . Impacts would be felt by fi rms directly aff ected by the tariff s, as well as by fi rms in their supply chain . The Bank also expects fi rms’ plans to invest in Canada and Canadian workers’ incomes to be negatively aff ected . Government support could mitigate some of these challenges .
1 For the complete list of countermeasures imposed by the Canadian government, see “Countermeasures in Response to Unjustifi ed Tariff s on Canadian Steel and Aluminum Products,” on the Department of Finance Canada website .
Impact of the Canadian countermeasuresCanada’s tariff s are estimated to reduce real imports by $3 .9 billion, or about 0 .6 per cent, starting in the third quarter of 2018 . They are also likely to have complex eff ects on other sectors of the Canadian economy, notably through higher costs for users of steel, iron and aluminum, as well as for fi rms using other items made from these products .
These tariff s are expected to put upward pressure on con-sumer prices, which would temporarily boost consumer price index (CPI) infl ation by about 0 .1 percentage point until the third quarter of 2019 .2 Consumers’ purchasing power would be reduced, which would weigh on household spending . However, potential mitigants to the direct price eff ects of the tariff s include Canadian importers fi nding suppliers outside the United States .
The Bank estimates that trade uncertainty and US trade actions already implemented will subtract about 2/3 per cent from GDP by the end of 2020 . The Bank will continue to closely monitor the implications of these US tariff s and Canadian countermeasures, especially given the level of uncertainty around the size and timing of the eff ects .
2 The consumer products subject to the countermeasures represent about 1 per cent of the CPI basket of goods and services, mostly in three components: house-hold operations, furnishings and equipment; recreation, education and reading; and food . This number is calculated as a weighted sum of the estimated shares of the CPI components that are imported from the United States and subject to the Canadian tariff s, using CPI weights . Data are from Statistics Canada’s supply and use tables and from the Canadian International Merchandise Trade Database .
Table 2-A: Recently announced tariffs will have a negative impact on trade
Direct impact (in per cent) of the US and Canadian tariffs on the level of 2018Q4
Canadian exports (from US steel tariff) -0.4
Canadian exports (from US aluminum tariff) -0.2
Canadian imports (from Canadian tariffs) -0.6
CanaDian EConoMy 13 banK oF CanaDa • MonEtaRy PoliCy REPoRt • July 2018

Household spending is expected to grow moderatelyConsumer spending is expected to provide less support to GDP growth than in 2017. The contribution of residential investment is expected to be small in 2018 and to subsequently decline. The decline is driven by tighter mortgage rules and higher interest rates.
The sensitivity of consumption and housing to interest rates is estimated to be larger than in past cycles, given the elevated ratio of household debt to disposable income. The impact of higher interest rates likely differs across categories of borrowers, with highly indebted households the most affected (Box 3).
Consumption growth is expected to be supported by a pickup in wage growth and an improvement in Canada’s terms of trade resulting from higher oil prices. However, growth in consumer spending is anticipated to be tem-pered by a modest slowdown in the growth of total hours worked and by the revisions to mortgage rules. The revised rules may prompt some households to save more so that they can pass the tighter mortgage stress tests.
Residential investment is slowing, reflecting the effects of higher interest rates and tighter mortgage rules. Resale activity contracted when the revised measures went into effect but is anticipated to improve over the next few quarters. Data on resale activity and housing starts suggest that the housing market is beginning to stabilize. Growth of new construction spending is expected to slow over the projection horizon. The new mortgage measures may cause households to purchase less-expensive residences because typical homebuyers are now more constrained in how much they can borrow.
Table 4: Recently imposed US tariffs
Goods subject to new US trade policies Duty/tariff rate (per cent) Implementation dates
Total nominal exports in 2017 (Can$ billions)
Share of total Canadian exports (per cent)
Newsprint and uncoated groundwood paper* 28.7 January 9, 2018
and March 13, 2018 2.2 0.3
Softwood lumber† 20.2 April 24, 2017 and June 26, 2017 8.6 1.3
Steel products 25.0 June 1, 2018 7.2 1.1
Aluminum products 10.0 June 1, 2018 9.4 1.4
* The duty rate shown is the sum of the average preliminary countervailing and anti-dumping duties announced by the US Department of Commerce on January 9 and March 13, 2018, respectively.
† While fi nal duties on softwood lumber became effective in January 2018, preliminary duties were implemented on April 24 and June 26, 2017. The duty rate displayed for softwood lumber is the sum of the average anti-dumping and countervailing duties announced by the US Department of Commerce.
14 CanaDian EConoMy banK oF CanaDa • MonEtaRy PoliCy REPoRt • July 2018
Box 3
The impact of rising interest rates on mortgage holders
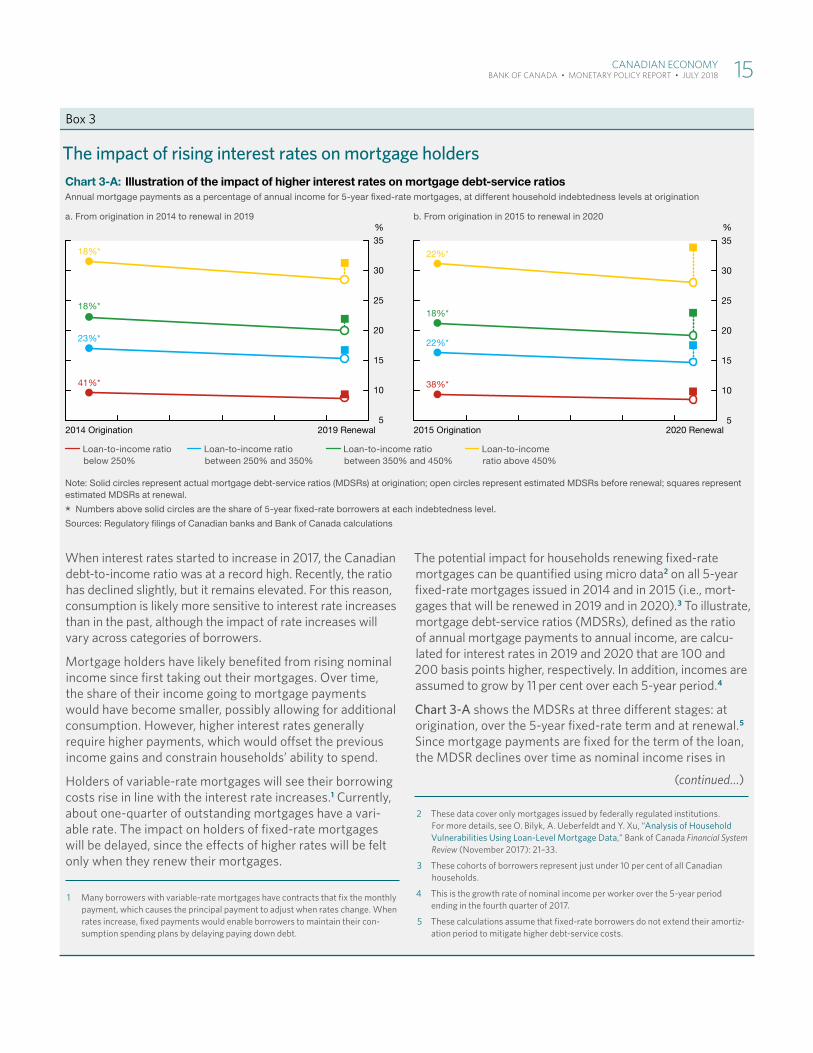
When interest rates started to increase in 2017, the Canadian debt-to-income ratio was at a record high . Recently, the ratio has declined slightly, but it remains elevated . For this reason, consumption is likely more sensitive to interest rate increases than in the past, although the impact of rate increases will vary across categories of borrowers .
Mortgage holders have likely benefi ted from rising nominal income since fi rst taking out their mortgages . Over time, the share of their income going to mortgage payments would have become smaller, possibly allowing for additional consumption . However, higher interest rates generally require higher payments, which would off set the previous income gains and constrain households’ ability to spend .
Holders of variable-rate mortgages will see their borrowing costs rise in line with the interest rate increases .1 Currently, about one-quarter of outstanding mortgages have a vari-able rate . The impact on holders of fi xed-rate mortgages will be delayed, since the eff ects of higher rates will be felt only when they renew their mortgages .
1 Many borrowers with variable-rate mortgages have contracts that fi x the monthly payment, which causes the principal payment to adjust when rates change . When rates increase, fi xed payments would enable borrowers to maintain their con-sumption spending plans by delaying paying down debt .
The potential impact for households renewing fi xed-rate mortgages can be quantifi ed using micro data2 on all 5-year fi xed-rate mortgages issued in 2014 and in 2015 (i .e ., mort-gages that will be renewed in 2019 and in 2020) .3 To illustrate, mortgage debt-service ratios (MDSRs), defi ned as the ratio of annual mortgage payments to annual income, are calcu-lated for interest rates in 2019 and 2020 that are 100 and 200 basis points higher, respectively . In addition, incomes are assumed to grow by 11 per cent over each 5-year period .4
Chart 3-A shows the MDSRs at three diff erent stages: at origination, over the 5-year fi xed-rate term and at renewal .5 Since mortgage payments are fi xed for the term of the loan, the MDSR declines over time as nominal income rises in
2 These data cover only mortgages issued by federally regulated institutions . For more details, see O . Bilyk, A . Ueberfeldt and Y . Xu, “Analysis of Household Vulnerabilities Using Loan-Level Mortgage Data,” Bank of Canada Financial System Review (November 2017): 21–33 .
3 These cohorts of borrowers represent just under 10 per cent of all Canadian households .
4 This is the growth rate of nominal income per worker over the 5-year period ending in the fourth quarter of 2017 .
5 These calculations assume that fi xed-rate borrowers do not extend their amortiz-ation period to mitigate higher debt-service costs .
Chart 3-A: Illustration of the impact of higher interest rates on mortgage debt-service ratiosAnnual mortgage payments as a percentage of annual income for 5-year fi xed-rate mortgages, at different household indebtedness levels at origination
a. From origination in 2014 to renewal in 2019 b. From origination in 2015 to renewal in 2020
Loan-to-income ratio below 250%
Loan-to-income ratio between 250% and 350%
Loan-to-income ratio between 350% and 450%
Loan-to-income ratio above 450%
Note: Solid circles represent actual mortgage debt-service ratios (MDSRs) at origination; open circles represent estimated MDSRs before renewal; squares represent estimated MDSRs at renewal.
* Numbers above solid circles are the share of 5-year fi xed-rate borrowers at each indebtedness level.
Sources: Regulatory fi lings of Canadian banks and Bank of Canada calculations
5
10
15
20
25
30
35%
2014 Origination
18%*
18%*
23%*
41%*
2019 Renewal5
10
15
20
25
30
35
%
2015 Origination 2020 Renewal
22%*
18%*
22%*
38%*
(continued…)
CanaDian EConoMy 15 banK oF CanaDa • MonEtaRy PoliCy REPoRt • July 2018
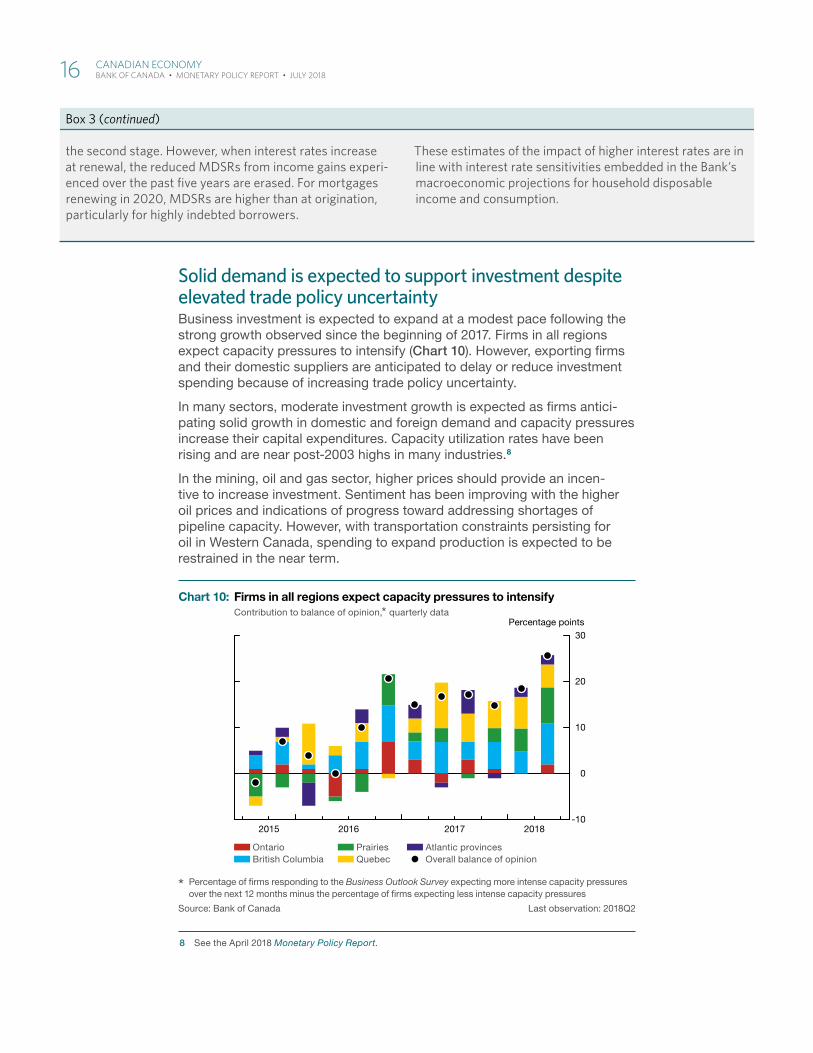
Solid demand is expected to support investment despite elevated trade policy uncertaintyBusiness investment is expected to expand at a modest pace following the strong growth observed since the beginning of 2017. Firms in all regions expect capacity pressures to intensify (Chart 10). However, exporting firms and their domestic suppliers are anticipated to delay or reduce investment spending because of increasing trade policy uncertainty.
In many sectors, moderate investment growth is expected as firms antici-pating solid growth in domestic and foreign demand and capacity pressures increase their capital expenditures. Capacity utilization rates have been rising and are near post-2003 highs in many industries.8
In the mining, oil and gas sector, higher prices should provide an incen-tive to increase investment. Sentiment has been improving with the higher oil prices and indications of progress toward addressing shortages of pipeline capacity. However, with transportation constraints persisting for oil in Western Canada, spending to expand production is expected to be restrained in the near term.
8 See the April 2018 Monetary Policy Report.
Box 3 (continued)
the second stage . However, when interest rates increase at renewal, the reduced MDSRs from income gains experi-enced over the past fi ve years are erased . For mortgages renewing in 2020, MDSRs are higher than at origination, particularly for highly indebted borrowers .
These estimates of the impact of higher interest rates are in line with interest rate sensitivities embedded in the Bank’s macroeconomic projections for household disposable income and consumption .
Chart 10: Firms in all regions expect capacity pressures to intensifyContribution to balance of opinion,* quarterly data
Ontario British Columbia
Prairies Quebec
Atlantic provinces Overall balance of opinion
* Percentage of fi rms responding to the Business Outlook Survey expecting more intense capacity pressures over the next 12 months minus the percentage of fi rms expecting less intense capacity pressures
Source: Bank of Canada Last observation: 2018Q2
-10
0
10
20
30
2015 2016 2017 2018
Percentage points
16 CanaDian EConoMy banK oF CanaDa • MonEtaRy PoliCy REPoRt • July 2018
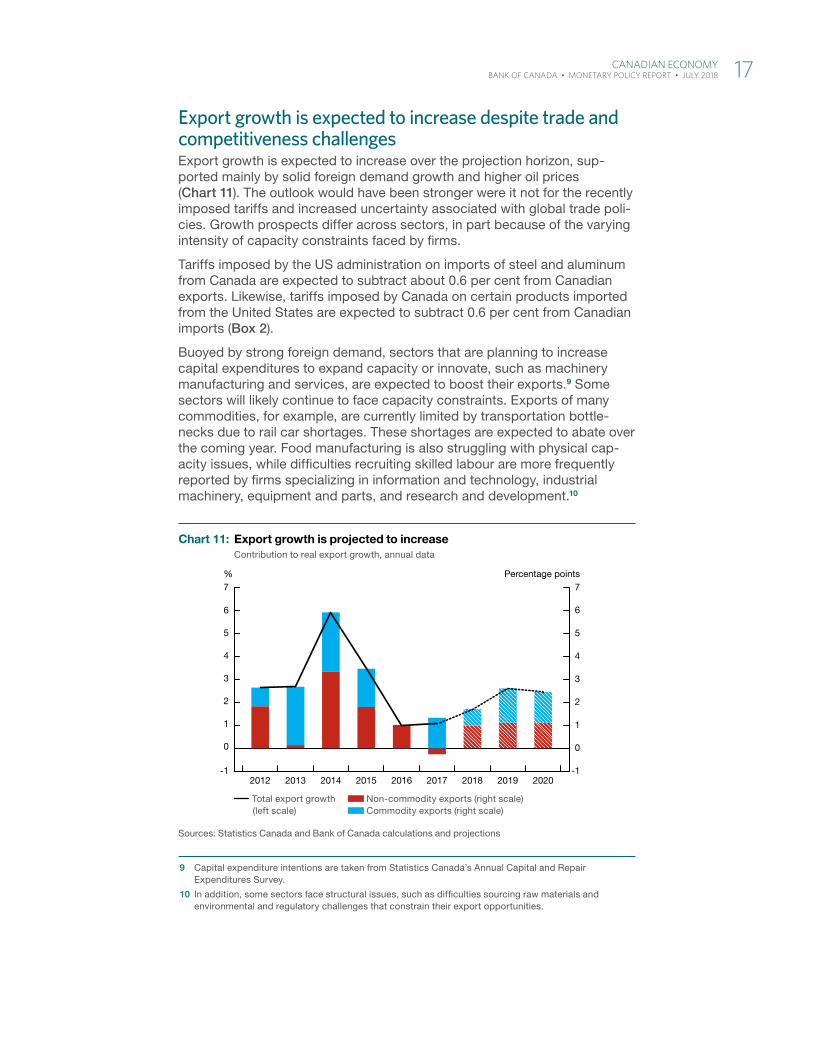
Export growth is expected to increase despite trade and competitiveness challenges Export growth is expected to increase over the projection horizon, sup-ported mainly by solid foreign demand growth and higher oil prices (Chart 11). The outlook would have been stronger were it not for the recently imposed tariffs and increased uncertainty associated with global trade poli-cies. Growth prospects differ across sectors, in part because of the varying intensity of capacity constraints faced by firms.
Tariffs imposed by the US administration on imports of steel and aluminum from Canada are expected to subtract about 0.6 per cent from Canadian exports. Likewise, tariffs imposed by Canada on certain products imported from the United States are expected to subtract 0.6 per cent from Canadian imports (Box 2).
Buoyed by strong foreign demand, sectors that are planning to increase capital expenditures to expand capacity or innovate, such as machinery manufacturing and services, are expected to boost their exports.9 Some sectors will likely continue to face capacity constraints. Exports of many commodities, for example, are currently limited by transportation bottle-necks due to rail car shortages. These shortages are expected to abate over the coming year. Food manufacturing is also struggling with physical cap-acity issues, while difficulties recruiting skilled labour are more frequently reported by firms specializing in information and technology, industrial machinery, equipment and parts, and research and development.10
9 Capital expenditure intentions are taken from Statistics Canada’s Annual Capital and Repair Expenditures Survey.
10 In addition, some sectors face structural issues, such as difficulties sourcing raw materials and environmental and regulatory challenges that constrain their export opportunities.
Chart 11: Export growth is projected to increase Contribution to real export growth, annual data
Total export growth (left scale)
Non-commodity exports (right scale) Commodity exports (right scale)
Sources: Statistics Canada and Bank of Canada calculations and projections
-1
0
1
2
3
4
5
6
7
-1
0
1
2
3
4
5
6
7%
2012 2013 2014 2015 2016 2017 2018 2019 2020
Percentage points
CanaDian EConoMy 17 banK oF CanaDa • MonEtaRy PoliCy REPoRt • July 2018
The Bank continues to assume that competitiveness challenges will restrain export growth over the forecast horizon. This follows losses of competitive-ness in recent years that were experienced in all categories of non-energy exports.11
Growth of imports is expected to slow over the projection horizon, con-sistent with the moderation in the growth rate of final domestic demand and the tariffs imposed by Canada on certain US products.
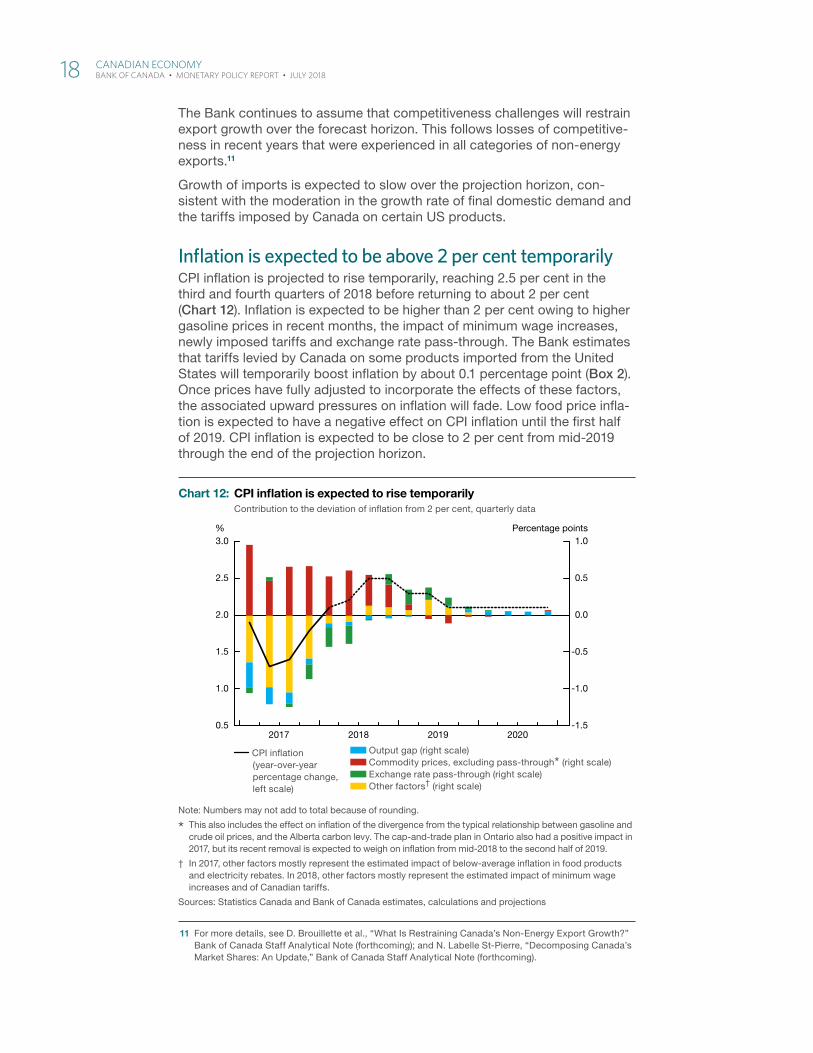
Inflation is expected to be above 2 per cent temporarilyCPI inflation is projected to rise temporarily, reaching 2.5 per cent in the third and fourth quarters of 2018 before returning to about 2 per cent (Chart 12). Inflation is expected to be higher than 2 per cent owing to higher gasoline prices in recent months, the impact of minimum wage increases, newly imposed tariffs and exchange rate pass-through. The Bank estimates that tariffs levied by Canada on some products imported from the United States will temporarily boost inflation by about 0.1 percentage point (Box 2). Once prices have fully adjusted to incorporate the effects of these factors, the associated upward pressures on inflation will fade. Low food price infla-tion is expected to have a negative effect on CPI inflation until the first half of 2019. CPI inflation is expected to be close to 2 per cent from mid-2019 through the end of the projection horizon.
11 For more details, see D. Brouillette et al., “What Is Restraining Canada’s Non-Energy Export Growth?” Bank of Canada Staff Analytical Note (forthcoming); and N. Labelle St-Pierre, “Decomposing Canada’s Market Shares: An Update,” Bank of Canada Staff Analytical Note (forthcoming).
Chart 12: CPI infl ation is expected to rise temporarilyContribution to the deviation of infl ation from 2 per cent, quarterly data
CPI infl ation (year-over-year percentage change, left scale)
Output gap (right scale) Commodity prices, excluding pass-through* (right scale) Exchange rate pass-through (right scale) Other factors† (right scale)
Note: Numbers may not add to total because of rounding.
* This also includes the effect on infl ation of the divergence from the typical relationship between gasoline and crude oil prices, and the Alberta carbon levy. The cap-and-trade plan in Ontario also had a positive impact in 2017, but its recent removal is expected to weigh on infl ation from mid-2018 to the second half of 2019.
† In 2017, other factors mostly represent the estimated impact of below-average infl ation in food products and electricity rebates. In 2018, other factors mostly represent the estimated impact of minimum wage increases and of Canadian tariffs.
Sources: Statistics Canada and Bank of Canada estimates, calculations and projections
2017 2018 2019 2020-1.5
-1.0
-0.5
0.0
0.5
1.0
0.5
1.0
1.5
2.0
2.5
3.0Percentage points%
18 CanaDian EConoMy banK oF CanaDa • MonEtaRy PoliCy REPoRt • July 2018

The base-case projection provides the Bank’s view of the most likely out-come for inflation. Any projection is subject to considerable forecast uncer-tainty. A 90 per cent confidence band around the inflation projection widens from ±0.6 percentage points in the third quarter of 2018 to ±1.5 percentage points by the end of 2020.
The projection is consistent with medium- and long-term inflation expecta-tions remaining well anchored. Most respondents to the summer Business Outlook Survey anticipate that inflation will remain within the Bank’s target range of 1 to 3 per cent over the next two years. The majority expect infla-tion to be in the upper half of that range, consistent with the Bank’s pro-jection. The June 2018 Consensus Economics forecast for CPI inflation is 2.3 per cent in 2018 and 2.0 per cent in 2019, with long-term annual inflation expectations averaging 2.0 per cent through 2028.
CanaDian EConoMy 19 banK oF CanaDa • MonEtaRy PoliCy REPoRt • July 2018
Risks to the inflation outlookThe ongoing shift toward protectionist global trade policies remains the most important source of uncertainty surrounding the outlook. Related risks have broadened and intensified, although some aspects of these risks have been partially realized with the imposition of tariffs by the US admin-istration and countermeasures by other countries. With respect to bilateral trade arrangements between the United States and Canada, the base-case projection incorporates the effects of the US tariffs on steel and aluminum imports from Canada and Canadian countermeasures. It also incorporates the effects of previously imposed US tariffs on Canadian softwood lumber and newsprint and those of trade policy uncertainty.
It is impossible to fully quantify the possible outcomes associated with changing trade policies without clarity about the actual measures and their timing. The range of possibilities is wide, and the channels through which the measures would affect the economy are complex.
In this context, the Bank assesses that the risks to the projected path for inflation are roughly balanced. As in past reports, the focus is on a selec-tion of risks identified as the most important for the projected path for infla-tion, drawing from a larger set of risks accounted for in the projection. The evolution of risks since April is summarized in Table 5. The risk of weaker Canadian exports and investment has intensified since April.
(i) Weaker Canadian investment and exportsA broadening of US tariffs could pose a significant risk to Canadian economic activity. While the primary channel for such trade policy actions would be through reduced exports and imports, additional channels of transmission could be important. For industries that comprise a relatively large share of Canadian exports and with highly integrated cross-border supply chains, such as the auto sector, tariffs would have large impacts on investment and employment. Adverse effects on business and consumer confidence could lead to large negative spillovers on household spending and on business invest-ment in other sectors of the economy. Moreover, an overall reduction in investment and dislocation of global value chains would have nega-tive effects on productivity and potential growth. These effects would be mitigated by a depreciation of the Canadian dollar and possibly by government measures to support affected industries and workers. The direct effect of tariffs and exchange rate pass-through would immediately result in higher prices for some goods and reduce con-sumer purchasing power. In an economy already operating at cap-acity, this could lead to demands for higher wage increases and, in turn, put upward pressure on prices. In addition, there are two-sided
RisKs to thE inFlation outlooK 21 banK oF CanaDa • MonEtaRy PoliCy REPoRt • July 2018
effects associated with the demand and supply implications of the tariffs. Weaker aggregate demand would weigh on price inflation, although reductions to potential output would work in the opposite direction.
(ii) Sharp tightening of global financial conditionsGlobal financial conditions remain broadly accommodative, but could tighten suddenly. Further escalation of trade tensions, a faster-than-anticipated pickup in wage and price inflation, or significant increases in expectations of the future path of monetary policy could lead to higher term premiums and equity risk premiums. If premiums were to rise, the higher bond yields could increase capital outflows from EMEs, exacerbating country-specific vulnerabilities in some cases, and financial conditions could tighten further. These developments could translate into a decline in activity in sectors sensitive to interest rates, a rise in debt-service burdens, weaker global and Canadian growth, and a decline in commodity prices.
(iii) Stronger real GDP growth in the United StatesThe outlook for US GDP growth in 2018 has been revised up following signs in recent data of greater-than-expected strength. However, growth over the projection horizon could be stronger if trade-related uncertainty diminishes or tax reform and deregulation trigger animal spirits. The resulting boost to investment, as well as stronger house-hold spending, would have positive implications for Canadian invest-ment and exports.
(iv) Stronger consumption and rising household debt in CanadaWhile consumption has been weaker than expected in the first quarter of 2018, persistently elevated consumer confidence could lead to even stronger consumer spending, with a savings rate that falls below the relatively high level embedded in the projection. The vulnerabilities associated with household indebtedness would be exacerbated if the additional spending were financed by more borrowing.
(v) A pronounced decline in house prices in overheated markets in CanadaWhile there has been some moderation in price growth and less speculative demand in the single-family home segment, prices for condominiums have continued to increase rapidly in some markets. Thus, there remains a risk of a sharp decline in house prices in over-heated markets, which would likely dampen residential investment and consumption.
22 RisKs to thE inFlation outlooK banK oF CanaDa • MonEtaRy PoliCy REPoRt • July 2018
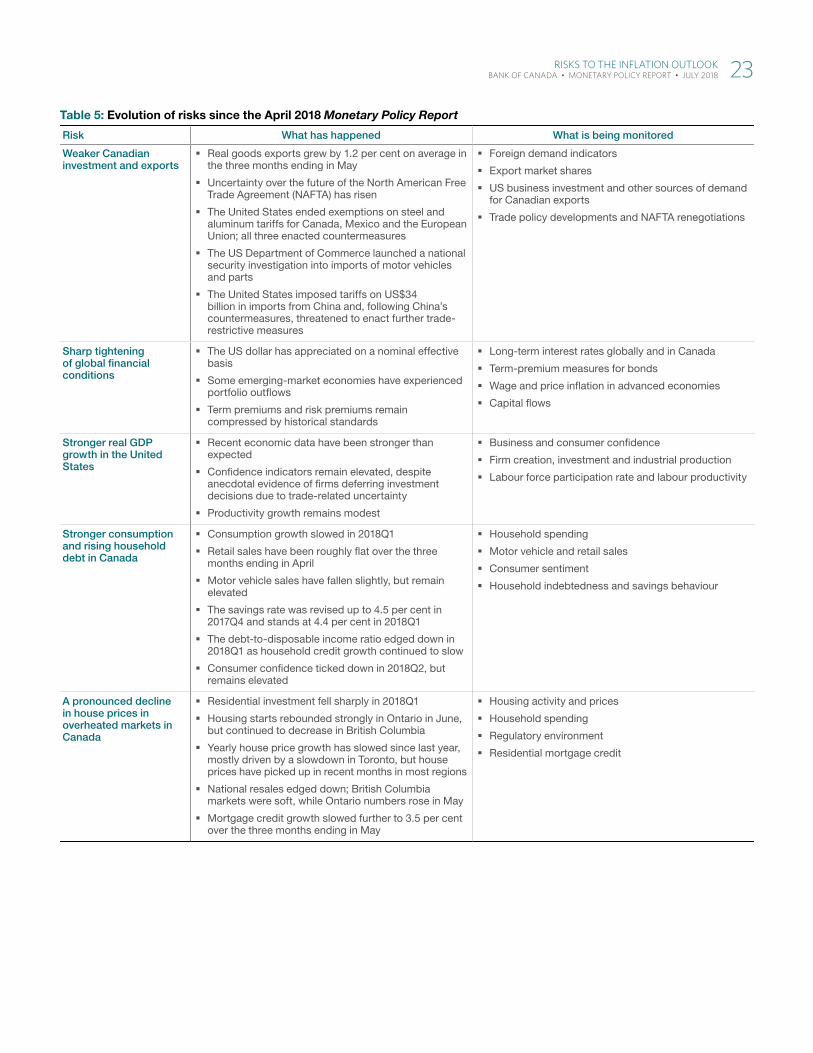
Table 5: Evolution of risks since the April 2018 Monetary Policy Report
Risk What has happened What is being monitored
Weaker Canadian investment and exports
Real goods exports grew by 1.2 per cent on average in the three months ending in May
Uncertainty over the future of the North American Free Trade Agreement (NAFTA) has risen
The United States ended exemptions on steel and aluminum tariffs for Canada, Mexico and the European Union; all three enacted countermeasures
The US Department of Commerce launched a national security investigation into imports of motor vehicles and parts
The United States imposed tariffs on US$34 billion in imports from China and, following China’s countermeasures, threatened to enact further trade-restrictive measures
Foreign demand indicators
Export market shares
US business investment and other sources of demand for Canadian exports
Trade policy developments and NAFTA renegotiations
Sharp tightening of global fi nancial conditions
The US dollar has appreciated on a nominal effective basis
Some emerging-market economies have experienced portfolio outfl ows
Term premiums and risk premiums remain compressed by historical standards
Long-term interest rates globally and in Canada
Term-premium measures for bonds
Wage and price infl ation in advanced economies
Capital fl ows
Stronger real GDP growth in the United States
Recent economic data have been stronger than expected
Confi dence indicators remain elevated, despite anecdotal evidence of fi rms deferring investment decisions due to trade-related uncertainty
Productivity growth remains modest
Business and consumer confi dence
Firm creation, investment and industrial production
Labour force participation rate and labour productivity
Stronger consumption and rising household debt in Canada
Consumption growth slowed in 2018Q1
Retail sales have been roughly fl at over the three months ending in April
Motor vehicle sales have fallen slightly, but remain elevated
The savings rate was revised up to 4.5 per cent in 2017Q4 and stands at 4.4 per cent in 2018Q1
The debt-to-disposable income ratio edged down in 2018Q1 as household credit growth continued to slow
Consumer confi dence ticked down in 2018Q2, but remains elevated
Household spending
Motor vehicle and retail sales
Consumer sentiment
Household indebtedness and savings behaviour
A pronounced decline in house prices in overheated markets in Canada
Residential investment fell sharply in 2018Q1
Housing starts rebounded strongly in Ontario in June, but continued to decrease in British Columbia
Yearly house price growth has slowed since last year, mostly driven by a slowdown in Toronto, but house prices have picked up in recent months in most regions
National resales edged down; British Columbia markets were soft, while Ontario numbers rose in May
Mortgage credit growth slowed further to 3.5 per cent over the three months ending in May
Housing activity and prices
Household spending
Regulatory environment
Residential mortgage credit
RisKs to thE inFlation outlooK 23 banK oF CanaDa • MonEtaRy PoliCy REPoRt • July 2018