money hei$t
TRANSCRIPT

1
MONEY HEI$TCovid-19 Wage Theft in Global Garment Supply Chains

2
Design and layout: Koundinya Dhulipalla
Graphics sourced from freepik.com
The text of this publication is available under Creative Commons Attribution 4.0 International license. Photos are excluded from this license, as their copyright falls under the original copyright owner, which may or may not be Asia Floor Wage Alliance.
Contact us for questions regarding use of any materials: [email protected]

3
AcknowledgementsThis report was made possible due to the tremendous efforts of Asian trade unions and labour organisations in undertaking data collection during extremely challenging times, in order to capture and respond to the severe crisis facing garment workers during the Covid-19 pandemic. This report was prepared by the Asia Floor Wage Alliance (AFWA) in collaboration with 23 trade unions and labour organisations across six countries, including Commercial and Industrial Workers’ Union (CIWU), Dabindu Collective, Revolutionary Existence for Human Development (RED), Stand Up Movement Lanka, and the Textile Garment and Clothing Workers’ Union (TGCWU) in Sri Lanka; Labour Education Foundation (LEF), Labour Qaumi Movement (LQM), National Trade Union Federation (NTUF), and Pakistan Institute of Labour Education and Research (PILER) in Pakistan; Erode District Women Workers Federation (EDWF), Garment Labour Union (GLU), Garment and Allied Workers’ Union (GAWU), Karnataka Garment Workers’ Union (KOOGU), Mill Mazdoor Panchayat (MMP), and Tamil Nadu Textile and Common Labour Union (TTCU) in India; Federasi Serikat Buruh Garmen Kerajinan Tekstil Kulit dan Sentra Industri (FSB Garteks), Serikat Buruh Sejahtera Indonesia (SBSI) 1992 and Serikat Pekerja Nasional (SPN) in Indonesia; the Cambodian Alliance of Trade Unions (CATU) and Coalition of Cambodia Apparel Workers Democratic Union (C.CAWDU) in Cambodia; Bangladesh Nari Progati Sangha, Garment Worker Trade Union Centre (GWTUC), and Textile Garment Workers Federation (TGWF) in Bangladesh.
Data collectors, researchers and advisors from across countries played a crucial role in successfully putting together a cross-country report. We extend our thanks to Natasha van Hoff, Zameer Awan, Murtaza Bajwa, Aslam Miraj, Farhan Haider, Hamza Baloch, Abas Haider, Aruna K, Ganesh Kumar, Bhargav O, Hemalatha, Sowmya, Bhavana, Yuvaraj S, Ary Joko, Agus Saefudin, Agus Pramono, Faisal Rahman, Abdul Aziz Pristiadi, Indah Fatma Sari, Robert, Iwan Kusmawan, Sugianto, As Ari, Suhendi, Djamaludin, Harry Febriyanto, Nazar, Nazer, Ruhiyat, Nazar Rattanakpreset, Loem Chanratanak, Chhorn Namchheav, Soumen Ghosh, Sanjana, Surendra Nath Murmu, for their support in data collection, cleaning and entry.
Abiramy Sivalogananthan, Vishmee Warnachapa, Aabida Ali, Wiranta Ginting, Rizki Estrada Portier, Gerry Michael Purba, Panha Vong, Ratana Samnang, Abdul Aziz Munshi and Mosabber Hossain played the important role of coordinating the research in their respective countries. Anannya Bhattacharjee, Arpan Ganguly, Ashim Roy, Karamat Ali, Patrick Lee, Dina Septi and Syarif Arifin provided extensive editorial inputs, guidance and support throughout the research and writing process; and Ashley Saxby helped in proofreading the report. The report was written by Aabid Firdausi, Nandita Shivakumar, Nivedita Jayaram and Rahul S on behalf of the entire team.

i
Foreword
The Culpability Of Brand Actions In The Global Recession2020 was a year unlike any other. This report documents what happened to garment workers across Asia – in Sri Lanka, Pakistan, India, Indonesia, Cambodia and Bangladesh, putting numbers to the 25 per cent or so wage losses suffered by these workers in 2020. The report argues that the wage losses were actually wage theft by the global brands for whom these workers produced garments. Before proceeding, I would like to congratulate the various researchers and trade union members across the above-mentioned countries, who have put together a cross-country study, overcoming all the constraints in carrying out research during pandemic-induced restrictions on movement and contact.
Can the wage loss suffered by garment workers be called wage theft by the brands for whom they produced garments? This is an important question that is posed by the report, in the context of contract manufacturing of garments by brands — one that I will deal with in the rest of this Foreword.
Garment workers covered in this study, work to produce garments for a number of brands from the Global North. But, they are not directly employed by these brands. Rather, workers are employed by suppliers in various countries of the Global South. These suppliers, however, are not independent manufacturers, having garments produced and selling them on the global market. Rather, they are contract manufacturers. They produce garments based on designs and specifications provided by the brands. This contracted production is handed over to the brands who also carry out the post-production branding and marketing of the garments. In several countries, employers engaging in labour sub-contracting are treated as principal employers of sub-contracted workers and contractors are treated as intermediaries. Similarly in global value chain (GVC) contracted production, the contracting brand should be considered the principal employer and suppliers intermediary employers. The regulation of GVCs, however, is undeveloped and brands are not held legally responsible for employment conditions in their cross-border supplier factories, as they would be in the case of foreign direct investment (FDI) based branches.
If brands are the principal employers of workers in supplier factories, they should have responsibility to sustain suppliers and their workers in times of recession, just as they take various measures to support share-holder value, even carrying out share buy-backs. Brands, however, refused to take or share any responsibility for either suppliers or their workers. Instead, some of them even refused to pay suppliers for orders already delivered, a step from which they stepped back only after exposure in the international media threatened them
ii
with a loss of reputation. Refusal to pay for orders already delivered, cancellation of orders for which suppliers had purchased inputs, all such measures discussed in this report, left suppliers without cash. There was a knock-on effect, with suppliers not paying wages to workers. Labour contractors went so far as to switch off their phones in order to avoid workers asking for their dues. There are variations in these responses, as documented in this report, with permanent workers, i.e. those who are important for renewing production when orders are revived, doing a little better than contract and otherwise precariously employed workers.
The main point from the above analysis is that the risks of business were basically transferred to suppliers from the Global South and, in turn, to their workers. While the owners of the suppliers would surely have been able to secure their consumption from their savings, the workers’ incomes were pushed below even the poverty line, with women workers falling even more behind the poverty line than men. In addition, women had to compensate for what was formerly purchased from the market, but could no longer be afforded, such as health services, with increasing unpaid care work. With governments of the supplier countries too doing little, again with differences between countries, workers and their families were forced to reduce consumption, deplete savings, increase debt taken on usurious rates of interest, and increase unpaid care work just to stay alive – in order to be able to return to work when the brands from the Global North once again required their labour.
Wages are meant to cover keeping a worker able to work and for children to go to school, etc. i.e. to cover the costs of social reproduction of labour power. A living wage, as advocated by the Asia Floor Wage Alliance (AFWA) is meant to cover just this cost of social reproduction incurred even when the worker is not at work, but costs that are necessary for them to recuperate in order to return to work. The brands, however, refused to cover the cost of social reproduction of labour power in their contracted factories. I stress contracted factories since they are not what may be called own-account enterprises, buying their inputs and selling their outputs on the market. Rather, what supplier factories and their workers do is to handover production carried out with given designs and specifications, in exchange for the contracted payment. It is this contract nature of the relationship between brands and their supplier factories that makes the brands, and not just the suppliers, liable for meeting the costs of social reproduction of workers. This, in turn, turns the wage loss incurred by garment workers into wage theft by brands from the Global North; wage theft carried out in order to shore up their share values. They sacrificed workers from the Global South to protect their share value in the Global North.
Even with all the excesses of brands (e.g. non-payment for orders already delivered) suppliers and their workers have no alternative but to remain available when the orders are revived. That is the reality of Global monopsony capitalism, where myriad suppliers and their workers from the South, in a condition of overall labour surplus, face a few brands (including mass retailers) from the Global North. Of course, there are also a few emerging brands, most from China and also a few from India, that are likely to have acted in such a manner. That only shows that one must pay attention to new emerging forces in global monopsony capitalism, but it does not alter the basic picture of the burden of the current global recession in garment production having been pushed onto suppliers and workers from the Global South. The certainty that suppliers and workers in the Global South will be there, even if with somewhat weakened bodies, when the brands require them – this is what underlies the behaviour of brands in
iii
carrying out wage theft in the current recession.
The report by AFWA researchers and union members very carefully documents and analyzes this wage theft by virtually every brand of importance from the US and EU. It deserves to be read carefully by anyone concerned about the condition of garment workers working in GVCs for brands and markets of the Global North.
Dev Nathan Visiting Professor, Institute for Human Development, India
Director Research, GenDev Centre for Research and Innovation, India Co-editor, Cambridge University Press Series on Global Value Chains

Foreword i
List of Figures v
List of Tables ix
1. Introduction 1
2. Methodology 11
3. Sri Lanka 19
4. Pakistan 42
5. Indonesia 63
6. India 87
7. Cambodia 113
8. Bangladesh 135
9. Typology of Managerial Practices and Wage Theft in Global Garment Supply Chains 155
10. Wage Theft in the Supply Chains of 15 Global Apparel Brands 159
11. Conclusion and Way Forward 177
Appendix: Summary of Relevant Labour Legislations in Surveyed Countries 184
Table of Contents

List of Figures
Chapter 3: Sri Lanka
Figure 3.1: Classification of the selected factories according to the size of the workforce 21
Figure 3.2: Classification of time periods, 2020 23
Figure 3.3: Trend in RMG exports from Sri Lanka - 2019 vs 2020 24
Figure 3.4: Wage theft estimates, 2020 27
Figure 3.5: Trend in monthly wages by gender, 2020 28
Figure 3.6: Trend in monthly wages by contract type, 2020 29
Figure 3.7: Employment status, 2020 30
Figure 3.8: Trend in percentage of workers laid off, 2020 30
Figure 3.9: Trend in overtime pay received, 2020 32
Figure 3.10: Trend in hours of overtime by contract type, 2020 32
Figure 3.11: Trend in hours of overtime by gender, 2020 32
Figure 3.12: Trend in wage, consumption and debt 34
Figure 3.13: Trend in monthly wages with reference to international poverty line (World Bank), 2020 35
Figure 3.14: Trend in monthly household income with reference to AFWA living wage, 2020 35
Figure 3.15: Age-wise distribution of wage, 2020 35
Figure 3.16: Share of wages and debt in consumption 36
Figure 3.17: Reasons for incurring debt, 2020 37
Figure 3.18: Sources of debt, 2020 37
Figure 3.19: Percentage of workers who received Covid-19 support from various sources 38
Chapter 4: Pakistan
Figure 4.1: Classification of the selected factories according to the size of the workforce 44
Figure 4.2: Classification of time periods, 2020 46
Figure 4.3: Trend in RMG Exports from Pakistan - 2019 vs. 2020 47

Figure 4.4: Wage theft estimates, 2020 50
Figure 4.5: Trend in monthly wages by gender, 2020 51
Figure 4.6: Trend in monthly wages by contract type, 2020 51
Figure 4.7: Employment status, 2020 52
Figure 4.8: Trend in percentage of workers laid off, 2020 52
Figure 4.9: Trend in percentage loss in workdays 53
Figure 4.10: Trend in overtime pay received by contract type, 2020 53
Figure 4.11: Trend in access to social security benefits, 2020 54
Figure 4.12: Trend in wages, consumption and debt, 2020 55
Figure 4.13: Trend in monthly wages with reference to international poverty line (World Bank), 2020 56
Figure 4.14: Trend in monthly household income with reference to AFWA living wage, 2020 56
Figure 4.15: Age-wise distribution of wages 56
Figure 4.16: Reasons for incurring debt, 2020 59
Figure 4.17: Sources of debt, 2020 59
Figure 4.18: Percentage of workers who received Covid-19 support from various sources 60
Chapter 5: Indonesia
Figure 5.1: Classification of selected factories by size of workforce 65
Figure 5.2: Trend in apparel exports from Indonesia - 2019 vs. 2020 68
Figure 5.3: Wage theft estimates, 2020 72
Figure 5.4: Trend in monthly wages across minimum wage regions, 2020 72
Figure 5.6: Trend in monthly wages by gender, 2020 73
Figure 5.5: Monthly wages by gender across minimum wage regions, 2020 73
Figure 5.7: Monthly wages by contract type across minimum wage regions, 2020 74
Figure 5.8: Trend in monthly wages by contract type across minimum wage regions, 2020 75
Figure 5.9: Composition of employment loss across minimum wage regions, 2020 76
Figure 5.10: Trend in percentage of workers facing layoff across
minimum wage regions, 2020 77
Figure 5.11: Percentage loss in work days, 2020 77
Figure 5.12: Percentage of workers receiving legally mandated overtime pay, 2020 78
Figure 5.13: Trend in monthly wages with reference to international poverty line (World Bank, 2020) 80
Figure 5.14: Trend in monthly household income with reference to AFWA living wage, 2020 80
Figure 5.15: Age-wise distribution of wages 81
Figure 5.16: Trend in consumption across minimum wage regions, 2020 82
Figure 5.17: Share of wages and debt in household consumption 82
Figure 5.18: Reasons for incurring debt, 2020 83
Figure 5.19: Sources of debt, 2020 83
Figure 5.20: Percentage of workers who received Covid-19 support from various sources 84
Chapter 6: India
Figure 6.1: Classification of the selected factories according to the size of the workforce 89
Figure 6.2: Classification of time periods, 2020 91
Figure 6.3: Trend in RMG exports from India - 2019 vs. 2020 92
Figure 6.4: Wage theft estimates, 2020 93
Figure 6.5: Trend in monthly wages by gender, 2020 95
Figure 6.6: Trend in wages by social category, 2020 98
Figure 6.7: Trend in wages by contract type, 2020 100
Figure 6.8: Composition of employment loss, 2020 101
Figure 6.9: Trend in average number of days of layoff, 2020 101
Figure 6.10: Trend in overtime pay received by contract type, 2020 103
Figure 6.11: Trend in access to social security benefits, 2020 104
Figure 6.12: Trend in wages, consumption and debt, 2020 105
Figure 6.13: Trend in monthly wages with reference to international poverty line (World Bank), 2020 106
Figure 6.14: Trend in monthly household income with reference to

AFWA living wage, 2020 106
Figure 6.15: Age-wise distribution of wages, 2020 106
Figure 6.16: Share of wages and debt in household consumption 107
Figure 6.17: Trend in consumption across regions, 2020 108
Figure 6.18: Reasons for incurring debt, 2020 109
Figure 6.19: Sources of debt, 2020 109
Figure 6.20: Percentage of workers who received Covid-19 support from various sources 110
Chapter 7: Cambodia
Figure 7.1: Classification of selected factories by size of workforce 115
Figure 7.2: Trend in apparel exports from Cambodia - 2019 vs. 2020 118
Figure 7.3: Wage theft estimates, 2020 121
Figure 7.4: Trend in workers earning less than minimum wage by gender, 2020 122
Figure 7.5: Trend in monthly wages by gender, 2020 122
Figure 7.6: Trend in hourly wages by contract type, 2020 123
Figure 7.7: Composition of employment loss, 2020 123
Figure 7.8: Trend in percentage of workers facing layoff, 2020 124
Figure 7.9: Percentage loss in workdays, 2020 124
Figure 7.10: Average years of experience of terminated workers 125
Figure 7.11: Payment of legally mandated overtime rates by contract type, 2020 126
Figure 7.12: Trend in wages, consumption and debt, 2020 127
Figure 7.13: Trend in monthly wages with reference to international poverty line (World Bank), 2020 128
Figure 7.14: Trend in monthly household income with reference to AFWA living wage, 2020 128
Figure 7.15: Age-wise distribution of wages 128
Figure 7.16: Reasons for incurring debt, 2020 131
Figure 7.17: Sources of debt, 2020 131
Figure 7.18: Percentage of workers who received Covid-19 support from various sources 132
Chapter 8: Bangladesh

Figure 8.1: Classification of the selected factories according to the size of the workforce 137
Figure 8.2: Classification of time periods, 2020 139
Figure 8.3: Trend in apparel exports from Bangladesh - 2019 vs 2020 140
Figure 8.4: Trend in actual wage theft, 2020 144
Figure 8.5: Composition of employment status, 2020 144
Figure 8.6: Trend in wages, consumption and debt 146
Figure 8.7: Trend in monthly wages with reference to international poverty line (World Bank, 2020) 147
Figure 8.8: Trend in monthly household income with reference to AFWA living wage, 2020 147
Figure 8.9: Age-wise distribution of wages 148
Figure 8.10: Trend in monthly household consumption, 2020 149
Figure 8.11: Trend in household debt by employment status 151
Figure 8.12: Reasons for incurring debt, 2020 152
Figure 8.13: Sources of debt, 2020 152
List of Tables
Chapter 2: Introduction
Table 2.1: No. of factories and workers surveyed across 6 countries 12
Table 2.2: Summary of key concepts and variables 15
Chapter 4: Pakistan
Table 4.1: Share of wages and debt in household consumption 58
Chapter 5: Indonesia
Table 5.1: Classification of regions based on minimum wage levels 68
Table 5.2: Cuts in bonus payment by region, 2020 79
Chapter 7: Cambodia
Table 7.1: Percentage reduction in consumption in 2020 130

Table 7.2: Share of wages and debt in household consumption 130
Chapter 8: Bangladesh
Table 8.1: Share of wages and debt in consumption 150
Chapter 9: Typology Of Managerial Practices And Wage Theft In Global Garment Supply Chains
Table 9.1: Impact of brand actions on poverty levels, employment, wages and debt of workers, 2020 156
Table 9.2: Cascading effect of brand actions on suppliers’ employment practices 157

1
Money HeistCovid-19 Wage Theft in Global
Garment Supply Chains
July 2021
Asia Floor Wage Alliance

2
The Covid-19 pandemic exposed the undeniable truth that extreme labour exploitation forms the core feature of global apparel supply chains. The humanitarian crisis unleashed on garment workers in Asia due to the pandemic-induced recession, was neither unanticipated nor unavoidable. Rather, it was the direct consequence of the actions of global apparel brands located in the Global North, which earn super-profits through the exploitation of workers within a “framework of unequal regional and national development, [and] an unequal and segmented labour market.”1, 2
Asian garment production countries have relied on global apparel supply chains as a pathway to economic growth and development for the past several decades to generate employment and provide wages that would lift millions of wage-dependent populations in Asia out of poverty.3 International policy makers and academics, as well as institutions such as the Organisation for Economic Cooperation and Development (OECD)4 and the World Bank,5 have recommended the integration of developing countries into global supply chains as a strategy for rapid industrial development.
The garment industry has created approximately 60 million jobs globally,6 with the majority of these concentrated in Asia.7 However, it has not generated decent and good quality employment for the majority of its workforce. Rather, the creation of non-standard forms of work and insecure employment, without union rights or strong enforcement institutions, resulting in wage
theft for garment workers, has become the norm in global apparel supply chains.8
Wage Theft – Common Experience Of Garment Workers The basic labour and human rights of garment workers in Asia have historically been violated within global apparel supply chains. Workers’ wages determine the ability of their households to survive. However, these wages are subject to market clearing forces in a labour surplus economy which pushes them below even poverty-level legal minimum wages. Persistently low, poverty-level wages, which do not permit workers to meet a minimum standard of living, coupled with the ever-present threat of employment loss and further deprivation of wages as a result of product market fluctuations, is the common experience of garment workers.9 Brands are able to accumulate extreme profits by passing on the risks and costs associated with production based on fluctuating demand in volatile apparel markets to workers, through an inbuilt mechanism since inception, of wage theft in their supply chains. Wage theft is a central aspect of the business models of global apparel brands, and not an unintended result of crises, such as the Covid-19 pandemic. It comes as no surprise then, that far from protecting the wages of workers in their supply chains during the pandemic-induced recession, global apparel brands engaged in harmful actions that aggravated and magnified the intrinsic condition of wage
Introduction

3
theft in their supply chains.
This report studies the manner in which the most brutal impacts of the recession on the global apparel industry were absorbed by the poorest workers, disproportionately comprising of women from vulnerable socio-economic groups in Asia. It analyses how the actions of brands during the pandemic impacted employment relationships in their supplier factories, resulting in widespread wage theft and severe humanitarian consequences for workers in their supply chains.
The report’s focus on wage theft is based on two interrelated aspects. One, while it documents several forms of exploitation over the course of the pandemic-induced recession in 2020, wage theft formed the predominant consequence of this exploitation. As a result of labour exploitation during the recession, workers were deprived of their wages – the most fundamental aspect of their employment in global apparel supply chains – which mediates their households’ access to food, nutrition, housing, healthcare and education. Several studies point to the extreme magnitude of wage theft facing Asian garment workers10, 11, 12 and its devastating, long term consequences on the nutrition and health of their families.13
Two, the deprivation of workers’ wages during the pandemic are mostly covered by national laws with regard to layoff and retrenchment wages, and terminal benefits. Workers forego enforcement of such rights and benefits to get re-employed, in the face of severe unemployment, threat of starvation, and almost absent will of the state to enforce it. Even if such laws are absent in some Asian countries, they form the legitimate expectation of workers based on international normative frameworks of the International Labour Organization (ILO) for the protection of human rights.14
In such situations, wage loss is undeniably
wage theft and has to be treated as such, which this present report does. At higher wage levels, some forms of reduction in wages may be negotiated during short periods of recession; they are not wage theft as they are not unilateral and workers have a capacity to adjust to the loss. However, the pre-existing poverty-level wages of Asian garment workers did not provide any form of resilience – including savings, asset creation or vertical mobility – that would have allowed them to tide over loss of employment and wages during the recession. Any loss of wages at poverty levels denies garment workers access to the minimum level of consumption required for survival, and therefore, constitutes wage theft.
Asymmetrical Power Relations Forms The Basis For Wage Theft Asian production countries are trapped in an economic growth and development model informed by the strategy of export-oriented industrialisation.15 However, the captive nature of global apparel supply chains has resulted in low gains for workers, suppliers and production countries in Asia. Global apparel brands, head-quartered in developed economies, off-shore and outsource manufacturing to low-wage developing countries in Asia, to take advantage of low input costs, including labour costs and low labour law enforcement regime. Brands retain high-value activities such as design, marketing and retail, through which they are able to retain control over profits from the sale of products manufactured by their suppliers in the Global South.16
The low entry barriers to participate in global apparel supply chains through manufacturing in production countries, due to low capital and technological requirements, and the labour-intensive nature of production, are accompanied by high entry barriers
4
to consumer markets in developed economies, which are captured by global apparel brands. As a result, global apparel supply chains are characterised by a small number of transnational corporations that maintain monopsonistic power over a large number of suppliers who perform low-value manufacturing without many opportunities for upgradation to high value activities.17 Just as the functional upgradation of supplier factories in global apparel supply chains has remained a myth, so has the expectation that workers in the supplier factories of global apparel brands would move from low-skill to high skill labour, through a process of economic and social upgradation, with opportunities for improved wages. Global apparel brands are able to extract high productivity from workers in their supplier factories, but drive down the unit cost of labour in order to capture maximum value.18
The accumulation of super-profits by brands is directly linked to their ability to capture consumer markets of developed economies and sustain them with low price inflation, with garments manufactured through the extreme exploitation of labour in Asian production countries. The dual nature of their control over two distinct markets of the global apparel industry enables them to perpetuate and deepen structural inequalities in their supply chains by earning high profits while denying the basic labour and human rights of workers.19
Therefore, global apparel brands are the main drivers of global apparel supply chains, which are characterised by asymmetrical power relations between brands, their suppliers, and workers. Brands present themselves as simply ‘buyers’ of garments produced in Asia, even though the contracts between the brands and their suppliers are not simply contracts for procurement of garments manufactured independently by Asian suppliers. Rather, they are contracts for production of the garments based on specific quality standards for product and process
with tight delivery schedules set by brands, who design, own, market and sell these garments. Their false position as ‘buyers’ of garments manufactured by Asian suppliers has severe consequences for workers in their supply chains. One, it forces the large number of suppliers to engage in intense competition to offer cheap manufacturing that comply with the pricing models imposed by brands. They pass on the costs of cheap manufacturing to workers in the form of insecure employment, low wages, and lack of liability for non-enforcement of labour standards.20 Two, governments in Asian production countries are forced to legalise the labour rights violations in supplier factories, resulting in a race-to-the-bottom in order to attract and retain the businesses of brands, through the dilution of existing labour protective frameworks leading to repressed wages, hiring and firing at will, and attacks on freedom of association.21
The plight of garment workers during the pandemic-induced recession was an extension and aggravation of these asymmetrical power relations. Suppliers, without opportunities to engage in the high value activities, remain hostage to production orders from brands to keep their businesses operational. While global garment supply chains offer little opportunity to workers, suppliers and production countries for upgradation, they remain extremely susceptible to downgrading. As brands adjusted their businesses to respond to the impact of the pandemic on their markets through predatory purchasing practices,22 suppliers were forced to take on production at even lower costs, accepting order fluctuations, lower prices and delayed payments, resulting in greater wage theft for garment workers over extended periods of time.
5
Human Rights Impact Of Wage Theft Access to work and wage is the most basic form of inclusion in a capitalist economy. Wage-dependent workers work for wages under explicit or implicit employment contracts, whether they are fair or unfair. Being the primary source of income for labour, wage payment is a crucial pre-condition for ensuring the basis of survival of workers and their households and mediates the exercise of social, economic, political and cultural rights.
Several Asian governments acknowledged the critical role played by wages in the lives and livelihoods of the significant section of their population – wage-dependent labour – by calling on brands to make full and timely payments for their orders. Suppliers’ associations in major production countries came together to demand that brands engage in responsible purchasing practices, pointing out that the choices made by brands impact the most fundamental labour and human rights of workers in Asia.23
Labour legislation enacted to protect workers’ right to work and wages in Asian countries, recognised that wages are essential for industrial peace and productivity alongside equitable and inclusive economic growth. International normative frameworks establish that the right to adequate wages and secure employment is a universal human right. Non-payment of wages that pushes workers and their households to the brink of survival ipso facto is a violation of human rights and perpetuates more violations as workers get caught in a vicious cycle during a global crisis. Wages and labour rights in general, therefore, are fundamental in ensuring that human rights are safeguarded. This is recognised in Article 23(2) and Article (25) of the Universal Declaration of Human Rights as the “right to just and
favourable remuneration” that ensures “an existence worthy of human dignity” and “right to a standard of living adequate for the health and well-being of his and his family” respectively.24 Similarly, Article 7 (a) (ii) of the International Covenant on Economic, Social and Cultural Rights (ICESCR) recognises the “right to decent living”, which is however only recognised as an aspirational goal that needs to be progressively realised.25 The ILO that was founded to protect workers’ rights predates the establishment of human rights frameworks and set labour standards through Covenants and Recommendations. The ILO recognises the need for a living wage in its Constitution, as well as Declarations, Covenants and Recommendations and has consistently highlighted that wage-led growth is integral to social justice and reducing inequalities.26
The terms governing the participation of Asian production countries in global garment supply chains is paradoxical to these recognitions in national labour legislations and international normative frameworks. The competition between suppliers and governments in Asia to retain the businesses of global apparel brands is made possible by labour and human rights violations against garment workers. It demands a growth model that relies on cheap, flexible and disposable labour as the only comparative advantage. In particular, exploitation on the basis of social identities such as gender, religion, caste, ethnicity or migration status, became the means through which labour costs could be further reduced.27 Garment workers remain trapped in low-paying and insecure jobs despite being associated with a high growth industry, without the ability to experience occupational mobility or improve their standard of living – leaving them without resilience to tide over the crisis triggered by the pandemic.
Minimum wages in production countries are set at extremely low levels that do not cover the costs of living, including social
6
reproduction, with living wages, estimated by the Asia Floor Wage Alliance, being at least three times higher than the minimum wages available to garment workers.28 Even as workers faced extreme crisis during the pandemic, governments in Asia were forced to respond with labour reforms focused on further deregulation, in order to recover the dwindling investments and foreign exchange earned from garment exports.29 The total abandonment of workers by brands forced governments into rescuing practices through fiscal and workplace policies. Many governments rolled out stimulus packages for industry, and wage subsidies for workers, diverting scarce national resources to subsidise the profits of the brands. They also released orders or requests that suppliers pay wages to workers, which could not be enforced as suppliers cited lack of orders and timely payments from brands as obstacles to paying workers. Domestic tripartite collective bargaining mechanisms proved ineffective where production and employment is dependent on the actions of international brands. But, none of the governments made any effort to hold brands responsible for abandonment in the face of need or initiated any process for legal accountability of brands.
Lack Of Regulation Perpetuates Wage Theft The lack of regulation in global apparel supply chains, that perpetuates the extreme exploitation of garment workers in the Global South, has been at the forefront of global discourse much before the onset of the pandemic. Voluntary codes of conduct of brands, and auditing mechanisms, that have prevailed for many years as the sole regulatory mechanisms, have been discredited. Rather, several measures that focus on corporate accountability for labour and human rights violations in global supply chains have gained traction.
This includes the OECD Guidelines for Multinational Enterprises,30 and the 2011 United Nations Guiding Principles for Business and Human Rights (or Ruggie Principles).31 Following the Rana Plaza disaster in 2013, the UN Human Rights Council adopted a resolution to work towards a legally binding instrument to regulate transnational corporations with respect to human rights.32 This was followed by the International Labour Conference, in 2016, which resulted in a resolution to review current ILO standards, and consider guidance, programmes, measures, initiatives or standards for achieving decent work in global supply chains.33 The building of global momentum towards mandatory and enforceable legislation to establish corporate accountability is reflected in the due diligence laws enacted by several European governments, leading to the proposed comprehensive and mandatory due diligence legislation by the European union.34
These international initiatives articulate certain principles as key factors for ensuring justice and fairness in global supply chains. First, they emphasise collaboration between different actors in global supply chains, including brands, their suppliers, and workers’ unions. Second, it stresses on the importance of cost sharing between different stakeholders, with brands paying for the cost of decent labour standards and environmental protection, rather than outsourcing the costs to production countries, suppliers and ultimately workers and vulnerable communities. Third, it exhorts brands to compensate for jurisdictional and governance weaknesses in terms of worker or environment protection laws, and prevailing norms that perpetuate labour and human rights violations in production countries. However, these principles remained aspirational even in the pre-recession period, allowing brands to remain unaccountable to workers in their supply chains. Brands

7
have utilised the acute power asymmetries in global apparel supply chains to drive their extremely profitable business models based on deeply entrenched management practices that embody the very opposite values. The recession led to an extreme escalation of these management practices, which include, unilateral actions by brands without consulting suppliers or workers’ unions, outsourcing of costs to suppliers and workers, and leveraging of jurisdictional and governance weaknesses in production countries to further drive down costs and evade bare minimum responsibilities towards workers.
During the recession, brands engaged in aggressive actions based on these practices to preserve their colossal past profits and minimise any reduction in profits during the recession. These actions, in turn, resulted in cascading effects on the employment practices of their suppliers towards workers in their supply chains. Brands imposed unilateral decisions such as order cancellations without payment to suppliers, and used their leverage to demand shorter lead times, delayed payments, and deep discounts from suppliers. They exhibited a total disregard for basic justice and fairness in their supply chains – forcing Asian suppliers to pass on costs to workers – by engaging in overnight and illegal terminations without payment of termination benefits, layoffs without payment of wages, and other practices that resulted in extreme wage theft for workers. As a result, workers’ wages through the practice of extreme wage theft, subsidised not only the impact of financial losses on suppliers, but also the stabilisation and recovery of brand profits during the pandemic-induced recession.

8
References
1 Bhattacharjee, A. & Roy, A. (2015). The Global Commodity Chain, Labour and the Global Garment Industry. Towards an Asia Floor Wage: A Global South Labour Initiative for Garment Workers. South-South Dispatch 03. Asia Floor Wage Alliance & South Solidarity Initiative, pp. 7.
2 Bhattacharjee, A. & Roy, A. (2015). Bargaining in the global commodity chain: the Asia Floor Wage Alliance. Kees van der Pijl, ed. Handbook of the International Political Economy of Production, Cheltenham: Edward Elgar, pp. 334. https://asia.floorwage.org/wp-content/uploads/2019/10/Towards-an-Asia-Floor-Wage-Nov-2015.pdf
3 Bhattacharjee, A. & Roy, A. (2012). Asia Floor Wage and global industrial collective bargaining. International Journal of Labour Research, 4(1), pp. 67-83. Retrieved from https://asia.floorwage.org/wp-content/uploads/2019/10/AFW-essay-AB-AR.pdf
4 Organisation for Economic Cooperation and Development (2013). Interconnected Economies: Benefiting from Global Value Chains. Retrieved from https://www.oecd.org/mcm/C-MIN(2013)15-ENG.pdf
5 The Word Bank (2020). Trading for Development in the Age of Global Value Chains. World Development Report 2020. Retrieved from https://www.worldbank.org/en/publication/wdr2020
6 Richetti, M. & De Palma, R. (2020). Will COVID-19 accelerate the transition to a sustainable fashion industry? United Nations Industrial Development Organization. Retrieved from https://www.unido.org/stories/will-covid-19-accelerate-transition-sustainable-fashion-industry
7 Asia Floor Wage Alliance (2014) Report on Living Wage in Asia. Retrieved from https://asia.floorwage.org/wp-content/uploads/2019/10/LW-in-Asia-AFWA-CCC.pdf
8 Ghosh, S. (2015). Global Value Chains and the Garment Sector in Asia. Towards an Asia Floor Wage: A Global South Labour Initiative for Garment Workers. South-South Dispatch 03. Asia Floor Wage Alliance & South Solidarity Initiative.
9 Asia Floor Wage Alliance (2014). Report on Living Wage in Asia. Retrieved from https://asia.floorwage.org/wp-content/uploads/2019/10/LW-in-Asia-AFWA-CCC.pdf
10 Asia Floor Wage Alliance (2020). The Emperor Has No Clothes, Issue II. Retrieved from https://asia.floorwage.org/wp-content/uploads/2020/05/The-Emperor-Has-No-Clothes-Issue-II-May.pdf
11 Clean Clothes Campaign (2020). Un(der)paid in the Pandemic: An estimate of what the garment industry owes its workers. Retrieved from https://cleanclothes.org/file-repository/underpaid-in-the-pandemic.pdf/view
12 Business and Human Rights Resource Centre (2021). Wage theft and pandemic profits: The right to a living wage for garment workers. Retrieved from https://media.business-humanrights.org/media/documents/Unpaid_wages_v9.pdf
13 Worker Rights Consortium (2020). Hunger in the Apparel Supply Chain: Survey findings

9
on workers’ access to nutrition during Covid-19. Retrieved from https://www.workersrights.org/wp-content/uploads/2020/11/Hunger-in-the-Apparel-Supply-Chain.pdf
14 Lebaron, G. (2021). Wages: an overlooked dimension of business and human rights in global supply chains. Business and Human Rights Journal, 6(1), pp. 1-20.
15 Castaneda-Navarette, J., Hauge, J. & Lopez-Gomez, C. (2020). COVID-19’s impacts on global value chains, as seen in the apparel industry. Development Policy Review, 2021;00, pp. 1-18.
16 Nathan, D. (2018). Imperialism in the 21st century: Global Value Chains and International Labour Arbitrage. Economic & Political Weekly, 53(32), pp. 33-39. Retrieved from https://www.epw.in/journal/2018/32/perspectives/imperialism-21st-century.html
17 Gereffi, G. and Frederick, S. (2010). The Global Apparel Value Chain: Trade and the Crisis: Challenges and Opportunities for Developing Countries. Policy Research Working Paper No. 5281. World Bank. Retrieved from https://openknowledge.worldbank.org/handle/10986/3769
18 Selwyn, B. (2019). Poverty chains and global capitalism. Competition & Change, 23(1), pp. 71-97.
19 Bhattacharjee, A. & Roy, A. (2015). The Global Commodity Chain, Labour and the Global Garment Industry. Towards an Asia Floor Wage: A Global South Labour Initiative for Garment Workers. South-South Dispatch 03. Asia Floor Wage Alliance & South Solidarity Initiative.
20 Anner, M., Bair, J. & Blasi, J. 2012. Towards Joint Liability in Global Supply Chains: Addressing the Root Causes of Labor Violations in International Subcontracting Networks. Comparative Labor Law and Policy Journal, 35(1), pp. 1-43.
21 Asia Floor Wage Alliance (2021). Garment Workers under Threat from Labour Deregulation in Asia – A Review of recent Labour and Employment Law changes in Cambodia, India, Indonesia and Sri Lanka. Retrieved from https://asia.floorwage.org/wp-content/uploads/2021/03/Labor-Deregulation-Asia-March-2021-Final-Draft-24-March.pdf
22 Anner, M. (2020). Predatory purchasing practices in global apparel supply chains and the employment relations squeeze in the Indian garment export industry. International Labour Review, 158(4), pp. 705-727.
23 Sustainable Textile of the Asian Region (2020). Joint Statement on Responsible Purchasing Practices amid the Covid-19 Crisis. Retrieved from https://bgmea.com.bd/page/Joint_Statement_on_Responsible_Purchasing_Practices_amid_the_COVID-19_Crisis
24 Universal Declaration of Human Rights (1948). Retrieved from https://www.un.org/sites/un2.un.org/files/udhr.pdf
25 International Covenant on Economic, Social and Cultural Rights (1976). Retrieved from https://www.ohchr.org/en/professionalinterest/pages/cescr.aspx
26 ILO constitution (1919). Retrieved from https://www.ilo.org/dyn/normlex/en/f?p=NORMLEXPUB:62:0::NO::P62_LIST_ENTRIE_ID,P62_LANG_CODE:2453907,en
27 Mezzadri, A. (2017). The Sweatshop Regime: Labouring Bodies, Exploitation and Garments Made in India (Development Trajectories in Global Value Chains). Cambridge:

10
Cambridge University Press.
28 Living Wage Versus Minimum Wage. Asia Floor Wage Alliance. Retrieved from https://asia.floorwage.org/living-wage-versus-minimum-wage/
29 Asia Floor Wage Alliance (2021). Garment Workers under Threat from Labour Deregulation in Asia – A Review of recent Labour and Employment Law changes in Cambodia, India, Indonesia and Sri Lanka. Retrieved from https://asia.floorwage.org/wp-content/uploads/2021/03/Labor-Deregulation-Asia-March-2021-Final-Draft-24-March.pdf
30 Organization for Economic Cooperation and Development (2011). Guidelines for Multinational Enterprises. Retrieved from https://www.oecd.org/daf/inv/mne/48004323.pdf
31 United Nations (2011). Guiding Principles on Business and Human Rights. https://www.ohchr.org/documents/publications/guidingprinciplesbusinesshr_en.pdf
32 United Nations Human Rights Council (2014). Resolution 26/9 Elaboration of an international legally binding instrument on transnational corporations and other business enterprises with respect to human rights. Retrieved from https://documents-dds-ny.un.org/doc/UNDOC/GEN/G14/082/52/PDF/G1408252.pdf?OpenElement
33 International Labour Organization (2016). Resolution concerning decent work in global supply chains. 105th Session of the International Labour Conference. Retrieved from https://www.ilo.org/wcmsp5/groups/public/---ed_norm/---relconf/documents/meetingdocument/wcms_497555.pdf
34 European Parliament (2020). Towards a mandatory EU system of due diligence for supply chains. Retrieved from https://www.europarl.europa.eu/RegData/etudes/BRIE/2020/659299/EPRS_BRI(2020)659299_EN.pdf

11
The Asia Floor Wage Alliance (AFWA) joined with garment workers’ unions across six major garment production countries in Asia to study the impact of the Covid-19 pandemic-induced recession and resultant actions of global apparel brands on the employment relationships of, and consequent wage theft experienced by, garment workers employed in the supplier factories of these brands.
Research Objectives • Document, analyse and report the extent
and forms of wage theft experienced by garment workers employed in the supply chains of major global apparel brands during the Covid-19 pandemic-induced recession in 2020.
• Develop a theoretical typology of forms of managerial power and wage theft in global garment supply chains.
• Recommend strategies for strengthening the governance of global garment supply chains to prevent the harmful actions of brands that lead to extreme wage theft and human rights violations of garment workers.
• Propose a pathway towards transformative shifts in global garment supply chains that enable the re-distribution of power and profits captured by brands to workers, suppliers and production countries.
Research Questions The study focused on four central research
questions:
• What were the adverse shifts in the employment relationships of garment workers employed in the supplier factories of major global apparel brands as a result of the pandemic-induced recession?
• What was the extent and forms of wage theft experienced by garment workers as a result of the adverse shifts in their employment relationships?
• What was the impact of wage theft on garment workers and their households’ access to basic human rights and a minimum standard of living?
• What were the coping strategies employed by garment workers to tide over the crisis, and its short and long-term consequences on workers and their households?
SamplingSample Size
The study was conducted among:
2185 garment workers employed; across
189 factories; located in
6 countries – Sri Lanka, Pakistan, Indonesia, India, Cambodia and Bangladesh; where
15 major brands source their garments
Methodology

12
Sampling Method
A two-stage random sampling method was used to ensure the representation of the overall garment worker population across surveyed countries:
• In the first stage, factories were identified and a representative sample was drawn for the identified factories.
• In the second stage, the number of workers to be sampled for each factory was drawn proportionate to the factory size.
The selection of factories, and further selection of workers was done in a phased manner. Both factories and workers were chosen based on definite inclusion criteria, to ensure the representativeness of the sample, as summarised below.
Selection Of Factories
Factories where workers reported experiencing wage theft due to the
pandemic-induced recession in 2020, were selected by trade unions in the respective countries.
The inclusion criteria for selection of factories were as follows:
• Factory is registered under national legislation.
• Factory is operating in the supply chains of selected global apparel brands as a Tier 1 supplier.
• Factories are present across major garment clusters in the respective countries, which are considered as the centres of garment manufacturing.
Selection Of Workers
The choice of factories satisfying the above-mentioned criteria forms the sampling frame. Workers were selected from these factories based on their accessibility through trade unions. The selection of factories in all the countries followed a replacement sampling procedure, which allows the replacement of the selected factory if workers cannot be reached.
The inclusion criteria for selection of workers were as follows:
• They were employed in the garment factory for at least twelve months prior to the period of data collection. In other words, they were employed in the factory in the period prior to the pandemic-induced recession.
• Proportionate representation based on gender, employment contract type, different departments and job roles in the factory was ensured to the extent possible.
Details Of Sampling
The sample comprises workers employed in Tier 1 export factories operating in the supply chains of major global apparel brands, with
Country No. of Factories
No. of Workers
Bangladesh 21 271
Cambodia 24 294
India 55 433
Indonesia 28 390
Pakistan 50 605
Sri Lanka 11 192
Total 189 2185
Table 2.1: No. of factories and workers surveyed across 6
countries

13
relatively better employment conditions as compared to informal, sub-contracted units, or home-based workers. Factories have been verified as supplying to major brands based on both the supplier lists of those brands (where publicly available) and reporting by workers and trade unions.
The sample, in most countries, is over-represented by unionised and regular workers, who have relatively more secure employment, wages and benefits, as compared to non-unionised and contractual or casual workers.
As a result, the study under-estimates the wage theft experienced by garment workers and its human rights impact. By presenting the extent and severity of the crisis facing workers who fare relatively better, the study hints at the real magnitude of the crisis facing the majority of garment workers who are in more insecure forms of employment.
The specific limitations and details of the sampling in each country is summarised in the respective chapters.
Note: Data collection in Bangladesh was conducted within a short time period (May 2021) during a total, nationwide lockdown. As a result, the sample of workers from Bangladesh include workers who were easily accessible to trade unions during the lockdown – focusing on trade union members who were removed from their jobs, particularly in November-December 2020. The findings have been presented in a special chapter focusing on the unfair dismissals of garment workers and resultant wage theft in Bangladesh.
Collaboration With Trade UnionsThe data collection for this study was conducted in collaboration with 23 trade unions and labour organizations across the 6 countries, who have a strong presence
among workers employed in supplier factories of major global apparel brands. Trade union representatives identified factories and workers, and administered different data collection tools for the purpose of the study.
Trade unions faced immense challenges in documenting the conditions of workers during the pandemic, due to:
• Silencing and repression of workers, who were afraid of losing their employment if they reported violations in their factories.
• Increasing threats to trade unions and freedom of association in the context of the pandemic.
• Challenges in reaching out to workers who had left the industrial clusters and returned to their villages as they lost jobs and wages.
• Reduced accessibility to industrial zones as infection rates increased, and lockdown restrictions made transportation and access extremely difficult.
Classification Of Time PeriodsThe data was collected for different time periods across the year of 2020. The data has been classified into two broad periods in all countries:
• Pre-recession period: The months of January and February 2020 are considered the pre-recession period, as garment workers were not yet experiencing employment loss or wage theft related to the pandemic-induced recession.
• Pandemic-induced recession period: There was a pandemic recession from March to December 2020, where workers experienced employment loss and wage theft.

14
The data from the pre-recession period has been considered as the reference for calculating shifts in key variables during the pandemic-induced recession period.
In South Asian countries, where there were specific government-imposed lockdowns which impacted garment manufacturing, the pandemic-induced recession period has been further classified into different time periods based on relevant factors in each country, as detailed in the specific chapters. Several months in the pandemic-induced recession period have been grouped together for data collection, analysis and reporting as they had fairly similar situations in terms of employment loss and wage theft. In Southeast Asian countries, there were no specific periods of total lockdowns imposed by the government. As a result, the data has been collected, analysed and reported for each month during the pandemic-induced recession period.
For the purpose of keeping the language used to present the findings simple and accessible, the pre-recession period has been referred to as pre-Covid-19 period, and the pandemic-induced recession period has been referred to as the Covid-19 period throughout the chapters.
Sources Of Data • The primary respondents of the study
and the basic unit of analysis are garment workers employed in export-oriented factories supplying to major global apparel brands, and workers’ households.
• In addition to this, trade unions were interviewed to create profiles on the situation of total workforce and overall conditions in the selected factories, beyond the workers selected for the sample.
• Secondary sources, including aggregates of national level trade statistics and
national level micro-data has been used for setting the context on how the Covid-19 pandemic impacted the industry.
Tools For Data Collection 1. Structured interview schedule was administered to workers from selected factories to collect data on:
• Demographic details of worker: Gender, age, migration status, religion, and other relevant social identity markers.
• Employment status, wages and benefits:
◦ Employment status: Layoffs or terminations experienced by workers across 2020.
◦ Loss in Work Days: Number of working days and layoffs per month.
◦ Wages and Benefits: Total monthly earnings, and other benefits such as bonus and social security payments.
◦ Overtime Work and Payment: Number of hours of overtime and overtime payment per hour.
• Consumption and indebtedness:
◦ Monthly Consumption Expenditure: Monthly household consumption expenditure on selected items.
◦ Indebtedness: Cumulative monthly debt at the household level
• Household profile of the Worker: Details of other members of the household, employment status and wages.
2. Factory profile schedule was administered to trade unions with a strong presence in the selected factories to triangulate the data collected from workers selected for the sample, and collect additional data on the total workforce and overall conditions in each selected factory:

15
Summary Of Key Concepts And Variables
Table 2.2: Summary of key concepts and variables
Concept/Variables Description of Variables and Calculations
Wages
Wages paid to workers on a monthly basis.
It includes the total earnings of worker on a monthly basis, including overtime payment and incentives, and is not restricted to basic pay.
Average or median monthly wages have been calculated based on the requirements of each chapter.
% Wage Theft
The difference in wages calculated for each month in the pandemic-induced recession period (March to December 2020) from the pre-recession wages (January to February 2020).
Actual Wage Theft
Actual Wage Theft is the cumulative figure of difference in wages for each month in the pandemic-induced recession period from the pre-recession monthly wages.
Bonus Annual or festive bonus payment made to the worker based on the legislations or customary practices of the respective country.
• Total workforce in the factory
• Shifts in the employment status of the total factory workforce
• Working conditions and facilities in the factory
• Impact of Covid-19 pandemic and resultant actions of global apparel brands on the operations of the factory.
3. In-depth qualitative interviews and Focus Group Discussions (FGDs) were conducted with selected workers to capture anecdotal information and further substantiate and elaborate on the objective data collected through the structured interview and factory profile schedules.
The names of interviewed workers have been replaced with pseudonyms to preserve their anonymity and privacy.

16
Actual Bonus Theft
Actual Bonus Theft is the cumulative figure of difference in bonus due to each worker based on the respective country’s customary practice or legislations and actual bonus received.
Note: Bonus owed to workers has not been calculated for Pakistan and Cambodia as there is no customary practice of paying a specific amount annually to workers bonus payment. Rather it is dependent on several other factors due to which workers receive varied bonus amounts. It has not been calculated for Bangladesh due to limited data collection.
Wage Theft Estimates
A simple sample weight driven estimation process for wage theft has been followed to extrapolate wage theft to the total workforce across surveyed factories. The estimation process for the wage theft measure involves using sampling weights at each factory which is adjusted for mean sampling errors and other data values. The sampling weights for factories were adjusted to the lowest figure to account for estimation bias. The drawback of the estimation method used here is underestimation, by virtue of the method, sampling weights, and nature of the sample.
Note: Wage theft estimates have not been calculated for Bangladesh due to limited data collection.
Wage Theft Estimates per Factory
Wage theft per factory is calculated as the weighted average of the Wage theft estimates, weighted to the size of workforce.
- Wage theft estimates per factory
- Weight for nth term
- Value of nth term
- Sum of all weights
Hourly Wages
Average hourly wages of the workers calculated as follows
Hourly wages = ω/(d*h)
ω - Monthly Wages, d - days of work in the month, h - hours of work in a day

17
% Loss in Work Days
The difference in days of work calculated for each month in the pandemic-induced recession period (March to December 2020) from the days of work in the pre-recession period (January to February 2020)
% of Work Days Lost =
Trend in Number of Work Days
Average number of work days available to workers on a monthly basis.
Total Consumption Expenditure
Monthly expenditure on a basic consumption requirement of Food, Accommodation, Education, Health Care, Travel, Leisure, Socio-cultural aspects (including expenditure on festivals, weddings and other social events).
Note: In the case of single migrant workers living away from their families, the total consumption includes monthly consumption expenditure incurred by the single migrant worker and the monthly remittances sent by the worker to their family.
Debt Debt is captured as the monthly debt incurred by the worker.
Trend in Debt Trend in Debt is represented as cumulative sum across each month for the worker
% Increase in Debt
The difference in cumulative debt calculated for the year 2020 from the debt in pre-recession period (January to February 2020). The cumulative debt in 2020 includes all 12 months of 2020. Debt in pre-recession months include the cumulative debt in January and February 2020.
% Increase in Debt =
Share of Wage in Consumption
Ratio of Monthly Wage to the Total Monthly Consumption
Share of Wages in Consumption =
Share of Debt in Consumption
Ratio of Monthly Debt incurred to the Total Monthly Consumption
Share of Debt in Consumption =
Household Income
The household income is the cumulative income across each worker household comprising of income of family members and any other subsidiary income.

18
Poverty Line
Poverty line is calculated as monthly household level poverty line based on the poverty line figures reported by World bank based on different income levels of countries in PPP USD.
% Workers pushed below International Poverty Line
The percentage of workers pushed below international poverty line is calculated for the peak Covid-19 period for each country or apparel brand:
% Workers pushed below International Poverty Line =
AFWA Living Wage
AFWA living wage in USD is calculated based on the AFWA living wage figures for 2020
Structure Of AnalysisThe data on extent and forms of wage theft, and its impact on consumption levels and indebtedness of workers’ households has been presented through:
• Country level analysis: Extent and forms of wage theft and its impact on garment workers and their households in different countries has been analysed.
• Inter-country and Asia-regional analysis: The findings at the country level are compared, and the different forms of
wage theft prevalent across countries have been used to formulate a typology of managerial power and resultant wage theft at the regional level.
• Brand level analysis: The extent and forms of wage theft experienced by garment workers in the supplier factories of major global apparel brands at the Asia-regional and country levels has been analysed and placed in context of the revenues of the brands.

19
SRI LANKA

20
Chapter Highlights• 96% of the workers experienced employment shocks either in the form of
layoffs (76%) or termination (20%). 85% of the terminated workers did not receive full severance benefits.
• Though the levels of monthly debt per worker was relatively low at 6 USD in the pre-pandemic period, it had risen to around 15-17 USD per month from April, with this level persisting throughout the rest of 2020.
• Garment workers, most of whom are migrants, cut down personal consumption and incurred debt to send remittances as it is the most important source of income for their families.
• There is a rise in distress-driven employment in families of garment workers, with 15% reporting that, after May 2020, at least one additional member of their immediate family — mostly young men aged between 17-22 years — had to abandon their formal education and enter low-wage informal employment to help their families repay existing debt and to ensure that household income meets at least basic needs of food and rent.
• 78% of the workers were pushed below the international poverty line of the World Bank (measured at 3.2 USD PPP) between March and May, 2020.
Section 1: IntroductionSri Lanka is the only Asian garment producing country where a nationwide outbreak of Covid-19 was directly linked to the working and living conditions of garment workers producing for global apparel brands. Sri Lanka experienced two major waves of Covid-19 in 2020, first between March and October 2020, and then from October 2020.
While workers suffered layoffs and terminations in the first Covid-19 wave, the second wave started in Brandix Lanka Ltd at Minuwangoda, where more than 1000 workers tested positive for Covid-19.1 Workers reported severe ostracisation, physical violence and mistreatment from the government and military, as they and their families, including pregnant women and children, were taken to quarantine centres
late at night, in some cases against their will, and were treated as “criminals rather than as patients.”2
The Sri Lankan apparel industry is one of the most significant contributors to the country’s economy and the primary foreign exchange earner. The industry contributes around 7% of the GDP and 46% of the total exports. The apparel industry also directly employs more than 350,000 people, which is approximately 15% of the country’s total workforce.3
The Sri Lankan apparel industry grew steadily since the 1980s but rising competition from other Asian production countries after phasing out of the Multi-Fibre Agreement from 2005 and the temporary suspension of trade preferences by the EU had led to

21
a slowdown.4 As a strategic response, the industry focused on a smaller range of design-intensive, value-added garments like women’s lingerie and swimwear, and rebranded Sri Lanka as a site for ethically responsible apparel production.5 However, much of this applies to the regular workforce that has been dwindling as suppliers increasingly resorted to contractual workers hired through manpower/recruitment agencies.6 Sri Lanka also has some of the lowest minimum wage rates for garment workers in Asia,7 which leaves workers extremely vulnerable to shocks like Covid-19.
The Covid-19-related crisis in the garment industry began in early 2020 in the form of shortage of raw materials imported from China. This disrupted delivery schedules, and brands penalised suppliers for delays. Once the Covid-19 crisis spread to Europe, order cancellations, severe delays in payment for existing orders and retroactive price reductions for goods already in production coupled with lockdown within the nation pushed the industry into a much deeper crisis. Though Sri Lanka quickly emerged as one of the leading producers of PPE kits in the world,8 it was not a viable alternative to apparel production.
The cost of the Covid-19 crisis was passed on to workers by suppliers and brands, with trainees* and manpower workers suffering high levels of termination between April and May, 2020. When factories reopened at less-than-full capacity with higher production targets per worker, the suppliers ignored health and safety standards, leading to Covid-19 clusters being formed within the Free Trade Zones (FTZs) where garment
* Trainees are workers with less than 6 months’ experience in a factory. Manpower workers are workers who are not directly hired by the factory they work for but are hired by third party agents or sub-contractors. Manpower workers are not given a contract letter either by the company they work for or the manpower agency. They generally receive low wages, lack access to social protection and face substantial obstacles in joining a trade union.
factories are situated. The brutal treatment of garment workers in Covid-19 quarantine centres, in particular migrants, led to high levels of fear, depression, and anxiety. Workers terminated or laid off due to the Brandix outbreak have still not been able to recover lost wages, with many reporting that they sold assets, in particular jewellery, to meet basic needs. Migrant workers, who are the backbone of the Sri Lankan apparel industry, were severely affected by this outbreak as they lost jobs, were unable to return home and could not access government relief programs due to their status as migrants.
Section 2: The Methodology In Brief
1. SamplingAFWA conducted a survey of 192 workers from 11 garment factories in Sri Lanka located in 3 Free Trade Zones (FTZs), namely the Katunayake FTZ, the Biyagama FTZ and the Koggala FTZ, which are the largest garment-producing hubs in the country. The average size of selected factories is given in Figure 3.1, and the details of workers surveyed are provided on Page 22.
Figure 3.1: Classification of the selected factories according to
the size of the workforce
Source: Primary Data, n=11
Average number of workers per factory
Per
cent
age
of
fact
ori
es
0
10
20
30
40
50
60
>20001000-2000<1000
27%
55%
18%

22
Details of Workers Surveyed
Number of Factories
11
Experience
Nature of Employment
Education
Age
Source : Primary data, n = 192

23
2. Limitations Of Sampling• There is an under-representation of
manpower workers in the sample.
Many manpower workers were terminated after the first Covid-19 wave and had moved out of the boarding houses (worker hostels) within the FTZs. This made tracing these workers difficult for the trade unions. This also implies that terminated workers may be under-represented in our sample.
To bridge this gap, targeted interviews were conducted with workers, in particular manpower workers, who approached trade unions with cases of illegal termination or loss
Pre Covid-19
Total Covid-19 Lockdown(First wave of Covid-19)
Covid-19 Curfew(Second wave of Covid-19)
Partial Covid-19 Lockdown/Limited Recovery
January - February
March - May
June-September
October-December
• Garment suppliers started being slowly affected by the shortage of Chinese raw materials (notably fabric).
• Rise in Covid-19 cases, and a nationwide lockdown is imposed from March 20th to April 27th, forcing factories to stop all operations.
• PPE production begins in some garment factories.• Gradual reopening of garment factories begins in
May as lockdown restrictions were relaxed.
• Complete lifting of Covid-19 restrictions by June end.
• Steady increase in garment production.
• Brandix Covid-19 outbreak leads to 1000s of garment workers getting infected with Covid-19, forcing some garment factories to shut down temporarily.
• Covid-19 curfew zones were introduced across several districts. However, there was no nationwide lockdown during this period.
2020
of jobs as a result of factory closure, without payment of legally mandated compensations.
3. Classification Of Time Periods, 2020Our survey has measured variables across four time periods, based on the implementation of Covid-19 lockdown restrictions in Sri Lanka. The graphs also show variables across these time periods. However, in order to fully capture the crisis during the Covid-19 national lockdown period, data was collected separately for March-April, the peak of the lockdown, and May when lockdown restrictions were gradually removed and production resumed.
Figure 3.2: Classification of time periods, 2020

24
Section 3: Covid-19 And The Export-Oriented Garment Industry In Sri Lanka
1.How Did Covid-19 Affect Sri Lanka’s Garment Exports?Garment exports from Sri Lanka have been consistently growing over the past five years. This trend suffered a setback in 2020 as exports declined by 18% from 5.2 billion USD in 2019 to 4.3 billion USD in 2020 (Figure 3.3). Sri Lanka is largely dependent on China for raw materials and the initial outbreak of Covid-19 in China affected garment exports, causing a decline of around 3-4% in the beginning of 2020.
The sharpest decline was observed in April and May where exports decreased by 46% and 69%, respectively, compared to 2019. Though this coincided with the nationwide lockdown, the loss was largely driven by order cancellations, suspension of payments and demand for discounts by brands that left suppliers with limited funds to continue operations and pay workers.9 Though export picked up from June, it did not recover to 2019 levels, except for a brief period in September. Sri Lanka saw the poorest recovery in apparel exports in 2020 among countries surveyed in this study, primarily due to the impact of the Brandix Covid-19 outbreak on garment exports.
2. What Did The Sri Lankan Government Do For Garment Workers?Though the government announced a one-time support of 5000 LKR (25 USD) as
Figure 3.3: Trend in RMG exports from Sri Lanka - 2019 vs 2020
Covid-19 relief during the Covid-19 national lockdown (March-April), many migrant workers in FTZs who were unable to return to their native villages were not able to access it as the scheme was linked to the possession of local identity cards. Factories reopened in May, and based on tripartite consultations regarding wage payment, the government instructed that half the salary or 14500 LKR (75 USD), whichever is higher, must be paid to all those who were not working, including terminated and laid-off workers. The government also gave support in working capital at 4% interest to the garment companies for payment of salaries.10
Additionally, the National Covid-19 Task Force and the Ministry of Health issued health and safety protocols to be followed in factories that reopened. While this was strictly followed initially, the lack of coordination with the Department of Labour that usually investigates labour-related issues made health inspections less effective.11 Along with the general lifting of Covid-19 protocols in August and September, this led to the eventual outbreak of the Covid-19 cluster at the Brandix garment factory in Minuwangoda and the second Covid-19 wave in Sri Lanka.
100
200
300
400
500
600
20202019
December
November
October
September
AugustJuly
JuneMay
AprilMarch
February
January
Source: UN Comtrade
Tota
l val
ue o
f R
MG
exp
ort
s (M
illio
n U
SD
)
25
3. How Did Sri Lanka’s Suppliers React To The Covid-19 Crisis?In May, 2020, the Sri Lankan government established a Covid-19 tripartite taskforce to protect the interest of workers and employers through social dialogue during the Covid-19 period. This tripartite arrangement in Sri Lanka was partially able to check suppliers, from passing the burden disproportionately to workers, at least during the initial months of the Covid-19 crisis. However, the benefits of the wage agreement mostly accrued to regular workers. As suppliers could not shift the burden of the crisis to regular workers, they engaged in mass termination of manpower workers and trainees, who constitute up to 40% of the workforce in some of the factories included in this survey. While trainees did not receive any termination benefits, many manpower workers did not receive full legally mandated severance payments. Some factories also engaged in increasing production targets up to 50% after the first Covid-19 wave in order to force workers to voluntarily resign.
Moreover, though testing of body temperature, face masks, and physical distancing were made mandatory in factories during the first Covid-19 wave, boarding facilities in FTZs as well as crowded transport arrangements to the factories fell outside the purview of these health regulations, which put garment workers at significant risk. Garment workers share small, crowded rooms in groups of 4-5 in the boarding facilities in FTZs, with 100-150 workers sharing toilets and bathrooms. Many workers claim that poor living conditions within the boarding houses in the FTZ also played a crucial role in the spread of the second wave of Covid-19.
Section 4: Hyper-Exploitation Of Labour Through Wage Theft
1. Wage Theft EstimatesWage theft was the predominant feature of the Covid-19 crisis for garment workers in Sri Lanka, with our survey estimates indicating that 14,650 garment workers across 11 factories were denied 9.42 million USD as wages due to order cancellations, non-payment, and other irresponsible practices by brands during the pandemic. Even though wage theft peaked in April 2020, workers consistently experienced wage theft throughout the year and well into 2021, with no real sign of recovery (Figure 3.4).
Extent of Wage Theft
• 94% of workers surveyed
reported that they had
experienced wage theft during
the pandemic.
• Workers reported an overall
wage theft of 23% in 2020, with
a very sharp decline in wages
by 39% in April.
• Wages did not recover to
the pre-pandemic levels in
2020 as workers continued
to experience wage theft of
around 27 % during November-
December.
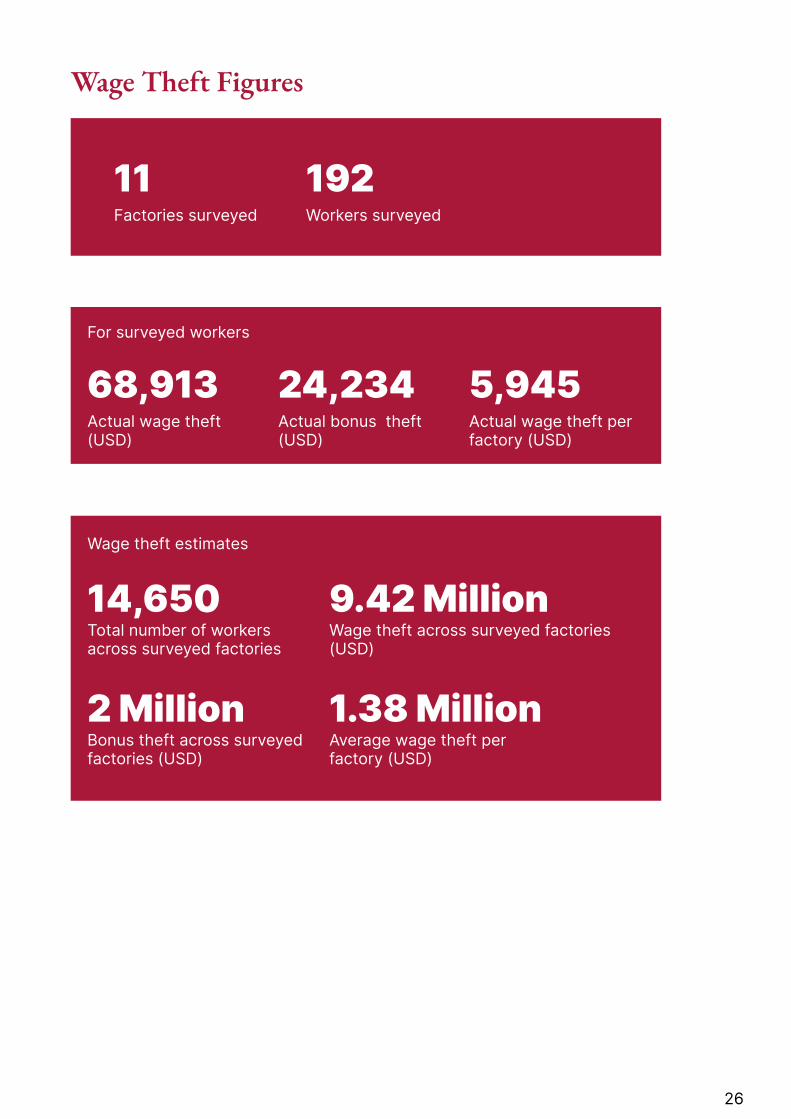
26
11Factories surveyed
68,913Actual wage theft (USD)
14,650Total number of workers across surveyed factories
5,945Actual wage theft per factory (USD)
9.42 MillionWage theft across surveyed factories (USD)
2 MillionBonus theft across surveyed factories (USD)
1.38 MillionAverage wage theft per factory (USD)
24,234Actual bonus theft (USD)
192Workers surveyed
Wage Theft Figures
For surveyed workers
Wage theft estimates

27
Figure 3.4: Wage theft estimates, 2020
2. Pre-Existing Inequalities As A Fertile Ground For Covid-19 Wage TheftWages and working conditions are shaped by pre-existing inequalities in the labour market in the form of gender, age and contractual status. During the pre-pandemic period, brands took advantage of these disparities to systematically underpay vulnerable segments of the workforce and flexibilise employment relations.
Among women, 17% are manpower/trainee workers while only 8% men are manpower/trainee workers, indicating the higher prevalence of women in insecure forms of employment. Manpower workers and trainees like Kalani form an extremely disadvantaged group of workers as they earn lower wages than regular workers and have limited access to social security benefits and employment security. Thus, the double burden of job insecurity and patriarchal norms accentuated the precarity of women garment workers during the Covid-19 crisis.
“
”
“My factory temporarily closed during the Covid-19 lockdown in March. In April, when the factory reopened, workers like
me who had just six months of experience in the factory were terminated. We
were asked to sign on blank papers by the management. If we refused to accept the termination, they asked us to stitch 100 pieces an hour, double of what we
produced in February. They knew it was humanly impossible to stitch 100 pieces per hour – it was a tactic to force us to resign. No one could handle the work pressure, and the constant slut shaming and verbal abuse from the supervisors – we all were forced to accept the termination. In May, I registered myself in a manpower agency
but the work was irregular and I was hardly earning 7000 LKR (36 USD) a month. I
thought of returning to my village but my parents, who are agricultural labourers, were in deep poverty themselves, and I
did not want to burden them. Sometimes, I don’t eat in the night, just to save some money to send home. Being a migrant, I
could not access Covid-19 relief schemes, including the 5000 LKR (26 USD) provided
by the government to workers who lost their income. I know of garment workers who are engaging in sexual bribery, just
to keep their jobs after the Covid-19 lockdown. I myself contemplated being a sex worker once, especially when I did not have money to buy dinner for two
consecutive days. But I got scared. Maybe if I don’t find any regular work, I might have no other way than to do it – just to
survive.”
- Kalani, a 22-year-old garment worker who worked at a US Polo supplier factory
Figure 8.2: Wage theft estimates, 2020
0.0
0.2
0.4
0.6
0.8
1.0
December
NovemberOctober
SeptemberAugust
JulyJune
May April
Source : Primary data, n = 192
Mill
ion
US
D

28
Gender Pay Gap
• The hourly gender pay gap that existed in the pre-pandemic period continued during the pandemic period, with male workers earning about 10% more than female workers throughout the year.
• However, during the Covid-19 national lockdown period (March-May, 2020), the monthly wages of women were higher than that of men, with women earning 94 USD as opposed to men who earned only 78 USD (Figure 3.5). This is because, during these months, women workers continued to be employed at low wage rates for extremely long hours in order to produce Personal Protective Equipment (PPE) while men were mostly laid off. Once garment production resumed from mid-May, the monthly gender wage gap started going back to pre-pandemic levels. However, wages of men and women remained below pre-pandemic levels throughout the rest of 2020, with women facing a higher fall in wages.
Figure 3.5: Trend in monthly wages by gender, 2020
Proliferation Of Precarious Work
In the pre-pandemic period there was a significant gap (51 USD) between the monthly wages of manpower workers and regular
workers, with manpower workers earning only 104 USD while regular workers earned 155 USD (Figure 3.6). This is despite the fact that manpower workers and regular workers are engaged in similar tasks and work for almost the same hours.
• After the second wave
of Covid-19 began in
October, there was a
general fall in wages
for both regular and
manpower workers,
with the wages of
regular wages being
reduced to almost the
pre-pandemic wages of
manpower workers.
While the monthly wages of both manpower and regular workers fell from March 2020, the gap between them declined by the end of the year, with regular workers earning 111 USD while manpower workers earned around 84 USD. This is because after the second wave of Covid-19 began in October there was a general fall in the wages of both regular and manpower workers, with the wages of regular workers being reduced to almost the pre-pandemic wages of manpower workers. Hence, manpower workers suffered an average wage loss of only 18% for 2020 while regular workers experienced a much slower recovery, with the average wage loss remaining around 26% for 2020.
• 81% of manpower/trainee workers experienced wage loss, compared to 97% of regular workers.
• The sharpest dip in wages was observed in April when manpower workers experienced a wage loss of over 80%
Figure 8.3: Trend in monthly wages by gender, 2020`
50
100
150
200
MaleFemale
October-December
June-SeptemberMayMarch-April
January-February
Source: Primary data, n = 192
Mo
nthl
y w
ages
in U
SD

29
while regular workers lost only 34% of the wages. Most manpower workers who were either terminated or laid off during the Covid-19 lockdown period did not have any access to layoff compensation or severance benefits, unlike regular workers who had more access to both.
Figure 3.6: Trend in monthly wages by contract type, 2020
3. Forms Of Covid-19 Wage Theft Wage theft is endemic in global garment supply chains due to power asymmetry between brands, suppliers, and workers. Brands force suppliers to drive down production costs and suppliers in turn pass this down to workers through various forms of wage theft. The Covid-19 pandemic witnessed an escalation of wage theft in Sri Lanka, such as: (A) layoff and termination without legal dues and benefits; (B) underpaid or unpaid overtime; and (C) bonus theft.
“
”
“I was first laid off by the factory between March and early June, during the first Covid-19 lockdown. When the factory reopened, while workers with less than 6 months experience were terminated, workers with 4-5 years of experience,
like me, were shifted to new departments and the production targets were almost doubled. Supervisors and managers also engaged in constant verbal harassment,
calling us ‘whores’ and ‘bitches.’ The work environment was terrible and no one
could complete these targets. We were all terminated by September. I only received
part of my severance benefits in September and was promised that the remaining
will be paid to me within 3 months. Even after 6 months, I have not received it. In
October, I registered myself in a manpower agency but I was unable to find work as
factories were no longer hiring manpower workers. I also tried to stitch and sell
clothes from my house at that time, but it failed miserably, as I could not travel
to the market due to the Covid-19 travel restrictions. My sister, who is pregnant,
also lost her job at the same time, and she is unable to find work as manpower
agencies refuse to enrol pregnant women. I have pawned both my sister’s and my
gold jewellery to pay for rent and to send remittances to my parents who are agricultural workers. We don’t want to
return to our village as we know there are no job opportunities there.”
-Prisha, 33-year-old garment worker who worked at a Levi Strauss & Co supplier factory
Figure 8.4: Trend in monthly wages by contract type, 2020
0
50
100
150
200
Manpower workers/TraineesRegular worker
October-December
June-SeptemberMayMarch -April
January-February
Source: Primary data, n = 192
Mo
nthl
y w
ages
in U
SD

30
• 96% of the workers
experienced employment
shocks either in the
form of layoffs (76%) or
termination (20%) (Figure
3.7). 85% of terminated
workers did not receive
full severance benefits.
• On an average workers lost
21% of their work days in
2020.
A. Layoffs And Terminations
• Some workers, as seen in the case of Prisha, faced both layoffs and termination, with a few working days in July and August when production picked up pace with the relaxation of Covid-19 restrictions.
• At the peak of the Covid-19 national lockdown, 95% of the respondents were laid off in April and 87% of the respondents still had no job in May (Figure 3.8). Though the trend in layoffs declined to 27% between June and September, it subsequently climbed to 35% during the second wave of Covid-19 between October and December.
• Around 83% of the regular workers were laid off at some point in 2020 and around 13% were terminated. However, around 30% manpower workers were laid off, while 60% of the manpower workers were terminated.
Figure 3.7: Employment status, 2020
Figure 3.8: Trend in percentage of workers laid off, 2020
Source: Primary data, n = 192
Figure 8.5 : Employment status, 2020
76%Laid Off
20%Terminated
5%Didn’t face layoff/
termination
Source: Primary data, n = 192
Per
cent
age
of
Wo
rker
s
0
20
40
60
80
100
October-December
June-SeptemberMay
March-April
January-February
Figure 8.6 : Trend in percentage of workers laid-off, 2020

31
B. Unpaid And Underpaid Overtime
“
”
“Although the factory shut down due to the Covid-19 lockdown only by the last
week of April, workers were not paid for the entire month of April, even if we had
worked overtime every week. We also did not receive our bonus that month. In mid-May, when a worker in my boarding
house tested positive for Covid-19, the factory forced me to go on unpaid leave for 3 weeks. While the government provided
5000 LKR (26 USD) at that time, it was a quarter of what I would have earned
had I worked those weeks. Since June, I have been asked to do unpaid overtime
for at least 2-3 hours a week. In October, even when workers were informing the management that they were unwell and having fever, the management forced
them to work – this led to the spread of Covid-19 in the factory, with almost 600
workers contracting the virus. I have never seen such tough times in my 9 years in this industry. I have been buying food on credit since April so that I can save some cash to send to my family. In July, I also pawned
the only gold necklace I have. My husband has been sick and bed-ridden for the past 6 months and I have a three-year-old son
in my village, so I have to send money to them regularly. Even if I go hungry, I do not want to see my child go hungry. At least, if the company paid us for our
overtime work, life would not have been this difficult.”
- Eromi, 29-year-old garment worker who works at a NEXT supplier factory
Unpaid or underpaid overtime work is one of the main practices through which wage theft is operationalised. According to Sri Lanka’s labour laws, employers are required to pay 1.5 times the regular hourly rate for overtime work performed. However, no worker in our survey was paid for overtime at the legally mandated rate even during the pre-pandemic period.
• After the Covid-19 lockdown
started, workers reported
two trends with regard to
payment of overtime:
1. Underpayment of overtime,
with workers working
longer hours of overtime
than in the pre-pandemic
period.
2. Underpayment of overtime,
which existed in the pre-
pandemic period turned
to non-payment for
overtime, with workers
who demanded payment
for overtime work
being threatened with
termination.

32
Both these trends accentuated during the Covid-19 lockdown period (April-May) when factories were engaged in PPE production (Figure 3.9). Women manpower workers were mainly engaged in PPE production, with the workers working for longer hours of overtime than regular workers at lower wage rates (Figure 3.10 and Figure 3.11). However, once garment production resumed, regular workers were made to work longer hours of overtime than manpower hours, with regular workers facing higher levels of non-payment or under-payment for overtime work than in the pre-pandemic period.
Figure 3.9: Trend in overtime pay received, 2020
Figure 3.11: Trend in hours of overtime by gender, 2020
Figure 3.10: Trend in hours of overtime by contract type, 2020
C. Bonus Theft
The non-payment or partial payment of bonuses constitutes another form of wage theft in Sri Lanka during the pandemic period.
Figure 8.7 : Trend in overtime pay received, 2020
Source: Primary data, n = 136(workers who worked overtime)
40
60
80
100
October-December
June-SeptemberMay
March-April
January-February
Per
cent
age
of
Wo
rker
s
Source: Primary data, n = 136
Ho
urs
of
over
tim
e
1.0
1.5
2.0
2.5
3.0
Manpower/Trainee WorkersRegular Workers
October-December
June-SeptemberMayMarch-April
January-February
Figure 8.8 : Trend in hours of overtime by contract type, 2020
Figure 8.9 : Trend in hours of overtime by gender, 2020
1
2
3
4
5
MaleFemale
October-December
June-SeptemberMayMarch-April
January-February
Ho
urs
of
over
tim
e
Source: Primary data, n = 136
• 76% of regular workers
surveyed reported that they
did not receive the Sinhala/
Tamil New Year bonus in
2020 while all regular workers
stated that they received it
in 2019. For workers who
received the bonus, the average
bonus amount fell from 128
USD in 2019 to 120 USD.
In Sri Lanka, most regular workers in surveyed factories generally receive an annual bonus in April during the Sinhala/Tamil New Year. Some factories also provide a bonus in December, before the holiday
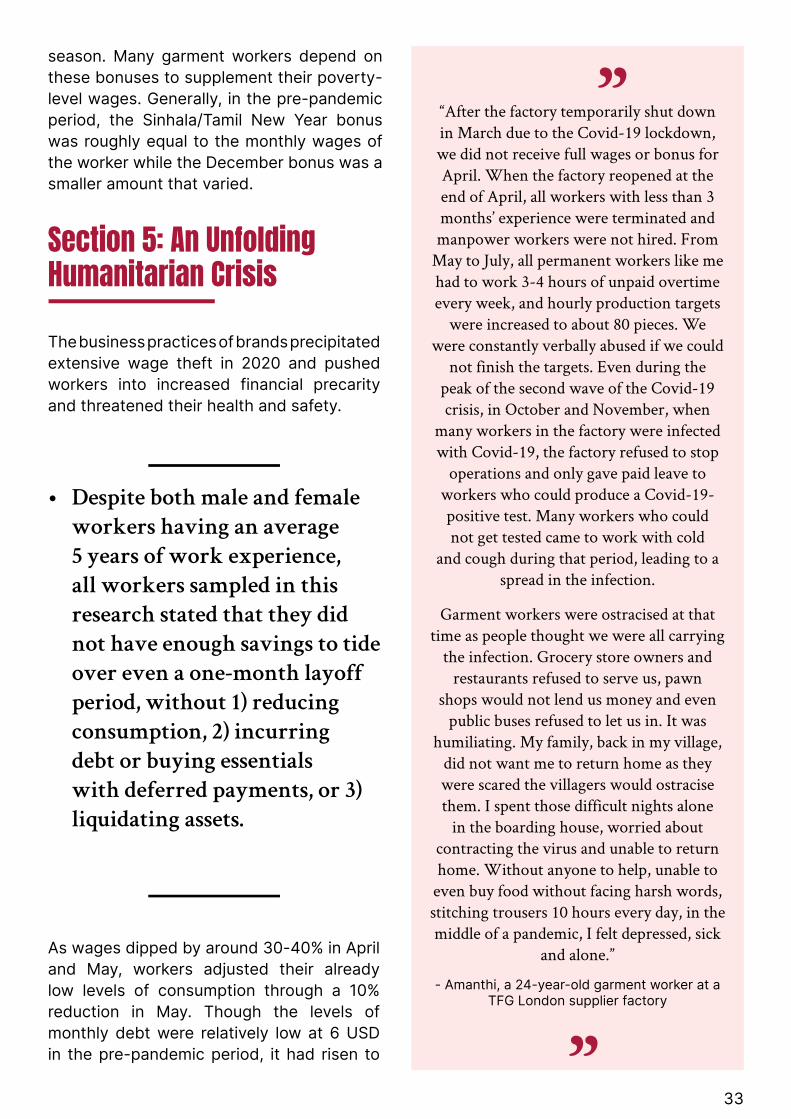
33
Section 5: An Unfolding Humanitarian CrisisThe business practices of brands precipitated extensive wage theft in 2020 and pushed workers into increased financial precarity and threatened their health and safety.
“
”
“After the factory temporarily shut down in March due to the Covid-19 lockdown, we did not receive full wages or bonus for April. When the factory reopened at the end of April, all workers with less than 3 months’ experience were terminated and manpower workers were not hired. From
May to July, all permanent workers like me had to work 3-4 hours of unpaid overtime every week, and hourly production targets
were increased to about 80 pieces. We were constantly verbally abused if we could
not finish the targets. Even during the peak of the second wave of the Covid-19 crisis, in October and November, when
many workers in the factory were infected with Covid-19, the factory refused to stop
operations and only gave paid leave to workers who could produce a Covid-19-positive test. Many workers who could not get tested came to work with cold
and cough during that period, leading to a spread in the infection.
Garment workers were ostracised at that time as people thought we were all carrying
the infection. Grocery store owners and restaurants refused to serve us, pawn
shops would not lend us money and even public buses refused to let us in. It was
humiliating. My family, back in my village, did not want me to return home as they were scared the villagers would ostracise them. I spent those difficult nights alone
in the boarding house, worried about contracting the virus and unable to return home. Without anyone to help, unable to
even buy food without facing harsh words, stitching trousers 10 hours every day, in the middle of a pandemic, I felt depressed, sick
and alone.”
- Amanthi, a 24-year-old garment worker at a TFG London supplier factory
season. Many garment workers depend on these bonuses to supplement their poverty-level wages. Generally, in the pre-pandemic period, the Sinhala/Tamil New Year bonus was roughly equal to the monthly wages of the worker while the December bonus was a smaller amount that varied.
• Despite both male and female
workers having an average
5 years of work experience,
all workers sampled in this
research stated that they did
not have enough savings to tide
over even a one-month layoff
period, without 1) reducing
consumption, 2) incurring
debt or buying essentials
with deferred payments, or 3)
liquidating assets.
As wages dipped by around 30-40% in April and May, workers adjusted their already low levels of consumption through a 10% reduction in May. Though the levels of monthly debt were relatively low at 6 USD in the pre-pandemic period, it had risen to
34
around 15-17 USD per month from April, with this level persisting through the rest of the year (Figure 3.12).
Moreover, as seen in the case of Amanthi, workers also reported that during the Brandix Covid-19 outbreak that sparked the second Covid-19 wave, garment factories continued to work to meet the production targets of brands, endangering the health and safety of workers. Multiple reports from workers and media indicate that in the aftermath of the Brandix outbreak, the military raided garment workers’ boarding rooms and forced them into quarantine centres which were not created according to procedures established by law. The quarantine centres were unclean with flooded and unsanitary toilets, and PCR tests were not conducted on admission to the Centre, subjecting the workers to greater threat of contagion.12
Thus, the Covid-19 crisis and brand practices during the period played an important role in accentuating the human rights violations of garment workers in Sri Lanka.
1. A Push Below The Poverty LineOur survey indicates that:
• There was a sharp decline in wages and household income of Sri Lankan garment workers due to the Covid-19 crisis, pushing them into severe poverty (Figure 3.13). Wages continued to remain far below the international poverty line for the rest of the year and did not recover to pre-pandemic levels.
• In 2020, even household income, which includes total income of all earning members of the household, falls short when AFWA’s living wage figure is considered (Figure 3.14).
While household income never increases to pre-pandemic levels in 2020 after the sharp dip in April, there is still a steady rise in household income between May and December, 2020 despite the second wave of Covid-19 in October. This is mainly due to distress-driven employment as young men, aged 17-22 years, in the families of garment workers turned to auto rickshaw driving or took up jobs in the construction or agriculture sector to mitigate the impact of the fall in wages of garment workers who were the main breadwinners. Most of these young men dropped out of school or college to take up poorly paid insecure forms of employment and this is likely to increase inter-generational transmission of poverty.
Workers reported that household income earned from May 2020 was mostly devoted to repaying debt incurred during the Covid-19 lockdown or meeting basic consumption needs like food and rent.
• Wages of garment workers have remained stagnant, regardless of work experience, as the age-wise distribution of wages shows that middle-aged workers do not
Figure 3.12: Trend in wage, consumption and debt
Figure 8.10: Trend in wages, consumption and debt, 2020
0
50
100
150
200
DebtConsumptionWages
October-December
June-SeptemberMayMarch-April
January-February
Source: Primary data, n = 192
US
D
35
have higher wages, compared to younger workers (Figure 3.15).
“
”
“When the factory temporarily shut down at the end of April 2020 due to the Covid-19 lockdown, none of the 1400 workers in the factory received
their wages for April. All workers who had worked for less than 6 months in
the factory were terminated overnight. I was laid off from April to June,
and then terminated. Although I had worked in the factory for 7 years, I
received no severance benefits. I was unable to find another job for the next two months. Since August, I have been
trying to find work as a manpower worker through an agency but I
can only get 1-2 days of work every week, reducing my monthly income to almost 6000 LKR (31 USD). From June, I stopped sending money to my parents in the village. My father, who
has chronic diseases like diabetes, stopped taking his medicines regularly
as he could not afford it without my financial support. In July, I pawned
a gold ring my mother had given me to help send money to my parents. I have now moved into a one-room apartment, which I share with three other women to cut costs. I have cut down my food intake and only eat 2
meals a day. I have never experienced such difficult times.”
- Anika, a 27-year-old garment worker who worked at a PVH supplier factory
Figure 3.13: Trend in monthly wages with reference to
international poverty line (World Bank), 2020
Figure 8.11 : Trend in monthly wages with referenceto international poverty line (World Bank), 2020
60
90
120
150
Poverty Line at 3.2 USD PPPWages
October-December
June-SeptemberMayApril
January-February
US
D
Figure 3.14: Trend in monthly household income with reference
to AFWA living wage, 2020
Figure 3.15: Age-wise distribution of wage, 2020
200
250
300
350
400AFWA Living WageFamily Income
October-December
June-SeptemberMayMarch-April
January-February
Source: Primary data, n = 192
US
D
Figure 8.12 : Trend in monthly householdincome with reference to AFWA living wage , 2020
0 10 20 30 40 50 6050
100
150
200
250
Age
Mo
nthl
y w
ages
in U
SD
Source: Primary Data, n = 192

36
2. Distress-Driven Employment: A Means To Meet Household Consumption And Rising DebtConsumption
• 15% of the workers reported that, after the Covid-19 lockdown, at least one additional member of their immediate family, mostly young men aged between 17-22 years, left their education and took up precarious employment to help their families repay existing debt and to ensure that household income meets at least basic needs of food and rent.
• This distress-driven employment ensured that total consumption, which reduced from USD 170 during January-February to USD 151 during May, returned to pre-pandemic levels between October-December.
• Despite this, significant dips in consumption were observed in food, healthcare and entertainment in 2020, with workers cutting expenses on these items by an average of 9%, 10%, and 21%, respectively.
As garment workers in Sri Lanka are mostly migrants, many like Anika cut down on personal consumption and incurred debt to send remittances to their families, which ensured that wages met around 70-90% of the household consumption in 2020 (Figure 3.16). Migrants remitted around 30% of their income in 2020 to support their families in villages. This was exceptionally high at around 47% in April, 2020.
• Garment workers cut down
personal consumption
and incurred debt to send
remittances as it is the most
important source of income
for most families of garment
workers. Most workers stated
that they could not avoid
sending remittances as that
would jeopardise the survival
of their families as remittances
are used to meet basic needs of
the household including food,
rent, health and education.
Figure 3.16: Share of wages and debt in consumption
Source: Primary Data, n=192
0
20
40
60
80
100
Share of debt in household consumption
Share of wages in household consumption
October-December
June-SeptemberMayMarch-April
January-February
90%
72%
90% 91%84%
3%8% 8% 8% 8%
Per
cent
age
of
wo
rker
s
Debt
• The average monthly debt of workers increased from 6 USD in the pre-pandemic period to 17 USD by the end of 2020. The absolute amount of debt remains low as it was incurred to meet individual

37
consumption needs of the worker and not the household.
• Around 51% of the workers borrowed an average of 10 USD on a monthly basis from April; out of which 60% reported that they incurred debt to meet food expenses, and around 25% borrowed to pay rent (Figure 3.17).
• While 55% of the workers reported that they borrowed predominantly from friends and relatives, 36% resorted to moneylenders, while the share of formal credit, which is inaccessible to migrant workers in the FTZ, was negligible (Figure 3.18).
• Additionally, most workers in FTZs also entered into informal agreements with their landlords and grocery store owners during the pandemic period, with the promise that they would pay for rent and items purchased, respectively, within 30-90 days. This is implicit debt, but it is not reflected in the actual borrowing figures reported by workers. Such dependence on landlords and grocery store owners created extreme uncertainty for garment workers regarding access to food and housing, as informal arrangements like these could be revoked at any time.
Figure 3.17: Reasons for incurring debt, 2020
Source: Primary data, n = 170(number of workers who incurred debt)
60%Food
24%Rent
10%Education
6%Others
Figure 3.18: Sources of debt, 2020
Figure 8.15: Sources of debt, 2020
Source: Primary data, n = 170(number of workers who incurred debt)
55%Friends/Relatives
36%Moneylenders
8%Co-workers
1%Banks/Microfinance

38
Access To Covid-19 Related Relief EffortsAround 80% of garment workers reported that they were able to access some form of relief/support during the Covid-19 crisis.
• Civil society organisations played an important role in supporting workers. 33% of the workers receiving food support from NGOs. 24% of the workers reported receiving similar support from suppliers, predominantly because they were migrants residing near factories in FTZs (Figure 3.19).
• 18% of the workers received monetary support of 5000 LKR (25 USD) from the government in the form of Covid-19 relief during the lockdown.
Figure 3.19: Percentage of workers who received Covid-19 support from various sourcesFigure 8.16 : Percentage of workers who received Covid-19 support from various sources
Source: Primary data, n = 154(workers who received Covid-19 relief)
0
5
10
15
20
25
30
35
Trade UnionNGO/CharityGovernmentFactory
HealthcareFoodMonetary
2% 2%
24%
10%
33%
11%
15%
6% 7%5%
18%
11%
Per
cent
age
of
wo
rker
s
39
Section 6: 2021 – The Tragedy RepeatsA third wave of Covid-19 started in Sri Lanka in April 2021, soon after the traditional Sinhala and Tamil New Year celebrations. Garment factories were exempt from lockdown restrictions as the apparel sector is economically important for Sri Lanka.13 Suppliers took advantage of these relaxations as they increased the pressure on workers, putting the lives and well-being of workers at risk. This is despite the fact that the second wave of Covid-19 in Sri Lanka in 2020 was due to a super-spreader event within the garment industry.
Workers and unions have been repeatedly raising complaints about the lack of implementation of health and safety protocols in the industry and the exclusion of manpower workers from relief programmes. Due to the absence of social security nets and high wage loss suffered by workers in 2020, garment workers are reluctant to stay home and they are eager to work as they are struggling to survive.14 Brands remain insensitive to the crisis faced by the workers as they continue to pressure suppliers to cut down prices and delay payments to them. The consequence of these practices again disproportionately fall on workers in the form of wage theft and unsafe working conditions.
40
References
1 GLJ-ILRF. (2021). IFC Investment in Brandix Lanka LTD. GLJ-ILJRF. Retrieved from https://globallaborjustice.org/wp-content/uploads/2021/03/03.25.2021-Brief-re-Brandix-IFC-complaint.pdf
2 Daniel, S. (2020, November 16). A Pillar Of Sri Lanka’s Economy, Garment Workers Ostracised After A Covid Outbreak At A Factory. Retrieved from Huff Post: https://www.huffpost.com/archive/in/entry/sri-lankas-garment-factory-workers-coronavirus-pandemic_in_5fae6868c5b6b363336975a2
3 Srilanka Apparel. (2020, November). An Industry Misunderstood – Sri Lankan Apparel’s Tale Of Resilience & Global Leadership. Srilanka. Retrieved from https://www.srilankaapparel.com/an-industry-misunderstood-sri-lankan-apparels-tale-of-resilience-global-leadership/
4 Tilakaratne, W. M. (2006). Phasing out of MFA and the emerging trends in the readymade garment industry in Sri Lanka. Employment in Readymade Garment Industry in Post-MFA Era: The Case of India, Bangladesh and Sri Lanka, China. Institute of Developing Economies. Retrieved from https://www.ide.go.jp/library/English/Publish/Download/Jrp/pdf/140_2.pdf
5 Ruwanpura, K. N. (2015). Garments without guilt? Uneven labour geographies and ethical trading—Sri Lankan labour perspectives. Journal of Economic Geography, 16(2), 423-446. Retrieved from https://academic.oup.com/joeg/article/16/2/423/2412622
6 Hewamanne, S. (2021). Pandemic, Lockdown and Modern Slavery among Sri Lanka’s Global Assembly Line Workers. Journal of International Women’s Studies, 22(1), 54-69.
7 Cowgill, M., Luebkler, M., & Xia, C. (2015). Minimum wages in the global garment industry: Update for 2015. Bangkok: ILO.
8 Xinhua (2020). Sri Lanka’s apparel industry attracts over 500 million USD orders for PPE Retrieved from: http://www.xinhuanet.com/english/2020-05/22/c_139079934.htm
9 Dias, S. (2020). Apparel industry to lay off 30% workforce. Retrieved from Business Times: https://www.sundaytimes.lk/200405/business-times/apparel-industry-to-lay-off-30-workforce-399059.html
10 Saini, M. (2021, February 24). Sri Lanka Plays to Strengths Amid Covid Downturn. Retrieved from Sourcing Journal: https://sourcingjournal.com/topics/sourcing/sri-lanka-joint-apparel-association-forum-sourcing-coronavirus-manufacturing-263546/
11 Hewage, K., & Anjana , P. (2021, March 22). Stitching Solutions: Protecting Sri Lanka’s Apparel Workers During COVID-19. Retrieved from Southern Voice: http://southernvoice.org/stitching-solutions-protecting-sri-lankas-apparel-workers-during-covid-19/
12 Jang, B. (2020, October 27). Sri Lanka: vulnerable groups pay the price for militarization of COVID-19 response. Retrieved from International Commission of Jurists: https://www.icj.org/sri-lanka-vulnerable-groups-pay-the-price-for-militarization-of-covid-19-response/

41
13 Kumarasinghe, K. (2021, May 18). Sri Lanka Teaches the World How Not to Respond to COVID-19. Retrieved from The Diplomat: https://thediplomat.com/2021/05/sri-lanka-teaches-the-world-how-not-to-respond-to-covid-19/
14 UCA News. (2021, May 17). Sri Lankan garment workers seek urgent government help. Retrieved from UCA News: https://www.ucanews.com/news/sri-lankan-garment-workers-seek-urgent-government-help/92484#

42
PAKISTAN

43
Chapter Highlights• All workers experienced employment shocks either in the form of layoffs
(86%) or terminations (14%).
• While workers reported an overall wage theft of 29% in 2020, overall exports in 2020 declined by just 2%, as compared to 2019.
• 81% of the workers were pushed below the international poverty line of the World Bank (measured at 3.2 USD PPP) between March and May, 2020.
• Workers with an average 5 years of work experience did not have enough savings to tide over even a one-month layoff period, without reducing consumption, incurring debt or selling assets.
Section 1: Introduction
Garment workers in Pakistan faced some of the highest levels of wage theft in the Asian garment industry during the Covid-19 crisis due to the imposition of provincial Covid-19 lockdowns that coincided with the cancellation of orders by many global brands sourcing from the country. Although the intensity of the crisis was felt most in April and May 2020, women workers, who are mostly employed in casual jobs, continued to bear the brunt of it even in early 2021 as most factories did not rehire women workers laid off in 2020.
The textile and garment industry in Pakistan, which is the second largest employer in Pakistan, accounts for around 8.5% of GDP and almost 70% of the country’s exports.1 Pakistan’s garment exports contribute to around 1-2% of the world market share and has recorded high rates of Compounded Annual Growth Rate in the value of garment exports over the past few years.2 Despite this growth, Pakistan’s garment workers are some of the worst paid in the world, with
poor social security coverage and extremely low rates of unionisation.
In contrast to the global norm, the garment factory workforce in Pakistan is largely male-dominated, as women face significant restrictions to mobility due to cultural and social norms. Nevertheless, presence of women in the garment workforce has been increasing after the phase-out of the quota-based Multi Fibre Agreement (MFA) in 2005 as a result of various campaigns by development agencies.3 Accordingly, the garment industry is slowly emerging as an important driver of female workforce participation as brands and suppliers take advantage of the gender pay gap and lack of industrial work experience among women. However, cheap wages, lack of written contracts, exploitative working conditions, and labour rights violations remain a characteristic feature of the Pakistani garment industry, as indicated by multiple investigations conducted in the aftermath of the Ali Enterprises factory fire

44
that killed 264 garment workers.4
During the Covid-19 crisis, the plight of garment workers, women in particular, significantly worsened as suppliers under financial distress resorted to wage theft through widespread layoffs and terminations, cuts in social security benefits, and forced unpaid or underpaid overtime work. As prices of essential items soared due to high inflation, workers were pushed below the poverty line, with some of them reporting that they even sold utensils and mattresses at home to make ends meet.
Section 2: The Methodology In Brief
1. SamplingAFWA conducted a survey of 605 workers from 50 garment factories in Pakistan, located across three districts in Punjab and Sindh provinces – Faisalabad, Lahore and Karachi. The average size of the selected factories is given in Figure 4.1, and the details of workers surveyed are provided below.
Figure 4.1: Classification of the selected factories according to the
size of the workforce
Source: Primary data, n = 50
0
5
10
15
20
25
30
>100007001-10000
5001-70003001-5000
1000-3000<1000
Average number of workers per factory
Per
cent
age
of
fact
ori
es
4% 4%
30%
22%
30%
8%

45
Number of Factories
50
Experience
Nature of Employment
Education
Age
Source: Primary data, n = 605
Details of Workers Surveyed

46
Pre Covid-19
Covid-19 National Lockdown
Post Covid-19 Lockdown
Partial Covid-19 Lockdown
January - February
March - May
June-October
November-December
• Slight increase in orders for garment exporters as some of the cancelled orders from China were shifted to Pakistan.
• Garment factories worked at almost full capacity.
• Steady rise in Covid-19 cases led to a nationwide lockdown, forcing factories to stop all operations.
• Gradual reopening of garment factories as lockdown restrictions were relaxed, with the government providing various export subsidies to garment exporters.
• Rise in garment export production from September.
• Steady increase in garment production surpassing the 2019 production for the same period.
• Second wave of Covid-19 begins from November
2020
Figure 4.2: Classification of time periods, 2020
2. Classification Of Time Periods, 2020Our survey has measured variables across four time periods based on the implementation of the Covid-19 lockdown restrictions in Pakistan. The graphs also show variables across these time periods. However, in order to fully capture the crisis during the Covid-19 national lockdown period, data was collected with respect to each month in the period (March, April and May) and the graphs also indicate the same.
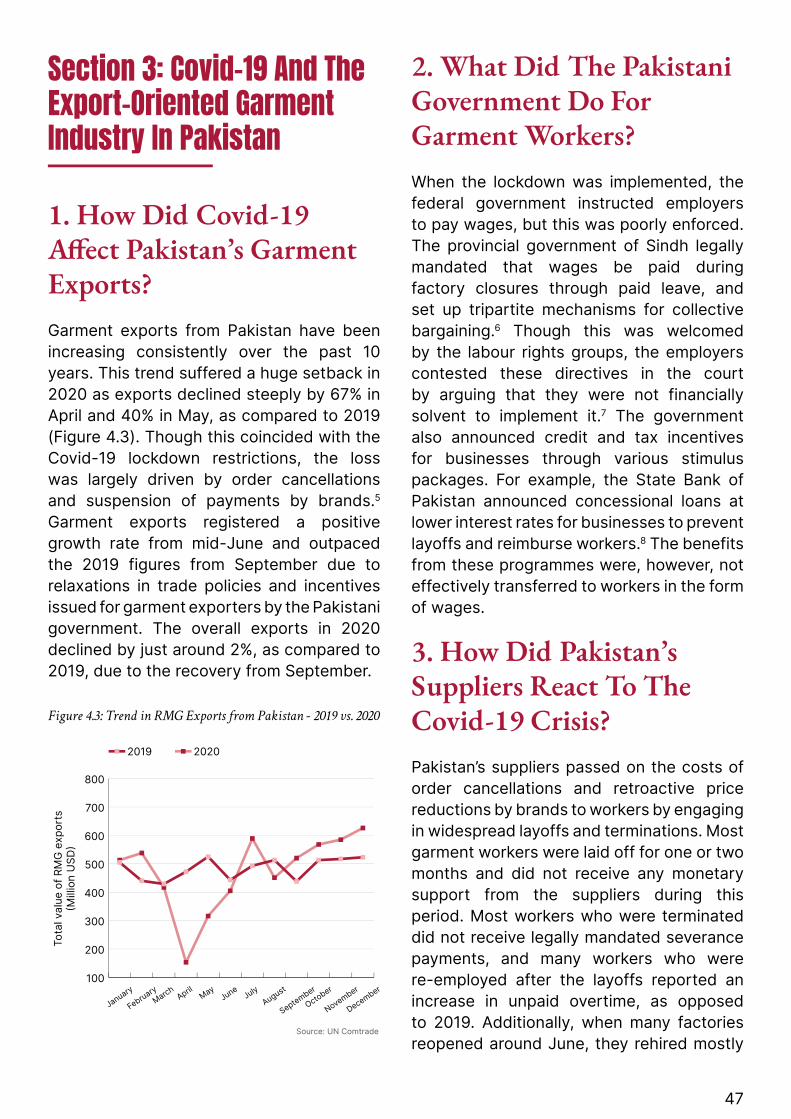
47
Section 3: Covid-19 And The Export-Oriented Garment Industry In Pakistan
1. How Did Covid-19 Affect Pakistan’s Garment Exports?Garment exports from Pakistan have been increasing consistently over the past 10 years. This trend suffered a huge setback in 2020 as exports declined steeply by 67% in April and 40% in May, as compared to 2019 (Figure 4.3). Though this coincided with the Covid-19 lockdown restrictions, the loss was largely driven by order cancellations and suspension of payments by brands.5 Garment exports registered a positive growth rate from mid-June and outpaced the 2019 figures from September due to relaxations in trade policies and incentives issued for garment exporters by the Pakistani government. The overall exports in 2020 declined by just around 2%, as compared to 2019, due to the recovery from September.
Figure 4.3: Trend in RMG Exports from Pakistan - 2019 vs. 2020
2. What Did The Pakistani Government Do For Garment Workers?When the lockdown was implemented, the federal government instructed employers to pay wages, but this was poorly enforced. The provincial government of Sindh legally mandated that wages be paid during factory closures through paid leave, and set up tripartite mechanisms for collective bargaining.6 Though this was welcomed by the labour rights groups, the employers contested these directives in the court by arguing that they were not financially solvent to implement it.7 The government also announced credit and tax incentives for businesses through various stimulus packages. For example, the State Bank of Pakistan announced concessional loans at lower interest rates for businesses to prevent layoffs and reimburse workers.8 The benefits from these programmes were, however, not effectively transferred to workers in the form of wages.
3. How Did Pakistan’s Suppliers React To The Covid-19 Crisis?Pakistan’s suppliers passed on the costs of order cancellations and retroactive price reductions by brands to workers by engaging in widespread layoffs and terminations. Most garment workers were laid off for one or two months and did not receive any monetary support from the suppliers during this period. Most workers who were terminated did not receive legally mandated severance payments, and many workers who were re-employed after the layoffs reported an increase in unpaid overtime, as opposed to 2019. Additionally, when many factories reopened around June, they rehired mostly
100
200
300
400
500
600
700
800
20202019
December
November
October
September
AugustJuly
JuneMay
April
March
February
January
Tota
l val
ue o
f R
MG
exp
ort
s(M
illio
n U
SD
)
Source: UN Comtrade

48
male workers as opposed to female workers who were mostly casual workers.
Section 4: Hyper-Exploitation Of Labour Through Wage Theft
1. Wage Theft EstimatesWage theft was the predominant feature of the Covid-19 crisis for garment workers in Pakistan, with our survey estimates indicating that 244,510 garment workers across 50 factories in Pakistan were denied 85.08 million USD as wages due to order cancellations, non-payment for existing orders, and other irresponsible practices by brands during the pandemic. Wage theft peaked in April 2020 but workers consistently experienced wage theft throughout the year (Figure 4.4), and well into 2021. The magnitude of wage theft declined towards the end of the year with an increase in production due to government support and relaxation of Covid-19 lockdown-related restrictions.
Extent of Wage Theft
• Workers reported an
overall wage theft of 29% in
2020, with a sharp decline
in wages by 61-69% during
the total lockdown period
and 26% during the partial
lockdown period.
• Wages never recovered to
the pre-pandemic levels in
2020 as workers continued
to experience wage theft of
around 5% during the post-
lockdown period.

49
50Factories surveyed
144,957Actual wage theft (USD)
244,510Total number of workers across surveyed factories
4,762Actual wage theft per factory (USD)
85.08 MillionWage theft across surveyed factories (USD)
2.2 MillionAverage wage theft per factory (USD)
605Workers surveyed
Wage Theft Figures
For surveyed workers
Wage theft estimates

50
Figure 4.4: Wage theft estimates, 2020
2. Pre-Existing Inequalities As A Fertile Ground For Covid-19 Wage TheftWages and working conditions are shaped by pre-existing inequalities in the labour market in the form of gender, age, and contractual status. During the pre-pandemic period, brands took advantage of these disparities to systematically underpay vulnerable segments of the workforce and flexibilise employment relations.
Pakistan has one of the highest male-female disparities in garment sector earnings in Asia.9 As per our survey, 66% of the casual workers were women, indicating the high prevalence of women in casual jobs. Casual workers are an extremely disadvantaged group of workers as they earn lower wages and have more limited access to social security benefits and employment security, compared to regular workers.
The double burden of job insecurity and patriarchal norms accentuated the precarity of women workers during the Covid-19 crisis, as they faced higher wage theft and an exacerbation of social inequalities.
“
”
“Before we were laid off in May, we had to work 14 hours a day, but had no contracts
or any access to social security benefits. Moreover, in 2020, the factory refused to pay us Eid bonus, stating that their orders
were cancelled. Women workers who had worked for more than a decade in the
factory were terminated overnight and were given no severance benefits. For the few who were laid off like me, no financial
support was given. I had to sell our refrigerator, mixer and mobile phone to
put food on our table. In October, when the factory reopened, only male workers were reemployed. Only in January, 2021 did the factory start reemploying women workers. However, our overtime pay is half of what
we were paid in January 2020, though we work the same hours. We are also
constantly threatened with termination and are yelled at for even drinking water during
work hours.”
– Amira, 30-year-old garment worker at a Levi’s supplier factory in Faisalabad
• 82% of women experienced
wage loss in 2020 compared
to 71% of men.
Female workers lost more working days than their male counterparts in 2020. Our survey shows that women had less chances of getting reemployed than men as factories reopened. Most women workers who were laid off or terminated turned to informal
Figure 7.2 : Wage theft estimates, 2020
0
5
10
15
20
December
NovemberOctober
SeptemberAugust
JulyJune
MayApril
March
Source: Primary data, n = 605
Mill
ion
US
D

51
home-based work or domestic work to feed their families.
On an average, women lost 43% of their wages, while on an average, men suffered a total wage loss of 27% over 2020. When men suffered wage loss of 68% and 56% in April and May, respectively, women lost 80% and 90% of their wages during these months (Figure 4.5). Even during the partial lockdown stage from June to October, while men suffered 20% wage loss, female workers lost 65% of their wages.
• 90% of casual workers
experienced wage loss in
2020, compared to 60% of
regular workers.
Casual workers lost more working days than regular workers and the recovery was much slower for these workers as suppliers reemployed predominantly regular workers after the Covid-19 lockdown. The sharpest wage loss was experienced during the month of May – 90% for casual workers and 47% for regular workers (Figure 4.6). The disparity between the two categories of workers worsened during the pandemic and persisted throughout 2020.
Figure 4.6: Trend in monthly wages by contract type, 2020
3. Forms Of Covid-19 Wage TheftWage theft is endemic in garment supply chains due to power asymmetry between brands, suppliers, and workers. Brands force suppliers to drive down production costs and suppliers in turn pass this down to workers through various forms of wage theft. The Covid-19 pandemic witnessed an escalation of wage theft in Pakistan, such as:
A. Layoffs And Terminations
At the peak of the crisis, 88% of the respondents were laid off in April, and 67% of the respondents still had no job in May (Figure 4.8). While the trend in layoffs consistently declined after June, around 11% of the workers were still not reemployed at the end of the year. Moreover, 86% of the workers who were terminated did not receive their termination benefits and legal layoff wages. All these workers were initially laid off between March and May and then abruptly terminated between June and July.
Figure 7.3: Trend in monthly wages by gender, 2020
0
30
60
90
120
150
MaleFemale
November- December
June-OctoberMayAprilMarch
January
February
Mo
nthl
y w
ages
in U
SD
Source: Primary data, n = 605
Figure 4.5: Trend in monthly wages by gender, 2020
0
30
60
90
120
150
Casual WorkersPermanent/Regular Workers
November- December
June-OctoberMayAprilMarch
January-February
Figure 7.4 Trend in monthly wages by contract type, 2020
Source: Primary data, n = 605
Mo
nthl
y w
ages
in U
SD

52
“
”
“We received only 2000 PKR (12 USD) for two months as financial support from the company after being laid off in May. This amount hardly helped us meet food costs, especially with food prices rising steadily. Since June, my 15-year-old daughter and I have been working from home, stitching embroideries for a local retail shop that
pays 5 PKR (0.032 USD) per piece. Even if we complete 100 pieces a day by working more than 10 hours, we hardly earn 500
PKR (3.2 USD). My 14-year-old daughter has also started working with us from
December, 2020. Both my children have dropped out of school, as I don’t have any money to pay for school fees. We can only
feed ourselves if all of us work.”
- Ayesha, 33-year-old garment worker at a Tesco supplier factory in Faisalabad
• On an average workers lost
26% of their work days in
2020 (Figure 4.9)
As seen in the cases of Amira and Ayesha, layoffs and terminations during the Covid-19 period have accentuated pre-existing inequalities and have disproportionately affected the more vulnerable sections of the garment workforce, in particular women, who are mostly casual workers. This is likely to have a lasting impact on employment relations and work standards in the industry.
Figure 4.7: Employment status, 2020
Figure 4.8: Trend in percentage of workers laid off, 2020
Figure 7.6 : Trend in percentage of workers laid off, 2020
0
20
40
60
80
100
November- DecembeMayAprilMarch
January-February
Source: Primary data, n = 605
Per
cent
age
of
wo
rker
s
Figure 7.5 : Composition of employment loss, 2020
Source: Primary data, n = 605
85%Laid off
14%Terminated
• All workers in our survey
experienced employment
shocks either in the
form of layoffs (86%) or
terminations (14%) (Figure
4.7).
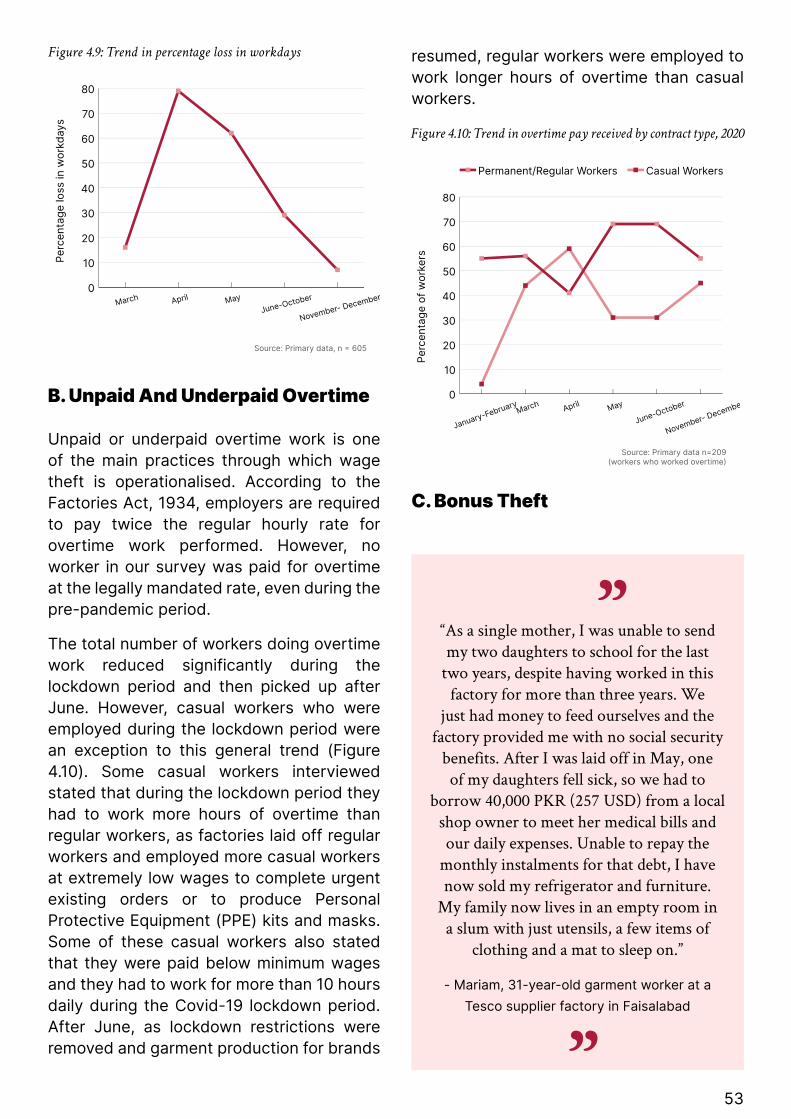
53
Figure 4.9: Trend in percentage loss in workdays
B. Unpaid And Underpaid Overtime
Unpaid or underpaid overtime work is one of the main practices through which wage theft is operationalised. According to the Factories Act, 1934, employers are required to pay twice the regular hourly rate for overtime work performed. However, no worker in our survey was paid for overtime at the legally mandated rate, even during the pre-pandemic period.
The total number of workers doing overtime work reduced significantly during the lockdown period and then picked up after June. However, casual workers who were employed during the lockdown period were an exception to this general trend (Figure 4.10). Some casual workers interviewed stated that during the lockdown period they had to work more hours of overtime than regular workers, as factories laid off regular workers and employed more casual workers at extremely low wages to complete urgent existing orders or to produce Personal Protective Equipment (PPE) kits and masks. Some of these casual workers also stated that they were paid below minimum wages and they had to work for more than 10 hours daily during the Covid-19 lockdown period. After June, as lockdown restrictions were removed and garment production for brands
resumed, regular workers were employed to work longer hours of overtime than casual workers.
Figure 4.10: Trend in overtime pay received by contract type, 2020
C. Bonus Theft
“
”
“As a single mother, I was unable to send my two daughters to school for the last
two years, despite having worked in this factory for more than three years. We
just had money to feed ourselves and the factory provided me with no social security
benefits. After I was laid off in May, one of my daughters fell sick, so we had to
borrow 40,000 PKR (257 USD) from a local shop owner to meet her medical bills and our daily expenses. Unable to repay the
monthly instalments for that debt, I have now sold my refrigerator and furniture.
My family now lives in an empty room in a slum with just utensils, a few items of
clothing and a mat to sleep on.”
- Mariam, 31-year-old garment worker at a Tesco supplier factory in Faisalabad
Source: Primary data n=209(workers who worked overtime)
0
10
20
30
40
50
60
70
80
Casual WorkersPermanent/Regular Workers
November- Decembe
June-OctoberMayAprilMarch
January-February
Per
cent
age
of
wo
rker
s
Source: Primary data, n = 605
Per
cent
age
loss
in w
ork
day
s
0
10
20
30
40
50
60
70
80
November- December
June-OctoberMayAprilMarch
Figure 7.7 : Trend in percentage loss in workdays

54
The non-payment or partial payment of bonuses and social security contributions constitutes another form of wage theft in Pakistan during the pandemic period.
In Pakistan, workers, regardless of their employment status, generally receive Eid bonus, while regular workers also receive an annual bonus. While the bonus amounts vary across regions and types of employment, it is crucial in helping workers meet additional expenses, especially as wages remain low.
• While all workers stated
that they received Eid
bonus in 2019, only 31%
stated that they received it
in 2020.
• While 97% of the regular
workers received annual
bonus in 2019, only 61%
received it in 2020.
• 80% of the workers
reported they did not
receive SESSI/PESSI
contributions and EOBI
contributions during April
and May, 2020.
D. Social Security Theft
Regular workers are entitled to two main social security benefits, namely, the pension scheme provided by the national-level Employees Old Age Benefits Institution (EOBI) and the health services and cash benefits provided by the provincial-level Employees’ Social Security Institutions (ESSIs) - PESSI in Punjab and SESSI in Sindh. Employers are required to contribute to both schemes under the law.
Around 65% of the workers, like Mariam, did not receive any social security benefits even during the pre-pandemic period (Figure 4.11). These numbers significantly increased during the lockdown period, with around 80% of the workers reporting they did not receive SESSI/PESSI contributions and EOBI contributions during April and May. However, the payment of social security benefits resumed to almost pre-pandemic levels by December 2020.
Figure 4.11: Trend in access to social security benefits, 2020efits, 2020
15
20
25
30
35
40
SESSI/PESSIEOBI
November-December
June-OctoberMayAprilMarch
January-
February
Per
cent
age
of
wo
rker
s
Source: Primary data, n (EOBI) = 127 and n (SESSI&PESSI) = 175�(number of workers receiving social security benefits)

55
Section 5: An Unfolding Humanitarian CrisisThe business practices by brands precipitated extensive wage theft during the Covid-19 crisis in 2020, pushing workers into severe poverty.
Despite both male and female workers having an average 5 years of work experience, all workers sampled in this research stated that they did not have enough savings to tide over even a one-month layoff period without 1) reducing consumption, especially cost of children’s education 2) incurring debt, or 3) selling assets. Ten cases of increase in child labour in families of terminated garment workers were also noticed.
• As the wages of garment
workers in Pakistan dipped
by 60-70% in April, the
debt taken by workers
increased by around 113%
for the same period (Figure
4.12).
Figure 4.12: Trend in wages, consumption and debt, 2020
1. A Push Below The Poverty Line
“
”
“I tried to commit suicide soon after I was laid off in May, as I was four months
pregnant and had no money to feed myself or my two other children. The company did not provide any financial support for laid-
off workers, even if they were pregnant or had young children to feed at home.
My landlord saved my life and helped me secure 30,000 PKR (193 USD) as loan from an NGO, to take care of my family’s basic needs and to pay for my medical expenses. I have removed my children from school, as I could not pay for their books or their school fees. In October, I had to take on more debt to meet my pregnancy related expenses. As repaying these debt became difficult, I asked my 15-year-old son to find work in a neighbourhood shop. In January, 2021, I was forced to return to
the factory when it reopened as I did not want my family to starve to death. I leave
my two-month-old baby with my 12-year-old daughter and come to work. I work for more than 10 hours a day, without break and the factory gates are locked to make
sure we don’t leave before the production targets are met. Also, since January, the
management has been constantly making us do unpaid overtime and is threatening
us with termination, if we refuse to do it. I keep feeling suicidal.”
- Sadia, 32-year-old-garment worker at a Levi’s supplier factory in Faisalabad
Figure 7.10: Trend in wages, consumption and debt,
0
50
100
150
200
ConsumptionWageDebt
November-December
June-OctoberMayAprilMarch
January-
February
Source: Primary data, n = 605
US
D

56
Our survey indicates that:
• As seen in the case of Sadia, there was a sharp decline in wages and household income of Pakistani garment workers due to the Covid-19 crisis, pushing them into severe poverty (Figure 4.13). 81% of the workers surveyed were pushed below the international poverty line of the World Bank (measured at 3.2 USD PPP) between March and May, 2020.
• In 2020, even household income, which includes total income of all earning members of the household, falls short when AFWA’s living wage figure is considered (Figure 4.14). This shows the extent of precarity faced by garment workers and their families.
• Wages of garment workers have remained stagnant regardless of work experience as the age-wise distribution of wages shows that middle-aged workers do not have higher wages, as compared to younger workers (Figure 4.15).
Most workers interviewed live in urban slums in single room buildings with limited access to basic necessities, including water and electricity. Many workers informed us that they did not possess any assets like land or jewellery to sell during the Covid-19 period, forcing them to sell other basic items at home - including mixers, fans, chairs or refrigerators. Most women workers who were terminated informed us that they withdrew their children, especially girls, from schools due to the financial burden imposed by the Covid-19 crisis. Many of these girls were working along with their mothers as home-based garment workers, producing clothes for 5-6 PKR per piece (0.3 USD). These pandemic-induced shocks will push more children and families into inter-generational poverty for long periods of time.
Figure 4.13: Trend in monthly wages with reference to
international poverty line (World Bank), 2020
Figure 4.14: Trend in monthly household income with reference
to AFWA living wage, 2020
Figure 4.15: Age-wise distribution of wages
Figure 7.13 : Age-wise distribution of wages
10 15 20 25 30 35 40 45 50 55 6050
100
150
200
250
300
350
Age
Mo
nthl
y w
ages
in U
SD
Source: Primary data, n = 605
Source: Primary data, n = 605
Figure 7.11 : Trend in monthly wages with reference to international poverty line (World Bank), 2020
30
60
90
120
150
Poverty Line at 3.2 USD PPPWages
November- December
June-OctoberMayAprilMarch
January-
February
US
DFigure 7.12 : Trend in monthly household income with reference to AFWA living wage, 2020
Source: Primary data, n = 605
100
150
200
250
300
AFWA Living WageHousehold Income
November- December
June-OctoberMayAprilMarchJanuary-
February
US
D
57
2. Falling Consumption: An Inability To Meet Basic Needs
“
”
“Having been employed as a contract worker, I was unable to get any severance benefits, when I was terminated, though I had worked for three years in the factory.
After losing my job, I became a home-based garment worker, but the pay was less
than half of what I earned in the factory. Since I could not meet our basic expenses, I shifted my children, who were studying
in a private school to a madrasa (an Islamic educational institution), as it provided free education and meals for children. We also sold our mobile phone, refrigerator, mixer and a fan over the last few months, to meet
daily expenses. I have never seen such difficult times.”
- Suha, 35-year-old garment worker at a Primark supplier factory in Karachi
Even prior to the lockdown, neither garment workers’ wage nor total family income (of which wages form the major component) were adequate to meet the consumption requirements of their households, which were already at a minimum level. This shows that despite producing clothes for the world’s richest brands, workers were forced into debt even during the pre-pandemic period. During the peak of the crisis, earned wages met barely around 25-30% of the total consumption needs, forcing workers to cut down further their family’s basic levels of consumption.
The Extent Of Fall In Consumption
Workers were forced to cut down their subsistence level consumption from 145 USD in the pre-pandemic period to 139 USD during the total lockdown period (Figure 4.12). Though consumption recovered to 147 USD by the end of the year, actual consumption is likely to have gone down as prices increased significantly for essential commodities due to a general inflation of 9.1%.
• Consumption expenditure on food fell by around 2% during the Covid-19 lockdown period but this was accompanied by a high food inflation of 14%, indicating that workers and their families were cutting down food consumption.
• While consumption expenditure on health increased from 13% to 22% during the Covid-19 period, this was mainly due to an inflation rate of 8.5% in health services and 14-20% inflation in the prices of basic medicines, including life-saving drugs. In other words, workers are forced to pay more for essentials to prevent any further deterioration in health.
• Consumption expenditure on education also declined by 2% in 2020. While the widespread school closures in Pakistan from March to September could be one reason for this, workers also reported several instances of their children being moved from private schools to madrassas (as seen in the case of Suha) or being forced out of school to find employment in order to make ends meet. Workers also slashed expenses on entertainment and other socio-cultural heads by 75-84% during the Covid-19 period.
• While the share of wages in household consumption fell from 81% in the pre-pandemic period to 25% at the peak of the Covid-19 lockdown period, the share of debt in household consumption increased from 4% in the pre-pandemic

58
period to 59% at the peak of the Covid-19 lockdown period (Table 4.1). This indicates that workers with an average 5 years of experience mainly depended on debt and not savings to finance consumption during the 60-day lockdown period.
Months
Share of wages in household consumption
Share of debt in household consumption
January-February 81% 4%
March 71% 11%
April 25% 59%
May 31% 20%
June-October 56% 25%
November- December 90% 4%
Grand Total 63% 15%
Source: Primary data, n=605
3. Mortaging The FuturePakistani garment workers like Kabir went deeper into debt to finance lower levels of consumption during the Covid-19 lockdown period. 71% of the workers borrowed money because of the Covid-19 crisis and there was an average increase in total debt of about 61% in 2020. The average amount borrowed more than doubled (from 54 USD
to 115 USD) during the Covid-19 lockdown period when compared to the pre-Covid-19 period. 64% of the workers borrowed money to meet basic food expenses, while 23% borrowed to pay housing rent (Figure 4.16).
“
”
“After I was terminated from the factory without any severance benefits in May,
I started working as a daily wage worker for a few days, in another garment factory, which pays around 500 PKR (3 USD) for a 10-hour work shift. I could no longer
afford the medicines my father needed for his chronic diseases and I have accrued more than 30,000 PKR (192 USD) as
debt since I lost my job. I sold my cow in November to meet daily expenses.”
- Kabir, a 34-year-old garment worker at an Adidas supplier factory in Faisalabad
75% of the workers reported that they borrowed from neighbours, friends and relatives (Figure 4.17). Just around 20% relied on formal financial institutions like banks and microfinance institutions, as garment workers informed us, they were not considered “credit-worthy” due to their poverty-level wages.
Table 4.1: Share of wages and debt in household consumption

59
Figure 4.16: Reasons for incurring debt, 2020
Figure 4.17: Sources of debt, 2020Figure 7.15 : Sources of debt, 2020
Source: Primary data, n = 432(workers who incurred debt in 2020)
0
10
20
30
40
50
60
70
80
Others
Moneylenders
Co-workers
Banks/Microfinance
Friends/Relatives
Per
cent
age
of
wo
rker
s
75%
20%
3% 1% 1%
Figure 7.14 : Reasons for incurring debt, 2020
Source: Primary data, n = 432(workers who incurred debt in 2020)
64%Food
1%Education
13%Others
23%Rent

60
Access To Covid-19 Related Relief EffortsOnly 44% of garment workers reported that they were able to access some form of relief/support during the Covid-19 crisis.
• Civil society organisations and trade unions played an important role in supporting workers during the Covid-19 crisis. Around 41% of the workers received food relief from NGOs while 21% of the workers reported receiving food relief from trade unions (Figure 4.18).
• 24% of the workers received monetary support from the government. However, most workers received a meagre one-time amount of 1000-2000 PKR (6-12 USD), which could hardly help meet consumption needs for more than two weeks.
Figure 4.18: Percentage of workers who received Covid-19 support from various sources
Source: Primary data, n = 605
0
10
20
30
40
50
Trade UnionNGO/CharityGovernmentFactory
HealthcareFoodMonetary Support
4%
24%
14%
4%2%
41%
21%
0% 0% 0% 0% 0%
Figure 7.16 : Percentage of workers who received Covid-19support from various sources
Per
cent
age
of
wo
rker
s

61
Section 6: 2021 – The Tragedy RepeatsThough garment exports from Pakistan continued to increase and an ambitious Textile and Apparel 2020-25 Policy with a trillion rupees in subsidies for suppliers is on the anvil, the unanticipated decision of the government to stop cotton imports from India has led to a shortage of cotton. The condition of garment workers, especially women, continues to remain bleak and is likely to worsen because brands have not taken any significant steps to curb wage theft in their supply chains.
Most women garment workers who have been terminated are now working at extremely poorly paid jobs that roughly provide 2-3 USD per day, while those who were laid off and rehired are working more hours of unpaid overtime and suffering increased levels of verbal and mental harassment. Unlike in other garment-producing countries, our sample shows that a significant number of children of garment workers in Pakistan have been forced to drop out of schools and are engaged in menial jobs that pay 1-2 USD per day. The impact of the Covid-19 crisis is likely to have long-lasting effects on inter-generational poverty and gender disparity in Pakistan.

62
References
1 Hearst, K. (2020, July 20). Open Democracy. Retrieved from Our Economy: https://www.opendemocracy.net/en/oureconomy/covid-19-and-the-garment-industrys-invisible-hands/
2 Frederick, S., & Daly, J. (2019). Pakistan in the Apparel Global Value Chain. Durham: Duke Global Value Chains Center, Duke University.
3 Munir, K. A., Naqvi, N., & Usmani, A. (2015). The abject condition of labor in Pakistan. International Labor and Working-Class History, 174-183. Retrieved from http://scholar.google.co.in/scholar_url?url=https://www.researchgate.net/profile/Kamal_Munir/publication/315909292_ilwch_published_version/data/58ecd8f20f7e9b81aedeb7b2/ilwch-published-version.pdf&hl=en&sa=X&ei=8cvSYNDXC9aR6rQPiNGVqAs&scisig=AAGBfm32tYxRt
4 Human Rights Watch. (2019). No Room to Bargain Unfair and Abusive Labor Practices in Pakistan. Karachi: Human Rights Watch. Retrieved from https://www.hrw.org/sites/default/files/report_pdf/pakistan0119.pdf
5 All Pakistan Textile Mills Association. (2020). Statements/Circulars. Retrieved from APTMA.
6 The News International. (2020, March 30). Tripartite mechanism activated to mitigate impact of COVID-19 lockdown on workers. Karachi, Pakistan. Retrieved from https://www.thenews.com.pk/print/636776-tripartite-mechanism-activated-to-mitigate-impact-of-covid-19-lockdown-on-workers
7 Pakistan Today. (2020, May 4). Can’t Pay Workers During Lockdown, Textile Owners Tell Court. Pakistan. Retrieved from https://archive.pakistantoday.com.pk/2020/05/04/cant-pay-workers-lockdown-textile-industry-owners-tell-court/
8 State bank of Pakistan. (2020, April 22). Press. Retrieved from State Bank of Pakistan: https://www.sbp.org.pk/press/2020/Pr-22-Apr-20.pdf
9 International Labour Organization. (2016, April). Publications. Retrieved from ILO: https://www.ilo.org/wcmsp5/groups/public/---ed_protect/---protrav/---travail/documents/publication/wcms_467449.pdf

63
INDONESIA

64
Chapter Highlights• Our survey estimates indicate that 81,633 garment workers across 28
factories in Indonesia were denied 20.02 million USD as wages due to order cancellations, non-payment, and other irresponsible practices by brands in 2020.
• 72% of the workers suffered employment shocks either in the form of layoffs (64%) or terminations (8%).
• As their wages dipped, workers in Indonesia reduced their consumption by 10%, which did not recover by the end of the year.
• 70% of the workers reported that they incurred debt during the pandemic period to finance their consumption.
• Workers who were already living below the international poverty line (measured at 5.5 USD PPP) in the pre-pandemic period were pushed into deeper poverty during the crisis.
• 78% of the workers were barely surviving below the international poverty line during the peak months of May, June, and July.
Section 1: Introduction
Indonesia was one of the Southeast Asian countries worst affected by the Covid-19 pandemic in 2020, reporting high rates of infection and related deaths. As a response, the government implemented partial and regional lockdowns through the policy of “Large Scale Social Restrictions” (locally referred to as Pembatasan Sosial Berskala Besar or “PSBB”). According to the government, this was in contrast to a total lockdown, which would hurt economic activity and create instability in the economy. However, the implementation of the PSBB in several provinces, regencies and cities had a negative impact on Indonesia’s garment industry and its workforce, as factories were not allowed to operate without permits and
workers faced barriers in reporting to work.
In addition to this, disruptions in the supply of raw materials from China further worsened the situation, as the industry depends on imports of anywhere between 20-50% of its inputs from China.1 The contraction of demand in foreign consumer markets – US, Middle East, EU, and China – as they faced Covid-19 lockdowns, further worsened the crisis. Cancellations of orders, reduction in new orders, delayed payments and demands for discounts by fashion brands had adverse effects on Indonesia’s garment industry as exports accounts for 70% of garment manufacturing in the country.2

65
Section 2: The Methodology In Brief
1. Sampling AFWA conducted a survey of 390 workers across 28 garment and footwear factories in Indonesia, located across three provinces – Jakarta, West Java and Banten. The average size of selected factories is given in Figure 5.1, and the details of workers surveyed are provided below*.
* The explanation for why regions are classified based on minimum wages is given below
Indonesia’s export-oriented textile and garment industry has been growing consistently over several years and contributes 1.25% of the GDP, with the industry providing employment to over 3.7 million workers, majority of whom are women.3 According to Indonesia’s Ministry of Industry, the pandemic’s effect on the garment workforce resulted in 30% of garment workers being laid off by July 2020. The Ministry of Industry reported that, in 2020, the garment sector terminated 13% or 351,388 workers.4
Better Work Indonesia found that, among its participating factories, 70% had closed down only for a month, with the largest share closing down for less than 14 days.5 This was attributed to the government’s partial lockdown measures that allowed factories to remain operational even during the peak of the pandemic. However, a survey conducted by Decent Work Check, with over 3500 garment factories revealed that 90% experienced a negative impact on orders due to a reduction in overall demand, with only 25% factories reporting that they had paid workers in full.6
Garment workers in Indonesia were hit by unpaid layoffs and terminations, leading to a fall in consumption and increased indebtedness of workers and their household, pushing them into deeper poverty.
Figure 5.1: Classification of selected factories by size of workforce
Source: Primary data, n = 390
0
10
20
30
40
50
High Minimum WageLow Minimum Wage
>45003500-4500
2500-34991500-2499
500-1499<500
Number of workers per factory
Per
cent
age
of
fact
ori
es
41%
0% 0%
29%
11% 12%
33%
22%
6%
11% 12%
22%

66
Number of Factories
28
Education
Age
Source: Primary data, n = 390
Completed Elementary School
Completed Junior high school
Completed Senior high school
Diploma/Certificate
Bachelor’s Degree or Higher
Details of Workers Surveyed
67
2. Limitations Of Sampling96% of the workers surveyed were union members as the surveys were conducted by trade union representatives.
Trade union members generally fare better than non-unionised workers. The report captures the severity of the crisis by analysing its impact on workers with relatively secure employment and better conditions. The gaps in data collection have been partially bridged through qualitative and anecdotal information on the conditions facing more vulnerable workers.
Data collection focused largely on workers who were working in factories that were operating at partial or full capacity during the worker surveys, leading to an under-representation of terminated workers.
Workers who lost their jobs were often untraceable. To bridge this gap, targeted interviews or focus group discussions were conducted with workers who approached the unions with cases of illegal terminations or loss of jobs because of factory closures without payment of legally mandated compensation.
Women workers are slightly under-represented in the sample due to challenges in accessing women workers inside the factory premises during work hours.
To overcome this limitation, in-depth case studies of gender-based issues facing women workers have been collected separately.
3. Classification Of Time PeriodsPartial or regional lockdowns were imposed since April 2020, in different provinces, regencies/municipalities and cities, based on the rates of infection in those
regions. The country experienced frequent fluctuations in garment production and trade throughout 2020, resulting in varied impacts on employment and wages of workers over the course of the year. It was not possible to classify the impact of lockdown restrictions or trade on garment production and workers’ employment and wages into specific time periods in 2020. Therefore, the time period for data collection has been classified into two broad categories: (a) pre-recession period from January to February 2020; and (b) pandemic-induced recession period from March to December 2020. Data has been collected for each month in the pandemic-induced recession period.
4. Classification Of Regions Based On Minimum WagesIndonesia has a wide range of legally mandated minimum wages, varying extensively across districts within the same provinces, even though there is no significant variation in living costs in these regions. Provincial minimum wages are set at a very low level, requiring cities and regencies within the province to set minimum wages higher than the provincial minimum wage. Older industrial regions, characterised by stronger unionisation and a long history of labour struggles, have been able to achieve significantly higher minimum wages. Newer industrial regions have lower minimum wages and are marked by an absence of trade unions.
This has resulted in relocation of factories from high minimum wage regions like West Java with stronger unionisation to lower minimum wage regions with low unionisation to reduce labour costs by 25-50%. The spatial disparities in Indonesia due to multiple wage rates and mobility of capital resulted in differential impacts of Covid-19 on workers and their households.

68
Therefore, the 390 workers surveyed across 28 factories in 3 provinces have been classified into two regions – Low Minimum Wage (LMW) and High Minimum Wage (HMW) - based on the prevailing minimum wages in the region where their factories are located (See Table 5.1). The findings of this report have been disaggregated by two minimum wage regions to capture the impact of Covid-19 on garment workers and their households.
Table 5.1: Classification of regions based on minimum wage
levels
Regions Number of Factories
Minimum Wages (USD)
Low Minimum Wage (Less than 250 USD)
9 181
Cianjur 1 172
Majalengka 2 138
Subang 4 204
Sukabumi 2 208
High Minimum Wage (Above 250 USD)
19 286
Bogor 5 287
Cakung 1 290
Jakarta 4 290
Kabupaten Bogor
3 281
Purwakarta 1 278
Serang 2 287
Tangerang 2 286
Kota Bandung
1 250
SECTION 3: EXAMINING THE IMPACT OF COVID-19 CRISIS IN GARMENT EXPORTS
1. How Did Covid-19 Affect Indonesian Garment Exports?
Figure 5.2: Trend in apparel exports from Indonesia - 2019 vs.
2020
200
300
400
500
600
700
800
900
20202019
December
November
October
September
AugustJuly
JuneMay
AprilMarch
February
Januray
Source: Indonesia Statistics, 2021
Tota
l val
ue o
f ap
par
el e
xpo
rts
(Mill
ion
US
D)
• Garment exports from
Indonesia fell by 15% in
2020, as compared to 2019,
with the worst decline
experienced between
March and May. The
overall export value
dropped from 8,237 million
USD in 2019 to 6.988
million USD in 2020.

69
Indonesia’s textile and garment exports had recorded rapid growth over the past three years, after hitting a low point in 2016. The Indonesian Textile Association (API) reported that it had anticipated a Compounded Annual Growth Rate (CAGR) of 5% in 2020 in the textile and garment industry, prior to the onset of Covid-19, with the government aiming to place Indonesia among the top five global exporters of textile and garment by 2030 through the Industry 4.0 Masterplan.7
However, the pandemic resulted in a severe setback for Indonesia’s garment exports. The worst dip in exports corresponds with the months that experienced the initial brunt of lockdown restrictions in Indonesia, along with disruptions in the supply of raw materials from China, and reduced demand from consumer countries due to the first wave of Covid-19. It experienced a steep decline once again in October and November 2020, when the second wave of pandemic hit consumer countries. While exports recovered over the course of the year after June 2020, they did not recover to 2019 levels, due to an overall contraction in demand and reduction in new orders from global apparel brands.
In addition to this, in February 2020, Indonesia was removed from the World Trade Organization’s list of developing countries, which had access to differential treatment. As a result, Indonesia’s garment exports would be subject to higher import taxes in the US, its main market, leading to an overall decrease of 1.56% in garment exports.8
2. What Did The Indonesian Government Do For Garment Workers During The Covid-19 Crisis?Indonesia’s Ministry of Finance allocated a National Economic Recovery budget of
744.28 trillion IDR budget by November 2020, for handling the Covid-19 outbreak by supporting the healthcare sector, expanding social protection, providing tax incentives and credit for businesses, stimulus for Small and Medium Enterprises (SMEs), and stimulus for SOEs and corporations. Non-fiscal measures included the relaxation of import restrictions and expedited imports of raw materials, and the postponement of credit and leasing payments.9
A number of social policies including food or cash transfers, wage subsidy, subsidy on payment of electricity, data packages and phone credit, employment training for terminated workers, as well as credit relief for informal workers were announced. Food or cash relief as food packages or cash transfers worth 600,000 IDR were provided for three months from April to June and extended to December but the value was reduced to 300,000 IDR. Wage subsidy for workers with salary below 5 million IDR was announced in September 2020, with an incentive of 600,000 IDR for four months.10
Though this constituted a major form of support for garment workers, they were inadequate to mitigate the impact of the crisis. Moreover, despite massive protests by unions and workers, the government passed the Omnibus Law on Job Creation that has been criticised for diluting workers’ rights by facilitating contractualisation of labour and increasing work hours.11
3. How Did Indonesian Suppliers React To The Covid-19 Crisis?Indonesian suppliers passed on the costs of contraction in business to workers through layoffs and terminations of contract or temporary workers. Trade unions report that the “Gak Kerja Gak Ada Upah” or “No Work No Pay” policy became a popular measure

70
employed by suppliers. Through this policy, workers were laid off without pay for several days per month based on the decline in production in the factory.
This is despite several provisions under Indonesian law that states that employers cannot abdicate their responsibility for paying wages to laid-off workers, unless decided through negotiations with unions and workers (see Appendix). Suppliers illegally imposed the “No Work No Pay” norm to keep their margins stable, even if their absolute profits declined because of reduced demand.
Section 4: Hyper-Exploitation Of Labour Through Wage Theft
1. Wage Theft EstimatesWage theft was the pre-dominant feature of the Covid-19 crisis for garment workers in Indonesia, with our survey estimates indicating that 81,633 garment workers across 28 factories in Indonesia were denied 20.02 million USD as wages due to order cancellations, non-payment and other
Extent of Wage Theft
• Workers reported an
overall wage theft of 21% in
2020, with a sharp decline
in wages by 37% during the
peak month of June.
• Wages never recovered to
the pre-pandemic levels in
2020 as workers continued
to experience a wage theft
of around 17% even in
December.
• Workers experienced a
bonus theft of around 45%
in 2020.
irresponsible practices by brands during the pandemic. Even though wage theft peaked from May to July 2020, workers consistently experienced wage theft throughout the year, and into 2021.
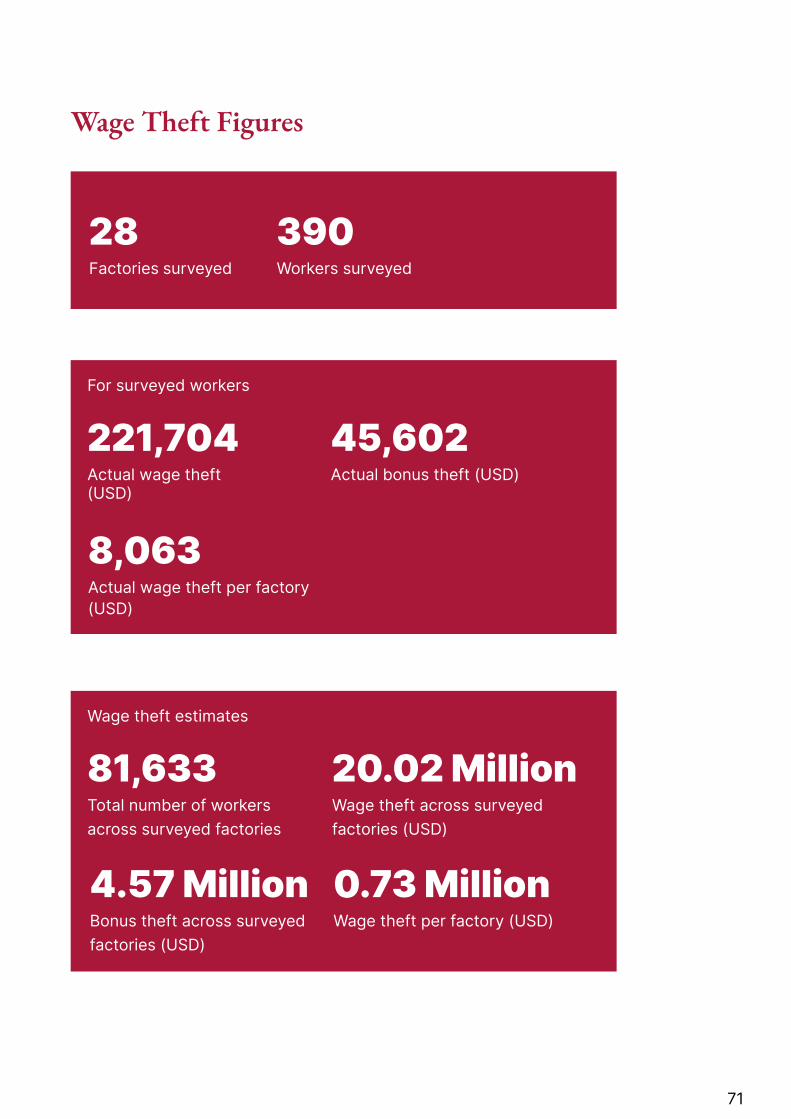
71
28Factories surveyed
221,704Actual wage theft (USD)
81,633Total number of workers across surveyed factories
45,602Actual bonus theft (USD)
8,063Actual wage theft per factory (USD)
20.02 MillionWage theft across surveyed factories (USD)
4.57 MillionBonus theft across surveyed factories (USD)
0.73 MillionWage theft per factory (USD)
390Workers surveyed
Wage Theft Figures
For surveyed workers
Wage theft estimates

72
Figure 5.3: Wage theft estimates, 2020
Figure 5.2: Wage theft estimates, 2020
0.0
0.5
1.0
1.5
2.0
2.5
3.0
3.5
4.0
December
November
October
SeptemberAugust
JulyJune
MayApril
March
Source : Primary Data n = 390
Mill
ion
US
D
2. Pre-Existing Inequalities As A Fertile Ground For Covid-19 Wage Theft
“
”
“I voluntarily resigned from my job in November, 2020, as I lost wages of almost
12 million IDR (837 USD), after the No Work No Pay policy started in my factory
in June 2020. Once it started, the pay could not support the needs of my family,
especially as food and education costs increased. Now I work as a tailor in a micro
enterprise 3 days a week, 9 hours a day while also working as a domestic worker in
the weekends.”
- Darlia, a 35-year-old garment worker, who worked at an H&M supplier factory
Wages and working conditions are shaped by pre-existing inequalities in the labour market in the form of gender, age, contractual status,
and regional specificities. During the pre-pandemic period, brands took advantage of these disparities to systematically underpay vulnerable segments of the workforce and flexibilise employment relations.
Spatial Wage Disparities
Both LMW and HMW workers were badly affected by the pandemic-induced recession. 77% of the workers in LMW regions reported that they experienced wage theft in 2020, while 87% in HMW regions reported the same.
Figure 5.4: Trend in monthly wages across minimum wage
regions, 2020
Figure 5.3: Trend in monthly wages acrossminimum wage regions, 2020
100
150
200
250
300
High MinimumWage Region
Low MinimumWage Region
Decem
ber
Novem
ber
Octob
er
Sept
embe
r
Augus
t
July
June
May
April
Mar
ch
Janu
ary-
Febr
uary
Source : Primary Data n = 390
US
D
• Both LMW and HMW regions experienced a significant wage dip of 37% in the worst affected month of June 2020. In LMW regions, wages fell from 196 USD to 123 USD, while in HMW regions, it fell from 282 USD to 178 USD.
• In both regions, wages did not recover by the end of the year, with LMW reporting 16% and HMW reporting 17% lower wages in December 2020, as compared to the pre-recession period.
However, workers in LMW regions, reporting 30% lower wages than workers in HMW

73
regions prior to the recession, were severely hit by wage theft as their wages dipped to extremely low levels.
Gender Pay Gap
A gender pay gap was reported across LMW regions, suggesting that many women workers earned less than the minimum wages in these regions during the pre-recession period.
In LMW regions, women reported earning an average monthly wage of 139 USD, 25% lower than male workers who received an average of 185 USD per month in 2020.
The gender pay gap worsened in both regions during the pandemic due to wage theft:
• In LMW regions, average monthly wages for women dipped sharply by 46% from 179 USD in the pre-recession period to as low as 97 USD in June 2020. By the
High Minimum Wage RegionLow Minimum Wage Region
50
100
150
200
250
300MaleFemale
MaleFemale
Dec
emb
er
Nov
emb
er
Oct
ob
er
Sep
tem
ber
Aug
ust
July
June
May
Ap
ril
Mar
ch
Janu
ary-
Feb
ruar
y
Dec
emb
er
Nov
emb
er
Oct
ob
er
Sep
tem
ber
Aug
ust
July
June
May
Ap
ril
Mar
ch
Janu
ary-
Feb
ruar
y
Mo
nthl
y W
ages
in U
SD
Source : Primary Data N=390
Figure 5.5: Trend in monthly wages by gender, 2020
Figure 5.5: Monthly wages by gender across minimum wage
regions, 2020
0
50
100
150
200
250
MaleFemale
High MinimumWage Region
Low MinimumWage Region
Source : Primary Data n = 390
Mo
nth
ly w
ages
in U
SD
139
185
221 223
Figure 5.6: Trend in monthly wages by gender, 2020
end of the year, their wages remained low at 136 USD, 22% less than pre-pandemic levels. Male workers’ wages dipped by 39%, from 217 USD in the pre-recession to 131 USD in the June 2020. By the end of the year, their wages recovered to 200 USD, close to their pre-recession wages.

74
• In HMW regions, too, women workers experienced more significant wage theft than male workers, with their average monthly wages falling by 43%, from 267 USD in pre-recession period, to 151 USD by June 2020. By the end of the year, their wages recovered to near pre-pandemic levels. In comparison, male workers only experienced a 32% reduction in wages from 287 USD to 194 USD by May 2020. By the end of the year, their wages were 16% lower than the pre-recession period, at 247 USD.
Extreme Exploitation Based On Employment Contract
In Indonesia, employment contracts can be entered into for a fixed or unspecified term. Fixed Term Contract (FTC) workers are contract workers, while Unspecified Term Contract (UTC) workers are permanent or regular workers. FTCs are given for a fixed time period or until the completion of a specific job. Such contracts can be renewed for a maximum period of two years*. After the completion of two years, FTC workers are converted into UTC workers unless their contracts are terminated. UTC contracts do not specify a time period for employment, and the employment continues until they are terminated. FTC contracts allow flexible work hours based on daily or monthly wage rates, and have less secure employment, as well as benefits associated with employment such as termination or seniority benefits, as compared to UTC workers.
FTC workers fared worse than UTC workers in both LMW and HMW regions:
• In LMW regions, FTC workers received an average monthly wage of 161 USD in 2020, which is 12% lower than UTC workers, who received 183 USD.
• In HMW regions, FTC workers similarly
* Under the new Omnibus Law passed in October, 2020, FTCs can be renewed indefinitely
Figure 5.7: Monthly wages by contract type across minimum
wage regions, 2020
Source : Primary Data n = 390
0
50
100
150
200
250
UTCFTC
High Minimum Wage RegionLow Minimum Wage Region
Figure 5.6: Monthly wages by contrac type across minimum wage regions, 2020
Mo
nthl
y w
ages
in U
SD
161
183
210
235
reported 11% lower wages at 210 USD, as compared to 235 USD earned by UTC workers.
The pandemic-induced recession increased the disparity between FTC and UTC workers. In the pre-recession period, FTC workers’ wages were close to or higher than UTC workers’ wages as they worked a high number of overtime hours to bring their wages to survival levels.
• In LMW regions, the wages of UTC workers recovered to pre-recession wages by June 2020, and remained close to those levels throughout the year. On the other hand, FTC workers reported a significant wage theft of 40% in June 2020. By the end of the year, their wages remained 10% lower than the pre-recession levels at 169 USD.
• In HMW regions, the wages of FTC workers declined steeply by 57% from 284 USD in the pre-recession period to 121 USD in June 2020. In comparison, the wages of UTC workers declined only by 30% from 270 USD to 188 USD in the same period. UTC workers’ wages recovered to almost pre-recession levels by the end of the year, while FTC workers’ wages remained 18% lower than pre-recession levels.

75
High Minimum Wage RegionLow Minimum Wage Region
100
150
200
250
300UTCFTC
UTCFTC
Dec
emb
er
Nov
emb
er
Oct
ob
er
Sep
tem
ber
Aug
ust
July
June
May
Ap
ril
Mar
ch
Janu
ary-
Feb
ruar
y
Dec
emb
er
Nov
emb
er
Oct
ob
er
Sep
tem
ber
Aug
ust
July
June
May
Ap
ril
Mar
ch
Janu
ary-
Feb
ruar
y
Mo
nthl
y W
ages
in U
SD
Source : Primary Data n =390
Figure 5.7: Trend in monthly wages by contract type across minimum wage regions, 2020Figure 5.8: Trend in monthly wages by contract type across minimum wage regions, 2020
3. Forms Of Covid-19 Wage TheftWage theft is endemic in global garment supply chains due to power asymmetry between brands, suppliers, and workers. Brands force suppliers to drive down production costs and suppliers in turn pass this down to workers through various forms of wage theft. The Covid-19 pandemic witnessed an escalation of wage theft in Indonesia, such as: (A) layoff and termination without legal dues and benefits; (B) unpaid and underpaid overtime; and (C) bonus theft.
A. Layoffs And Terminations
• 72% of the workers suffered employment shocks either in the form of layoffs (64%) or terminations (8%).
• On an average, workers lost 20% of their workdays in 2020.
• Workers in LMW regions fared the worst, with 74% of the workers reporting that they were laid off at some point during 2020. In HMW regions, 59% reported being laid off during the same period.
• In LMW regions, only 23% of the workers reported not facing any change in their employment status, while 30% in HMW regions reported the same.
• 11% of the workers in HMW regions reported terminations, while only 3% in LMW regions reported the same.

76
Figure 5.9: Composition of employment loss across minimum
wage regions, 2020
Layoffs Without Pay Through The “No Work No Pay” Policy
Figure 5.8: Composition of employmentloss across minimum wage regions, 2020
0
10
20
30
40
50
60
70
80
High Minimum Wage RegionLow Minimum Wage Region
TerminatedLaid offDid not face LayoffTermination
23%
30%
74%
59%
3%
11%
Source : Primary Data n = 390
Per
cent
age
of
Wo
rker
s
“
”
“Before May 2020, I worked as a tailor 26 days a month, however after the No Work No Pay policy started in my factory, I work only 14-18 days a month. Moreover, some
days I am asked to work as a helper and some days as a tailor. My wages have now fallen by more than 25 percent a month.”
- Afifa, a 34-year-old daily wage garment worker who works at an H&M supplier factory
Layoffs without payment because of the “No Work No Pay” policy was the most common response of suppliers to offset losses to business due to Covid-19 in 2020.
Workers in LMW and HMW regions experienced a high number of layoffs, peaking from May to July 2020.
• In LMW regions, 63-71% of the workers experienced layoff in the months of June and July 2020, while in HMW regions, 62-67% experienced layoff in the months of May and June 2020.
• Workers in both regions reported high loss of work days through layoff. HMW regions reported 40-41% loss in work days in May and June 2020, while workers in LMW regions reported 22-36% loss in work days in June and July 2020.
• While the loss of work days remained high for LMW regions during June to September 2020, it recovered to almost pre-recession levels from October onwards. However, in HMW regions, while the loss of work days reduced from July 2020 onwards, it remained high, with 12% loss in work days by the end of the year.
• While only 2% of the workers were laid off in LMW regions by the end of the year, a higher number of workers continued to be laid off in HMW regions, with 24% reporting layoff in December 2020.
Workers report that suppliers resort to illegal means to implement the “No Work No Pay” policy. In the workers’ payslips, the days of layoff in the month are reported as absence from work, even though workers were not given work and asked not to report to the factory. Documenting layoff as absence from work can be considered “indiscipline” and can later be used to terminate workers for misbehaviour.

77
0
10
20
30
40
50
60
70
80
High Minimum Wage RegionLow Minimum Wage Region
December
NovemberOctober
SeptemberAugust
JulyJune
MayApril
March
January-
February
Source : Primary Data n = 390
Per
cent
age
of
Wo
rker
sFigure 5.9: Trend in percentage of workersfacing layoff across minimum wage regions, 2020
Figure 5.10: Trend in percentage of workers facing layoff across
minimum wage regions, 2020
Figure 5.11: Percentage loss in work days, 2020
Figure 5.10: Percentage loss in work days, 2020
0
10
20
30
40
50
High Minimum Wage RegionLow Minimum Wage Region
December
November
October
September
AugustJuly
JuneMay
AprilMarch
Per
cent
age
of
Wo
rker
s
Source : Primary Data n = 390
Non-Payment Of Legally Mandated Termination Benefits
“
”
“I was terminated from the factory in June 2020, just three months after I had
joined. The factory management said they did not have new orders from brands and they terminated all the new hires
in my department. I did not receive any termination benefits, and I could not
find another job. My family was in deep financial stress. We reduced meat intake
in our food and cut down usage of gas and electricity. We did not want to borrow
money, as we had already taken debt to buy a motor vehicle in January.”
- Tuti, a 28-year-old garment worker, who worked at an Adidas supplier factory
8% of the workers surveyed, across regions, reported that they were terminated:
Terminations were significantly higher among workers in HMW regions, where 11% of the workers reported terminations, while only 3% in LMW regions reported terminations.
81% of the workers reported that they did not receive legally mandated termination benefits, with both FTC and UTC workers
reporting that they did not receive full termination benefits. Often, FTC workers are not converted to UTC workers even though they have worked at the same factory for several years. This allows employers to terminate them with ease and deny them their termination benefits.
76% of the terminated workers reported that they were not able to find any other work after being terminated, remaining unemployed and without any income throughout the course of the year. Some workers, like Sari for instance, were rehired in the same factory on far more insecure contracts. Others, like Farah, were forced to accept extremely precarious daily wage jobs with much lower wages.

78
“
”
“The factory laid off all workers in July and August and paid us only half our wages. In September, when they called us back,
they forced permanent employees like me to resign and rejoin as contract workers,
with 3-month contracts. We lost access to health insurance, social security schemes and faced wage cuts. From June, I have taken debt every month just to meet the
medical expenses of my sick mother and the educational expenses of my children.”
- Sari, a 35-year-old garment worker who works at a The Children’s Place supplier
factory
“
”
“I was forced to resign from my job because I participated in a strike when my wages dipped so low that I could not meet any expenses. After a few months, I got a job
as a daily wage worker in another factory, where I earn a little bit more than my
previous job. I only get work 3 days a week, and my daily wages remain the same even when I’m forced to work several hours of
overtime.”
- Farah, a 37-year- old garment worker who worked at an H&M supplier factory
B. Unpaid And Underpaid Overtime
Unpaid or underpaid overtime work is one of the main practices through which wage theft is operationalised. According to Indonesian law, overtime is paid according to differing rates, ranging from 150-400% of hourly wages, based on the day of the week and the number of hours of overtime (see Appendix).
While the number of hours of overtime reduced due to the contraction of production during the pandemic, the large majority of workers who performed overtime were not paid legally mandated overtime rates.
In LMW regions, workers were less likely to receive legally mandated overtime wages, with 89% of the workers reporting the same. In HMW regions, 67% reported that they did not receive legally mandated overtime wages. Suppliers engaged in deceptive practices to deny overtime payment, including under-reporting hours of work on workers’ payslips, as in the case of Fitri.
Figure 5.12: Percentage of workers receiving legally mandated
overtime pay, 2020
0
20
40
60
80
100
Did not receive legal OT payReceived legal OT pay
High MinimumWage Region
Low MinimumWage Region
Source: Primary data, n = 114 (workers who worked overtime)
Per
cent
age
of
Wo
rker
s
11%
33%
67%
89%
Figure 5.11: Percentage of workers receiving legally mandated overtime pay, 2020
While workers faced increasing layoffs during the pandemic-induced recession period, they were also forced to work longer hours on the days they received work. This is because different workers were laid off on different days, significantly reducing the number of workers per production line on any given day. The workers who received work had to work longer hours and meet more production targets, without legal overtime wages.
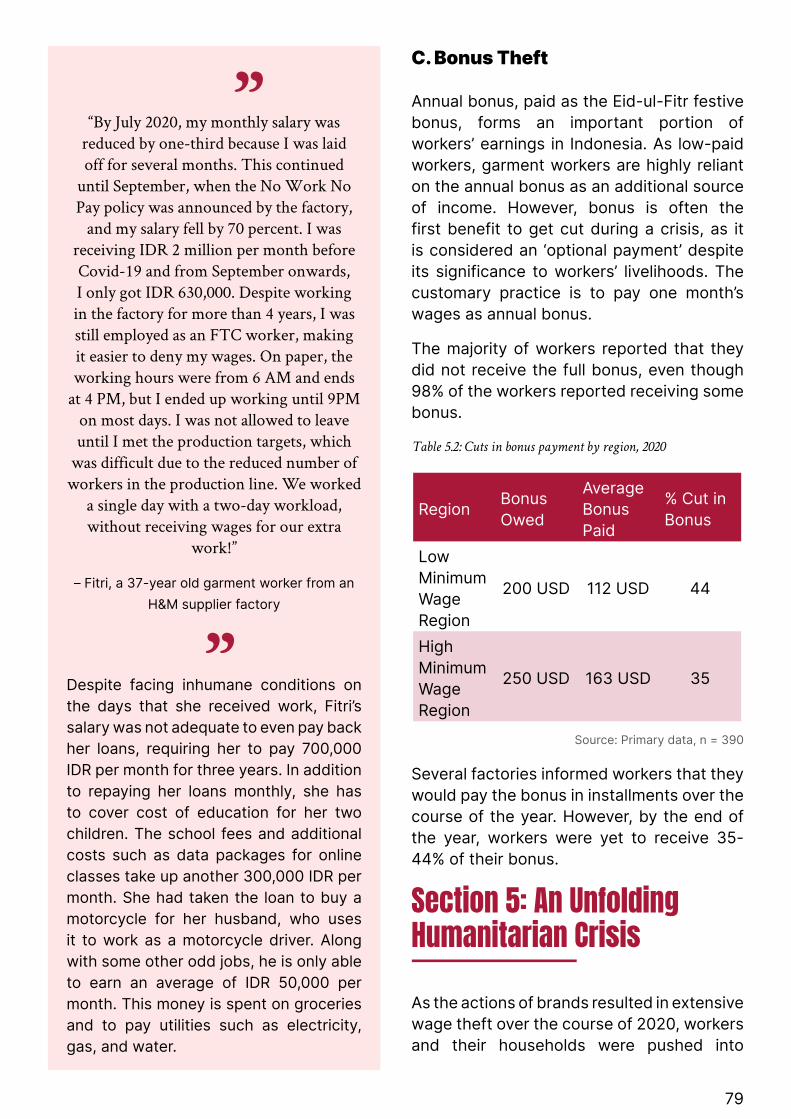
79
“
”
“By July 2020, my monthly salary was reduced by one-third because I was laid off for several months. This continued
until September, when the No Work No Pay policy was announced by the factory,
and my salary fell by 70 percent. I was receiving IDR 2 million per month before Covid-19 and from September onwards, I only got IDR 630,000. Despite working in the factory for more than 4 years, I was still employed as an FTC worker, making it easier to deny my wages. On paper, the working hours were from 6 AM and ends
at 4 PM, but I ended up working until 9PM on most days. I was not allowed to leave until I met the production targets, which
was difficult due to the reduced number of workers in the production line. We worked
a single day with a two-day workload, without receiving wages for our extra
work!”
– Fitri, a 37-year old garment worker from an H&M supplier factory
Despite facing inhumane conditions on the days that she received work, Fitri’s salary was not adequate to even pay back her loans, requiring her to pay 700,000 IDR per month for three years. In addition to repaying her loans monthly, she has to cover cost of education for her two children. The school fees and additional costs such as data packages for online classes take up another 300,000 IDR per month. She had taken the loan to buy a motorcycle for her husband, who uses it to work as a motorcycle driver. Along with some other odd jobs, he is only able to earn an average of IDR 50,000 per month. This money is spent on groceries and to pay utilities such as electricity, gas, and water.
C. Bonus Theft
Annual bonus, paid as the Eid-ul-Fitr festive bonus, forms an important portion of workers’ earnings in Indonesia. As low-paid workers, garment workers are highly reliant on the annual bonus as an additional source of income. However, bonus is often the first benefit to get cut during a crisis, as it is considered an ‘optional payment’ despite its significance to workers’ livelihoods. The customary practice is to pay one month’s wages as annual bonus.
The majority of workers reported that they did not receive the full bonus, even though 98% of the workers reported receiving some bonus.
Table 5.2: Cuts in bonus payment by region, 2020
Region Bonus Owed
Average Bonus Paid
% Cut in Bonus
Low Minimum Wage Region
200 USD 112 USD 44
High Minimum Wage Region
250 USD 163 USD 35
Source: Primary data, n = 390
Several factories informed workers that they would pay the bonus in installments over the course of the year. However, by the end of the year, workers were yet to receive 35-44% of their bonus.
Section 5: An Unfolding Humanitarian CrisisAs the actions of brands resulted in extensive wage theft over the course of 2020, workers and their households were pushed into

80
deeper job insecurity and precarity. Workers surveyed in Indonesia had worked an average of nine years in the same factory but earned low wages, leaving them with little savings to tide over the crisis. As a result, they were forced to resort to: (a) reduction in consumption, (b) increase in indebtedness, and (c) liquidating assets.
• As their wages dipped,
workers in Indonesia
reduced their consumption
by 10%, which did not
recover by the end of the
year.
1. A Push To Deeper PovertyOur survey indicates that:
• Monthly wages for garment workers remained just below the international poverty line even before the pandemic. After April, there was a sharp decline in wages and household income of Indonesian garment workers due to the Covid-19 crisis, pushing them into severe poverty (Figure 5.13). This is despite a conservative reference point, as the international poverty line of the World Bank is not based on living wage calculations and also ignores non-income dimensions of poverty.
• In 2020, even household income, which includes total income of all earning members of the household, falls short when AFWA’s living wage figure is considered (Figure 5.14). This shows the extent of precarity faced by garment workers and their families.
• Despite some evidence of middle-aged workers earning slightly more
than younger workers, wages earned by the majority of younger workers are no different from that of middle-aged workers, indicating that wages have remained stagnant regardless of work experience (Figure 5.15).
Figure 5.13: Trend in monthly wages with reference to
international poverty line (World Bank, 2020)
Figure 5.14: Trend in monthly household income with reference
to AFWA living wage, 2020
150
200
250
300
Poverty Line at 5.5 USD PPPWages
December
November
October
September
AugustJuly
JuneMay
AprilMarch
January-February
US
D
Figure 5.12: Trend in monthly wages with reference to international poverty line
Source : Primary Data n = 390
Figure 5.13: Trend in monthly household income with ref-erence to AFWA living wage, 2020
200
300
400
500
600
AFWA Living WageHousehold Income
December
November
October
September
AugustJuly
JuneMay
AprilMarch
January-February
US
D
Source : Primary Data n = 390

81
Figure 5.15: Age-wise distribution of wages
Age
10 20 30 40 50 60100
150
200
250
300
350
Mo
nth
ly W
ages
in U
SD
Fig 5.14: Age-wise distribution of wages, 2020
Source : Primary Data n = 390
2. Falling Consumption: An Inability To Meet Basic Needs
“
”
“My company refused to provide me paid leave after I was infected with Covid-19.
I had to rent a house to quarantine myself and had to bear the additional expenses of medicines, tests, and food by myself. I lost
wages for a month and had to take debt amounting to 4,300,000 IDR (301 USD)
just to meet basic expenses like food, rent and education that month.”
- Shireen, 31-year-old garment worker who works for an Inditex and Macy’s supplier
factory
In July, workers cut short their consumption on food by 8%, on accommodation by 5%, on education by 17%, on health by 10%, and on socio-cultural heads by 25%. Indonesia reported a high general inflation of 9% and food inflation of 11%. Thus, the real consumption is much lower than the nominal values reported.
Average monthly household consumption declined significantly across regions:
• In HMW regions, consumption fell by 3% from 247 USD in January-February 2020 to 239 USD in June 2020 and returned nearly to pre-recession levels at the end of the year.
• In LMW regions, consumption was extremely low at 227 USD even during the pre-recession period. Workers were forced to cut down consumption by 8%, to 209 USD in June 2020. Consumption did not recover and remained at the same level by the end of the year.
• Total consumption reduced
by 10% over the course of
the year, falling from an
average of 239 USD prior to
the pandemic to an average
of 213 USD in July 2020.
By the end of the year,
consumption increased to
an average of 231 USD but
remained below the pre-
pandemic levels.
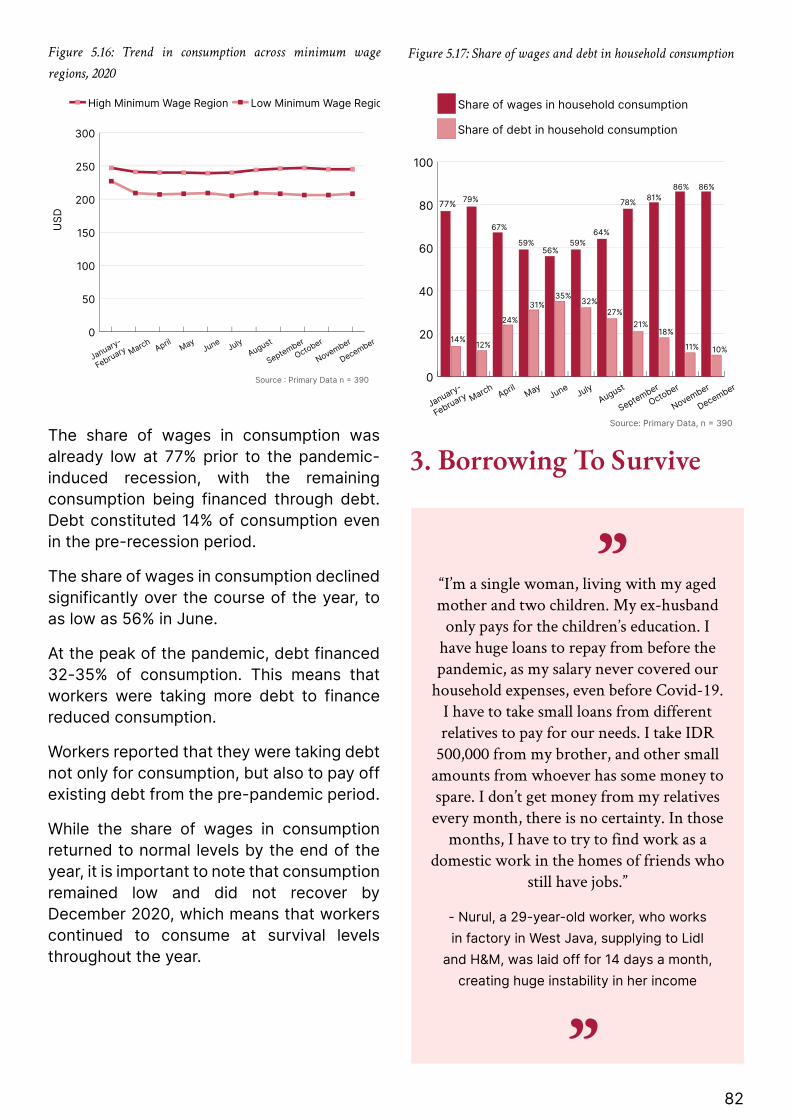
82
Figure 5.16: Trend in consumption across minimum wage
regions, 2020
Figure 5.15: Trend in consumption across minimum wage re-gions, 2020
0
50
100
150
200
250
300
Low Minimum Wage RegioHigh Minimum Wage Region
December
November
October
September
AugustJuly
JuneMay
AprilMarch
January-
February
US
D
Source : Primary Data n = 390
The share of wages in consumption was already low at 77% prior to the pandemic-induced recession, with the remaining consumption being financed through debt. Debt constituted 14% of consumption even in the pre-recession period.
The share of wages in consumption declined significantly over the course of the year, to as low as 56% in June.
At the peak of the pandemic, debt financed 32-35% of consumption. This means that workers were taking more debt to finance reduced consumption.
Workers reported that they were taking debt not only for consumption, but also to pay off existing debt from the pre-pandemic period.
While the share of wages in consumption returned to normal levels by the end of the year, it is important to note that consumption remained low and did not recover by December 2020, which means that workers continued to consume at survival levels throughout the year.
0
20
40
60
80
100
Share of debt in household consumption
Share of wages in household consumption
December
November
October
September
AugustJuly
JuneMay
AprilMarch
January-
February
Source: Primary Data, n = 390
77%
14%
79%
67%
59% 59%56%
64%
78%81%
86% 86%
12%
24%
31%35%
32%27%
21%18%
11% 10%
Figure 5.17: Share of wages and debt in household consumption
3. Borrowing To Survive
“
”
“I’m a single woman, living with my aged mother and two children. My ex-husband
only pays for the children’s education. I have huge loans to repay from before the pandemic, as my salary never covered our
household expenses, even before Covid-19. I have to take small loans from different relatives to pay for our needs. I take IDR
500,000 from my brother, and other small amounts from whoever has some money to spare. I don’t get money from my relatives every month, there is no certainty. In those
months, I have to try to find work as a domestic work in the homes of friends who
still have jobs.”
- Nurul, a 29-year-old worker, who works in factory in West Java, supplying to Lidl
and H&M, was laid off for 14 days a month, creating huge instability in her income

83
• 70% of the workers
reported that they incurred
debt during the pandemic
period to finance their
consumption.
• Workers like Nurul reported taking loans for meeting the most basic consumption of food, education, housing and healthcare. Of these, more than half (56%) of the workers reported that they took on more debt for meeting their food requirements.
• Around 31% of the workers depended on banks or microfinance institutions for loans, but workers reported that they were unable to borrow more from formal financial institutions as they were already in a state of indebtedness, even before the pandemic. Banks were therefore unwilling to lend more credit to garment workers.
• The largest number of workers (35%) depended on their personal networks, i.e., friends, relatives or co-workers. They took small amounts of money from multiple people to sustain their basic levels of consumption.
Figure 5.18: Reasons for incurring debt, 2020
Figure 5.19: Sources of debt, 2020
n
56%Food18%
Health
17%Rent
5%Education
3%Mobile/Internet
Source: Primary Data, n = 273 (number of workers who incurred debt)
Figure 5.17: Sources of debt, 2020
0
5
10
15
20
25
30
35
MoneylendersOthers
Co-workersBanks/
MicrofinanceNeighbour/
Friends/
Relatives
35%
32%
25%
6%
3%
Source: Primary Data n = 273 (number of workers who incurred debt)
Per
cent
age
of
wo
rker
s

84
Access To Covid-19 Related Relief Efforts95% of the workers reported that they were able to access some form of relief/support during the Covid-19 crisis.
• The government’s income and food support came as a major relief for garment workers. 92% of the workers reported they received monetary support and 36% received food support from the government.
• However, support from other sources were low. This also shows that employers largely abdicated their responsibility for the well-being of garment workers during the Covid-19 crisis. The lack of support from other sources made workers extremely dependent on government relief, which in itself was inadequate to meet their basic needs.
Figure 5.20: Percentage of workers who received Covid-19 support from various sources
Source : Primary Data n = 390
Figure 5.18: Percentage of workers who receivedCovid-19 support from various sources, 2020
0
20
40
60
80
100
Trade UnionNGO/CharityGovernmentFactory
Health CareProvisionsMonetory Support
Per
cent
age
of
Wo
rker
s
1% 1%0%
92%
4%
36%
7% 6% 8% 8%
0%1%

85
Section 6: 2021 - The Tragedy Repeats The Covid-19 crisis has worsened in 2021 and the government has imposed partial and regional lockdowns known as Restriction on Public Activities (locally referred to as Pemberlakuan Pembatasan Kegiatan Masyarakat or PPKM). Garment factories are allowed to operate, provided they obtain permits to do so. However, workers report that suppliers have flouted health and safety protocols, endangering the well-being of workers and their families.
In February 2021, the government announced that employers can pay workers below the minimum wage levels based on agreement with unions, provided the enterprise employs at least 200 workers and the percentage of labour cost is a minimum of 15% of the production cost.12 This is likely to give way to a further downward pressure on wages and worsen the spatial disparities in wages between different regions in Indonesia.
In a bid to attract foreign investment, the government has continued to flexibilise labour relations through promoting Fixed Term Contracts and increasing work hours as part of the rollout of the Omnibus Job Creation Law. Brands continue to take advantage of these policies and they have not yet stepped forward to address the impact of wage theft faced by garment workers in Indonesia. As a result, the most vulnerable workers continue to bear the disproportionate costs of market fluctuations and deregulation of labour laws amidst a raging pandemic.

86
References
1 Fibre2Fashion. (2020, May). Indonesian textiles industry likely to pull through global pandemic. Retrieved from https://www.fibre2fashion.com/industry-article/8679/indonesian-textiles-industrylikely-to-pull-through-global-pandemic?amp=true
2 Business and Human Rights Centre. (2020). Indonesia – Impacts of Covid-19 on Indonesia’s garment sector. . Retrieved from https://www.business-humanrights.org/en/from-us/covid-19-action-tracker/indonesia/
3 Indonesia Investments. (2021, May 11). Textile and Garment Industry of Indonesia; More than Just Clothes, but Challenges Persist. Retrieved from https://www.indonesia-investments.com/news/todays-headlines/textile-and-garment-industry-of-indonesia-more-than-just-clothes-but-challenges-persist/item9405
4 Jackson, J., Judd, J., & Viegelahn , C. (2020). The supply chain ripple effect: How COVID-19 is affecting garment workers and factories in Asia and the Pacific. International Labour Organization. Retrieved from https://www.ilo.org/wcmsp5/groups/public/---asia/---ro-bangkok/documents/briefingnote/wcms_758626.pdf
5 Ibid
6 Decent Work Check (2020). Corona Factory Survey Report – General Comparison. https://decentworkcheck.org/company-overviews/garment-factories-in-indonesia/garment-indonesia-data-visuals-covid-19-impact
7 Fibre2Fashion (2020). Indonesian textiles industry likely to pull through global pandemic https://www.fibre2fashion.com/industry-article/8679/indonesian-textiles-industrylikely-to-pull-through-global-pandemic
8 Ibid
9 KPMG (2020). Indonesia: Government and institution measures in response to COVID-19. Insights. https://home.kpmg/xx/en/home/insights/2020/04/indonesia-government-and-institution-measures-in-response-to-covid.html
10 Rahman, D. (2020, August 11). Government expands wage subsidy to include 3 million furloughed, reduced pay workers. Retrieved from https://www.thejakartapost.com/news/2020/08/11/government-expands-wage-subsidy-to-include-3-million-furloughed-reduced-pay-workers.html
11 Asia Floor Wage Alliance (2021). Garment Workers under Threat from Labour Deregulation in Asia – A Review of recent Labour and Employment Law changes in Cambodia, India, Indonesia and Sri Lanka. Retrieved from https://asia.floorwage.org/wp-content/uploads/2021/03/Labor-Deregulation-Asia-March-2021-Final-Draft-24-March.pdf
12 Fair Wear (2021, May 17). Covid-19 impact and responses: Indonesia. Fair Wear’s Covid-19 Dossier, Retrieved from: https://www.fairwear.org/covid-19-dossier/worker-engagement-and-monitoring/country-specific-guidance/covid19-indonesia/
87
INDIA
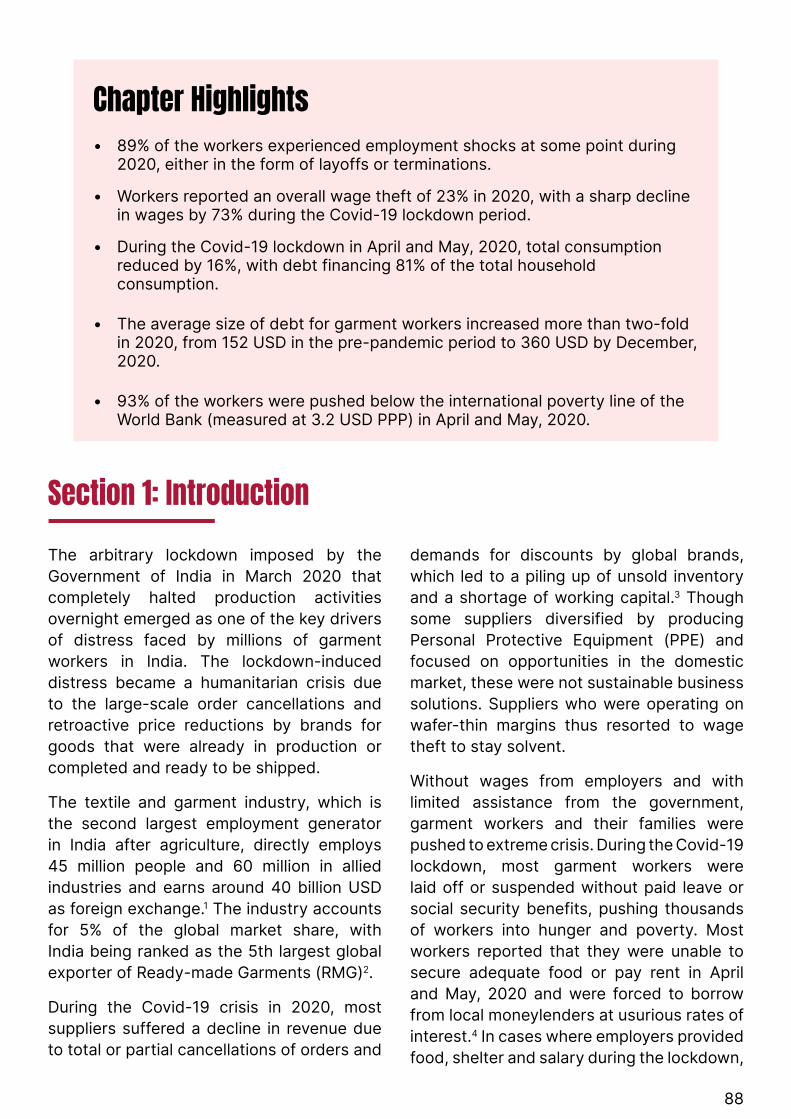
88
Chapter Highlights• 89% of the workers experienced employment shocks at some point during
2020, either in the form of layoffs or terminations.
• Workers reported an overall wage theft of 23% in 2020, with a sharp decline in wages by 73% during the Covid-19 lockdown period.
• During the Covid-19 lockdown in April and May, 2020, total consumption reduced by 16%, with debt financing 81% of the total household consumption.
• The average size of debt for garment workers increased more than two-fold in 2020, from 152 USD in the pre-pandemic period to 360 USD by December, 2020.
• 93% of the workers were pushed below the international poverty line of the World Bank (measured at 3.2 USD PPP) in April and May, 2020.
Section 1: IntroductionThe arbitrary lockdown imposed by the Government of India in March 2020 that completely halted production activities overnight emerged as one of the key drivers of distress faced by millions of garment workers in India. The lockdown-induced distress became a humanitarian crisis due to the large-scale order cancellations and retroactive price reductions by brands for goods that were already in production or completed and ready to be shipped.
The textile and garment industry, which is the second largest employment generator in India after agriculture, directly employs 45 million people and 60 million in allied industries and earns around 40 billion USD as foreign exchange.1 The industry accounts for 5% of the global market share, with India being ranked as the 5th largest global exporter of Ready-made Garments (RMG)2.
During the Covid-19 crisis in 2020, most suppliers suffered a decline in revenue due to total or partial cancellations of orders and
demands for discounts by global brands, which led to a piling up of unsold inventory and a shortage of working capital.3 Though some suppliers diversified by producing Personal Protective Equipment (PPE) and focused on opportunities in the domestic market, these were not sustainable business solutions. Suppliers who were operating on wafer-thin margins thus resorted to wage theft to stay solvent.
Without wages from employers and with limited assistance from the government, garment workers and their families were pushed to extreme crisis. During the Covid-19 lockdown, most garment workers were laid off or suspended without paid leave or social security benefits, pushing thousands of workers into hunger and poverty. Most workers reported that they were unable to secure adequate food or pay rent in April and May, 2020 and were forced to borrow from local moneylenders at usurious rates of interest.4 In cases where employers provided food, shelter and salary during the lockdown,

89
Section 2: The Methodology in Brief
1. SamplingAFWA conducted a survey of 433 workers from 51 garment factories and 4 processing units (yarn and fabric) in India, spread across four top garment producing states in India, namely Gujarat (Ahmedabad), Haryana (Gurgaon, Faridabad), Karnataka (Bangalore) and Tamil Nadu (Erode and Tirupur). The average size of the selected factories is given in Figure 6.1, and the details of workers surveyed are provided below.
Figure 6.1: Classification of the selected factories according to the
size of the workforce
Source: Primary data, n = 433
0
5
10
15
20
25
30
35
40
> 25001500-25001000-1500500-1000< 500
Per
cent
age
of
fact
ori
es
Average number of workers per factory
20%
38%
15%13% 14%
workers were forced to compensate for it with unpaid overtime in the post-lockdown period.5

90
Details Of Workers Surveyed
Number of Factories
55
Experience
Education
Nature of Employment
Social Category

91
2. Limitations Of Sampling• 42% of workers interviewed were
trade union members as the surveys were conducted by trade union representatives.
Trade union members are more likely to have relatively secure employment and fare better than non-unionised workers. This chapter provides a picture of the severity of the crisis by analysing its impact on workers with relatively secure employment and better conditions. The gaps in data collection have been bridged through qualitative and anecdotal information on the conditions facing more vulnerable workers who are not unionised and have insecure employment.
• There is an under-representation of workers who were terminated, especially among migrants.
Many migrants who were terminated returned to their native villages and towns after losing employment and could not be
Pre Covid-19
Covid-19 Lockdown
Partial Covid-19 Lockdown
Post Covid-19 Lockdown
January - February
March - May
June-October
November-December
• Slight increase in orders for garment export factories as some of the cancelled orders from China, due to the Covid-19 crisis, were shifted to India.
• Garment factories working at almost full capacity.
• Total shutdown of garment factories, except those producing medical and para-medical gear like Personal Protective Equipment (PPE) and masks.
• Reopening of garment factories.
• Slow recovery in garment production due to low consumer demand with lockdowns being reintroduced in Europe due to rising Covid-19 cases.
2020
tracked down by the field investigators. To bridge this gap, targeted interviews were conducted with migrant workers who approached the unions with cases of illegal terminations or loss of jobs as a result of factory closure without payment of legally mandated compensations.
• Migrant workers staying in employer provided housing in Tamil Nadu and Karnataka could not be surveyed due to difficulties in accessing them, as factory management refused to allow these workers to engage with outsiders.
3. Classification Of Time Periods, 2020Our survey has measured variables across four time periods, based on the implementation of Covid-19 lockdown restrictions in India. The graphs also show variables across these time periods.
Figure 6.2: Classification of time periods, 2020

92
Section 3: Covid-19 And The Export-Oriented Garment Industry In India
1. How Did Covid-19 Affect India’s Garment Exports?Indian garment exports have been declining over the last four years in terms of value of exports due to sluggish demand from the US and EU as well as rising competition from other garment exporting countries in Asia. This trend worsened in 2020 during the Covid-19 crisis as brands cancelled orders or demanded retroactive price reductions, for goods already in production or ready to be shipped.
Garment exports from India fell from 16.25 billion USD in 2019 to 12.26 billion USD in 2020, which is a reduction of around 24% (Figure 6.3). Most of this fall was experienced during the total lockdown phase with April reporting a decline in exports of almost 91%.
Exports from India had experienced a slight
increase in February, 2020, as suppliers did not suffer from a raw material shortage, and orders from certain brands shifted from China to India. However, this advantage was soon lost with the imposition of the lockdown which also coincided with order cancellations by brands.
Exports picked up post-lockdown till September 2020, then dropped again till November due to lower consumer demand in Europe, when lockdowns were reintroduced with rising Covid-19 cases. Exports did not reach pre-Covid levels even in December 2020 and declined once again in mid-2021 due to the second wave of Covid-19 in India.
2. What Did The Indian Government Do For Garment Workers?While the government eased liquidity for garment suppliers through tax incentives and by facilitating credit flow, there was no concerted intervention by the government to address the crisis of unpaid wages in the industry. The Government of India issued an advisory in March 2020 to all employers’ associations to not terminate their employees, particularly casual and contractual workers or cut wages of workers in view of the lockdown.6 However, it was not enforced as it was legally contested by employers who cited weak finances and limited monetary support from the government. Moreover, instead of safeguarding labour rights, the central government as well as several state governments also pushed through key labour reforms during the crisis,7 that further undermined workers’ basic rights and bargaining power to fight the Covid-19 induced wage theft in the garment industry.
Figure 6.3: Trend in RMG exports from India - 2019 vs. 2020Figure 6.1 : Trend in apparel exports from India - 2019 vs. 2020
0
500
1000
1500
2000
20202019
December
November
October
September
AugustJuly
JuneMay
April
March
February
January
Source : UN Comtrade
Tota
l Val
ue o
f A
pp
arel
Exp
ort
s (M
illio
n U
SD
)

93
3. How Did India’s Suppliers React To The Covid-19 Crisis?During the Covid-19 crisis, Indian suppliers suffered multiple issues like order cancellations by brands, weak demand in the domestic market (due to fall in disposable income and consumer confidence), reduction in operating surpluses and inadequate support from the government. India’s suppliers passed the cost of these issues onto workers by engaging in widespread layoffs and terminations, with most workers not receiving layoff compensation and termination benefits.
In some cases, suppliers extended relief to garment workers through cash transfers and in-kind support during the lockdown. However, once work resumed, they forced these workers to do unpaid overtime work as compensation for the relief provided.
Section 4: Hyper-Exploitation Of Labour Through Wage Theft
1. Wage Theft EstimatesWage theft was the predominant feature of the Covid-19 crisis for garment workers in India, with our survey estimates indicating that 79,600 garment workers across 55 factories in India were denied 29.67 million USD as wages due to order cancellations, non-payment for existing orders, and other irresponsible practices by brands during the pandemic. Wage theft peaked in April and May 2020 but workers consistently experienced wage theft throughout the year (Figure 6.4), and well into 2021 due to the second wave of Covid-19. The magnitude
of wage theft declined from June 2020 with increase in production due to relaxation of lockdown-related restrictions.
Figure 6.4: Wage theft estimates, 2020Figure 6.2 : Wage theft estimates, 2020
0
1
2
3
4
5
6
7
8
Wage Theft
December
November
October
September
AugustJuly
JuneMay
April
March
Source : Primary data, n = 433
Mill
ion
US
D
Extent of Wage Theft
• Workers reported an overall
wage theft of 23% in 2020, with
a sharp decline in wages by 73
% during the lockdown period.
• Wages never recovered to
the pre-pandemic levels in
2020 as workers continued
to experience wage theft of
around 5% even in November
and December, 2020.
• Of the 29.67 million dollars’
worth of wages that workers
lost, 5.3 million dollars was lost
in the form of festive bonuses,
which is an integral income
supplement to workers who
are paid poverty-level wages.

94
55Factories surveyed
140,336Actual wage theft (USD)
79,600Total number of workers across surveyed factories
3,655Actual wage theft per factory (USD)
29.67 MillionWage theft across surveyed factories (USD)
5.34 MillionBonus theft across surveyed factories (USD)
1.15 MillionAverage wage theft per factory (USD)
26,460Actual bonus theft (USD)
433Workers surveyed
Wage Theft Figures
For surveyed workers
Wage theft estimates

95
2. Pre-Existing Inequalities As A Fertile Ground For Covid-19 Wage TheftWages and working conditions are shaped by pre-existing inequalities in the labour market in the form of age, caste, gender and contractual status. During the pre-pandemic period, brands took advantage of these disparities to systematically underpay vulnerable segments of the workforce and to flexibilise employment relations.
Gender Pay Gap
Although wages of both men and women fell during the Covid-19 lockdown period, the monthly gender pay gap reversed when compared to the pre-pandemic period, with women earning more than men between March and May 2020 (Figure 6.5). This is because, during these months, more women workers were engaged in the production of Personal Protective Equipment (PPE). Men were mainly laid off or in places like Ahmedabad and Gurgaon, where suppliers employ a large number of single male migrants, many had returned to their villages during the migrant-exodus in March 2020, forcing suppliers to employ more women in PPE production. Most women engaged in PPE production stated that they were forced to work extremely long hours at very low wages during this period.
However, once garment production resumed from June, with migrant men also slowly returning back to work, the monthly gender wage gap started going back to pre-pandemic levels with men earning more than women workers.
Figure 6.5: Trend in monthly wages by gender, 2020
0
50
100
150
200
MaleFemale
November-DecemberJune-October
March-MayJanuary-February
Mo
nthy
l Wag
es in
US
D
Source : Primary data, n = 433
Figure 6.3 : Trend in monthly wages by gender, 2020
“After the lockdown, the factory stated the creche facility will not be reopening due to health and safety concerns. With a two-year-old child, how could I return to work without a creche in the factory? We had no savings and were in massive
debt after the lockdown, so for a few days, I left my child at a neighbour’s house and
returned to work. But it could not be sustained, and the manager said its better
I resign, as they were anyway trying to cut down their workforce. So, I resigned and started selling vegetables at the market, where I could at least take my baby to
work. I hardly earn 5000 INR (69 USD) a month now. I wish I could return to the factory so I could earn more and give my
baby more nutritious food.”
- Saritha, 25-year-old garment worker at PVH supplier factory in Bengaluru
“
”

96
no severance benefits.
• In some factories, there was forced termination of all pregnant women immediately after the Covid-19 lockdown, with a particular factory even forcing all women workers to undergo ultrasound scans violating workers’ bodily rights and privacy and using the results to terminate pregnant women workers. None of these workers received full severance benefits.
• In some cases, as below, pregnant women were forced to go on paid leave in the early months of their pregnancy itself, while they wished to use their maternity leave only in the later months of their pregnancy. This forced many pregnant women workers to resign immediately after the birth of their child as they had exhausted their maternity leave and with creches closed, had no affordable child care options.
Gendered Impacts Of Creches Closures
As seen in the case of Saritha, many young women workers in Karnataka were forced to resign in 2020 after garment factories refused to reopen creches after the Covid-19 lockdown. Under the Maternity Benefit (Amendment) Act, 2017, factories with more than 30 women employees have to provide a creche for children under six. However, garment factories refused to reopen these creches after the Covid-19 lockdown citing health and safety concerns. This is despite labour department officials stating that the government had not given any permission to close creches after the Covid-19 lockdown.8 Given these circumstances, trade unions strongly believe that creches were not reopened throughout 2020 as a means to force young working women like Saritha to voluntarily resign. With young mothers being discouraged from labour market participation due to loss of access to childcare, the health and wellbeing of their children have been seriously compromised.
The Plight Of Pregnant Women During Covid-19
In the pre-pandemic period itself, pregnant garment workers faced multiple types of discriminatory treatment and behaviour, ranging from increased verbal abuse or reduced pay to terminations and forced resignations. This situation exacerbated during the Covid-19 pandemic, despite Indian labour laws providing various maternity benefits, including 26 weeks of paid leave for pregnant women.
Reports collected during our surveys indicate:
• Some garment factories stating health and safety concerns, forced pregnant women to resign after the Covid-19 lockdown. Most of these workers received

97
“I was one month pregnant when my factory closed during the lockdown in March, 2020. My husband, lost his job during the lockdown and was unable to find himself
another job till July, 2020. Despite having worked as a tailor in the garment industry for 10 years I had only 3000 INR (40 USD) as savings to meet the needs of a family of four
for two months.
I received wages (8500 INR/116USD) for March only by mid-April. I did not receive wages for April and May as I could not report back to work on time, due to lack of
transport facilities because of travel restrictions by the government. When I returned to the factory by the end of May, I was forced to take maternity leave from June, despite
being only three months pregnant. In normal circumstances, I would have taken maternity leave only in the last month of my pregnancy, so that I could spend a few
months with my child while getting paid and returned to work soon after the 6-month paid leave was over.
My family survived the lockdown period, only due to the kindness of neighbours and family members. The factory and the brand did nothing for us – they left us to starve,
despite having worked for years for them. After my husband lost his job, we ran out of money by the third week of April. Our neighbours knew how poor we were, so even if they had little, they gave us some food they cooked or passed 100-200 INR (1-3 USD)
to me every week. The tension and stress of managing our family’s financial needs, the domestic work and the Covid-19 situation put me in grave mental agony. I did
not know how we would survive. In the first week of May, I fainted from high blood pressure and had to be admitted in the hospital. The doctor said I needed to relax more, but how can you relax, when you don’t know where your next meal will come from?”
- Usha, a 31-year-old garment worker working at a H&M supplier factory in Bengaluru
”
“
The Exploitation Of Dalit Labour
Caste-based discrimination, which includes discrimination based on caste, work and descent, and similar forms of inherited status is a common form of discrimination in Indian garment factories, especially in Tamil Nadu.9
Usha had her baby in November, 2020 but since she had exhausted her paid leave by then, she availed unpaid leave till January, 2021. Realising that a return to the factory will not be possible with the Covid-19 pandemic spreading and with the creche closed in the factory, she resigned from her job in February 2021 and has not returned to the workforce since. She is considering selling vegetables in a cart, so that she does not have to ask her husband for money.
Dalits or Scheduled Castes (SCs) are the most affected by caste-based discrimination, as they are often considered “untouchable,” with the vast majority of workers from this community being subjected to forced labour in South Asia.

98
In the pre-pandemic period itself, Dalit garment workers, including those in our sample, were earning significantly lower than workers from other communities (Figure 6.6). They faced bigotry at multiple fronts as they were:
• Concentrated in the most poorly paid and hazardous jobs in the garment and textile industry, with many garment factories hiring Dalits from the most historically stigmatised communities for only janitorial work like cleaning cotton waste from factory floors, cleaning toilets, etc.
• Relegated to poorer working conditions than non-Dalits including lower wages, longer working hours and higher chances of sexual harassment.
• Discriminated against promotion or being considered for higher positions in the industry.
• Discriminated against services provided by employers including access to social security, employer provided housing and trainings.
• This systemic discrimination
against Dalits was accentuated
during the Covid-19 lockdown
period in terms of wage theft,
with Dalit workers facing the
highest fall in wages when
compared to every other social
category. While the wages of
OBC workers dipped by 55%,
and General category workers
by 57%, the wages of SC
workers dipped by 79%.
However, while the wages of SC workers climbed to almost pre-pandemic levels by the end of 2020, the wages of General and OBC workers remained below pre-pandemic levels. This is because the latter are concentrated in tailoring roles where they depend significantly on overtime pay which was now reduced due to low orders from brands in 2020.
Figure 6.6: Trend in wages by social category, 2020
Contract And Casual Labour Worst Affected By Covid-19
“My contractor did not even pay me for days I worked in March. He switched off his phone and
disappeared. My family was left starving with no work or money for two months. We took 10,000
INR (135 USD) as debt from a money lender at 10% interest.
We ate only rice porridge for two months.”
- Ashok, a contract worker at a Walmart supplier factory in Tirupur
”
“
Mo
nthy
l Wag
es in
US
D
Source : Primary data, n = 433
0
30
60
90
120
150
STSC/DalitOBCGeneral
November-DecemberJune-October
March-MayJanuary-February

99
engaged only for short periods of time, all workers sampled in this survey have worked for at least one year in the given factory. These workers do not generally have a contract.
• All contract workers surveyed
stated that they received no
wages in the months of April
and May, 2020.
In the pre-pandemic period itself there was a gap between the monthly wages of permanent workers and contract workers, despite both categories of workers being engaged in similar tasks (mainly as tailors) and working for almost the same hours (Figure 6.7). The wages of casual workers were much lower than workers in the other two categories in the pre-pandemic period itself as they were engaged in more poorly paid jobs including as cleaners, who remove cotton waste from factory floors.
For this survey, garment workers in India are broadly divided into three categories in terms of contract type, namely:
Permanent workers: Workers who are directly employed by the factory, receive a monthly wage (generally directly deposited to their bank account) and have access to social security benefits including Employees Provident Fund (EPF), Employees State Insurance (ESI) and Gratuity under the Payment of Gratuity Act (1972). However, these workers may or may not have a contract.
Contract workers: These are workers who receive a monthly wage but do not have access to any form of social security and are employed by a factory generally through a contractor for a fixed time period ranging between 1-2 years. These workers do not generally have a contract.
Casual workers: These are daily wage workers, who do not have access to any form of social security and are employed by a factory either directly or through a contractor. While most casual workers are

100
While the monthly wages of all categories of workers fell from March 2020, contract workers faced the highest dip in wages during the Covid-19 lockdown period. Permanent workers faced a 69% dip in wages, casual workers an 86% dip in wages while contract workers faced a 100% dip in wages. In other words, all contract workers reported that they received no wages during April and May, 2020.
Casual workers were able to earn at least some wages during the lockdown period as opposed to contract workers as some casual workers were called to clean factory floors especially in factories where PPE production was going on. While wages of casual and permanent workers went back to pre-pandemic level by the end of 2020, the wages of contract workers remained lower than the pre-pandemic levels. Contract workers say that this is because they had lower overtime pay during the Covid-19 period in 2020. Overtime pay was a major component of their pre-pandemic wage, especially in 2019.
Figure 6.7: Trend in wages by contract type, 2020
3. Forms Of Covid-19 Wage Theft Wage theft is endemic in global garment supply chains due to power asymmetry between brands, suppliers, and workers. Brands force suppliers to drive down production costs and suppliers in turn pass this down to workers through various forms of wage theft. The contraction of business and factory closures due to brands’ purchasing practices led to an escalation of wage theft in India through: (A) layoff and termination without legal dues and benefits, and forced resignation; (B) unpaid, underpaid, and forced overtime; (C) bonus theft; and (D) social security theft.
A. Layoffs, Terminations, And Forced Resignations
“We received no wages for the lockdown period. Once we returned to
work after the lockdown, they asked us to resign and rejoin the factory as new employees. If we refused to do
that, they threatened to terminate us. We used to be permanent employees; the new contracts made us contract
employees. I did not receive my gratuity amount after I resigned
and I lost all access to social security schemes when I rejoined.”
- Mahesh, a migrant worker working for US Polo supplier factory in Gurgaon
”
“
0
30
60
90
120
150
Temporary Workers
Permanent Workers
Contract Workers
November-Decembe
June-October
March-May
January-February
Source : Primary data, n = 433
Mo
nthl
y W
ages
in U
SD

101
• 89% of the workers in
our survey experienced
employment shocks at some
point during 2020, either
in the form of layoffs or
terminations (Figure 6.8).
Figure 6.8: Composition of employment loss, 2020
Figure 6.9: Trend in average number of days of layoff, 2020
resign and rejoin as new employees. If they refused to do this, they were threatened with termination with no possibility for being rehired. All these workers who voluntarily resigned did not receive their seniority benefits. Moreover, some of these workers, who were permanent workers, were rehired as contract labour.
b) Some factories arbitrarily stopped transportation facilities either completely or to certain areas after the Covid-19 lockdown, forcing workers to resign.
Many garment workers in rural regions in Tamil Nadu and Karnataka spend 3-4 hours travelling to and from garment factories. For these workers, factories can be accessed only through factory buses as public transportation is limited in their villages and workers do not own private vehicles. The discontinuation of transport facilities by many factories, sometimes due to Covid-19 related travel restrictions by the government, forced some workers, especially women to resign.
c) In a few factories which closed down in 2020, workers were told that they will not receive their severance benefits if they did not voluntarily resign. Most of these workers
11%Laid off
79%Didnt face layoff/
termination
10%Terminated/
forced to resign
Source : Primary data, n = 433
Figure 6.6 : Composition of employment loss, 2020
0
5
10
15
20
25
November-December
June-October
March-May
January -February
Source : Primary data, n = 433
Figure 6.7 : Trend in number of days of layoff, 2020
Num
ber
of
day
s o
f la
yoff
• 79% of the garment workers surveyed were laid off, with all laid-off workers stating that they were laid off in April and May, 2020 during the Covid-19 lockdown (Figure 6.9).
• Only 11% of the workers did not experience job loss and all these workers were involved in the production of medical and paramedical gear during the Covid-19 lockdown period.
• 10% of the surveyed workers reported they were either terminated or coerced to resign under various pretexts, including:
a) In some factories, after the Covid-19 lockdown, workers with more than five years of experience were forced to voluntarily

102
did not receive full seniority benefits after resignation.
d) As stated in the previous section, the arbitrary closure of creches after the Covid-19 lockdown and the discriminatory labour practices towards pregnant women also forced some women workers to voluntarily resign.
B. Unpaid, Underpaid, And Forced Overtime
Nadu was 11 hours. Thus, garment factories in Tamil Nadu were violating national laws with regard to overtime in the pre-pandemic period not just through underpayment or non-payment for overtime work but by also forcing workers to work beyond the legally allowed working hours. While working hours fell to zero in April and May in Tamil Nadu, by June 2020, the average working hours per day went back to pre-pandemic levels with workers reporting a 11-hour workday, indicating a continuum in violation of rules by Tamil Nadu garment factories with regard to working hours after the Covid-19 lockdown.
Unpaid And Underpaid Overtime
Unpaid or underpaid overtime work is another major practice through which wage theft is enabled.
• In the pre-pandemic period itself, only 77% permanent workers, 54% contract workers and 33% casual workers reported receiving any payment for overtime work (figure 6.10). Most workers stated that overtime work was paid at regular hourly wage rate instead of twice the hourly wage rate as required by law.
• During the Covid-19 lockdown there was a general fall in the percentage of workers receiving any payment for overtime work, across all contract types. However, the steepest decline was seen in the case of contract workers, as no contract worker received any overtime pay during April and May, 2020. But, the percentage of contract workers employed in overtime work was also limited during this period as suppliers mostly engaged permanent workers in PPE production during the lockdown. There was a 10% fall in overtime pay received by regular workers and an 8% fall in overtime pay received by casual workers during this period. However, the percentage of workers receiving overtime pay, across all contract types went back to almost pre-pandemic levels between
“No one in our factory received wages for the lockdown period in April and May, 2020. When the factory reopened in June, there was a huge increase in verbal harassment, including
name-calling, slut-shaming and constant threats of termination. If we wanted to take even a one-day leave due to any illness, they would shout at us and tell us to just resign and never return to
work. In August and September, we were forced to do at least
30 minutes of unpaid overtime almost every day.”
- Soumya, 28-year-old tailor at Primark supplier factory in Tirupur
”
“
Forced Overtime In Tamil Nadu
According to the Factories Act, 1948, a factory cannot employ a worker for more than 9 hours a day or for more than 48 hours in any week, and employers are required to pay twice the regular hourly wages for overtime work performed. However, in the pre-pandemic period the average working hours per day for garment workers in Tamil

103
June to October, 2020. As in the pre-pandemic period, most workers stated that overtime work was paid at regular hourly wage rate as opposed to twice the hourly wage rate as required by law from June, 2020.
Figure 6.10: Trend in overtime pay received by contract type,
2020
C. Bonus Theft
“During the lockdown period, they paid us no wages. We had no savings and we survived having only rice and
water. Once, we returned to work, they forced us to do unpaid overtime. We at least thought, after all the suffering we underwent for the factory over the
years, working long hours, harassing our bodies, they would at least give us our due bonus amount during this crisis–
they just gave us 1500 INR (21 USD) and told us we should be grateful that we
have not been terminated yet.”
- Chellamma, 36-year-old garment worker at a C&A supplier factory in Tamil Nadu
”
“
0
10
20
30
40
50
60
70
80
Casual WorkersPermanent WorkersContract Workers
November-December
June-OctoberMarch-May
January-February
Source: Primary data, n = 296 (workers who worked overtime)
Per
cent
age
of
Wo
rker
s
Figure 6.8 : Trend in overtime pay received by contract type, 2020
The non-payment or partial payment of festive bonuses constitutes another form of wage theft in India during the pandemic period. Bonus theft has significant consequences for garment workers as it serves as a crucial income supplement to their poverty-level wages.
In India, permanent workers, usually receive at least one festive bonus every year, which is generally equal to one month’s wages. Contract and casual workers also receive festive bonuses, either as cash or in-kind, with the bonus amount varying significantly across factories and regions. The festive bonus is given in different months in different regions based on regional festivities like Diwali (Gujarat, Haryana, Tamil Nadu), Dussehra (Karnataka), Pongal (Tamil Nadu) etc.
• While all permanent
workers stated that they
received at least one
festive bonus in 2019,
only 75% permanent
workers stated that they
received it in 2020. For
workers who received
festive bonus, the average
bonus amount fell from
142 USD in 2019 to 109
USD in 2020.

104
Figure 6.11: Trend in access to social security benefits, 2020
40
60
80
100
ESIPF
November-DecembeJune-October
March-May
January-February
Source: Primary Data, n = 364
Per
cent
age
of
Wo
rker
s
Figure 6.9 : Trend in access to social security benefits, 2020
D. Social Security Theft
Permanent workers are entitled to two main social security benefits, namely:
• Employees’ Provident Fund (EPF): This is a government managed retirement savings scheme for workers. Both the employer and the employee need to contribute 10-12% of the employee’s wages in every wage period towards the EPF.
• Employees’ State Insurance (ESI): This is a health insurance scheme for Indian workers. While the employee needs to contribute 0.75% of the wages, the employer needs to contribute 3.25% of the wages of the employee in every wage period to the ESI.
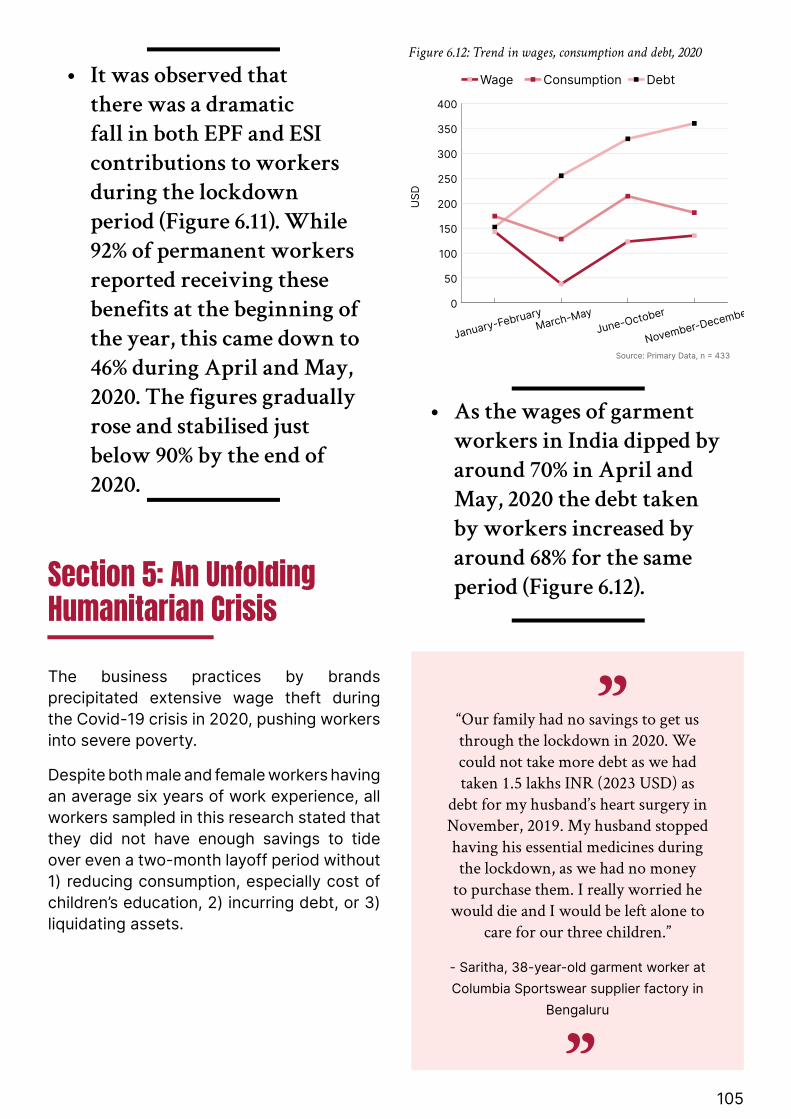
105
Section 5: An Unfolding Humanitarian CrisisThe business practices by brands precipitated extensive wage theft during the Covid-19 crisis in 2020, pushing workers into severe poverty.
Despite both male and female workers having an average six years of work experience, all workers sampled in this research stated that they did not have enough savings to tide over even a two-month layoff period without 1) reducing consumption, especially cost of children’s education, 2) incurring debt, or 3) liquidating assets.
• It was observed that
there was a dramatic
fall in both EPF and ESI
contributions to workers
during the lockdown
period (Figure 6.11). While
92% of permanent workers
reported receiving these
benefits at the beginning of
the year, this came down to
46% during April and May,
2020. The figures gradually
rose and stabilised just
below 90% by the end of
2020.
• As the wages of garment
workers in India dipped by
around 70% in April and
May, 2020 the debt taken
by workers increased by
around 68% for the same
period (Figure 6.12).
Figure 6.12: Trend in wages, consumption and debt, 2020
US
D
0
50
100
150
200
250
300
350
400
DebtConsumptionWage
November-DecembeJune-October
March-May
January-February
Source: Primary Data, n = 433
Figure 6.10 : Trend in wages, consumption and debt, 2020
“Our family had no savings to get us through the lockdown in 2020. We could not take more debt as we had taken 1.5 lakhs INR (2023 USD) as
debt for my husband’s heart surgery in November, 2019. My husband stopped having his essential medicines during the lockdown, as we had no money
to purchase them. I really worried he would die and I would be left alone to
care for our three children.”
- Saritha, 38-year-old garment worker at Columbia Sportswear supplier factory in
Bengaluru
“
”
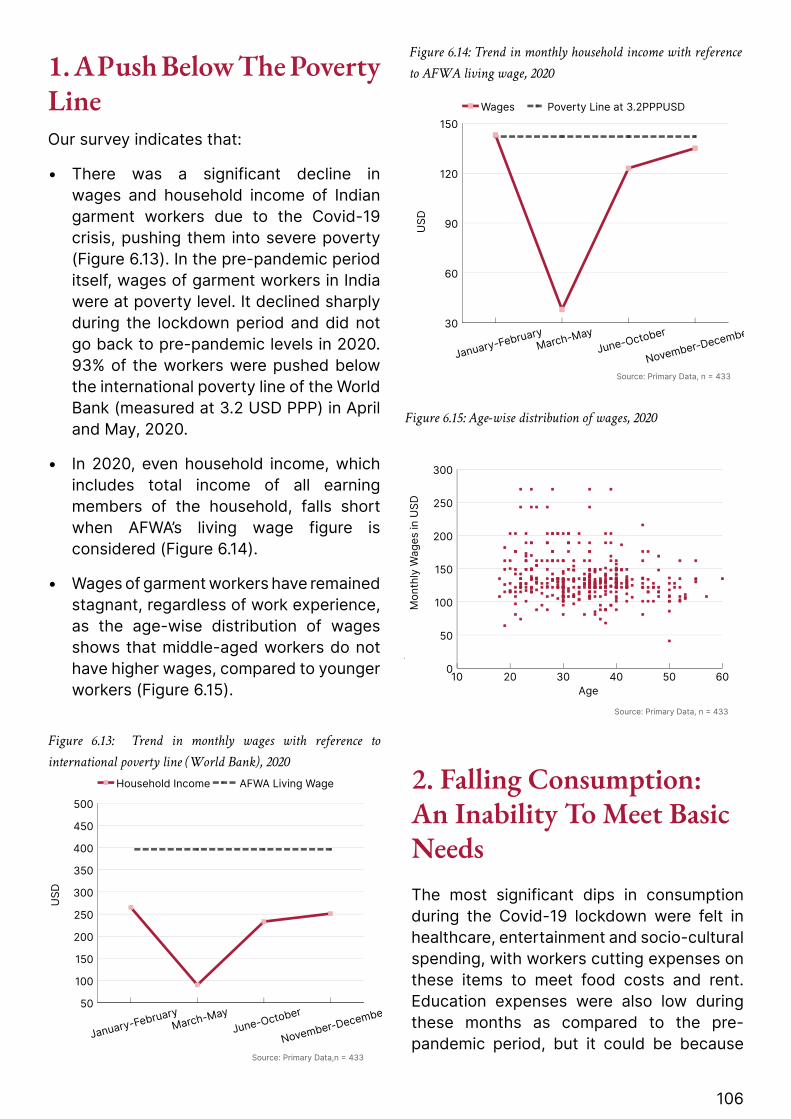
106
1. A Push Below The Poverty Line Our survey indicates that:
• There was a significant decline in wages and household income of Indian garment workers due to the Covid-19 crisis, pushing them into severe poverty (Figure 6.13). In the pre-pandemic period itself, wages of garment workers in India were at poverty level. It declined sharply during the lockdown period and did not go back to pre-pandemic levels in 2020. 93% of the workers were pushed below the international poverty line of the World Bank (measured at 3.2 USD PPP) in April and May, 2020.
• In 2020, even household income, which includes total income of all earning members of the household, falls short when AFWA’s living wage figure is considered (Figure 6.14).
• Wages of garment workers have remained stagnant, regardless of work experience, as the age-wise distribution of wages shows that middle-aged workers do not have higher wages, compared to younger workers (Figure 6.15).
Figure 6.13: Trend in monthly wages with reference to
international poverty line (World Bank), 2020
r50
100
150
200
250
300
350
400
450
500
AFWA Living WageHousehold Income
November-DecembeJune-October
March-May
January-February
Source: Primary Data,n = 433
US
D
Figure 6.12 : Trend in monthly household incomewith reference to AFWA living wage, 2020
Figure 6.14: Trend in monthly household income with reference
to AFWA living wage, 2020
30
60
90
120
150
Poverty Line at 3.2PPPUSDWages
November-DecembeJune-October
March-May
January-February
Source: Primary Data, n = 433
US
D
Figure 6.11 : Trend in monthly wages withreference to international poverty line (World Bank), 2020
Figure 6.15: Age-wise distribution of wages, 2020
r
Figure 6.13 : Age-wise distribution of wages, 2020
10 20 30 40 50 600
50
100
150
200
250
300
Source: Primary Data, n = 433
Mo
nthl
y W
ages
in U
SD
Age
2. Falling Consumption: An Inability To Meet Basic NeedsThe most significant dips in consumption during the Covid-19 lockdown were felt in healthcare, entertainment and socio-cultural spending, with workers cutting expenses on these items to meet food costs and rent. Education expenses were also low during these months as compared to the pre-pandemic period, but it could be because
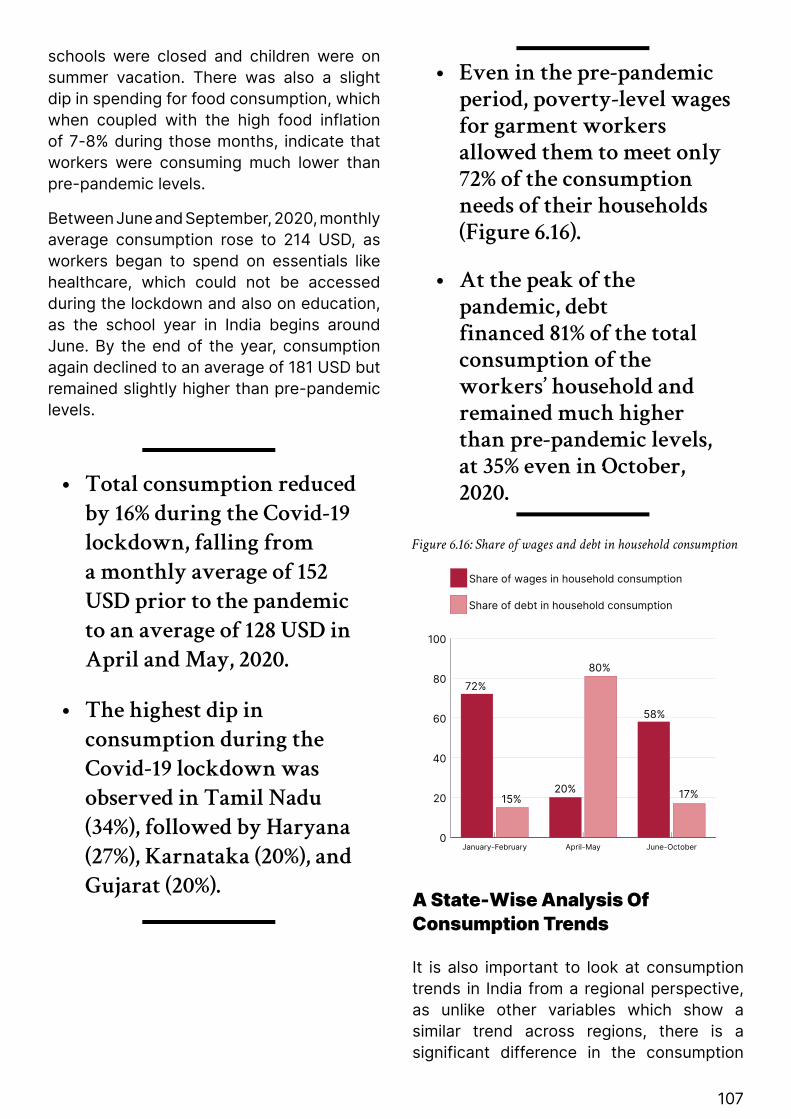
107
schools were closed and children were on summer vacation. There was also a slight dip in spending for food consumption, which when coupled with the high food inflation of 7-8% during those months, indicate that workers were consuming much lower than pre-pandemic levels.
Between June and September, 2020, monthly average consumption rose to 214 USD, as workers began to spend on essentials like healthcare, which could not be accessed during the lockdown and also on education, as the school year in India begins around June. By the end of the year, consumption again declined to an average of 181 USD but remained slightly higher than pre-pandemic levels.
• Total consumption reduced
by 16% during the Covid-19
lockdown, falling from
a monthly average of 152
USD prior to the pandemic
to an average of 128 USD in
April and May, 2020.
• The highest dip in
consumption during the
Covid-19 lockdown was
observed in Tamil Nadu
(34%), followed by Haryana
(27%), Karnataka (20%), and
Gujarat (20%).
• Even in the pre-pandemic
period, poverty-level wages
for garment workers
allowed them to meet only
72% of the consumption
needs of their households
(Figure 6.16).
• At the peak of the
pandemic, debt
financed 81% of the total
consumption of the
workers’ household and
remained much higher
than pre-pandemic levels,
at 35% even in October,
2020.
Figure 6.16: Share of wages and debt in household consumption
0
20
40
60
80
100
Share of debt in household consumption
Share of wages in household consumption
June-OctoberApril-MayJanuary-February
72%
80%
15% 17%
58%
20%
A State-Wise Analysis Of Consumption Trends
It is also important to look at consumption trends in India from a regional perspective, as unlike other variables which show a similar trend across regions, there is a significant difference in the consumption

108
trend in Karnataka as opposed to the other three states (Figure 6.17).
In Karnataka there is a 90% increase in monthly consumption after the lockdown in April and May, 2020, while all other regions show only a 40-50% increase. This is because June is the beginning of the school year, and most garment workers in Bengaluru (the state capital of Karnataka) prefer to send their children to private schools, which are relatively expensive, even if it means taking more debt as these workers see it as a means to upward social mobility. As seen in the section on debt below, it is only in Karnataka that workers took debt in 2020 for education. Information from the ground also indicated that some women garment workers in Bengaluru, during Covid-19 lockdown, were willing to reduce food consumption, which was at bare minimum, in order to save money to purchase school textbooks for their children in June. In all other regions, most workers send their children to government schools which charge a minimal fee.
Additionally, it is also important to note that in many factories, especially in South India, transport facilities which were provided freely by the factory, started to be charged after the lockdown period, adding to the consumption expenses of workers. Workers in Karnataka stated that there was 54% increase in transport costs per month from June as factories either hiked transport charges or started charging for transport facilities which were free in the pre-pandemic period. Workers in other regions also indicated that there was an increase in transport costs from June, with workers in Gujarat, Haryana and Tamil Nadu stating there was around 20% increase in transport costs per month from June, 2020.
Figure 6.17: Trend in consumption across regions, 2020
50
100
150
200
250
300
Tamil NaduHaryanaKarnatakaGujarat
November-DecembJune-October
March-May
January-February
Source: Primary Data,n = 433
US
D
Figure 6.14: Trend in Household Consumption across regions, 2020
3. Mortaging The Future
“We received no wages in April and May, 2020. I pawned my wedding
jewellery to feed my family and pay for my son’s college education. He
was the first person to go to college from my family and I did not want
him to drop out, just because we were poor. Sometimes I cannot sleep at
night thinking about the debt we have incurred.”
- Maya, 36-year-old garment worker at TESCO supplier factory in Tamil Nadu
“
”

109
Figure 6.18: Reasons for incurring debt, 2020
Figure 6.19: Sources of debt, 2020
• 95% of the workers took debt during the Covid-19 lockdown period, while only 30% took debt from June, 2020.
• 60% of the workers took debt to meet food expenses while 28% took debt to pay rent (Figure 6.18).
• 83% of the workers depended on informal sources of credit, mainly friends, relatives and local money lenders, while only 7% were able to access institutional credit (Figure 6.19). Moreover, many workers reported that they had to approach multiple moneylenders, friends and relatives to collect small amounts of debt which varied from 500-2000 INR (7-40 USD) and how this entire process was both distressing and humiliating.
• The average size of debt for
garment workers increased
more than two-fold, from
152 USD pre-pandemic to
360 USD by the end of the
year.
er
60%Food
28Rent
7%Health
5%Education
Source: Primary data, n = 412 (workers who incurred debt)
Figure 6. 15 : Reasons for incurring debt, 2020
Source: Primary data, n = 412 (workers who incurred debt)
49%Friends/Relatives
7%Banks/
Microfinance
6%Co-workers
3%Others 1%
Factory
34%Moneylenders
Figure 6.16 : Sources of debt, 2020

110
Access To Covid-19 Related Relief Efforts67% garment workers reported that they were able to access some form of Covid-19 relief in 2020. However, most workers stated that it was too little, too late.
• Around 30-40% of the workers received Covid-19 relief either as in-kind in the form of dry food or through cash transfers from State governments (Figure 6.20). However, the cash support was a meagre one-time amount of 1000-2000 INR (13-26 USD), which could hardly help meet consumption needs for more than a week.
• Around 10% of the workers reported they received monetary support from trade unions/NGOs while around 30% stated they received dry food packets from unions/NGOs.
• Around 10% of the workers received monetary support from suppliers. However most workers reported that they were forced to compensate for it with unpaid overtime in the post-lockdown period.
• Workers were not able to access any healthcare support through any sources during the Covid-19 crisis in 2020.
Figure 6.20: Percentage of workers who received Covid-19 support from various sources
Per
cent
age
of
wo
rker
s
Source: Primary data, n = 290 (workers who received Covid-19 related relief)
0
10
20
30
40
50
Trade UnionNGO/CharityGovernmentFactory
HealthcareFoodMonetary support
Figure 6.17 : Percentage of workers who receivedCovid-19 support from various sources
5%
36%
1%
10%
1% 1%0%
27%
44%
2%0% 0%

111
Section 6: 2021 – The Tragedy RepeatsThe second wave of Covid-19 started in mid-March, 2021 overwhelming the healthcare system, with shortages in oxygen cylinders and critical medicines and adversely affecting all garment producing hubs including Ahmedabad, Bengaluru, Gurgaon and Tirupur. As lockdowns were introduced to curb the second wave in several states in India, many suppliers faced a shortage of raw materials and could not complete existing orders which led to a second round of order cancellations by certain brands.
In Bengaluru, facing pressure from supplier associations the Karnataka government allowed garment factories to operate with 50% of their workforce during the lockdown in May, 2021. However, with limited safety measures, garment factories turned into Covid-19 hotspots, with hundreds of workers being infected with the virus. While this forced the government and suppliers to shut down garment factories, many workers who were infected were already in serious condition and being unable to afford medicines and oxygen cylinders, given their poverty-level wages, were pushed to severe distress. In the neighbouring state of Tamil Nadu, the government sealed many garment factories after they were found violating Covid-19 protocols which led to Covid-19 hotspots. It is uncertain how many garment workers have died in the second wave of Covid-19 as factories did not want stop operations fearing a second round of order cancellations from brands. However, trade unions feel the numbers could run in hundreds, and for workers who were able to survive the Covid-19 infection, the debt taken to buy basic medicines could take months to repay.
As we write this report, negotiations are going on with regard of payment of wages for garment workers during the Covid-19 2021 lockdowns in different states. While preliminary reports indicate that suppliers in Bengaluru are willing to pay partial wages for the lockdown period, most suppliers in other part of India have refused to pay any wages for the lockdown period. This is likely to push workers into deeper poverty, which could have intergenerational effects in the long run.

112
References
1 KPMG. (2020). Mitigation strategy for Indian textile and apparel sector. New Delhi: KPMG. Retrieved from https://assets.kpmg/content/dam/kpmg/in/pdf/2020/05/covid-19-indian-textile-and-apparel-sector.pdf
2 IBEF. (2021). Textile Industry & Market Growth in India. IBEF. Retrieved from https://www.ibef.org/industry/textiles.aspx
3 Apparel Export Promotion Council. (2020). Impact of COVID19 on Indian Apparel. Mumbai: APEC.retieved from: https://aepcindia.com/system/files/AEPC%20Covid%20Study%208%20May%202020.pdf
4 Society for Labour and Development. (2020). Garment Workers in India’s Lockdown Semi-starvation and De-humanization Lead to Exodus. New Delhi: SLD. Retrieved from https://media.business-humanrights.org/media/documents/files/documents/Garment-Workers-in-Indias-Lockdown11.pdf
5 Nagaraj, A. (2020, October 22). Indian garment workers cover bosses’ lockdown losses. Retrieved from Reuters: https://www.reuters.com/article/india-workers/indian-garment-workers-cover-bosses-lockdown-losses-idUKL4N2HB3SD
6 Ministry of Labour and Employment. (2020, March 20). Statement by GoI. Do NoM-11011/08/202. New Delhi, India. Retrieved from https://labour.gov.in/sites/default/files/Central_Government_Update.pdf
7 Asia Floor Wage Alliance. (2021). Garment workers under threat from labour deregulation in Asia A review of recent labour and employment law changes in Cambodia, India, Indonesia and Sri Lanka. New Delhi: AFWA. Retrieved from https://asia.floorwage.org/wp-content/uploads/2021/03/Labor-Deregulation-Asia-March-2021-Final-Draft-24-March.pdf
8 Nagaraj, A. (2020). With creches shut, mothers forced out of garment factory jobs in India. Chennai: Reuters. Retrieved from https://www.reuters.com/article/us-health-coronavirus-india-workers-trfn-idUSKBN2412Z7
9 Ethical Trading Intiative. (2019). Base Code Guidance: Caste in Global Supply Chains. London: ETI. Retrieved from: https://idsn.org/portfolio-items/eti-guidance-caste-in-global-supply-chains/

113
CAMBODIA

114
Chapter Highlights• 73% of garment workers experienced employment shocks either in the form
of layoffs or terminations.
• The pre-existing gender pay gap of 12% (33 USD) in January-February increased to 16% (37 USD) in July and worsened to 21% (53 USD) by the end of the year.
• Total consumption reduced by 10-15% over the course of the year, falling from an average of 351 USD prior to the pandemic, to an average of 296 USD in August 2020. By the end of the year, consumption increased to an average of 309 USD but remained significantly below the pre-pandemic levels.
• The average size of debt for garment workers increased more than two-fold, from 628 USD pre-pandemic to 1390 USD by the end of the year.
Section 1: IntroductionCambodia is one of the few garment production countries that had low Covid-19 infection rates and no related deaths in 2020. However, Cambodian garment manufacturers faced two main issues during the pandemic: (a) interrupted supply of raw materials from China, and (b) falling demand in the consumer markets of the European Union (EU) and the United States (US). This combination of supply and demand side disruptions resulted in order cancellations and reduction in new orders, as well as delayed payments and demands for discounts by brands, leading to severe crisis in Cambodia’s garment industry in 2020.
Cambodia drives economic growth and employment through its garment exports. In the past five years, garment exports from the country grew in double digits, capturing 2% of the global market share.1 The garment industry has relied heavily
on foreign investments and trade since its inception in the 1990s, with the majority of garment factories having offshore ownership concentrated in mainland China, Hong Kong and Taiwan.2 Cambodia benefited from the relocation of garment manufacturing due to rising labour costs in China, along with trade privileges for export to the EU and US through the Everything But Arms (EBA) initiative and the Generalised System of Preferences (GSP).3 Access to supply of raw materials from China and ports in Vietnam has also played a role in boosting Cambodia’s garment exports.
The pandemic wreaked havoc on Cambodia’s economy and workforce because of its over-reliance on low-value garment exports for economic growth and employment generation. The country participates in garment supply chains through basic Cut-Make-Trim (CMT) operations carried out

115
Section 2: The Methodology In Brief
1. SamplingAFWA conducted a survey of 294 workers from 24 garment and footwear factories in Cambodia, located across Phnom Penh, Kampong Chhnang, Kampong Speu and Kandal. The average sizes of selected factories are given in Figure 7.1, and the details of workers surveyed are provided below.
predominantly by women workers from vulnerable socio-economic groups who migrate from rural provinces to Phnom Penh and other industrial areas. According to the Garment Manufacturers’ Association of Cambodia (GMAC), trade fluctuations during the pandemic impacted the operations of 60% of the 600 garment factories that it represents, which employ an 800,000 strong workforce.4 Informal and unregistered garment factories take the number even higher. By July 2020, GMAC reported that operations had been suspended in 400 factories, resulting in the loss of work and wages for 150,000 workers.5 The government reported the closure of 110 factories in 2020, which left over 55,000 workers unemployed6. According to trade unions, the actual numbers are much higher than those being reported.
The other major employment-generating sectors, such as construction and tourism, were also severely hit by the pandemic, limiting options for garment workers and their families to earn income through alternate employment. This pushed Cambodian garment workers into severe debt, with workers reporting that they cut down on healthcare costs to meet costs of food and rent.
Figure 7.1: Classification of selected factories by size of workforce
0
5
10
15
20
25
30
35
>40003000-40002000-29991000-1999<1000
Average number of workers per factory
Per
cent
age
of
fact
ori
es
13%
17%
25%
33%
13%
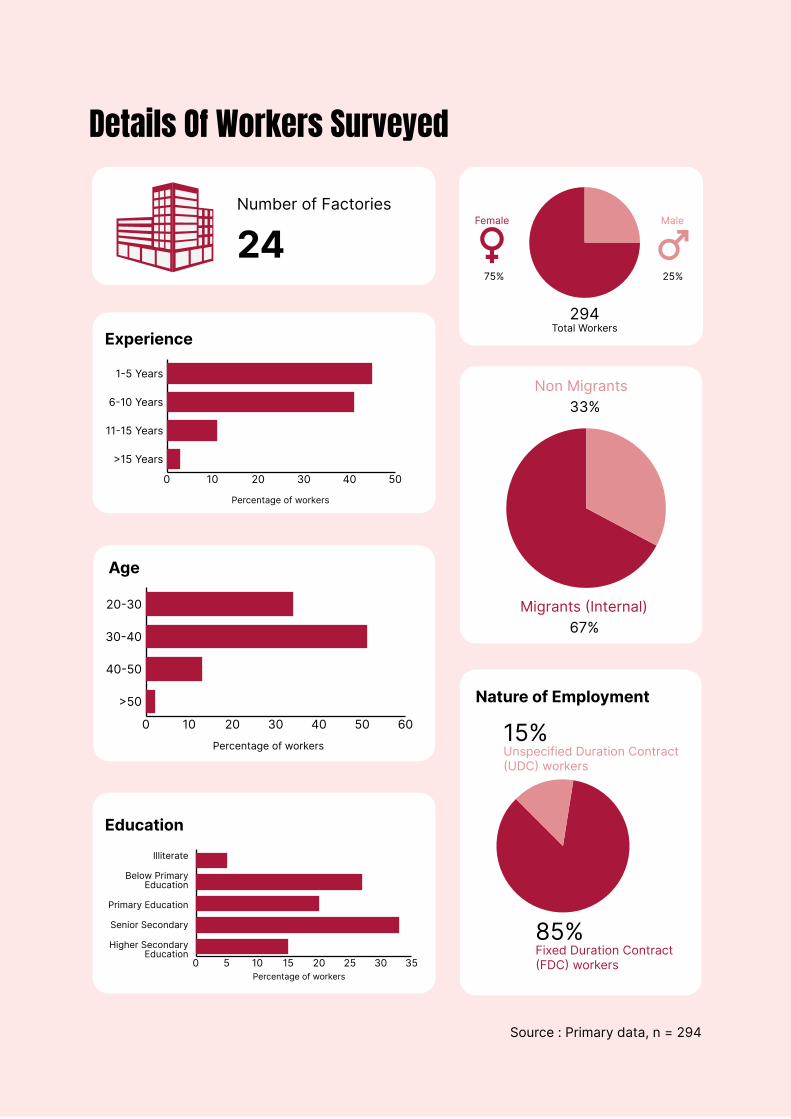
116
Details Of Workers Surveyed
Number of Factories
24
Experience
Nature of Employment
Education
Age
Source : Primary data, n = 294
Illiterate
Below Primary Education
Primary Education
Senior Secondary
Higher Secondary Education

117
2. Limitations Of Sampling• 96% of workers interviewed were
trade union members, as the surveys were conducted by trade union representatives.
Trade union members are more likely to have relatively secure employment and fare better than non-unionised workers. This chapter provides a picture of the severity of the crisis by analysing its impact on workers with relatively secure employment and better conditions.
The gaps in data collection have been partially bridged through qualitative and anecdotal information on the conditions facing more vulnerable workers who are not unionised and have insecure employment.
• Data collection focused largely on workers who were working in factories that were operating at partial or full capacity during the worker surveys, leading to an under-representation of terminated workers.
Many terminated workers, most of whom are migrants, had returned to their native villages and towns after losing employment and could not be tracked down by the data collectors. To bridge this gap, targeted interviews or focus group discussions (FGDs) were conducted with workers who approached the unions with cases of illegal terminations or loss of jobs as a result of factory closure without payment of legally mandated compensations.
3. Classification Of Time Periods, 2020Due to the lack of Covid-19 related lockdowns in Cambodia in 2020, it was not possible to clearly delineate the impact of the pandemic on garment production and workers’ employment and wages. Therefore,
the time period for data collection has been classified into two broad categories: (a) pre-Covid-19 period from January to February 2020, and (b) Covid-19 period from March to December 2020.
The country experienced frequent fluctuations in trade and garment production throughout 2020, resulting in varied impacts on employment and wages of workers over the course of the year. Given this scenario, data was collected separately for all 12 months of the year and the graphs also show variables across all these 12 months.
Section 3: Covid-19 And The Export-Oriented Garment Industry In Cambodia
1. How Did Covid-19 Affect Cambodia’s Garment Exports?The rapid and steady growth in Cambodia’s garment exports suffered an extreme setback in 2020. Garment exports constituted 31% of the GDP and 56% of total exports from Cambodia in 2019. In 2020, it fell to 29% of the GDP and 42% of total exports. Garment exports from Cambodia dropped by 10-12% in 2020, as compared to 2019, with the worst dip experienced between March and July, 2020 (Figure 7.2). The overall export value dropped from 8,287 million USD in 2019 to 7,485 million USD in 2020.7
The impact of Covid-19 was felt early on in 2020 due to disruptions in the supply of raw materials as the pandemic hit China. This resulted in Cambodian suppliers being unable to meet existing orders or secure future orders as they were bound by the short lead times and strict timelines set by the brands. As a result, garment exports fell

118
steeply till April 2020, following which, there was limited recovery characterised by an overall reduction in new orders as demand contracted in the consumer markets of the EU and the US.
The significant improvement in garment exports in July 2020 is most likely explained by the receipt of payments from brands for cancelled or frozen orders as a result of campaigning by GMAC and the global labour rights’ movement. However, this does not mean that there was a positive impact on the employment and wages of garment workers during this period.
There were frequent dips in exports throughout the Covid-19 period, allowing little opportunity for the industry to revive as demand fluctuated severely in western markets due to pandemic-induced lockdowns in 2020. These conditions continued into 2021, made worse by increasing rates of Covid-19 infection in Cambodia and resultant lockdowns in the country.
The withdrawal of the EBA by the EU in August 2020, estimated to impact one-fifth of Cambodia’s exports, also led to uncertainty and instability in garment exports, which needs to be studied further.8 Even though garment suppliers from Cambodia have been relying more heavily on exports to
Figure 7.2: Trend in apparel exports from Cambodia - 2019 vs.
2020
the US, with the share of exports to the US increasing significantly between 2017 to 2019, the EU continues to be an important market for Cambodian garment exports.
2. What Did The Cambodian Government Do For Garment Workers?The most significant measure adopted by the Cambodian government throughout 2020 was the provision of wage subsidies to garment workers who were suspended from their jobs as a result of the Covid-19 pandemic. The government initially announced that garment workers who were laid off would receive at least 60% of minimum wages, amounting to 114 USD per month, with the government providing 40% and the suppliers covering the remaining 20%. However, workers ultimately received a maximum of 70 USD per month for layoff, with 40 USD provided by the government, and 30 USD paid by suppliers.9 According to trade unions, this amount, falling far below minimum wages, was inadequate to meet basic consumption of workers and their families. Trade unions appealed to brands to contribute 40% of the wages of workers but received no response.
The government also announced 192 USD as the minimum wage for 2021, with only a 2 USD hike from the previous year due to pressure from the industry. Trade unions had demanded a hike of 12 USD.
Trade
200
400
600
800
1000
20202019
December
November
October
September
AugustJuly
JuneMay
April
March
February
January
Source: Trade Map
Tota
l val
ue o
f ap
par
el e
xpo
rts
(Mill
ion
US
D)

119
3. How Did Cambodia’s Suppliers React To The Covid-19 Crisis?The Cambodian government announced several incentives to support garment suppliers during the Covid-19 pandemic, including tax relief and customs relaxations for the import of raw materials.10 Despite this, Cambodian suppliers passed on the costs of contraction in business to workers by engaging in widespread layoffs and terminations. While the government demanded that suppliers pay a maximum of 30 USD per month to garment workers who were laid off, reports from the ground indicate that this benefit has not reached all workers.
Illegal terminations of workers without following due process were also reported. Moreover, several factories closed down, leaving workers unemployed due to a range of reasons – from bankruptcy to shutting down and reopening under another name to avail tax incentives and to avoid paying workers seniority benefits.
Section 4: Hyper-Exploitation Of Labour Through Wage Theft
1. Wage Theft Estimates Wage theft was the predominant feature of the Covid-19 crisis for garment workers in Cambodia. Our survey estimates indicate that 73,412 garment workers across 24 factories were denied 12.71 million USD in wages due to order cancellations, non-payment, and other irresponsible practices by brands during the pandemic. Wage theft peaked in July 2020 and declined in intensity between August and October as factories resumed production (Figure 7.3). However, workers consistently experienced wage theft throughout the year, and well into 2021.
Extent of Wage Theft
• 72% of the workers
experienced wage theft
during the pandemic.
• Workers reported an overall
wage theft of 6% in 2020, with
a sharp decline in wages by
13-15% during June and July,
2020
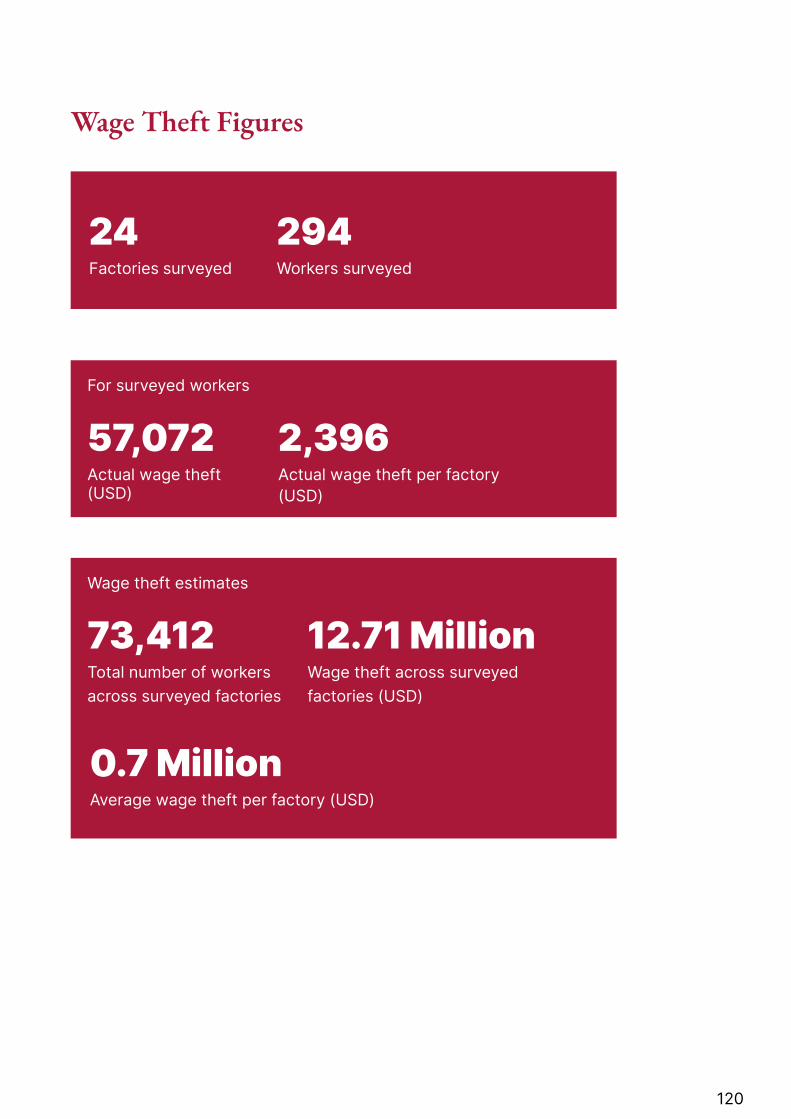
120
24Factories surveyed
57,072Actual wage theft (USD)
73,412Total number of workers across surveyed factories
2,396Actual wage theft per factory (USD)
12.71 MillionWage theft across surveyed factories (USD)
0.7 MillionAverage wage theft per factory (USD)
294Workers surveyed
Wage Theft Figures
For surveyed workers
Wage theft estimates

121
Figure 7.3: Wage theft estimates, 2020
3. Pre-Existing Inequalities As A Fertile Ground For Covid-19 Wage TheftPre-existing inequalities in the labour market in the form of gender, age, and contractual status play an important role in shaping wages and working conditions in the garment industry. During the pre-pandemic period, brands took advantage of these disparities to systematically underpay vulnerable segments of the workforce and flexibilise employment relations.
The extreme exploitation of workers based on gender and type of employment contract, leading to higher wage theft for women workers and contract workers was particularly evident in Cambodia.
Gender Pay Gap
Even during the pre-pandemic period, women were underpaid compared to men, and they were more likely to earn less than the legally mandated minimum wage of 190 USD. This inequality worsened with the pandemic. The share of women experiencing minimum wage violations went up from 19% in March, reached a peak of 33% in June and was 30% in December. In contrast, only 7% of men experienced minimum wage violations
in March, 29% in June, which declined to 7% in December (Figure 7.4).
The escalation of gender differences in violation of minimum wage laws corresponds to the trend in wage disparity between men and women. Though wages of both men and women fall during a period of intense wage theft, the impact is felt much more by women.
• 76% of female workers,
as opposed to 60% of
male workers, reported
experiencing wage theft.
• The pre-existing gender
pay gap of 12% (33 USD)
in January-February
increased to 16% (37 USD)
in July 2020 and worsened
to 21% (53 USD) by the end
of the year.
While wages of men eventually recovered to pre-pandemic levels by the end of the year, women’s wages settled at a much lower level (Figure 7.5). This increased gender pay gap signifies that gender inequality has worsened during the pandemic with women, who comprise two-thirds of the garment workforce, being acutely impacted. With the Covid-19 pandemic hitting Cambodia more severely in 2021, this trend is likely to continue.
Wage Loss Estimation
0.0
0.5
1.0
1.5
2.0
2.5
3.0
3.5
Wage Loss in Million USD
December
NovemberOctober
SeptemberAugustJulyJuneMayApril
March
Mill
ion
US
D
Source: Primary data, n=294
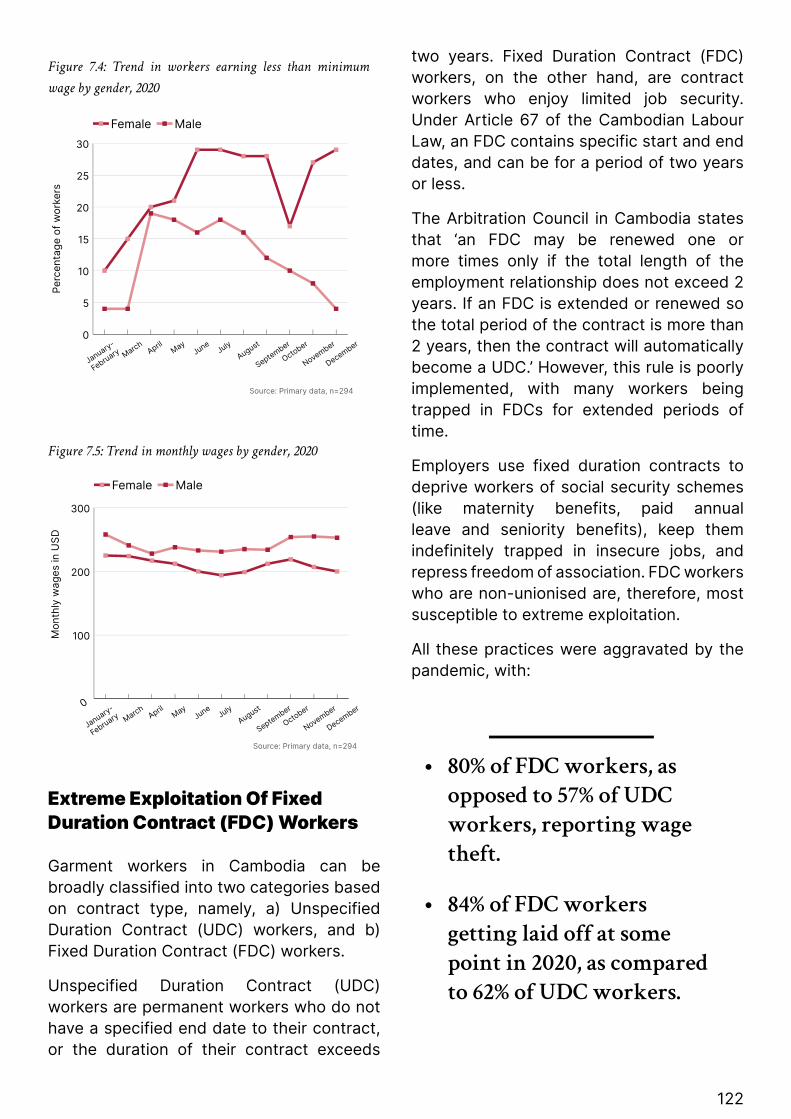
122
Figure 7.4: Trend in workers earning less than minimum
wage by gender, 2020
Figure 7.5: Trend in monthly wages by gender, 2020
Extreme Exploitation Of Fixed Duration Contract (FDC) Workers
Garment workers in Cambodia can be broadly classified into two categories based on contract type, namely, a) Unspecified Duration Contract (UDC) workers, and b) Fixed Duration Contract (FDC) workers.
Unspecified Duration Contract (UDC) workers are permanent workers who do not have a specified end date to their contract, or the duration of their contract exceeds
two years. Fixed Duration Contract (FDC) workers, on the other hand, are contract workers who enjoy limited job security. Under Article 67 of the Cambodian Labour Law, an FDC contains specific start and end dates, and can be for a period of two years or less.
The Arbitration Council in Cambodia states that ‘an FDC may be renewed one or more times only if the total length of the employment relationship does not exceed 2 years. If an FDC is extended or renewed so the total period of the contract is more than 2 years, then the contract will automatically become a UDC.’ However, this rule is poorly implemented, with many workers being trapped in FDCs for extended periods of time.
Employers use fixed duration contracts to deprive workers of social security schemes (like maternity benefits, paid annual leave and seniority benefits), keep them indefinitely trapped in insecure jobs, and repress freedom of association. FDC workers who are non-unionised are, therefore, most susceptible to extreme exploitation.
All these practices were aggravated by the pandemic, with:
• 80% of FDC workers, as
opposed to 57% of UDC
workers, reporting wage
theft.
• 84% of FDC workers
getting laid off at some
point in 2020, as compared
to 62% of UDC workers.
4.3
Source: Primary data, n=294
Per
cent
age
of
wo
rker
s
0
5
10
15
20
25
30
MaleFemale
December
November
October
September
AugustJuly
JuneMay
April
March
January-
February
Source: Primary data, n=294
Mo
nthl
y w
ages
in U
SD
0
100
200
300
MaleFemale
December
November
October
September
AugustJuly
JuneMay
April
March
January-
February
Figure 4.4: Trend in monthly wages by gender, 2020

123
• Hourly wages of FDC
workers dipping by 30-35
% in July and August, as
opposed to UDC workers
who suffered only 10-12%
dip in hourly wages for the
same period (Figure 7.6).
Figure 7.6: Trend in hourly wages by contract type, 2020
3. Forms Of Covid-19 Wage TheftWage theft is endemic in garment supply chains due to power asymmetry between brands, suppliers, and workers. Brands force suppliers to drive down production costs and suppliers in turn pass this down to workers through various forms of wage theft. The contraction of business and factory closures due to brands’ purchasing practices led to an escalation of wage theft in Cambodia through: (A) layoff and termination of workers without legal dues and benefits, and (B) unpaid and underpaid overtime.
A. Layoffs And Terminations
• 73% of the workers in
our survey experienced
employment shocks at
some point during 2020,
either in the form of layoffs
(65%) or terminations (8%)
(Figure 7.7).
• On an average workers lost
6% of their work days in
2020.
• 60-70% of workers were
laid off between June and
August 2020, as compared
to 1% in the pre-pandemic
period (Figure 7.8).
Figure 7.7: Composition of employment loss, 2020
Covid-19 Layoffs
Figure 4.5 : Trend in hourly wages by contract type, 2020
Source: Primary data, n=294
Ho
urly
wag
es in
US
D
0.6
0.8
1.0
1.2
UDCFDC
December
November
October
September
AugustJuly
JuneMay
April
March
January-February
Figure 4.6 : Composition of employment loss, 2020
0
10
20
30
40
50
60
70
80
90
100
TerminatedLaid offDid not face layoffand termination
Per
cent
age
of
wo
rker
s
Source: Primary data, n=294
27%
65%
8%

124
“
”
“After I was laid off from work in May, my income fell from around 200 USD to 70
USD per month. My husband also got laid off in the same time, when the restaurant
my husband worked in suspended operations due to the fall in tourists to
Cambodia. We have not been able to find any other regular jobs so far. Our debt is
almost thrice our income now and we have no money to meet any emergency expenses,
except by borrowing more from private lenders.”
- Davi, a 35-year-old garment worker who works at a GAP supplier factory
While this trend in layoffs declined after July 2020, it remained high over the course of the year. Since wages are paid according to the number of days worked, workers lost wages for the days that they were laid off. Workers lost 13% of the workdays in May and June, which climbed to a peak of 24% in July (Figure 7.9). Though the number of workdays increased subsequently, loss in workdays still remained at a high of 8% during November and December, 2020.
Vulnerable segments of the workforce, in particular women and FDC workers, were worst affected by the Covid-19 related layoffs:
• 84% of FDC workers were laid off, as compared to 62% of UDC workers.
• At the peak of the crisis, garment factories preferred female labour over male labour so as to exploit the gender pay gap while making women workers work longer hours of overtime. In June and July 2020, at the crisis peak, 64% of women workers
were laid off as compared to 80% male workers. While conditions improved for male workers by the end of the year, with only 3% male workers being laid off, 8% women workers continued to be laid off in the same period.
Figure 7.8: Trend in percentage of workers facing layoff, 2020
Figure 7.9: Percentage loss in workdays, 2020
Covid-19 Terminations
• (76%) of terminated
workers reported that
they did not receive legally
mandated termination
benefits. The majority
(67%) of workers who
Source: Primary data, n=294
0
10
20
30
40
50
60
70
80Lay off
December
November
October
September
AugustJuly
JuneMay
April
March
January-
February
Figure 4.7 : Trend in percentage of workers facing layoff, 2020
Per
cent
age
of
wo
rker
s
Figure 4.8 : Percentage loss in workdays, 2020
0
5
10
15
20
25
December
November
October
September
AugustJuly
JuneMay
April
March
Per
cent
age
loss
in w
ork
day
s
Source: Primary data, n=294

125
were terminated had been
working at the factory for
10-15 years.
“
”
“The Covid-19 crisis was used by my factory to selectively terminate unionised
workers like me. Even in the pre-Covid-19 period, women union members like me, have been threatened with termination and cuts in social security benefits, but
the reduction in orders by brands, during the Covid-19 pandemic, was used by the
supplier to openly attack workers’ freedom of association by unfairly dismissing
unionised workers.”
- Sothy, 36-year-old garment worker who worked at an Adidas supplier factory
• 8% of the workers surveyed reported that they were terminated. Interestingly, all workers who reported termination also reported themselves as permanent workers. However, three-fourths (76%) of them reported that they did not receive legally mandated termination benefits.
• The majority (67%) of workers who were terminated had been working at the factory for 10-15 years (Figure 7.10). This reveals the targeted terminations of experienced and older workers. While they were legally considered permanent workers by default due to long years of employment in the factory, trade unions report that workers were not recognised as such by factory managements. As a result, only 33% of these workers received legally mandated termination benefits, with the large majority losing
out on benefits related to seniority.
• As seen in the case of Sothy, the Covid-19 crisis was used by some garment suppliers as a cover to attack workers’ freedom of association by unfairly targeting unionised workers with layoffs and terminations.
• One-fourth (25%) of the terminated workers surveyed were forced to return to agriculture as their main source of livelihood following terminations. However, this is not a viable alternative, given the near-landlessness of small-scale farmers and the weak performance of the agriculture sector in Cambodia. Three-fourths (75%) of terminated workers were employed in other garment factories. However, several workers reported that they were forced to accept more precarious forms of work, with insecure contracts, in order to secure some income.
Figure 7.10: Average years of experience of terminated workers
B. Unpaid And Underpaid Overtime
Unpaid or underpaid overtime work is one of the main practices through which wage theft is practised. According to Cambodian labour law, employers are required to pay 150% of regular wages for overtime work
Figure 4.9 : Average years of expe-rience of terminated workers
Source: Primary data, n=294
0
10
20
30
40
50
60
70
80
Received termination benefitsWorkers terminated
10-15 Years5-10 yearsLess than 5 years�
Per
cent
age
of
wo
rker
s
8%
0%
25%
67% 67%
33%

126
performed in the day, and 200% for overtime work undertaken at night, between 22:00 to 05:00. While the number of hours of overtime reduced due to the contraction of production during the pandemic, many workers who performed overtime were not paid legally mandated overtime rates, with FDC workers being the worst affected.
“
”
“Most of the women workers in my factory were employed in Fixed Duration
Contracts (FDCs) in the pre-Covid-19 period, and most of us were laid off in
May, at the peak of the pandemic. When workers like me who were laid off were asked to re-join the factory in July, the
workforce had reduced significantly and we were asked to work longer hours without
additional pay, handling multiple tasks and facing constant verbal harassment.
Being in deep debt and knowing we won’t find better jobs, we suffered the insults
and long work hours, hoping we won’t be terminated like many of our colleagues.”
- Mony, a 34-year-old garment worker who works at a C&A supplier factory
• Only 59% of FDC workers received legally mandated overtime rates, while 86% of UDC workers reported receiving legally mandated overtime payment (Figure 7.11).
• On an average, FDC workers performed 30 hours of overtime per month in 2020 while UDC workers performed only 18 hours of overtime. Since the per hour wages of FDC workers are much lower than those of UDC workers (as seen in Figure 7.6), FDC workers are forced to
work several hours of overtime, at less than legally mandated rates, in order to earn enough wages to meet their household needs.
Figure 7.11: Payment of legally mandated overtime rates by
contract type, 2020
Section 5: An Unfolding Humanitarian CrisisAs the actions of brands resulted in extensive wage theft over the course of 2020, workers and their households were pushed into deeper job insecurity and precarity. Workers surveyed in Cambodia had worked an average of ten years in the same factory but continued to earn low wages despite their seniority, leaving them with little savings to tide over the crisis. As a result, they were forced to resort to: (a) reduction in consumption, (b) increase in indebtedness, and (c) liquidation of assets.
Source: Primary data, n=294
0
20
40
60
80
100
Did not receive legally mandated overtime rate
Received legally mandated overtime rate
UDCFDC
Figure 4.10 : Payment of legally mandated overtime rates by contract type, 2020
59%
41%
86%
14%
Per
cent
age
of
wo
rker
s

127
“
”
“I was unable to find a job for four months, after my factory closed down, owing me, among many others, one month’s unpaid
wages and severance benefits. My husband, who worked at a local tour agency, also lost
his job at the same time. Unable to meet daily expenses and being pursued by loan
sharks charging 25 percent interest for loans we took for my mother’s surgery last year, my husband and I decided to sell the small paddy field we owned in our village.
We own nothing now except for some jewellery, which we might have to sell if
this crisis continues.”
- Dara, a 29-year-old garment worker who worked in a factory that supplied to Inditex
and Children’s Place
“
”
“We barely have enough to survive. I feel guilty that I can’t take care of my family,
but what can I do, if I can’t find another job and if my previous company won’t pay me my legally earned severance pay. Despite
working in the factory for almost a decade, when it shut down, the factory did not
pay my full severance benefits. Unable to find another regular job, my family started
cutting down on food and milk. From June, I started working as a daily wage
worker for a few days a month, but I hardly earn 100 USD now, almost half of what I
earned before. I have asked my 18-year-old daughter to find herself a job and I have
stopped sending money to my parents back in the village.”
- Bopha, a 43-year-old garment worker who worked at a H&M supplier factory
• As their wages
dipped, workers in
Cambodia reduced
their consumption
by 10-15%, which did
not recover by the
end of the year. At the
same time, their debt
increased more than
two-fold by the end of
2020 (Figure 7.12).
Figure 7.12: Trend in wages, consumption and debt, 2020
1. ‘Barely Enough To Survive’
Source: Primary data, n=294
Wag
es a
nd c
ons
ump
tio
n in
US
D
0
300
600
900
1200
1500
ConsumptionDebtWages
December
November
October
September
AugustJuly
JuneMay
AprilMarch
January-
February
4.11

128
Our survey indicates that:
• Though wages of Cambodian garment workers remain just above the poverty line* (Figure 7.13), they have not kept pace with the rising living costs and workers are forced to resort to debt to meet their basic needs, as seen in the cases of Davi, Dara, Sophea and Charaya. Moreover, terminated workers, many of whom did not receive legally mandated severance payments, are currently earning below the poverty line as seen in the case of Bopha. 10% of the workers surveyed were pushed below the international poverty line of the World Bank (measured at 3.2 USD PPP) between March and May, 2020. Thus, wage theft has had a definite impact on workers’ well-being.
• In 2020, even household income, which includes the total income of all earning members of the household, falls short when AFWA’s living wage figure is considered (Figure 7.14).
• Wages of garment workers have acquired no gain through seniority as the age-wise distribution of wages shows that middle-aged workers do not earn higher wages, as compared to younger workers (Figure 7.15).
* The minimum wage for Cambodian garment workers have significantly increased in recent years, more than doubling from 80 USD per month in 2013, to 190 USD in 2020, due to tremendous organising efforts by trade unions like C.CAWDU and CATU.
Figure 7.13: Trend in monthly wages with reference to
international poverty line (World Bank), 2020
Figure 7.14: Trend in monthly household income with reference
to AFWA living wage, 2020
Figure 7.15: Age-wise distribution of wages
Source: Primary data, n=294
US
D
150
200
250
Poverty Line at 3.2 PPP USDWages
December
November
October
September
AugustJuly
JuneMay
AprilMarch
January-
February
7.12
Source: Primary data, n=294
US
D
300
400
500
600
AFWA Living Wage, 2020Household Income
December
November
October
September
AugustJuly
JuneMay
AprilMarch
January-
February
4.13
10 20 30 40 50 600
200
400
600
800
1000
Age
Mo
nthl
y w
ages
in U
SD
Source: Primary data, n=294
129
2. Falling Consumption: An Inability To Meet Basic Needs
“
”
“After my factory abruptly shut down in May, I did not receive my full severance
payment, which I legally earned after working for five years in the factory. I
owed almost 7000 USD as debt at that time, which I borrowed as microfinance loans at 18 to 25% interest from two different
agencies to build our house. I did not want the debt collectors to take away our new
house, so I tried to get daily shifts in other garment factories through contractors for
7-8 dollars a day, but could only secure one or two shifts per week. From June, we
started cutting down on food. Given the deep financial crisis, my mother, who can
hardly walk, started selling vegetables in the market. My husband, a labour contractor in the construction industry, also started facing pay cuts from July, pushing us into greater debt. Unable to meet even daily
expenses, we are now forced to take loan of 150-200 USD almost every month at 20% interest from our neighbours to pay off
our previous debt. I cannot sleep at night, thinking of how to pay back our debt.”
- Sophea, a 36-year-old garment worker in a factory that supplied to Nike
• Even in the pre-pandemic
period, poverty-level wages
for garment workers
allowed them to meet only
65% of the consumption
needs of their households
(Table 7.2).
• At the peak of the
pandemic, debt financed
25-28% of the total
consumption of the
workers’ household and
remained much higher
than pre-pandemic levels,
at 20% by the end of the
year.
The most significant dips in consumption were felt in healthcare, education, entertainment and socio-cultural spending, with workers cutting expenses on these items to meet food costs and rent (Table 7.1). Even though they were spending the same amount on food consumption across the year, there was a 3.74-5.9% inflation in food prices in Cambodia in 2020, which was particularly high in the peak pandemic-affected months. Moreover, many workers like Sophea were forced to accrue more debt even to finance their reduced food consumption as compared to the pre-pandemic period.
• Total consumption reduced
by 10-15% over the course
of the year, falling from an
average of 351 USD prior to
the pandemic to an average
of 296 USD in August 2020.
By the end of the year,
consumption increased
to an average of 309 USD
but remained significantly
below the pre-pandemic
levels.

130
Table 7.1: Percentage reduction in consumption in 2020
Table 7.2: Share of wages and debt in household consumption
Consumption Item Reduction in Consumption
Healthcare 22 – 36 %
Education 14 – 18 %
Entertainment 40 %
Socio-cultural 65 – 80 %
Source: Primary Data, N = 294 (reduction in consumption did not happen at a particular month but over a period
ranging from April to July, 2020. To capture this, a range in provide with regard to percentage reduction in
consumption of various items.)
Source: Primary data, n = 294
Months
Share of wages in household consumption
Share of debt in household consumption
January - February 65% 13%
March 75% 14%
April 65% 17%
May 62% 25%
June 67% 24%
July 66% 22%
August 70% 27%
September 70% 25%
October 71% 25%
November 60% 28%
December 68% 20%
3. Mortaging The Future
“
”
“My income was too low to have any savings, even if I worked overtime every
day before the pandemic. As an FDC worker, banks refused to give me a loan when I wanted to build our house. So, I
borrowed 4000 USD from a microfinance agency at 20% interest in 2018 but I could not do the repayments on time. With late fees and penalties, my debt had increased
to almost 6000 USD in 2020. After I was laid off from the factory, suffering
constant harassment and threats from debt collectors, I sold our agricultural land,
which my family owned for two decades, so that we won’t lose our house, which was
the collateral for the loan.”
- Charaya, a 36-year-old garment worker in a Levi Strauss & Co supplier factory
Cambodia has the highest average microloan size in the world, with the indiscriminate promotion of microfinance as a remedy to poverty, causing harm to vulnerable populations that do not earn enough wages to meet basic consumption. The pandemic proved that reliance on debt in order to supplement the loss of wages has further exacerbated this vicious cycle of indebtedness.
Cambodian garment workers took greater amounts of debt during the pandemic in 2020 to finance lower levels of consumption, as compared to the pre-pandemic period. 65% of all workers surveyed reported that they had taken loans during the pandemic.
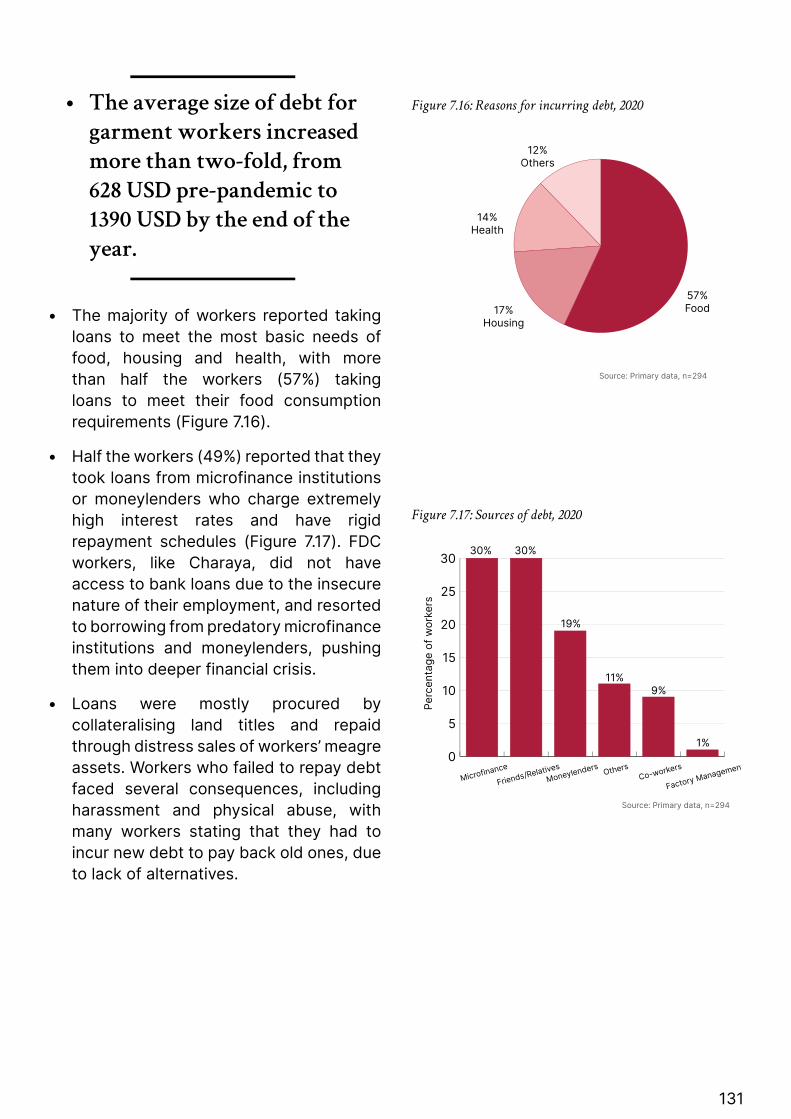
131
• The average size of debt for
garment workers increased
more than two-fold, from
628 USD pre-pandemic to
1390 USD by the end of the
year.
• The majority of workers reported taking loans to meet the most basic needs of food, housing and health, with more than half the workers (57%) taking loans to meet their food consumption requirements (Figure 7.16).
• Half the workers (49%) reported that they took loans from microfinance institutions or moneylenders who charge extremely high interest rates and have rigid repayment schedules (Figure 7.17). FDC workers, like Charaya, did not have access to bank loans due to the insecure nature of their employment, and resorted to borrowing from predatory microfinance institutions and moneylenders, pushing them into deeper financial crisis.
• Loans were mostly procured by collateralising land titles and repaid through distress sales of workers’ meagre assets. Workers who failed to repay debt faced several consequences, including harassment and physical abuse, with many workers stating that they had to incur new debt to pay back old ones, due to lack of alternatives.
Figure 7.16: Reasons for incurring debt, 2020
Figure 7.17: Sources of debt, 2020
Source: Primary data, n=294
57%Food17%
Housing
14%Health
12%Others
Figure 4.15: Reasons for incurring debt, 2020
Source: Primary data, n=294
0
5
10
15
20
25
30
Factory ManagementCo-workers
Others
Moneylenders
Friends/RelativesMicrofinance
30% 30%
19%
11%9%
1%
4.16
Per
cent
age
of
wo
rker
s

132
Access To Covid-19 Related Relief Efforts76% of garment workers reported that they were able to access some form of relief/support during the Covid-19 crisis.
• 60% of the workers reported that they received the wage support of 70 USD for laid-off workers from the government and suppliers for at least a single month in 2020 (Figure 7.18). However, most workers stated that this amount was grossly inadequate to meet even basic expenses including food, rent, education and healthcare for a month.
• Around 20% of the workers received food support from the government, suppliers and trade unions each.
• Formal support for healthcare was limited from both the government and suppliers, but 12% of the workers reported that they were supported by trade unions in this regard.
Figure 7.18: Percentage of workers who received Covid-19 support from various sources
Source: Primary data, n=294
0
10
20
30
40
50
60
Trade UnionNGO/CharityGovernmentFactory
HealthcareFoodMonetary support
4.16
58%59%
11%
22%19% 20%
3%
21%
5%3% 3%
12%Per
cent
age
of
wo
rker
s

133
Section 6: 2021 – The Tragedy RepeatsCambodia’s first major outbreak of Covid-19 began in February, 2021.11 By April 2021, the spike in cases resulted in strict government-imposed lockdown restrictions. This forced garment factories across the country to shut down, leaving the vast majority of garment workers without work. Unlike 2020, workers no longer received the guaranteed 70 USD per month when they were laid off. Rather, the GMAC and the Ministry of Labour urged factory owners to support workers with whatever aid was possible. Unemployment benefits much lower than the 70 USD in 2020 were announced for a small fraction of workers, that is, 5,262 workers in 29 selected factories across garment and tourism sectors.
In May 2021, factories were allowed to reopen in the less-restricted zones of the country, but factories in the red and orange zones remained closed. In the less-restricted yellow zones, factories were allowed to open with partial capacity, leading to layoffs without wages. Several workers who lived in red zones were not allowed to travel back to resume work.
Hunger, inability to pay rent, and mounting microfinance debt with little relaxation of repayment rules have severely intensified the humanitarian crisis facing Cambodian garment workers since the pandemic struck in 2020. Workers received some relief in the form of food assistance and relaxation of rent payments, but unions report that this is grossly inadequate in the face of employment and wage theft for the second consecutive year.
GMAC reported that brands remained insensitive to the lockdown restrictions imposed by the government, providing little leeway to Cambodian suppliers in terms of order fulfilment. The majority of factories, especially those in red zones, were not able to fulfil the orders placed by brands. Without delivery of finished orders within strict deadlines, Cambodian suppliers have gone without payment for existing orders and lost out on future orders, leaving them with huge financial losses. The consequences of these losses fall on workers in the form of greater wage theft, forcing them to incur even greater debt to survive.

134
References
1 Trade Map. (2020). Exports. Retrieved from Trade Map: https://www.trademap.org/Index.aspx
2 Yamagata, T. (2006). The garment industry in Cambodia: Its role in poverty reduction through export-oriented development. Cambodian Economic Review. 81-136.
3 HKTDC Research. (2017, March). Cambodia: Manufacturing Relocation Opportunities (1). Cambodia. Retrieved from https://research.hktdc.com/en/article/MzgyODg2Nzky
4 Fibre2Fashion. (2020, May). COVID-19 plays havoc with Cambodian Textile & Clothing business. Retrieved from Fibre2Fashion: https://www.fibre2fashion.com/industry-article/8663/covid-19-plays-havoc-with-cambodian-textile-clothing-business
5 Khmer Times. (2020, July). 400 factories in Cambodia suspend operations, affecting over 150,000 workers due to COVID-19. Cambodia. Retrieved from https://www.khmertimeskh.com/740479/400-factories-in-cambodia-suspend-operations-affecting-over-150000-workers-due-to-covid-19/
6 Kunthear, M. (2020, November 22). Over 110 garment factories close. Phnom Penh, Cambodia. Retrieved from https://www.phnompenhpost.com/national/over-110-garment-factories-close
7 The World Bank. (2020). Data_Cambodia. Retrieved from The World Bank: https://data.worldbank.org/indicator/NY.GDP.MKTP.KD?locations=KH
8 Arnold, D. (2021). Cambodia’s Garment Sector in Transformation: External Shocks, Political Space and Supplier Consolidation. CNV Internationaal. Retrieved from https://www.cnvinternationaal.nl/_Resources/Persistent/a9351254dc6dfa56573c6f0a455403a1402867ad/2021%20Cambodia%27s%20Garment%20Sector%20in%20Transformation_Researchreport.pdf
9 Kimmarita, L. (2020, April). Temporarily laid-off workers to get just $70. Cambodia. Retrieved from https://www.phnompenhpost.com/national/temporarily-laid-workers-get-just-70
10 Medina, A. F. (2020, May 7). More Incentives, Obligations Announced for Businesses in Cambodia in Tourism, Garment Industries. Retrieved from ASEAN Briefing: https://www.aseanbriefing.com/news/incentives-obligations-announced-businesses-cambodia-tourism-garment-industries/
11 Chorn , A., & Jonathan, S. (2021, May 19). COVID-19 comes to Cambodia. Cambodia. Retrieved from https://www.brookings.edu/blog/order-from-chaos/2021/05/19/covid-19-comes-to-cambodia/
135
136
Chapter Highlights• Workers reported an overall wage theft of 27% in 2020, with a very sharp
decline in wages by 60% in November and December.
• For workers who were unfairly dismissed and could not find jobs in the garment industry in 2020, monthly wages fell sharply from 110 USD in the pre-pandemic period to 37 USD by the end of the year.
• 99% of the workers reported that they had taken on debt during the pandemic.
• Many workers who were unfairly dismissed and could not find jobs in the garment industry in 2020, were pushed below the extreme poverty line (living on less than 1.90 USD a day), which is the lowest yardstick of poverty measurement by the World Bank.
Section 1: Introduction
This chapter provides a picture of wage theft in the Bangladeshi garment industry in 2020 through a special focus on unfair dismissals and union busting during Covid-19.
The global apparel industry has played a crucial role in pushing Bangladesh, a predominantly agrarian economy, to rapid industrialisation and to lower middle-income status in 2015. Bangladesh is the second largest exporter of ready-made garments and the industry contributes to about 11% of the GDP, accounts for approximately 80% of Bangladesh’s total exports, and employs around 4.4. million workers, most of whom are women.1
Despite the tremendous growth of the industry, industrial safety was by and large neglected until tragic incidents like the Tazreen fire in 2012 that killed 117 workers and the Rana Plaza collapse in 2013 that killed 1100 workers. Though measures have been taken over the years to improve industrial safety, especially through the creation of the Bangladesh Accord on Fire
and Building Safety, the garment industry continues to rely excessively on women workers from marginalised communities who are paid poverty-level wages to perform basic Cut and Make (CM) tasks.
As per a survey by the Center for Global Workers’ Rights (CGWR) in March 2020, after the onset of the Covid-19 crisis, more than half of the suppliers in Bangladesh reported that the bulk of their in-process or already completed production was cancelled and 70-90% of brands refused to pay for raw materials and the production cost, leaving more than one million workers fired or furloughed.2
Many garment factories in Bangladesh used the Covid-19 crisis as a cover to attack freedom of association by unfairly dismissing unionised workers or workers who engaged in protests for unpaid wages

137
or bonus. Some of these dismissed workers were also unable to find other jobs in the garment industry as they were specifically targeted for being union members and were blacklisted by factory owners. These workers have been pushed to extreme poverty and hunger, with their children dropping out of schools to take up jobs like street hawking. This chapter, unlike previous chapters, will focus specifically on these workers who were unfairly dismissed and the crisis they experienced in 2020.
Section 2: The Methodology In Brief
1. SamplingAFWA conducted a survey of 271 workers from 21 garment factories in Bangladesh, located across industrial areas in and around the capital city of Dhaka, including Ashulia, Badda, Gazipur, Mirpur, Rampura, and Savar. Most of these factories are covered by the Bangladesh Accord on Fire and Building Safety or the Alliance for Bangladesh Worker Safety. The average size of selected factories is given in Figure 8.1, and the details of workers surveyed are provided on page 138.
Figure 8.1: Classification of the selected factories according to the
size of the workforce
A Focus On Unfair Dismissals, Especially Among Unionised Workers
Thousands of garment workers in Bangladesh have been laid off, terminated or unfairly dismissed as a result of order cancellations and non-payment for existing orders by fashion brands during Covid-19. However, these terminations and layoffs have disproportionately impacted unionised garment workers, with the Covid-19 crisis being used as a cover to attack workers’ freedom of association. This chapter provides a special focus on these workers, with case studies looking at workers who were unfairly dismissed for organising or joining protests demanding unpaid wages and severance benefits.
Given this focus our sample primarily consists of:
• 98% were unfairly dismissed or terminated in 2020 during Covid-19 crisis. None of these workers are currently working in the factories in which they were employed in the pre-pandemic period of 2020.
• 55% were members of trade unions. All non-union members in our sample have also actively taken part in protests for unpaid wages and bonus, leading to the unfair dismissal of many of these workers.
2. Classification Of FindingsAs we are focusing on unfair dismissals during Covid-19, throughout this report, we have divided workers into two categories:
• Unfairly dismissed (found employment): This includes workers who have been unfairly dismissed from a garment factory in 2020 and have been able to find employment in another garment factory
0
5
10
15
20
25
30
35
>4000
3000-4000
2000-3000
1000-2000<1000
Average number of workers per factory
Per
cent
age
of
fact
ori
es
Source: Primary data, n = 21
33%
24%
14%
19%
10%

138
Number of Factories
21
Experience
Nature of Employment
Education
Age
Source : Primary data, n = 271
96%Regular/Permanent Workers
4%Contract Workers
Illiterate
Primary Education
Secondary Education
Higher Seconary Education
Details of Workers Surveyed

139
in the same year.
• Unfairly dismissed (did not find employment): This includes workers who have been unfairly dismissed from a garment factory and have not been able to find employment in another garment factory in 2020. A small percentage of these workers, have been able to find jobs outside the garment industry. However, these jobs are paid less, highly informal and more hazardous compared to the jobs these workers held in the garment industry.
3. Classification Of Time Periods, 2020Our survey has measured variables across four time periods, based on the implementation of Covid-19 lockdown restrictions in Bangladesh. The figures also show variables across these time periods.
Pre Covid-19
Covid-19 National Lockdown
Post Covid-19 Lockdown
Partial Covid-19 Lockdown
January - February
March - May
June-October
November-December
• Garment suppliers face delays in receiving shipments of raw materials from China. Some suppliers also report increases in prices of raw materials.
• Covid-19 cases are detected in the country and a nation-wide lockdown is introduced in the last week of March.
• Brands delay payments to suppliers and abruptly cancel future orders as well as orders already in process. This leads to massive layoffs and terminations.
• The production of Personal Protective Equipment (PPE) and masks begin in some garment factories.
• Reopening of garment factories begin in May.
• Apparel market begins to slowly stabilise and factories increase garment production, re-employing many laid-off and terminated workers.
• Europe, which accounts for 60% of Bangladesh’s exports, goes back into a lockdown, bringing down apparel production. This leads to layoffs and terminations, specifically targeting union members.
2020
Figure 8.2: Classification of time periods, 2020

140
Section 3: Covid-19 And The Export-Oriented Garment Industry In Bangladesh
1. How Did Covid-19 Affect Bangladesh’s Garment Exports?Garment exports from Bangladesh have been consistently increasing since the 1990s and it has registered a Compound Annual Growth Rate of 7% over the last decade.3 This trend suffered a huge setback as total exports declined by 15% from 37 billion USD in 2019 to 31 billion USD in 2020 (Figure 8.3). The sharpest decline was observed in the months of April, May, and June where exports fell by 28%, 55% and 44% ,respectively. Though this coincided with the general lockdown predominantly in April, 2020, the crisis was largely driven by order cancellations, suspension of payments, and the demands for deep discounts by apparel brands. Though exports recovered to almost 2019 levels between August and October, it declined in November and December by around 10% due to the second wave of Covid-19 lockdowns in Europe.Figure 8.3: Trend in apparel exports from Bangladesh - 2019 vs
2020
2. What Did Bangladesh’s Government Do For Garment Workers?When the Bangladeshi government announced a lockdown at the end of March, the initial confusion regarding whether garment factories would be open caused uncertainty among workers. Workers travelled long distances sometimes on foot in the absence of public transportation only to find the factories closed.4
On March 31, the government announced a 50 billion BDT (595 million USD) credit package for export industries that included loans at 2% interest to factory owners and wages for workers to be paid through electronic payment mechanisms from April to June, 2020. This shift to digital payments was made over a span of a few weeks and around three million workers opened accounts with Mobile Financial Service providers during the crisis. However, many workers stated that wages were not paid in full and workers who were affected by factory closures were not eligible for this cash support.5
The government also announced a cash relief program with the support of EU countries, where workers who were laid off would receive 3000 BDT (35 USD) for three months from September, 2020. However, this is just one third of the regular monthly wage of workers and the scheme is restricted to only factories that were members of BGMEA (Bangladesh Garment Manufacturers and Exporters Association) and BKMEA (Bangladesh Knitwear Manufacturers and Exporters Association).6
3. How Did Bangladesh’s Suppliers React To The Covid-19 Crisis?Bangladeshi suppliers benefited from
1.0
1.5
2.0
2.5
3.0
3.5
4.0
20202019
December
November
October
September
AugustJuly
JuneMay
April
March
February
January
Source: Trade Map
Tota
l Val
ue o
f R
MG
Exp
ort
s in
Mill
ion
US
D
Figure 8.1: Trend in apparel exports from Bangladesh - 2019 vs. 2020

141
various types of monetary and non-monetary support from the government during the Covid-19 crisis. This includes loans for factories at low-interest rates, moratoriums on loan payments and extensions for payment of utility bills. Small factories with less than 500 workers did not avail these benefits as much as larger factories that have more than 2500 workers due to complicated application procedures or because they were not members of BGMEA or BKMEA.7
As factories reopened in May, 2020, after the Covid-19 lockdown, suppliers followed health and safety protocols through temperature screening, physical distancing, and provision of PPE kits to workers. But such protocols were violated within a few weeks leading to the spread of Covid-19 in certain garment factories.
Throughout the Covid-19 crisis in 2020, supplier associations like the BGMEA appealed to brands to honour their contractual obligations, even as they passed the impact of brands’ irresponsible purchasing practices to workers through unfair dismissals or layoffs that disproportionately targeted unionised workers. In many cases, garment workers who took part in protests demanding fair wages and bonus were not only dismissed but also blacklisted, making it difficult for these workers to find jobs in other garment factories.
Section 4: Wage Theft, Unfair Dismissals And Union Busting
1. Wage Theft EstimatesWorkers who were unfairly dismissed during the Covid-19 crisis suffered massive wage theft, with our survey indicating that 271
“
”
“I was terminated in May with the factory management stating that they can’t keep us employed as brands had cancelled orders. However, it was mostly union members like me who were terminated. I did not
receive any severance benefits, even though I had worked for 3 years in the factory.
I was unable to find another job till July. However, I was terminated from it by November, as the factory management
said that the orders had gone down again. I have not been able to find another job since
then. Life was very difficult for garment workers like me before the pandemic – but it has become unbearable now, especially since I have not been able to find regular
work and my husband has been unwell and unable to work from September. I have not
been able to pay rent on time since April and the landlord is constantly threatening to evict my family. I have stopped sending
my oldest daughter to school this year, as we could not afford the cost of her schoolbooks. She is helping meet our
daily expenses by selling vegetables in the market. We have taken around 30,000 BDT (355 USD) as debt since March to meet rent
and the health expenses of my husband. I am worried we will be on the streets, if I
can’t find another job soon.”
- Amira, a 36-year-old garment worker who worked at a Levi’s supplier factory
garment workers across 21 factories were denied 95,229 USD as unpaid wages and bonus in 2020.

142
Extent of Wage Theft
• 99% of workers surveyed
reported that they had
experienced wage theft
during 2020.
• Workers reported an
overall wage theft of 27%
in 2020, with a very sharp
decline in wages by 60% in
November and December,
2020 (Figure 8.4). Many trade
union members, especially
workers who took part
in protests for unpaid
wages and bonus between
April and May, 2020, were
unfairly dismissed in
November and December,
as orders from global brands
fell, leading to high wage
theft.
• 28% of the unfairly
dismissed workers could
not find employment in the
garment industry in 2020
(Figure 8.5).

143
21Factories surveyed
95,229Actual wage theft (USD)
4,140Actual wage theft per factory (USD)
271Workers surveyed
Wage Theft Figures
For surveyed workers

144
Figure 8.4: Trend in actual wage theft, 2020
Figure 8.5: Composition of employment status, 2020
2. Forms Of Wage TheftWage theft is endemic in garment supply chains due to power asymmetry between brands, suppliers, and workers. Brands force suppliers to drive down production costs and suppliers in turn pass this down to workers through various forms of wage theft. The Covid-19 pandemic witnessed an escalation of wage theft in Bangladesh, such as: (A) targeted dismissal of unionised women workers and (B) theft of social security benefits and Eid bonus.
A. Targeted Dismissal Of Unionised Women Workers
• All workers surveyed
reported suffering from
employment shocks in the
form of unfair dismissals.
• 85% of the workers who got
dismissed did not receive
any termination benefits,
and the remaining received
only partial benefits.
In Bangladesh employers have in the past resorted to unfair dismissals, false criminal charges, blacklisting of union members, and fostering of company-controlled “yellow” unions to curb unionisation among workers. For example, in 2017, more than 1500 garment workers in the Ashulia industrial area were fired and had to face police action, for protesting against low wages. In 2020, as brands cancelled orders and cut prices, suppliers used the Covid-19 crisis as a pretext to escalate union-busting through targeted dismissals of union members.
48% of the unfairly dismissed workers were trade union members. Of these, around 20% were actively involved in protests demanding unpaid wages and bonus between April and May, 2020. These workers were terminated without severance benefits in November and December, 2020, when orders from global brands fell again.
Among trade union members who were unfairly dismissed, 63% were women
3000
6000
9000
12000
15000
December
NovemberOctober
SeptemberAugustJulyJuneMayApril
Source: Primary data, n = 271
Figure 8.2 : Trend in actual wage theft
US
D
Figure 8.3: Employment status, 2020
Source: Primary data, n = 271
28%Unfairly Dismissed(Did not find Employment)
72%Unfairly Dismissed
(Found Employment)

145
workers. None of these women workers received full severance benefits. As per Bangladesh labour laws, workers who are laid off for more than 45 days can either be laid off for another 15 days or legally retrenched. Suppliers resorted to the latter option to avoid paying compensation to workers for the layoff period. Moreover, ground reports indicate that suppliers forced workers to resign to avoid paying workers their legally mandated termination benefits.
54% of the women union members who were dismissed were unable to find alternate jobs in the garment industry in 2020, with some reporting that this was because they got blacklisted for protesting against unpaid wages and bonus. Some of these workers have moved to more informalised jobs such as construction work and street hawking.
B. Theft Of Social Security Benefits And Eid Bonus
The non-payment or partial payment of
bonuses constitutes another form of wage theft in Bangladesh during the pandemic period. In Bangladesh, most workers in surveyed factories generally receive an annual bonus during Eid, which is 50 to 70% of their monthly wages. The non-payment of bonuses had triggered huge protests in Bangladesh in the midst of the Covid-19 crisis and forced at least some suppliers to take note of workers’ demands, leading to payment of Eid bonus, even though it was delayed or given in instalments in many cases.8
Section 5 - An Unfolding Humanitarian CrisisAs the actions of brands resulted in extensive wage theft through unfair dismissals over the course of 2020, workers and their households were pushed deeper into poverty. Workers surveyed in Bangladesh had worked an average of 3.15 years in the same factory, but earned poverty-level wages, leaving them without any savings to help them tide over the crisis. As a result, they were forced to resort to: (a) reduction in consumption; (b) increase in indebtedness; and (c) sale of assets.
• Workers who belonged to the category ‘unfairly dismissed (found employment)’ saw a sharp fall in wages and proportionally higher amount of debt during April-May, after which both wages and debt levels recovered to pre-pandemic levels (Figure 8.6).
• For workers who belonged to the category ‘unfairly dismissed (did not find employment)’, wages fell sharply from 110 USD in the pre-pandemic period to 37 USD at the end of the year, forcing workers to linearly increase their rate of borrowing to finance their consumption throughout the year.
• No worker in the survey
had access to social security
benefits even before the
pandemic. This trend
continued throughout 2020.
• 35% of the workers did not
receive Eid bonus in 2020,
while all these workers
stated that they received it
in 2019. For workers who
received the bonus, the
average bonus amount fell
from 85 USD in 2019 to 65
USD.

146
1. Unfair Dismissals: A Pathway To PovertyOur survey indicates that:
• Monthly wages for garment workers remained much below the international poverty line even before the pandemic. In April-May, there was a sharp decline in wages and household income of garment workers in Bangladesh due to the Covid-19 crisis, pushing them further below the poverty line (Figure 8.7). Though wages recovered to pre-pandemic levels for those workers who were dismissed and able to find employment in June-October, the condition of dismissed workers who could not find new jobs, consistently deteriorated throughout the year to the extent that they were pushed below the extreme poverty line (living on less than $1.90 a day), which is the lowest yardstick of poverty measurement by the World Bank.
• In 2020, even household income, which includes total income of all earning members of the household, falls short
Figure 8.6: Trend in wages, consumption and debt
US
D
0
50
100
150
200
DebtConsumptionWages
Unfairly Dismissed(found employment)
Unfairly Dismissed(did not find employment)
Source: Primary data, n = 271
November-December
June-OctoberMarch-May
January-February
November-December
June-OctoberMarch-May
January-February
“
”
“When I was dismissed from the factory in April, I was neither paid full wages for March
nor any severance benefits. My sister and mother, who also work in garment factories,
were terminated the same month. With a family of six to support, we sold my mother’s wedding jewellery just to buy food and repay
existing debt. In June, our landlord evicted us, as we had not paid rent for three months. We have since then moved to a single room house owned by my uncle in a neighbouring slum. The roof is leaking, there is no proper door and attached toilet- but I was grateful we are at least not on the streets. I was able to find work in another garment factory between
June and October – but I was terminated by November, stating orders were low. My sister
and mother are selling vegetables in a cart, but the income is very low. We are earning less than half of what we earned in 2019.”
- Fathima, a 34-year-old garment worker who worked at a Walmart supplier factory

147
Figure 8.7: Trend in monthly wages with reference to international poverty line (World Bank, 2020)
Figure 8.8: Trend in monthly household income with reference to AFWA living wage, 2020
DebtConsumptionWages
0
50
100
150
200Poverty Line at 3.2 PPP USDWage
Poverty Line at 3.2 PPP USDWage
November-December
June-OctoberMarch-May
January-February
November-December
June-OctoberMarch-May
January-February
reference to international poverty line (World Bank), 2020
Unfairly Dismissed(did not find employment)
Unfairly Dismissed(found employment)
US
D
Source: Primary data, n = 271
Fig 8.6: Trend in monthly household income with reference to AFWA living wage, 2020
100
200
300
400
500
600AFWA Living WageHousehold Income
AFWA Living WagesHousehold Income
November-December
June-OctoberMarch-May
January-February
November-December
June-OctoberMarch-May
January-February
US
D
Source: Primary data, n = 271
Unfairly Dismissed(did not find employment)
Unfairly Dismissed(found employment)

148
Figure 8.9: Age-wise distribution of wages
2. An Inability To Meet Basic Needs
“
”
“I was laid off first in April and then in November and December. I did not receive
any financial support from the factory during these months. The year 2020 has been extremely difficult for my family as
my 18-year-old sister who was a helper in a garment factory was terminated in April
and has been unable to find another job. As we lost both our parents, and live with our grandparents, the financial responsibility of my family falls completely on my shoulder.
My sister and I were working to help fund our brother’s education. We both
could not finish schooling due to financial constraints, but we wanted him to at least complete school and find a better paying
job. This year, with our income being less than half of what we earned in 2019, we could no longer fund his education. He
dropped out of school and he is working in a mill now. Thinking about this makes
me really sad – like all my hopes and aspirations are gone.”
- Fara, a 22-year-old garment worker who works at an H&M supplier factory
10 20 30 40 5050
100
150
200
Wage
Fig 8.7: Age-wise distribution of wages
Source: Primary data n=271
Mo
ntly
Wag
es in
US
D
Age
when AFWA’s living wage figure is considered (Figure 8.8) This shows the extent of precarity faced by garment workers and their families.
• Wages of garment workers have remained stagnant as the age-wise distribution of wages shows that middle-aged workers do not have higher wages, as compared to younger workers (Figure 8.9).

149
• For workers in the category
‘unfairly dismissed (did not
find employment)’, total
consumption reduced by
nearly 8% over the course
of the year falling from an
average of 155 USD prior to
the pandemic, to an average
of 143 USD in December
2020 (Figure 8.10). For
workers in the category
‘unfairly dismissed (found
employment)’, household
consumption remained
at the pre-pandemic
subsistence level of 155 USD,
throughout the year.
• Some of the workers who
were dismissed and could
not find any alternative
employment in 2020, stated
that they could not pay for
Covid-19 treatment of their
children or spouses due to
loss of income. Further,
family members of these
workers cut short on
medicines for diabetes and
hypertension, and pregnant
women avoided prenatal
checkups and tests to save
money for food.
• Twelve workers who were
unfairly dismissed, all of
whom were helpers, stated
that their children were
forced to drop out of school
within two months of their
dismissal, with most such
children employed in street
hawking, earning around
3000 BDT (35 USD) per
month.
• Twenty-two unfairly
dismissed workers who
were unemployed for over
four months, informed us
that they may be homeless if
Most garment workers surveyed are primary breadwinners. The loss of wages of the primary breadwinner of the family forced households to rely on debt to pay for survival needs such as food and accommodation, and compromise on healthcare and education.
Figure 8.10: Trend in monthly household consumption, 2020
100
150
200
Unfairly Dismissed(did not find employment)
Unfairly Dismissed(found employment)
November-DecemberJune-October
March-MayJanuary-February
Source: Primary data n=271
US
D
Figure 8.8: Trend in monthly household consumption, 2020

150
they are not employed within
the next three months.
• All unfairly dismissed
workers who could not find
any alternate employment
in 2020 reported that most of
the assets that they possessed,
including jewellery, furniture
and household appliances, have
been sold during this crisis to
meet basic consumption needs,
including food, healthcare and
rent.
Wages met just around 75-80% of household consumption prior to the pandemic and debt financed around 3% of their consumption (Table 8.1).
In April-May, wages met 62% of the household consumption while the share of debt rose to 23%.
Workers belonging to the category ‘unfairly dismissed (did not find employment)’ financed more than half of their consumption through debt at the end of the year, precipitating an unprecedented household debt crisis.
Table 8.1: Share of wages and debt in consumption
Unfairly dismissed (Found employment)
Share of Wages in Consumption
Share of Debt in Consumption
January-February 74% 3%
March-May 57% 27%
June-October 76% 3%
November-December 75% 3%
Unfairly dismissed (Did not find employment)
Share of Wages in Consumption
Share of Debt in Consumption
January-February 81% 3%
April-May 67% 17%
June-October 58% 31%
November-December 32% 52%

151
3. Household Debt Crisis
Figure 8.11: Trend in household debt by employment status
99% of all workers surveyed reported that they had taken debt during the pandemic. For workers in the category ‘unfairly dismissed (found employment)’ debt had increased only during the lockdown months when the income also declined (Figure 8.11). This period saw an increase in debt from 5 USD at pre-pandemic level to 41 USD during April- May, after which it declined. For workers in the category ‘unfairly dismissed (did not find employment)’, however, the average debt increased drastically from USD 5 in the pre-pandemic period to USD 75 by the end of the year.
The majority of workers reported taking loans to meet the most basic needs of food, housing and health, with 87% of workers stating that they took loans to meet their food consumption requirements (Figure 8.12). Most workers (88%) took loans from informal sources of credit, as they did not possess
0
10
20
30
40
50
60
70
80
Unfairly dismissed(Did not find employment)
Unfairly dismissed(Found employment)
Nov-DecJun-OctApr-MayJan-Feb
US
D
Figure 8.9: Trend in household debt by employment status
Source: Primary data n=271

152
“
”
“My factory closed down in April, without paying us our full wages since January 2020
and denying us any severance benefits. Though I had worked in the factory for two years, I was neither able to take paid leaves
nor did we have any access to maternity benefits. Though I used to earn around 10,000 BDT (119 USD) a month with
regular overtime work, I never received our wages on time – with the management paying us as and when they wished. Despite
all these hardships, I stayed on the job as I wanted to support my father who
suffers from heart disease. The day I was terminated – I could not but cry in despair,
not knowing how I will meet his health expenses along with rent and food, in the coming months. The fear I felt then can’t be described. With all the rumours of the Covid-19 virus spreading on one side and
without any money and not knowing when I will be able to secure another job – I felt that we would die soon. It took me two months to find another job in a garment
factory, but by then we had borrowed 15000 BDT (178 USD). I have been buying food and medicine on credit since April. I
cut my meals to once a day in May, so that I could meet my father’s medical bills. I slept hungry most nights. We would have never had to cut our food and borrow so much money had the factory paid me my full
wages and severance benefits.”
- Inaya, a 24-year-old garment worker who worked at a NEXT supplier factory
relatives, in particular store owners or labour contractors, who lived in their neighborhood. While some reported that these loans were interest free, others stated that they were borrowed at 8-10% interest. Workers who borrowed from labour contractors stated that if they are unable to repay debt on time, they would have to do unpaid labour for these contractors, sometimes for as many days as the contractor wishes, which could then take the form of bonded labour.
Figure 8.12: Reasons for incurring debt, 2020
Figure 8.13: Sources of debt, 2020
the collateral to take loans from banks or microfinance agencies (Figure 8.13).
More than half (62%) the workers stated that they took loans from neighbours, friends, and
87%Food
10%Rent
2%Others
1%Health
Source: Primary data n=271
Figure 8.10: Reasons for incurring debt, 2020
Figure 8.11: Sources of debt, 2020
0
10
20
30
40
50
60
70
Co-WorkersBanks/MicrofinanceMoneylenderNeighbour/Friends/Relatives
Per
cent
age
of
Wo
rker
s
Source: Primary data n=271
62%
22%
12%
4%
153
Section 6: 2021 - The Tragedy Repeats The Covid-19 crisis worsened in 2021 and the Bangladesh government imposed a strict lockdown in April. Garment factories were allowed to operate, considering the vital importance of the industry in sustaining the economy and also because suppliers feared another round of order cancellations by brands if production halted.9 However, restrictions on mobility amidst the lockdown caused a lot of distress to workers as suppliers stopped providing bus transportation to workers. Unions raised concerns that safety protocols were not properly followed in garment factories, putting workers and their families at grave risk.10
Focus group discussions conducted by AFWA in mid-2021 indicate that consumption levels of all workers have worsened, regardless of their employment status. Bangladesh’s healthcare system is under severe strain and garment workers are extremely vulnerable to contracting Covid-19. Workers say that brands have not stepped forward to protect them, even as they continue to produce their clothes, and have left them to fend for themselves in the absence of formal social security coverage.
Even during the crisis, brands have refused to renew the legally binding Accord on Fire and Building Safety that came into effect after the Rana Plaza disaster and expired this year, renewing debates about corporate accountability in garment supply chains.11 The consequence of these practices is disproportionately borne by workers, who are paid poverty-level wages for working in unsafe factories.

154
References
1 IHRB & Chowdhury Center for Bangladesh studies at UC Berkeley. (2021). The Weakest Link in the Supply Chain - How the Pandemic is Affecting Bangladesh’s Garment Workers. Retrieved from https://www.ihrb.org/uploads/reports/IHRB__Chowdhury_Center_-_How_the_Pandemic_is_Affecting_Bangladesh_Garment_Workers_-_Apr_2021.pdf
2 Anner, M. (2020). Abandoned? The Impact of Covid-19 on Workers and Businesses at the Bottom of Global Garment Supply Chains. PennState Center for Global Workers’ Rights. Retrieved from https://www.workersrights.org/wp-content/uploads/2020/03/Abandoned-Penn-State-WRC-Report-March-27-2020.pdf
3 Bangladesh Garment Manufacturers and Exporters Association. (2020, July). Comparative Statement on Export of RMG & Total Export of Bangladesh. Retrieved from https://www.bgmea.com.bd/export-performances/
4 Karim, N. (2020, April 5). Thousands of Bangladeshi garment workers ordered home as factories stay closed. Reuters. Retrieved from https://www.reuters.com/article/us-health-coronavirus-bangladesh-workers/thousands-of-bangladeshi-garmentworkers-ordered-home-as-factories-stay-closed-idUSKBN21N0QU
5 Uddin, Z. (2020, May 3). Garment workers’ salary disbursement from stimulus package starts from today. The Daily Star. Retrieved from https://www.thedailystar.net/business/news/garment-workers-salary-disbursement-stimulus-package-starts-today-1898938?browserpush=true
6 Glover, S. (2020, September 10). Cash support for Bangladesh’s garment workers. Ecotextile News. Retrieved from https://www.ecotextile.com/2020091026658/materials-production-news/cash-support-for-bangladesh-s-garment-workers.html
7 CPD-MiB. (2021, January 23). Vulnerability, Resilience and Recovery in the RMG Sector in view of COVID Pandemic: Findings from the Enterprise Survey. Retrieved from https://cpd.org.bd/wp-content/uploads/2021/01/Presentation-on-Vulnerabiliies-Resilience-and-Recovery-in-the-RMG-Enterprsies-.pdf
8 The Business Standard. (2020, May 18). Thousands of RMG workers demonstrate for salary, bonus. Retrieved from https://www.tbsnews.net/economy/rmg/thousands-rmg-workers-demonstrate-salary-bonus-82885
9 Dhaka Tribune. (2021, April 18). Why RMG factories were kept open during lockdown. Retrieved from https://www.dhakatribune.com/business/2021/04/18/why-rmg-factories-were-kept-open-during-lockdown
10 Dhaka Tribune. (2021, April 18). Why RMG factories were kept open during lockdown. Retrieved from https://www.dhakatribune.com/business/2021/04/18/why-rmg-factories-were-kept-open-during-lockdown
11 Guardian( 2021, April 22). Bangladesh clothing factory safety deal in danger, warn unions. Retrieved from https://www.theguardian.com/world/2021/apr/22/bangladesh-clothing-factory-safety-deal-in-danger-warn-unions

155
Typology Of Managerial Practices And Wage Theft In Global Garment Supply Chains
The manufacturing of garments, outsourced by brands, follows an intrinsic trend of movement towards regions with poverty-level minimum wages and low labour law enforcement regimes. Wage theft is a key feature of global garment supply chains that are driven by deeply entrenched management practices through which global apparel brands earn super-profits. These management practices orient global garment supply chains solely towards creating risk-free businesses for brands, by allowing them to use their power and leverage over their supply chains to transfer risks associated with manufacturing for volatile consumer markets to suppliers, and ultimately, workers in production countries. The broad management practices, starkly demonstrated during the pandemic, are to (i) unilaterally exercise cost-cutting decisions that affect suppliers and workers, (ii) refuse cost-sharing in the consequences arising out of the pandemic-induced recession, and (iii) leverage jurisdictional and governance weaknesses in production regions to shift liability.
During the pandemic-induced recession, brands unilaterally engaged in aggressive actions including order cancellations or reductions in new orders, demand for discounts, deferring of payments, refusal to pay, and demanding shorter lead times. This resulted in suppliers engaging in harmful employment practices that passed on the
costs of such aggressive actions of brands to workers as extreme wage theft. During the recession, suppliers engaged in widespread layoffs of workers without payment and illegal terminations as a response to a contraction in their businesses.
These management practices modelled by brands within their supply chains have, therefore, resulted in a ‘cascade effect’ through which the unilateral and aggressive actions of brands towards their suppliers are converted into harmful employment practices towards workers in their supplier factories. The management decisions of brands, therefore, caused and contributed to the unprecedented wage theft experienced by workers in their supply chains, the majority of whom were women workers receiving poverty-level wages. Table 9.1 summarises the impact of brand actions on workers employed in their supplier factories across six countries during the pandemic-induced recession.
Most of the suppliers have long-term, dedicated relationships with brands and have made investment decisions, sometimes jointly, to build capacity for production based on the brands’ commitments. This is captured in the contract for manufacturing entered between suppliers and brands. Most of the suppliers exclusively produce for brands who have no production capacity of their own. In order to undertake

156
Table 9.1: Impact of brand actions on poverty levels, employment, wages and debt of workers, 2020
Country
% Workers pushed below International Poverty Line (during peak Covid-19 period)
% Loss in Work Days
% Wage Theft
Wage Theft Estimates per factory (Million USD)
% Increase in Debt
Sri Lanka 78% 21% 23% 1.38 200%
Pakistan 81% 26% 29% 2.2 196%
Indonesia 78% 20% 21% 0.73 198%
India 93% 26% 23% 1.15 137%
Cambodia* 10% 6% 6% 0.7 64%
Bangladesh 96% 23% 27% N/A 202%
Source: Primary data, n = 2185
production for the brands, suppliers enter into contract of employment with workers under employment laws in their countries. The nature of contract for manufacturing between brands and suppliers shapes, conditions and controls the employment contracts between suppliers and workers. It is therefore evident that the contract for manufacturing and employer contract are linked.
In fact, in the context of export-oriented economics, the contract for manufacturing makes suppliers extremely dependent on brands for their capacity utilisation. Suppliers are acutely vulnerable to the power of brands due to their consistently low
margins in contract manufacturing. Across surveyed countries, suppliers’ management of labour were constrained by the contract of manufacturing – in other words, by the management practices set by the brands. This linking up of brands’ management practices and suppliers’ labour management practices can be described as a ‘cascade effect.’ It resulted in various harmful employment practices in brands’ supplier factories that culminated in different forms of wage theft for workers.
* The minimum wage for Cambodian garment workers have significantly increased in recent years, more than doubling from 80 USD per month in 2013, to 190 USD in 2020, due to tremendous organising efforts by trade unions like CATU and C.CAWDU, allowing workers to earn wages above the International Poverty Line. The government order to pay 70 USD per month to workers during layoff (or suspension of contract) ensured that workers received at least part of their wages. The wage theft and resultant crisis facing garment workers in Cambodia was, therefore, lower in comparison to other countries.

157
Table 9.2: Cascading effect of brand actions on suppliers’ employment practices
Exercise of Managerial Power and Leverage over Workers
Employment Practices Forms of Wage Theft
1. Malafide Use of Power to Change Employment Status
• Failure to recognise seniority of workers (such as rehiring older workers on fresh contracts or termination of senior workers without following due process)
• Replacing more secure employment with more precarious employment (such as rehiring regular workers as contractual or casual workers)
• Wrongful designation of permanent workers as short term contract workers
• Reduction in wages due to demotion
• Reduction in employment-related benefits due to shift in contract type
2. Arbitrary Practices to Impose Flexibility of Workforce
• Layoffs and termination to reduce size of workforce
• Coercive intensification of work by smaller workforce
• Extension of the work day of smaller workforce
• Loss of terminal benefits
• Loss of wages
• Unpaid/underpaid overtime
3. Use of Deceptive Practices to Evade Liability Under Labour Law
• Manipulation of work-related documentation (such as mis-reporting of reduction in wages, number of work days, number of overtime hours)
• Termination or wage theft under the guise of disciplinary action (such as in the case of workers for joining protests, taking sick leaves or being unable to rejoin work on the date set by the employer due to Covid-19 restrictions)
• Loss of wages
• Unpaid or underpaid overtime
• Loss of terminal benefits

158
4. Unethical Practices to Leverage Vulnerability in Workforce Demographics
• Replacement or termination of pregnant workers, older workers, union leaders & members, female workers over male workers.
• Rehiring of male workers over female workers; and non-union members over union members.
• Layoff of female workers over male workers.
• Layoff of contractual and casual workers over regular workers.
• Forcing casual or contract workers to work longer hours without payment.
• Loss of terminal benefits
• Loss of wages
• Rising gender pay gap
• Rising wage gap between regular, contractual and casual workers
• Coercive extraction of unpaid labour
5. Blatant Leveraging of Weak Enforcement Mechanism
• Blatant reduction or denial of bonus, social security, provision of creches, etc.
• Loss of key provisions of security
The restitution of rights of workers is not possible within unregulated supply chains, where power is concentrated with brands and extreme disregard for basic justice persists as a result of jurisdictional and governance weaknesses in production countries. Rather, it requires mechanisms through which workers and their unions can hold brands accountable for labour rights violations, and that can counter-balance the egregious management principles of brands as the sole drivers of their supply chains. The regulation of global garment supply chains must cover for jurisdictional and governance weaknesses in production countries by mandating brands to move beyond compliance to national laws and reliance on local enforcement mechanisms to upholding international labour standards
and normative frameworks within global garment supply chains. Such a mechanism must be contextualised within a paradigmatic shift in the understanding of global supply chains – which cannot be viewed as markets for the sales and purchase of apparels. Brands are able to exercise managerial power and leverage over their suppliers, and consequently workers in their supply chains, but evade liability through the alibi of being ‘buyers’ who are seemingly unaccountable for the employment contracts of workers. The employment relationship embedded within the transnational commercial relationships of brands, their suppliers and workers must be recognised.
159
Wage Theft In The Supply Chains Of 15 Global Apparel BrandsThe majority of top global apparel brands, who command the largest market shares and revenues, remained profitable in 2020, as they shifted to digital marketing and online sales, leading to some recovery in their sales over the course of the year. Workers in the supply chains of these brands continued to face the brunt of the crisis throughout 2020, and well into 2021, as they subsidised the stabilisation and recovery of brand profits by absorbing the costs passed on to them in the form of employment loss and wage theft.
Several brands only agreed to the bare minimum of withdrawing their aggressive and unilateral actions, such as order cancellations and refusal to pay in full for existing orders, after prolonged campaigning by the global labour movement, and demands by suppliers and production country governments. However, these commitments came too late, with no evidence pointing to the reversal of wage theft or its devastating human rights consequences on workers and their households. Several global campaigns have asked brands to act over and above this minimal responsibility, and commit to paying workers their wages and severance benefits. Brands have largely refused to guarantee protection for workers in their supply chains, even though it constitutes only a miniscule proportion of their overall costs.
The ILO Call to Action (CtA),1 which was launched at the peak of the pandemic crisis, initially provided hopes that brands would be called to account for the conditions of workers in their supply chains. However, the ILO CtA did not mandate financial commitments from brands, but merely required them to commit to work with governments and financial institutions to mobilise funds. The fund made available for garment workers through the ILO CtA is largely financed by the European Union and the German government. Even though it has been more than a year since the introduction of the initiative, very few workers in select Asian garment production countries have been deemed eligible for receiving the fund. The fund, which represents only a small portion of the wages denied to workers, do not make up for the extreme wage theft in affected countries. Endorsing the ILO CtA has allowed brands to take cover behind rhetorical statements and avoid accountability for their actions.2
Ultimately, it was the fiscal measures adopted by production country governments, along with some contributions from Global North governments through the ILO CtA, that made funds available to garment workers. However, these contributions remained grossly inadequate to make up for the harmful actions of brands or cover for the lack of brand contribution towards workers’ wages and benefits.
This section summarises the impact of brands’ actions in the form of wage theft and its human rights consequences for garment workers. It organises brands by their performance in terms of revenue, and places it in the context of the extreme crisis facing workers in their supplier factories.

160
“
”
“I have not been able to pay rent on time since March and the landlord is constantly threatening to evict my family. I have stopped sending my oldest daughter to school this year, as we could not afford the cost of her school books. She is helping meet our daily
expenses by selling vegetables in the market.”
- worker who was unfairly dismissed from a Walmart supplier factory in Bangladesh
• Revenue: 559 billion USD (January 2021)3
• CEO’s total compensation (2020): 22.5 million USD, with the pay of top executives in the company reaching a total of 80 million USD4
• Asda (the UK based subsidiary of Walmart) did not commit to paying in full for cancelled orders and demanded price reductions for orders that were already shipped.5
Workers across 26 Walmart supplier factories in Bangladesh, Cambodia, India, Indonesia, and Pakistan reported (2020):
• Range of monthly wages: 80 USD (Bangladesh) to 220 USD (Cambodia)
• 18% loss in working days
• 18% reduction in monthly wages
76,631Actual wage theft (USD)
86 MillionWage theft estimates (USD)
• 82% of the workers’ wages fell below the international poverty line during peak pandemic months in their countries.
• 63% increase in the household debt of workers
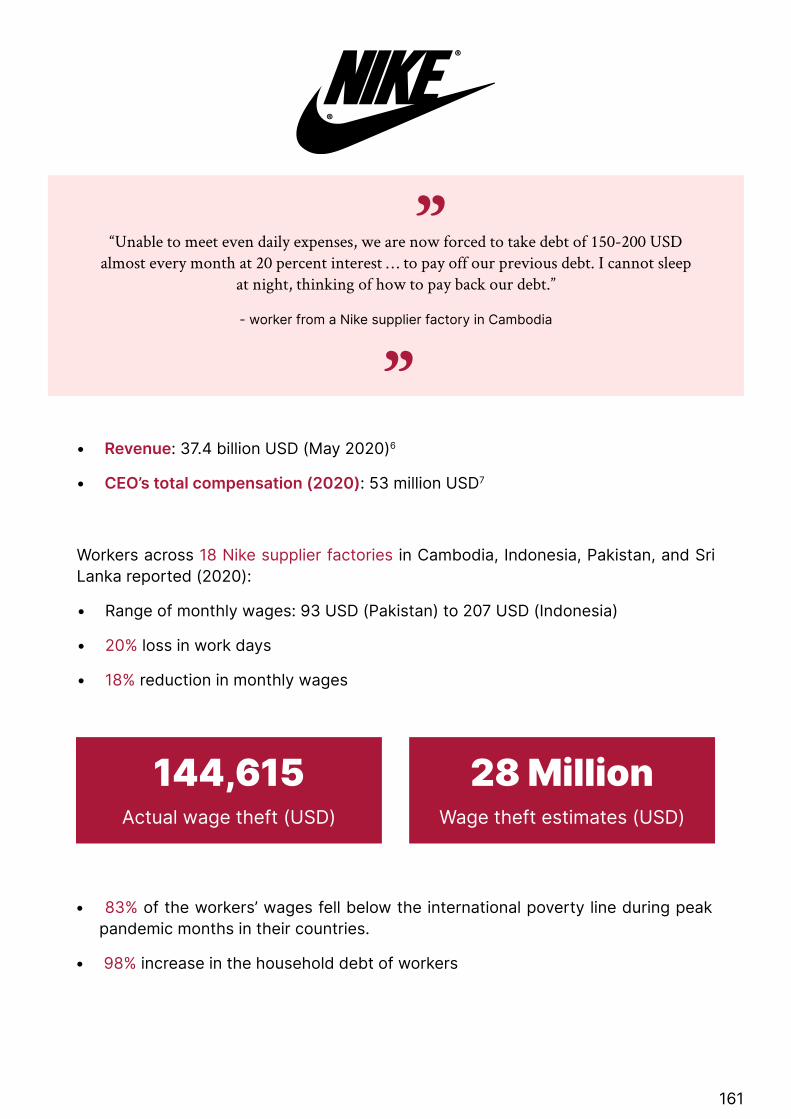
161
“
”
“Unable to meet even daily expenses, we are now forced to take debt of 150-200 USD almost every month at 20 percent interest … to pay off our previous debt. I cannot sleep
at night, thinking of how to pay back our debt.”
- worker from a Nike supplier factory in Cambodia
• Revenue: 37.4 billion USD (May 2020)6
• CEO’s total compensation (2020): 53 million USD7
Workers across 18 Nike supplier factories in Cambodia, Indonesia, Pakistan, and Sri Lanka reported (2020):
• Range of monthly wages: 93 USD (Pakistan) to 207 USD (Indonesia)
• 20% loss in work days
• 18% reduction in monthly wages
144,615Actual wage theft (USD)
28 MillionWage theft estimates (USD)
• 83% of the workers’ wages fell below the international poverty line during peak pandemic months in their countries.
• 98% increase in the household debt of workers

162
“
”
“… pursued by loan sharks charging 20-30 percent interest … my husband and I decided to sell the small paddy field we owned in our village. We own nothing now except for
some jewellery, which too we might have to sell if this crisis continues,”
- worker from an Inditex supplier factory in Cambodia
• Revenue: 3.4 billion USD (January 2021)8
Inditex is owned by the second wealthiest individual in Europe, with total net worth increasing by 28% from April 2020 to 77 billion USD in April 2021.9
Workers across 13 Inditex supplier factories in Bangladesh, Cambodia, and Pakistan reported (2020):
• Range of monthly wages: 81 USD (Bangladesh) to 135 USD (Cambodia)
• 23% loss in work days
• 23% reduction in monthly wages
60,585Actual wage theft (USD)
143 MillionWage theft estimates (USD)
• 70% of the workers’ wages fell below the international poverty line during peak pandemic months in their countries.
• 34% increase in household debt of workers, from a high debt level of 272 USD pre-recession to 365 USD by the end of 2020

163
“
”
“After the no-work-no-pay policy started in my factory, I work only 14-18 days a month … My wages have now fallen by more than 25 percent a month.”
- worker from an Adidas supplier factory in Indonesia
• Revenue: 2.6 billion USD (December 2020)10
Workers in 15 Adidas supplier factories across Cambodia, India, Indonesia, and Pakistan reported (2020):
• Range of monthly wages: 96 USD (Pakistan) to 271 USD (Indonesia)
• 15% loss in work days
• 21% reduction in monthly wages
52,785Actual wage theft (USD)
320 MillionWage theft estimates (USD)
• 82% of the workers’ wages fell below the international poverty line during peak pandemic months in their countries.

164
“
”
“… the pay [in H&M supplier factory] could not support the needs of my family, especially as food and education costs increased. Now, I work as a tailor in a micro enterprise 3 days a
week, 9 hours a day while also working as a domestic worker on the weekends.”
- worker who was forced to resign from an H&M supplier factory in Indonesia due to steep decline in wages
• Revenue: 19.1 billion USD (November 2020)
Workers across 49 H&M supplier factories in Bangladesh, Cambodia, India, Indonesia, Pakistan and Sri Lanka, reported (2020):
• Range of monthly wages: 76 USD (Bangladesh) to 209 USD (Cambodia)
• 28% loss in work days
• 27% reduction in monthly wages
306,398Actual wage theft (USD)
189 MillionWage theft estimates (USD)
• 89% of the workers’ wages fell below the international poverty line during peak pandemic months in their countries.
• 79% increase in household debt of workers

165
“
”
“… my income fell from around 200 USD to 70 USD per month. My husband also got laid off in the same time … Our debt is almost thrice our income now and we have
no money to meet any emergency expenses, except by borrowing more from private lenders.”
– worker from a GAP supplier factory in Cambodia
• Revenue: 13.8 billion USD (January 2021)11
• CEO’s total compensation (2020): 21.9 million USD12
Workers across 28 GAP supplier factories in Bangladesh, Cambodia, India, Indonesia, Pakistan and Sri Lanka reported (2020):
• Range of monthly wages: 85 USD (Bangladesh) to 105 USD (India)
• 26% loss in work days
• 24% reduction in monthly wages
100,927Actual wage theft (USD)
633 MillionWage theft estimates (USD)
• 85% of the workers’ wages fell below the international poverty line during peak pandemic months in their countries.

166
“
”
“My 17-year-old son was forced to give up his education to work in odd jobs because my wages were no longer enough to support the entire family. There was no certainty when
I would be laid off or have to take unpaid leave during the pandemic”.
– worker from a Marks & Spencer supplier factory in Sri Lanka
• Revenue: 13.1 billion USD (April 2021)13
Workers across 17 Marks & Spencer supplier factories in Bangladesh, Cambodia, India, Indonesia, Pakistan and Sri Lanka reported (2020):
• Range of monthly wages: 78 USD (Pakistan) to 158 USD (Cambodia)
• 15% loss in work days
• 14% reduction in monthly wages
60,093Actual wage theft (USD)
23 MillionWage theft estimates (USD)
• 78% of the workers’ wages fell below the international poverty line during peak pandemic months in their countries.
• 108% increase in workers’ household debt

167
“
”
“I didn’t receive any wages during the lockdown period in April and May. The wages from March were also pending. We had to go door to door asking our neighbours and
relatives for some spare money so that we could afford food.”
- worker from a VF Corp supplier factory in India
• Revenue: 9.2 billion USD (March 2021)14
• CEO’s total compensation (2020): 16.6 million USD15
Workers across 13 VF Corp. supplier factories in Bangladesh, Cambodia, India, Indonesia and Pakistan reported (2020):
• Range of monthly wages: 97 USD (Pakistan) to 216 USD (Cambodia)
• 23% loss in work days
• 20% reduction in monthly wages
35,727Actual wage theft (USD)
22 MillionWage theft estimates (USD)
• 92% of the workers’ wages fell below the international poverty line during peak pandemic months in their countries.
• 52% increase in workers’ household debt

168
“
”
“…the manager said its better I resign, as they were anyway trying to cut down their workforce. So, I resigned and started selling vegetables at the market, where I could at least take my baby to work. I hardly earn 5000 INR (69 USD) a month now. I wish I
could return to the factory so I could earn more and give my baby more nutritious food.”
- worker who was forced to resign from a PVH supplier factory in India due to the shutdown of creche facilities.
• Revenue: 7.1 billion USD (January 2021)16
• CEO’s total compensation (2019): 17 million USD, with 6 top executives receiving an average compensation of 9.8 USD million from 2006 to 201917
• Workers across 17 PVH supplier factories in Bangladesh, Cambodia, India, Indonesia and Pakistan reported (2020):
• Range of monthly wages: 101 USD (India) to 199 USD (Indonesia)
• 17% loss in work days
• 18% reduction in monthly wages
60,724Actual wage theft (USD)
221 MillionWage theft estimates (USD)
• 72% of the workers’ wages fell below the international poverty line during peak pandemic months in their countries.

169
“
”
“I have been buying food on credit since April, so that I can save some cash to send to my family. I also pawned the only gold necklace I have in July… At least, if the company paid
us for our overtime work, life would not have been this difficult.”
- worker from a Next supplier factory in Sri Lanka who was forced to perform unpaid overtime work
• Revenue: 4.8 billion USD (January 2021)18 (converted from 3.5 billion GBP based on currency conversion rate as of 31 January 2021)
• CEO’s total compensation (2020): CEO’s annual pay more than doubled to a five year high due to bumper share awards.19
• Workers across 14 Next supplier factories in Bangladesh, Cambodia, India, Pakistan, and Sri Lanka reported (2020):
• 22% loss in work days
• 20% reduction in monthly wages
83,130Actual wage theft (USD)
189 MillionWage theft estimates (USD)
• 73% of the workers’ wages fell below the international poverty line during peak pandemic months in their countries.
• 98% increase in workers’ household debt

170
“
”
“I tried to commit suicide soon after I was laid off in May, as I was four months pregnant and had no money to feed myself or my two other children. I have removed my children from school, as I could not pay for their books or their school fees. In October, I had to
take on more debt to meet my pregnancy related expenses. As repaying this debt became difficult, I asked my 15-year-old son to find work in some neighbourhood shops”
- pregnant worker who was laid off without wages from a Levi’s supplier factory in Pakistan
• Revenue: 4.5 billion USD (November 2020)20
• CEO’s total compensation (2020): 10.6 million USD21
• Workers across 31 Levi’s supplier factories in Cambodia, India, Pakistan, and Sri Lanka reported (2020):
• Range of monthly wages: 93 USD (Pakistan) to 252 USD (Cambodia)
• 25% loss in work days
• 23% reduction in monthly wages
140,494Actual wage theft (USD)
82 MillionWage theft estimates (USD)
• 73% of the workers’ wages fell below the international poverty line during peak pandemic months in their countries.
• 98% increase in workers’ household debt

171
“
”
“Our landlord threatened to throw us out during the lockdown if we didn’t pay our rent. I had no wages during the lockdown, and we didn’t have any savings to pay the rent for
those two months. We were barely able to afford our food. We took debt to pay rent and weren’t able to manage more debt to pay medical bills when our child fell ill.”
– worker from an AEO supplier factory in India
• Revenue: 3.7 billion USD (January 2021)22
• CEO’s total compensation (2020): USD 15 million, increasing by 83% from 201923
AEO has not committed to paying in full for existing orders, and imposed a 20% price reduction on certain categories of apparel that were already produced or in the process of production.24
Workers across 9 AEO supplier factories in India, Indonesia, and Pakistan reported (2020):
• Range of monthly wages: 108 USD (Pakistan) to 207 USD (Indonesia)
• 24% loss in work days
• 20% reduction in monthly wages
42,971Actual wage theft (USD)
118 MillionWage theft estimates (USD)
• 66% of the workers’ wages fell below the international poverty line during peak pandemic months in their countries.
• 98% increase in workers’ household debt

172
“
”
“When the factory reopened in June, there was a huge increase in verbal harassment, including name-calling, slut-shaming and constant threats of termination. If we wanted to take even a one-day leave due to any illness, they would shout at us and tell us to just
resign and never return to work.”
- worker from a Primark supplier factory in India who was subject to harassment after returning to work following the lockdown
• Revenue: Not known
• Primark committed to paying 460 million USD in cancelled or existing orders, but did not disclose information on its payments. It took Primark six months to agree to pay for all orders in full.25
Workers across 20 Primark supplier factories in Bangladesh, India, and Pakistan reported (2020):
• Range in monthly wages: 84 USD (Pakistan) to 102 USD (India)
• 32% reduction in the number of working days per month
• 32% reduction in monthly wages
89,935Actual wage theft (USD)
192 MillionWage theft estimates (USD)
• 52% of the workers’ wages fell below the international poverty line during peak pandemic months in their countries.
• 387% increase in the household debt of workers

173
“
”
“…we were asked to work longer hours without additional pay, handling multiple tasks, facing constant verbal harassment. Being in deep debt and knowing we won’t find better jobs, we suffered the insults and long work hours, hoping we won’t be terminated, like
many of our colleagues.”
- worker from a C&A supplier factory in Cambodia who was forced into unpaid overtime during the pandemic
• Revenue: Not known
• C&A is owned by the richest family in the Netherlands, with an estimated net worth of 30 billion USD in 201726
• C&A took seven months to commit to paying in full for existing orders, with orders “put on hold” for this period.27
Workers across 13 C&A supplier factories in Bangladesh, Cambodia, Indonesia and Sri Lanka, reported (2020):
• Range of monthly wages: 69 USD (Bangladesh) to 213 USD (Cambodia)
• 11% loss in work days
• 15% reduction in monthly wages
74,947Actual wage theft (USD)
18 MillionWage theft estimates (USD)
• 79% of the workers’ wages fell below the international poverty line during peak pandemic months in their countries.
• 20% increase in household debt of workers, increasing from as high as 1054 USD before the recession to 1266 USD during the recession

174
“
”
“I couldn’t afford to buy medicines for my father who is suffering from many chronic illnesses during the lockdown, because I lost all my wages overnight. We couldn’t afford healthcare for many months even after the lockdown because we had to use our wages to
pay back the moneylender – we had huge debt from even before the lockdown.”
– worker from a Bestseller supplier factory in Pakistan
• Revenue: Not known
• CEO and sole owner of Bestseller is from one of the richest families in Denmark, with net worth increasing by 39% from April 2020, to 13.2 billion USD in April 2021.28
• Bestseller refused to pay in full for existing orders, and imposed 10% reduction in payments for orders already produced or in the process of production.29
• Workers across 11 Bestseller supplier factories in Cambodia, India, and Pakistan reported (2020):
• Range of monthly wages: 79 USD (Pakistan) to 96 USD (India)
• 31% loss in work days
• 27% reduction in monthly wages
22,729Actual wage theft (USD)
43 MillionWage theft estimates (USD)
• 79% of the workers’ wages fell below the international poverty line during peak pandemic months in their countries.
• 9% increase workers’ household debt - increasing from as high as 389 USD before the recession to 494 USD during the recession.
175
References
1 International Labour Organization (2020). Covid-19: Action in the Garment Industry. https://www.ilo.org/wcmsp5/groups/public/---ed_dialogue/---dialogue/documents/statement/wcms_742371.pdf
2 Mathews, B. (2021). ILO’s Call to action is failing garment workers. Apparel Insider. https://apparelinsider.com/ilos-call-to-action-is-failing-garment-workers/
3 Kohan, S. E. Walmart Revenue Hits $559 Billion for Fiscal Year 2020. Forbes. https://www.forbes.com/sites/shelleykohan/2021/02/18/walmart-revenue-hits-559-billion-for-fiscal-year-2020/?sh=303d9bc23358
4 Clark, E. (2021). Walmart CEO’s Pay Day: Doug McMillon Tops $22 Million Including Stock. Women’s Wear Daily. https://wwd.com/fashion-news/fashion-scoops/walmart-ceo-pay-doug-mcmillon-stock-awards-1234808505/
5 Worker Rights Consortium (2020). Walmart subsidiary Asda abandons suppliers, despite packed stores. https://www.workersrights.org/updates-and-analysis/#May01Asda
6 Nike (2020). Nike, Inc. Reports Fiscal 2020 Fourth Quarter and Full Year Results. https://news.nike.com/news/nike-inc-reports-fiscal-2020-fourth-quarter-and-full-year-results
7 ExecPay News (2020). Nike CEO John Donahoe receives $53M in 2020. https://www.execpay.org/news/nike-inc-2020-compensation-139
8 Forbes (2021). Inditex. https://www.forbes.com/companies/inditex/?sh=534d7a1251e9
9 Forbes (2021). #11 Amancio Ortega. https://www.forbes.com/profile/amancio-ortega/?sh=5c7db415116c
10 Forbes (2021). Adidas. https://www.forbes.com/companies/adidas/?sh=5cd97a8d5e27
11 Gap Inc. (2021). Gap Inc. Reports Fourth Quarter and Fiscal Year 2020 Results; Provides 2021 Outlook. https://www.gapinc.com/en-us/articles/2021/03/gap-inc-reports-fourth-quarter-and-fiscal-year-202
12 Clark, E. (2021). Gap Inc.’s $21.9 Million CEO. Women’s Wear Daily. https://wwd.com/fashion-news/fashion-scoops/sonia-syngal-ceo-pay-compensation-gap-inc-21-9-million-1234790843/
13 Forbes (2021). Marks & Spencer. https://www.forbes.com/companies/marks-spencer/?sh=640c99ca7de1
14 VF Corp. Annual Report Fiscal Year 2021. https://d1io3yog0oux5.cloudfront.net/_5954f2d6ebc3863697055b12e432e20a/vfc/db/409/75634/annual_report/VF_FY2021_DigitalAnnualReport-FINAL.pdf
15 AFL-CIO (2020). Steven Rendle VF Corp. (VFC). https://aflcio.org/paywatch/VFC
16 PVH (2021). Annual Report 2020. https://www.pvh.com/-/media/Files/pvh/investor-relations/PVH-Annual-Report-2020.pdf

176
17 ExecPay (2020). PVH Compensation History. https://www.execpay.org/company/pvh-corp-3404
18 Wall Street Journal (2021). Next PLC. https://www.wsj.com/market-data/quotes/UK/XLON/NXT/financials/annual/income-statement
19 Jahshan, E. (2021). “Next CEO’s pay soars to five-year high of £3.4m despite pandemic woes.” Retail Gazette. https://www.retailgazette.co.uk/blog/2021/04/next-ceo-pay-soars-to-five-year-high-of-3-4m-despite-pandemic-woes/
20 Levi Strauss & Co. (2021). 2020 Annual Report. https://s23.q4cdn.com/172692177/files/doc_financials/2020/ar/Levis_2020-Annual-Report_Final.pdf
21 Salary.com (2020). Charles V. Bergh Executive Compensation. https://www1.salary.com/Charles-V-Bergh-Salary-Bonus-Stock-Options-for-LEVI-STRAUSS-and-CO.html
22 Wall Street Journal (2021). American Eagle Outfitters Inc. https://www.wsj.com/market-data/quotes/AEO/financials
23 ExecPay (2021). American Eagle Outfitters CEO Jay Schottenstein’s 2020 pay jumps 83% to $15M. https://www.execpay.org/news/american-eagle-outfitters-inc-2019-compensation-2503
24 Worker Rights Consortium (2020). American Eagle Outfitters imposed significant retroactive discounts on some suppliers. https://www.workersrights.org/updates-and-analysis/#Nov23AEO
25 Worker Rights Consoritum (2020). Primark confirms full reinstatement of all in-production orders. https://www.workersrights.org/updates-and-analysis/#Sep10Primark
26 Fashion United (n.d.) List of the Richest People in Fashion. https://fashionunited.com/i/richest-people-in-fashion/
27 Worker Rights Consortium (2020). C&A agrees to pay for remaining orders. https://www.workersrights.org/updates-and-analysis/#Oct30CA
28 Forbes (2021). #161 Anders Holch Povlsen. https://www.forbes.com/profile/anders-holch-povlsen/?sh=5ea738932691
29 Worker Rights Consortium (2020). Bestseller suppliers report discounts imposed of up to 10%. https://www.workersrights.org/updates-and-analysis/#Sep30Bestseller
177
The increasing integration of developing countries in Asia into global apparel supply chains has been accompanied by the dominant policy and academic perspective that production countries, supplier factories and workers will benefit from trickle-down growth, and the economic and social upgrading that results from their association with major global apparel brands. The most popular indicator used for measuring the positive developmental impact of global apparel supply chains is the movement of garment workers above the World Bank International Poverty Line. Yet this poverty line has been widely critiqued as a low standard that does not take into account the full range of consumption requirements of workers and their households.1
The pandemic-induced recession and resultant humanitarian crisis facing garment workers has revealed strong evidence that the existing structure of global supply chains is not oriented towards facilitating the development of production countries or alleviating the poverty of garment workers, with the costs of participation in global apparel supply chains outweighing its benefits.
Poverty-level Wages Cause Human Rights Violations Three interrelated conclusions can be inferred from the findings of the report. One, the stagnation of workers’ wages at poverty levels results in the lack of any form of resilience to crisis, causing workers to fall below the poverty line and slip into extreme poverty immediately. Two, wage theft of workers with poverty-level wages
constitutes a human rights violation as workers and their households are forced to reduce consumption below minimum survival levels and incur increased debt, thereby getting trapped in a vicious cycle of poverty and indebtedness. Three, brands caused and contributed to human rights violations of workers in their supply chains through their actions before and during the pandemic-induced recession. The management practices and harmful actions of brands, which are deeply entrenched and legitimised within their supply chains, translated into harmful employment practices in their supplier factories, which in turn led to different forms of wage theft experienced by workers.
Poverty-level wages do not allow workers the flexibility to withstand even short periods of loss of employment and wages without triggering a humanitarian crisis, leading to the reversal of any development gains for workers or production countries. The economy and workforce in the majority of Asian production countries are highly dependent on garment exports, making them even more vulnerable to crisis. Despite being employed in the most globalised, industrial sector of their economies, garment workers’ wages remain at poverty levels over their lifetime, without any scope for upward mobility, improved standards of living, and creation of savings and assets. Garment workers faced different forms of forced labour even prior to the pandemic, as they were pushed to take on oppressive debt or work brutal overtime hours to cover their families’ consumption needs.
Under these already harsh conditions, garment workers were compelled to further
Conclusion And Way Forward

178
absorb the costs of the pandemic-induced recession, in the form of extreme wage theft. Workers and their households paid for the crisis with the physical degradation of their bodies – as they reduced consumption on food, healthcare and education. When such workers are pushed below the poverty line, their experience is not short-lived, but triggers a long-term crisis in the form of loss of meager assets and severe indebtedness, leading to inter-generational transfer of poverty as their children face nutritional deficits, gaps in their education and are forced into child labour. As an industry dominated by women from vulnerable socio-economic groups, the conditions facing workers in the garment industry have clear implications in the form of heightened economic violence against women and deepening gender disparities in production countries.
The findings of this report are an underestimation of the scale of the crisis faced by workers because the data over-represents unionised and regular workers, pointing to an even more tragic reality for the large numbers of non-unionised workers with less secure employment contracts.
Rapid Response By Asian Garment Unions During The Peak Pandemic PeriodAs Asia Floor Wage Alliance received reports from the ground in Asia during the peak of the pandemic, it became evident that an intense humanitarian crisis was unfolding that would propel workers into a debt and poverty cycle. AFWA conducted a rapid assessment with garment unions in Asia and formulated an immediate demand for Supply-chain Relief Contribution (SRC) from brands.2 The SRC would be in proportion to a brand’s procurement in 2019 from a supplier in its supply chain and payable to workers through its suppliers. However, due to multiple factors, brands were able to deflect
their roles and defuse their accountability. Shortly thereafter, the global garment labour rights movement regrouped itself with a broad consensus on Wage Assurance.3
Global apparel brands evade public criticism and union action by hiding behind public assurances of meeting standards set by national laws. However, they fail to recognise or make up for the jurisdictional and governance weaknesses and erasure of justice delivery mechanisms induced in production countries by the very nature of their supply chains. Most national governments have set their minimum wages at the same level or marginally higher than the International Poverty Line, as higher wages would result in the relocation of sourcing by brands due to increase in labour costs. During the recession, governments were forced to withdraw or relax orders requiring suppliers to pay wages to workers, as suppliers cited that their businesses are wholly dependent on the actions of brands, who engaged in cancellations and non-payment for orders. Brands are able to distance themselves from any liability arising from the human rights violations of workers in their supply chains by transferring this liability to supplier factories, who are considered the sole employers of workers, even though brands determine workers’ access to employment and wages and control the production process.
Building A New Social ContractOne of the major forms of wage theft across all countries, as shown in this report is non-payment of layoff wages and terminal benefits as per the legal provisions in each country or according to the ILO standards for social protection, terminal benefits and employment security. This gap reveals major structural flaws in global supply chains, which signals the need for a global architecture for social protection. The emerging consensus

179
is for a New Social Contract that has at its core social protection against employment loss.4
The global garment labour rights movement has also stated the need for a structural change to shift responsibility through an enforceable and binding agreement. There is a campaign towards a Severance Guarantee Fund to complement national laws and institutions and ensure workers timely access to severance payments when there is a jurisdictional and governance failure.5
Towards A Living Wage In Global Garment Supply ChainsThe concentration of power and profits in the hands of transnational corporations within global supply chains has been globally recognised as detrimental to a balanced and inclusive growth for all.6 In the case of global apparel supply chains, brands wield complete control over their suppliers and workers, pushing down costs further and further, while accumulating more and more profits. The fair redistribution of power and profits through transformative shifts in the structure and governance of global supply chains is a pre-condition for Asian garment workers’ access to decent work and dignified living conditions that will lift them out of inter-generational poverty, leading to more lasting development gains for production countries.
Global Readjustment Towards Higher Prices Required For The Payment Of Living Wages
The Asia Floor Wage (AFW) is a regional living wage formulation by Asian trade unions that has been recognised as a necessary and legitimate living wage that meets the minimal conditions for decent labour standards. However, the current structure of
global supply chains is contradictory to the achievement of a living wage for workers. The primary motivation of global apparel brands to offshore and outsource manufacturing is to lower production costs by driving down labour costs. Brands, which wield monopsonistic power over their suppliers, are able to impose several conditions, including Freight on Board (FOB) pricing models that only account for poverty-level wages for workers according to statutory minimum wages. Such a pricing model allows brands to maximise value capture and accumulate profits through the reduction of input costs and squeezing of labour, rather than by increasing product prices.7
Pricing models that allow the perpetuation of poverty-level wages are justified on the basis that it meets the standards set by national laws. However, it results in the exploitation and chronic impoverishment of workers by denying them living wages that account for the daily renewal of their labour power and the reproduction of their households.8 Therefore, transformative change in global apparel supply chains will entail a process of global readjustment by consumer markets in developed economies and global apparel brands to higher prices, which will in turn, enable fair living wages for garment workers. The accumulation of super-profits through the indiscriminate sale of low-cost garments produced by workers earning poverty-level wages, must be replaced with a pricing model that enables workers to be compensated adequately by the fair redistribution of profits earned through the marketing and sale of products manufactured by them.
Wage Forward:9 Enforceable And Binding Agreement For Living Wages
The governance of global supply chains has been driven by the codes of conduct and auditory regimes of global apparel brands as

180
part of their Corporate Social Responsibility (CSR) programmes. These CSR initiatives are attempts by corporations to self-regulate their supply chains, and evade collaboration or accountability towards other actors in the supply chains, including workers and trade unions.10 It allows global apparel brands to hide behind commitments in their codes of conduct towards the payment of adequate wages, including living wages, while continuing to drive down prices for their orders without any contestation.11
The implementation of guaranteed living wages for garment workers across supply chains in all production countries is not possible without the development of strong labour market institutions that replace the self-regulation of supply chains by brands, and hold them accountable for violations. Labour market institutions that are pro-labour are required to sustain and promote the unionisation process and collective bargaining within global apparel supply chains. The building of workers’ and their unions’ agency is essential to contest the hegemonic power of brands in the governance of supply chains and to ensure a union-driven and worker-monitored process for the payment of living wages.
The global garment labour rights movement has launched the Wage Forward Campaign, which aims to reverse the exploitation of workers for super-profits by demanding that brands pay an additional living wage contribution on every order placed, which covers the gap between the legally mandated minimum wage and estimated living wage in production countries. By paying 25% premium over and above the price they currently pay their suppliers, brands would be able to ensure living wages to workers in their supply chains. The Wage Forward campaign proposes an Enforceable Wage Agreement (EWA) that is a global, legally binding agreement negotiated and signed by trade unions, international brands and retailers to guarantee a living wage to
garment workers.12
Need For Joint Employer Liability Of Global Apparel Brands With Suppliers
Brands capture the majority share of profits as drivers of global apparel supply chains but evade accountability for the conditions of workers who manufacture the garments that they own, market and sell. They transfer any liability towards workers in their supply chains to their suppliers, who are considered the sole employers. Suppliers, on the other hand, have been able to escape their liability towards workers within the national jurisdictions of production countries by arguing that they cannot pay workers without continued orders and full and timely payments from brands. The economic dependency of suppliers on brands for their continued operations translates to the total reliance of workers on brands for their continued employment and wages. However, production country governments have not taken any steps to hold brands liable for wage theft experienced by workers during the recession, though major Asian garment supplier associations had called for “fair compensation” to be paid directly as salaries to workers of suppliers.13 Governments of a few countries that are heavily dependent on garment exports, nevertheless, provided some cash relief to the workers. Brands have consistently refused to share liability and offloaded all risks.
The transnational commercial relationship between brands and their suppliers must be reexamined in order to redefine liability towards workers in the global apparel supply chains. Brands enter into contracts for production with their suppliers in production countries. These contracts for production cannot be fulfilled without the employment of labour, and therefore, give rise to employment contracts between suppliers and workers. Workers are hired by suppliers on behalf of

181
brands to manufacture the garments that are owned, marketed and sold by the brands. Workers receive employment and wages from their suppliers based on the quantity of orders and pricing determined by the brand, while their work process and conditions are determined by the minute specifications on the design, quantity and quality of products, deadlines and delivery models provided by brands. This provides the opportunity to view global supply chains as a system of joint production and employment of labour by brands and their suppliers, rather than viewing it as a relationship of sales and purchase.
The liability gap in the existing structure of global garment supply chains has foreclosed the option of workers’ and their unions’ agency to hold brands accountable. AFWA wants to restore this agency, bring unions into direct engagement with the brands and claim accountability within the jurisdictional domain of their countries. AFWA’s partner unions across several production countries have been taking steps to hold brands jointly liable for the wage theft of workers in their supplier factories, in the national jurisdictions of production countries, using national legislations. These complaints demand that brands compensate workers for wage theft during the pandemic-induced recession, where the supplier has failed to do so, as they are jointly liable for the payment of workers’ wages.
Workers in industries with unions and a tradition of collective bargaining have been able to secure higher wages than the minimum wage. The living wage formulated by AFWA is within the range of bargainable wages in each country. Access to living wages would have allowed garment workers to face the pandemic-induced recession with resilience. As long as garment workers do not have unions to progressively reach a living wage, they will continue to provide what has been called a “reverse labour subsidy” for brands’ super-profits.14 During crises,
such as the Covid-19 pandemic, the reverse subsidy is further deepened through wage theft, leading to further mining of workers’ bodies15 for the stabilisation and recovery of brand profits. The capture of value by brands in the form of super-profits earned through the exploitation of workers must be replaced by protected and guaranteed living wages for workers across global apparel supply chains in all production countries.

182
References
1 Selwyn, B. (2017). The Struggle for Development. Polity Press.
2 Asia Floor Wage Alliance. (2020, April). Brands’ Responsibility in COVID-19 Humanitarian Crisis: Contribute to Garment Workers’ Relief Retrieved from Asia Floor Wage Alliance: https://asia.floorwage.org/wp-content/uploads/2020/04/Brand-SRC-for-Garment-Workers-Impacted-by-COVID-19.pdf
3 Payyourworkers Campaign. (2020). Retrieved from payyourworkers: https://www.payyourworkers.org/
4 International Trade Union Confederation (2020). Frontline Campaigns and Four Pillars for Action 2021. https://www.ituc-csi.org/IMG/pdf/ituc_frontlinesandpillarsreport_en_2021.pdf
5 Payyourworkers Campaign. (2020). Retrieved from payyourworkers: https://www.payyourworkers.org/
6 United Nations Conference on Trade And Development. (2017). Trade and Development Report. New York and Geneva: UNCTD. Retrieved from https://unctad.org/system/files/official-document/tdr2017_en.pdf
7 Milberg, W. (2008). Shifting sources and uses of profits: sustaining US financialization with global value chains. Economy and Society, 37(3), pp. 420-451.
8 Selwyn, B. (2019). Poverty chains and global capitalism. Competition & Change, 23(1), pp. 71-97.
9 Wage Forward (2020). A New Strategy for Achieving Living Wages in the Global Garment Industry. Retrieved from Wage Forward:https://wageforward.org/files/galleries/Intro_living_wage_campaign.pdf
10 Bair, J. & Palpacuer, F. (2015). CSR beyond the corporation: contested governance in global value chains. Global Networks, 15(1), pp. 1-19.
11 Worker Rights Consortium (2019). The False Promise of Corporate Living Wage Commitments. Retrieved from Worker Rights Consortium: https://www.workersrights.org/commentary/the-false-promise-of-corporate-living-wage-commitments/
12 Wage Forward (2020). A New Strategy for Achieving Living Wages in the Global Garment Industry. Retrieved from Wage Forward: https://wageforward.org/files/galleries/Intro_living_wage_campaign.pdf
13 The Bangladesh Garment Manufacturers and Exporters Association. (2020). Sustainable Textile of the Asian Region Joint Statement on Responsible Purchasing Practices amid the COVID-19 Crisis. Retrieved from BGMEA: https://bgmea.com.bd/page/Joint_Statement_on_Responsible_Purchasing_Practices_amid_the_COVID-19_Crisis
14 Nathan, D., Bhattacharjee, S., Shaji, R., Swaminathan, P., Singh, S., & Kumar, P. (2021). Reverse Subsidies in Global Monopsony Capitalism (Forth Coming). Cambridge: Cambridge University Press.

183
15 Ibid

184
Appendix: Summary Of Relevant Labour Legislations In Surveyed Countries
Sri Lanka
Layoffs And Terminations Of Workers Layoffs and terminations of workers in Sri Lanka are governed by laws pertaining to the retrenchment of workers, as set out in the Termination of Employment of Workmen (Special Provisions) Act, No. 45 of 1971.
Process Of Retrenchment
The TEWA covers the retrenchment of workers in Scheduled Employment, including workers employed in factories. Section 2 (1) of the TEWA states that no employer shall terminate the scheduled employment of any workman without the prior consent in writing of the workman or the prior written approval of the Commissioner General of Labour. Once an application is made under TEWA, the Commissioner General of Labour is given the powers to approve and refuse retrenchment within a period of three months from the application, and also powers to decide the terms and conditions of that retrenchment including payments of compensation and gratuity by the employer to the employee.
If an employee is dismissed in contravention to the provisions of TEWA, it is considered illegal, null and void. Further, if any person fails to comply with the decision of the Commissioner General or Labour, it is treated as an offence with penalty, including a prison sentence of up to six months. The decision of the Commissioner General cannot be challenged in any forum and is considered final and conclusive.
Compensations And Severance Pay
The Payment of Gratuity Act, No. 12 of 1983, states that workers who have completed five years of service are entitled to gratuity, which includes half a month’s or 14 days wages for each completed year of service. Further, TEWA has a provision for payment for redundancy, which is payable in the event of termination of workers resulting from the closure of business.
Payment Of Wages During Covid-19The lack of laws governing temporary layoff of workers during emergencies resulted in the ad hoc tripartite taskforce on Covid-19, which led to the tripartite agreement between the

185
Employers’ Federation of Ceylon (EFC), trade unions and the Ministry of Skills Development, Employment and Labour Relations. As per the agreement reached on May 5, 2020, employers agreed to: (a) not terminate workers during the Covid-19 pandemic; (b) provide 50% of workers’ basic wages or LKR 14,500 (77 USD), whichever is more beneficial to workers, if the factory did not provide work to workers during this time; and (c) contribute to Employers’ Provident Fund (EPF) and Employees’ Trust Fund (ETF). The taskforce also required employers to receive prior authorisation from the Labour Department if they did not require the services of workers and retrenched them with reduced salaries.
Overtime Payment The Factories Ordinance, No. 45 of 1942, stipulates that working hours must not exceed 9 hours per day, excluding time allocated for meals or rest. The Wages Board Ordinance states that Wages Boards constituted in respect of the trade for which it is established may determine the applicable rate for overtime work done by workers. Accordingly, for the garment industry, payment for overtime work is 1.5 times the normal hourly rate.
Pakistan
Layoffs And Terminations Of WorkersIn Punjab province, the West Pakistan Industrial and Commercial Employment (Standing Orders) Ordinance 1968 (ICEO), adopted in 2012, governs the layoff and termination of workers. In Sindh Province, the Sindh Terms of Employment (Standing Orders) Act, 2015, is applicable in the case of layoff and terminations of workers.
Payment Of Wages During Layoff
Standing Order 11 (3) of the ICEO governs the layoff of workers. In cases where workers are laid off due to stoppage of work for several reasons laid out in Standing Order 11 (1), they shall be paid by the employer an amount equal to one-half of their daily wages during the first fourteen days of layoff as compensation. When, however, the workmen have to be laid off for an indefinite period beyond the above-mentioned fourteen days, their services may be terminated after giving them due notice or pay in lieu thereof.
Process Of Termination
Standing Order 12 of the ICEO governs the termination of workers. It states that either employer or worker may terminate an employment contract by providing one month’s notice. This is applicable only to permanent workers and does not cover temporary workers or probationers. Standing Order 15 of the ICEO allows the employer to terminate workers for misconduct. The ICEO requires a written employment termination letter to be provided by the employer, stating reasons for termination. The law does not lay down fair grounds for the dismissal of workers. However, case law has set the precedent for rightful termination to include illness, inefficiency, and based on the financial and economic needs of the establishment.
186
Compensations And Severance Pay
If one month notice is not provided by the employer, as per Standing Order 12, the worker must be paid one month’s wages in lieu of notice.
According to Standing Order 16 of the ICEO, the worker is entitled to gratuity equivalent to one month’s wages, calculated on the basis of the wages admissible to them if they are a fixed-rated worker, or the highest pay drawn by them during the last twelve months if they are a piece-rated worker, for every completed year of service or any part of the year over six months. Seasonal workers are also entitled to gratuity equal to one month’s wages for each season. The employer may substitute provident fund payment with gratuity.
Similar provisions are found in the Sindh Terms of Employment (Standing Orders) Act, 2015.
Payment Of Wages During Covid-19The Sindh Covid-19 Emergency Relief Ordinance was promulgated on 18 May 2020, which provides inter alia that ‘no employee or worker shall be laid off, terminated or removed’ and further provides a list of permissible deductions from salaries of employees earning PKR 50,000 and above. Workers, governments and employers in Sindh agreed to tripartite mechanisms for resolving grievances of workers due to non-compliance to the ordinance. Textile industry employers filed a petition with the Sindh High Court stating that they would not be able to pay wages as required by the ordinance.
Overtime PaymentIn Punjab province, overtime payment is regulated by the Factories Act 1934. Section 47 states that overtime pay must be at twice the ordinary rate of pay. Overtime payment is applicable where a worker (a) in a non-seasonal factory works for more than nine hours in any day or for more than forty-eight hours in any week, or (b) in a seasonal factory works for more than nine hours in any day or for more than fifty hours in any week.
In Sindh province, the Sindh Factories Act 2015, regulates overtime payment. Section 68 states that workers are entitled to pay at twice the ordinary rate of pay. Overtime payment is applicable where a worker is (a) in a non-seasonal factory works for more than nine hours in any day or for more than forty-eight hours in any week, or (b) in a seasonal factory works for more than ten hours in any day or for more than fifty hours in any week.
India
Layoffs And Terminations Of WorkersIn India, the Industrial Disputes Act (IDA), 1947, governs the layoff and terminations of workers.
Payment Of Wages During Layoff
Section 25M of the IDA prohibits layoff of workers whose names are on the muster rolls

187
of industrial establishments without the prior permission of the appropriate government or such authority as may be specified by that government, unless such layoff is due to specific emergency situations. If no application has been made for permission for layoff of workers by the employer, such layoff is deemed illegal and workers are entitled to all benefits under applicable laws as if they are not laid off.
According to Section 25 C of the IDA when workers whose names are on the muster rolls of industrial establishments who have completed not less than one year of continuous service under an employer is laid off, whether continuously or intermittently, they shall be paid by the employer for all days during which they are so laid off, compensation which shall be equal to 50%, of the total of the basic wages and dearness allowance that would have been payable to them had they not been so laid off. However, there are two conditions to this provision. If during any period of twelve months, a workman is so laid off for more than 45 days, no compensation is payable for any period of the layoff after the expiry of the first 45 days, if there is an agreement to that effect between the worker and the employer. The employer may retrench workers at any time after the expiry of the first 45 days of the layoff and any compensation paid to the workers for having been laid off during the preceding 12 months may be set off against the compensation payable for retrenchments.
Process Of Retrenchment
Termination under the IDA is defined as “retrenchment”.
Section 25 N of the IDA (applicable to establishments with 100 or more workers) states that workers employed in an industrial establishment for over a period of one year in continuous service cannot be retrenched without provision of three months’ notice indicating reasons for retrenchment. The prior permission of the appropriate government or authority specified by that government must be obtained, through an application clearly stating reasons for intended retrenchment. If no application has been made for permission for retrenchment of workers by the employer, such retrenchment is deemed illegal and workers are entitled to all benefits under applicable laws as if they are not laid off.
Section 25 F of the IDA (applicable to establishments with less than 100 workers) states that workers employed in an industrial establishment for over a period of one year in continuous service cannot be retrenched without provision of one months’ notice indicating reasons for retrenchment. Notice must be served to the appropriate Government or authority specified by the appropriate government regarding the retrenchment.
Compensations And Severance Pay
The worker must be paid in lieu of notice, as per section 25 N and 25 F of the IDA.
When permission for retrenchment has been granted by the government, workers are entitled to receive compensation of fifteen days’ average pay for every completed year of continuous service or any part thereof in excess of six months.
Payment Of Wages During Covid-19The Ministry of Home Affairs issued an order on 29 March 2020 requiring all employers to pay their workers full wages for the period of the lockdown. This was challenged by employers
188
in the Supreme Court, following which it was ruled on June 4 that coercive action cannot be taken against employers for non-payment of wages during the lockdown period. On June 12, the Supreme Court ruled that the state must facilitate negotiations between employers and workers for payment of wages during the lockdown period.
Overtime Payment The Minimum Wages Act, 1948, Section 14, states that if the number of hours constituting a normal working day exceeds the given limit, then employers will have to pay workers for every hour or for part of an hour for which workers have worked in excess at the overtime rate.
Section 59 of the Factories Act states that if a worker works in a factory for more than 9 hours a day or for more than 48 hours a week, they shall receive wages at twice the ordinary wage rate.
Indonesia
Layoffs And Terminations Of WorkersThe newly passed Omnibus Law on Job Creation and the Government Regulation 35/2021 governs layoff and termination of workers.
Payment Of Wages During Layoff
There is no specific law on layoff in Indonesia. Rather, the law governing labour is found in the law of contract. Article 81, No. 25 of the Omnibus Law for Job Creation which contains Article 88 A, paragraph (1) of the Manpower Law, stipulates that workers’ rights to wages arise when there is an employment relationship between a worker and an entrepreneur and ends when the employment relationship is terminated. Letter of Minister of Manpower 5/1998 affirms the rights of laid-off workers to wages, with the following provisions:
• Employers continue to pay wages in full, namely in the form of basic wages and fixed allowances as long as workers are laid off, unless otherwise stipulated in the work agreement, company regulations or collective work agreement.
• If the employer will not pay the worker’s wages in full, it must be negotiated with the trade union and/or the workers regarding the amount of wages during the time off and the length of time they are laid off.
However, in certain conditions like force majeure, workers can be furloughed, and after the condition ends, workers must be paid as usual.
Process Of Termination
According to the Omnibus Law and the Government Regulation 35/2021, employers must notify workers of the intention and reasons for terminating them, unless termination is a result of the expiration of their fixed term contract, due to resignation, reaching retirement age or death. If the worker rejects the termination after receiving notice, the worker and employer

189
must enter into bipartite negotiations. If the negotiations fail, then termination must be conducted in accordance with the Industrial Relations Dispute Settlement Law of Indonesia, Law No. 2, 2004. The disagreement of termination may be taken to the local employment office for mediation, or, if this fails, to the Industrial Relations Court.
Compensations And Severance Payments
Workers are entitled to the following payments upon termination:
• Standard severance of one month’s salary per year or part year of service, capped at nine months’ salary.
• Service payment calculated as per a scale ranging from two months’ salary for a worker with three years of service, to 10 months’ salary for a worker with 24 years of service or more.
• Compensation of Rights payment, including untaken leave, repatriation costs and housing, and other contractual entitlements, such as separation pay.
Payment Of Wages During Covid-19The Ministry of Manpower requested employers to discuss in advance with workers’ representatives and trade unions before laying off workers, including taking alternate measures such as reducing wages and perks of top level positions, reducing work shifts, limiting or removing overtime work, reducing work hours, reducing work days, temporary layoff or rotational work, extending or not extending the contracts of workers whose contracts have expired, and providing pensions for those who are eligible. The government required that Religious Festive Allowance be paid to workers in full regardless of the business situation of employers, with the method of payment being agreed upon by employers and workers.
Overtime Payment The Omnibus Law recognises normal working hours of 40 hours per week, which includes 7 hours per day for 6 days of a week or 8 hours per day for 5 days of a week. It extended maximum overtime hours to four hours per day and 18 hours per week. Overtime payment rate is 1.5 times the normal pay for the first hour of overtime work and two times the normal pay from the second hour of overtime work.
Cambodia The laws on suspension of employment contract, termination of employment contract and mass layoff govern the layoff and terminations of workers in Cambodia.
Layoff And Terminations Of Workers The Labour Law, 1997 governs the layoff and terminations of workers in Cambodia.

190
Payment Of Wages During Layoff
Temporary layoff is considered to be a form of “suspension of contract” in Cambodia. Article 71, Labour Law 1997, provides several reasons for which the employment contract of a worker may be suspended by the employer, including temporary layoff the worker for valid reasons in accordance with internal regulations, Act of God that prevents either the employer or worker from fulfilling obligations for a maximum of three months, and when the enterprise faces a serious economic or material difficulty which leads to suspension of the operation of the enterprise, with the suspension not exceeding two months and under the control of the Labour Inspector.
Article 72, Labour Law 1997, states that workers will not have to be paid for the period of suspension of contract unless there are provisions to the contrary that require the employer to pay workers.
Process Of Termination
According to Article 73, Labour Law 1997, a labour contract of a specific duration normally terminates at the specified ending date. It can, however, be terminated before the ending date if both parties are in agreement, and this agreement is made in form of writing in the presence of a Labour Inspector and signed by both parties to the contract. If both parties do not agree, then a contract can be terminated before the ending date only in the event of serious misconducts on part of employer or worker, and Acts of God. A brief notice period must be provided in the case of fixed duration contracts where workers have been in continuous employment for more than 6 months.
According to Article 74, Labour Law 1997, an unspecified duration contract can be terminated at will by either of the contracting parties, subject to prior notice given in writing by either of the parties. However, employers cannot terminate an unspecified duration contract without valid reasons relating to a worker’s attitude or behaviour, or based on the requirements of the operation of the enterprise, establishment or group.
Article 75 provides the minimum period for a prior notice based on the length of the worker’s service with the establishment, ranging from 7 days if the worker’s service is less than six months, and three months if it is longer than 10 years. This notice period can be exempted in the event of probation or internship as specified in the contract, due to serious misconduct on part of employer or worker, and Acts of God.
Article 95, Labour Law 1997, states that any layoff resulting from the reduction in an establishment’s activity or internal reorganisation that is foreseen by the employer is subject to procedures. Here, layoff is considered to mean permanent layoff.
• The employer must inform the workers’ representatives in writing to solicit their suggestions on the measures for a reduction in workers and to minimise the effect of this on workers.
• The employer will first layoff workers with the least professional ability, and then workers with the least seniority.
• Dismissed workers have priority, for the next two years, to be re-hired in the same position in the enterprise.

191
• The Labour Inspector is kept informed and may call concerned parties together to examine the impact of the proposed layoffs and measures to be taken to minimise the effect.
• The Minister in Charge of Labour can issue an order to suspend the layoff for a period not exceeding 30 days to help the concerned parties reach a solution.
Compensations And Severance Pay
The termination of workers by the employer without providing prior notice obligates the employer to compensate them with an amount equal to wages and other benefits that the worker would have received during the notice period.
Article 89, Labour Law 1997, provides indemnity for dismissal if the contract is terminated by the employer alone. The indemnity for dismissal is based on the duration of service. Article 91 entitles both employer and worker to payment of damages if the contract is terminated without valid reasons.
Workers with fixed duration contracts are entitled to a severance payment of at least 5% of the total wages paid to the worker during the length of the contract. Workers with an unspecified duration contract are entitled to layoff compensation depending on the length of service, with workers with a length of service between six months to one year receiving seven days of wages and benefits, and workers with a length of service more than one year receiving 15 days for each year of service, up to 6 months of wages and benefits.
Payment Of Wages During Covid-19The Prime Minister announced on 7 April 2020 that suspended or laid-off workers would receive a flat 70 USD, with employers paying 30 USD and the government paying 40 USD.
Overtime Payment According to Article 137 of the Labour Law, 1997, the number of working hours is 8 hours per day and 48 hours per week. Overtime work is only permitted for exceptional and urgent jobs, and must not be more than two hours per day, as per the Arbitration Council Award 10/04. According to Prakas 80/90, overtime work must be voluntary. Employers are required to pay at least 150% of the usual wage to employees who work overtime in the day and 200% of the usual wage for overtime work during the night.
Bangladesh
Layoff And Terminations Of WorkersThe Bangladesh Labour Act, 2006, governs layoff, retrenchments and terminations of workers.
Payment Of Wages For Layoff
According to Article 12 of the Labour Act, an employer may, at any time, in the event of

192
fire, catastrophe, breakdown of machinery, or stoppage of power supply, epidemics, civil commotion or any other cause beyond his control, stop any section or sections of the establishment, wholly or partly for such period as the cause for such stoppage continues to exist. If the stoppage of work does not exceed one day, workers are not entitled to wages, whereas if the stoppage exceeds one day, workers are paid wages for each day of stoppage. If the period of stoppage exceeds three days, the employer may lay off workers.
According to Article 16 of the Labour Act, a worker who has their name on the muster rolls of the industrial establishment, and who has been employed for one or more years, is entitled to compensation by the employer for all days of layoff. The compensation for the first 45 days of layoff shall be equal to half of the total of the basic wages and dearness allowance, and ad-hoc or interim pay, if any, and the full amount of housing allowance, if any, that would have been payable to him had he not been so laid off. After the expiry of 45 days of layoff, if workers are laid off for periods of 15 days or more, they are entitled to payment of compensation for all days in every subsequent period of layoff for 15 days or more. The amount of compensation shall be equal to one-fourth of the total of the basic wages and dearness allowance, and ad-hoc or interim pay if any, and the full amount of housing allowance, if any, that would have been payable to them, had they not been laid off.
Process Of Retrenchment Or Termination
Beyond layoff of 45 days, if workers are being laid off for periods of 15 days or more, the employer may choose to retrench the workers instead. In the case of such retrenchment, according to Article 20 of the Labour Act, no notice needs to be provided to the worker. However, the worker so retrenched must be paid 15 days of wages.
According to Article 20 of the Labour Act, a worker may be retrenched on the grounds of redundancy. However, workers who have been in continuous service for a period of one year or more shall be given a one month’s notice in writing, indicating reasons for retrenchment, or wages for the notice period in lieu of the notice and a copy of the notice is sent to the chief Inspector or any other officer authorised by him and also to the collective bargaining agent in the establishment.
A worker may be dismissed in two cases. As per sections 23 and 24 of the Labour Act, a worker may be dismissed without prior notice or payment in lieu of notice in the case of misconduct. As per section 22, a worker may be discharged from service for reasons of continued physical or mental incapacity or continued ill-health.
According to Article 26 of the Labour Act, termination of a permanent worker requires a notice of 120 days for monthly rated workers and 60 days for others. Termination of temporary workers requires 30 days’ notice for monthly rated workers and 14 days’ notice for others, if the termination was not due to completion, cessation, abolition or discontinuance of the temporary work for which the worker was appointed.
Compensations And Severance Pay
If the employer terminates a worker without providing notice, the employer must pay wages in lieu of notice.
Permanent workers who are terminated are paid compensation at the rate of thirty day’s

193
wages for every completed year of service or for any part of the year in excess of six months, or gratuity, if any, whichever is higher. A worker who is dismissed as a measure of punishment, with service of a year or more, be paid by the employer compensation at the rate of fourteen days wages for every completed year of service, or gratuity, if any, whichever is higher.
Payment Of Wages During Covid-19The government offered a stimulus package of 5,000 BDT to pay the wages of workers in export-oriented industries from April to June 2020. The owners of export-oriented factories can access the funds as interest-free loans. The lenders would deposit the wages in the bank accounts of workers directly.
Overtime Payment According to Article 102 of the Labour Act, no worker should be ordinarily required to work more than 8 hours per day and 48 hours per week.
According to Article 108 of the Labour Act, when a worker works for more than the ordinary hours of work, the worker is entitled to allowance at twice the ordinary basic wage, dearness allowance, and ad-hoc and interim pay, if any.

