mongolia policy note tertiary education in mongolia...
TRANSCRIPT
Report No. 52925 - MN
MONGOLIA POLICY NOTE
Tertiary Education in Mongolia: Meeting the Challenges of the Global
Economy
June 2010
Human Development Sector Unit
Mongolia Country Management Office
East Asia and Pacific Region
Document of the World Bank
CURRENCY EQUIVALENTS
Currency
US$1.00 = MNT 1,168.20 (2007)
US$1.00 = MNT 1,171.36 (2008)
US$1.00 = MNT 1,358.19 (2009)
FISCAL YEAR
January 1- December 31
WEIGHTS AND MEASURES
Metric System
ACRONYMS AND ABBREVIATIONS
ECDE Early Childhood Development
and Education
MSUE Mongolian State University of
Education
EGSPRS Economic Growth Support
and Poverty Reduction
Strategy
MUST Mongolia University of Science and
Technology
ESMP2 Education Sector Master Plan 2 NER Net Enrolment Ratio
GER Gross Enrolment Ratio NQF National Qualification Framework
GDP Gross Domestic Product NUM National University of Mongolia
HSU Health Sciences University of
Mongolia
NVETMC National Vocational Education and
Training Methodology Center
LSMS Living Standards Measurement
Survey
OECD Organization for Economic
Cooperation and Development
M&E Monitoring and Evaluation QA Quality Assurance
MECS Ministry of Education, Culture,
and Science
STF State Training Fund
MNCEA Mongolian National Council
for Educational Accreditation
TEI Tertiary Education Institution
MOF Ministry of Finance TVE Technical and Vocational Education
MSUA Mongolian State University of
Agriculture
Country Director: Klaus Rohland
Sector Director: Emmanuel Jimenez
Sector Manager: Eduardo Velez Bustillo
Task Team Leader: Kin Bing Wu
i
CONTENTS
Executive Summary .......................................................................................................... v
1. Challenges to Post-basic Education ................................................................ 1
1.1. Educational Development since the Transition .................................................. 1 1.2. Key Policy Questions Surrounding Tertiary Education...................................... 5
2. The Demand for Skills ..................................................................................... 7
2.1 Rising Wage Premia for Skills ............................................................................ 7 2.2. Prospects for Job Growth .................................................................................... 9 2.3. Migrant workers ................................................................................................ 11 2.4. Conclusion ........................................................................................................ 12
3. The Impact of Governance and Financing on Quality and Equity of
Tertiary Education ......................................................................................... 13
3.1. Governance ....................................................................................................... 14 3.2. Accreditation and Quality Assurance ............................................................... 16
3.3. Finance .............................................................................................................. 18 3.4. Tuition Fees and Student Financial Assistance ................................................ 21
4. Policy Options to Reform Tertiary Education ............................................. 27
4.1. Concentrate Resources to Fund Premier Universities through Competitive
Funding ............................................................................................................. 27
4.2. Differentiate Roles of TEIs and Improve System Articulation to Facilitate
Lifelong Learning ............................................................................................. 29
4.3. Higher Education Commission and Quality Assurance .................................... 32 4.4. Public Accountability and Consumer Protection .............................................. 35
4.5. Better Targeting of Financial Aid and Improvement of Basic Education ........ 37
5. Technical and Vocational Education and Training: An Alternative to
Tertiary Education? ....................................................................................... 39
5.1. The Structure and Outcomes of Mongolia‟s TVET system.............................. 39 5.2. Challenges to the Quality of Mongolia‟s TVET System .................................. 40 5.3. Options to Improve Quality and Relevance ...................................................... 41
6. Conclusions ..................................................................................................... 47
References ........................................................................................................................ 49
ii
List of Tables
Table 1: Growth of the Tertiary Education Sector, 1991-2009 ......................................... 2
Table 2: Tertiary Graduates per 10,000 Population ............................................................ 2 Table 3: Gross Enrollment Rates by Level, 1991, 1995, 2000 and 2007 ........................... 3 Table 4: Wage Premia of Various Levels of Education, 1998 and 2007 ............................ 8 Table 5: Wage Premia for Different Levels of Educational Attainment, 1998 and 2007 .. 9 Table 6: Distribution of Wage Employees by Sector, 1998, 2002, and 2007................... 10
Table 7: Public Expenditure on Education, 1991, 2002 and 2007 .................................... 18 Table 8: Sources of Funding of Tertiary Education Institutions, 2007............................. 19 Table 9: International Comparison of Per Student Spending By Level of Education (US
Dollars) ................................................................................................................ 21
Table 10: State Training Fund Recipients by Program Area ........................................... 22 Table 11: A Cross Country Comparison of Tuition Fees as Percentage of per capital
Gross National Income ..................................................................................... 23 Table 12: State Training Fund Allocation of Resources, 2007 ......................................... 24
Table 13: Proportion of College Costs Covered by Tuition/Financial Aid ...................... 25 Table 14: Tripartite System of Tertiary Education in Selected OECD Countries ............ 28 Table 15: Ranking of the World‟s Top Universities, 2007 ............................................... 30
Table 16: Spatial and Income Disparities in Educational Completion Rates .................. 37 Table 17: Basic Outcomes of TVET in Mongolia ............................................................ 39
List of Figures
Figure 1: Enrollment Ratio by Age, 1998 and 2007 ........................................................... 4
Figure 2: Age Earning Profiles of Workers between 25 and 55, 1998 and 2007 .... 7 Figure 3: Characteristics of World Class Universities ...................................................... 13
Figure 4 : The Widening of STF Eligibility Criteria ........................................................ 24
List of Boxes
Box 1: California‟s System of Universities and Community Colleges ............................ 29 Box 2: Competitive Funding as an Innovative Financing Tool ........................................ 32 Box 3: New Zealand‟s Tertiary Education Commission .................................................. 34
Box 4: How Singapore is proposing to deal with the proliferation of private tertiary
education institution to assure quality .......................................................................... 35
Box 5: Labor Market Observatories in Italy and Chile ..................................................... 36
Box 6: Singapore‟s Institute of Technical Education (ITE) Curriculum Development
Model ................................................................................................................................ 43 Box 7: Denmark‟s TVET Teachers‟ Qualification and Training ..................................... 44 Box 8: The Australian Qualification Framework (AQF) .................................................. 46
iii
List of Annexes
Annex 1: Mongolia‟s Educational Framework ................................................................. 50
Annex 2: Years of Schooling of the Younger and Older Adult Population ..................... 52
Annex 3: Tertiary Premia by Year, Age Group, Gender and Sector of Employment . 53
Annex 4: Aggregate Institutional and Enrollment Data ................................................... 57
Annex 5: Enrolment Data, by Degree Level and Type of Institution ............................... 62
Annex 6: Enrolment by Subject and Degree Level .......................................................... 63
Annex 7: Students Supported by Financial Assistance, by Degree Level and Institutional
Type .................................................................................................................. 68
Annex 8: Faculty Qualifications ....................................................................................... 72
Annex 9: Recent Research Excellence Initiatives Worldwide ......................................... 73
iv
Acknowledgements
The preparation of this policy note was led by Kin Bing Wu (Lead Education
Specialist, EASHD). Prateek Tandon (Economist, EASHD) wrote the sections on tertiary
education development, finance, and accreditation. Fook Yen Chong (Consultant)
assessed the system of technical and vocational education and training. Chris Sakellariou
(Consultant) analyzed the Living Standard Measurement Surveys to obtain trends of the
labor market, and Roberta Bassett provided useful information on New Zealand‟s
Tertiary Education Commission. Ms. Tungalag Chuluun (Human Development
Operations Officer) provided helpful advice on the substance and also provided quality
assurance on the translation of this policy note into the Mongolian language. The policy
note benefited from discussion on South Gobi development with Arshad Sayed (Country
Manager, Mongolia, EACMF) and James Reichert (Senior Operations Officer, EASCS).
The Team is grateful to the Minister of Education for framing the policy questions
for tertiary education reform and for guiding the team in the direction of its research. We
thank Mongolian officials and academics for sharing their insight and information on the
country‟s higher education system, particularly Mr. M. Baasanjav, Director of Tertiary
Education Department, Mr. R. Bat-Erdene (Director of the Monitoring and Evaluation
Department and former Director of the Tertiary Education Department); Ms. D.
Khishigbuyan (Director of the Rural Education and Development Project PMU); Mr. O.
Gankhuyag (Deputy Director, EFA-FTI); Mr. A. Tsolmon (Officer in the Monitoring and
Evaluation Department); Mr. D. Bayar (Officer in the Tertiary Education Department);
Mr. Ts. Erdentsetseg (Officer in the Education Evaluation Center); and Ms. D.
Chuluuntsetseg (Senior Officer for External Relations and Program Accreditation of the
National Accreditation Center) for their helpful advice and guidance. Byambatsogt
Jugder (Consultant) shared with us his knowledge and insight, including the direction of
revision of the Master Plan. We are also grateful to representatives from Ivanhoe Mines,
LLC and the Mongolia Employers Federation for sharing their perspectives on the
education and training system in the country.
Peer reviewers for this note are Jamil Salmi (Lead Education Specialist, HDNED)
and William Experton (Lead Education Specialist, AFTH2).
v
EXECUTIVE SUMMARY
Since the transition from a planned economy to a market-based democracy
in the early 1990s, Mongolian higher education has experienced a marked
expansion. Between 1992 and 2007, the number of tertiary education institution (TEIs)
has increased more than four-fold and enrollment more than six-fold, with the gross
enrollment ratio growing from 14 to 47 percent.
This rapid growth has been fueled by the increased demand for higher skills
in the labor market and has led to rising education premia. These trends, in turn, have
stimulated increased household demand for tertiary education. In the early 1990s, the
liberalization of the economy and the legalization of private higher education made it
possible to increase the supply of tertiary education. However, this expansion in supply
has been met with the charging of tuition fees in public universities and the growth of
private institutions. As a result, public expenditure on higher education has been
contained to about 14 percent of total expenditure, compared with over 20 percent in
China.
Although this policy has met the need for an increased supply of tertiary
education, it has failed to produce graduates who can improve Mongolia’s
international competitiveness. The emerging problems are low-cost and low-quality
education, a mismatch between the demand for and supply of skills, and inequitable
opportunities of access between the urban and rural areas and between the rich and the
poor. The policy has triggered a downward spiral:
Per student public expenditure on tertiary education is about $339, low by
international standards. In contrast, the average per student public expenditure
on tertiary education in OECD is $11,512. Insufficient public funding and the
proliferation of small private institutions have driven TEIs to rely on the mass
admission of fee paying students for financial sustainability.
As a result, TEIs have few resources to attract highly qualified persons into
teaching, improve teaching and learning facilities, or upgrade the
qualification and skills of faculty members. A full professor‟s salary in a
public TEI is about $300 a month, with little distinction from that of a school
teacher. The salary of professors in private institutions varies more, but is
generally not much higher. Only 23 percent of faculty members in public
institutions and 15 percent in private institutions have PhDs, reflecting the non-
research nature of higher education. There are few incentives or resources for
professional development or upgrading.
vi
Moreover, there is a mismatch between the fields of study demanded by the
labor market and the fields of study chosen by those enrolled. Most private
TEIs offer social science and business studies because of lower delivery costs.
But the labor market demand is in science and technology, which accounts for
only 23 percent of the total enrollment.
As tertiary education enrollment grows more quickly than the number of
available jobs, ill prepared graduates face grim employment prospects. Only
about 36 percent of university graduates have been able to find a job, compared
with 60 percent of graduates from technical and vocational education. The
majority of those who find a job come from public universities.
Yet, as tertiary education premium remains high, urban parents who can
afford to pay continue to send their children to pursue tertiary education. About 70 percent of students are from urban areas, although only half of the
population live in the urban areas. Tuition fees in public and private TEIs,
however, are high and average around $300 per year with variation across
institutions.
These fees contribute to households’ indebtedness. About 67 percent of the
personal loans taken by herders are spent on tertiary education.
This indebtedness is partly a lack of publicly available information on the
quality of education offered by each institution and about the employment
prospects of the graduates from different disciplines. Hence, the consumers of
education (i.e. parents and youths) are not making informed choices.
There is thus an urgent need to reform the tertiary education subsector. This
policy note calls for several actions to improve quality and the equity of access.
Enhancing the quality of tertiary education is essential to improving Mongolia‟s
international competitiveness. To do so requires making strategic choices, improving
governance, and increasing investments in tertiary education. The following steps should
be considered:
Rationalize TEIs in order to concentrate resources on fewer, premier institutions
and programs to help them reach international standards;
Use competitive funding to allocate resources (such as equipment and staff
training) to the best programs (as measured by key performance indicators and
labor market outcomes) on a tri-annual basis to allow for predictability of funding
and to give time to demonstrate outcomes;
Invigorate the existing accreditation and quality assurance mechanisms, using
international benchmarks, to facilitate rationalization of public and private
institutions and to allow for good quality offshore programs to compete in
Mongolia;
vii
Develop a diversified but integrated tertiary education system so that each
institution can play a key role in regional development and transfers between
institutions can be made; and
Establish a Tertiary Education Commission comprising representatives from
industry, key professions, and academics from developed countries to set strategic
direction, improve governance, allocate block grants, and oversee the role of TEIs
in facilitating regional development.
To improve the equity of access and to provide greater consumer protection, the
following measures could be adopted:
Tighten eligibility criteria and improve the targeting of the State Training Fund to
aid low-income students;
Improve the quality of basic education to ensure that the poor complete schooling
so as to enhance the probability of their enrollment in higher education; and
Set up a labor market observatory to inform the public about the key performance
indicators of each institution and employment statistics by discipline to facilitate
school and career choice.
To reduce the pressure on tertiary education and provide alternatives to youths,
the development of technical and vocational education at the senior secondary level
should be explored.
viii
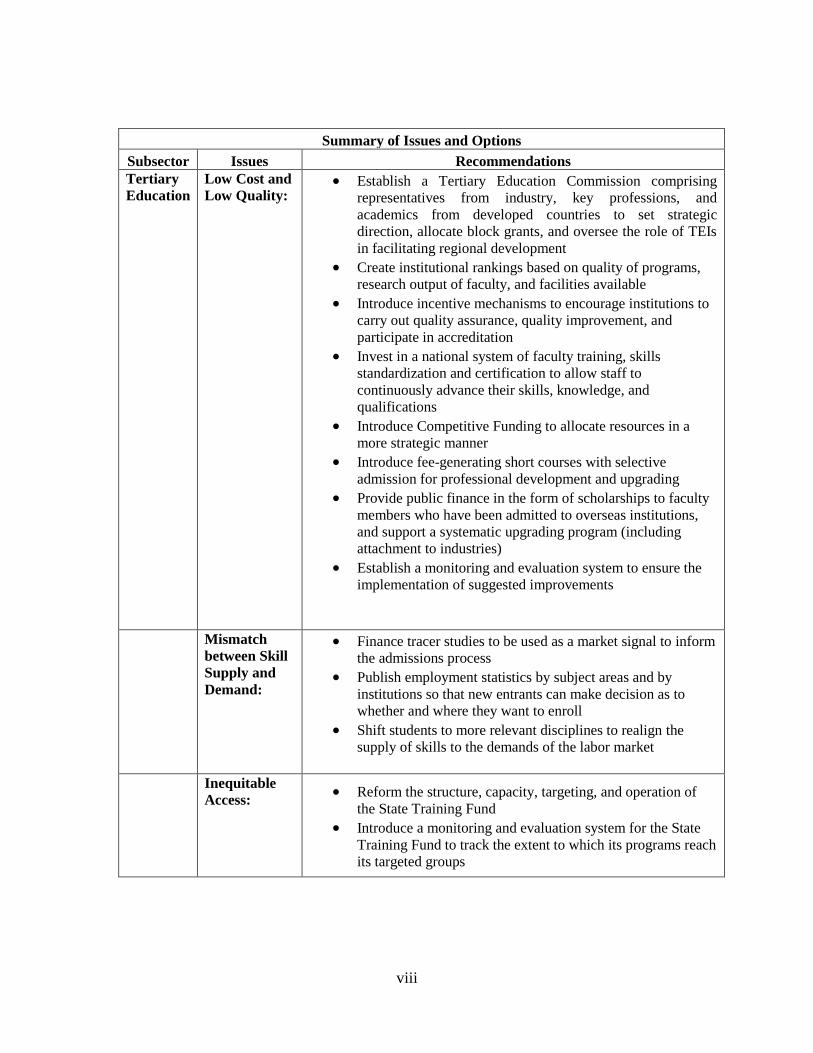
Summary of Issues and Options
Subsector Issues Recommendations Tertiary
Education Low Cost and
Low Quality:
Establish a Tertiary Education Commission comprising
representatives from industry, key professions, and
academics from developed countries to set strategic
direction, allocate block grants, and oversee the role of TEIs
in facilitating regional development
Create institutional rankings based on quality of programs,
research output of faculty, and facilities available
Introduce incentive mechanisms to encourage institutions to
carry out quality assurance, quality improvement, and
participate in accreditation
Invest in a national system of faculty training, skills
standardization and certification to allow staff to
continuously advance their skills, knowledge, and
qualifications
Introduce Competitive Funding to allocate resources in a
more strategic manner
Introduce fee-generating short courses with selective
admission for professional development and upgrading
Provide public finance in the form of scholarships to faculty
members who have been admitted to overseas institutions,
and support a systematic upgrading program (including
attachment to industries)
Establish a monitoring and evaluation system to ensure the
implementation of suggested improvements
Mismatch
between Skill
Supply and
Demand:
Finance tracer studies to be used as a market signal to inform
the admissions process
Publish employment statistics by subject areas and by
institutions so that new entrants can make decision as to
whether and where they want to enroll
Shift students to more relevant disciplines to realign the
supply of skills to the demands of the labor market
Inequitable
Access:
Reform the structure, capacity, targeting, and operation of
the State Training Fund
Introduce a monitoring and evaluation system for the State
Training Fund to track the extent to which its programs reach
its targeted groups
ix
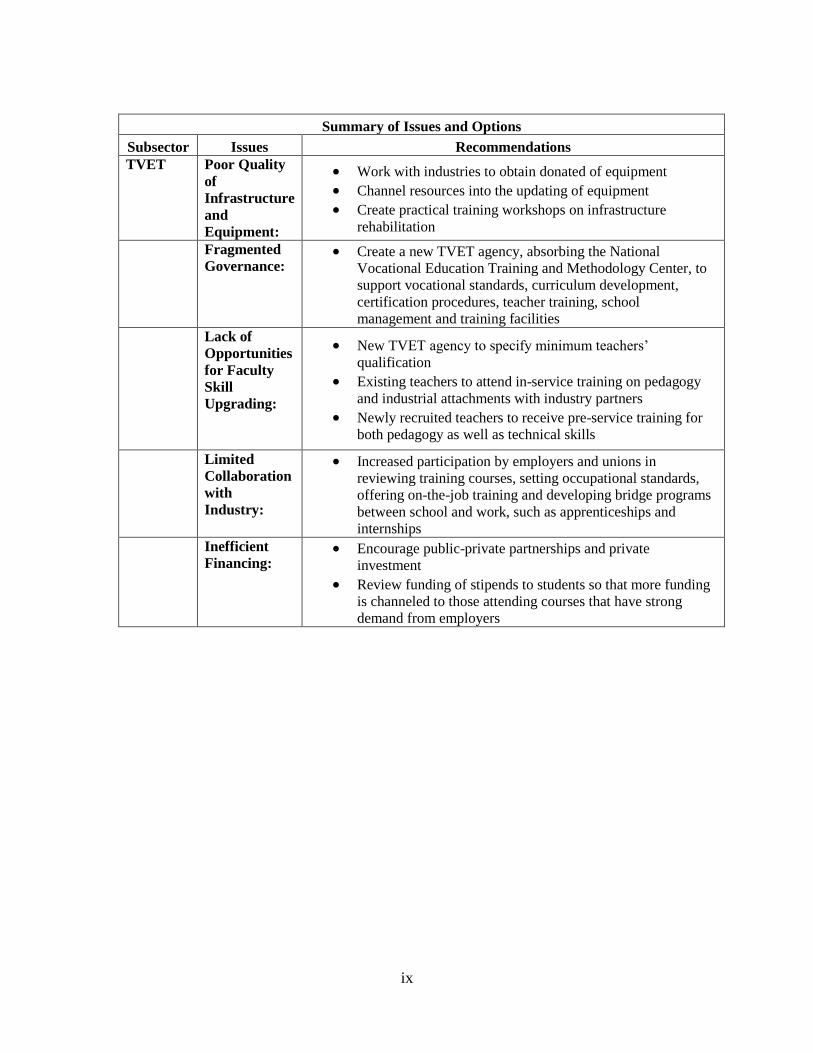
Summary of Issues and Options
Subsector Issues Recommendations TVET Poor Quality
of
Infrastructure
and
Equipment:
Work with industries to obtain donated of equipment
Channel resources into the updating of equipment
Create practical training workshops on infrastructure
rehabilitation
Fragmented
Governance: Create a new TVET agency, absorbing the National
Vocational Education Training and Methodology Center, to
support vocational standards, curriculum development,
certification procedures, teacher training, school
management and training facilities Lack of
Opportunities
for Faculty
Skill
Upgrading:
New TVET agency to specify minimum teachers‟
qualification
Existing teachers to attend in-service training on pedagogy
and industrial attachments with industry partners
Newly recruited teachers to receive pre-service training for
both pedagogy as well as technical skills
Limited
Collaboration
with
Industry:
Increased participation by employers and unions in
reviewing training courses, setting occupational standards,
offering on-the-job training and developing bridge programs
between school and work, such as apprenticeships and
internships Inefficient
Financing: Encourage public-private partnerships and private
investment
Review funding of stipends to students so that more funding
is channeled to those attending courses that have strong
demand from employers
1
1. CHALLENGES TO POST-BASIC EDUCATION
1.1. Educational Development since the Transition
Universities educate future leaders and develop the high-level technical and managerial
capacities that underpin economic growth. Specifically, they perform three critical roles –
teaching, service to the community, and research and development. In an age of rapid
technological change and globalization, the role played by institutions of higher learning is
indispensible: they facilitate regional development and are an integral mechanism of national
development. Recognizing the importance of tertiary education‟s contribution to development,
Mongolia has rightly prioritized reform of its tertiary education system as a key aspect of its
efforts to achieve economic growth and employment-based poverty reduction.
1.1.1. Tertiary Education
Mongolia‟s rapid expansion of its tertiary education system has been a key element in its
successful transition from a planned to a market-based economy, which grew at an annual
average of 9 percent between 2004 and 2008.1 The gross enrollment ratio (GER) increased from
14 percent in 1991 to 47 percent in 2009 (Table 1). The total number of students rose from some 20,000 to about 150,000 during the same period. This rapid growth was stimulated by the
increased demand for skills in the market economy, which has fueled the private demand for
tertiary education, and was enabled by the legalization of private institutions in 1991.
The increase in supply has been driven by private expansion, but state institutions
continue to have a strong presence in the sub-sector. The number of tertiary education
institutions (TEIs) grew from 14 to 151 in 2009, of which 72 percent is private, and has been
accompanied by several positive outcomes. Mongolia‟s GER in tertiary education is more than
twice as high as China‟s 23 percent, and closer to the OECD‟s average of over 55 percent. It
should be noted, however, that although 72 percent of TEIs are private, 66 percent of students
still enroll in public TEIs. The student-to-teacher ratio in Mongolia is 22:1, similar to South
1 The Government’s Economic Growth Support and Poverty Reduction Strategy (EGSPRS) has
specifically called for improving the quality of and access to tertiary education services, and the Government‟s
Education Sector Master Plan (ESMP2) has set the twin goals of establishing a world-class university system and
transforming Mongolia into a knowledge economy. With respect to tertiary education, the ESMP2 identifies three main policies: (1) to upgrade education quality and produce citizens who can function effectively in a modern knowledge economy; (2) to provide education services that can be accessed by students in all parts of the country, including rural areas, and by poor and vulnerable groups; and (3) to improve the management capacity of central and local educational institutions.
2
Korea‟s, although slightly lower than OECD‟s average of 16:1. The availability of student
financial assistance has mitigated to some extent the adverse impact on access.
Table 1: Growth of the Tertiary Education Sector, 1991-2009
1991 2009 % increase, 1991-2009
Share of total,
2009 Number of TEIs 14 151 979% 100%
Public 14 42 200% 28%
Private - 109 - 72%
Number of Students
20,000
150,326 652% 100%
Public 20,000 99,037 395% 66% Private - 50,878 - 34% Source: MECS statistics.
Note: The number of institutions in 2008 was higher, but this table presents the most updated statistics.
In addition to the national education system, Mongolians also have access to education
overseas. During the socialist era, thousands of students attended universities in the former
Soviet Union, as well as Eastern European countries such as East Germany, Czechoslovakia,
Hungary, and Yugoslavia. Many government officials were graduates of overseas universities.
After the transition, the academic connection with Russia and some newly independent states
continued, while many more went to Singapore, Australia, the United Kingdom, and the USA.
The vast majority of these students were self-financed, 80 percent of whom attended institutions
in Singapore. In 2010, the Government of Mongolia (GoM) set up a program to fund and place
Mongolian graduate students into U.S. universities through the Fulbright Program. It is clear that
the formation of high level skills is not restricted to TEIs in Mongolia. Rather, it has a global
reach.
As a result of the rapid development of tertiary education, Mongolia compares well with
other developed countries (Korea, Japan, USA and UK) and middle income countries (such as
Mexico and Brazil) in terms of graduates per 10,000 population (Table 2).
Table 2: Tertiary Graduates per 10,000 Population
2003 2004 2005 2006 2007
Mongolia 73 84 88 91 N/A
Korea 127 126 126 125 125
Japan 81 82 83 84 83
USA 81 84 87 89 90
UK 101 100 105 106 107
Mexico 34 34 37 40 N/A
Brazil 31 36 41 N/A 43 Source: World Bank’s EdStat database, and OECD Education at a Glance (2009).
3
1.1.2. Basic Education
In contrast with tertiary education after the transition, pre-primary, primary, lower
secondary and upper secondary education suffered a severe decline throughout the 1990s and has
only recovered in recent years (Table 3). Both the supply of and demand for these subsectors
have been adversely affected by the contraction of fiscal and household expenditures and by the
dismantling of the collectives and social safety nets which provided these services. These trends
began to reverse starting at the turn of the 21st century.
Table 3: Gross Enrollment Rates by Level, 1991, 1995, 2000 and 2007
Pre-
primary
Primary Lower
Secondary
Upper
Secondary
Tertiary
1991 39% 97% 82% 69% 14%
1995 21% 88% 59% 21% 15%
2000 28% 99% 63% 28% 29%
2007 54% 94%* 89% 54% 47% Source: Edstats 2008 and MECS statistics.
Note: the GER of 94% in 2007 is due to the lowering of the entry age in primary education from 8 to 7 in
2004-5, and from 7 to 6 in 2008-9. This entails expanding the number of school-age children which is used
as a denominator for estimating the enrollment ratio. It does not mean reduced coverage.
Recognizing the importance of providing more and better basic education to all school-
age children on the grounds of equity and the need to deepen human capital, the GoM began an
important structural reform by adding an 11th
year to the primary-secondary education cycle in
2004-2005 and subsequently added a 12th
year beginning in 2008-2009. The reform addresses
the very short (10-year) primary-plus-secondary cycle that existed in Mongolia prior to 2004-
2005.
An analysis of the Living Standard Measurement Surveys (LSMS) of 1998 and 2007
found that due to improved education conditions and the lowering of school-entry age, more
children have entered schools earlier and have stayed longer (Figure 1). It also shows that a
larger group of youths who have completed secondary education continue on to tertiary
education. The same trends are apparent for both boys and girls (Annex 4, Table A4.6).
Compared to 1998, enrollment ratios disaggregated by gender were much higher in 2007; this
trend is particularly pronounced for girls entering secondary school and tertiary education. There
have also been impressive enrollment trends among the rural population (Annex 4, Table A4.7).
While both rural and urban enrollments increased in 2007 compared to 1998, significantly more
rural students have enrolled in secondary education and are staying in the system longer.
4
Figure 1: Enrollment Ratio by Age, 1998 and 2007
Enrollment by Age, 1999 and 2007
0
20
40
60
80
100
120
6 7 8 9 10 11 12 13 14 15 16 17 18 19 20 21 22
Age
En
roll
me
nt
Ra
tio
1998
2007
Source: LSMS, 1998 and 2007.
Figure 1 also shows that enrollment in basic education for the 8 to 15 age group has still
not reached 100 percent. Boys‟, girls‟, rural, and urban student enrollments start tapering off by
age 14, and rural students still have the furthest to go. Overall, Mongolia‟s basic education
completion rate is only 77 percent, lower than other transitional economies, such as Armenia (87
percent) and Tajikistan (90 percent). These data indicate that that Mongolian education policy is
facing the serious challenge of a trade-off between basic and tertiary education in the medium
term and also explain the urban and rural disparity in access to tertiary education.
Demographic trends show that the 20-24 age-group constitutes the largest cohort in the
population in 2010, with 342,000 people, or about 13 percent of the total population (US Census
Bureau projection, also see Annex 2). Therefore the social demand for tertiary education is also
the highest. By 2020, this cohort is projected to decline to 283,000, thereby reducing pressure
for this subsector. This shift presents an opportunity to improve quality while expanding the
gross enrollment ratio for tertiary education, even if everything is held constant. At the same
time, with a total fertility rate of 2.24, the number of school-aged children in the country will
increase by almost 40 percent (Annex 2). The education system will need to adjust to
accommodate greater numbers of students in lower levels of education in the coming decades.
This policy note looks primarily at the tertiary education subsector but also reviews the
technical and vocational education and training (TVET) subsector in order to assess policy
options to meet the demand of the economy and the aspiration of parents and students for social
mobility.
5
1.2. Key Policy Questions Surrounding Tertiary Education
Given the history of Mongolian tertiary education development, three factors appear to be
inhibiting its ability to improve the country‟s competitiveness: (i) low cost and low quality; (ii) a
mismatch between the supply of and demand for skills; and (iii) inequitable access that
perpetuates the wealth gap and rural-urban disparities.
Low-cost and low-quality. First, this subsector has expanded with low cost and low
quality. Due to underfunding, per student public expenditure on tertiary education is about $339,
slightly higher than per student expenditure of $206 in primary education and $285 in secondary
education. This is far below the OECD‟s average of $11,520 (Table 8). Low-cost TEIs can ill
afford to use high salaries to attract qualified faculty members, or invest in better learning
facilities or skill upgrading for staff. A full professor‟s salary in both public and private TEIs is
about $300 a month, with little distinction from that of a school teacher. Insufficient funding has
driven even public tertiary education institutions to rely on the mass admission of fee paying
students for financial sustainability, further driving down the standards.
Poor labor market outcomes and mismatch of skills. A low-cost and low-quality
system that relies on mass enrollment to sustain itself predictably over-produces ill-prepared
graduates with grim employment prospects. In recent years, only about 36 percent of university
graduates were able to find a job (MECS 2008). This is likely due to the over-supply of poorly
prepared graduates in fields with low demand. By comparison, the official employment rate for
TVET graduates was 60 percent2 in 2008.
Data from Mongolia‟s Labor Force Survey indicate that most of those unemployed in
2002-2003 had an educational attainment of either incomplete secondary (34 percent) or
completed secondary (33 percent). Data from the School-to-Work Transition Survey indicate
that, among people aged 15-29, unemployment rates were lower for vocational education
graduates (15 percent) than for general secondary (22 percent) and lower for those with technical
diplomas (8 percent) than for a tertiary degree (12 percent). The labor market outcomes of
graduates from tertiary education and TVET raises serious questions of how best to match supply
with demand.
Inequitable access. There are obvious disparities in enrollment between rural and urban
areas, and between high and low income groups. Although post-basic education has never aimed
for universal access, the inequality in opportunity is striking: 71 percent of all students in tertiary
education come from urban areas, although half of the population live in rural areas. This is in
large part due to lower academic achievement and lower school completion rates of rural
2 This figure is derived from the MECS official statistical yearbook. A World Bank mission recently visited selected
TVET schools in Ulaanbaatar and Selenge. All visited schools reported employment rates in excess of 80 percent,
though they were unable to provide formal tracer study of their graduates. Interviewed school directors said that
they surveyed their students on an informal basis. MECS‟s Information, Monitoring and Evaluation Department
confirmed that there is no formal survey or tracer study to collect data on TVET school leavers by TVET schools.
6
students; the charging of tuition fees presents a prohibitive barrier for aspiration. Fees on average
cost about $300 per annum. However, for herding families with multiple children, it would be
very difficult to finance all children‟s tertiary education. About 67 percent of debts incurred by
herders are spent on higher education. Even if families can borrow to pay for the direct cost of
schooling, few can afford the opportunity cost of not getting their children involved in economic
activities.
It should be noted that student financial assistance from the State Training Fund (STF) is
available to help low income students to offset their cost. However, the fund is poorly targeted
and eligibility covers a number of categories, including civil servants. Thus, the fund cannot be
counted on to offset the tuition fees or living expenses of a tertiary education.
There is a broad consensus in Mongolia that the tertiary education system should aim to
strengthen quality in order to produce the professional and technical manpower to meet the needs
of the economy and improve Mongolia‟s competitiveness. There is also consensus that equity of
access and efficiency of the use of public resources should be improved. There are thus two sets
of policy questions:
Is there an oversupply of tertiary education graduates, given low employment rates?
Should there be a policy to contain the growth of enrolment? If not, what are the options
to improve quality?
What options are available to meet the skill demand of the economy and aspiration for
employment of parents and youths?
This study will examine the following areas in order to answer the aforementioned policy
questions and assess the policy options for both tertiary education and TVET:
Demand for skills: What is the wage premium of the 25-34 age group, compared with
the older age group of 35-55? What are the implications for the demand for skills and,
hence, for the policy towards tertiary education and technical and vocational education
and training?
The impact of governance and finance of tertiary education on quality and equity:
How is tertiary education governed? How has the proliferation of tertiary education
institutions affected the financing of public and private tertiary education, and how have
these financing trends affected equity and quality? Is the existing system of accreditation
adequate to assure quality?
Policy Options for Reform: What should be done to break the vicious cycle of low-cost
and low quality education from the perspective of governance and finance and to protect
the consumer?
TVET as alternative to tertiary education: How feasible is it to channel more students
from tertiary education to TVET? What are the key challenges in TVET? And what
needs to be done to address them?
7
2. THE DEMAND FOR SKILLS
Since the opening of the economy in the early 1990s, Mongolia has experienced a surge
in the demand for skills. This is the underlying factor for the growth in demand for tertiary
education. Better understanding of the demand for skills would help steer education policy with
respect to which subsector and which discipline to invest in, and what kind of trade off needs to
be made.
2.1. Rising Wage Premia for Skills
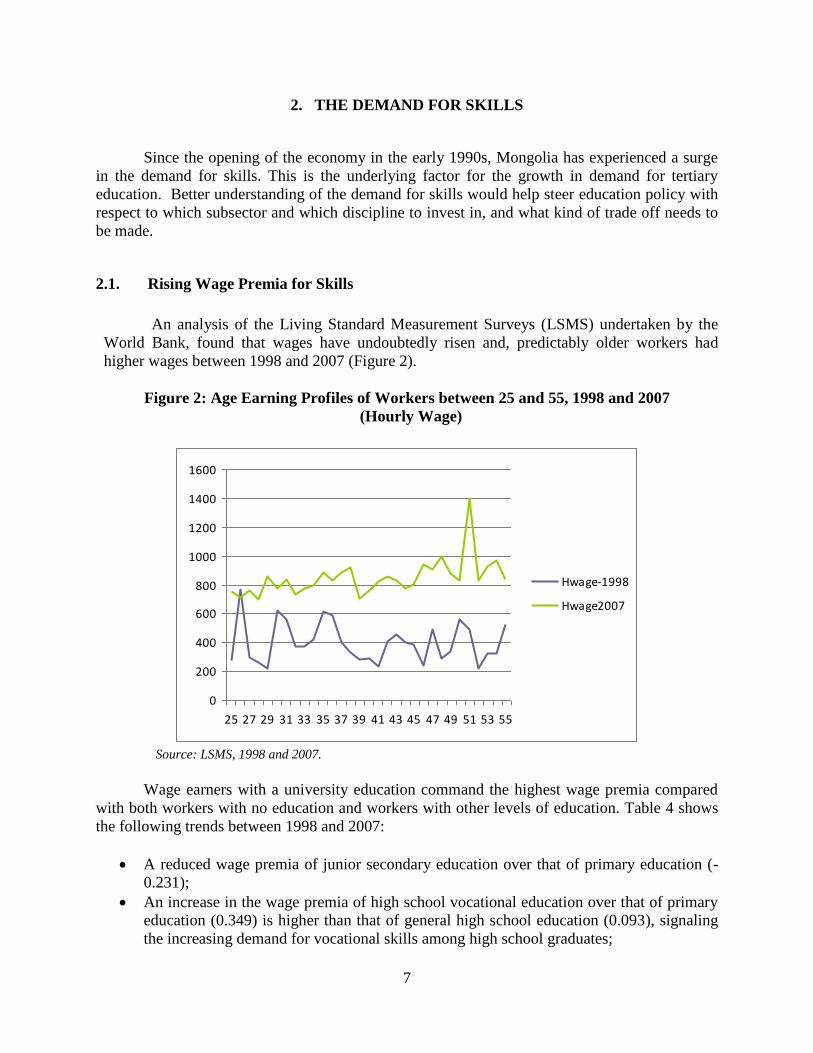
An analysis of the Living Standard Measurement Surveys (LSMS) undertaken by the
World Bank, found that wages have undoubtedly risen and, predictably older workers had
higher wages between 1998 and 2007 (Figure 2).
Figure 2: Age Earning Profiles of Workers between 25 and 55, 1998 and 2007
(Hourly Wage)
0
200
400
600
800
1000
1200
1400
1600
25 27 29 31 33 35 37 39 41 43 45 47 49 51 53 55
Hwage-1998
Hwage2007
Source: LSMS, 1998 and 2007.
Wage earners with a university education command the highest wage premia compared
with both workers with no education and workers with other levels of education. Table 4 shows
the following trends between 1998 and 2007:
A reduced wage premia of junior secondary education over that of primary education (-
0.231);
An increase in the wage premia of high school vocational education over that of primary
education (0.349) is higher than that of general high school education (0.093), signaling
the increasing demand for vocational skills among high school graduates;
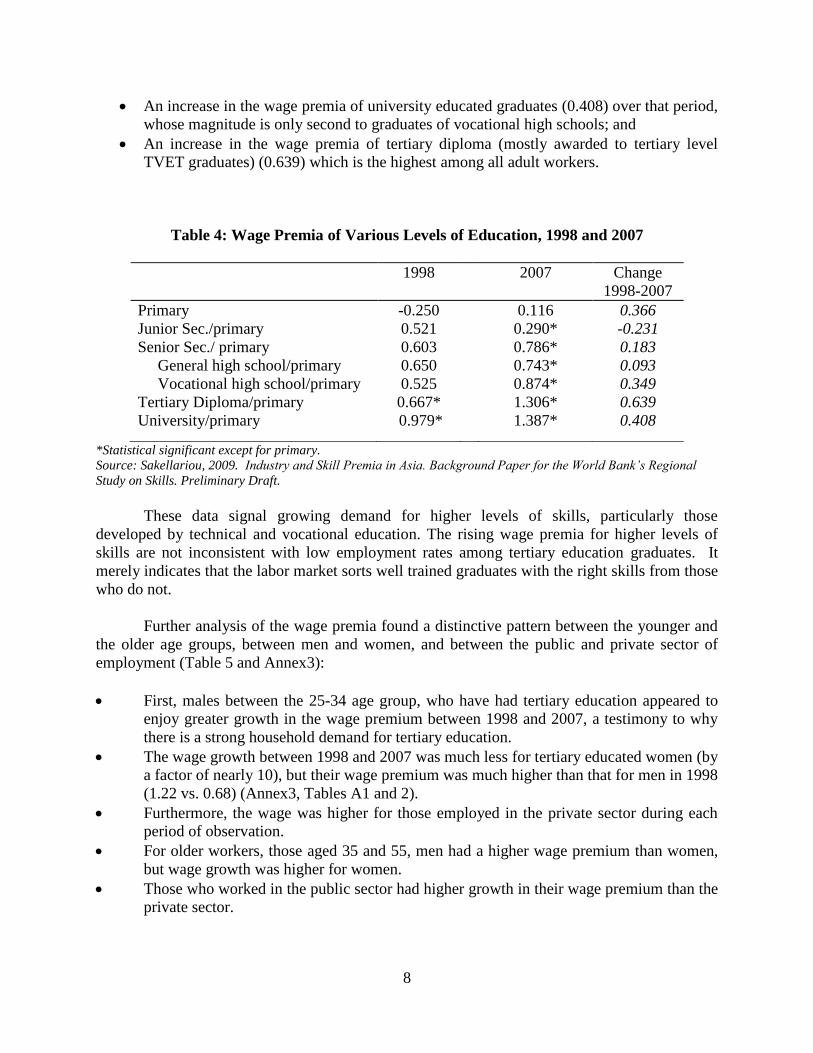
8
An increase in the wage premia of university educated graduates (0.408) over that period,
whose magnitude is only second to graduates of vocational high schools; and
An increase in the wage premia of tertiary diploma (mostly awarded to tertiary level
TVET graduates) (0.639) which is the highest among all adult workers.
*Statistical significant except for primary.
Source: Sakellariou, 2009. Industry and Skill Premia in Asia. Background Paper for the World Bank’s Regional
Study on Skills. Preliminary Draft.
These data signal growing demand for higher levels of skills, particularly those
developed by technical and vocational education. The rising wage premia for higher levels of
skills are not inconsistent with low employment rates among tertiary education graduates. It
merely indicates that the labor market sorts well trained graduates with the right skills from those
who do not.
Further analysis of the wage premia found a distinctive pattern between the younger and
the older age groups, between men and women, and between the public and private sector of
employment (Table 5 and Annex3):
First, males between the 25-34 age group, who have had tertiary education appeared to
enjoy greater growth in the wage premium between 1998 and 2007, a testimony to why
there is a strong household demand for tertiary education.
The wage growth between 1998 and 2007 was much less for tertiary educated women (by
a factor of nearly 10), but their wage premium was much higher than that for men in 1998
(1.22 vs. 0.68) (Annex3, Tables A1 and 2).
Furthermore, the wage was higher for those employed in the private sector during each
period of observation.
For older workers, those aged 35 and 55, men had a higher wage premium than women,
but wage growth was higher for women.
Those who worked in the public sector had higher growth in their wage premium than the
private sector.
Table 4: Wage Premia of Various Levels of Education, 1998 and 2007
1998 2007 Change
1998-2007
Primary
Junior Sec./primary
Senior Sec./ primary
General high school/primary
Vocational high school/primary
Tertiary Diploma/primary
University/primary
-0.250
0.521
0.603
0.650
0.525
0.667*
0.979*
0.116
0.290*
0.786*
0.743*
0.874*
1.306*
1.387*
0.366
-0.231
0.183
0.093
0.349
0.639
0.408
9
Table 5: Wage Premia for Different Levels of Educational Attainment, 1998 and
2007 by Age Group Education Premiums (vs. No Education):
1998 2007 Change (%) (1998-07)
25-34 Age Group Primary Lower Secondary Secondary General completed Secondary Vocational Tertiary Diploma University R-sq adjusted N
(dropped)
0.515 0.392 0.376 0.531 0.827
0.025 384
-0.304 -0.082 0.458*
0.679*** 1.01*** 1.18***
0.180 2,549
-
16.84 80.6 90.2 42.7
35-55 Age Group Primary Lower Secondary Secondary General completed Secondary Vocational Tertiary Diploma University R-sq adjusted N
0.839 1.34**
1.63*** 1.45**
1.61*** 1.94***
0.100 702
0.172
0.554*** 0.976*** 1.15*** 1.64**
1.69***
0.157 4,739
-79.5 -58.7 -40.1 -20.7 1.8
-12.9
Note: Based on a Mincerian regression with basic controls. Percentage changes were not calculated when
premiums for both years were statistically insignificant.
Source: LSMS, 1998 and 2007.
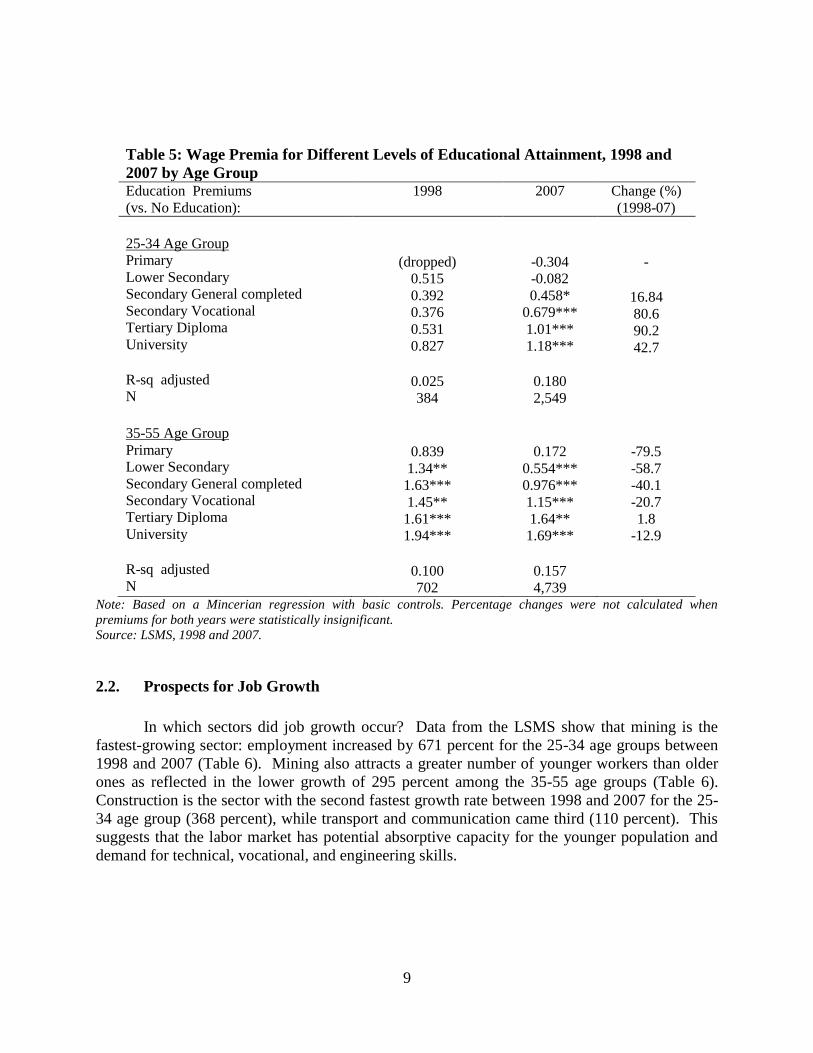
2.2. Prospects for Job Growth
In which sectors did job growth occur? Data from the LSMS show that mining is the
fastest-growing sector: employment increased by 671 percent for the 25-34 age groups between
1998 and 2007 (Table 6). Mining also attracts a greater number of younger workers than older
ones as reflected in the lower growth of 295 percent among the 35-55 age groups (Table 6).
Construction is the sector with the second fastest growth rate between 1998 and 2007 for the 25-
34 age group (368 percent), while transport and communication came third (110 percent). This
suggests that the labor market has potential absorptive capacity for the younger population and
demand for technical, vocational, and engineering skills.
10
Table 6: Distribution of Wage Employees by Sector, 1998, 2002, and 2007
Industry 1998 (%) 2007 (%) Change (%)
(1998-07)
- 25-34 Age Group
Agriculture
Mining
Manufacturing
Utilities
Construction
Trade
Transport/Commun.
Public admin.
Services
(n=383)
4.18
0.78
4.69
3.39
2.08
9.89
6.77
25.52
42.56
(n=2,579)
1.86
6.01
9.93
3.44
9.74
11.02
14.19
9.55
34.25
-55.5
670.5
111.7
1.5
368.3
11.4
109.6
-62.6
-19.5
35-55 Age Group
Agriculture
Mining
Manufacturing
Utilities
Construction
Trade
Transport/Commun.
Public admin.
Services
(n=700)
6.43
1.28
4.70
3.85
3.56
5.13
7.26
22.36
45.29
(n=4,780)
3.28
5.06
9.50
5.84
8.37
7.85
10.66
10.91
38.52
-49.0
295.3
102.1
51.7
135.1
53.0
46.8
-51.2
-14.9 Source: LSMS, 1998 and 2007.
This labor market snapshot is corroborated by the rising importance of these sectors in
the economy. Mongolia is well endowed with mineral deposits, including copper, coal, gold, and
uranium. Revenue from the mining sector, for example, contributed nearly 45 percent of the
2008 state budget and accounted for nearly 28 percent of GDP. The Erdenet mining company
alone accounted for 12 percent of the country‟s GDP in 2008. The transportation and
communications sectors accounted for nearly 13 percent of GDP.
These trends are likely to continue in the future. Because of Mongolia‟s mineral wealth,
many investors have shown great interest in the high growth potential in South Gobi, where there
is a huge deposit of coal, gold, and copper. As the World Bank‟s Southern Infrastructure Strategy
for Mongolia points out, the need for skilled mining and construction workers will be very large
in the region and is expected to require at least 7,000 additional workers. These workers would
be involved in various infrastructure development projects surrounding the mines such as
township development, road construction, mine equipment operations and maintenance, and
railway construction. Besides the increased quantity of imported labor expected to be brought in
to the region, training facilities will need to be established to help locals benefit from new
mining-related jobs, help upgrade locals‟ skills, and ensure a supply of suitably skilled labor to
the mining industry.
11
Over the medium term, mining companies are beginning to prepare for the transformation
of the sector. Ivanhoe Mines Mongolia LLC, for example, expects to hire 3,000 workers in the
region for its steady-state operations and about 8,000 workers during the construction phase of
its mining work in the South Gobi. Energy Resources LLC also forecasts a similar jump: it aims
to double the current number of workers to 800 by end of 2009 and 1,500 in three years‟ time.
Both companies are concerned about the inadequacy of competent (skill and knowledge) workers
and wish to be actively involved in the training of mine workers through formal collaboration
with MECS. Some of these companies are planning to bring in migrant workers (mostly from
neighboring China) to work until Mongolian workers are available.3
Similarly, the Mongolia Employers‟ Federation, a national NGO representing the interest
of 8,300 businesses in Mongolia, has acknowledged the gap between the expectations of
employers and the technical competencies of TVET graduates. They have argued that TVET
graduates appear to have very little competence with regards to occupational health and safety or
high technological skills and are currently advocating for curricular reform in the subsector.
The sentiment expressed by these employers appears to be supported by data on student
enrolment by discipline (Annex 5). Only 23 percent of students are enrolled in science and
technology courses in 2008 (areas in demand by employers), versus over 50 percent who
enrolled in the social sciences and the arts (areas with low demand). It is not surprising, then,
that a skills mismatch dominates the labor market.
Thus, given the potential for development, there appears to be a strong need to improve
the quality of tertiary education and realign the supply of skills to the demands of the labor
market. To do this entails reforming this subsector in several important ways, detailed in the
following sections.
2.3. Migrant workers
The above description of the labor market does not include migrant workers. South Korea
is the most important destination for Mongolian export workers. There are roughly 30,000
Mongolians, in addition to the domestic workforce of 1.1 million, working in South Korea. If the
self-employed and herders are excluded as denominator, the wage earning jobs in South Korea
may add about 6 percent to the total number of jobs. There are other jobs held by Mongolians in
neighboring and far away countries, although such statistics are not available.
At the same time, there are about 15,000 Chinese migrant workers in Mongolia, mostly in
construction. Some of these jobs filled by Chinese workers are low wage jobs which are not
attractive to Mongolians. Others are skilled jobs for which Mongolians may not be qualified.
In the age of globalization, it would no longer be viable to plan for education with only
the national labor market in mind. Remittances from migrant workers have increasingly become
a major source of wealth and migration relieves pressure on the domestic labor market. In
Bangladesh, for example, which is also a large labor-exporting country to the Middle East and
3 Interview with mining official.
12
Southeast Asia, remittances from migrant workers amount to 10 percent of GDP. Hence, in
making policy for education, Mongolia would be well served by taking into account the demand
for skills beyond its border.
2.4. Conclusion
On the basis of the above evidence, given the potential for development, there appears to
be a strong need to improve the quality of tertiary education and realign the supply of skills to
the demands of the labor market. To do this entails reforming not only tertiary education but
also technical and vocational education in several important ways.
13
3. THE IMPACT OF GOVERNANCE AND FINANCING ON QUALITY AND EQUITY
OF TERTIARY EDUCATION
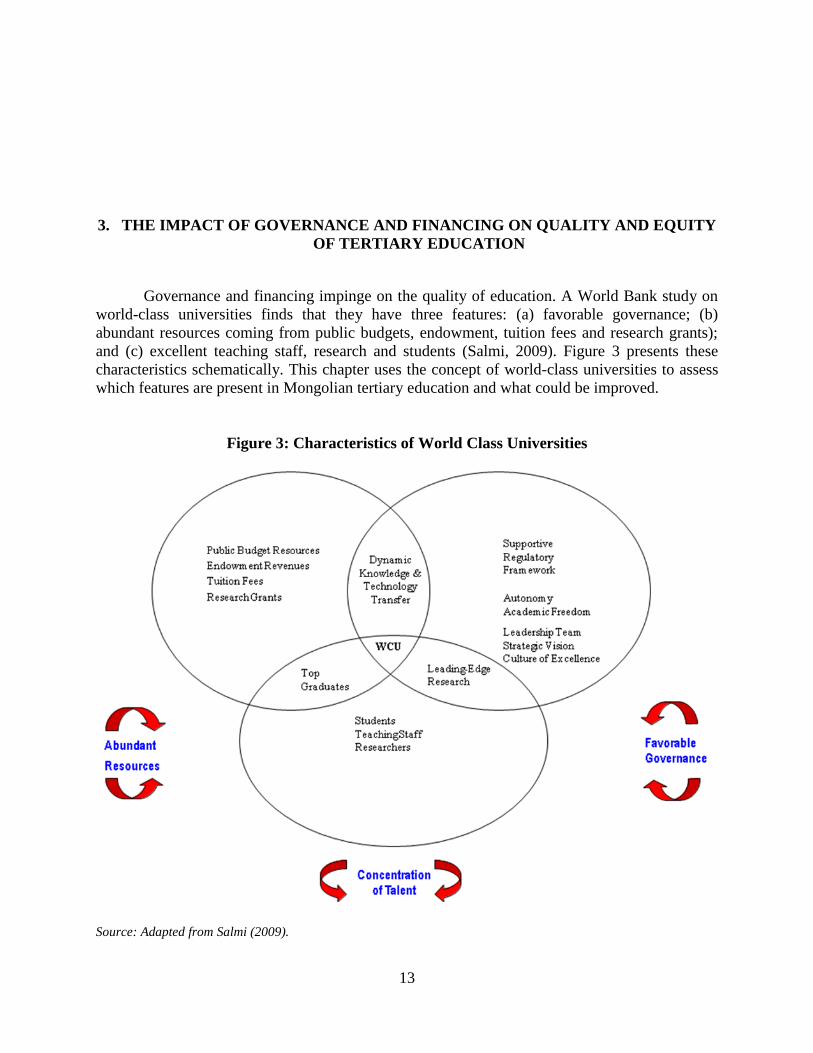
Governance and financing impinge on the quality of education. A World Bank study on
world-class universities finds that they have three features: (a) favorable governance; (b)
abundant resources coming from public budgets, endowment, tuition fees and research grants);
and (c) excellent teaching staff, research and students (Salmi, 2009). Figure 3 presents these
characteristics schematically. This chapter uses the concept of world-class universities to assess
which features are present in Mongolian tertiary education and what could be improved.
Figure 3: Characteristics of World Class Universities
Source: Adapted from Salmi (2009).
14
3.1. Governance
Governance encompasses the framework in which an institution pursues its goals and
policies in a coherent and coordinated manner. Governance structures are extremely diverse
across countries. On one side of the spectrum is the highly decentralized system in the USA with
state university systems for publicly funded universities and private universities governed by
their own board. On another side of the spectrum are British Commonwealth countries (UK,
Australia, India, Pakistan, etc) where tertiary education is steered by the Commission on Higher
Education, or the University and Polytechnic Grants Commission, which are independent from
the Ministry of Education, often comprise of representatives from industry and the private sector,
as well as academics from other countries, and allocate budgets based on multi-year plans
generated by tertiary education institutions. On yet another side of the spectrum lays countries
whose ministries of education make policy for tertiary education. While there is no single system
that is intrinsically better than others, there are elements associated with favorable governance.
These are a supportive regulatory framework, institutional autonomy, academic freedom, strong
leadership with strategic vision, and a culture of excellence (Salmi, 2009).
3.1.1. The Public Sector
There were 42 public TEIs in Mongolia, accounting for 28 percent of total institutions,
enrolling about 99,000 students, or 66 percent of total enrollment. The premium universities are
in the public sector. These are the National University of Mongolia (NUM), the Mongolian
University of Science and Technology (MUST), the Mongolian State University of Education
(MSUE), the Health Sciences University of Mongolia (HSU) and the Mongolian State University
of Agriculture (MSUA). NUM is strong on law, international studies, languages, economics, and
geology. MUST‟s strength is in mining and computer sciences. Newer ones such as the
University of Finance has the best MBA program in the country. The plan is to consolidate the
public TEIs into 16 universities.
Mongolian tertiary education is administered directly by the Ministry of Education,
Science and Culture (MECS) and regulated by the Law on Higher Education and a number of
statutes. The Department of Higher Education is in charge of policy formulation. The Minister of
Education has overall responsibility for tertiary education. Public universities are accountable to
MECS.
The Minister has an advisory council which is composed of individuals selected by the
Minister himself and provides advice on a broad range of issues covering education, culture and
science. Advisory council members are often from the higher education subsector. This council
meets irregularly, at the Minister‟s request, and does not have decision-making authority.
There is no formal council or internal unit mandated for strategic planning for tertiary
education. The usual practice is to form an ad hoc group, always with funding from outside
(usually a development partner such as the Asian Development Bank). The ad hoc group is
composed of Ministry staff and representatives from other ministries and other relevant parties.
15
The main strategic paper such as the Master Plan for Education is submitted to the cabinet for
approval or endorsement. Sometimes, development partners are invited to comment or endorse
jointly (which was happened in case of the 2006 Master Plan). Operational planning is based on
longer term strategic plans, and initial suggestions and proposals are collected from line
departments of the Ministry and synthesized by the Department of Finance and Investment
which makes final costing. After the Minister‟s endorsement, the plan becomes an obligation to
be implemented by officials who are indicated to be in charge.
The presidents or rectors of public universities are appointed by the Minister of
Education, although the Civil Service Sub-Committee led by the State Secretary of MECS is
responsible for selection. Each TEI has a Board of the Directors. According to legislation
(Education Law and Higher Education Law), the government sets common procedures and
regulations in the form of charters and bylaws. Institutions are authorized to make some
adaptation when they adopt their own institutional bylaws reflecting specifics of the institution,
giving them some room to maneuver. Therefore, the internal institutional power distribution can
be controlled by the President. Institutional bylaws are subject to approval of the institutional
governing board. However, in practice, board members tend to approve the president‟s
suggestions with no or minor change. Presidents of public institutions sign a contract indicating
performance outputs annually, so the Minister can set specific conditions and targets that may
streamline or limit the actions of the president.
The Mongolian National Council for Education Accreditation (MNCEA) accredits new
private TEIs, but its coverage remains low. In recent years, program accreditation has also been
instituted. Numerous programs, especially in the fields of economics and management,
engineering, have been accredited by special bodies authorized by the National Council and
MECS and subject to the National Council‟s formal endorsement.
Faculty members are appointed by the rectors. If faculty members commit misconduct,
there is a moral committee in each public institution to judge them and determine the penalty. In
general, Labor Codes and other internal procedures of the higher education institutions are
applied in such cases. However, if faculty members are incompetent or out-of-date in their
teaching contents, there is no remedy. MECS does not get involved in the dismissal of faculty
members from public universities, although in principle this is possible.
3.1.2. The Private Sector
Since the passage of the 1991 Education Law that established the legal basis for private
universities and institutions, it has not been difficult to obtain a license to run a private college in
Mongolia. All that was required was to have adequate facilities, a faculty, a library, and financial
resources. With the increasing demand for tertiary education in the country and the fact that
colleges do not pay value-added or profit taxes, investing in private colleges is lucrative for
many. As a consequence private institutions have grown from zero to 144 in 2007. Only about 20
percent private institutions or 29 out of 144 have been accredited.
All regulatory and legislative norms apply to all TEIs regardless of their ownership. So,
private institutions are also required to observe educational standards for designing and
16
performing their academic programs, and their internal processes should comply with „typical‟
regulations established by the Ministry. There is, however, one major difference between private
and public TEIs. The presidents of private TEIs are appointed by the owner, or are themselves
the owner. Their power is not curtailed by any external body. There is no board required for
private TEIs.
The expansion of higher education has not contributed to regional development as much
as it should, as the vast majority of private TEIs are located in Ulaanbataar. Private TEIs are
accountable to their owners who appoint the directors and staff.
Private TEIs are very small, averaging 468 students per institution, closer to the size of a
high school than a university. By contrast, many American and Asian universities have over
10,000 students. Many Mongolian private institutions offer only a single field of study, such as
business. Private TEIs‟ faculty members also have lower academic qualifications. Only 15
percent have PhDs, compared with 24 percent of public TEIs, suggesting that private TEIs are
not oriented towards research. They also have many part-time staff, who were working full time
in public TEIs. Private TEIs‟ limited course offering reduces the quality of education, as students
do not receive a general education that would enable them to have broad-based knowledge, make
connections across different fields, think creatively, develop the skills to learn on their own,
communicate well with others, and be entrepreneurial in their future career.
There is also no regular, national information about the graduation rates and employment
rates of each of the public and private TEIs. Policymakers do not have the evidence to steer
tertiary education with respect to the strengths and difficulties of each institution.
3.2. Accreditation and Quality Assurance
Good governance always has a built-in mechanism for quality assurance (QA) and
academic excellence, as well as public accountability. Accreditation is akin to institutional peer
review, in which a community of experts performs impartial review. In the age of mass tertiary
education, and liberalization of service provision, educational accreditation carries an especially
important role. Accreditation is an integral part of quality assurance. In this process, an external
body evaluates the services and operations of an educational institution or program to determine
if the required standards are met. If standards are met, accredited status is granted by the agency.
In most countries, the function of educational accreditation is conducted by a government
agency. In the USA, QA is independent of the government and performed by private
membership associations.
The Mongolian National Council for Education Accreditation (MNCEA) has been in
operation since 1998. It is responsible for accrediting TEIs and TVET centers. Institutional
accreditation remains voluntary.
MNCEA is self-financed exclusively from the accreditation services they provide to
applying institutions. The Council is chaired by the Minister and composed of rectors of
universities and colleges accredited by the Council. Although it is an independent agency, since
17
the Council is chaired by Minister, it functions very much like a part of the Ministry but funded
from service fees charged to applying institutions. Since it is sustained by fee paying institutions,
its financial viability is precarious.
MNCEA includes the Board of the National Council, Executive Office, 6 full time
officers, 13 accreditation council members for TEIs and 11 accreditation council members for
TVET institutions. The Council also employs over 150 external evaluators on a part-time basis.
Since its establishment the Council has accredited 91 TEIs including state-owned universities,
institutes and colleges, vocational education and technical training centers and private higher
education institutions.
MNCEA has established a two-step process for the assurance of quality in higher
education institutions, vocational and technical training centers and their educational activities.
First institutions wishing to be accredited submit a self-assessment to MNCEA detailing its
operational and pedagogical practices. Subsequently a team of visiting external assessors visits
the institution for an on-site accreditation to interview faculty and students, review assignments,
classroom practices, academic publications, and staff academic qualifications. Assessors accredit
an institution based on the major criteria for accreditation in Mongolia, namely: (i) whether an
institution has a clear and publicly stated mission; (ii) whether an institution has made progress
towards achieving that mission; (iii) whether an institution has established the extent to which
resources of the institution are directed and organized toward achieving its stated educational
objectives; and, (iv) whether an institution has demonstrated the integrity and commitment to the
accomplishment of its mission.
Program accreditation began in early 2000s. Now numerous programs, especially in the
fields of economics, management, and engineering, are accredited by special bodies authorized
by the National Council and the ministry. Program accreditation is a process subject to the
National Council‟s formal endorsement. All tertiary programs need to comply with standards
approved by the National Standardization Council but there is no mechanism of enforcement.
The criteria used for accreditation are not derived using international benchmarks. The
external assessors do not include international members. Also, the accreditation work has mainly
focused on new private TEIs. There is no periodic review of academic programs, new or
existing, under public TEIs. Until recently, there was little quality assurance or public
accountability. However, the 2003 Higher Education Law introduced a new form of audit, which
can be initiated by the Ministry to examine whether an institution performs in compliance with
established common criteria. The degrees and diplomas dispensed by accredited private
institutions are assumed to confer recognition of the completion of an academic program of at
least minimal quality.
The current challenge for the Government is to strengthen the quality assurance and
accreditation system in a way that can to improve its links with the labor market, begin to
reference international benchmarks in developing the criteria for accreditation, and further
engage with distance and overseas learning activities. It also should reexamine its system of
incentives and sanctions and provide students with more and better information regarding the
quality of institutions and programs.
18
3.3. Finance
3.3.1. Public Expenditure on Education
Level of public spending. Currently, Mongolia spends between 6 and 7 percent of its
gross domestic product (GDP) on education, a level of spending similar to former socialist
economies and higher than the OECD‟s average of 5.8 percent. This level of public spending
reflects the high cost of service delivery to a population dispersed over vast territory, as well as
the harsh climate.
As a percentage of total government expenditures, public spending on education has been
consistently above the East Asian average of 16.2 percent (see Table 7 for trends). The high
spending on education reflects the value Mongolia places on education. Even during the global
economic crisis in 2009, the education budget has not been cut. As the overall public expenditure
shrank, the share of education increased to 30 percent of the total public expenditure. The high
share of public spending on education suggests that there is not much fiscal space for a further
increase, at least in the medium term.
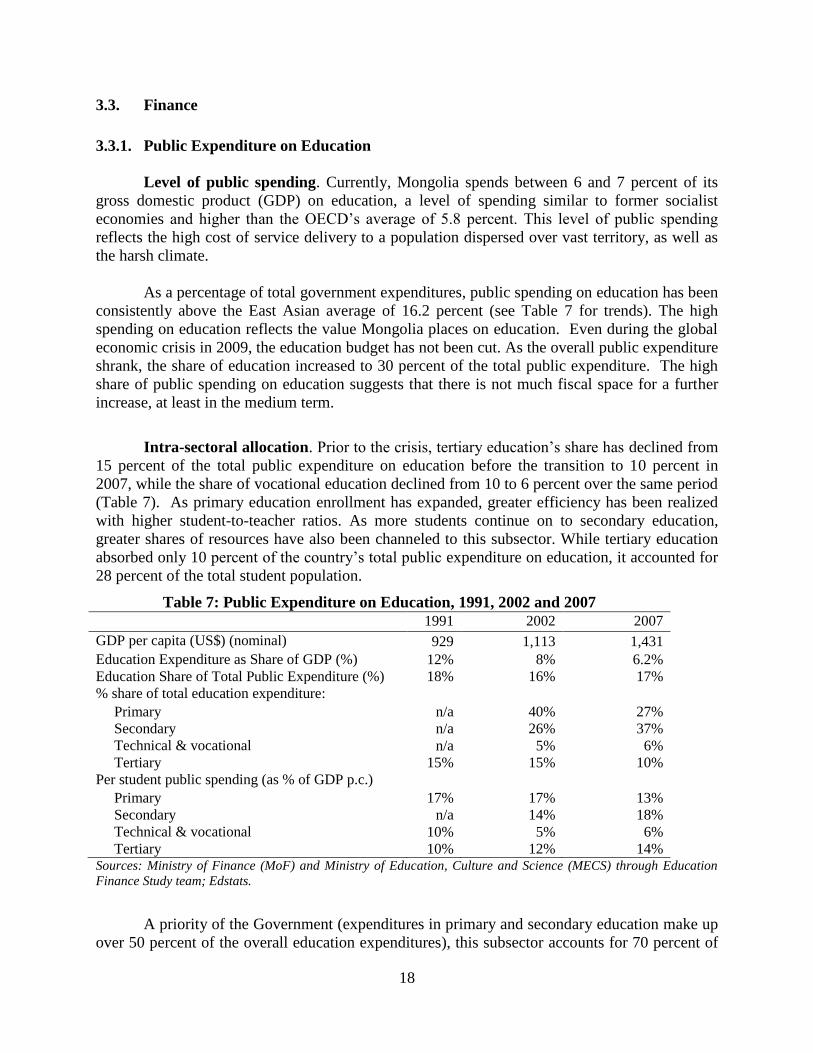
Intra-sectoral allocation. Prior to the crisis, tertiary education‟s share has declined from
15 percent of the total public expenditure on education before the transition to 10 percent in
2007, while the share of vocational education declined from 10 to 6 percent over the same period
(Table 7). As primary education enrollment has expanded, greater efficiency has been realized
with higher student-to-teacher ratios. As more students continue on to secondary education,
greater shares of resources have also been channeled to this subsector. While tertiary education
absorbed only 10 percent of the country‟s total public expenditure on education, it accounted for
28 percent of the total student population.
Table 7: Public Expenditure on Education, 1991, 2002 and 2007
1991 2002 2007
GDP per capita (US$) (nominal) 929 1,113 1,431 Education Expenditure as Share of GDP (%) 12% 8% 6.2% Education Share of Total Public Expenditure (%) 18% 16% 17% % share of total education expenditure: Primary n/a 40% 27% Secondary n/a 26% 37% Technical & vocational n/a 5% 6% Tertiary 15% 15% 10% Per student public spending (as % of GDP p.c.) Primary 17% 17% 13% Secondary n/a 14% 18% Technical & vocational 10% 5% 6% Tertiary 10% 12% 14% Sources: Ministry of Finance (MoF) and Ministry of Education, Culture and Science (MECS) through Education
Finance Study team; Edstats.
A priority of the Government (expenditures in primary and secondary education make up
over 50 percent of the overall education expenditures), this subsector accounts for 70 percent of
19
all students in Mongolia. In the near term as the system expands to 12 years, this sector will
require additional resources to finance the additional grade level and achieve universalization
targets. In particular, while government spending on kindergarten has remained relatively
consistent over the years, funding for kindergartens may become more of a priority in the coming
years to encourage on-time enrollment of six year-olds to grade 1.
In the medium-term, Mongolia faces hard choices. On the one hand, it has to protect
spending on basic education. On the other hand, it has to ensure that the system produces well
trained and flexible professional, technical, and vocational manpower needed for economic
development. Given the resource constraints, it was an equitable use of public finance for
Mongolia to use cost recovery to finance higher education, thereby making available more public
resources to fund basic education.
In the long-term, however, as Mongolia is expecting the development of mineral
resources to bring in revenue for investment in education, it will have to think through how best
to use its new windfall to make its education system world class. Thus, educational strategy must
plan for two potentially very different medium- and long-term scenarios.
3.3.2. Financing of Tertiary Education
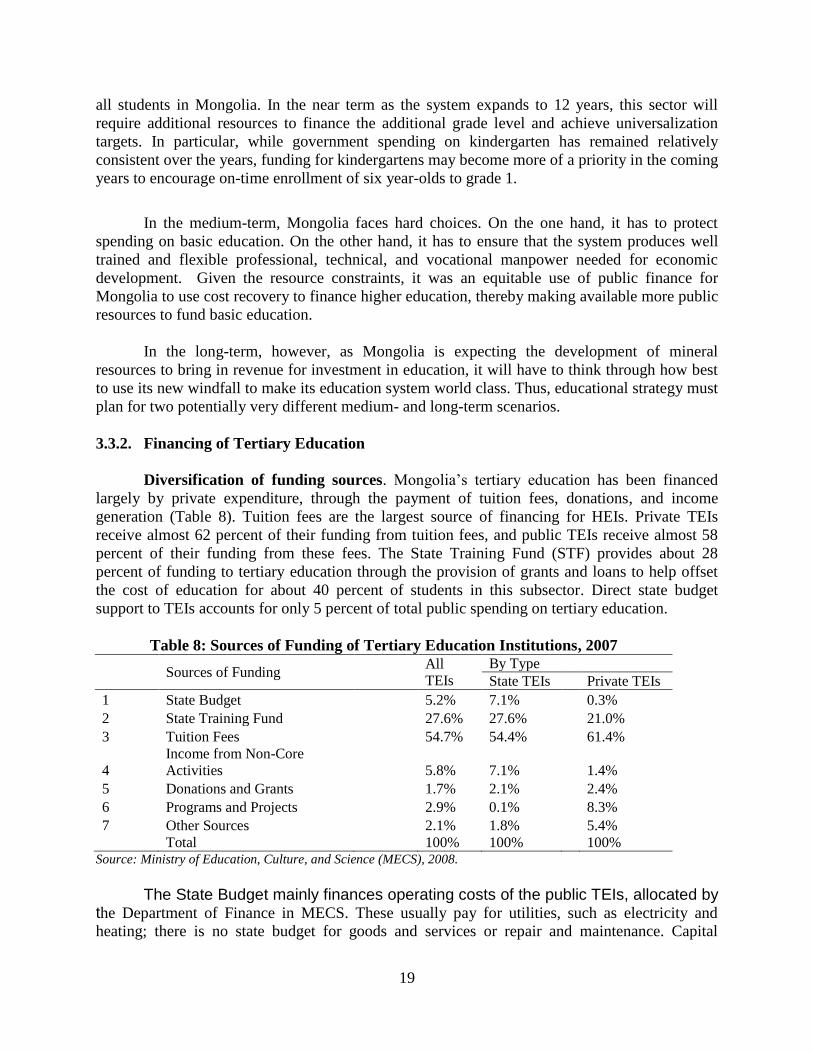
Diversification of funding sources. Mongolia‟s tertiary education has been financed
largely by private expenditure, through the payment of tuition fees, donations, and income
generation (Table 8). Tuition fees are the largest source of financing for HEIs. Private TEIs
receive almost 62 percent of their funding from tuition fees, and public TEIs receive almost 58
percent of their funding from these fees. The State Training Fund (STF) provides about 28
percent of funding to tertiary education through the provision of grants and loans to help offset
the cost of education for about 40 percent of students in this subsector. Direct state budget
support to TEIs accounts for only 5 percent of total public spending on tertiary education.
Table 8: Sources of Funding of Tertiary Education Institutions, 2007
Sources of Funding All
TEIs By Type
State TEIs Private TEIs
1 State Budget 5.2% 7.1% 0.3%
2 State Training Fund 27.6% 27.6% 21.0%
3 Tuition Fees 54.7% 54.4% 61.4%
4 Income from Non-Core
Activities 5.8% 7.1% 1.4%
5 Donations and Grants 1.7% 2.1% 2.4%
6 Programs and Projects 2.9% 0.1% 8.3%
7 Other Sources 2.1% 1.8% 5.4% Total 100% 100% 100%
Source: Ministry of Education, Culture, and Science (MECS), 2008.
The State Budget mainly finances operating costs of the public TEIs, allocated by
the Department of Finance in MECS. These usually pay for utilities, such as electricity and
heating; there is no state budget for goods and services or repair and maintenance. Capital
20
investment in facilities, equipment, and laboratories is decided by the Board of Directors in each
public TEI. If the TEI does not have the resources to fund investment, the Board of Directors
will present their request to MECS which consolidates the proposals from different TEIs and
presents the draft to the Ministry of Finance (MoF) where major negotiations take place. Then
MoF submits the proposal to the Cabinet discussion. The Cabinet submits the final draft to the
Parliament. At the Parliament, all Standing Committees discuss the proposal where individual
MPs can propose specific funding or investment. At this stage, lobbying for specific programs
and projects takes place. Once the Parliament approves the budget with a specified itemized
allocation, the Cabinet, the Minister and other authorities are charged to execute the plan. The
dependency on MECS and Parliamentary approval for funding, the vulnerability to lobbying
efforts, and the lack of TEI‟s own endowment, reduces institutional ability to plan and act.
Funding is on a short-term basis and unpredictable and undermines medium-term planning and
institutional development.
Salaries, which constitute roughly 60 percent of total expenditure on higher education,
are funded by tuition fees.4 There is a strong incentive to expand enrollment irrespective of the
capacity of the faculties to deliver and labor market outcomes. In general, faculty salaries are not
that much higher than teachers‟ salaries, making teaching unattractive for people with high levels
of skills, particularly if they are young and well trained. Since the Parliament approves
investment budget, public institutions are accountable to the government. Furthermore, as
demand for tertiary education outstrips supply, there is little incentive for TEIs to be accountable
to the students they serve, or to provide information about their own performance in order to
facilitate the consumer of education to make informed decision about enrollment and field of
study.
For research, there are two types of research grants, given on a competitive basis. The
first grant is given through the Mongolian Academy of Sciences to the scientists and researchers.
Every year up to 16 people receive the grant for an amount of up to 4,000,000 MNT (US$3,600).
They are those who carried out a high level theoretical research and those who need funding for
their research work, which was approved to be applicable into practice. By comparison, the USA
National Institute of Health‟s annual budget ranges from US$26-30 billion, and a research grant
can run into the amount of hundreds of million dollars.
The second grant is received by young scientists for their outstanding research work.
Every year a conference on scientific research is held and young scientists present their research
work. The Commission of Young Scientists select the top ten young scientific works by each
sector based on the decision of the conference on scientific research and the MECS endorses the
decision to select the young scientists to receive the grant.
There is no financial scheme to provide incentives to encourage efficiency, for example,
the allocation of the budget by the number of students who graduate on time, the number of
students who find a job, or to reward publications in international peer reviewed journals. The
4 A May 2009 World Bank mission selectively examined the categorical expenditures of six universities in
Ulaanbaatar and found that these universities spent between 55 and 68 percent of their revenue on staff and teacher
salaries. In several instances, expenditures on equipment and facilities were largely financed by private donations
(e.g., computer laboratories in two universities were sponsored by private commercial interests).
21
lack of resources to fund improvement in facilities, improvement of the teaching and learning
environment (laboratories, libraries, etc.), faculty upgrading, research, and conference
participation has hampered the ability of Mongolian tertiary universities to deliver high quality
education.
According to official statistics, 25 percent of faculty members in public universities are
part-time staff, seriously affecting the quality of teaching and research. Only 16 percent of
faculty members in all public universities have a doctoral degree, while about 43 percent have
masters‟ degrees. In private universities, only 5 percent have doctoral degrees and 23 percent
have master‟s degrees (Annex 7). There is no predictable funding for the upgrading of
qualifications for faculty members or for attending international conferences, and there is no
systematic tracking of faculty members‟ publication and research efforts.
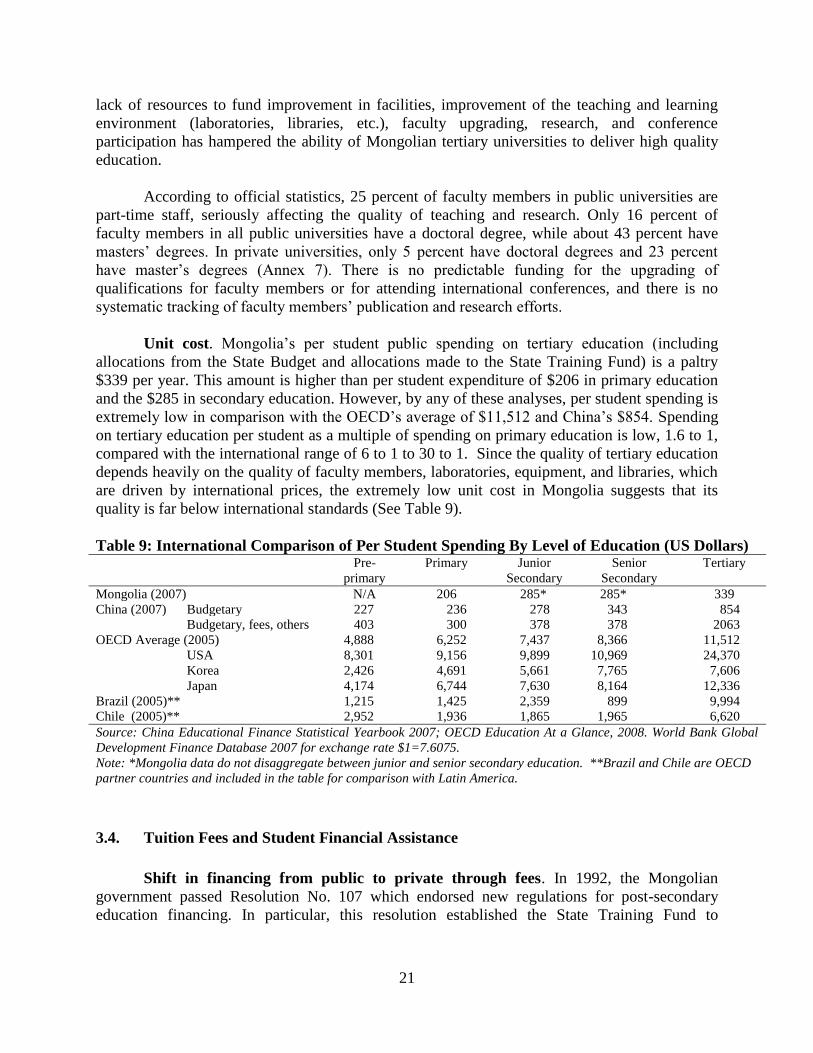
Unit cost. Mongolia‟s per student public spending on tertiary education (including
allocations from the State Budget and allocations made to the State Training Fund) is a paltry
$339 per year. This amount is higher than per student expenditure of $206 in primary education
and the $285 in secondary education. However, by any of these analyses, per student spending is
extremely low in comparison with the OECD‟s average of $11,512 and China‟s $854. Spending
on tertiary education per student as a multiple of spending on primary education is low, 1.6 to 1,
compared with the international range of 6 to 1 to 30 to 1. Since the quality of tertiary education
depends heavily on the quality of faculty members, laboratories, equipment, and libraries, which
are driven by international prices, the extremely low unit cost in Mongolia suggests that its
quality is far below international standards (See Table 9).
Table 9: International Comparison of Per Student Spending By Level of Education (US Dollars) Pre-
primary
Primary Junior
Secondary
Senior
Secondary
Tertiary
Mongolia (2007) N/A 206 285* 285* 339
China (2007) Budgetary 227 236 278 343 854
Budgetary, fees, others 403 300 378 378 2063
OECD Average (2005) 4,888 6,252 7,437 8,366 11,512
USA 8,301 9,156 9,899 10,969 24,370
Korea 2,426 4,691 5,661 7,765 7,606
Japan 4,174 6,744 7,630 8,164 12,336
Brazil (2005)** 1,215 1,425 2,359 899 9,994
Chile (2005)** 2,952 1,936 1,865 1,965 6,620
Source: China Educational Finance Statistical Yearbook 2007; OECD Education At a Glance, 2008. World Bank Global
Development Finance Database 2007 for exchange rate $1=7.6075.
Note: *Mongolia data do not disaggregate between junior and senior secondary education. **Brazil and Chile are OECD
partner countries and included in the table for comparison with Latin America.
3.4. Tuition Fees and Student Financial Assistance
Shift in financing from public to private through fees. In 1992, the Mongolian
government passed Resolution No. 107 which endorsed new regulations for post-secondary
education financing. In particular, this resolution established the State Training Fund to
22
administer and manage financial aid programs for students.5 These new financing measures
drastically reduced the number and amount of government subsidies to the tertiary education
subsector that had been a staple since the Soviet-era. The new legislation allowed institutions to
begin charging tuition and fees up to the amount of per student variable costs, enforced tuition
grants for students enrolled within the state quota, provided need-based tuition and stipend loans
to students, and provided TEIs with government subsidies to cover the fixed costs of their
operations.
Since that time, public funds have been channeled to tertiary education institutions
through the STF. As a proportion of funding, the State Budget itself provides a relatively small
percentage of funds to TEIs. The STF funds themselves, however, are not well targeted to the
poor. Only 39 percent of students receive funds based on needs or disadvantaged status, while 40
percent are children of civil servants (Table 10).
Table 10: State Training Fund Recipients by Program Area
2003 2004 2005
Grants Number % Number % Number %
Need-based Grants 8,119 23.3 13,294 33.5 13,831 33.5 Disadvantaged Group Grant
2,216 6.4 2,454 6.2 2,149 5.2
Merit-based Grants 153 0.4 149 0.3 126 0.3 Public Employee Family Grant 15,915 45.7 16,335 41.2 16,428 39.8 Loan 8,409 24.2 7,390 18.6 8,696 21 Total 34,812 100 39,622 100 41,230 100
Source: Ministry of Education, Culture and Science, 2007.
Tuition fees have constituted a barrier to aspiration for higher education for the poor, if
not a barrier to entry. Mongolian bachelor‟s degree students pay an average of 383,000 tugriks
(US$270) per academic year, which is roughly 16 percent of the Gross National Income per
capita. This is higher than most OECD countries, on par with South Korea, and lower than
Chile‟s (see Table 11 for international comparison). The fee levels in private TEIs are similar.
When living expenses are included, an average student would have to spend over 150,000
additional tugriks (over US$120) per year. The policy of cost recovery is cushioned, to some
extent, by the availability of grants and loans to students through the State Training Fund (STF).
On average, a recipient student would receive assistance in the amount of 80 percent of tuition.
5 The State Training Fund is a semi-governmental agency which is governed by an independent board but is
operationally attached to MECS. It is responsible for the implementation of all state financial aid programs. Its
governing board consists of six officials, selected for their positions by the Ministry of Finance and the Ministry of
Education, Culture, and Science. No institutional or public representatives are included on the Board.
23
Table 11: A Cross Country Comparison of Tuition Fees as Percentage of per capital Gross
National Income Country Public Universities Private Universities
Mongolia
Australia 16%
11.3% 16%
21.9%
Canada 10.0% n/a
Japan 11.8% 18.5%
Korea 16.3% 31.1%
New Zealand 6.5% n/a
United Kingdom 5.2% 4.9%
United States 11.4% 42.0%
Italy 3.3% 11.5%
Netherlands 4.4% 4.4%
Israel 12.0% 29.2%
Chile 27.9% 32.0%
Sources: Provided by Salmi, drawn from OECD Education at a Glance 2007;
Background Report; World Bank World Economic Indicators.
Expansion of eligibility criteria. Since its inception the mandate and the operations of
the STF have changed several times.6 The mandate of the STF stems from the country‟s
Constitutional rights to education: the STF aims to provide financial support to low income,
academically able students in order to provide them the opportunity to pursue tertiary education,
regardless of their ability to pay. Annually, about 20,000 students apply for university admission,
but under current resource constraints, the STF funds on average only about 6,000 – 7,000
students per year.
Need-based loans. Loans represent the third largest financial aid program in terms of the
number of students covered, as well as in the percentage of allocation of the STF resources.
Students who receive loans must repay them within ten years. They have a grace period of six
years after their graduation. After the seventh year, the STF raises the interest rate on the loan
to 0.5 percent above the average annual bank rate for commercial loans. Loans can be forgiven
if recipients have been employed for eight consecutive years, including five years in a rural
county. In 2004, the government universally forgave all outstanding loans.
Non-need and non-merit based grants. Grants represent the largest of the STF‟s financial
aid program. Children of public sector workers can receive both grants and loans. Further, the
6 In 1995, new and detailed regulations were issued for financial aid for students that specified the criteria for
eligibility, the conditions for the repayment of grants and loans, and the establishment of a satellite program to
provide financial assistance to students from the families of public employees. Other legislation at the time reduced
the coverage of grants to needy students only and abolished the state quota system. State financial aid was also
extended to Master‟s and Doctoral students, those pursuing graduate degrees abroad, and outstanding high school
graduates and college students with a GPA of no less than 3.8 for four consecutive semesters. In 2000 tuition grants
were extended to nomadic families with less than 700 heads of livestock on the basis of one child per family and
also to a maximum of one student per family in which three or more children were enrolled in TEIs (Box 1, below).
24
tuition grant is for only one student pursuing an undergraduate degree for the total duration of the
parent‟s employment in the public sector. Grants are made on a semester basis and are renewable
if the recipient maintains full-time enrolment and maintains a GPA of at least 2.0 and the parent
remains employed by the government.
The widening of the eligibility criteria in 2000 with the passage of Government
Resolution 201 has extended coverage to the children of civil servants (Figure 4). In 2007, over
17,000 students, or over 40 percent of all recipients of the STF were children of civil servants
(Table 12). Although the poor are more likely to receive government tuition aid for tertiary
education, approximately 54 percent of beneficiaries are non-poor. 7
Figure 4 : The Widening of STF Eligibility Criteria
Table 12: State Training Fund Allocation of Resources, 2007
No. of
Students
Covered Average Amount
per Year (USD) Resources as % of
STF Funding STF Grant Program 17,053 222.16 39.0% STF Loan Program 8,007 232.25 19.2% State Employee Children's Fund
Grant 6,442 246.17 16.3% State Employee Children's Fund
Loan 11,198 221.13 25.5% Source: Ministry of Education, Culture, and Science (MECS), 2008.
Consequences of widening eligibility. Given the constraints on the STF budget, the
provision of assistance to non-poor students may mean that some poor students will be displaced.
It is likely that this situation is already occurring: as shown in Table 3, there are significant
spatial and income disparities in completion rates of tertiary education, particularly for those
7 Since 2000 the number of higher income students receiving assistance has grown by 36 percent, from 13,487 to
18,402 (Interview with STF official). Higher income students are defined as those who would not be eligible for a
grant from the STF based on their family income level.
1993-1995
Stipends for needy, talented and foreign students and tuition fee to students who studied by state contract
1996-1999
Tuition loans for very poor students and disadvantaged families
Small number of grants to orphans/disabled students and MA/PhD students in developed countries
2000+
Loans for poor students and disadvantaged families
Grants to orphans, disabled and disadvantaged students
Grants for one child of civil servants
Grants to herders, low income students and families with 3+ children
Scholarships to able students
25
living in rural areas and those in the poorest income quintile. It is unlikely that students of civil
servants, one of the fastest growing groups, would meet the criteria of being both poor and
meritorious.
The MECS annual budget to the STF strives to give financial assistance to 60 percent of
enrolled students. This percentage was based on a student survey that solicited opinion from
students as to their level of interest in a financial assistance scheme. MECS does not, however,
indicate the extent to which the scheme is reaching its target group or the proportion of needy
students that are denied access to financial assistance because places within the scheme are
limited.
Further, as indicated in Table 13, there is a significant shortfall between the average level
of assistance provided under the financial assistance scheme in 2007 and the average cost of
public tertiary education (including living expenses). Since STF funds do not cover living
expenses, aid recipients who enroll in an institution must cover this difference out of pocket,
which can be significantly costly to many. This gap is even higher for students at high cost
public and private institutions. Based on data from MECS, tuition represented approximately 13
to 36 percent of yearly costs of attending a college depending on whether the student lived with
his or her family or not.
Table 13: Proportion of College Costs Covered by Tuition/Financial Aid
For those living
with parents For those living
in dormitories For those living in
private (rented)
housing Living expenses for an
academic year, Tugrik 832,000 1,262,000 2,342,000
Tuition 300,000 300,000 300,000 Percent of tuition 36.1 23.7 12.8
Note: Based on Altantsetseg, 2002, World Bank, 2008.
3.5. Strategies of the Updated Education Sector Master Plan
The updated Education Sector Master Plan (2010) recognizes many of the issues identified in
this policy note. Its strategies to improve quality and equity of this subsector and matching of
supply with demand are as follows:
By 2017, increase enrolment in engineering, technology, natural sciences, education and
agriculture from 32 percent to 41 percent of total enrolment, whilst reducing enrolment in
humanities, law and medical sciences from 30 percent to 29 percent.
Provide tuition loans from State Training Fund for 3 out of every 5 students majoring in
engineering, technology, natural sciences, education and agriculture, and for 2 out of every 5
students majoring in other subjects, and introduce merit scholarship and set an optimal ratio
between tuition loans, grants, and scholarship.
Provide funding of $25, 000 each for NUM, MUST, MSUE, HSU, MSUA, for purchasing
textbooks, training manuals and other publications in foreign languages.
26
Register national universities to inter-library network, and ensure that university teachers,
students and researchers have free access to inter-library network.
Provide foreign grant and support on in-service training for university teachers.
Develop the capacity of university teachers, through professional development and joint
program with international universities, and provide support to those working in rural areas
Set up a quality assurance system for higher education institutions.
Set international standards for premier universities.
Undertake a comprehensive review of the financing and governance of higher education
institutions in Mongolia, aimed at course rationalization.
Undertake a comprehensive review of higher education provision in Mongolia aimed at
course rationalization and national course and institutional accreditation standards.
In addition, in 2010, the Parliament has approved the consolidation of some 42 public TEIs
into 6, mostly through merger. There is a clear signal about the seriousness of reforming higher
education. To improve quality and relevance of higher education, it is necessary to undertake
major structural changes which will be described in Chapter 4.
27
4. POLICY OPTIONS TO REFORM TERTIARY EDUCATION
International experience suggests that a highly educated population will generate its own
dynamic for development. Better educated people are more adaptable to technological change,
can learn new skills faster, and are better prepared to generate income for themselves through
creative work and entrepreneurship. They are also more internationally mobile and more
resourceful in exploring income generating opportunities beyond national borders. In the
globalized economy, it is impossible to predict change. A manpower planning model that
matches enrollment with job projection is unlikely to improve the skills needed for the future.
Higher education policy should look beyond the medium-term demand of the national labor
market and the formal wage sector. While there should not be a policy to contain enrollment
growth, there must be effective mechanisms in place to ensure quality and equity, and to provide
incentives to develop a culture of excellence in TEIs. This chapter offers four measures to
improve quality and a measure to improve equity, in addition to the strategies outlined in the
updated Education Sector Master Plan of 2010.
4.1. Differentiate Roles of TEIs and Improve System Articulation to Facilitate Lifelong
Learning
Given the diversity of TEIs in Mongolia and the strong social demand for higher
education, there is an urgent need to differentiate the missions and pools of students for different
tiers of its public and private TEIs. Even in OECD countries, only a handful of universities
achieve the kind of concentration of top researchers, professors, students, facilities, and resources
to attain world class status (Table 14). In the USA, only about 30 out of 5,000 TEIs are research
universities. However, second tier universities and/or community colleges have different but
equally important functions, which are to serve community and local development. Box 1
describes how the University of California System differentiates the roles of its TEIs to better
serve both the state and students.
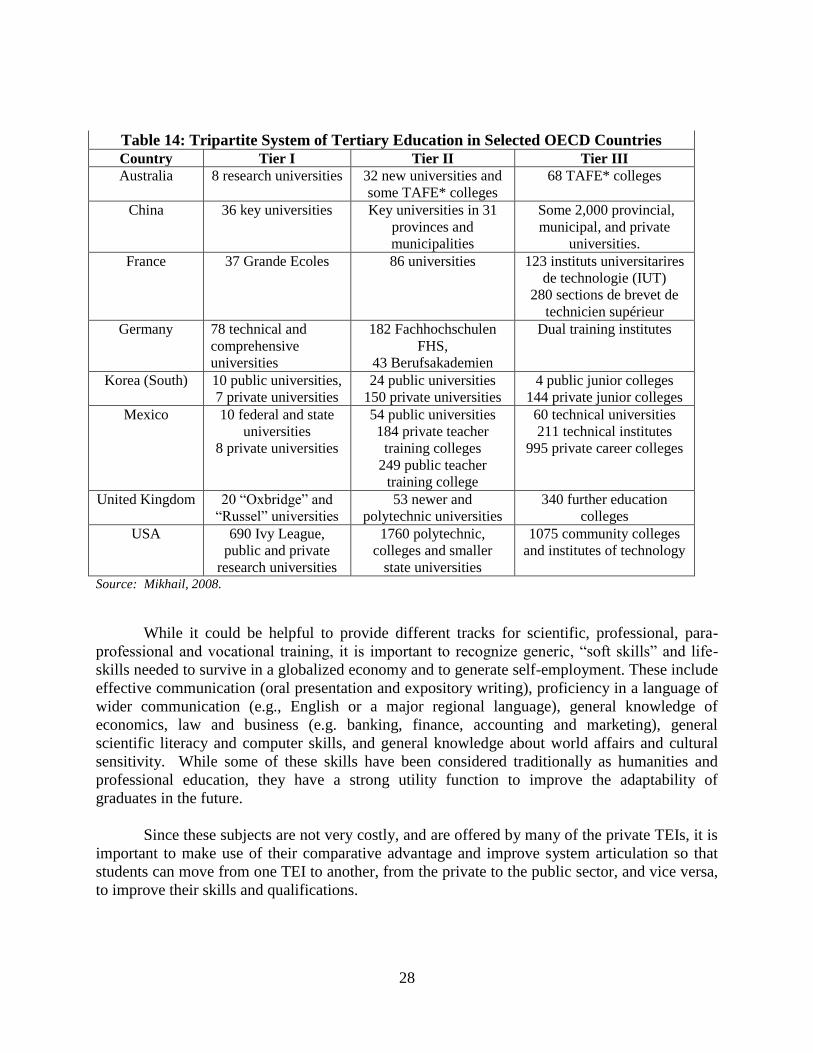
28
Table 14: Tripartite System of Tertiary Education in Selected OECD Countries
Country Tier I Tier II Tier III
Australia 8 research universities 32 new universities and
some TAFE* colleges
68 TAFE* colleges
China 36 key universities Key universities in 31
provinces and
municipalities
Some 2,000 provincial,
municipal, and private
universities.
France 37 Grande Ecoles 86 universities 123 instituts universitarires
de technologie (IUT)
280 sections de brevet de
technicien supérieur
Germany 78 technical and
comprehensive
universities
182 Fachhochschulen
FHS,
43 Berufsakademien
Dual training institutes
Korea (South) 10 public universities,
7 private universities
24 public universities
150 private universities
4 public junior colleges
144 private junior colleges
Mexico 10 federal and state
universities
8 private universities
54 public universities
184 private teacher
training colleges
249 public teacher
training college
60 technical universities
211 technical institutes
995 private career colleges
United Kingdom 20 “Oxbridge” and
“Russel” universities
53 newer and
polytechnic universities
340 further education
colleges
USA 690 Ivy League,
public and private
research universities
1760 polytechnic,
colleges and smaller
state universities
1075 community colleges
and institutes of technology
Source: Mikhail, 2008.
While it could be helpful to provide different tracks for scientific, professional, para-
professional and vocational training, it is important to recognize generic, “soft skills” and life-
skills needed to survive in a globalized economy and to generate self-employment. These include
effective communication (oral presentation and expository writing), proficiency in a language of
wider communication (e.g., English or a major regional language), general knowledge of
economics, law and business (e.g. banking, finance, accounting and marketing), general
scientific literacy and computer skills, and general knowledge about world affairs and cultural
sensitivity. While some of these skills have been considered traditionally as humanities and
professional education, they have a strong utility function to improve the adaptability of
graduates in the future.
Since these subjects are not very costly, and are offered by many of the private TEIs, it is
important to make use of their comparative advantage and improve system articulation so that
students can move from one TEI to another, from the private to the public sector, and vice versa,
to improve their skills and qualifications.
29
Box 1: California’s System of Universities and Community Colleges
The State of California differentiates the missions and pool of students for three tiers of its public
higher education system -- University of California (UC), California State Universities (CSU),
and community colleges. The UC draws from the top 8% of high school graduates, CSU, from
the top 33%, and community colleges have an open admission policy to students with a high
school diploma, or a general education diploma, or simply over the age of 18. It is also very low
cost at $20 per credit per semester. There is a statutory coordinating body for the entire system,
and the key feature of the system is the articulation and transferability of credits and students
from one tier to another.
Community colleges offers a range of programs: (i) Associate‟s degrees take two years and
allows students who have completed the necessary "core" requirements to transfer to a four-year
institution and earn a degree. (ii) Certification is provided in a number of vocational training (e.g.
nursing, computer repair, law enforcement) which require preparation for a state or national
examination, or where certification would allow a higher salary upon entering the workforce.
(iii) Local services of local interest include job placement, adult continuing education classes,
customized training with local businesses, and working with high school dropouts to earn a high
school diploma or obtain a GED. (iv) Bachelor's degrees are gaining popularity. Some
community colleges offer specialized programs in conjunction with other universities.
4.2. Concentrate Resources to Fund Premier Universities through Competitive Funding
An examination of the world‟s top universities found that high quality tertiary education
is supported by abundant resources. Harvard University, for example, had an endowment of $37
billion, an annual expenditure of $3.2 billion, and a per student expenditure of $105,041 before
the crisis (Table 15). Other top universities in the world have expenditures in similar orders of
magnitude.
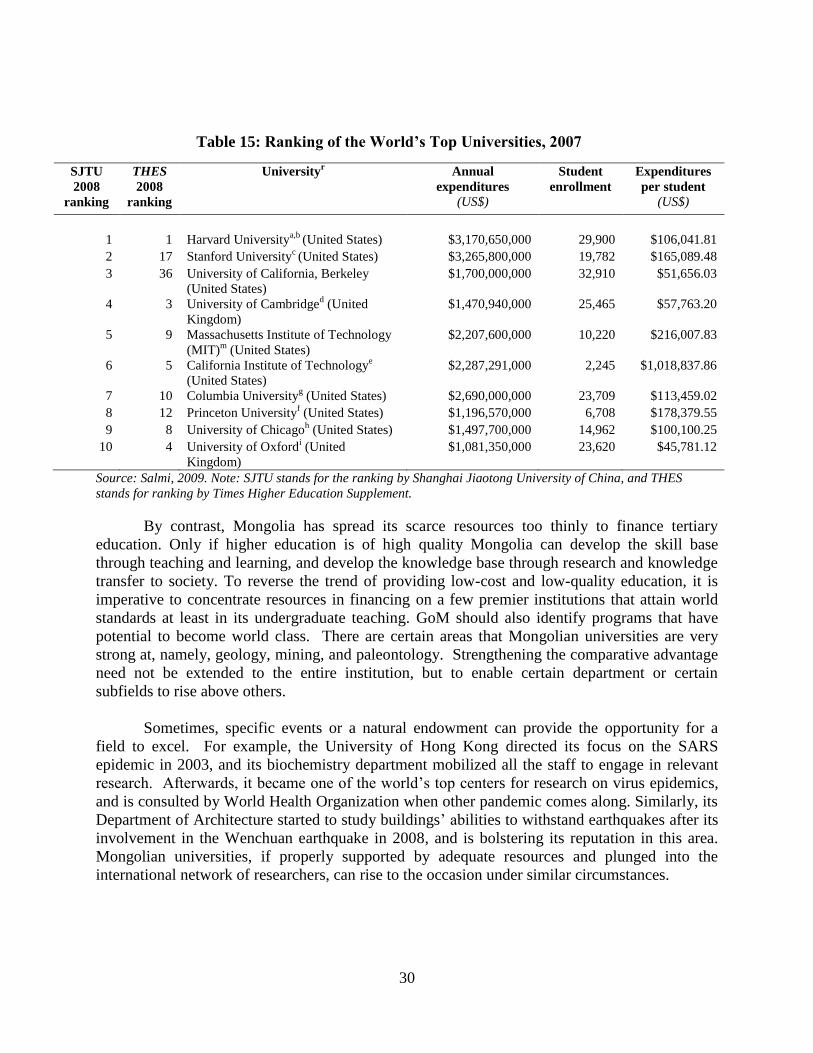
30
Table 15: Ranking of the World’s Top Universities, 2007
SJTU
2008
ranking
THES
2008
ranking
Universityr
Annual
expenditures
(US$)
Student
enrollment
Expenditures
per student
(US$)
1 1 Harvard Universitya,b
(United States) $3,170,650,000 29,900 $106,041.81
2 17 Stanford Universityc (United States) $3,265,800,000 19,782 $165,089.48
3 36 University of California, Berkeley
(United States)
$1,700,000,000 32,910 $51,656.03
4 3 University of Cambridged (United
Kingdom)
$1,470,940,000 25,465 $57,763.20
5 9 Massachusetts Institute of Technology
(MIT)m (United States)
$2,207,600,000 10,220 $216,007.83
6 5 California Institute of Technologye
(United States)
$2,287,291,000 2,245 $1,018,837.86
7 10 Columbia Universityg (United States) $2,690,000,000 23,709 $113,459.02
8 12 Princeton Universityf (United States) $1,196,570,000 6,708 $178,379.55
9 8 University of Chicagoh (United States) $1,497,700,000 14,962 $100,100.25
10 4 University of Oxfordi (United
Kingdom)
$1,081,350,000 23,620 $45,781.12
Source: Salmi, 2009. Note: SJTU stands for the ranking by Shanghai Jiaotong University of China, and THES
stands for ranking by Times Higher Education Supplement.
By contrast, Mongolia has spread its scarce resources too thinly to finance tertiary
education. Only if higher education is of high quality Mongolia can develop the skill base
through teaching and learning, and develop the knowledge base through research and knowledge
transfer to society. To reverse the trend of providing low-cost and low-quality education, it is
imperative to concentrate resources in financing on a few premier institutions that attain world
standards at least in its undergraduate teaching. GoM should also identify programs that have
potential to become world class. There are certain areas that Mongolian universities are very
strong at, namely, geology, mining, and paleontology. Strengthening the comparative advantage
need not be extended to the entire institution, but to enable certain department or certain
subfields to rise above others.
Sometimes, specific events or a natural endowment can provide the opportunity for a
field to excel. For example, the University of Hong Kong directed its focus on the SARS
epidemic in 2003, and its biochemistry department mobilized all the staff to engage in relevant
research. Afterwards, it became one of the world‟s top centers for research on virus epidemics,
and is consulted by World Health Organization when other pandemic comes along. Similarly, its
Department of Architecture started to study buildings‟ abilities to withstand earthquakes after its
involvement in the Wenchuan earthquake in 2008, and is bolstering its reputation in this area.
Mongolian universities, if properly supported by adequate resources and plunged into the
international network of researchers, can rise to the occasion under similar circumstances.
31
In the process of building up premier programs and institutions, it is important to identify
the comparative strengths of various institutions and their academic offerings and build on those
strengths. However, it is essential to use a competitive process to aid the targeting of resources
to finance premier institutions.
In Mongolia the creation of a competitive fund should be considered to aid the process of
consolidation and rationalization. In such a scheme, TEIs are asked to submit their funding
proposals along with their respective institutional development plans with key performance
indicators (including faculty strengths in course offerings, academic qualification, research and
publications, student graduation rates, employment rates, and student evaluation results). The
funds will be used to fund equipment, facility improvement, and staff upgrading and professional
development. They could also be used as block grants to cover salaries for faculty members.
This would be akin to research grants in US institutions, which also cover the salary of
researchers on a multi-year basis. This would reduce the incentives to use enrollment expansion
to sustain financial viability, and encourage faculty members to devote time on teaching and
research. Student fees could be used by the institutions for supplemental investments. Decisions
should be made to award funding to the disciplines and courses that are well related to labor
market needs. In this way, those weaker programs would be weeded out or have to cooperate
with stronger programs in order to survive. It is not recommended to set admission quotas for the
institution, but essentially to use the competitive funding mechanism to guide the rationalization
process. Box 2 describes international experiences in using competitive funds to stimulate
institutional development and cultures of excellence.
Merely merging institutions, however, does not necessarily achieve cost savings as
salaries continue to rely on tuition fees. Thus, the competitive funds should also include
coverage of at least a certain percentage of salaries and reward faculty members for research and
contribution to regional and national development, in order to realign incentives.
The creation of a competitive fund would entail additional public expenditure and a
replacement of the existing system of financing. But without such a mechanism, it would be
difficult to break the cycle of low cost, low quality education.
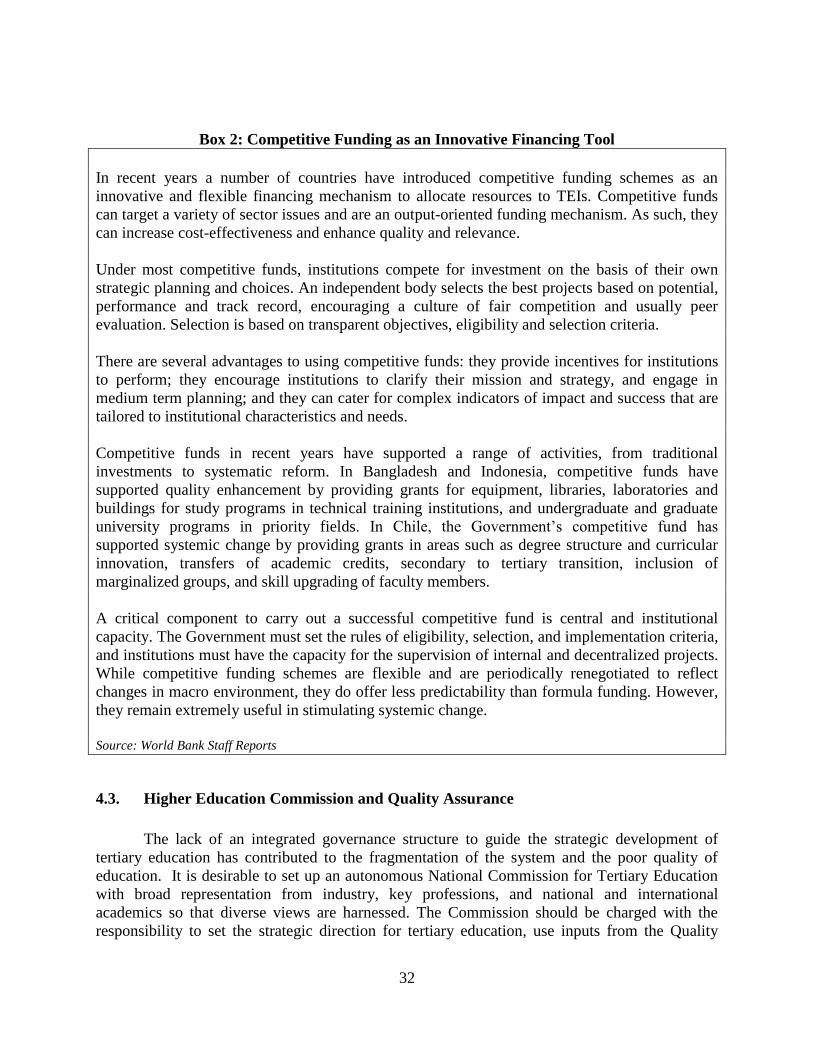
32
Box 2: Competitive Funding as an Innovative Financing Tool
In recent years a number of countries have introduced competitive funding schemes as an
innovative and flexible financing mechanism to allocate resources to TEIs. Competitive funds
can target a variety of sector issues and are an output-oriented funding mechanism. As such, they
can increase cost-effectiveness and enhance quality and relevance.
Under most competitive funds, institutions compete for investment on the basis of their own
strategic planning and choices. An independent body selects the best projects based on potential,
performance and track record, encouraging a culture of fair competition and usually peer
evaluation. Selection is based on transparent objectives, eligibility and selection criteria.
There are several advantages to using competitive funds: they provide incentives for institutions
to perform; they encourage institutions to clarify their mission and strategy, and engage in
medium term planning; and they can cater for complex indicators of impact and success that are
tailored to institutional characteristics and needs.
Competitive funds in recent years have supported a range of activities, from traditional
investments to systematic reform. In Bangladesh and Indonesia, competitive funds have
supported quality enhancement by providing grants for equipment, libraries, laboratories and
buildings for study programs in technical training institutions, and undergraduate and graduate
university programs in priority fields. In Chile, the Government‟s competitive fund has
supported systemic change by providing grants in areas such as degree structure and curricular
innovation, transfers of academic credits, secondary to tertiary transition, inclusion of
marginalized groups, and skill upgrading of faculty members.
A critical component to carry out a successful competitive fund is central and institutional
capacity. The Government must set the rules of eligibility, selection, and implementation criteria,
and institutions must have the capacity for the supervision of internal and decentralized projects.
While competitive funding schemes are flexible and are periodically renegotiated to reflect
changes in macro environment, they do offer less predictability than formula funding. However,
they remain extremely useful in stimulating systemic change.
Source: World Bank Staff Reports
4.3. Higher Education Commission and Quality Assurance
The lack of an integrated governance structure to guide the strategic development of
tertiary education has contributed to the fragmentation of the system and the poor quality of
education. It is desirable to set up an autonomous National Commission for Tertiary Education
with broad representation from industry, key professions, and national and international
academics so that diverse views are harnessed. The Commission should be charged with the
responsibility to set the strategic direction for tertiary education, use inputs from the Quality
33
Assurance system to allocate block grants, oversee the development of the National Qualification
Framework, and monitor how TEIs facilitate regional development. The Commission could also
sponsor policy analysis, conduct strategic planning. In the UK, for example, the Commission on
Higher Education has helped set strategic direction by articulating five aims: (i) enhancing
excellence in learning and teaching; (ii) widening participation and fair access; (iii) promoting
employer engagement and skills; (iv) enhancing excellence in research; and (v) enhancing the
contribution of HE to the economy and society. These mission statements are very close to the
vision of Mongolian higher education. Box 3 describes the experience of New Zealand, a small
country with a population of 3 million, in how it uses the Commission to steer the tertiary
education system to achieve national objectives.
Higher education should engage more directly with employers to identify changing job
requirements and monitoring employers‟ expectations of graduates. There is a need for a
systematic approach to labor market information provision through tracer studies of graduates to
track trends in earnings nationwide and discern regional trends. The Commission should require
all TEIs to report on agreed performance indicators and labor market outcomes of graduates by
areas of study, as a basis for its decision to rationalize and consolidate TEIs. The Commission
should publish these statistics to provide information to consumers and hold TEIs publicly
accountable.
The establishment of this body should be done simultaneously with invigorating the
MMCEA, which should be responsible for the quality assurance of all academic programs and
institutions. The QA process should identify strengths and weaknesses of each institution for two
purposes. The first is to provide information and advice for the institutions to improve
themselves and the second is to provide guidance to policymakers for rationalization and
consolidation of the system. Involving professional associations in quality assurance is one
mechanism that has proven useful in many countries in providing feedback to tertiary institutions
and in helping link labor market needs to the academic programs of colleges and universities. A
quality assessment mechanism should also be introduced for bachelor, master and Ph.D.
programs. The involvement of professional associations in Specialized and Professional
Accreditation in the United States is one successful example.
The QA mechanism should also have consequences. It should enable the Commission to
make decisions about the rationalization and consolidation of programs. The Accreditation
Agency should also participate in the Asia-Pacific Quality Assurance Network to raise its
standards of world-class quality using international benchmarks. Box 4 describes the experience
of Singapore in its efforts to improve the quality of private TEIs.
34
Box 3: New Zealand’s Tertiary Education Commission
The Tertiary Education Commission Te Amorangi Mātauranga Matua (TEC) is governed by a
Board of Commissioners which is appointed by, and responsible to, the Minister for Tertiary
Education. The TEC operates within strategic and policy frameworks set by the government. The
TEC is a Crown Agent which must give effect to government policy when directed by the
Minister for Tertiary Education
Under the Crown Entities Act, the Minister may direct the TEC to undertake any tasks that are
consistent with the TEC‟s functions. The Minister may not direct the TEC to provide or deny
funding to any specified organization. The Chief Executive of the TEC has an independent
function under the Education Act 1989 to monitor tertiary education institutions for risks related
to financial or operational viability and to report directly to the Minister.
The TEC‟s principal function is to give effect to the tertiary education strategy. The TEC is also
required to operate the tertiary funding system generally, monitor the performance of tertiary
education organizations, and provide policy advice to the Minister for Tertiary Education.
The TEC manages Government funding for TEIs, provides policy advice and implementation
across the sector, and provides relevant support to TEIs. Its actions are guided by the
Government‟s priorities for higher education, namely (i) a high-trust and high-quality tertiary
funding environment; (ii) worthwhile qualifications for all students leaving the education system;
and (iii) an appropriately trained and competent workforce. In pursuing its directive, it works
with several key government agencies, including the Ministry of Education, the New Zealand
Qualifications Authority, and the Ministry of Research, Science and Technology, as well as a
range of private, education sector and industry representative groups.
The Board of Commissioners is responsible for governance. It is appointed by, and responsible
to, the Minister for Tertiary Education. It comprises at least six, but not more than nine,
members. Current board of commissioners consists of an executive chair, deputy chair
(university leader), academic and industry representatives, and one currently enrolled student.
The Commission‟s annual operating revenue is approximately NZ$ 75 million, 80 percent of
which is provided by the Ministry of Education.
Sources: Tertiary Education Commission of New Zealand, http://www.tec.govt.nz/
Tertiary Education Commission of New Zealand. (2009). Annual Report for the year that ended 30 June 2009.
Retrieved 3 February 2010 from http://www.tec.govt.nz/Documents/Publications/TEC-Annual-Report-final-
2009.pdf
35
Box 4: How Singapore is proposing to deal with the proliferation of private tertiary
education institution to assure quality
Singapore has about 1,000 private institutions of various sizes and quality. The largest
have over 10,000 students, and the smallest have a few hundred, offering a single field of
study, e.g. hotel management. As more and more foreign students, particularly Asian
students, flock to Singapore to study and mostly enroll in these private institutions, the
Government is concerned that the reputation of Singapore as a high quality producer
could be tarnished. As a result, it is preparing a law to regulate private tertiary education
which is likely to pass in September 2009. The law will require private tertiary education
institutions to be accredited from time to time. For institutions that are judged to be of
dubious quality, they would be given one year to improve themselves or face closure.
They will then have to be re-accredited again. For better institutions, the duration of
operation could be up to five years, but they are still required to be re-accredited. Under
these new regulations private TEIs will be under pressure to perform and improve
quality.
Source: Interview with Mr. Lin, chair of the private tertiary education council on March 31, 2009.
The current accreditation system in Mongolia does not engage with distance or overseas
learning activities and thus is not providing its students with knowledge about how these
programs compare to domestically-offered ones. Thus the internationally growing trend towards
open and distance learning presents new challenges which threaten the quality of tertiary
education in countries with less than strong regulatory capacity like Mongolia. The need to
strengthen the capacity of national quality assurance systems is therefore urgent both to take
advantage of these new opportunities and to protect the public against fraudulent or questionable
quality providers.
4.4. Public Accountability and Consumer Protection
Annual publication of TEIs performance indicators, and student employment statistics is
key to ensure public accountability and consumer protection. In pursuing fields with little labor
market demand, students could invest a substantial amount of money and time only to discover at
the time of graduation that their skills have no place in the economy. Thus, making such labor
market information available would help parents and youths make informed decision regarding
whether to pursue higher education or other tracks of training.
In this regard, international experience (e.g. Chile, Colombia, Italy) with labor market
observatory could provide relevant example for Mongolia. Box 5 describes how these labor
market observatories work to guide students and parents in making a decision about entering
tertiary education and which field to pursue.
36
Box 5: Labor Market Observatories in Italy and Chile
Orientation and employment opportunities are the two essential steps that can determine the
success of tertiary education‟s ultimate purpose: training citizens that would contribute to a
country‟s economy, development and growth. Dropout and unemployment demonstrate, on the
contrary, a failure or inefficiency of the education system to reach that goal, and can often reveal
to be extremely costly to the society as a whole (in terms of education public spending loss,
taxation loss, and public financial support for unemployed).
Two innovative initiatives have intended to respond to the challenges of orientation and
employment opportunities: AlmaLaurea in Italy, and Futuro Laboral in Chile. Both projects seek
to provide useful, practical and easy-to-use online information on career perspectives and job
opportunities. The overall idea is to equip all tertiary education stakeholders, in particular
students and families, with relevant information to make the right choices. Whereas AlmaLaurea
focuses more on the after graduation steps, Futuro Laboral gives priority to the previous stage of
tertiary studies.
AlmaLaurea provides the largest Italian database of graduates resumes (900,000 from 50
universities as of June 2007) and now gathers 67% of all Italian graduates‟ profiles. AlmaLaurea
was created in 1994, is currently managed by a consortium of Italian universities and supported
by the Ministry of Education, Universities and Research. The services offered to graduates and
students include the following: online posting of graduate resume, advices to improve resume,
and possibility to update it regularly; access to a large bank of job offers and enterprises
characteristics, and possibility to answer job offers online through AlmaLaurea Website;
postgraduates programs are also described to better match students‟ needs for further education;
alert are sent via emails to keep the user on track and facilitate his or her proceedings.
The incentives for universities to subscribe to AlmaLaurea are significant: provide more options
to their students, think about new curricula and orientation, and develop internships/first jobs
options. AlmaLaurea also provides annual information on the occupational conditions of
graduates, including PhDs, gathers archives of graduate and doctorate thesis titles, validates the
administrative records of graduates, and helps promote post-graduate and master courses through
the website.
Employers, on their part, have online access to the largest Italian database of graduates‟ resumes,
and can easily purchase CVs, select best candidates through criteria matching, announce new job
offers and describe their company to attract best graduates.
Futuro Laboral focuses more on the orientation stage. Supported by the Ministry of Education
and mutually organized by the University Adolfo Abánez School of Government and the
University of Chile‟s Department of Industrial Engineering, it aims to provide orientation tools
to youth and students. As such, Futuro Laboral provides information on the occupational
situation of graduates of hundred different professional and technical careers that represent 75%
of technical and professional graduates. These hundred careers are thus described, with salary
ranges, the type of study they imply and employment opportunities they generate.
37
As with AlmaLaurea, Futuro Laboral‟s approach is very practical and user friendly. Through its
website, students can look for a program by level, by area, or by career, they can visit foreign
websites containing information on career and work in other countries, and have access to an
online library referring to a large bank of information on the employability of technical and
professional graduates.
These two initiatives show particular examples of labor market observatories that aim to provide
a better understanding and match between individuals‟ professional aspirations, tertiary
education, and occupational trends. As such, they offer concrete responses to one of the main
challenges of tertiary education: its relevance to individuals and societies.
Source: Written by Jamil Salmi for this report, 2010.
4.5. Better Targeting of Financial Aid and Improvement of Basic Education
Ensuring equity of access is central to providing opportunity for increased earning and
intergenerational mobility. Data indicate that lower income and rural students are significantly
under-represented in tertiary education. The poor do not have equal opportunity of access
because they have much lower basic education completion rates and because they often cannot
afford to pay high tuition fees. Table 16 shows that rural students have much lower school
completion rates than urban students at all levels of education, be that primary, lower secondary,
upper secondary, and tertiary. Even if they enter tertiary education, they have much lower
completion rates. This is likely the result of the fact that their financial burden is proportionally
higher relative to their family income than the rich. Rural children, particularly boys, have lower
completion rates at all levels. Likewise, the same pattern holds for the poorest and the richest
quintiles. These data indicate that, in addition to reforming the tertiary education system to
ensure better access, efforts must also be made to ensure school completion for all subgroups in
order to provide equitable access to tertiary education.
38
Table 16: Spatial and Income Disparities in Educational Completion Rates
(% entering primary that complete each level)
Children aged 8-25
Total Urban Rural Boys Girls Poorest Richest
Primary 93.95 96.74 89.36 91.69 96.13 90.83 96.60
Lower secondary 81.04 87.41 70.00 75.98 85.72 72.93 90.61
Upper Secondary 54.87 60.01 45.73 48.73 60.35 42.59 69.93
Diplomas 41.91 47.20 31.56 38.31 45.49 39.59 51.47
University 9.43 10.38 7.79 10.36 9.20 7.48 12.60
Source: HIES 2006, as quoted in “Mongolia: Consolidating the Gains, Managing the Boom, and Moving to Better
Service Delivery,” World Bank, 2008.
Notes: Figures are Kaplan Meier estimates, which account for censoring (i.e. individuals still attending school at
the time of the survey only contribute to the estimation sample up to last level currently attended). Survival rates
indicate the cumulative probability of making the transition to each level.
To improve equity, the STF should also be reformed. Since the overall rate of loan
repayment to the STF is only 2 percent, and the government occasionally forgives many loans,
more resources will need to be mobilized, perhaps even from the private sector, to sustain and
scale-up the STF over the long run. One proposal may be to enlist the efforts of private
commercial banks. These banks could provide more flexibility in terms of accessibility and
amounts of loan defaults, though the government may still wish to guarantee the loans and
subsidize the interest. This may be one way for the government to save a large amount of
resources that can then be reallocated into existing or new need-based financial assistance
programs.
Furthermore, because the STF does not track the extent to which its programs reach its
targeted groups, it is clear that a stronger system of monitoring and evaluation is needed. Such a
system would help better understand whether or not the program is reaching intended
beneficiaries and what overall impact the program is having on student achievement. Developing
a more thorough examination of financial eligibility grounded in an appropriate methodology for
STF assistance could improve the equitable distribution of financial aid. Such a methodology
should contain not only a reliable way to determine family income, but also a method to
reasonably estimate the expected family contribution towards college costs. Any measurement of
family income must consider not only cash income, but also the substantial size of income from
subsidiary economic activity or livestock (World Bank, 2008).
39
5. TECHNICAL AND VOCATIONAL EDUCATION AND TRAINING:
COMPLEMENTARY TO TERTIARY EDUCATION?
The desirability of developing a diversified and flexible education system that allows for
multiple exists and re-entries across field of studies and between subsectors calls for expanding
vocationally oriented institutions and programs (at secondary and post-secondary levels),
community college types of institutions, teaching colleges and universities, and a very small
number of research universities. This chapter explores the potential for skill development and
employment generation as an option for youths.
5.1. The Structure and Outcomes of Mongolia’s TVET system
TVET is administered under the purview of the Ministry of Education, Culture and
Science (MECS) and the Ministry of Labour and Social Welfare Services (MLSWS). MECS
oversees formal long term TVET (more than two years) while MLSWS oversees the non-formal
short term TVET (ranging from two weeks to 45 days). All schools offering preliminary
vocational education recruit students who have completed 9th
grade, while intermediate
vocational education institutions recruit students who have completed 11th
grade. Basic
characteristics of the system are presented in Table 17.
Table 17: Basic Outcomes of TVET in Mongolia
Total No. of Students 37,867
of which females 17,844
Total No. of Graduates
2008 8,745
2009 11,408
Total No. of Schools 70
of which:
Public Vocational Schools offering preliminary training 23
of which schools are intermediate level 3
Private schools offering preliminary training 9
Public Technical Schools offering preliminary and intermediate
training 11
Private Vocational and Technical Higher Education Schools 6 Source: MECS, 2009.
40
Under informal short-term TVET, the LSWSO coordinates activities related to
employment and provides accreditation to 1,200 training providers to conduct informal short-
term TVET. Of the 1,200 training providers, 150 were also accredited to receive funding from
the Employment Promotion Fund to train unemployed people. The main purpose for these short-
term vocational trainings is to help unemployed people learn a new skill to seek employment.
Because technical skills are generally accorded low status and are given little recognition
in Mongolia, and because academic education is seen, in many cases mistakenly, as a more
helpful path toward lucrative employment, most young people continue to choose academic
education rather than vocational training. This is despite the fact that there are significant
emerging opportunities in trade occupations and technical jobs. About 140,000 Mongolian
students are attending university (about 15 percent of Mongolia‟s workforce), and many of these
graduates face difficulties in finding jobs because of the country‟s skill mismatch. In 2006, only
7,100 (5.4 percent) of tertiary graduates were from TVET institutions, of which 48 percent were
female.
Shifting larger proportions of students into the TVET system may be one way to address
the skills mismatch and improve labor market outcomes. However, such a policy option would
be viable only if the quality of education and training students receive is of good quality and
relevant to market demands, which can only be achieved through an overhaul of the existing
system. With a good quality TVET system, graduates are more likely to be employed.
However, despite the demand from employers for vocational skills, public investment in
TVET is limited. Facilities and machinery are often outdated and faulty, and private providers
are not currently part of a regulatory and monitoring framework to ensure that training meets
standards in terms of competency, course, credentials, and occupational safety and health.
5.2. Challenges to the Quality of Mongolia’s TVET System
Governance. The National Vocational Education and Training Methodology Center
(NVETMC) is responsible for the development of skills standards and curricular materials for
both formal and informal TVET courses, the production of textbooks, the training of TVET
teachers and industry practitioners to develop modular training materials, teachers‟ pedagogical
training, and research work on TVET-related issues, such as labor market studies. The NVETMC
is located in MECS and has five full-time staff; there are another six regional centers manned by
two staff each. There is also an accreditation agency known as the National Council for
Education Accreditation (MNCEA)8 whose role is to accredit the quality of TVET programs.
However, it has accredited less than 10 percent of all TVET programs.
Governance could be described as fragmented. Different agencies responsible for
different roles in the TVET system are working in silo without much coordination, interaction
and synergy. For example, the NVETMC has developed 70 skill standards but the National
Council for Education Accreditation has yet to undertake a single accreditation of any of these
programs. In addition, dated equipment, insufficient training, and the lack of skill development
8 To date, the MNCEA has accredited 11 schools delivering TVET education.
41
opportunities for teachers all seem to suggest that the developed standards and curricula have not
been deployed at the school level.
Furthermore, there is currently no structured and coordinated pre-service or in-service
teachers‟ pedagogy or technical skill training. Teachers‟ pedagogy training has been left very
much to the initiative of the TVET schools. For technical skills upgrading, some schools send
their teachers periodically for skills training. However, because of the lack of modern equipment
that are in line with the needs of the employers, it is likely that most teachers would need
technical skills training when new equipment and machines are put in place by schools.
At the policy level, although there is evidence of collaboration with industry, this is still
very limited to students‟ attachments which range from 30 to 45 days. Any attachment beyond
the stated duration is at the discretion of the school directors, and there is little initiative currently
by MECS to forge closer collaboration with the industry or employers.
Ineffective use of resources and outdated equipment. Public spending on TVET is
roughly 6 percent of the total public spending on education. However, about 45 percent of the
TVET budget is used for the purpose of students‟ stipends, and less than one percent is used for
the purpose of infrastructure development and training equipment acquisition, which are
critically inadequate.
Most of the infrastructure of TVET schools needs rehabilitation and expansion.
Interviews with TVET school directors revealed that the existing infrastructure of most schools,
including practical training facilities, may not be able to meet the training needs of implementing
a demand-led competency-based TVET curriculum. For most schools, practical training
equipment and machines are either outdated, broken or of insufficient quantity to meet the
requirements of practical training. Many schools are still using Russian-era equipment.
The policy of providing stipends for students attending preliminary vocational education
has led to an increase in enrollment of TVET students and as a result put on additional pressure
on existing facilities and infrastructure. Indeed, while some updated equipment donated by
developmental partners have been helpful, they are most often only in limited quantity and may
not be sufficient to meet the needs of an increased class size.
5.3. Options to Improve Quality and Relevance
System Review. One of the key recommendations to improve the quality and relevance
of the TVET subsector would be for the government to take stock of the current system to
determine what is working and identify gaps. An in-depth situational analysis of the TVET
system should be conducted on an immediate basis. The analysis should also provide strategic
recommendations to ensure sustainable reform of the TVET system. A review of the
methodology and curriculum materials developed could help refine teaching methodologies,
systems of deployment of materials to schools, the way TVET textbooks are published, and
systems for retaining staff at the NVETMC to ensure institutional memory that would facilitate
the work of the new TVET agency.
42
Governance. The role of the National Vocational Education Training and Methodology
Center from MECS can be absorbed within the new TVET agency to avoid the duplication of
activities. The number of curriculum development specialists should also be expanded, through
recruitment and training, taking into consideration the necessity to revise and develop new
curricula according to the needs of the economy. As the work on curriculum development is
very important to the success of the reformed TVET system, if the organizational structure9 of
the proposed new TVET agency has not factored in the necessity of human resources, then it
may make sense not to have the TVET agency absorbing this function but to develop a
framework to forge collaboration instead.
Infrastructure and Training Equipment. Resources must be channeled into the
updating of equipment and instituting practical training workshops. Training equipment must not
only meet the requirements of revised curricula but also meet the standards and specifications
used by industry. Documented practical workshop norms must be established to guide all schools
in establishing standard practical training facilities. Workshop norms should guide the number
and type of equipment needed for practical training and at the same time ensure that the practical
workshop follows rules of occupation safety and health. Since the state may not be able to
purchase sufficient practical training equipment and machines initially, the acquisition of
simulated training equipment, which is relatively cheaper, maybe a good option. In addition, an
apprenticeship system could be introduced with willing industry partners where students could
attend schools on a block release or day release basis with the rest of their time spent in
industries performing work under structured guidance from trained industry practitioners.
Curriculum Development and Governance The approach should be one that is
demand-led and competency-based. This is widely used in many countries such as Australia,
Singapore (Box6), UK, Canada, and New Zealand. TVET schools should only implement
courses that have clear demand from employers, and curricula should be guided by clear
indications from industries and practitioners on the skills and knowledge requirements of that
particular occupation.
9 Due to the global financial crisis the new TVET agency structure may have about 20 staff.
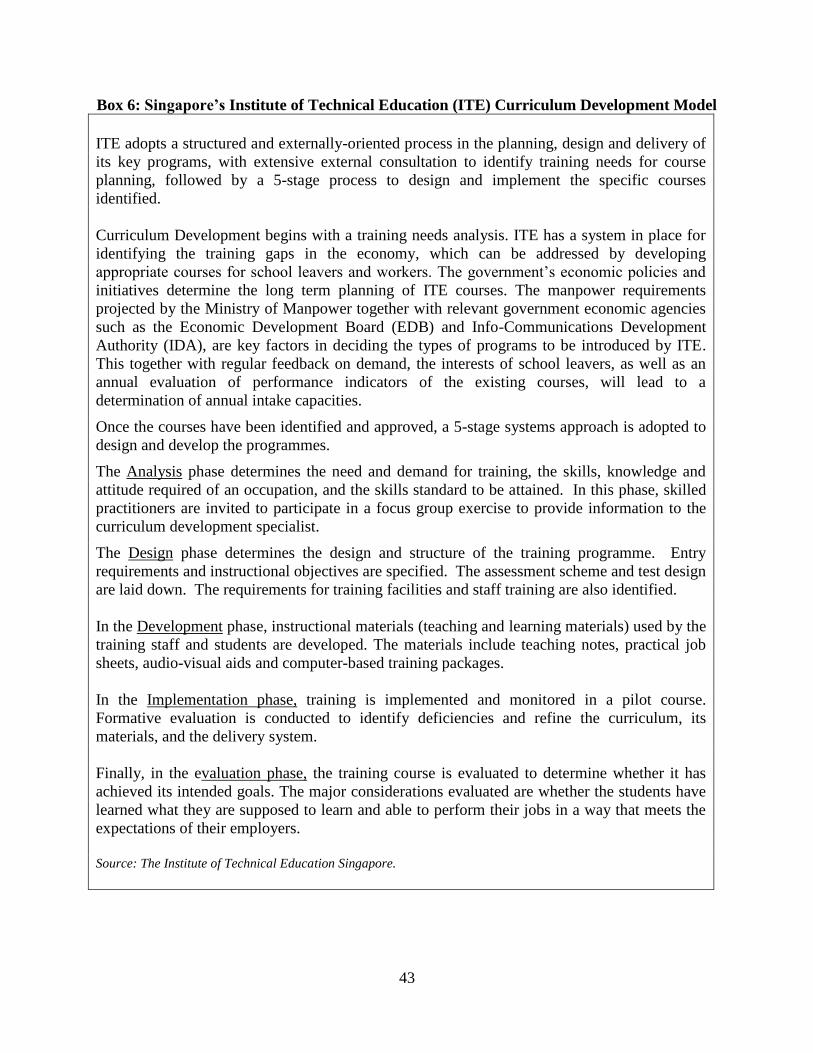
43
Box 6: Singapore’s Institute of Technical Education (ITE) Curriculum Development Model
ITE adopts a structured and externally-oriented process in the planning, design and delivery of
its key programs, with extensive external consultation to identify training needs for course
planning, followed by a 5-stage process to design and implement the specific courses
identified.
Curriculum Development begins with a training needs analysis. ITE has a system in place for
identifying the training gaps in the economy, which can be addressed by developing
appropriate courses for school leavers and workers. The government‟s economic policies and
initiatives determine the long term planning of ITE courses. The manpower requirements
projected by the Ministry of Manpower together with relevant government economic agencies
such as the Economic Development Board (EDB) and Info-Communications Development
Authority (IDA), are key factors in deciding the types of programs to be introduced by ITE.
This together with regular feedback on demand, the interests of school leavers, as well as an
annual evaluation of performance indicators of the existing courses, will lead to a
determination of annual intake capacities.
Once the courses have been identified and approved, a 5-stage systems approach is adopted to
design and develop the programmes.
The Analysis phase determines the need and demand for training, the skills, knowledge and
attitude required of an occupation, and the skills standard to be attained. In this phase, skilled
practitioners are invited to participate in a focus group exercise to provide information to the
curriculum development specialist.
The Design phase determines the design and structure of the training programme. Entry
requirements and instructional objectives are specified. The assessment scheme and test design
are laid down. The requirements for training facilities and staff training are also identified.
In the Development phase, instructional materials (teaching and learning materials) used by the
training staff and students are developed. The materials include teaching notes, practical job
sheets, audio-visual aids and computer-based training packages.
In the Implementation phase, training is implemented and monitored in a pilot course.
Formative evaluation is conducted to identify deficiencies and refine the curriculum, its
materials, and the delivery system.
Finally, in the evaluation phase, the training course is evaluated to determine whether it has
achieved its intended goals. The major considerations evaluated are whether the students have
learned what they are supposed to learn and able to perform their jobs in a way that meets the
expectations of their employers.
Source: The Institute of Technical Education Singapore.
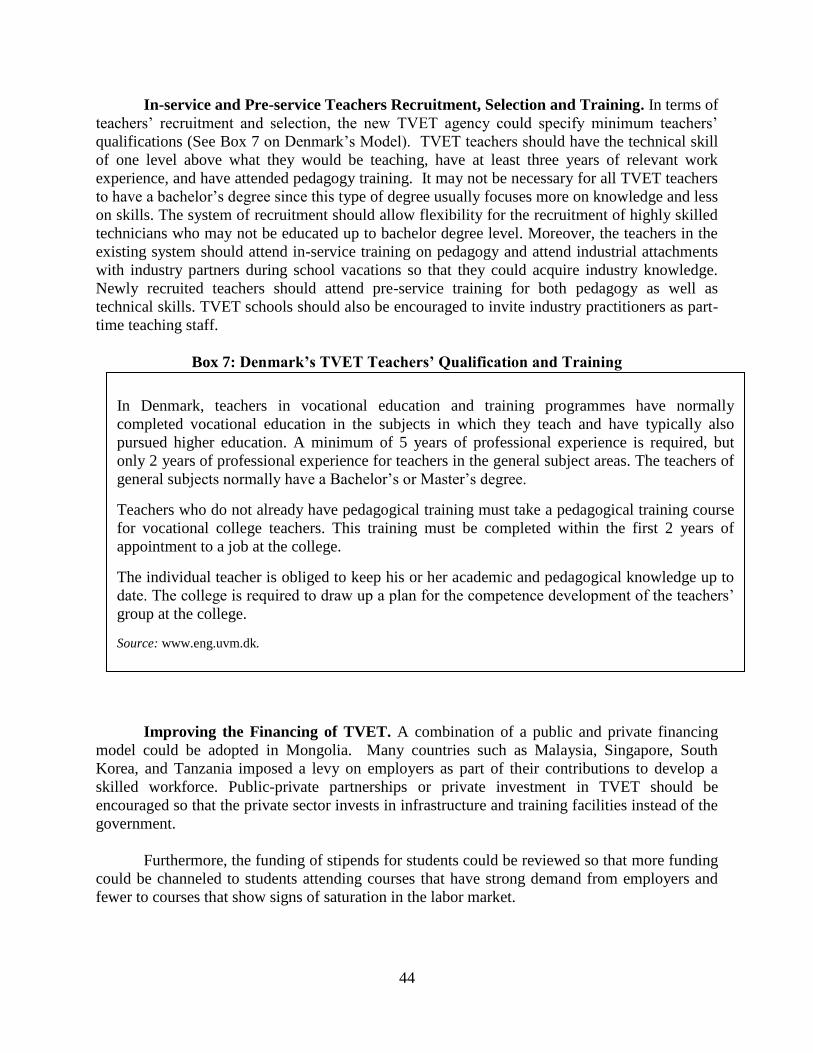
44
In-service and Pre-service Teachers Recruitment, Selection and Training. In terms of
teachers‟ recruitment and selection, the new TVET agency could specify minimum teachers‟
qualifications (See Box 7 on Denmark‟s Model). TVET teachers should have the technical skill
of one level above what they would be teaching, have at least three years of relevant work
experience, and have attended pedagogy training. It may not be necessary for all TVET teachers
to have a bachelor‟s degree since this type of degree usually focuses more on knowledge and less
on skills. The system of recruitment should allow flexibility for the recruitment of highly skilled
technicians who may not be educated up to bachelor degree level. Moreover, the teachers in the
existing system should attend in-service training on pedagogy and attend industrial attachments
with industry partners during school vacations so that they could acquire industry knowledge.
Newly recruited teachers should attend pre-service training for both pedagogy as well as
technical skills. TVET schools should also be encouraged to invite industry practitioners as part-
time teaching staff.
Box 7: Denmark’s TVET Teachers’ Qualification and Training
Improving the Financing of TVET. A combination of a public and private financing
model could be adopted in Mongolia. Many countries such as Malaysia, Singapore, South
Korea, and Tanzania imposed a levy on employers as part of their contributions to develop a
skilled workforce. Public-private partnerships or private investment in TVET should be
encouraged so that the private sector invests in infrastructure and training facilities instead of the
government.
Furthermore, the funding of stipends for students could be reviewed so that more funding
could be channeled to students attending courses that have strong demand from employers and
fewer to courses that show signs of saturation in the labor market.
In Denmark, teachers in vocational education and training programmes have normally
completed vocational education in the subjects in which they teach and have typically also
pursued higher education. A minimum of 5 years of professional experience is required, but
only 2 years of professional experience for teachers in the general subject areas. The teachers of
general subjects normally have a Bachelor‟s or Master‟s degree.
Teachers who do not already have pedagogical training must take a pedagogical training course
for vocational college teachers. This training must be completed within the first 2 years of
appointment to a job at the college.
The individual teacher is obliged to keep his or her academic and pedagogical knowledge up to
date. The college is required to draw up a plan for the competence development of the teachers‟
group at the college.
Source: www.eng.uvm.dk.
45
The Establishment of a National Qualifications Framework (NQF).In the immediate
future, a centralized examination, assessment and qualification system must be established as a
matter of priority. This system will ensure consistency in the output of the TVET system. It is
important that in designing a centralized examination, assessment and qualification system,
practitioners from industries are involved. A well-designed curriculum development model that
is demand-led and competency-based and an examination, assessment and qualification system
which involves industries‟ participation will build a solid foundation of quality assurance. It will
also ensure consistent quality of the TVET outputs. In the long run, a NQF framework similar to
those adopted by countries such as Australia (Box8), New Zealand, UK, and South Africa could
be implemented.
Data Monitoring. A coherent and coordinated labor market information system must be
established to provide current information on labor market requirements and serve as a form of
monitoring and evaluation (M&E) on the output of the reformed TVET system. A good M&E
system would ensure that there is quality control on the output of the TVET system and provide
checks and balances to employers of TVET graduates. The labor market information system
must enforce formal tracer studies on an annual basis on all TVET schools. Data from tracer
studies as well as information collected from employers‟ censuses and other labor market
surveys will provide more complete information for the new TVET agency to make informed
policy formulations and strategic plans for the system.
In sum, with a strong demand for TVET, it makes sense to channel some students into
this subsector. However, this strategy will only be successful if there are sufficient investments
into the supply of the system. These investments require additional resources and are urgently
needed to increase the capacity for governing the subsector, improve the quality of TVET
delivery, forge greater linkages with industry, and provide placement assistance to graduates.
While the challenges of the lack of infrastructure and equipment, poor quality assurance
mechanisms, and the lack of opportunity for faculty skill upgrading are similar to those faced by
the tertiary subsector, the challenges faced by the TVET subsector may indeed be tougher. The
Government needs to make vocational education an attractive alternative to academic higher
education and work to remove the stigma around TVET as a second-track option. After all,
creating new job openings in sectors with higher productivity and higher wages and earnings will
not have the desired impact on living standards unless more Mongolian women and men have
the skills that employers‟ demand.
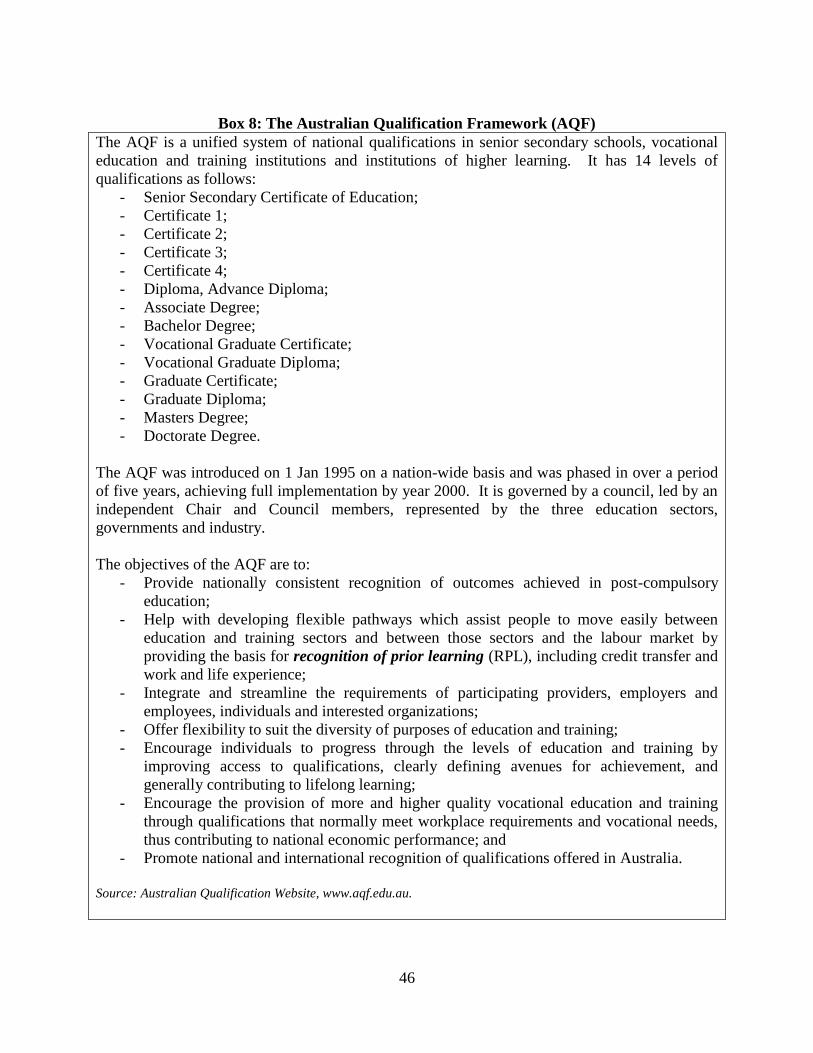
46
Box 8: The Australian Qualification Framework (AQF)
The AQF is a unified system of national qualifications in senior secondary schools, vocational
education and training institutions and institutions of higher learning. It has 14 levels of
qualifications as follows:
- Senior Secondary Certificate of Education;
- Certificate 1;
- Certificate 2;
- Certificate 3;
- Certificate 4;
- Diploma, Advance Diploma;
- Associate Degree;
- Bachelor Degree;
- Vocational Graduate Certificate;
- Vocational Graduate Diploma;
- Graduate Certificate;
- Graduate Diploma;
- Masters Degree;
- Doctorate Degree.
The AQF was introduced on 1 Jan 1995 on a nation-wide basis and was phased in over a period
of five years, achieving full implementation by year 2000. It is governed by a council, led by an
independent Chair and Council members, represented by the three education sectors,
governments and industry.
The objectives of the AQF are to:
- Provide nationally consistent recognition of outcomes achieved in post-compulsory
education;
- Help with developing flexible pathways which assist people to move easily between
education and training sectors and between those sectors and the labour market by
providing the basis for recognition of prior learning (RPL), including credit transfer and
work and life experience;
- Integrate and streamline the requirements of participating providers, employers and
employees, individuals and interested organizations;
- Offer flexibility to suit the diversity of purposes of education and training;
- Encourage individuals to progress through the levels of education and training by
improving access to qualifications, clearly defining avenues for achievement, and
generally contributing to lifelong learning;
- Encourage the provision of more and higher quality vocational education and training
through qualifications that normally meet workplace requirements and vocational needs,
thus contributing to national economic performance; and
- Promote national and international recognition of qualifications offered in Australia.
Source: Australian Qualification Website, www.aqf.edu.au.
47
6. CONCLUSIONS
Increasing investment in all subsectors of education – from primary and secondary to
post-basic – is imperative if Mongolia is to reduce its poverty, increase its employment, and
make its labor force more responsive to the needs of employers.
With regards to tertiary education, there is much to do. To summarize, as a result of rapid
expansion, an inequitable financing mechanism, and insufficient quality assurance, Mongolia‟s
tertiary education suffers from low external efficiency, inequitable access, and poor quality.
There is an urgent need to: (i) improve the coherence, governance, and responsiveness of the
country‟s tertiary education system to the changing demands of the market economy; (ii)
improve efficiency and resource utilization; and (iii) improve the quality of curricula, teaching,
and learning in the subsector.
To improve these areas requires making strategic choices and investments in tertiary education.
The following steps should be considered:
Summary of Recommendations
Improve the quality of basic education to ensure the poor complete schooling so as to
enhance the probability of their enrollment in higher education;
Rationalize TEIs in order to concentrate resources on fewer institutions and programs to
help them reach international standards;
Use competitive block grants to allocate resources (such as equipment and staff training)
to the best programs (as measured by key performance indicators and labor market
outcomes) on a tri-annual basis to allow for predictability of funding and to give time to
demonstrate outcomes;
Invigorate the accreditation and quality assurance mechanisms, using international
benchmarks, to facilitate rationalization of public and private institutions and to allow for
good quality offshore programs to compete in Mongolia;
Develop a diversified but integrated tertiary education system so that each institution can
play a key role in regional development and transfers between institutions can be made;
48
Establish a Tertiary Education Commission comprising representatives from industry,
key professions, and academics from developed countries to set strategic direction,
allocate block grants, and to oversee the role of TEIs in facilitating regional development;
Tighten eligibility criteria and improve the targeting of the State Training Fund to aid
low-income students;
Set up a labor market information system to inform the public about the key performance
indicators of each institution and employment statistics by discipline to facilitate school
and career choice;
Strengthen links between the supply of education and training and demand for skills in
labor markets, through greater participation by employers and unions in reviewing
training courses, setting occupational standards, offering on-the-job training and
developing bridge programs between school and work, such as through apprenticeships
and internships; and
Create a national council on vocational training, skills standards and certification, which
involves key stakeholders who will work together to support the development of a legal
framework, financing mechanisms, methodological centers, vocational standards,
pedagogical issues, certification procedures, teacher training, school management, and
training facilities.
It is clear that implementation of most of these recommendations will require additional
resources for the subsector, and planning reform for the subsector needs to begin. Investing in
the subsector over the medium-term will be essential to ensure tertiary education‟s continuing
contribution to competitiveness and growth.
49
REFERENCES
The Asian Development Bank. 2004. “The Mongolian Education and Training Fund: Building a
Sustainable Future.” Draft. .
Mikhail, Sam. 2008. Presentation at a Vocational Education Workshop at Peking University,
June, 2008.
Ministry of Education, Culture, and Science of Mongolia, Various Data, 2006, 2007, 2008.
Organization for Economic Cooperation and Development, Education at a Glance, 2007.
Raza, Reehana. 2009. “Examining Autonomy and Accountability in Public and Private Tertiary
Institutions”. World Bank (Draft)
Ridao-Cano, “Mongolia: Building Skills for the New Economy,” Washington, DC: The World
Bank, 2006.
Sakellariou, 2009, “Industry and Skill Premia in Asia,” Background Paper for the World Bank‟s
Regional Study on Skills, Preliminary Draft.
Salmi, Jamil. 2009. “The Challenge of Establishing World Class Universities,” Washington, DC:
The World Bank.
World Bank, The. 2001. China: Higher Education, Washington DC: The World Bank
World Bank, The, 2008. “Mongolia: Consolidating the Gains, Managing the Boom, and Moving
to Better Service Delivery.”
UNDP Consultant‟s Report on Higher Education in Mongolia. 2009 (Draft)
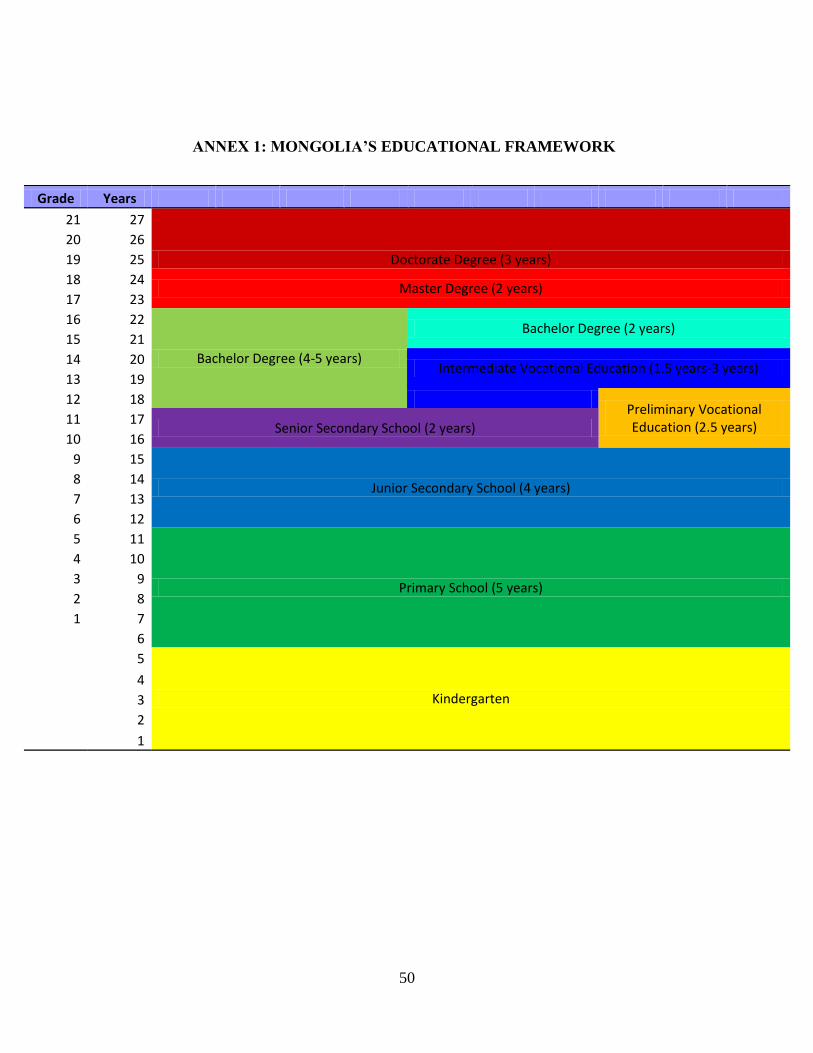
50
ANNEX 1: MONGOLIA’S EDUCATIONAL FRAMEWORK
Grade Years
21 27
Doctorate Degree (3 years) 20 26 19 25 18 24
Master Degree (2 years) 17 23 16 22
Bachelor Degree (4-5 years)
Bachelor Degree (2 years) 15 21
14 20 Intermediate Vocational Education (1.5 years-3 years)
13 19 12 18
Preliminary Vocational Education (2.5 years) 11 17
Senior Secondary School (2 years) 10 16
9 15
Junior Secondary School (4 years) 8 14 7 13 6 12 5 11
Primary School (5 years)
4 10
3 9 2 8 1 7
6
5
Kindergarten 4
3
2
1
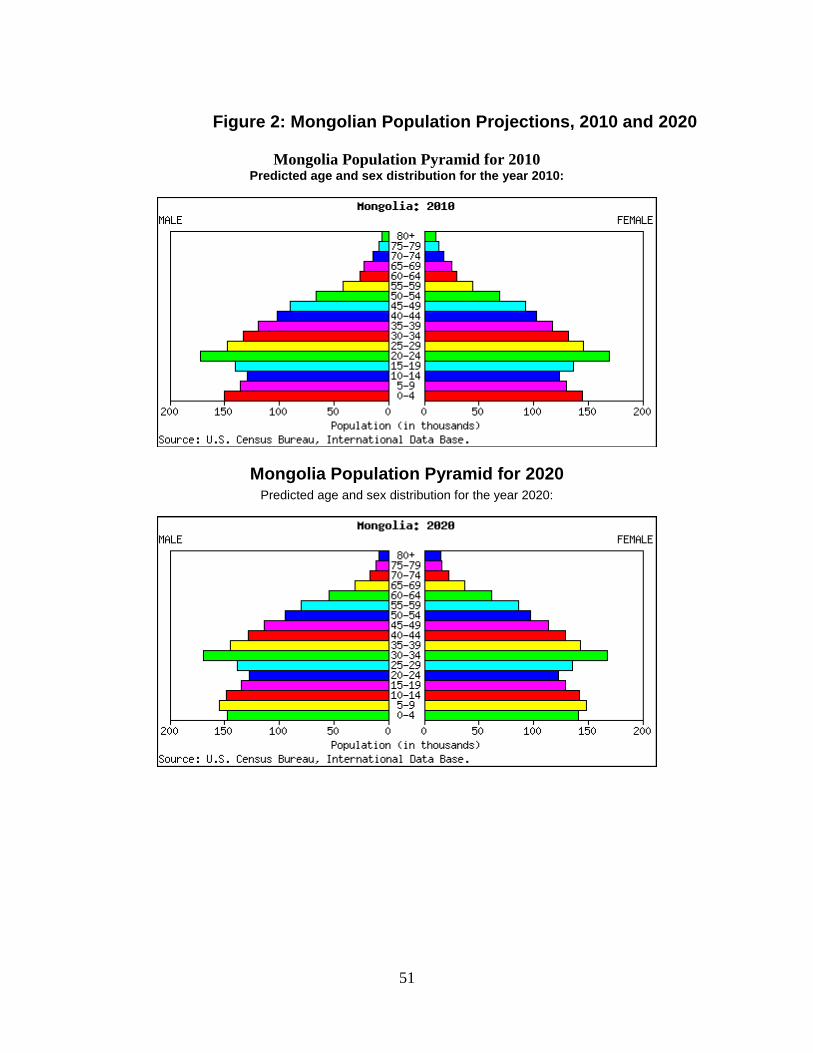
51
Figure 2: Mongolian Population Projections, 2010 and 2020
Mongolia Population Pyramid for 2010 Predicted age and sex distribution for the year 2010:
Mongolia Population Pyramid for 2020 Predicted age and sex distribution for the year 2020:
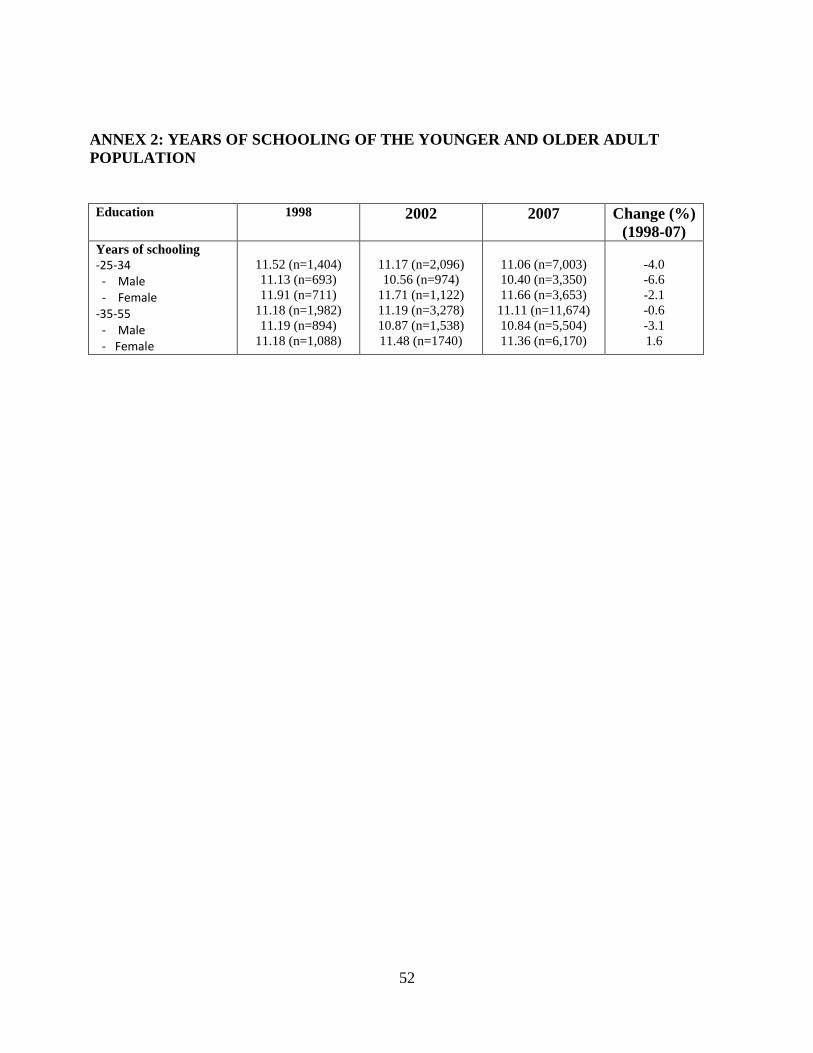
52
ANNEX 2: YEARS OF SCHOOLING OF THE YOUNGER AND OLDER ADULT
POPULATION
Education 1998 2002 2007 Change (%)
(1998-07) Years of schooling
- -25-34 - - Male - - Female - -35-55 - - Male - - Female
11.52 (n=1,404)
11.13 (n=693)
11.91 (n=711)
11.18 (n=1,982)
11.19 (n=894)
11.18 (n=1,088)
11.17 (n=2,096)
10.56 (n=974)
11.71 (n=1,122)
11.19 (n=3,278)
10.87 (n=1,538)
11.48 (n=1740)
11.06 (n=7,003)
10.40 (n=3,350)
11.66 (n=3,653)
11.11 (n=11,674)
10.84 (n=5,504)
11.36 (n=6,170)
-4.0
-6.6
-2.1
-0.6
-3.1
1.6
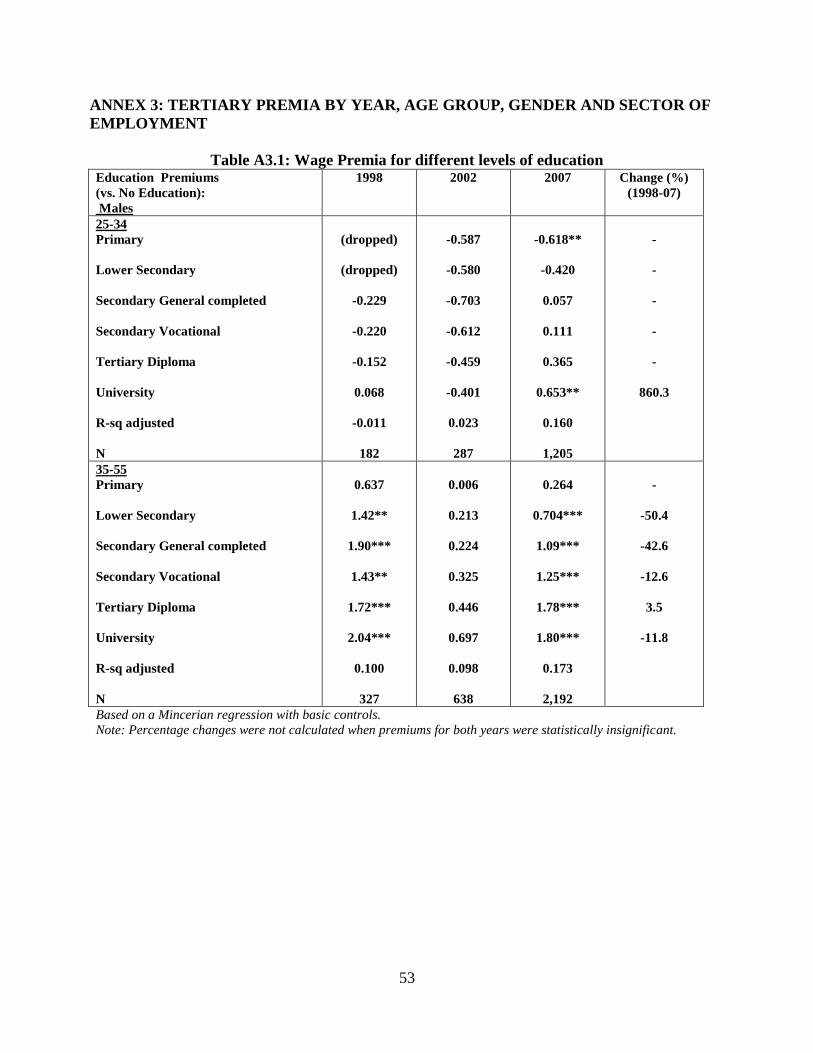
53
ANNEX 3: TERTIARY PREMIA BY YEAR, AGE GROUP, GENDER AND SECTOR OF
EMPLOYMENT
Table A3.1: Wage Premia for different levels of education Education Premiums
(vs. No Education):
Males
1998 2002 2007 Change (%)
(1998-07)
25-34
Primary
Lower Secondary
Secondary General completed
Secondary Vocational
Tertiary Diploma
University
R-sq adjusted
N
(dropped)
(dropped)
-0.229
-0.220
-0.152
0.068
-0.011
182
-0.587
-0.580
-0.703
-0.612
-0.459
-0.401
0.023
287
-0.618**
-0.420
0.057
0.111
0.365
0.653**
0.160
1,205
-
-
-
-
-
860.3
35-55
Primary
Lower Secondary
Secondary General completed
Secondary Vocational
Tertiary Diploma
University
R-sq adjusted
N
0.637
1.42**
1.90***
1.43**
1.72***
2.04***
0.100
327
0.006
0.213
0.224
0.325
0.446
0.697
0.098
638
0.264
0.704***
1.09***
1.25***
1.78***
1.80***
0.173
2,192
-
-50.4
-42.6
-12.6
3.5
-11.8
Based on a Mincerian regression with basic controls.
Note: Percentage changes were not calculated when premiums for both years were statistically insignificant.
54
Table A3.2: Wage Premia for different levels of education Education Premiums
(vs. No Education):
Females
1998 2002 2007 Change (%)
(1998-07)
25-34
Primary
Lower Secondary
Secondary General completed
Secondary Vocational
Tertiary Diploma
University
R-sq adjusted
N
(dropped)
0.616
0.685
0.630
0.880
1.22
0.041
202
(dropped)
(dropped)
0.230
0.397**
0.628***
0.918***
0.124
376
0.565
0.813*
1.48***
1.87***
2.22***
2.31***
0.208
1,344
-
32.0
116.1
196.8
152.3
89.3
35-55
Primary
Lower Secondary
Secondary General completed
Secondary Vocational
Tertiary Diploma
University
R-sq adjusted
N
(dropped)
0.357
0.526**
0.628**
0.636***
0.970***
0.093
375
0.899
1.18*
1.38**
1.47**
1.66***
1.87***
0.141
743
-0.072
0.113
0.556*
0.741**
1.20***
1.29***
0.144
2,547
-
-
5.7
18.0
88.7
33.0
Based on a Mincerian regression with basic controls.
Note: Percentage changes were not calculated when premiums for both years were statistically insignificant.
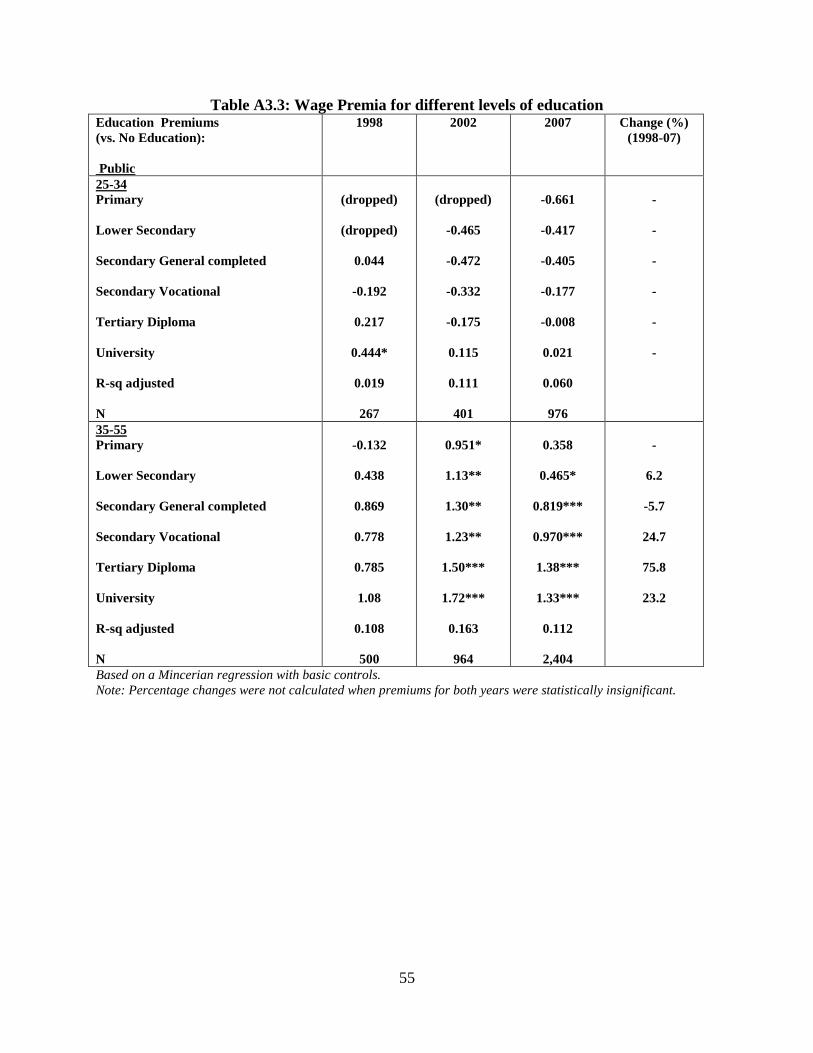
55
Table A3.3: Wage Premia for different levels of education Education Premiums
(vs. No Education):
Public
1998 2002 2007 Change (%)
(1998-07)
25-34
Primary
Lower Secondary
Secondary General completed
Secondary Vocational
Tertiary Diploma
University
R-sq adjusted
N
(dropped)
(dropped)
0.044
-0.192
0.217
0.444*
0.019
267
(dropped)
-0.465
-0.472
-0.332
-0.175
0.115
0.111
401
-0.661
-0.417
-0.405
-0.177
-0.008
0.021
0.060
976
-
-
-
-
-
-
35-55
Primary
Lower Secondary
Secondary General completed
Secondary Vocational
Tertiary Diploma
University
R-sq adjusted
N
-0.132
0.438
0.869
0.778
0.785
1.08
0.108
500
0.951*
1.13**
1.30**
1.23**
1.50***
1.72***
0.163
964
0.358
0.465*
0.819***
0.970***
1.38***
1.33***
0.112
2,404
-
6.2
-5.7
24.7
75.8
23.2
Based on a Mincerian regression with basic controls.
Note: Percentage changes were not calculated when premiums for both years were statistically insignificant.
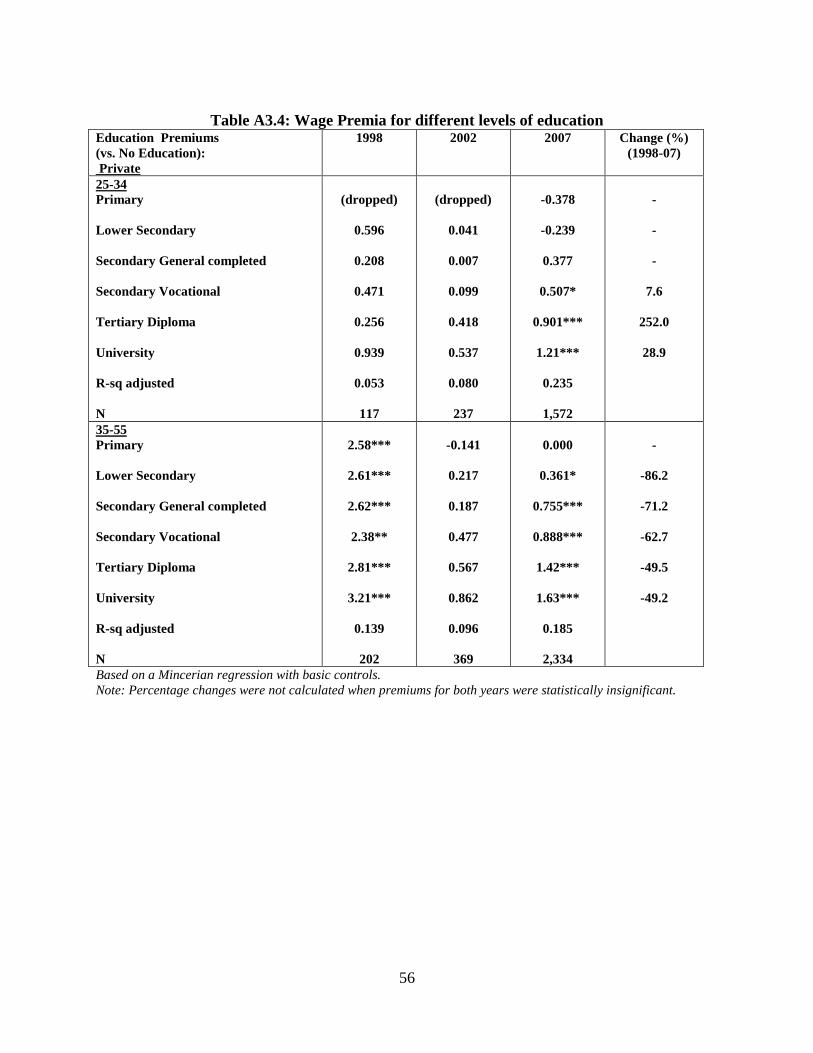
56
Table A3.4: Wage Premia for different levels of education Education Premiums
(vs. No Education):
Private
1998 2002 2007 Change (%)
(1998-07)
25-34
Primary
Lower Secondary
Secondary General completed
Secondary Vocational
Tertiary Diploma
University
R-sq adjusted
N
(dropped)
0.596
0.208
0.471
0.256
0.939
0.053
117
(dropped)
0.041
0.007
0.099
0.418
0.537
0.080
237
-0.378
-0.239
0.377
0.507*
0.901***
1.21***
0.235
1,572
-
-
-
7.6
252.0
28.9
35-55
Primary
Lower Secondary
Secondary General completed
Secondary Vocational
Tertiary Diploma
University
R-sq adjusted
N
2.58***
2.61***
2.62***
2.38**
2.81***
3.21***
0.139
202
-0.141
0.217
0.187
0.477
0.567
0.862
0.096
369
0.000
0.361*
0.755***
0.888***
1.42***
1.63***
0.185
2,334
-
-86.2
-71.2
-62.7
-49.5
-49.2
Based on a Mincerian regression with basic controls.
Note: Percentage changes were not calculated when premiums for both years were statistically insignificant.
57
ANNEX 4: AGGREGATE INSTITUTIONAL AND ENROLLMENT DATA
Figure A4.1: The Number of Private and Public TEIs in Mongolia
There Are Far More Private HEIs in Mongolia than Public
HEIs
0
20
40
60
80
100
120
140
160
2001 2002 2003 2004 2005
Public
Private
Source: Ministry of Education, Culture, and Science (MECS), 2008.
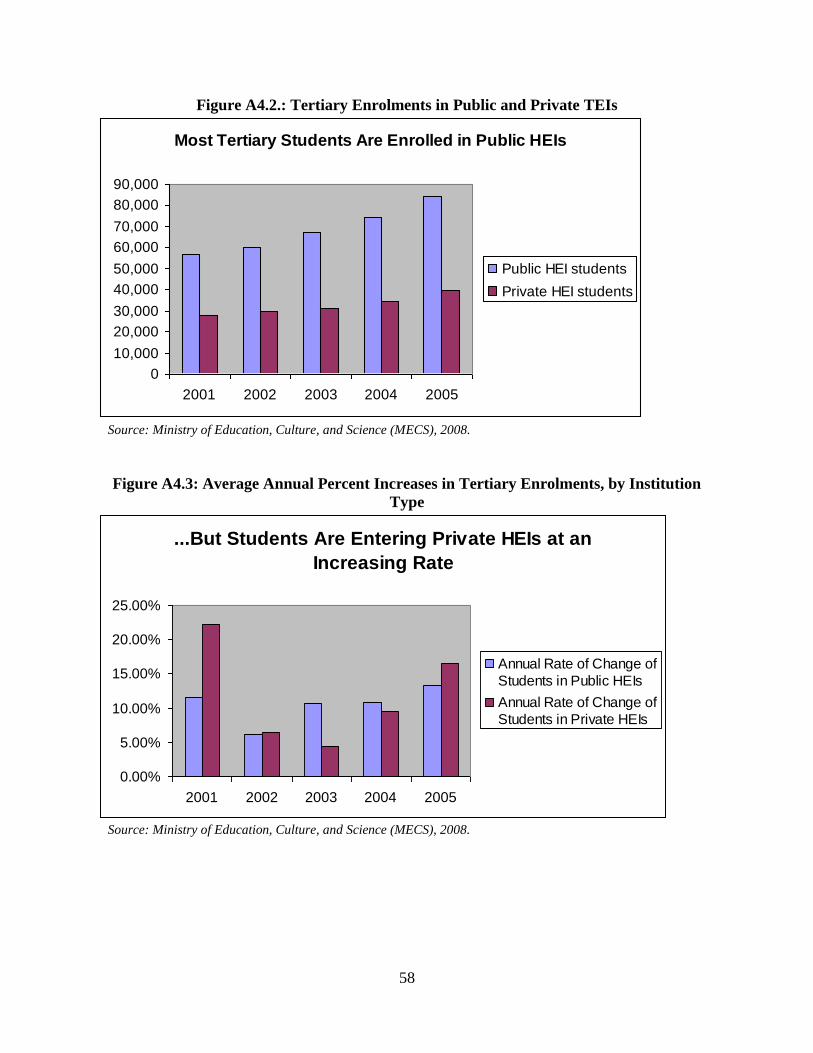
58
Figure A4.2.: Tertiary Enrolments in Public and Private TEIs
Most Tertiary Students Are Enrolled in Public HEIs
0
10,000
20,000
30,000
40,000
50,000
60,000
70,000
80,000
90,000
2001 2002 2003 2004 2005
Public HEI students
Private HEI students
Source: Ministry of Education, Culture, and Science (MECS), 2008.
Figure A4.3: Average Annual Percent Increases in Tertiary Enrolments, by Institution
Type
...But Students Are Entering Private HEIs at an
Increasing Rate
0.00%
5.00%
10.00%
15.00%
20.00%
25.00%
2001 2002 2003 2004 2005
Annual Rate of Change of
Students in Public HEIs
Annual Rate of Change of
Students in Private HEIs
Source: Ministry of Education, Culture, and Science (MECS), 2008.
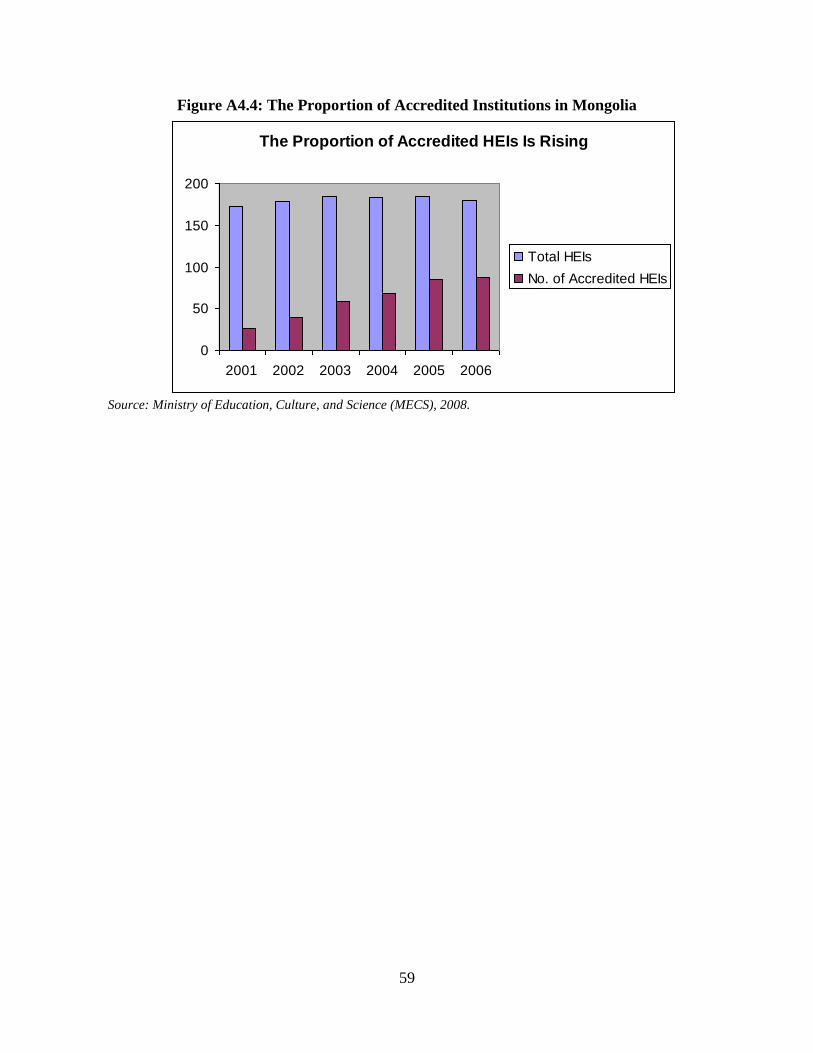
59
Figure A4.4: The Proportion of Accredited Institutions in Mongolia
The Proportion of Accredited HEIs Is Rising
0
50
100
150
200
2001 2002 2003 2004 2005 2006
Total HEIs
No. of Accredited HEIs
Source: Ministry of Education, Culture, and Science (MECS), 2008.
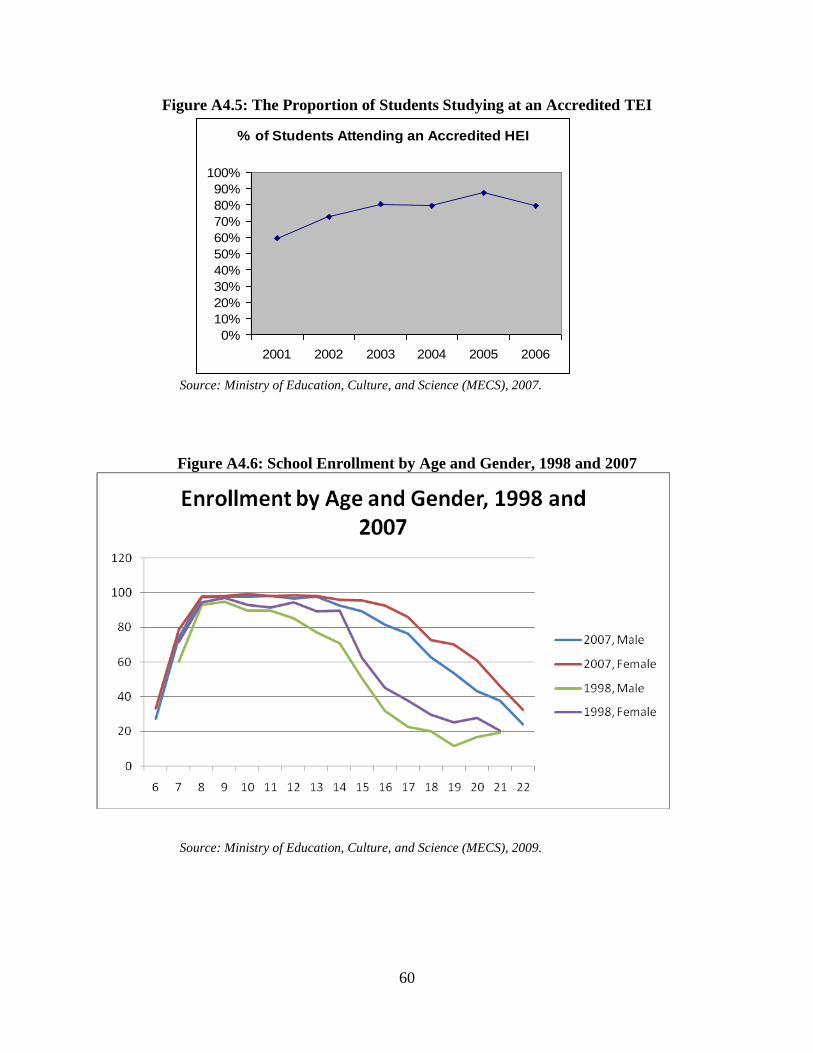
60
Figure A4.5: The Proportion of Students Studying at an Accredited TEI
% of Students Attending an Accredited HEI
0%
10%
20%
30%
40%
50%
60%
70%
80%
90%
100%
2001 2002 2003 2004 2005 2006
Source: Ministry of Education, Culture, and Science (MECS), 2007.
Figure A4.6: School Enrollment by Age and Gender, 1998 and 2007
Source: Ministry of Education, Culture, and Science (MECS), 2009.
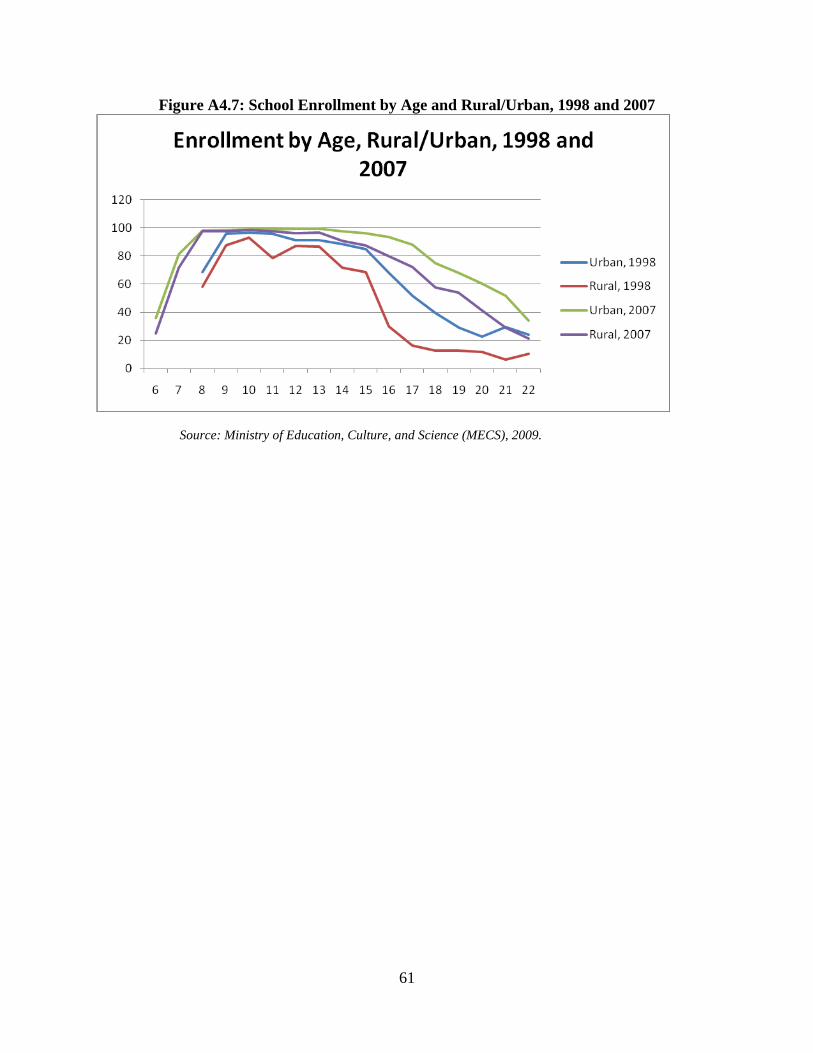
61
Figure A4.7: School Enrollment by Age and Rural/Urban, 1998 and 2007
Source: Ministry of Education, Culture, and Science (MECS), 2009.
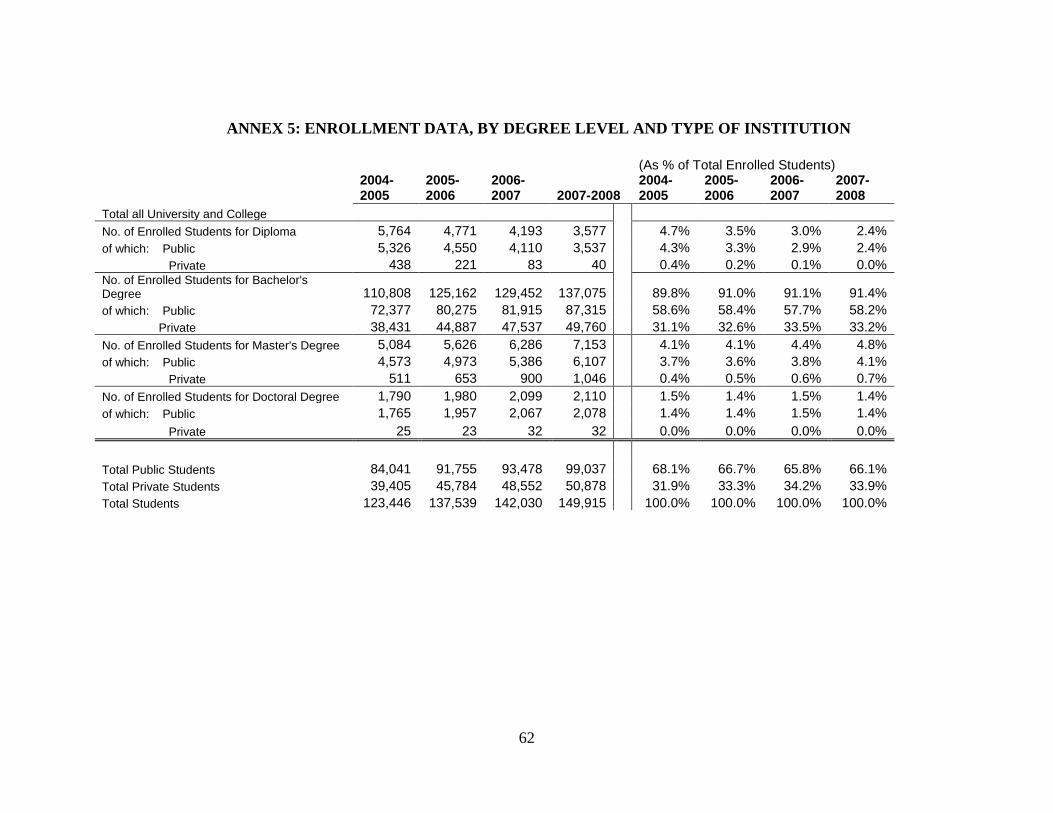
62
ANNEX 5: ENROLLMENT DATA, BY DEGREE LEVEL AND TYPE OF INSTITUTION
(As % of Total Enrolled Students)
2004-2005
2005-2006
2006-2007 2007-2008
2004-2005
2005-2006
2006-2007
2007-2008
Total all University and College
No. of Enrolled Students for Diploma 5,764 4,771 4,193 3,577 4.7% 3.5% 3.0% 2.4%
of which: Public 5,326 4,550 4,110 3,537 4.3% 3.3% 2.9% 2.4%
Private 438 221 83 40 0.4% 0.2% 0.1% 0.0% No. of Enrolled Students for Bachelor's Degree 110,808 125,162 129,452 137,075 89.8% 91.0% 91.1% 91.4%
of which: Public 72,377 80,275 81,915 87,315 58.6% 58.4% 57.7% 58.2%
Private 38,431 44,887 47,537 49,760 31.1% 32.6% 33.5% 33.2%
No. of Enrolled Students for Master's Degree 5,084 5,626 6,286 7,153 4.1% 4.1% 4.4% 4.8%
of which: Public 4,573 4,973 5,386 6,107 3.7% 3.6% 3.8% 4.1%
Private 511 653 900 1,046 0.4% 0.5% 0.6% 0.7%
No. of Enrolled Students for Doctoral Degree 1,790 1,980 2,099 2,110 1.5% 1.4% 1.5% 1.4%
of which: Public 1,765 1,957 2,067 2,078 1.4% 1.4% 1.5% 1.4%
Private 25 23 32 32 0.0% 0.0% 0.0% 0.0%
Total Public Students 84,041 91,755 93,478 99,037 68.1% 66.7% 65.8% 66.1%
Total Private Students 39,405 45,784 48,552 50,878 31.9% 33.3% 34.2% 33.9%
Total Students 123,446 137,539 142,030 149,915 100.0% 100.0% 100.0% 100.0%
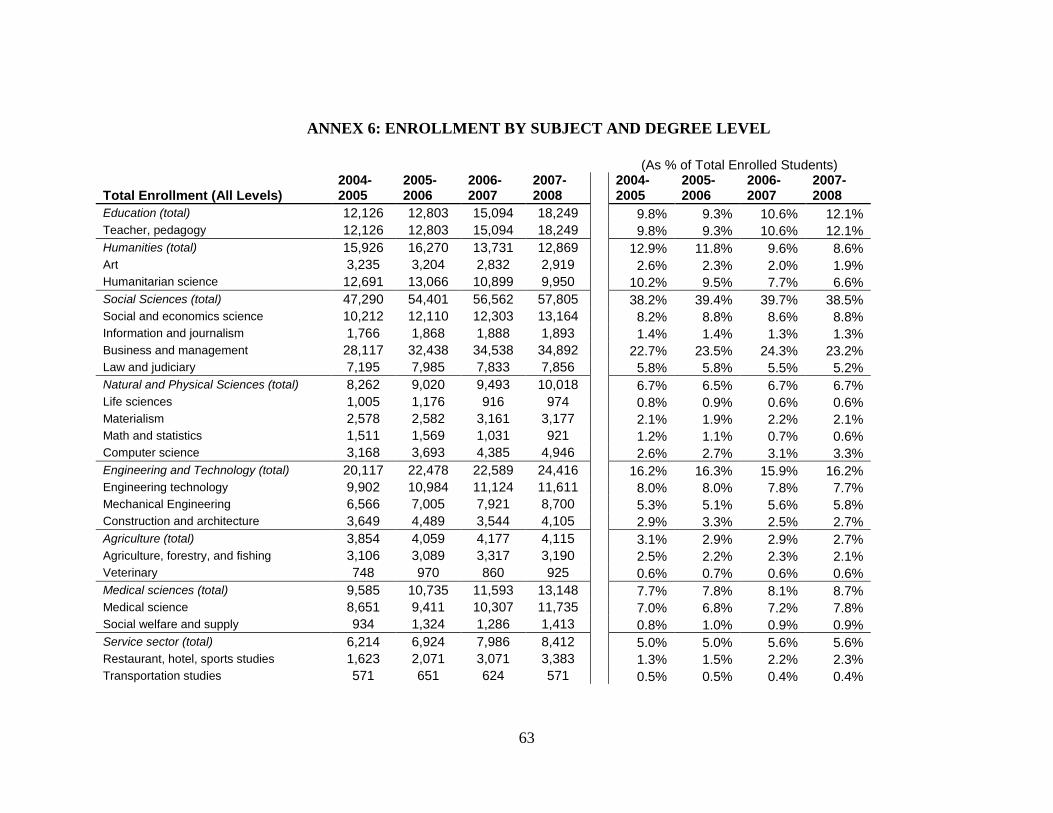
63
ANNEX 6: ENROLLMENT BY SUBJECT AND DEGREE LEVEL
(As % of Total Enrolled Students)
Total Enrollment (All Levels) 2004-2005
2005-2006
2006-2007
2007-2008
2004-2005
2005-2006
2006-2007
2007-2008
Education (total) 12,126 12,803 15,094 18,249 9.8% 9.3% 10.6% 12.1%
Teacher, pedagogy 12,126 12,803 15,094 18,249 9.8% 9.3% 10.6% 12.1%
Humanities (total) 15,926 16,270 13,731 12,869 12.9% 11.8% 9.6% 8.6%
Art 3,235 3,204 2,832 2,919 2.6% 2.3% 2.0% 1.9%
Humanitarian science 12,691 13,066 10,899 9,950 10.2% 9.5% 7.7% 6.6%
Social Sciences (total) 47,290 54,401 56,562 57,805 38.2% 39.4% 39.7% 38.5%
Social and economics science 10,212 12,110 12,303 13,164 8.2% 8.8% 8.6% 8.8%
Information and journalism 1,766 1,868 1,888 1,893 1.4% 1.4% 1.3% 1.3%
Business and management 28,117 32,438 34,538 34,892 22.7% 23.5% 24.3% 23.2%
Law and judiciary 7,195 7,985 7,833 7,856 5.8% 5.8% 5.5% 5.2%
Natural and Physical Sciences (total) 8,262 9,020 9,493 10,018 6.7% 6.5% 6.7% 6.7%
Life sciences 1,005 1,176 916 974 0.8% 0.9% 0.6% 0.6%
Materialism 2,578 2,582 3,161 3,177 2.1% 1.9% 2.2% 2.1%
Math and statistics 1,511 1,569 1,031 921 1.2% 1.1% 0.7% 0.6%
Computer science 3,168 3,693 4,385 4,946 2.6% 2.7% 3.1% 3.3%
Engineering and Technology (total) 20,117 22,478 22,589 24,416 16.2% 16.3% 15.9% 16.2%
Engineering technology 9,902 10,984 11,124 11,611 8.0% 8.0% 7.8% 7.7%
Mechanical Engineering 6,566 7,005 7,921 8,700 5.3% 5.1% 5.6% 5.8%
Construction and architecture 3,649 4,489 3,544 4,105 2.9% 3.3% 2.5% 2.7%
Agriculture (total) 3,854 4,059 4,177 4,115 3.1% 2.9% 2.9% 2.7%
Agriculture, forestry, and fishing 3,106 3,089 3,317 3,190 2.5% 2.2% 2.3% 2.1%
Veterinary 748 970 860 925 0.6% 0.7% 0.6% 0.6%
Medical sciences (total) 9,585 10,735 11,593 13,148 7.7% 7.8% 8.1% 8.7%
Medical science 8,651 9,411 10,307 11,735 7.0% 6.8% 7.2% 7.8%
Social welfare and supply 934 1,324 1,286 1,413 0.8% 1.0% 0.9% 0.9%
Service sector (total) 6,214 6,924 7,986 8,412 5.0% 5.0% 5.6% 5.6%
Restaurant, hotel, sports studies 1,623 2,071 3,071 3,383 1.3% 1.5% 2.2% 2.3%
Transportation studies 571 651 624 571 0.5% 0.5% 0.4% 0.4%
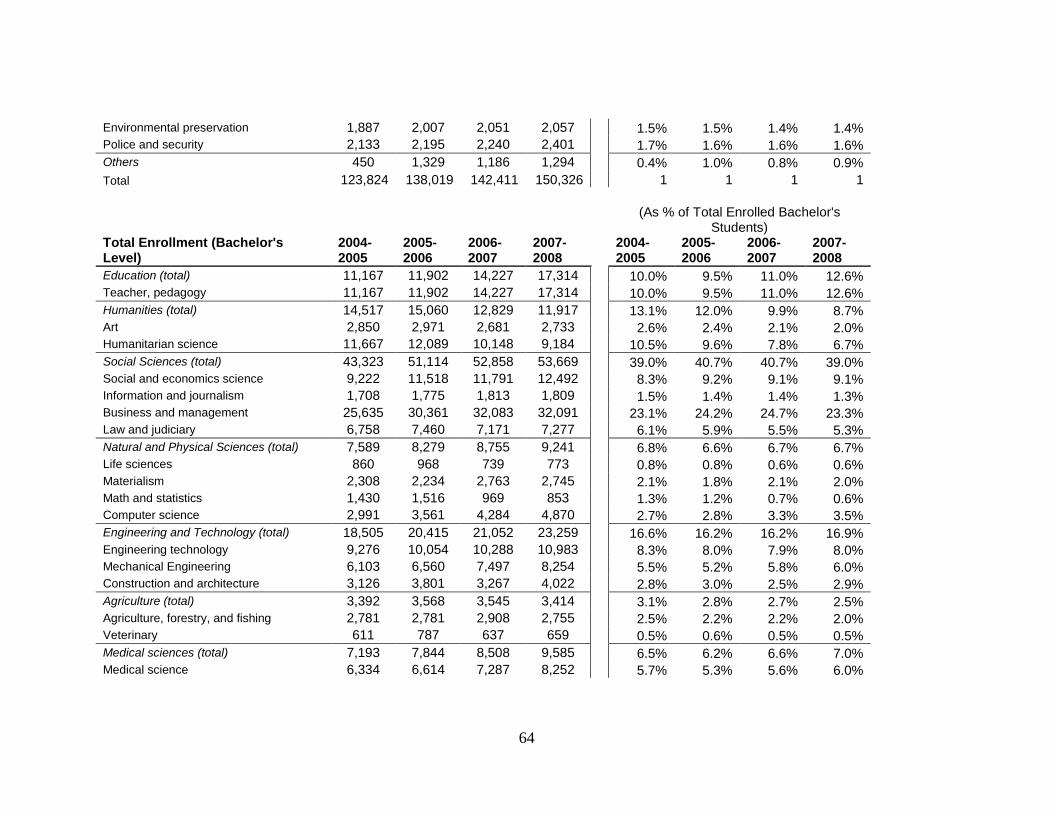
64
Environmental preservation 1,887 2,007 2,051 2,057 1.5% 1.5% 1.4% 1.4%
Police and security 2,133 2,195 2,240 2,401 1.7% 1.6% 1.6% 1.6%
Others 450 1,329 1,186 1,294 0.4% 1.0% 0.8% 0.9%
Total 123,824 138,019 142,411 150,326 1 1 1 1
(As % of Total Enrolled Bachelor's
Students) Total Enrollment (Bachelor's Level)
2004-2005
2005-2006
2006-2007
2007-2008
2004-2005
2005-2006
2006-2007
2007-2008
Education (total) 11,167 11,902 14,227 17,314 10.0% 9.5% 11.0% 12.6%
Teacher, pedagogy 11,167 11,902 14,227 17,314 10.0% 9.5% 11.0% 12.6%
Humanities (total) 14,517 15,060 12,829 11,917 13.1% 12.0% 9.9% 8.7%
Art 2,850 2,971 2,681 2,733 2.6% 2.4% 2.1% 2.0%
Humanitarian science 11,667 12,089 10,148 9,184 10.5% 9.6% 7.8% 6.7%
Social Sciences (total) 43,323 51,114 52,858 53,669 39.0% 40.7% 40.7% 39.0%
Social and economics science 9,222 11,518 11,791 12,492 8.3% 9.2% 9.1% 9.1%
Information and journalism 1,708 1,775 1,813 1,809 1.5% 1.4% 1.4% 1.3%
Business and management 25,635 30,361 32,083 32,091 23.1% 24.2% 24.7% 23.3%
Law and judiciary 6,758 7,460 7,171 7,277 6.1% 5.9% 5.5% 5.3%
Natural and Physical Sciences (total) 7,589 8,279 8,755 9,241 6.8% 6.6% 6.7% 6.7%
Life sciences 860 968 739 773 0.8% 0.8% 0.6% 0.6%
Materialism 2,308 2,234 2,763 2,745 2.1% 1.8% 2.1% 2.0%
Math and statistics 1,430 1,516 969 853 1.3% 1.2% 0.7% 0.6%
Computer science 2,991 3,561 4,284 4,870 2.7% 2.8% 3.3% 3.5%
Engineering and Technology (total) 18,505 20,415 21,052 23,259 16.6% 16.2% 16.2% 16.9%
Engineering technology 9,276 10,054 10,288 10,983 8.3% 8.0% 7.9% 8.0%
Mechanical Engineering 6,103 6,560 7,497 8,254 5.5% 5.2% 5.8% 6.0%
Construction and architecture 3,126 3,801 3,267 4,022 2.8% 3.0% 2.5% 2.9%
Agriculture (total) 3,392 3,568 3,545 3,414 3.1% 2.8% 2.7% 2.5%
Agriculture, forestry, and fishing 2,781 2,781 2,908 2,755 2.5% 2.2% 2.2% 2.0%
Veterinary 611 787 637 659 0.5% 0.6% 0.5% 0.5%
Medical sciences (total) 7,193 7,844 8,508 9,585 6.5% 6.2% 6.6% 7.0%
Medical science 6,334 6,614 7,287 8,252 5.7% 5.3% 5.6% 6.0%
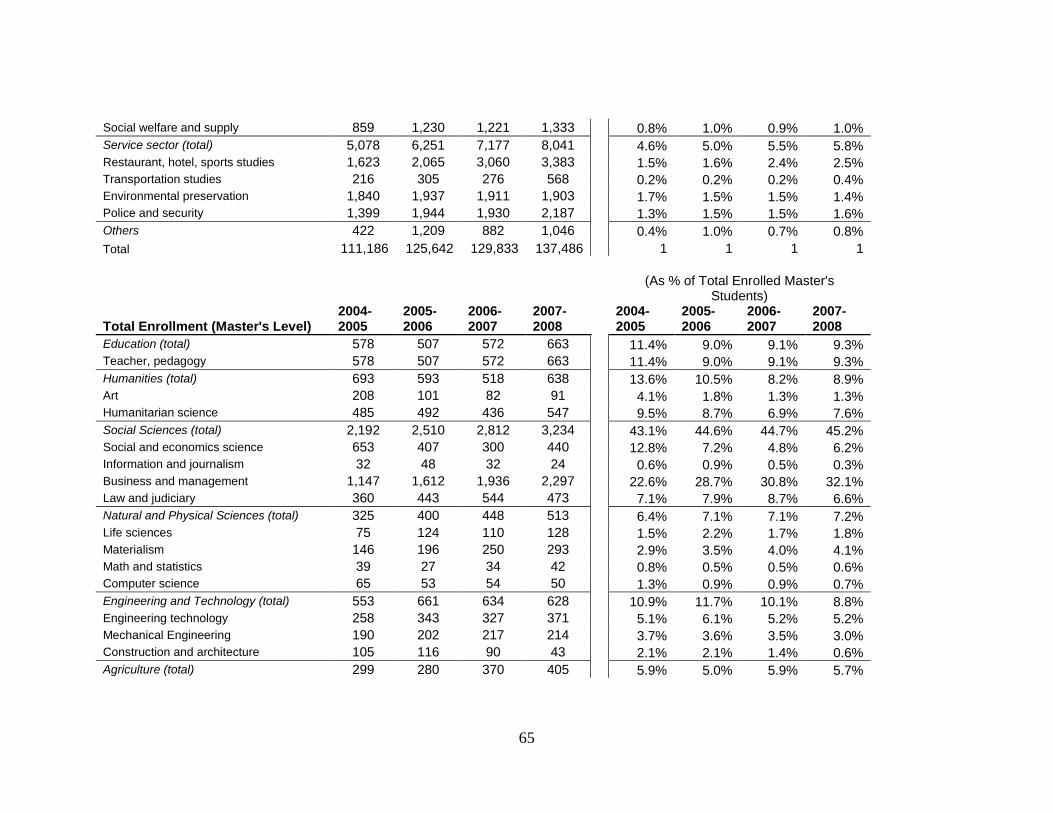
65
Social welfare and supply 859 1,230 1,221 1,333 0.8% 1.0% 0.9% 1.0%
Service sector (total) 5,078 6,251 7,177 8,041 4.6% 5.0% 5.5% 5.8%
Restaurant, hotel, sports studies 1,623 2,065 3,060 3,383 1.5% 1.6% 2.4% 2.5%
Transportation studies 216 305 276 568 0.2% 0.2% 0.2% 0.4%
Environmental preservation 1,840 1,937 1,911 1,903 1.7% 1.5% 1.5% 1.4%
Police and security 1,399 1,944 1,930 2,187 1.3% 1.5% 1.5% 1.6%
Others 422 1,209 882 1,046 0.4% 1.0% 0.7% 0.8%
Total 111,186 125,642 129,833 137,486 1 1 1 1
(As % of Total Enrolled Master's
Students)
Total Enrollment (Master's Level) 2004-2005
2005-2006
2006-2007
2007-2008
2004-2005
2005-2006
2006-2007
2007-2008
Education (total) 578 507 572 663 11.4% 9.0% 9.1% 9.3%
Teacher, pedagogy 578 507 572 663 11.4% 9.0% 9.1% 9.3%
Humanities (total) 693 593 518 638 13.6% 10.5% 8.2% 8.9%
Art 208 101 82 91 4.1% 1.8% 1.3% 1.3%
Humanitarian science 485 492 436 547 9.5% 8.7% 6.9% 7.6%
Social Sciences (total) 2,192 2,510 2,812 3,234 43.1% 44.6% 44.7% 45.2%
Social and economics science 653 407 300 440 12.8% 7.2% 4.8% 6.2%
Information and journalism 32 48 32 24 0.6% 0.9% 0.5% 0.3%
Business and management 1,147 1,612 1,936 2,297 22.6% 28.7% 30.8% 32.1%
Law and judiciary 360 443 544 473 7.1% 7.9% 8.7% 6.6%
Natural and Physical Sciences (total) 325 400 448 513 6.4% 7.1% 7.1% 7.2%
Life sciences 75 124 110 128 1.5% 2.2% 1.7% 1.8%
Materialism 146 196 250 293 2.9% 3.5% 4.0% 4.1%
Math and statistics 39 27 34 42 0.8% 0.5% 0.5% 0.6%
Computer science 65 53 54 50 1.3% 0.9% 0.9% 0.7%
Engineering and Technology (total) 553 661 634 628 10.9% 11.7% 10.1% 8.8%
Engineering technology 258 343 327 371 5.1% 6.1% 5.2% 5.2%
Mechanical Engineering 190 202 217 214 3.7% 3.6% 3.5% 3.0%
Construction and architecture 105 116 90 43 2.1% 2.1% 1.4% 0.6%
Agriculture (total) 299 280 370 405 5.9% 5.0% 5.9% 5.7%
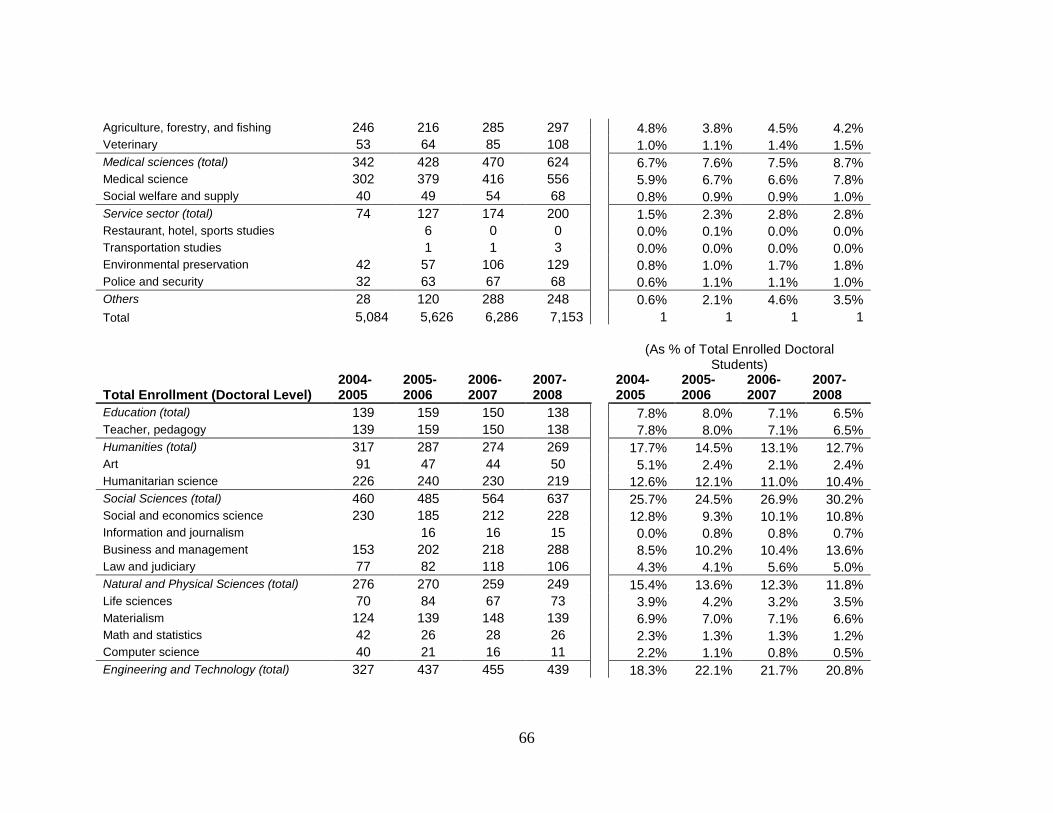
66
Agriculture, forestry, and fishing 246 216 285 297 4.8% 3.8% 4.5% 4.2%
Veterinary 53 64 85 108 1.0% 1.1% 1.4% 1.5%
Medical sciences (total) 342 428 470 624 6.7% 7.6% 7.5% 8.7%
Medical science 302 379 416 556 5.9% 6.7% 6.6% 7.8%
Social welfare and supply 40 49 54 68 0.8% 0.9% 0.9% 1.0%
Service sector (total) 74 127 174 200 1.5% 2.3% 2.8% 2.8%
Restaurant, hotel, sports studies 6 0 0 0.0% 0.1% 0.0% 0.0%
Transportation studies 1 1 3 0.0% 0.0% 0.0% 0.0%
Environmental preservation 42 57 106 129 0.8% 1.0% 1.7% 1.8%
Police and security 32 63 67 68 0.6% 1.1% 1.1% 1.0%
Others 28 120 288 248 0.6% 2.1% 4.6% 3.5%
Total 5,084 5,626 6,286 7,153 1 1 1 1
(As % of Total Enrolled Doctoral
Students)
Total Enrollment (Doctoral Level) 2004-2005
2005-2006
2006-2007
2007-2008
2004-2005
2005-2006
2006-2007
2007-2008
Education (total) 139 159 150 138 7.8% 8.0% 7.1% 6.5%
Teacher, pedagogy 139 159 150 138 7.8% 8.0% 7.1% 6.5%
Humanities (total) 317 287 274 269 17.7% 14.5% 13.1% 12.7%
Art 91 47 44 50 5.1% 2.4% 2.1% 2.4%
Humanitarian science 226 240 230 219 12.6% 12.1% 11.0% 10.4%
Social Sciences (total) 460 485 564 637 25.7% 24.5% 26.9% 30.2%
Social and economics science 230 185 212 228 12.8% 9.3% 10.1% 10.8%
Information and journalism 16 16 15 0.0% 0.8% 0.8% 0.7%
Business and management 153 202 218 288 8.5% 10.2% 10.4% 13.6%
Law and judiciary 77 82 118 106 4.3% 4.1% 5.6% 5.0%
Natural and Physical Sciences (total) 276 270 259 249 15.4% 13.6% 12.3% 11.8%
Life sciences 70 84 67 73 3.9% 4.2% 3.2% 3.5%
Materialism 124 139 148 139 6.9% 7.0% 7.1% 6.6%
Math and statistics 42 26 28 26 2.3% 1.3% 1.3% 1.2%
Computer science 40 21 16 11 2.2% 1.1% 0.8% 0.5%
Engineering and Technology (total) 327 437 455 439 18.3% 22.1% 21.7% 20.8%
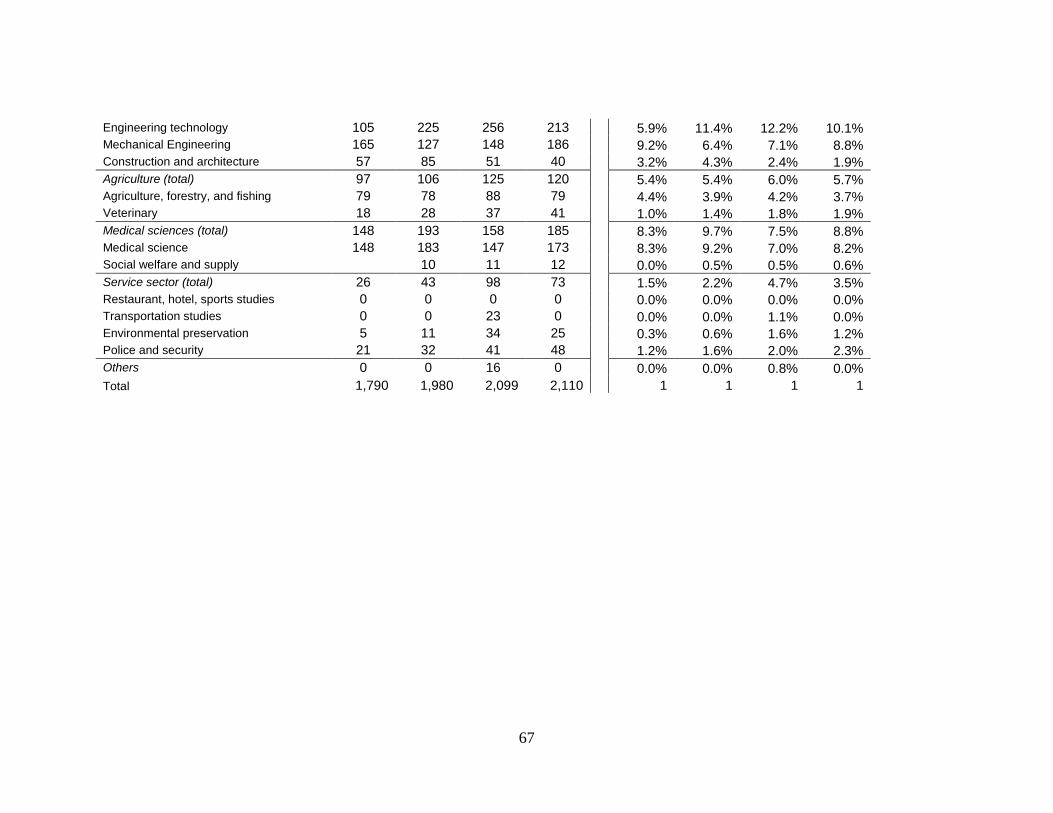
67
Engineering technology 105 225 256 213 5.9% 11.4% 12.2% 10.1%
Mechanical Engineering 165 127 148 186 9.2% 6.4% 7.1% 8.8%
Construction and architecture 57 85 51 40 3.2% 4.3% 2.4% 1.9%
Agriculture (total) 97 106 125 120 5.4% 5.4% 6.0% 5.7%
Agriculture, forestry, and fishing 79 78 88 79 4.4% 3.9% 4.2% 3.7%
Veterinary 18 28 37 41 1.0% 1.4% 1.8% 1.9%
Medical sciences (total) 148 193 158 185 8.3% 9.7% 7.5% 8.8%
Medical science 148 183 147 173 8.3% 9.2% 7.0% 8.2%
Social welfare and supply 10 11 12 0.0% 0.5% 0.5% 0.6%
Service sector (total) 26 43 98 73 1.5% 2.2% 4.7% 3.5%
Restaurant, hotel, sports studies 0 0 0 0 0.0% 0.0% 0.0% 0.0%
Transportation studies 0 0 23 0 0.0% 0.0% 1.1% 0.0%
Environmental preservation 5 11 34 25 0.3% 0.6% 1.6% 1.2%
Police and security 21 32 41 48 1.2% 1.6% 2.0% 2.3%
Others 0 0 16 0 0.0% 0.0% 0.8% 0.0%
Total 1,790 1,980 2,099 2,110 1 1 1 1
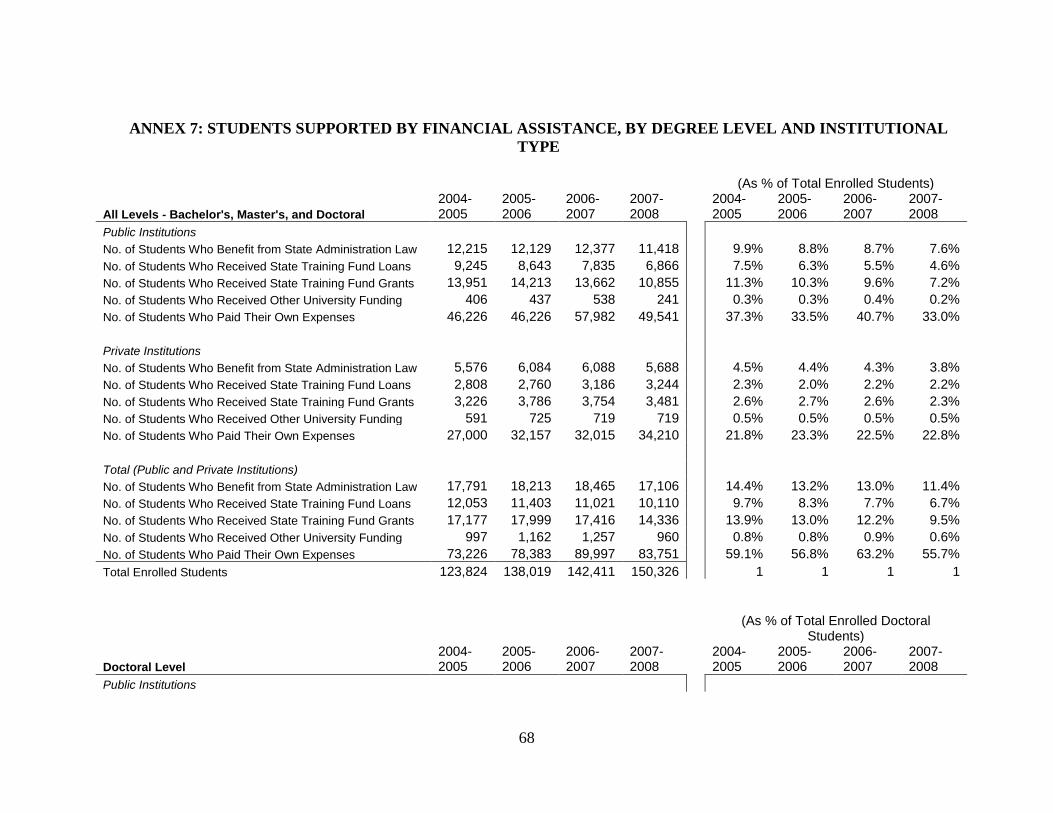
68
ANNEX 7: STUDENTS SUPPORTED BY FINANCIAL ASSISTANCE, BY DEGREE LEVEL AND INSTITUTIONAL
TYPE
(As % of Total Enrolled Students)
All Levels - Bachelor's, Master's, and Doctoral
2004-2005
2005-2006
2006-2007
2007-2008
2004-2005
2005-2006
2006-2007
2007-2008
Public Institutions
No. of Students Who Benefit from State Administration Law 12,215 12,129 12,377 11,418 9.9% 8.8% 8.7% 7.6%
No. of Students Who Received State Training Fund Loans 9,245 8,643 7,835 6,866 7.5% 6.3% 5.5% 4.6%
No. of Students Who Received State Training Fund Grants 13,951 14,213 13,662 10,855 11.3% 10.3% 9.6% 7.2%
No. of Students Who Received Other University Funding 406 437 538 241 0.3% 0.3% 0.4% 0.2%
No. of Students Who Paid Their Own Expenses 46,226 46,226 57,982 49,541 37.3% 33.5% 40.7% 33.0%
Private Institutions
No. of Students Who Benefit from State Administration Law 5,576 6,084 6,088 5,688 4.5% 4.4% 4.3% 3.8%
No. of Students Who Received State Training Fund Loans 2,808 2,760 3,186 3,244 2.3% 2.0% 2.2% 2.2%
No. of Students Who Received State Training Fund Grants 3,226 3,786 3,754 3,481 2.6% 2.7% 2.6% 2.3%
No. of Students Who Received Other University Funding 591 725 719 719 0.5% 0.5% 0.5% 0.5%
No. of Students Who Paid Their Own Expenses 27,000 32,157 32,015 34,210 21.8% 23.3% 22.5% 22.8%
Total (Public and Private Institutions)
No. of Students Who Benefit from State Administration Law 17,791 18,213 18,465 17,106 14.4% 13.2% 13.0% 11.4%
No. of Students Who Received State Training Fund Loans 12,053 11,403 11,021 10,110 9.7% 8.3% 7.7% 6.7%
No. of Students Who Received State Training Fund Grants 17,177 17,999 17,416 14,336 13.9% 13.0% 12.2% 9.5%
No. of Students Who Received Other University Funding 997 1,162 1,257 960 0.8% 0.8% 0.9% 0.6%
No. of Students Who Paid Their Own Expenses 73,226 78,383 89,997 83,751 59.1% 56.8% 63.2% 55.7%
Total Enrolled Students 123,824 138,019 142,411 150,326 1 1 1 1
(As % of Total Enrolled Doctoral
Students)
Doctoral Level
2004-2005
2005-2006
2006-2007
2007-2008
2004-2005
2005-2006
2006-2007
2007-2008
Public Institutions
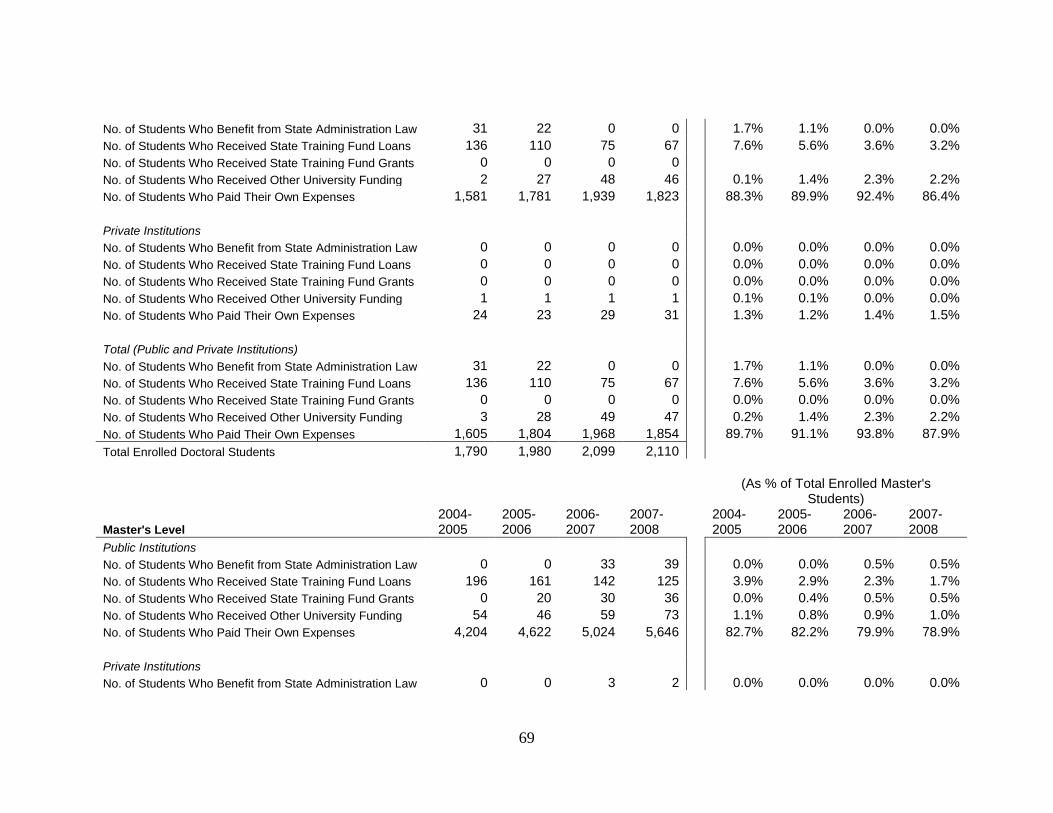
69
No. of Students Who Benefit from State Administration Law 31 22 0 0 1.7% 1.1% 0.0% 0.0%
No. of Students Who Received State Training Fund Loans 136 110 75 67 7.6% 5.6% 3.6% 3.2%
No. of Students Who Received State Training Fund Grants 0 0 0 0
No. of Students Who Received Other University Funding 2 27 48 46 0.1% 1.4% 2.3% 2.2%
No. of Students Who Paid Their Own Expenses 1,581 1,781 1,939 1,823 88.3% 89.9% 92.4% 86.4%
Private Institutions
No. of Students Who Benefit from State Administration Law 0 0 0 0 0.0% 0.0% 0.0% 0.0%
No. of Students Who Received State Training Fund Loans 0 0 0 0 0.0% 0.0% 0.0% 0.0%
No. of Students Who Received State Training Fund Grants 0 0 0 0 0.0% 0.0% 0.0% 0.0%
No. of Students Who Received Other University Funding 1 1 1 1 0.1% 0.1% 0.0% 0.0%
No. of Students Who Paid Their Own Expenses 24 23 29 31 1.3% 1.2% 1.4% 1.5%
Total (Public and Private Institutions)
No. of Students Who Benefit from State Administration Law 31 22 0 0 1.7% 1.1% 0.0% 0.0%
No. of Students Who Received State Training Fund Loans 136 110 75 67 7.6% 5.6% 3.6% 3.2%
No. of Students Who Received State Training Fund Grants 0 0 0 0 0.0% 0.0% 0.0% 0.0%
No. of Students Who Received Other University Funding 3 28 49 47 0.2% 1.4% 2.3% 2.2%
No. of Students Who Paid Their Own Expenses 1,605 1,804 1,968 1,854 89.7% 91.1% 93.8% 87.9%
Total Enrolled Doctoral Students 1,790 1,980 2,099 2,110
(As % of Total Enrolled Master's
Students)
Master's Level
2004-2005
2005-2006
2006-2007
2007-2008
2004-2005
2005-2006
2006-2007
2007-2008
Public Institutions
No. of Students Who Benefit from State Administration Law 0 0 33 39 0.0% 0.0% 0.5% 0.5%
No. of Students Who Received State Training Fund Loans 196 161 142 125 3.9% 2.9% 2.3% 1.7%
No. of Students Who Received State Training Fund Grants 0 20 30 36 0.0% 0.4% 0.5% 0.5%
No. of Students Who Received Other University Funding 54 46 59 73 1.1% 0.8% 0.9% 1.0%
No. of Students Who Paid Their Own Expenses 4,204 4,622 5,024 5,646 82.7% 82.2% 79.9% 78.9%
Private Institutions
No. of Students Who Benefit from State Administration Law 0 0 3 2 0.0% 0.0% 0.0% 0.0%
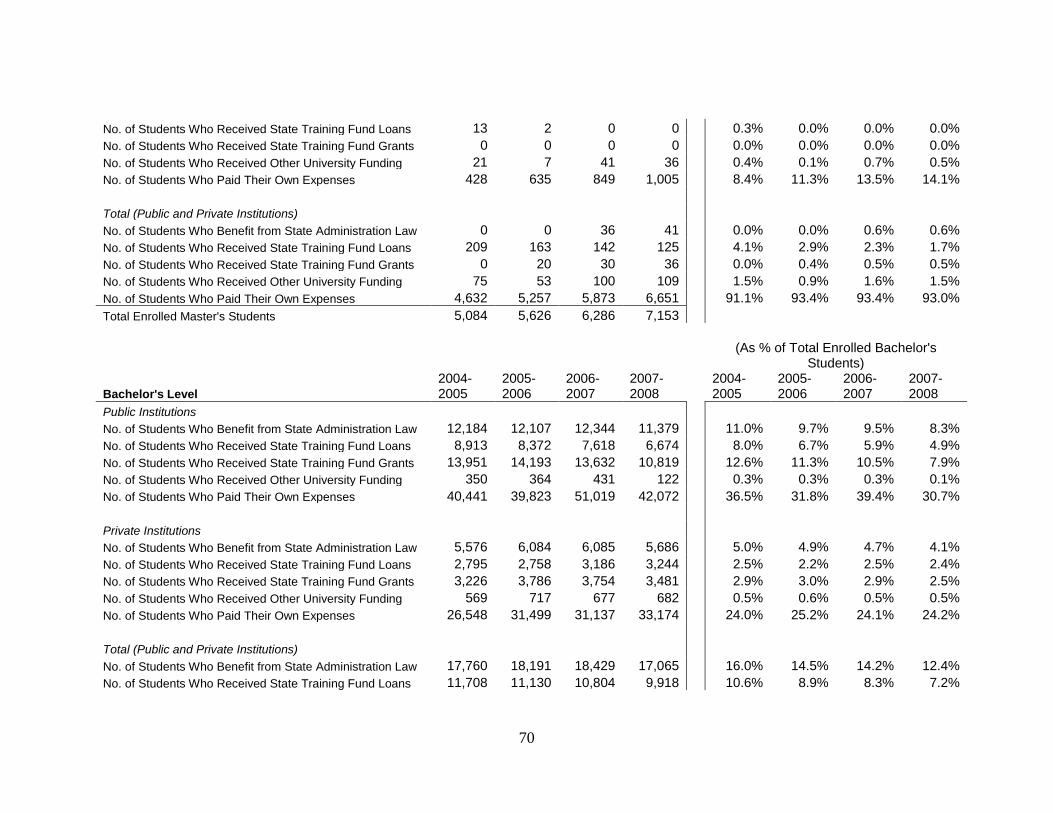
70
No. of Students Who Received State Training Fund Loans 13 2 0 0 0.3% 0.0% 0.0% 0.0%
No. of Students Who Received State Training Fund Grants 0 0 0 0 0.0% 0.0% 0.0% 0.0%
No. of Students Who Received Other University Funding 21 7 41 36 0.4% 0.1% 0.7% 0.5%
No. of Students Who Paid Their Own Expenses 428 635 849 1,005 8.4% 11.3% 13.5% 14.1%
Total (Public and Private Institutions)
No. of Students Who Benefit from State Administration Law 0 0 36 41 0.0% 0.0% 0.6% 0.6%
No. of Students Who Received State Training Fund Loans 209 163 142 125 4.1% 2.9% 2.3% 1.7%
No. of Students Who Received State Training Fund Grants 0 20 30 36 0.0% 0.4% 0.5% 0.5%
No. of Students Who Received Other University Funding 75 53 100 109 1.5% 0.9% 1.6% 1.5%
No. of Students Who Paid Their Own Expenses 4,632 5,257 5,873 6,651 91.1% 93.4% 93.4% 93.0%
Total Enrolled Master's Students 5,084 5,626 6,286 7,153
(As % of Total Enrolled Bachelor's
Students)
Bachelor's Level
2004-2005
2005-2006
2006-2007
2007-2008
2004-2005
2005-2006
2006-2007
2007-2008
Public Institutions
No. of Students Who Benefit from State Administration Law 12,184 12,107 12,344 11,379 11.0% 9.7% 9.5% 8.3%
No. of Students Who Received State Training Fund Loans 8,913 8,372 7,618 6,674 8.0% 6.7% 5.9% 4.9%
No. of Students Who Received State Training Fund Grants 13,951 14,193 13,632 10,819 12.6% 11.3% 10.5% 7.9%
No. of Students Who Received Other University Funding 350 364 431 122 0.3% 0.3% 0.3% 0.1%
No. of Students Who Paid Their Own Expenses 40,441 39,823 51,019 42,072 36.5% 31.8% 39.4% 30.7%
Private Institutions
No. of Students Who Benefit from State Administration Law 5,576 6,084 6,085 5,686 5.0% 4.9% 4.7% 4.1%
No. of Students Who Received State Training Fund Loans 2,795 2,758 3,186 3,244 2.5% 2.2% 2.5% 2.4%
No. of Students Who Received State Training Fund Grants 3,226 3,786 3,754 3,481 2.9% 3.0% 2.9% 2.5%
No. of Students Who Received Other University Funding 569 717 677 682 0.5% 0.6% 0.5% 0.5%
No. of Students Who Paid Their Own Expenses 26,548 31,499 31,137 33,174 24.0% 25.2% 24.1% 24.2%
Total (Public and Private Institutions)
No. of Students Who Benefit from State Administration Law 17,760 18,191 18,429 17,065 16.0% 14.5% 14.2% 12.4%
No. of Students Who Received State Training Fund Loans 11,708 11,130 10,804 9,918 10.6% 8.9% 8.3% 7.2%
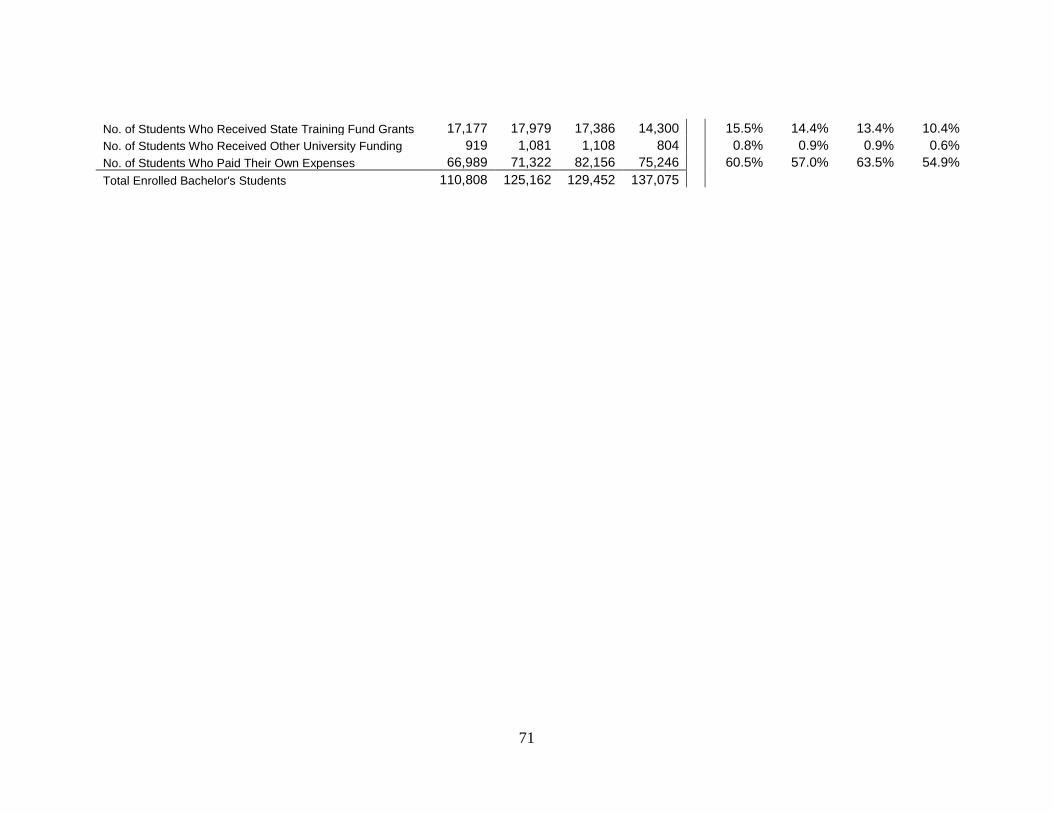
71
No. of Students Who Received State Training Fund Grants 17,177 17,979 17,386 14,300 15.5% 14.4% 13.4% 10.4%
No. of Students Who Received Other University Funding 919 1,081 1,108 804 0.8% 0.9% 0.9% 0.6%
No. of Students Who Paid Their Own Expenses 66,989 71,322 82,156 75,246 60.5% 57.0% 63.5% 54.9%
Total Enrolled Bachelor's Students 110,808 125,162 129,452 137,075
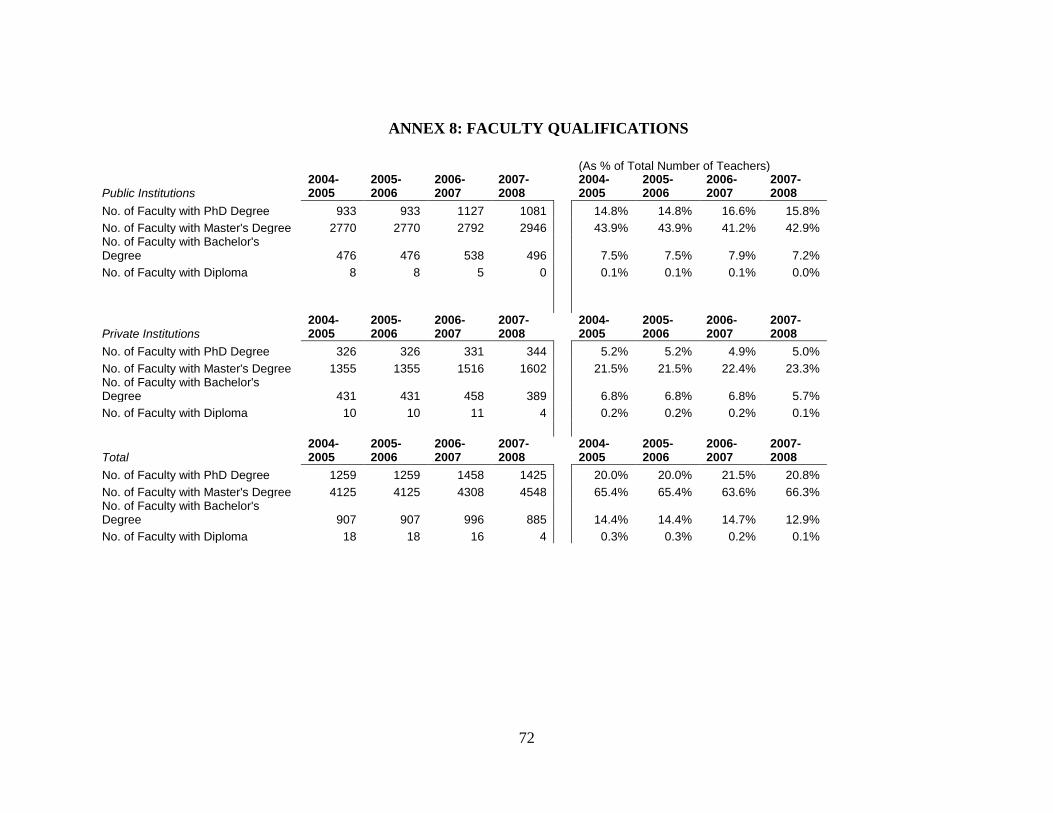
72
ANNEX 8: FACULTY QUALIFICATIONS
(As % of Total Number of Teachers)
Public Institutions 2004-2005
2005-2006
2006-2007
2007-2008
2004-2005
2005-2006
2006-2007
2007-2008
No. of Faculty with PhD Degree 933 933 1127 1081 14.8% 14.8% 16.6% 15.8%
No. of Faculty with Master's Degree 2770 2770 2792 2946 43.9% 43.9% 41.2% 42.9% No. of Faculty with Bachelor's Degree 476 476 538 496 7.5% 7.5% 7.9% 7.2%
No. of Faculty with Diploma 8 8 5 0 0.1% 0.1% 0.1% 0.0%
Private Institutions 2004-2005
2005-2006
2006-2007
2007-2008
2004-2005
2005-2006
2006-2007
2007-2008
No. of Faculty with PhD Degree 326 326 331 344 5.2% 5.2% 4.9% 5.0%
No. of Faculty with Master's Degree 1355 1355 1516 1602 21.5% 21.5% 22.4% 23.3% No. of Faculty with Bachelor's Degree 431 431 458 389 6.8% 6.8% 6.8% 5.7%
No. of Faculty with Diploma 10 10 11 4 0.2% 0.2% 0.2% 0.1%
Total 2004-2005
2005-2006
2006-2007
2007-2008
2004-2005
2005-2006
2006-2007
2007-2008
No. of Faculty with PhD Degree 1259 1259 1458 1425 20.0% 20.0% 21.5% 20.8%
No. of Faculty with Master's Degree 4125 4125 4308 4548 65.4% 65.4% 63.6% 66.3% No. of Faculty with Bachelor's Degree 907 907 996 885 14.4% 14.4% 14.7% 12.9%
No. of Faculty with Diploma 18 18 16 4 0.3% 0.3% 0.2% 0.1%
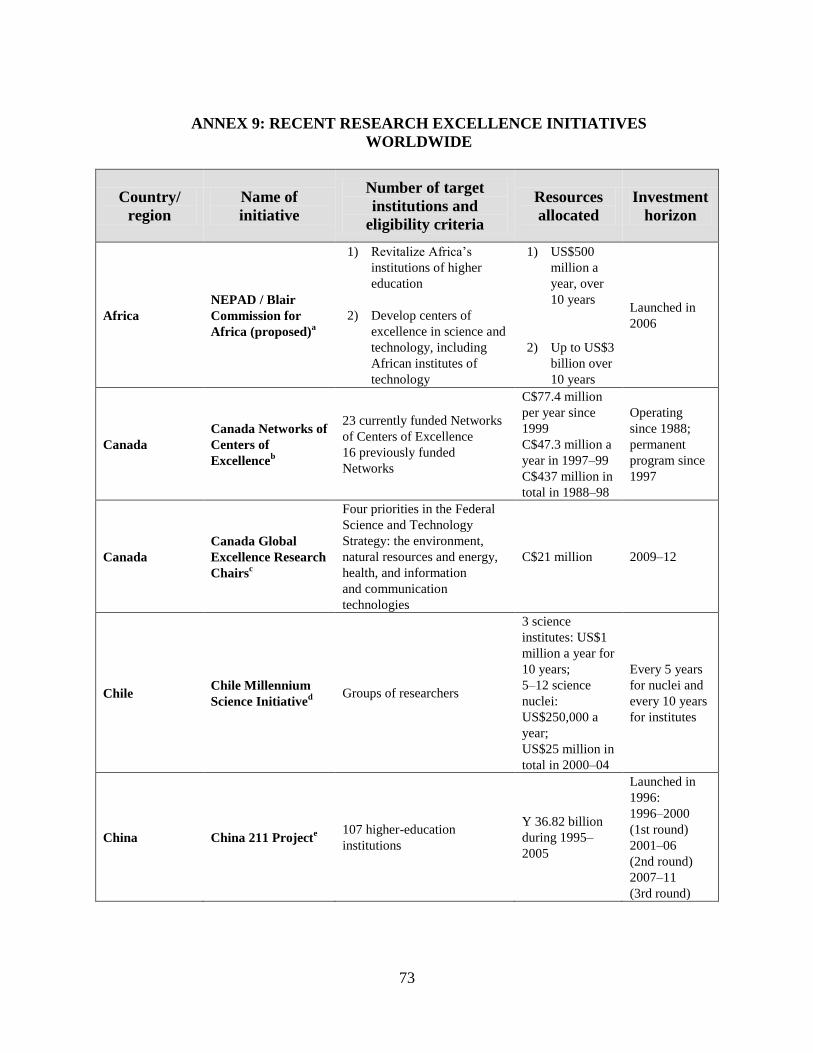
73
ANNEX 9: RECENT RESEARCH EXCELLENCE INITIATIVES
WORLDWIDE
Country/
region
Name of
initiative
Number of target
institutions and
eligibility criteria
Resources
allocated
Investment
horizon
Africa
NEPAD / Blair
Commission for
Africa (proposed)a
1) Revitalize Africa‟s
institutions of higher
education
2) Develop centers of
excellence in science and
technology, including
African institutes of
technology
1) US$500
million a
year, over
10 years
2) Up to US$3
billion over
10 years
Launched in
2006
Canada
Canada Networks of
Centers of
Excellenceb
23 currently funded Networks
of Centers of Excellence
16 previously funded
Networks
C$77.4 million
per year since
1999
C$47.3 million a
year in 1997–99
C$437 million in
total in 1988–98
Operating
since 1988;
permanent
program since
1997
Canada
Canada Global
Excellence Research
Chairsc
Four priorities in the Federal
Science and Technology
Strategy: the environment,
natural resources and energy,
health, and information
and communication
technologies
C$21 million 2009–12
Chile Chile Millennium
Science Initiatived
Groups of researchers
3 science
institutes: US$1
million a year for
10 years;
5–12 science
nuclei:
US$250,000 a
year;
US$25 million in
total in 2000–04
Every 5 years
for nuclei and
every 10 years
for institutes
China China 211 Projecte
107 higher-education
institutions
Y 36.82 billion
during 1995–
2005
Launched in
1996:
1996–2000
(1st round)
2001–06
(2nd round)
2007–11
(3rd round)
74
Country/
region
Name of
initiative
Number of target
institutions and
eligibility criteria
Resources
allocated
Investment
horizon
China China 985 Projectf 39 research universities
Y 27.07 billion
(1st round)
Launched in
1999:
1999–2001
(1st round)
2004–07
(2nd round)
China
Chinese Academy of
Sciences (CAS)
Institutesg
Mathematics and physics 15
Chemistry and chemical
engineering 12
Biological sciences 20
Earth sciences 19
Technological sciences 21
Others 2
Y 4.80 billion
(1st round)
1998–2000
(1st round)
2001–05
(2nd round)
2006–10
(3rd round)
Denmark
Denmark
(Globalization
Fund)
Funds to be allocated to
research universities on a
competitive basis
US$1.9 billion
between 2007
and 2012
Launched in
2006
Europe
European
Commission,
Framework
Programme 7
(FP7)h
TBD – determined by
structure of research proposals
(RFPs)
Based on number
of RFPs with a
“center of
excellence”
structure
Overall FP7
budget is €50.5
billion covering
2007–13i
2007–13
France “Opération
Campus”j
Develop 10 regional centers of
excellence in higher education
and research. Overall, the
centers will regroup 38
universities and research
organizations, representing
340,000 students and 13,000
researchers.
€5 billion Launched in
2008
Germany Germany Excellence
Initiative 2006k
40 graduate schools
30 clusters of excellence
(universities and private
sector)
10 top-level research
universities
US$2.3 billion in
total
Five-year
funding;
two rounds:
2006 and 2007
75
Country/
region
Name of
initiative
Number of target
institutions and
eligibility criteria
Resources
allocated
Investment
horizon
Japan
Japan Top-30
Program
(Centers Of
Excellence for 21st-
Century Plan)l
31 higher-education
institutions
US$150 million /
year (program
total: 37.8 billion
yen)
Five-year
funding;
launched in
2002;
3 rounds:
2002, 2003,
and 2004
Japan
Japan Global
Centers of
Excellence
Programm
50–75 centers funded per year
(5 new fields of study each
year)
50 million–500
million yen per
center per year
(~US$400,000–
US$4 million)
5 years;
launched in
2007
Republic of
Korea
Brain Korea 21
Programn
Science and technology: 11
universities
Humanities and social
sciences: 11 universities
Leading regional
universities: 38 universities
Professional graduate
schools in 11 universities
US$1.17 billion
in total
7 years;
two rounds in
1999
Republic of
Korea
Korea Science and
Engineering
Foundation
(KOSEF)o
1) Science research centers
(SRCs) / engineering research
centers (ERCs): up to 65
centers
2) Medical science and
engineering research centers
(MRCs): 18 centers
3) National core research
centers (NCRCs): 6 centers
funded in 2006
1) US$64.2
million / year
2) US$7 million
/ year
3) US$10.8
million / year
1) up to 9
years
2) up to 9
years
3) up to 7
years
All 3 programs
launched in
FY 2002 or
FY 2003
Russian
Federation
Russian
Federation’s
“Federal
Universities”p
Establish a network of high-
status federal institutions that
are specialized research
universities and lifelong
vocational centers
n.a.
Under
consideration
(two pilot
universities
were
established in
2007)
Taiwan
(China)
Taiwan
Development Plan
for University
Research
Excellenceq
Selection and financial support
of internationally leading
fields
US$400 million 4 years
76
Country/
region
Name of
initiative
Number of target
institutions and
eligibility criteria
Resources
allocated
Investment
horizon
United
Kingdom
U.K. Funding for
Excellent Unitsr
Universities with the highest
marks after the research
assessment exercise (RAE)
US$8.63 billion
disbursed after
2001 RAE
5 years for
research
council–
funded centerss
Two rounds:
1996 and
2001;
2008 RAE
scheduledt
United States,
Arizona
Science Foundation
Arizonau
Public-private partnership to
strengthen scientific,
engineering, and medical
research
US$135 million
+ US$135
million (1:1
matching)
Annually since
2006
United States,
California
California Institutes
of Science and
Innovationv
University-industry
partnerships to address state
problems
US$400 million
+ US$800
million (2:1
matching)
Annually since
2000
United States,
North Dakota
North Dakota
Centers of
Excellencew
Public-private centers
focusing on local needs
US$50 million +
US$100 million
(2:1 matching)
Annually since
2007
United States,
Washington
Washington State
Life Sciences
Discovery Fundx
Bioscience research that
provides economic and health
benefits US$350 million
10 years since
2005
United States,
Georgia
Georgia Research
Alliancey
Public-private partnership to
recruit eminent scholars to
Georgia universities US$30 million
Annually since
1990
United States,
Indiana
Indiana 21st-
Century Research
and Technology
Fundz
Academic and commercial
sector partnerships US$26 million
Annually since
1999
United States,
Kentucky
Kentucky’s “Buck
for Brains”aa Endowed chairs for top talent US$350 million Since 1997
77
Country/
region
Name of
initiative
Number of target
institutions and
eligibility criteria
Resources
allocated
Investment
horizon
United States,
Ohio
Ohio’s Third
Frontierbb
Establishment of centers of
innovation as joint initiatives
of universities and private
research organizations
US$1.6 billion 10 years since
2003
United States,
Oklahoma
Oklahoma Center
for the
Advancement of
Science and
Technologycc
Nanotechnology research US$29 million Annually since
1987
Sources: Salmi, 2009.
Note: US$ = U.S. dollars, C$ = Canadian dollars, Y = Chinese yuan, € = euros, n.a. = not available.
a. http://www.eurodad.org/articles/default.aspx?id=595.
b. http://www.nce.gc.ca/.
c. www.budget.gc.ca/2008/speech-discours/speech-discours-eng.asp.
d. http://www.msi-sig.org/msi/current.html.
e. Ministerial Office of 211 Project (2007), Report on 211 Project (1995–2005). Beijing: Higher Education
Press.
f. N. C. Liu and L. Zhou (2007), Building Research University for Achieving the Goal of an Innovative
Country. Beijing: China Renmin University Press.
g.http://www.itps.se/Archive/Documents/Swedish/Publikationer/Rapporter/Arbetsrapporter%20(R)/R2007/
R2007_001%20FoU-finansiarer.pdf. Chinese Academy of Science,
http://www.cas.ac.cn/html/books/o6122/e1/04/tongzhi/tz004.htm;
http://baike.baidu.com/view/229786.htm.
h. http://ec.europa.eu/research/era/pdf/centres.pdf.
i. http://cordis.europa.eu/fp7/what_en.html#funding.
j. http://www.france-science.org/Operation-Campus-6-projects-kept?var_recherche=operation%20campus;
http://www.universityworldnews.com/article.php?story=20080613092922742.
k. http://www.dfg.de/en/research_funding/coordinated_programmes/excellence_initiative/.
l. http://www.jsps.go.jp/english/e-21coe/index.html.
m. http://www.jsps.go.jp/english/e-globalcoe/index.html;
http://www.jsps.go.jp/english/e-globalcoe/data/application_guidelines.pdf;
http://www.jsps.go.jp/english/e-globalcoe/data/review_guidelines.pdf.
n. http://unpan1.un.org/intradoc/groups/public/documents/APCITY/UNPAN015416.pdf;
http://www.bk21.or.kr/datas/english_ver.htm.
o. http://www.kosef.re.kr/english_new/programs/programs_01_04.html.
p. http://www.universityworldnews.com/article.php?story=20081024094454199.
q. http://unpan1.un.org/intradoc/groups/public/documents/APCITY/UNPAN015416.pdf.
r. http://www.hefce.ac.uk/research/funding/.
s. http://www.rcuk.ac.uk/research/resfunding.htm.
t. http://www.rae.ac.uk/.
u. http://www.sfaz.org/.
v. http://www.ucop.edu/california-institutes/about/about.htm.
w. http://governor.state.nd.us/media/speeches/040325.html.
x. http://www.lsdfa.org/home.html.
y. http://www.gra.org/homepage.asp.
z. http://www.21fund.org/.
aa. http://www.wku.edu/IA/bucks/index.html.
bb. http://www.odod.ohio.gov/tech/program.htm.
cc. http://www.ocast.state.ok.us/