monitise market statistics expert views - 2nd edition2 v4highlighting the growth in mobile usage, as...
TRANSCRIPT
INSIGHTSYOUR PATH TO MOBILE MONEY
MOBILE MONEY:MARKET STATISTICSAND EXPERT VIEWSVolume 2 2014

THE MOBILE MONEY LANDSCAPE:MARKET STATISTICS AND EXPERT VIEWS
This updated version of The Mobile Money Landscape is compiled of facts, statistics and opinion
highlighting the growth in mobile usage, as well as the factors affecting and shaping Mobile Money
globally. 2014 has been another year when technology and standards moved at pace, setting new
challenges and opportunities for banks and financial institutions:
• People around the world checked their smartphones within minutes of waking up
• Facebook’s mobile users topped 1 billion
• Mobile banking logins outnumbered online banking logins in several countries as branch
visits continued to fall
• Mobile commerce continued to grow – 47% year-on-year in the US
• Apple Pay reached 1million activations within 72 hours of launch
• Technology advanced with NFC enabled phones set to top 1.2bn in 2018
• Fraud losses on online spending in Europe continued to decline and security features
became more advanced.
Volume 2 2014

Mobile Money Market Statistics and Expert Views
© 2003 – 2014 Monitise Group Limited. All Rights Reserved 2
1. Contents
2. Interesting facts 3
3. Mobile, smartphones, tablets, mobile internet & mobile apps 4
4. Mobile consumer behaviour 8
5. Mobile banking 12
6. Mobile payments 16
7. Mobile & tablet commerce 20
8. Mobile Money for the unbanked 24
9. Security and fraud 28
Mobile Money Market Statistics and Expert Views
© 2003 – 2014 Monitise Group Limited. All Rights Reserved 3
2. Interesting facts
54% 61% 59%
75%
34% 31%
45% 42% 32% 31%
43% 54%
28% 29%
48% 49%
17% 12%
28% 32%
US UK Brazil China
% of consumers with high trust that organisations will take care of personal data
Banks Major retailers Mobile Tech (eg Apple) Internet (eg Google) Social Networks
Source: FICO, 2014
In 2013 smartphone sales surpassed feature phone sales globally for the first time. 1.8bn phones were sold, of which 968 million were smartphones. Source: Gartner, February 2014
On Christmas Day 2013, mobile made up 48% of all online retail traffic in the US, and mobile sales reached 30% of all online retail sales. Source: IBM, February 2014
90% of US bankers surveyed expected at least a 10% decline in branch numbers over the next 5 years, with 45% expecting the decline to be 25% or more. Branch numbers have declined 9% in just the last 3 years. Source: Celent, February 2014
Did you know that… • 82% of US 18-25 year olds owned a
smartphone in Q4 2013 and 61% of those engaged in mobile banking. That compares to around 60% and 30% respectively for their parents. Source: Alix Partners, March 2014. With permission.
• There are over seven billion SIM cards globally, enough for one per person on earth. Only 50% of the global population has a formal financial account. Source: World Bank, GSMA, 2014
• Mobile-cellular penetration rates stand at
96% globally; 121% in developed countries; and 90% in developing countries. Source: ITU, April 2014
Did you also know… 1,124 million - Number of Facebook mobile monthly users 456 million - Number of Facebook mobile-only monthly users. $10 billion - Apple’s app revenue for 2013 200 billion – Number of tweets sent per year 540 million – Active Google+ users $108 (UK) $96 (US) – Google revenue per adult (15+) population in 2013 85 billion – Apps downloaded from Apple’s App Store Facebook, Business Insider, Twitter, Google, Apple, UN
50% of smartphone users in the UK would like to do more mobile banking in the future. Source: FICO, January 2014
There were 700m active smartphones and tablets in China at the end of 2013, more than double the 380m in Q1 2013 - 27% of those are high end ($500+). 55% of the top 1000 apps have links to the major Chinese social platforms. (WeChat, Tencent etc). Finance apps are up 109% in terms of active users. Source: UMENG, March 2014
In the UK 14.7million banking apps have been downloaded, which are used on average 18.6million times per week. Source: British Banker’s Association, June 2014
In June 2013 there were over 60million active mobile money accounts globally and 203million registered mobile money accounts. Source: GSMA, November 2013
76% of banks see the key value of a mobile solution as competitive advantage – yet 68% of respondents to the same survey already have mobile banking technology and 21% are in the process of adopting it. Source: CEB TowerGroup, Mobile Banking Solutions Technology Analysis , December 2013

Mobile Money Market Statistics and Expert Views
© 2003 – 2014 Monitise Group Limited. All Rights Reserved 4
85%
12%
3% 1% 1%
63%
31%
4% 2% 1%
Android iOS Microsoft BlackBerry Other OS
Global Operating System share vs US Operating System share
Global OS Market Share US OS Market Share
3. Mobile, smartphones, tablets, mobile internet & mobile apps
3.1. Global
CHANGE IN SCALE
PC Mobile
315m PCs sold in 2013 1.8bn phones sold in 2013
1.6bn units in use 3.6bn units in use
Replaced every 4-5 years Replaced every 2 years
Shared One (or more) per person
CHANGE IN USE
PC internet Mobile internet Shared, or work use Personal
Semi portable at best Taken everywhere
Web, web search, social
Web, web search, social, games, apps, location service integration, prediction, APIs, image recognition, NFC...
Source: Enders Analysis, 2014
Over half of 13 year olds in the UK have a smartphone, rising to over 70% of 15 year olds. Source: Ofcom, October 2013
Over 900 million smartphone units were shipped in 2013. Tablets will soon overtake consumer PC shipments.
Source: 451 Research’s Mobile Applications and Cloud Forecast, June 2014
0
200
400
600
800
1000
1200
1400
2000
20
01
2002
20
03
2004
20
05
2006
20
07
2008
20
09
2010
20
11
2012
20
13
Annual Unit Volumes (millions)
PC Total Tablets
Smartphones Feature phones
Source: Andreesson Horowitz, Gartner, IDC, 2013
Source: Gartner; Kantar, Q2 2014
Nearly 2.5billion of the world’s 4.3billion mobile phone users this year will be in Asia Pacific. Source: eMarketer, September 2013
1.6 2
2.3 2.6
2.8
2014 2015 2016 2017 2018
Active users of consumer mobile apps will reach 2.8bn worldwide by 2018
billions

Mobile Money Market Statistics and Expert Views
© 2003 – 2014 Monitise Group Limited. All Rights Reserved 5
Android iOS Blackberry Windows Other
USA 61.8% 32.6% 0.6% 4.3% 0.7%
Mexico 84.4% 2.5% 4% 6.4% 2.6%
Argentina 86% 0.2% 3.6% 7.9% 2.3%
Brazil 89.1% 5.2% 0.8% 3.8% 1.1%
Great Britain 58.2% 31% 0.6% 9.6% 0.6%
Spain 90.4% 6.3% 0% 3% 0.3%
Germany 79.2% 11.8% 0.4% 7.1% 1.5%
Italy 71.8% 10.4% 1.1% 15.2% 1.3%
China 83.4% 15.2% 0% 0.4% 1%
Japan 64.5% 31.3% 0.5% 0.9% 2.7%
Australia 58.1% 34.7% 0.6% 6.2% 0.4%
Source: Android Developer Site, September 2014 Source: Apple Developer Site, September 2014
Source: Kantar Worldpanel, September 2014
There are significant differences in OS share by country
Source: Flurry, Annual Reports, April 2014
49% 46%
5%
iOS 7
iOS 8 - 1 week after iPhone 6 launch
Earlier versions
Operating System Adoption - Apple
0.7%
11.4% 9.6%
53.8%
24.5%
Froyo G-Bread I-Cream J-Bean KitKat
Operating System Adoption - Google
700
465 360 355
300 249
105 100 66 34
China Mobile WhatsApp Vodafone WeChat Line Telefonica AT&T Kakao Talk NTT Docomo SK Telecom
Telco publicy disclosed number of subscribers (millions)

Mobile Money Market Statistics and Expert Views
© 2003 – 2014 Monitise Group Limited. All Rights Reserved 6
73% 66% 61% 48%
39% 23%
50%
21% 29% 30% 23% 22% 15%
24% 26% 34% 30%
42% 45% 55%
39%
18-25 26-34 35-44 45-54 55-64 65+ Overall
US device penetration by age group, Q4 2013
Smartphones Tablets Conventional Phones
0
10
20
30
40
Q1 08 Q1 09 Q1 10 Q1 11 Q1 12 Q1 13 Q1 14
US smartphone adds - net adds y-o-y (millions)
401 429
131
442 11
124
Dec 2010 Dec 2013
Total US time spent by digital platform (billion minutes)
Tablet
Smartphone
Computer
3.2. US
Google Browsers,
5% Apple Safari,
7%
Games, 32%
Facebook, 17% Twitter,
2%
Utilities, 8%
Social Messaging
(other), 10%
YouTube, 4%
News, 3%
Productivity, 4%
Other, 3%
Others, 2%
Time spent on iOS and Android Connected Devices (US)
The Facebook smartphone app had the most unique users in the US in 2013 – the next five most used apps were all Google properties. (Search, Play, Youtube, Maps and Gmail). Source: Nielsen, December 2013
42% of American adults own a tablet computer. Source: Pew , January 2014
There are 197million smartphone connections in the US, second only to China with 692million. Source: GSMA, Q2 2014
BROWSER 20%
34% of cell internet users go online mostly using their phones, and not using some other device such as a desktop or laptop computer. Source: Pew, January 2014
Source: ComScore, December 2013
Source: ComScore, Nielsen via BI Intelligence, September 2014
Entertainment (other), 4%
Source: Flurry, April 2014
Source: Alix Partners, March 2014. With permission.
APP 80%

Mobile Money Market Statistics and Expert Views
© 2003 – 2014 Monitise Group Limited. All Rights Reserved 7
90% of those aged 16-24 years old use a smartphone, and 88% of those aged 25-34 years old. Source: Ofcom, May 2014 In the UK approximately 300 billion instant messages are expected to be sent in 2014, more than double the volume of SMSs expected to be sent - 140billion. Source: Deloitte, January 2014 The mean number of apps installed on smartphones in the UK is 23 but the mean number of apps used regularly is 10. Source: Ofcom, May 2014 46% of UK subscriptions are prepaid, 54% are postpaid and 63% have 3G connections. Source: We Are Social, February 2014
3.3. UK
42.1% 42.4% 42.9% 43.6% 45.4% 46.6% 47.3% 47.7% 48.6% 49.5% 49.8% 50.1% 50.0%
26.9% 27.4% 28.0% 28.5% 28.4% 28.0% 27.6% 27.8% 28.1% 27.8% 28.0% 28.3% 28.8%
0%
20%
40%
60%
80%
100%
May-12 Jun-12 Jul-12 Aug-12 Sep-12 Oct-12 Nov-12 Dec-12 Jan-13 Feb-13 Mar-13 Apr-13 May-13
Smartphone operating system market share trend in the UK
Symbian
Microsoft
Blackberry
Apple
Android
Source: ComScore, August 2013
There are expected to be 12.3million iPad users in the UK this year - representing 19.1% of the country's total population, or 50% of tablet users. Source: eMarketer, Jan 2014
17.9 million Britons own tablets, a 63% rise year-on-year. 57% of tablet owners say it’s their “go-to” device to surf the internet at home with 66% saying it’s easier to go online with a tablet. Source: IAB, April 2014
59% of UK consumers use a mobile phone to go online at home, whilst 30% use a tablet. Source: Ofcom, May 2014
89%
68%
67%
65%
60%
57%
36%
20%
10%
26%
25%
27%
31%
29%
33%
27%
1%
6%
8%
9%
9%
15%
31%
53%
Long Lasting Batteries
Brand Name
Fast Processor
Camera Quality
Large screen
OS links with other devices
4G
Touchless technology
Importance of features on smartphone purchasing decisions % of respondents (smartphone owners)
Important Neutral Not Important
Source: Global Market Insite, May 2014

Mobile Money Market Statistics and Expert Views
© 2003 – 2014 Monitise Group Limited. All Rights Reserved 8
4. Mobile consumer behaviour 4.1. Global
Country Monthly ARPU – country avg US$ 2013
Mins of Use per sub (mins/month) 2013
Churn total 2013
Market Share of large operators 2013
Australia 40 280 19% Telstra – 50% Optus – 30% Vodafone – 20%
Brazil 9 134 43% Vivo – 28% TIM Brazil – 27% Claro Brazil – 25% Oi – 18%
China 10 429 42% China Mobile – 62% China Unicom – 23% China Telecom – 16%
France 31 229* 26%* Orange – 37% SFR – 30% Bouygues – 16%
Germany 19 130* 26%* T-Mobile – 33% Vodafone – 28% E-Plus – 22% O2 – 17%
Hong Kong 22 N/A 20% Hutchison – 54% HK Telecom – 23% SmarTone – 24%
India 3 350* 88%* Bharti-Airtel – 22% Idea – 15% RCom – 14% BSNL – 12%
Indonesia 3 163 120% Telkomsel – 51% Indosat – 24% XL Axiata – 18%
Spain 26 154* 34%* Movistar – 39% Vodafone – 27% Orange – 23%
UK 28 187* 31%* EE – 33% O2 – 30% Vodafone – 25% 3 – 12%
US 52 932 20% AT&T – 33% Verizon – 31% Sprint – 16%
*2012 Source: Bank of America Merrill Lynch, January 2014

Mobile Money Market Statistics and Expert Views
© 2003 – 2014 Monitise Group Limited. All Rights Reserved 9
Daily OTT (e.g. BBM, WhatsApp) messaging traffic has already overtaken daily P2P SMS traffic in terms of volume, with an average of 19.1 billion OTT messages sent per day in 2012, compared with an average of 17.6billion P2P SMS messages. Source: Informa for the FT, 2013 On December 31st, 2013 at 11:59 pm, a record 4.7 billion app sessions were tracked for a single day, for a total of 1.126 trillion sessions for the whole year. Source: Flurry Analytics, January 2014
One fifth of adult internet users globally have an Instagram account. Penetration is highest in Latin America and the Middle East, where a third of internet users use Instagram. Source: We Are Social, September 2014
Times when smartphone users check their smartphone % of respondents
US UK France Germany Singapore
Within 15 mins of waking up 65% 70% 75% 79% 82% Within 15 mins of going to bed 64% 58% 78% 76% 84% When waking up in the night 37% 32% 9% 18% 47%
76%
44% 43% 40%
24%
10%
69%
78%
39%
53%
32% 36%
Desktop PC Mobile Phone Stationary Game Console
Laptop Mobile Game Console
Tablet
Devices used to play video games in Germany
2013 2014 Source: BITKOM, August 2014
Western Europe is set to pass the halfway mark in mobile phone internet penetration among the total population. Norway and Sweden are already over 50%, whilst the UK is currently at 49%. Italy has the lowest mobile phone internet penetration in Western Europe with 34%. Source: eMarketer, December 2013
On average, Chinese smartphone users spend 179 minutes on their phone daily, with 109 of those minutes being spent on entertainment. Source: Thenextweb, September 2013
Only 7% of smartphone owners and 9% of tablet owners keep their devices for more than 2 years. Source: B2X Care Solutions and Motorola, June 2014 Source: Mobile Marketing Association, December 2013
Mobile phone internet user penetration in Western Europe by country
2012 2013 2014 2015 2016
Norway 51% 57% 64% 72% 79% Sweden 43% 52% 58% 64% 69% Denmark 41% 50% 60% 70% 77% UK 43% 49% 55% 59% 63% Finland 39% 47% 56% 63% 70% Netherlands 39% 47% 57% 66% 74% Spain 32% 43% 49% 55% 58% France 27% 37% 48% 55% 60% Germany 28% 36% 45% 57% 64% Italy 26% 34% 43% 52% 57% Other 29% 37% 45% 53% 58% Western Europe 32% 40% 48% 56% 62% Source: ComScore, December 2013
94%
53%
36% 35% 35%
Facebook Whatsapp Instagram Skype Twitter
Top 5 social networks/mesaging apps amongst Smarphone Owners in Brazil
% of respondents
Source: Toluna survey, August 2014
Mobile Money Market Statistics and Expert Views
© 2003 – 2014 Monitise Group Limited. All Rights Reserved 10
4.2. US
59% 65%
87%
2011 2012 2013
% of US mothers who use a smartphone
The average adult will spend over 5 hours a day online, compared to 4 hours and 31 minutes watching television. This is a slight decrease from 2012 for daily TV time, and about a 16% rise for digital media consumption. Source: eMarketer, July 2013 74% of US adult smartphone owners aged 18+ say that they use their phone to get directions or other information based on their current location. Source: Pew Internet, September 2013
Creating and consuming photo and video content. In the US, 24% of online adults upload pictures and videos to the Internet via their mobile phones. The success of Dropcam, Snapchat, Tencent, WeChat, Vine, and other services is a clear indication that consumers’ interest in creating and sharing rich content is increasing significantly. In the US, Instagram alone generated 3% of total time spent by consumers on mobile apps. Source: Forrester Research, Inc., Understanding the Gap Between Marketers and Consumers, August 2013. With permission.
Source: Pew Internet, August 2013
Mothers are 38% more likely than the general population to use their phones to be more efficient and half as likely to use them for fun and entertainment compared to the general population. Source: BabyCenter, September 2013
Among US teenagers 12-17 58% of all teens have downloaded apps to their cell phones or tablet computer 51% of teen app users have avoided certain apps due to privacy concerns 26% of teen app users have uninstalled an app because they learned it was collecting personal information that they didn’t wish to share 46% of teen app users have turned off location tracking features on their cell phone or in an app because they were worried about the privacy of their information.
Source: Deloitte, March 2014
44% 53%
70%
88% 92%
71%
32% 23%
15% 8% 6%
16% 9% 7% 4% 1% 1% 4% 7% 8% 6% 2% 1% 5%
Trailing millennials (14-24)
Leading millennials (25-30)
Gen X (31-47)
Baby boomers (48-66)
Matures (67+)
Total
Share of time spent watching tv/movies by US internet users % of total
TV Desktop/Laptop Smartphone Tablet

Mobile Money Market Statistics and Expert Views
© 2003 – 2014 Monitise Group Limited. All Rights Reserved 11
2% 4%
10%
21%
30% 27%
1% 6%
>200 101-200 51-100 26-50 11-25 <10 Never I don't know
How many times would you estimate you look at your phone a day?
4.3 UK
80% of UK Twitter users access Twitter via their mobile device. For 70%, mobile devices are the primary way they access Twitter. Source: Twitter, February 2014
45% of mobile users use social media apps on their phone and 87% search for local information via their phone. Source: We Are Social, February 2014
The number of visitors accessing mobile newspaper sites rose 39% year over year to 13.5million in December 2013. Source: ComScore; GSMA Mobile Media Metrics, February 2014
BBC iPlayer (TV on demand) requests from tablet devices are catching up with requests from computers – 33% of requests come from laptops or PCs, whilst 25% come from tablets and 16% come from mobile devices. Source: BBC iStats, December 2013
58% of UK consumers use their smartphones in bed, 66% do so whilst watching TV and 36% use them during their commute. Source: Mobile Marketing Association, November 2013
86% 81%
20% 16%
85% 76%
24% 10%
SMS Voice MIM MMS
Weekly use of different forms of communication
May-13 May-14 Source: Deloitte, May 2014
0 5 10 15 20 25 30
Google Sites
Yahoo Sites
BBC Sites
Microsoft Sites
Amazon Sites
Wikimedia Sites
MODE media
eBay
Apple
Top 10 Mobile Properties in the UK Unique Mobile Visitors (millions)
Source: ComScore, June 2014
Source: Deloitte UK, May 2014

Mobile Money Market Statistics and Expert Views
© 2003 – 2014 Monitise Group Limited. All Rights Reserved 12
56%
50%
48%
44%
43%
42%
38%
37%
34%
34%
27%
22%
17%
38%
Turkey
Netherlands
Poland
Spain
Austria
Luxembourg
UK
Italy
Germany
Czech Rep
Belgium
France
Romania
Europe
Mobile banking users in select European countries, by country
% of internet users in each group
5. Mobile banking 5.1. Global
Source: Javelin Strategy & Research, Leveraging an Omnichannel Approach to drive $1.5bn in Mobile Banking Cost Savings, 2013 With permission.
Source: ING Financial empowerment study, conducted by Ipsos, May 2014
1
Over 1.75 billion mobile phone users will have used their devices for banking purposes by the end of 2019, compared to 800 million this year. Source: Juniper Research, July 2014
Why Google, Apple, Facebook and Amazon will eat the banker's lunch. It’s just a matter of time before someone creates a truly Digital Bank for the Digital Age, and it probably won't be a traditional bank. Source: Financial Services Club Blog, March 2014
One of the key drivers to widespread adoption, security fear, is not a threat anymore - only 19% of those surveyed said they wouldn’t mobile bank due to security fears compared to 34% the year previously. Source: Buzzcity, July 2014
2
If history is any guide, precious few of these new payments systems will ever gain wide adoption. Whilst more than 200 new payment systems were launched between 1993 and 2000, only one has emerged as a standout success – PayPal, with some 86 million accounts in more than 55 countries. A few other systems are still alive, but many of these are on life support. The vast majority, more than 190 systems, simply failed. Source: McKinsey, c. 2005
RBS has 2.9 million mobile banking users, with 1.4 billion logins since launch and has the only Windows mobile banking app in the UK. Its mobile banking customers login on average once a day. Source: RBSG, June 2014
53% 50%
90% 97%
US UK Brazil China
Desire to increase mobile banking interactions
Source: FICO, 2014
The less I have to deal with the physical aspects of banking, the more I've come to appreciate my banks. Source: Simon Zhen, American Banker, January 2014
4.25
1.30 1.25
0.19 0.10
In person at a physical branch
By phoning a call center
ATM Online banking using a bank or credit union
Mobile banking
Estimated cost per transaction to a bank (US$)

Mobile Money Market Statistics and Expert Views
© 2003 – 2014 Monitise Group Limited. All Rights Reserved 13
8335 8955 9417 9687 10153 10771 11395
4560 6000
7911
11443
15278
19238
23068
2010 2011 2012 2013 e2014 e2015 e2016
Annual Digital Banking Logins in the US, 2010 - e2016 (in millions)
Annual Online Logins Annual Mobile Logins
5.2. US
Source: Aite, August 2014. With permission.
32%
34%
35%
39%
70%
72%
75%
90%
26%
35%
36%
34%
70%
62%
71%
88%
Auto Loan
Mortgage
Store branded credit card
Gift card good only at specific merchants
Major credit card usable anywhere
Major debit card or check card usable anywhere
Savings account (personal or joint)
Checking Account (personal or joint)
Financial product and service ownership by mobile bankers (past 90 days) vs all consumers
All Consumers
Mobile bankers
Source: Mooreland Partners, April 2014. With permission.
Mobile banking led mpayments

Mobile Money Market Statistics and Expert Views
© 2003 – 2014 Monitise Group Limited. All Rights Reserved 14
There are currently 165million online ebankers and 48 million mobile banking users in the United States, forecasted to nearly double by the end of 2016. Source: Aite, August 2014
The underbanked are more likely to have logged into mobile banking through their mobile device in the past 7 days (37% had) than all consumers (29% had). Source: Javelin Strategy & Research, August 2014
A survey of US consumers who owned at least one computer, tablet and smartphone, found that nearly three-quarters of respondents visited a banking website or mobile site more than five times per month. Source: Maxymiser, October 2013
3 year study of American millennials (born 1981-2000): 53% don’t think their bank is any different from other banks. 73% would be more excited about a new financial services offering from Google/Amazon/Apple/ Square/Paypal than their own bank and 33% believe soon they won’t need a bank at all. Source: www.millennialdisruptionindex.com, February 2014 Source: BI Intelligence, August 2014
51%
33% 24%
17%
Used mbanking in past 12m: smartphone
Used mbanking in past 12m Used mpayments in past 12m: smartphone
Used mpayments in past 12m
US mbanking usage leads mpayments
Source: US Federal Reserve, March 2014
93%
72%
57%
53%
44%
43%
41%
38%
26%
Checked balance / transactions
Downloaded mbanking app
Transferred money
Received email alert
made a bill payment
received a text alert
located an ATM
Deposited a check using camera
Person to person payment
What US mobile bankers do
Source: US Federal Reserve, March 2014
Source: US Federal Reserve, March 2014
94%
72%
72%
67%
39%
Active users of OLB
Active users of mobile banking
Likley to bank with non-FI they already do business
with
Feel the traditional/digital experience received
fromtheir bank is somewhat/
Would consider using a branchless digital bank
Attitudes on Banking - North American Millennials
Mobile Money Market Statistics and Expert Views
© 2003 – 2014 Monitise Group Limited. All Rights Reserved 15
5.3. UK
Source: Forrester Research, 2014 UK Mobile Banking Functionality Benchmark, June 2014
18%
43%
18%
80%
4%
21% 27%
52%
6% 14%
7%
27%
1% 4% 6% 12%
Daily Weekly Monthly Total
Banking channels used by UK banking customers % of respondents
Internet Branch Mobile Landline
Source: Accenture, July 2014
Around £1.7 billion a week is transferred using mobile banking apps by customers of major banks – compared with £6.4 billion for internet banking over the same period. Source: BBA, June 2014
“In five years’ time you will see people being able to manage their financial capabilities through a portal through a mobile personal finance manager. All their loans and bank accounts will be managed through one point, giving them greater control and choice.” Source: Retail Week, August 2013
UK banks are more likely than their global peers to take more than a year to develop and launch a new mobile app (32% compared to 22% to the whole group). Source: Finextra, March 2014 Around 167,000 RBS customers use their mobile banking app between 7am and 8am on their morning commute. On Friday 30 May 2014 the bank’s app had 3.65 million log-ins – its busiest day so far. NatWest and RBS’s mobile app has received more than 1.25 billion log-ins so far. Source: BBA, June 2014
80% of UK respondents said using mobile banking had improved their money management. Source: ING, May 2014 Of the 50% of UK smartphone users who want to do more mobile banking in the future, 69% want to check account balances and 69% want to receive security checks. Source: FICO, January 2014
6%
5%
1%
1%
3%
4%
3%
1%
1%
2%
2%
3%
1%
1%
1%
12%
9%
9%
6%
5%
4%
4%
4%
4%
3%
2%
2%
2%
1%
1%
Check balance
View transaction
Receive SMS alert
TopUp phone credit
Inter account transfer (same bank)
Pay bills
P2P (account)
Contact customer service/ acc mgr
Search branch/ATM
Inter account transfer (different bank)
P2P (email/mobile)
Research financial products
Set up/Manage alerts
Money management
Buy/Apply for financial products
Which of these channels have you used to do each of these banking activities in the past 3 months?
Mobile Tablet

Mobile Money Market Statistics and Expert Views
© 2003 – 2014 Monitise Group Limited. All Rights Reserved 16
6. Mobile payments 6.1. Migration to electronic payments
1% 13% 3%
14% 8% 1%
8%
48% 11%
5% 2%
4%
0%
1%
5% 7%
18%
10%
14%
11% 18%
10%
5%
23%
13%
71%
47% 34% 37%
59%
US & Canada Latin America MEA APAC Europe
Global E Transaction Payment Mix
Cards
E-Wallets
Other
Direct Debit
Cash on Delivery
Bank Transfer
This inexorable shift towards electronic payments has had many consequences: central and commercial banks now manage their liquidity balances in real time, businesses can transact with suppliers and customers more efficiently, and consumers can pay for products easily and quickly from multiple vendors, channels and in different countries and currencies. Source: Deutsche Bank, The Future of Banking, September 2013 The payment card industry is projected to reach 289billion purchase transactions at merchants (card present and card not present) by 2018. This will be an increase of 122 billion from the 166 billion purchase transactions in 2012 generated by credit, debit and prepaid cards. Source: Nilson Report, January 2014. With permission. A rigorous evaluation of a social transfer program in Niger has shown that the variable cost of administering social transfer is 20 percent lower by mobile transfer than by manual cash distribution. Source: World Bank, Better Than Cash Alliance, Bill & Melinda Gates Foundation, August 2014
"It's about partnerships: payment is about ubiquity - you should be able to pay anywhere at any time and securely. It shouldn't be about 'what telco or what bank am I with?' but more that when you get your card or phone out of your pocket it's got to work. We welcome partnerships - you need competition in the market. We're obviously involved with Apple which is quite right - they are a big brand and we're happy to be a partner." Source: MasterCard UK and Ireland, September 2014
Online sales and contactless cards are behind the 14% fall in cash use over the past five years, while debit card use has increased by 11%. Source: British Retail Consortium, June 2014
Source: WorldPay, 2013
Source: Nilson Report, December 2013. With permission.

Mobile Money Market Statistics and Expert Views
© 2003 – 2014 Monitise Group Limited. All Rights Reserved 17
45.6 42 41.5 40.4 39.7 39.6 37.5 36.5 36.1 35.3 33.7 33.4 33.2 32.7 31.6 31.5 31.2 29.1 28.8 28.5 27.9 27.7 25.5
Scor
e on
mob
ile re
adin
ess i
ndex
, 10
0 poi
nts m
axim
um
Singapore, the US, and Canada are the markets best prepared for mobile payments adoption
60%
48% 46%
35%
12% 8% 9%
5%
62%
46%
35%
26%
11% 8% 8% 6%
67%
47% 41%
16% 11% 10% 7%
3%
PayPal My bank Mastercard/Visa /Another card
A retailer My MNO Software Co. Mobile phone manufacturer
None of the above
Preferred mobile payments providers
UK Germany Spain
6.2. Global
Mobile payments in China are predicted to reach $1.45 trillion by 2015. Consumers have been showing more interest in mobile payments because of the level of support this kind of commerce has been receiving from retailers and financial service firms. These organisations have been paying strong attention to the security concerns that consumers have in regards to mobile commerce. Better security features means that consumers are more comfortable with participating in mobile commerce. Source: Internet Society of China, August 2013
It is estimated that 14 million mobile point of sale devices have already been shipped, which will rise to 43 million by 2018. Source: Business Insider, September 2014
Global annual shipments of NFC enabled phones are set to rise from 275 million units in 2013 to 1.2 billion units in 2018. Source: NFC World, February 2014
In 2013, 55% of consumers in China had used mobile payments, compared to only 19% in the US. Source: Forbes, August 2014
Source: MasterCard (50 Variables in index), 2013
Every UK issuer now offers contactless Visa cards – there are 32million in circulation – and the number of contactless Visa transactions in the UK increased to 94 million in 2013 from 25 million in 2012. Overall there were 340 million purchases made in Europe using contactless cards last year. The biggest users of the technology being Poland with 159 million purchases, followed by the UK, Czech Republic, Slovakia and Spain. Source: Visa Europe, March 2014
Source: Future Foundation: Monitise mCommerce, July 2013
Mobile payment transaction share in China Mobile Web
Payments Proximity SMS
Payment
2010 6.2% 1.3% 92.5%
2011 20.4% 2.0% 77.6%
2012 51.7% 2.6% 45.7%
2013 93.1% 0.8% 6.1%
2014 96.5% 0.9% 2.6%
2015 97.2% 1.3% 1.5%
2016 96.7% 2.4% 0.9%
2017 95.8% 3.6% 0.6% Source: iResearch Consulting Group, January 2014
Mobile Money Market Statistics and Expert Views
© 2003 – 2014 Monitise Group Limited. All Rights Reserved 18
6.3. US
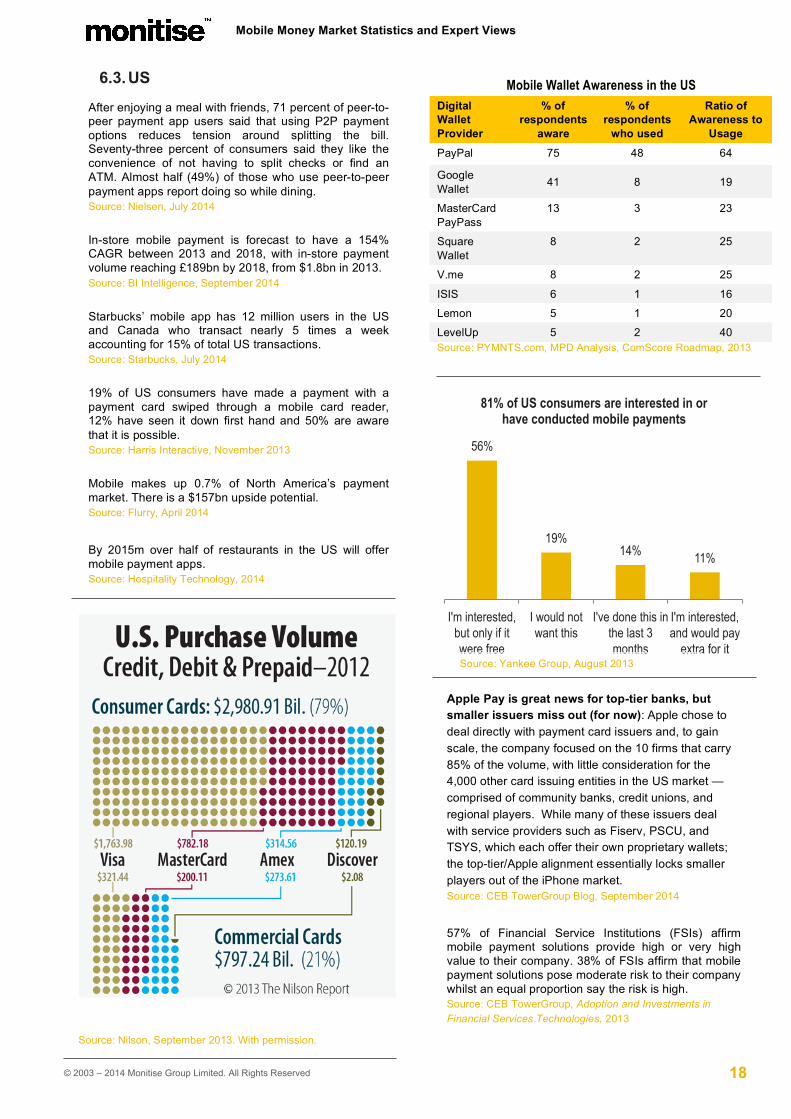
Mobile Wallet Awareness in the US Digital Wallet Provider
% of respondents
aware
% of respondents
who used
Ratio of Awareness to
Usage
PayPal 75 48 64
Google Wallet 41 8 19
MasterCard PayPass
13 3 23
Square Wallet
8 2 25
V.me 8 2 25
ISIS 6 1 16
Lemon 5 1 20
LevelUp 5 2 40 Source: PYMNTS.com, MPD Analysis, ComScore Roadmap, 2013
56%
19% 14% 11%
I'm interested, but only if it were free
I would not want this
I've done this in the last 3 months
I'm interested, and would pay
extra for it
81% of US consumers are interested in or have conducted mobile payments
Source: Yankee Group, August 2013
After enjoying a meal with friends, 71 percent of peer-to-peer payment app users said that using P2P payment options reduces tension around splitting the bill. Seventy-three percent of consumers said they like the convenience of not having to split checks or find an ATM. Almost half (49%) of those who use peer-to-peer payment apps report doing so while dining. Source: Nielsen, July 2014
In-store mobile payment is forecast to have a 154% CAGR between 2013 and 2018, with in-store payment volume reaching £189bn by 2018, from $1.8bn in 2013. Source: BI Intelligence, September 2014
Starbucks’ mobile app has 12 million users in the US and Canada who transact nearly 5 times a week accounting for 15% of total US transactions. Source: Starbucks, July 2014
19% of US consumers have made a payment with a payment card swiped through a mobile card reader, 12% have seen it down first hand and 50% are aware that it is possible. Source: Harris Interactive, November 2013
Mobile makes up 0.7% of North America’s payment market. There is a $157bn upside potential. Source: Flurry, April 2014
By 2015m over half of restaurants in the US will offer mobile payment apps. Source: Hospitality Technology, 2014
Source: Nilson, September 2013. With permission.
Apple Pay is great news for top-tier banks, but smaller issuers miss out (for now): Apple chose to deal directly with payment card issuers and, to gain scale, the company focused on the 10 firms that carry 85% of the volume, with little consideration for the 4,000 other card issuing entities in the US market —comprised of community banks, credit unions, and regional players. While many of these issuers deal with service providers such as Fiserv, PSCU, and TSYS, which each offer their own proprietary wallets; the top-tier/Apple alignment essentially locks smaller players out of the iPhone market. Source: CEB TowerGroup Blog, September 2014
57% of Financial Service Institutions (FSIs) affirm mobile payment solutions provide high or very high value to their company. 38% of FSIs affirm that mobile payment solutions pose moderate risk to their company whilst an equal proportion say the risk is high. Source: CEB TowerGroup, Adoption and Investments in Financial Services Technologies, 2013
Mobile Money Market Statistics and Expert Views
© 2003 – 2014 Monitise Group Limited. All Rights Reserved 19
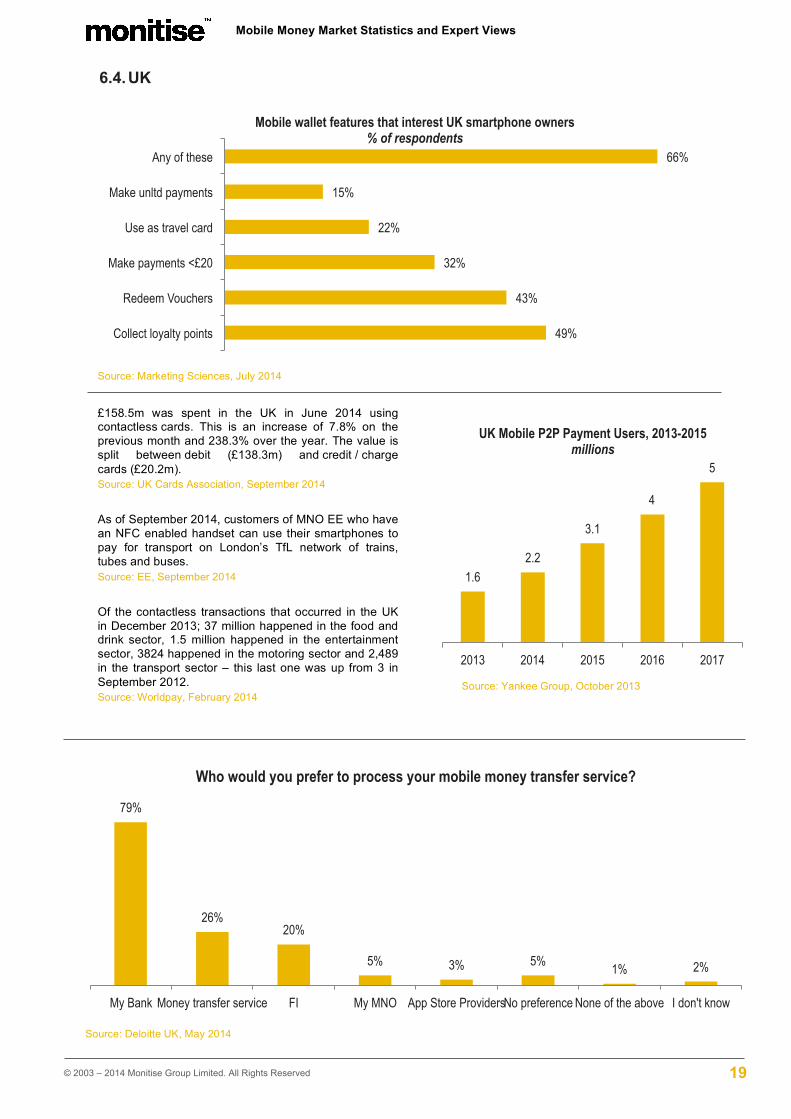
79%
26% 20%
5% 3% 5% 1% 2%
My Bank Money transfer service FI My MNO App Store Providers No preference None of the above I don't know
Who would you prefer to process your mobile money transfer service?
6.4. UK
Source: Marketing Sciences, July 2014
£158.5m was spent in the UK in June 2014 using contactless cards. This is an increase of 7.8% on the previous month and 238.3% over the year. The value is split between debit (£138.3m) and credit / charge cards (£20.2m). Source: UK Cards Association, September 2014
As of September 2014, customers of MNO EE who have an NFC enabled handset can use their smartphones to pay for transport on London’s TfL network of trains, tubes and buses. Source: EE, September 2014
Of the contactless transactions that occurred in the UK in December 2013; 37 million happened in the food and drink sector, 1.5 million happened in the entertainment sector, 3824 happened in the motoring sector and 2,489 in the transport sector – this last one was up from 3 in September 2012. Source: Worldpay, February 2014
Source: Deloitte UK, May 2014
Source: Yankee Group, October 2013
1.6 2.2
3.1
4
5
2013 2014 2015 2016 2017
UK Mobile P2P Payment Users, 2013-2015 millions
49%
43%
32%
22%
15%
66%
Collect loyalty points
Redeem Vouchers
Make payments <£20
Use as travel card
Make unltd payments
Any of these
Mobile wallet features that interest UK smartphone owners % of respondents

Mobile Money Market Statistics and Expert Views
© 2003 – 2014 Monitise Group Limited. All Rights Reserved 20
7. Mobile & tablet commerce 7.1. Global
The population most engaged in mobile shopping in Latin America is Mexico which also has the highest smartphone penetration on total population. In Western Europe, the UK leads by share of mobile retail on total B2C eCommerce sales, with sales from tablets growing faster than sales from smartphone. In APAC, South Korea sets the newest trends for global mCommerce, such as integration of mobile shopping into messaging platforms. In the MEA, mCommerce has a high potential, as most of the Internet users access the web through their mobile phones. Both in South Africa and in the UAE the share of Internet users shopping though mobile phones already reached a high one-digit number. Source: yStats, March 2014
Remote commerce makes up 90% of mobile payments. Source: Forrester Research, Inc , US Mobile Payments Forecast, 2013 To 2017, January 2013. With permission.
18%
15%
10%
8%
8%
6%
5%
4%
4%
4%
2%
8%
China
India
Great Britain
Australia
US
Germany
Sweden
Canada
Italy
Netherlands
France
Total
Internet users in select countries who purchase items via mobile device
% of respondents
Source: Retailmenot.com, Aug 2013
mCommerce makes up 12% of France’s total eCommerce sales. Source: CCM Benchmark Group, July 2014
More than half of Amazon customers used mobile devices to make purchases during the Holiday Season 2013. Source: Amazon, December 2013
PayPal’s annual mobile payments reached $27 billion in Q4 2013. Source: eBay, December 2013
The number of Brazilians using mobile devices for purchase of products and services has risen 84% over the last 12 months. Source: zdnet, July 2014
73% of mobile customers have abandoned shopping baskets for reasons including fiddly navigation, security concerns, off-putting pop-up adverts or clunky checkout process. Source: Internet Retailer, March 2014
Apple did $10 billion in app revenue in 2013. Source: Business Intelligence Insider, March 2014
4%
5% 5%
2%
4%
7%
2012 2013 2014
Smartphone vs Tablet mCommerce buyer penetration in France
% of population
Source: Ipsos for CA Com, June 2014
119
26 24
9 5 9.3 4.3 3.6 5.8 2.6
Taobao JD.com Tmall.com VIP Suning
Monthly estimates of activity and usage times of top mobile shopping apps in China
Active Accounts (million) Average usage times (monthly)
Source: TechinAsia., April 2014

Mobile Money Market Statistics and Expert Views
© 2003 – 2014 Monitise Group Limited. All Rights Reserved 21
8 12 16 19 23 28 16 26
32 37 42 46
2013 2014 (F) 2015 (F) 2016 (F) 2017 (F) 2018 (F)
US Smartphone Sales (US$ billions) & % of eCommerce
Travel & Food Retail & Daily Deals
3% 10%
47%
Total discretionary retail
eCommerce mCommerce
Q2 2014 Y/Y Retail Spending Growth by Channel
7.2. US
Source: Forrester Research, Inc., US Mobile Phone and Tablet Commerce Forecast, 2013-2018, May 2014. With permission.
1
Consumers spent a total of $352 billion online in 2013 and nearly $1 in every $6 originated from a mobile device. Source: Javelin Strategy & Research, February 2014. With permission. 48% of consumers would like to receive special discount offers from the bank that issues their most used credit card. Source: TSYS, October 2013
$200bn is spent annually on trade promotions in the US, US CPG advertising is $34bn of which $32bn was offline. Digital coupons represent less than 1% of US CGP coupon volume but over 10% of coupon redemptions. GfK estimates that digital coupon shoppers make 25% more trips to stores and spend 13% more each trip. eMarketer estimated that 97 million US adults would use digital coupons in 2013. Source: Coupons.com, February 2014
By Q3 2013 mobile devices made up 25% of all visits to ecommerce sites, this breaks down to 15% of visits from tablets and 10% from smartphones. A year earlier the overall figure was 16%, equally divided between smartphones and tablets. Source: Monetate, Q3 2013
2
By 2016, 1 in 4 US retail ecommerce dollars earned will come from mobile devices. In 2017, US retail mCommerce sales will top the $100 billion mark Source: eMarketer, July 2014
Most digital commerce spending still occurs on desktop but mobile is accounting for an increasingly meaningful percentage, 10.5% in 2013, and is growing at significantly faster rates. Source: ComScore, April 2014
Source: ComScore, August 2014
Source: PYMNTS.com, April 2014
36%
21%
200
1200
0 200 400 600 800 1000 1200 1400
0% 5%
10% 15% 20% 25% 30% 35% 40%
Millennials Baby Boomers
Millennials Baby Boomers
US mobile payment % of pop and spending power % who engage in mobile payments Annual spending power $ billions
6%
9% 10%
11% 11%
11%
37% 27%
25% 14%
1% 1% 1%
Computer Physical store
Smartphone Tablet Other
Mail Order Call Centre
Where did you use the last coupon/offer/promo code you found via smartphone?
Source: Forrester Research, The State of Digital Coupons, August 2014
Mobile Money Market Statistics and Expert Views
© 2003 – 2014 Monitise Group Limited. All Rights Reserved 22
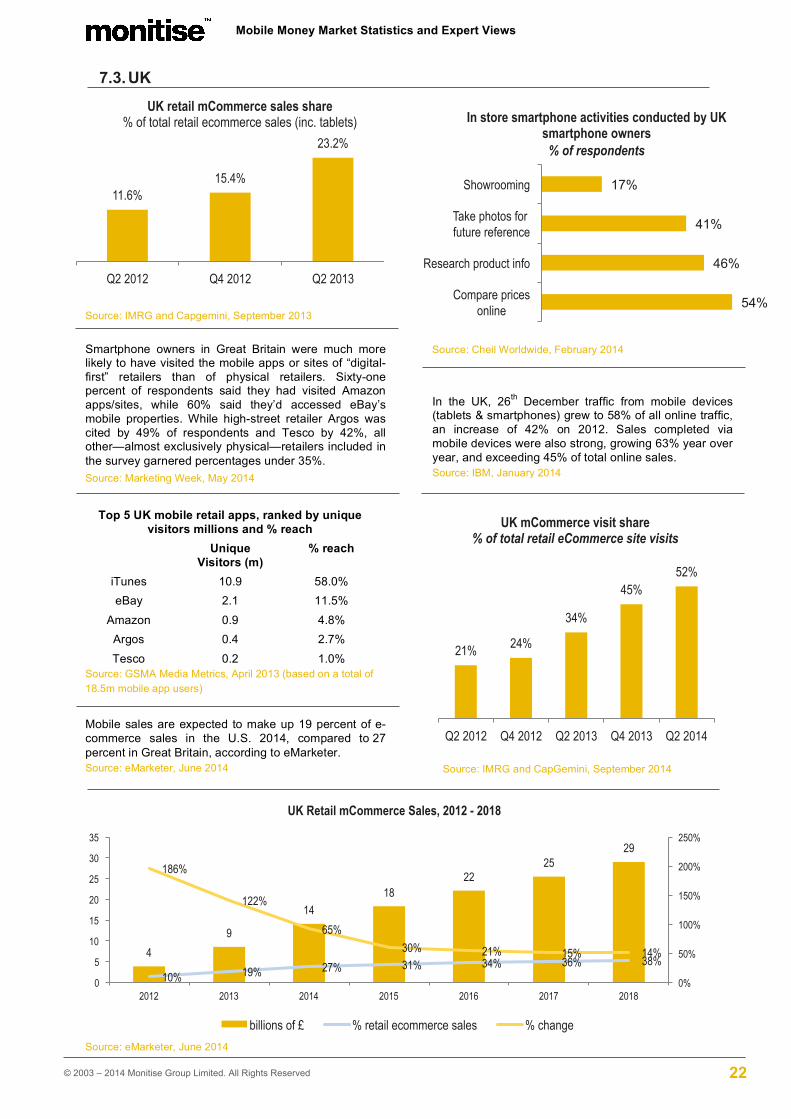
4 9
14 18
22 25
29
10% 19% 27% 31% 34% 36% 38%
186%
122%
65% 30% 21% 15% 14%
0%
50%
100%
150%
200%
250%
0
5
10
15
20
25
30
35
2012 2013 2014 2015 2016 2017 2018
UK Retail mCommerce Sales, 2012 - 2018
billions of £ % retail ecommerce sales % change
7.3. UK
Source: Cheil Worldwide, February 2014
11.6% 15.4%
23.2%
Q2 2012 Q4 2012 Q2 2013
UK retail mCommerce sales share % of total retail ecommerce sales (inc. tablets)
1
Source: IMRG and Capgemini, September 2013
Smartphone owners in Great Britain were much more likely to have visited the mobile apps or sites of “digital-first” retailers than of physical retailers. Sixty-one percent of respondents said they had visited Amazon apps/sites, while 60% said they’d accessed eBay’s mobile properties. While high-street retailer Argos was cited by 49% of respondents and Tesco by 42%, all other—almost exclusively physical—retailers included in the survey garnered percentages under 35%. Source: Marketing Week, May 2014
Top 5 UK mobile retail apps, ranked by unique visitors millions and % reach
Unique Visitors (m)
% reach
iTunes 10.9 58.0% eBay 2.1 11.5%
Amazon 0.9 4.8% Argos 0.4 2.7% Tesco 0.2 1.0%
Source: GSMA Media Metrics, April 2013 (based on a total of 18.5m mobile app users)
Mobile sales are expected to make up 19 percent of e-commerce sales in the U.S. 2014, compared to 27 percent in Great Britain, according to eMarketer. Source: eMarketer, June 2014
2
In the UK, 26th December traffic from mobile devices (tablets & smartphones) grew to 58% of all online traffic, an increase of 42% on 2012. Sales completed via mobile devices were also strong, growing 63% year over year, and exceeding 45% of total online sales. Source: IBM, January 2014
Source: eMarketer, June 2014
Source: IMRG and CapGemini, September 2014
54%
46%
41%
17%
Compare prices online
Research product info
Take photos for future reference
Showrooming
In store smartphone activities conducted by UK smartphone owners
% of respondents
21% 24%
34%
45% 52%
Q2 2012 Q4 2012 Q2 2013 Q4 2013 Q2 2014
UK mCommerce visit share % of total retail eCommerce site visits
Mobile Money Market Statistics and Expert Views
© 2003 – 2014 Monitise Group Limited. All Rights Reserved 23
7.4. Mobile Advertising
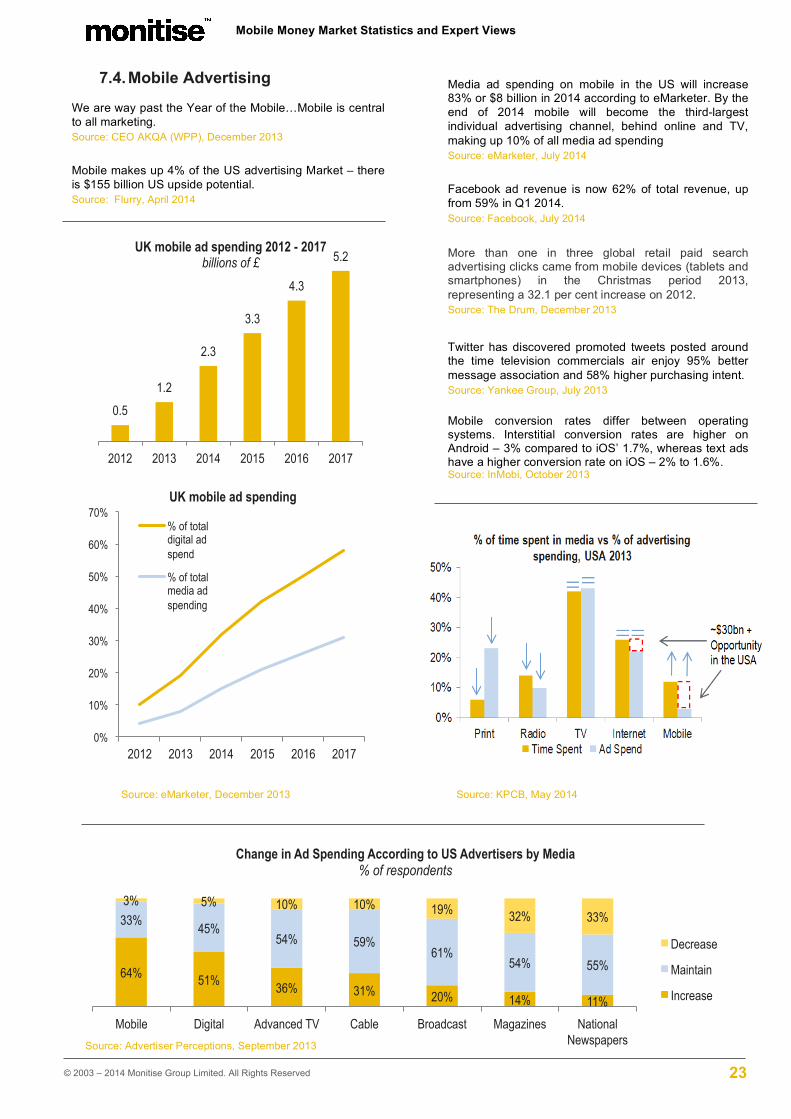
Source: eMarketer, December 2013
Media ad spending on mobile in the US will increase 83% or $8 billion in 2014 according to eMarketer. By the end of 2014 mobile will become the third-largest individual advertising channel, behind online and TV, making up 10% of all media ad spending Source: eMarketer, July 2014
Facebook ad revenue is now 62% of total revenue, up from 59% in Q1 2014. Source: Facebook, July 2014 More than one in three global retail paid search advertising clicks came from mobile devices (tablets and smartphones) in the Christmas period 2013, representing a 32.1 per cent increase on 2012. Source: The Drum, December 2013
Twitter has discovered promoted tweets posted around the time television commercials air enjoy 95% better message association and 58% higher purchasing intent. Source: Yankee Group, July 2013 Mobile conversion rates differ between operating systems. Interstitial conversion rates are higher on Android – 3% compared to iOS’ 1.7%, whereas text ads have a higher conversion rate on iOS – 2% to 1.6%. Source: InMobi, October 2013
Source: KPCB, May 2014
64% 51% 36% 31% 20% 14% 11%
33% 45% 54% 59%
61% 54% 55%
3% 5% 10% 10% 19% 32% 33%
Mobile Digital Advanced TV Cable Broadcast Magazines National Newspapers
Change in Ad Spending According to US Advertisers by Media % of respondents
Decrease
Maintain
Increase
0.5 1.2
2.3
3.3
4.3
5.2
2012 2013 2014 2015 2016 2017
UK mobile ad spending 2012 - 2017 billions of £
0%
10%
20%
30%
40%
50%
60%
70%
2012 2013 2014 2015 2016 2017
UK mobile ad spending
% of total digital ad spend
% of total media ad spending
We are way past the Year of the Mobile…Mobile is central to all marketing. Source: CEO AKQA (WPP), December 2013
Mobile makes up 4% of the US advertising Market – there is $155 billion US upside potential. Source: Flurry, April 2014
Source: Advertiser Perceptions, September 2013

Mobile Money Market Statistics and Expert Views
© 2003 – 2014 Monitise Group Limited. All Rights Reserved 24
8. Mobile Money for the unbanked 8.1. Mobile Money for the unbanked
Key Facts • Globally, more than 2.5 billion adults are without a formal account, most of them in developing
economies. World Bank Financial Inclusion Report, April 2012 • There are 58m people in the EU without bank access and another 92m are ‘underserved’ –
having access, say, to just one bank. The Financial Times, July 2014 • In Africa, less than a quarter of adults have a financial product or bank account with a formal
financial institution and about 90% of all consumer payments are conducted in cash. However, about 80% of Africans have a mobile phone, increasing at about 4% a year. MasterCard, March 2014
1
8.2. Un/underbanked user Profile While account penetration is nearly universal in high-income economies, with 89 percent of adults reporting that they have an account at a formal financial institution, it is only 41 percent in developing economies. Source: World Bank Financial Inclusion Report, April 2012
In developing economies, the richest 20 percent of adults in a country are more than three times as likely to save in a formal financial institution as the poorest 20 percent of adults. Source: World Bank Financial Inclusion Report, April 2012
2
There are 64.4 million underbanked – or 27% - Americans, and 12.9 million – or 5% - unbanked. Source: Javelin Strategy & Research, Prepaid with Mobile the Underbanked’s Killer App, August 2014
In the past year, almost 40% of the adult population in Latin America has saved money, of which nearly-three quarters did so at a bank or a formal financial institution. On the other hand, credit from formal financial institutions (8.6%) is less common than from family and friends (27%). Source: Yahoo Finance, August 2014
Mobile ownership in the BRIC markets by type of device Among mobile subscribers aged 16+, first-half 2012
Source: Nielsen, January 2013
Mobile Money Market Statistics and Expert Views
© 2003 – 2014 Monitise Group Limited. All Rights Reserved 25
8.3. Un/underbanked and mobile
1
Both the unbanked and the underbanked in the US make significant use of mobile phones and smartphones. Among individuals who are unbanked, 69% have access to a mobile phone and 49% of these are smartphones. Among the underbanked, 88% have a mobile phone, 64% of which are smartphones. Source: Federal Reserve, March 2014 Sub-Saharan Africa currently has the lowest smartphone adoption rate worldwide, at 15 per cent, but is expected to be the fastest-growing smartphone region over the next six years as affordable devices become more widely available and mobile broadband networks are deployed across Africa. Source: GSMA, September 2014
66% of the financially underserved and excluded in Europe have access to a standard mobile phone. This is significantly higher among the financially excluded. Source: MasterCard, The Road to Inclusion – across Europe, September 2013
53% of underbanked respondents in the US used mobile banking in the past 90 days vs. 42% of all respondents. Source: Javelin Strategy & Research, Prepaid with Mobile The Underbanked’s Killer App, August 2014
2
60% of adults in Latin America remain unbanked, ranging from 86% in Nicaragua and El Salvador, to 44% in Brazil. Mobile phone penetration however is at 104% overall, reaching 119% in Brazil and 98% in Nicaragua. Source: GSMA, ComScore, December 2013
Among the financially excluded and underserved, smartphone access, in some markets, showed some differences by gender. In Nigeria, only 13% women said they have access to a smartphone as against 49% of men. Likewise, in Vietnam, 52% of women have smartphone access as against a high of 84% of men. Source: MasterCard, The Road to Inclusion, Developing World Edition, May 2014
41% of India’s households are unbanked and approximately 67% of all retail transactions are still being conducted in cash. In contrast, mobile phones are already being used by ~17million Indians for banking purposes and its usage for banking and payment transactions is on the rise. Source: Deloitte, September 201
66%
60%
55%
61%
48%
51%
26%
39%
30%
87%
79%
76%
71%
73%
59%
49%
51%
44%
89%
76%
72%
69%
64%
47%
45%
44%
41%
Broadband
HDTV
Wireless laptop
Desktop computer
Smartphone
Entertainment device
Tablet
Feature phone
MP3 player
Selected products and services owned by underbanked vs all customers
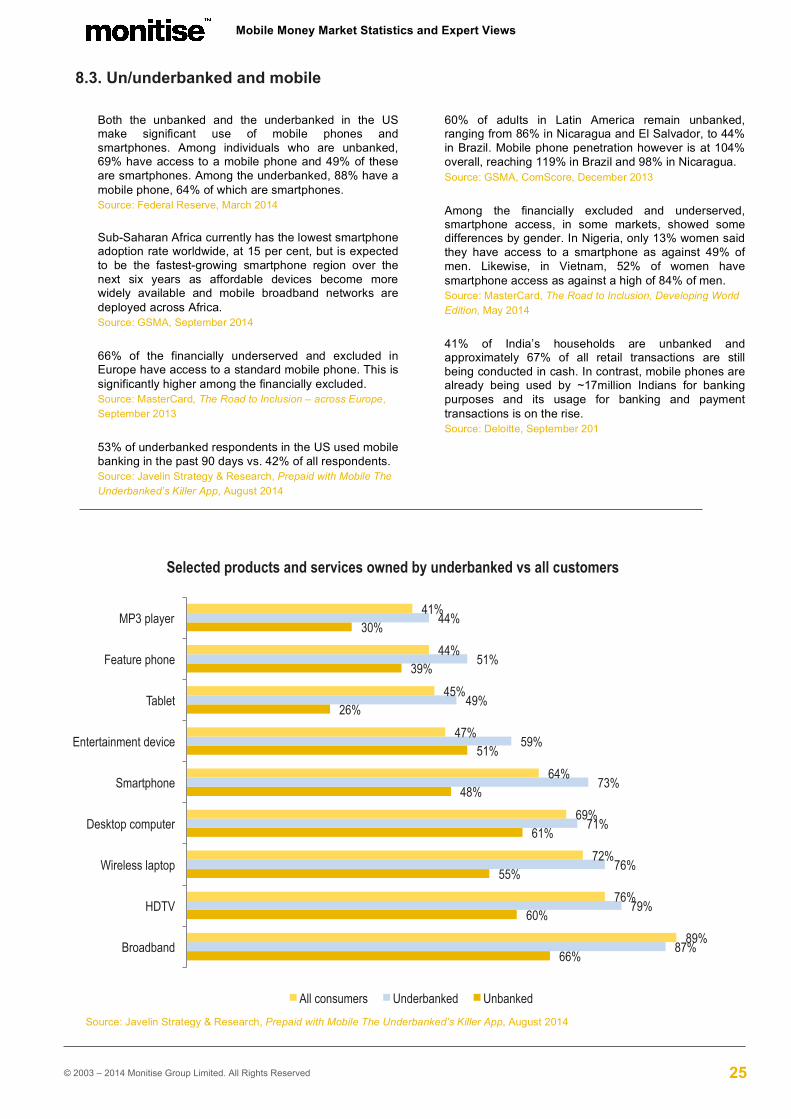
All consumers Underbanked Unbanked Source: Javelin Strategy & Research, Prepaid with Mobile The Underbanked’s Killer App, August 2014

Mobile Money Market Statistics and Expert Views
© 2003 – 2014 Monitise Group Limited. All Rights Reserved 26
8.4 The State of Mobile Financial Services for the un/underbanked
1
M-Pesa has 61 million active mobile money customers, 13 million of which are in Kenya. Source: Reuters, July 2014
Kenya’s Safaricom saw a 20% growth in revenues for its M-PESA mobile money service April-September 2013. M-PESA accounts for 18% of total revenue and the number of agents distributing M-PESA has now reached 79,000. Source: Mobileworldlive.com, November 2013
Orange Money has 10 million customers globally, most of them in the West Africa CFA Franc zone. Source: Reuters, July 2014
There are currently 246 live deployments of mobile money for the unbanked in developing countries, with a further 115 deployments in planning. Source: GSMA, August 2014
2
33 markets globally now have three or more live mobile money services for unbanked customers, up from 27 markets last December. Three new mobile money services recently launched in Zimbabwe, joining EcoCash in the race to acquire subscribers. Egypt’s four services – MobiCash, Phone Cash, Flous, Vodafone Cash – were all launched in the last 14 months. Source: GSMA, August 2014
As of June 2013 at least nine countries (Cameroon, the Democratic Republic of Congo, Gabon, Kenya, Madagascar, Tanzania, Uganda, Zambia, and Zimbabwe) had more mobile money accounts than bank accounts, compared to just four countries in 2012. Source: GSMA, August 2014
Nigeria has the highest number of mobile money deployments for the underbanked with 19, followed by India with 15. Europe as a continent has only 2 - 1 in Turkey and 1 in Romania. Source: GSMA, MMU Deployment Tracker, October 2014
Source: GSMA, MMU, September 2014
Payment system types in Kenya by volume and value
Mobile Money Market Statistics and Expert Views
© 2003 – 2014 Monitise Group Limited. All Rights Reserved 27
8.5 Mobile Financial Services for the underbanked – Expanding the offering
1
The race to emerging market consumers is truly underway after several announcements from handset manufacturers, content providers and notably Facebook – all of who are developing devices or mobile content specifically for consumers in these regions. Only when each player truly understands the audience of each region – being able to answer the questions of ‘what’s affordable’, ‘what content do consumers want’ and ‘what functionality is preferred’ – will they be able to connect with the consumers they are trying to reach”. Source: Upstream, February 2014
In regions where card penetration is lower than 30%, carrier billing offers an important alternative. Source: Ericsson Blog, November 2013
Adoption of mobile payments outside of Kenya has not been as strong, so the overall number of mobile banking users across Africa is still less than 50 million, demonstrating the enormous latent potential of mobile payments Source: Chairman of EMPH, January 2014
App stores using carrier billing have a 300-400% higher conversion rate in markets with relatively high levels of credit card penetration, and up to 1000% higher in markets where the penetration is low. Source: Mondato, October 2014
Remittances to developing countries are expected to top $436 billion in 2014, an increase of 7.8% over 2013. Source: World Bank, April 2014
2
1 in 10 (11%) say a major problem with current app stores options is the lack of payment methods offered when purchasing content. With many emerging market consumers not having access to credit cards, it will be the app stores that cater to all payment methods that will achieve widespread success. Source: Ovum data in Upstream, February 2014
Due to minimal diffusion of traditional point of sale (POS) infrastructure, mobile payment companies note the gap for market entry in countries such as Mexico, where there are an estimated 20 POS terminals per 1000 people, compared to 30 in Europe. Thus, the potential for, and ease of building mobile payment infrastructure from scratch remains higher in emerging markets Source: Fourth Source, November 2013
Source: World Bank, April 2014
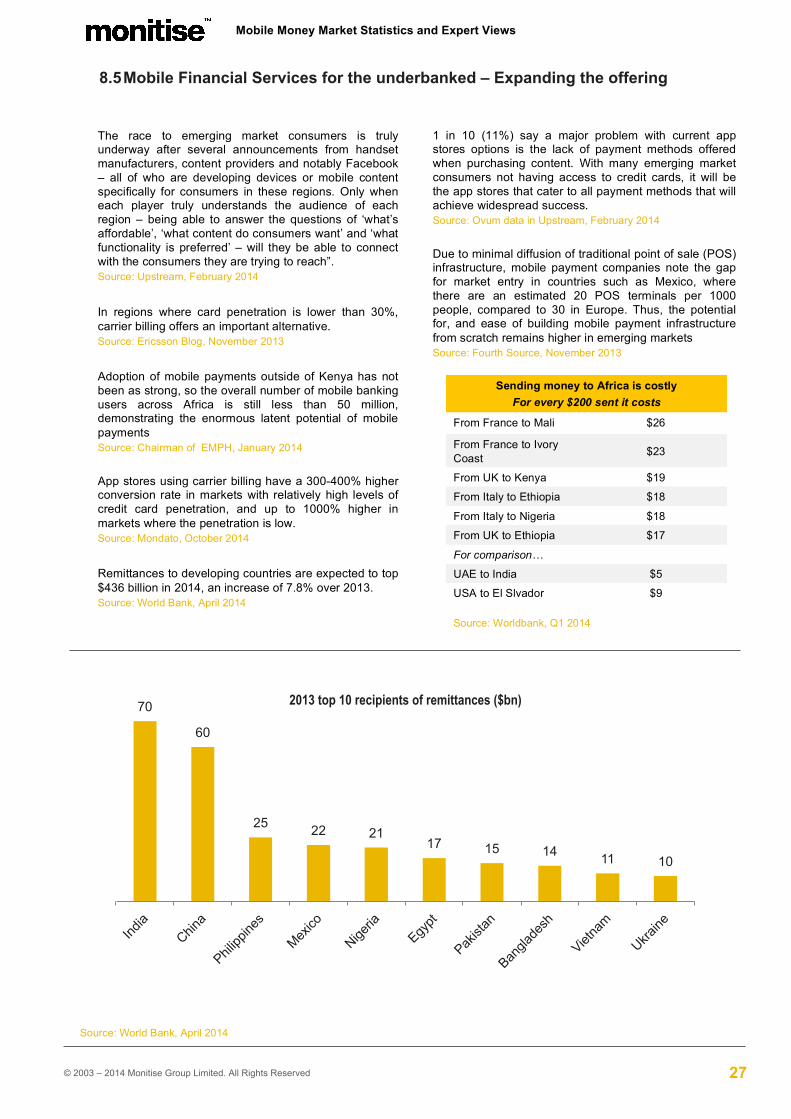
70
60
25 22 21 17 15 14 11 10
2013 top 10 recipients of remittances ($bn)
Sending money to Africa is costly For every $200 sent it costs
From France to Mali $26
From France to Ivory Coast $23
From UK to Kenya $19
From Italy to Ethiopia $18
From Italy to Nigeria $18
From UK to Ethiopia $17
For comparison…
UAE to India $5
USA to El Slvador $9 Source: Worldbank, Q1 2014
Mobile Money Market Statistics and Expert Views
© 2003 – 2014 Monitise Group Limited. All Rights Reserved 28
9. Security and fraud
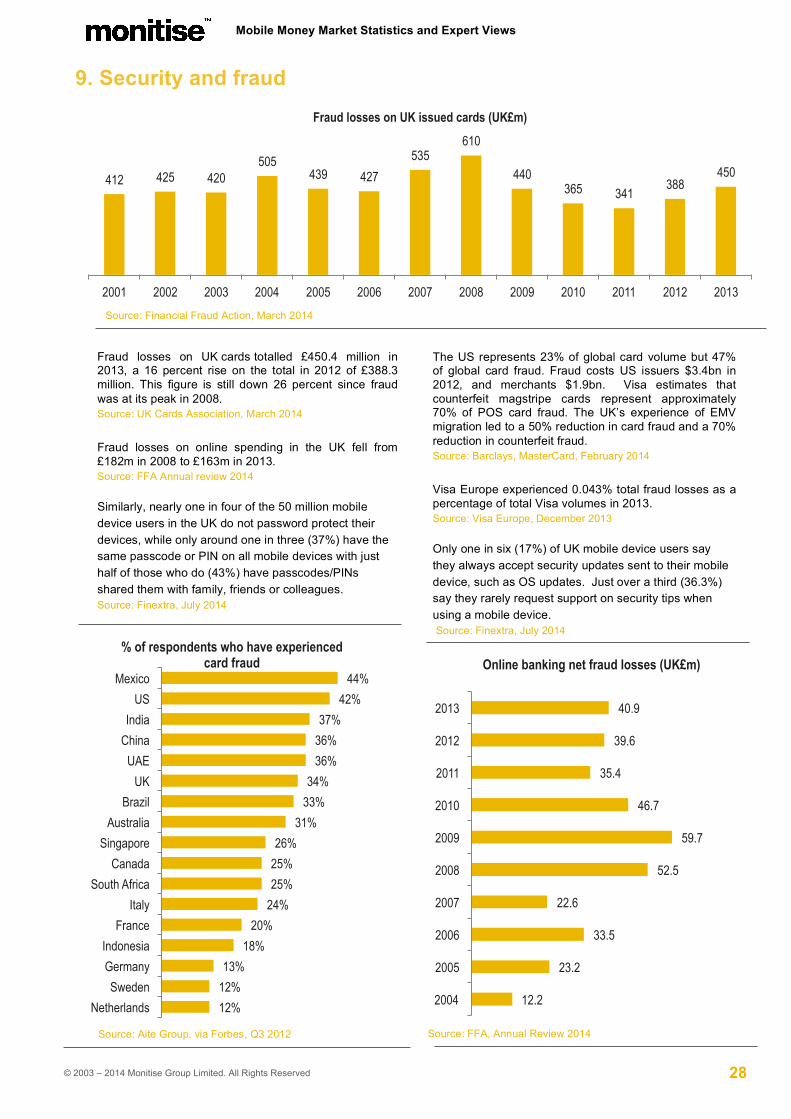
12% 12% 13%
18% 20%
24% 25% 25% 26%
31% 33% 34%
36% 36% 37%
42% 44%
Netherlands Sweden
Germany Indonesia
France Italy
South Africa Canada
Singapore Australia
Brazil UK
UAE China India
US Mexico
% of respondents who have experienced card fraud
412 425 420 505
439 427 535
610
440 365 341 388
450
2001 2002 2003 2004 2005 2006 2007 2008 2009 2010 2011 2012 2013
Fraud losses on UK issued cards (UK£m)
1
Fraud losses on UK cards totalled £450.4 million in 2013, a 16 percent rise on the total in 2012 of £388.3 million. This figure is still down 26 percent since fraud was at its peak in 2008. Source: UK Cards Association, March 2014
Fraud losses on online spending in the UK fell from £182m in 2008 to £163m in 2013. Source: FFA Annual review 2014 Similarly, nearly one in four of the 50 million mobile device users in the UK do not password protect their devices, while only around one in three (37%) have the same passcode or PIN on all mobile devices with just half of those who do (43%) have passcodes/PINs shared them with family, friends or colleagues. Source: Finextra, July 2014
2
The US represents 23% of global card volume but 47% of global card fraud. Fraud costs US issuers $3.4bn in 2012, and merchants $1.9bn. Visa estimates that counterfeit magstripe cards represent approximately 70% of POS card fraud. The UK’s experience of EMV migration led to a 50% reduction in card fraud and a 70% reduction in counterfeit fraud. Source: Barclays, MasterCard, February 2014
Visa Europe experienced 0.043% total fraud losses as a percentage of total Visa volumes in 2013. Source: Visa Europe, December 2013 Only one in six (17%) of UK mobile device users say they always accept security updates sent to their mobile device, such as OS updates. Just over a third (36.3%) say they rarely request support on security tips when using a mobile device. Source: Finextra, July 2014
Source: Aite Group, via Forbes, Q3 2012
Source: Financial Fraud Action, March 2014
12.2
23.2
33.5
22.6
52.5
59.7
46.7
35.4
39.6
40.9
2004
2005
2006
2007
2008
2009
2010
2011
2012
2013
Online banking net fraud losses (UK£m)
Source: FFA, Annual Review 2014
Global Headquarters
Global HeadquartersMonitise Group Limited,95 Gresham Street,London, EC2V 7NA
T: +44 (0)20 3657 0900F: +44 (0)20 3657 0901
Asia Pacific office
Monitise Asia Pacific,3rd Floor, Henley Building,5 Queen’s Road Central,Hong Kong
T: +852 2985 2635
US office
Monitise Americas, 781 Lincoln Ave., Suite 200,San Rafael,California, 94901
T: +1 (415) 526-7000F: +1 (415) 526-7099
Monitise MEA
ITU Teknokent ARI 2Binasi,B Blok,Kat:8 KoruyoluMaslak 34467IstanbulTurkey
T: +90 212 253 75 75
Monitise has a clear purpose: to help consumers bank anywhere, pay anyone and buy anything on their mobile devices. We are trusted by some of the world’s largest organisations who partner with Monitise for our leadership and expertise in Mobile Money.
If you would like to find out more about how we can realise your Mobile Money plans, please get in touch.
Contact details: [email protected] monitise.com
About Monitise