monitoring and evaluation plan for lesotho compact project …
TRANSCRIPT
MONITORING AND EVALUATION PLAN
FOR
LESOTHO COMPACT PROJECT
2008/09-2012/2013
1st Amendment May, 2010
2
Table of Contents List of Tables ........................................................................................................................................................ 4
List of Figures ...................................................................................................................................................... 4
Acronyms ............................................................................................................................................................ 5
1. Overview ..................................................................................................................................................... 6
2. Introduction ................................................................................................................................................. 8
3. Program Description .................................................................................................................................. 10
3.1 Economic Analysis .......................................................................................................................... 11
3.1. Beneficiary Analysis ........................................................................................................................ 12
3.1.1. The Health Component ............................................................................................................... 12
3.1.2. The Water Component ............................................................................................................... 13
3.1.3. The Private Sector Development Programme.............................................................................. 13
4. The Program Logic ..................................................................................................................................... 15
4.1. Program Model for Lesotho Compact ............................................................................................. 15
4.2. Program Logic Models for Specific Compact Projects ...................................................................... 17
5. Monitoring and Evaluation of the Lesotho Compact ................................................................................... 22
5.1. The Indicator Framework................................................................................................................ 22
5.2. Baseline and Targets ....................................................................................................................... 32
5.3. Data Collection and Reporting System ............................................................................................ 33
5.3.1. Data Collection Plan and Data Flow ............................................................................................. 33
5.3.2. Disaggregating Data by Gender, Income and Age ........................................................................ 34
5.3.3. Methods of Data Collection ........................................................................................................ 35
5.3.4. Frequency for Data Collection ..................................................................................................... 35
5.3.5. Responsible Entity for Data Collection......................................................................................... 36
5.3.6. Coordination of M&E Data Collection.......................................................................................... 36
5.3.7. Data Quality Review.................................................................................................................... 37
6. Reporting and Communication of M&E Results .......................................................................................... 38
6.1. Reporting within the Program......................................................................................................... 38
6.2. Reporting to MCC ........................................................................................................................... 38
7. Participatory Monitoring and Evaluation .................................................................................................... 39
3
8. Consultative Process .................................................................................................................................. 39
9. Management Information System .............................................................................................................. 39
10. Special Studies ....................................................................................................................................... 40
11. Evaluation .............................................................................................................................................. 41
11.1. Initial or Ex-Ante Evaluation ........................................................................................................ 41
11.2. Mid-Term Evaluation .................................................................................................................. 42
11.3. Impact Evaluation ....................................................................................................................... 43
12. Hypotheses and Risks ............................................................................................................................. 48
13. Administration and Management of M&E .............................................................................................. 50
14. Responsibilities for M&E ........................................................................................................................ 52
15. Human Capacity Building on M&E .......................................................................................................... 54
16. Institutional Strengthening ..................................................................................................................... 54
Annex 1 – Indicator Framework ......................................................................................................................... 55
Annex 1.1: Impact Indicators ............................................................................................................................. 55
Annex 1.2: Outcome and Output Indicators for the Health Project ..................................................................... 56
Annex 1.3: Outcome and Output Indicators for the Water Sector Project .......................................................... 57
Annex 1.4: Indicators for Wetlands Restoration and Rehabilitation .................................................................... 58
Annex 1.3: Outcome and Output Indicators for the Private Sector Development ............................................... 59

4
List of Tables Table 3.1.1: Summary of ERR Values for the respective projects ..................................................................... 12 Table 5.1.1.1: Impact (Goal Level) Indicators.................................................................................................... 234 Table 5.1.1.2: Objective Level Indicators .......................................................................................................... 234 Table 5.1.2.1: Outcome and Output Indicators for the Health Project........................................................... 256 Table 5.1.2.2: Outcome and Output Indicators for the Rural Water and Sanitation Project ........................ 267 Table 5.1.2.3: Outcome and Output Indicators for the Urban and Peri-urban Water Project...................... 278 Table 5.1.2.4: Outcome and Output Indicators for the Wetlands Restoration and Rehabilitation .............. 289 Table 5.1.2.5: Outcome and Output Indicators for Civil Legal Reform ............................................................. 29 Table 5.1.2.6: Outcome and Output Indicators for ACH, Credit Bureau and Debit Smart Card ..................... 30 Table 5.1.2.7: Outcome and Output Indicators for Land Administation and Reform Project ......................... 31 Table 5.1.2.8: Outcome and Output Indicators for National Identification Project......................................... 32 Table 5.1.2.9: Outcome and Output Indicators for Gender Equality Project .................................................. 32 Table 11.1: Program Hypotheses, Risks and Mitigation Measures ................................................................... 48 List of Figures Figure 4.1.1: The Program Logic Framework ................................................................................................ 16 Figure 4.2.1: Program Logic for the Health Sector Project .......................................................................... 17 Figure 4.2.2: Program Logic for the Metolong Down Stream Works .......................................................... 18 Figure 4.2.3: Program Logic for the Rural Water and Sanitation Project ................................................... 20 Figure 4.2.3: Program Logic for the Private Sector Development Project .................................................. 21 Figure 14.1: M&E Organisational Chart ......................................................................................................... 51

5
Acronyms ACH Automotive Clearing House ART Anti-Retroviral Drugs ADR Alternative Dispute Resolution BOS Bureau of Statistics CBL Central Bank of Lesotho CIF Compact Implementing Fund CP Conditions Precedence EIA Environmental Impact Assessment ERR Economic Rate of Return EIF Entry into Force FA Fiscal Agent HIMS Health Information Management System IE Implementing Entity IEA Implementation Entity Agreement M & E Monitoring and Evaluation MCA-Lesotho Millennium Challenge Account- Lesotho Authority MCC Millennium Challenge Corporation MOHSW Ministry of Health and Social Welfare NHTC National Health Training Centre NIDC National Identification Card OPD Out-Patient Department PIA Project Implementation Agreement PIU Project Implementation Unit PSD Private Sector Development QDRP Quarterly Disbursement Request Package TB Tuberculosis TBD To be determined WB World Bank WHO World Health Organization US United States
6
1. Overview The Millennium Challenge Corporation (MCC) and the Government of Lesotho have agreed on the formulation and implementation of this Monitoring and Evaluation (M&E) Plan that specifies:
i. How progress toward the Compact goal, objectives, and the intermediate results of each Project and Project Activity will be monitored;
ii. A methodology, process and timeline for monitoring and evaluation of planned, ongoing, or completed Projects and Project Activities to determine their efficiency, effectiveness, impact and sustainability and;
iii. Other components of the M&E Plan described below.
The Millennium Challenge Account-Lesotho (MCA-Lesotho) M&E Plan serves the following functions:
i. Explains in detail how MCC and MCA-Lesotho will monitor the various Projects to determine whether they are achieving their intended results and measure their larger impacts over time through program evaluation and rigorous impact evaluations.
ii. Outlines any M&E requirements that MCA-Lesotho must meet in order to receive disbursements.
iii. Serves as a guide for program implementation and management, so that MCA-Lesotho staff, members of the Board of Directors, Implementing Entities’ staff, beneficiaries, and other stakeholders understand the objectives and targets they are responsible for achieving, and are aware of their progress towards those objectives and targets during implementation.
iv. Establishes a process to alert implementers, stakeholders and MCC to any problems in program implementation and provides the basis for making any needed program adjustments.
v. Outline the designs and methodologies for conducting rigorous impact evaluation to demonstrate impact and attributions
This M&E Plan is considered a binding document, and failure to comply with its stipulations could result in suspension of disbursements. It may be modified or amended as necessary only with the approval of MCA-Lesotho Board and in accordance with MCC M&E Policy and the requirements of the Compact and any other relevant supplemental legal documents.

7
The M&E Plan has been developed and amended in consultation with MCC and MCA-Lesotho teams and it shall serve as the implementation plan for monitoring and evaluating the MCA-Lesotho Compact. It is a comprehensive M&E framework to which all partners have committed to use as part of the project management tool for decision-making process and for the results accountability functions of MCA-Lesotho. It describes all M&E activities that will be carried out during the remaining years of the Compact implementation, and it provides for the following:
a) Introduction of the M&E plan covering the purpose, roles and functions of the M&E plan as well as the description of how it was developed
b) Summary of the Compact goals and objectives that the project is intended to achieve c) The Compact Projects monitoring and evaluation framework d) Detail analysis of outcome and some output indicators for various project components
and the monitoring and evaluation pipeline linking indicators at different levels e) A description of the data collection and management system f) A detail description of program and impact evaluation designs and methodologies g) A detail description of information products and reports to be produced by MCA-
Lesotho h) A description of management and human and financial resources needed for the
implementation of the M&E Plan
8
2. Introduction
Monitoring and Evaluation (M&E) is a set of planning, information gathering and synthesis, reflection and reporting processes along with necessary conditions and capacities required for the outputs of M&E. M&E is an integral part of program management and a key component of program design and implementation. MCA-Lesotho M&E process is incorporated into all phases of the program design and implementation cycle. It is an essential tool in ensuring that programs are managed in a systematic, effective, sustainable and result-based manner and provides a continuous assessment for enhancing the overall effect of an intervention. It tracks performance to establish whether the goals and objectives are being achieved. 2.1. The Main Functions of the M&E Plan are:
i. Ensure accountability for results and transparency ii. Measure the efficiency, effectiveness, impact and sustainability of the compact iii. Provide information for evidence-based management decision making at sector, program
and project level iv. Support for national policy making and development v. Preserve institutional memory
2.2. The Process of Developing Lesotho Compact M&E Plan
MCA-Lesotho adopted a participatory process with its implementing partners and extensive consultations with organizations in all the sectors where Compact Project is operational in developing this M&E Plan. The development of M&E components such as indicators and data sources were led by PIUs and their relevant stakeholders while the MCA-Lesotho and MCC played a facilitation role. The BOS was consulted to give guidance on the surveys needed to gather information for project outcome and impact indicators. Two workshops were conducted by MCC and MCA-Lesotho to refine the M&E framework and all PIUs participated. 2.3. Amendment of the M&E Plan MCA-Lesotho has reviewed and amended the M&E Plan submitted in December 2008. The amended M&E Plan takes into consideration the performance indicators defined in the Activity Monitoring Plans developed by the Implementing units under the guidance of the MCA-Lesotho M&E team; changes in the scope of work and activities for Compact Projects; in the general environment for Compact implementation since 2008 and re-structuring of the M&E Section of MCA-Lesotho.

9
The amendment mainly entailed refinement and addition of key performance indicators; updating of baseline information; and revision of end of Compact targets for selected indicators. Adjustment in the projects’ work plans and time-lines and changes in the impact evaluation design due to the change in scope of the projects have also been taken into consideration. The new staffing structure and roles have also been incorporated.
10
3. Program Description The Lesotho Compact consists of three components: (a) the Health Sector Development; (b) the Water Sector Improvement; and (c) the Private Sector Development (“PSD). The Health Sector component is designed to increase access to life-extending ART (OPD), and essential health services by providing a sustainable delivery platform. The Health Sector Project activities include: (a) renovation of up to 138 health centers in order to establish a national stock of health centers that achieve a common standard; (b) establishment and integration of ART clinics in, and improvement of management of up to 14 hospital out-patient departments (“OPDs”); (c) construction and equipping of a new central laboratory and training laboratory staff; (d) construction of a dedicated, central facility for collecting and processing blood and provision of mobile blood collection and storage equipment; (e) an increase in the number of dormitories and staff residences at Lesotho’s National Health Training College (“NHTC”); (f) strengthened health systems through increased capacity for pre-service and in-service nurse training and improved district-level public health management; and (g) improved occupational health and safety and medical waste management practices. The objective of the Water Project is to improve water supply for industrial and domestic needs, and enhance rural livelihoods through improved watershed management. This Project is aimed at improving the water supply for industrial and domestic needs. It will provide essential infrastructure to deliver water to garment and textile operations. Domestic users in selected urban, Peri Urban and rural areas will benefit from water system upgrades and expansion to achieve a reliable supply of water and better sanitation. The Project will also enhance rural livelihoods through improved watershed management. The Water Sector Project activities include: (a) construction of a bulk water conveyance system and establishment of a program management unit for the Metolong Dam activity; (b) extension and rehabilitation of the urban and peri-urban water network; (c) provision of improved sanitation services for an estimated 25,000 households or approximately 150,000 persons through construction of ventilated improved pit latrines and water systems; and (d) restoration of degraded wetlands at three areas in the highland pastures and preparation of a strategic environmental assessment to support development of a national watershed management and wetlands conservation plan The Private Sector Development (“PSD”) project is intended to stimulate investment by improving access to credit, reducing transaction costs and increasing participation of women in the economy. The PSD Project activities include: (a) reform of the civil legal system through the development of the Commercial Court, including creation of case management systems for courts, and promotion of alternative dispute resolution (“ADR”); (b) support for the production and issuance costs of national identification cards (“NIDC”) as well as establishment of the necessary legal and regulatory reforms for data privacy and establishment and operations of a cross-border credit bureau;

11
(c) implementation of a new payments and settlement system1
3.1 Economic Analysis
in Lesotho; (d) reform of land administration in Lesotho through development of Lesotho Land Act, implementation of a systematic land regularization program for urban and peri-urban areas and development of a new Land Administration Authority (“LAA”); and (e) implementation of a training and public awareness program dedicated to promoting gender equality in economic rights and building of local capacity to continue advocacy.
Through the economic analysis conducted using the Economic Rate of Return modeling, the Lesotho Compact is anticipating to realize significant economic benefits which are expected to provide impacts between 10 and 20 years following the Compact’s interventions. The aim of the Lesotho Compact is to provide an economic rate of return double the Lesotho economic growth rate of 4.4% recorded in year in 2008, or to equal to or be more than the hurdle rate2
The estimates of economic impact of the proposed projects are based on the assumption that improvement of health status of Basotho through health systems strengthening and infrastructure; provision and access to water for household and industrial use; and removing barriers to foreign and local private sector investment will promote high and sustained economic growth and create a fiscal space for increasing priority in engaging in economic activity in Lesotho. This will ultimately reduce poverty in Lesotho through promotion of economic growth.
, which MCC has set at 9%.
To derive the economic goal, a cost-benefit analysis was conducted for all projects in the Compact based on MCC’s economic criteria. An internal economic rate of return (ERR) was calculated and will be revised when required for each of the projects, which is a comparison of the costs and benefits of a public investment. The ERRs for each project calculated in 2007 and updated in 2010 indicate that there were slight changes, especially in the health project, urban water, rural water and sanitation (see Table 3.1.1 below)
1 Payment and Settlement System includes the Automated Clearance House Project and Debit/Smart Card Project 2 The Hurdle rate is the Average Gross domestic Product (GDP) growth rate over three years from 2005 -2007

12
Table 3.1.1: Summary of ERR Values for the respective projects
Project ERR 2007
ERR 2010
Comments
a) Improved Health status for Basotho
Health Project
13% 10% Model to undergo revision
b) Improved Access to water for domestic and industrial use
Urban Water Supply
27% 20.7% Inclusion of Mapoteng Project
Rural Water and Sanitation 0.7% 3.5%
Metolong Dam
24% 24% No revisions made to date
c) Increased Foreign and Domestic Investment
Access to land
18% 18% No revision made to date
Access to Justice
13% 13% No revision made to date
National ID/Credit Bureau
10% 10% No revision made to date
3.2. Beneficiary Analysis
Beneficiary analysis is used to estimate the impact of Compact Projects on the poor, particularly the aged, women and children. Beneficiaries of the projects are individuals or households who realize improved standards of living, primarily through improved income, as a result of the economic gains generated by the investment. The participants on the other hand are groups of peoples who will utilize services provided by the MCC funding or enjoy outputs from the Projects. In 2008, the Lesotho Compact was planned to benefit all Basotho. However, following re-scoping of Compact activities, the number has declined and approximately 1,041,422 people are expected to benefit from the Compact as at May 2010.
3.2.1. The Health Component
In 2008, the Health Project was intended to benefit 1.8 million3
3 The total national population as estimated by the 2006 Lesotho Housing and Population Census
Basotho country-wide; primarily adult women and men who are HIV positive persons in need of ART and those who are already enrolled in ART services.
13
Following a re-scoping within the Project, and focusing exclusively on the income benefits of the Project, the number of beneficiaries was reduced to 752,003 as at May 2010. The poor urban and rural citizens are expected to derive income benefits from improved accessible health services with lower risk of exposure to Tuberculosis co-infection and safe birth deliveries. Secondary beneficiaries such as health personnel will gain skills and have equipment to lower the risk of infection in the work place.
3.2.2. The Water Component
The Metolong Dam Project will create employment opportunities for 39,750 people at Ha Tikoe Industrial Estate, and provide bulk water (75 ml) to Roma, Mazenod, Morija, and the Thetsane/Tikoe area. The urban water supply project will benefit urban and peri-urban people who are currently not being served and who do not have access to reliable/ consistent supply. The Project will further supply people in the Semonkong area who are currently using springs, with clean water. The Urban and Peri-Water Project has the potential to increase income benefit to approximately 304,000 people or 50,700 households. This potential number of beneficiaries is expected to increase following re-scoping of the project to include Mapoteng area and changes in project strategy for Semonkong area. The Rural Water Supply and Sanitation Project is expected to increase income and improve the quality of life for 150,000 people in rural areas of Lesotho; 75,000 people will derive income benefit from the rehabilitation of existing water systems and another 75,000 people will derive income benefit from new water and sanitation facilities. This will be achieved through the implementation of 250 water systems serving an average of 600 people each. The Project will also provide 25,000 rural households with VIP latrines. The funds provided for the water sector are to support activities for provision of rural water supply and sanitation services in 25 communities in each of the 10 districts of the country (250 total), improvements to urban and peri-urban water supply and limited sewerage works to 13 town centers throughout the country and finally the development of reliable treated bulk water conveyance systems from the Metolong Dam to meet water demands for the period up to 2020 in Maseru and the neighboring towns of Mazenod, Roma, Morija and Teyateyaneng in the Berea district. The current estimated total number of beneficiaries for the water component is 236,874 people.
3.2.3. The Private Sector Development Programme
This programme will support the benefits of access to land and access to financial services projects by ensuring contract enforcement and improving the households’ financial status. The Alternative Dispute Resolution (ADR) will support poorer litigants to gain access to legal services at reduced costs. The Land Administration Reform Project (LARP) will directly benefit at least 55,000 urban households by delivering formally recognized titles to land assets. A number of these new title holders are expected to use their land parcels as collateral for the financing of additional economic activity.

14
The training and public awareness to promote Gender Equality in Economic Rights project is expected to have a positive impact across the entire economy due to increased awareness of economic rights and practices. The Civil Legal Reform Project (CLRP) will reduce litigation and transaction costs for settling contract disputes; as well as reduce the risk due to enforceable contracting. The key beneficiaries of the civil legal reform project will be the financial institutions, business firms and individuals. This project will target more than 14,000 enterprises employing approximately 140,000 people over the Compact period by improving property and commercial rights. The Automated Clearing House (ACH) Project is expected to benefit financial institutions, large businesses as well as small medium and macro entrepreneurs, farmer’s associations, investors and borrowers who will gain from a more active economy. The project will diversify financial products and services to serve both urban and rural population. The payments and settlement systems project will benefit over 86,000 pensioners and 98,000 people currently remitting earnings to Lesotho via checks and/or cash. Women will also benefit from the project. The NIDC and Credit Bureau project will increase private sector access to credit, particularly among the “banked” portion of the population. It will also facilitate credit use among significant segments of those currently “un-banked”. The total number of people expected to derive income benefit from the Private Sector Development component is 368,319 people.
15
4. The Program Logic
4.1. Program Model for Lesotho Compact
The Lesotho Compact M&E Plan is built as illustrated in the overall program logic model. The program logic model is graphically presented in Figure 4.1 below and it shows project logic in relation to expected results; specifically outlining the sequence of outcomes and intended causality from the Compact objectives.
As shown in the figure, the overall impact of Lesotho Compact is to contribute to reduction of poverty in Lesotho through economic growth. For instance, the improvement in the health infrastructure will lead to improved delivery of health services throughout the country which will lead to increased access to improved health service delivery throughout the country; increased utilization of health services by the population thereby leading to reduced mortality and morbidity hence improved wellbeing of all Basotho. Improvement in the water sector will on the other hand, lead to increased access to portable water by business community and households in rural and urban areas, which will contribute to reduced water borne diseases, saved water collection time and improved availability of water. Consequently, this will lead to economic growth and ultimately reduced poverty. Similarly, the Private Sector Development Projects will enable access to economic resources and rights by all sectors of the population; hence increased investment and productivity, economic growth and reduced poverty

Figure 4.1.1: The Program Logic Framework
MCA-Lesotho Program Goal:
Poverty reduction through economic growth
Health Project Objective: Increase access to life-extending ART and essential health services by providing a sustainable delivery platform
Outcomes
All Activities: Quality of health service delivery is improved, and usage of health services is increased
Health Centers Activity: Health Centers are equipped and maintained at standards
ART Clinics Activity: Hospital based ART services are expanded
Central Laboratory Activity:Laboratory services are improved
Blood Transfusion Service Activity:Blood transfusion services are improved
National Health Training College Activity: Health professionals are trained
Water Project Objective:Improve the water supply for industrial and domestic needs, and enhance rural livelihoods through improved watershed management
Outcomes
Metolong Dam–Ancillary Works Activity: Bulk water supply to lowlands is increased
Urban Water Supply Activity: Urban domestic water supply is improved
Rural Water Supply and Sanitation Activity: Rural water supply is expanded and sanitation is improved
Wetlands Rehabilitation and Management Activity: Watershed management is improved
Private Sector Development Project Objective: Stimulate investment by improving access to credit, reducing transaction costs and increasing the participation of women in the economy
Outcomes
Credit Bureau and National Identification Card Activity: Access to credit is expanded
Payments and Settlement Systems Activity: Payment transaction processes are simplified
Land Reform Activity: Use of land as collateral is increased
Civil Legal Reform Activity: Commercial dispute resolution is increased
Training and Public Awareness to Support Gender Equality in Economic Rights: Knowledge, attitudes, and practices of women’s economic rights are improved

4.2. Program Logic Models for Specific Compact Projects
Figures 4.2.1 to 4.2.5 below show the logic for the specific Compact projects.
The Health Sector Project is designed to improve health status of all Basotho. The activities around the Project include improved health infrastructure which covers rehabilitation and equipping of up to 138 Health Centers, construction and equipping of a new central laboratory, provision of furniture and equipment for regional Blood Transfusion Services and training of laboratory staff which will contribute to improved specialized health services; while additional dormitories, staff housing will be built at Lesotho College of Education in an effort to retain competent health personnel. The Health Sector also expects to realize decentralized health service management whereby the DHMTs will be capacitated with necessary resources such as computers and vehicles. Equally important, the Project will focus on improved Health Care Waste Management whereby the Policy will be revised and Plan developed among others; for improved occupational safety and health care waste management practices.
Figure 4.2.1: Program Logic for the Health Sector Project
Improved health status of all Basotho
Improved health service delivery including
expanded Hospital based ART
Increased usage of health services
Public Aware of the improved health
services
Communities participating in the
Health delivery system
Improved health infrastructure
Strengthened HMIS & Research
Retained competent
staff
Improved health specialized
services
Strengthened DHMTs
Improved HCWM system
18
The overall performance of the Project will be guided by availability of quality and consistent data hence improved Health Management Information System and health research. It is imperative that the public and health personnel are aware of the envisaged developments in the Sector; and participate in the Project activities as advocated by Information and Outreach activities. With all these activities undertaken health service delivery including expanded hospital based ART will improve together with increase in the usage of health services. Ultimately, cases of mortality and morbidity will reduce hence improved health status of all Basotho.
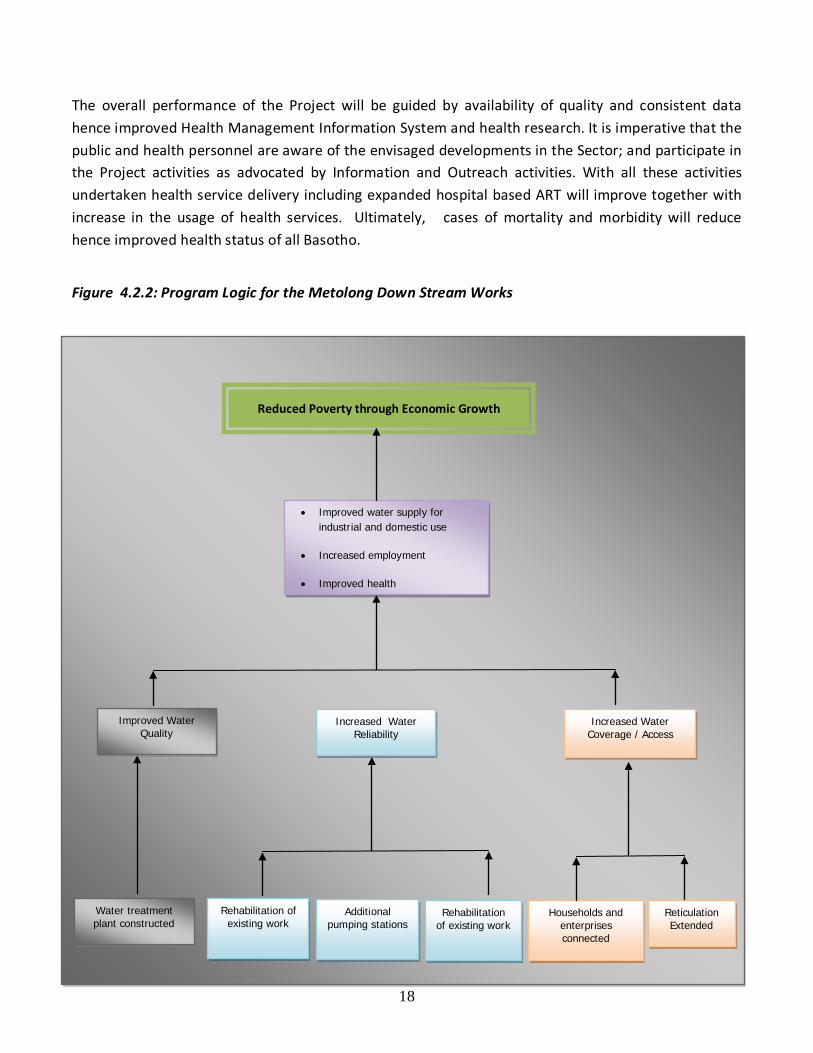
Figure 4.2.2: Program Logic for the Metolong Down Stream Works
Rehabilitation of existing work
Additional pumping stations
Water treatment plant constructed
Households and enterprises connected
Rehabilitation of existing work
Reticulation Extended
Increased Water Reliability
Increased Water Coverage / Access
Improved Water Quality
• Improved water supply for industrial and domestic use
• Increased employment
• Improved health
Reduced Poverty through Economic Growth
19
The construction of a bulk water conveyance system, extension and rehabilitation of the urban and peri-urban water network will assist in the creation of employment, improved water supply and reduced water borne diseases that will reduce household poverty. The Metolong Dam project was designed to alleviate chronic shortage and need of adequate water supply for domestic and enterprise use. The project is expected to improve the supply of bulk water to urban centers’ of Maseru, Mazenod, Roma, Morija and Teyateyaneng in the lowland areas and to stimulate enterprise growth and activity leading to increased employment in water intensive industries. One the other hand, the Urban and Peri-Urban (WASA) project consist of rehabilitations of segments of the existing water supply networks, mainly replacement of asbestos cement (AC) pipe materials with Un-plasticized Polyvinyl Chloride (UPVC) and network extensions works to peri-urban areas where there is high growth rate with the urbanisation that is going around the country. Also, there is construction of new town water supply system in Semonkong Urban centre and then an extension of Mazenod water supply network.

20
Figure 4.2.3: Program Logic for the Rural Water and Sanitation Project
The Rural Water Supply and Sanitation project will be implemented throughout the 10 districts of Lesotho in 4 construction phases. The construction of VIP Latrines will provide improved sanitation; restoration of degraded wetlands will retain water availability during dry season, promote handicraft, and preserve pastureland and medicines plant.
Public Awareness
Environmental M&E Tools
Water systems constructed
Rehabilitation Strategy
Hygiene awareness knowledge imparted
VIP latrines constructed
Improved & Sustainable
Sanitation in the Rural Areas
Increased & Sustainable Access to Improved water
supply
Improved health and livelihood of rural Basotho
Rehabilitated Wetlands
Improved ranges Alternative Livelihoods
Operational Range
Management System
21
The construction of water facilities will increase access to portable water and all these activities will lead to improved health which will further lead to increase in the household income resulting from time saved, agriculture use, medicinal plants and handicrafts. The Project also includes public health and hygiene awareness programmes, training and support to the communities.
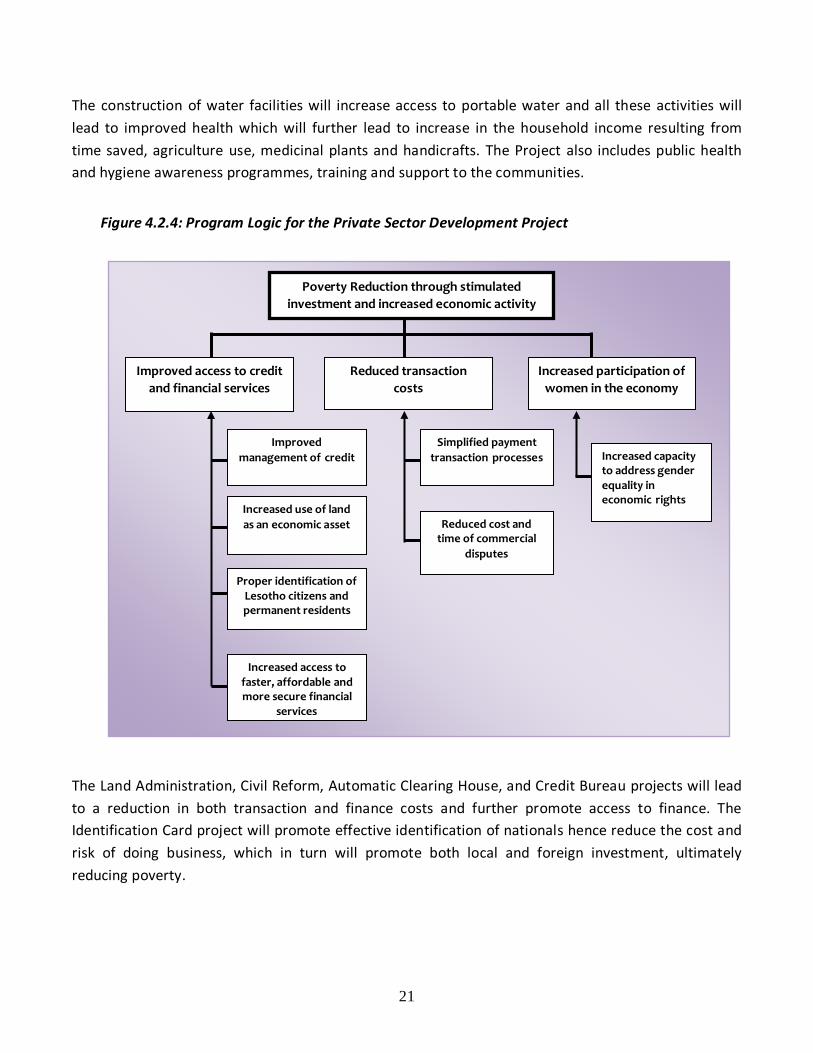
Figure 4.2.4: Program Logic for the Private Sector Development Project
The Land Administration, Civil Reform, Automatic Clearing House, and Credit Bureau projects will lead to a reduction in both transaction and finance costs and further promote access to finance. The Identification Card project will promote effective identification of nationals hence reduce the cost and risk of doing business, which in turn will promote both local and foreign investment, ultimately reducing poverty.
Poverty Reduction through stimulated investment and increased economic activity
Improved access to credit and financial services
Increased participation of women in the economy
Proper identification of Lesotho citizens and permanent residents
Increased use of land as an economic asset Reduced cost and
time of commercial disputes
Simplified payment transaction processes Increased capacity
to address gender equality in economic rights
Increased access to faster, affordable and more secure financial
services
Reduced transaction costs
Improved management of credit
5. Monitoring and Evaluation of the Lesotho Compact The M&E Plan is based on the results-based approach and it tracks indicators at the goal, objective and project activities levels. The relevant impact, outcome, output, and process indicators were identified at the respective levels in 2007, through an initial participatory process with the project team members at the Project Implementing Units (PIUs), and reviewed in 2010 through a series of consultations while developing the Activity Monitoring Plans (AMPs) for the PIUs. They will be tracked, measured and reported on to demonstrate the progress the program is making to addresses poverty reduction through economic growth in Lesotho. Impact and Outcome indicators, which are at the “Goal and Program Objective Level”, will measure the intermediate and final results of the individual projects as well as the overall compact project in order to monitor their success in meeting each of the project objectives, including results for the intended beneficiaries identified in the main project document. Output Indicators are the “Project activity level” and they will measure the direct outputs of the Project Activities in order to provide an early measure of their likely impact. Process Milestones will measure the key benchmarks being achieved at the “institutional level.” The short-term outcomes, output indicators and milestones will be tracked periodically through a set of tools as specified in the MCA Lesotho Reporting Framework and using the AMPs for each PIU and IE. Indicators will be disaggregated by gender, income level and age, and beneficiary types to the extent practicable. Each indicator will be accompanied by its corresponding targets over the project life cycle. This M&E plan outlines baseline and final targets for major outcome and output indicators.
5.1. The Indicator Framework
To monitor progress toward the achievement of the outputs, outcome, objectives and goal, the Monitoring Component of the M&E Plan includes an indicator table that identify (a) the indicators, (b) the definitions of the indicators, c) the data source d) the baseline, e) actual for Year 2 and f) end of Compact targets. The comprehensive indicators framework is attached as a reference table. The indicator tables below (Tables 5.1.1 through 5.1.6) provide an overview of the indicators and targets that will be used to monitor the performance of the Compact over the period of implementation.
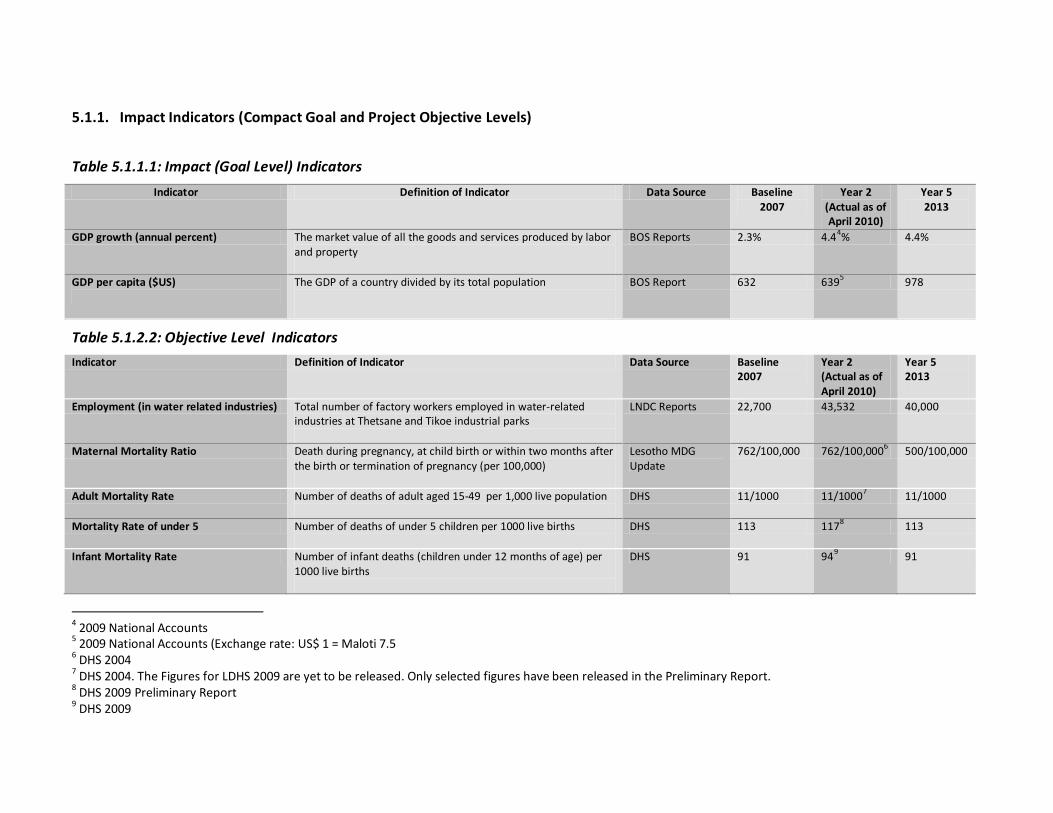
5.1.1. Impact Indicators (Compact Goal and Project Objective Levels)
Table 5.1.1.1: Impact (Goal Level) Indicators
Indicator Definition of Indicator Data Source Baseline 2007
Year 2 (Actual as of April 2010)
Year 5 2013
GDP growth (annual percent) The market value of all the goods and services produced by labor
and property
BOS Reports 2.3% 4.44 4.4% %
GDP per capita ($US)
The GDP of a country divided by its total population
BOS Report 632 6395 978
Table 5.1.2.2: Objective Level Indicators
Indicator Definition of Indicator Data Source Baseline 2007
Year 2 (Actual as of April 2010)
Year 5 2013
Employment (in water related industries) Total number of factory workers employed in water-related industries at Thetsane and Tikoe industrial parks
LNDC Reports 22,700 43,532 40,000
Maternal Mortality Ratio Death during pregnancy, at child birth or within two months after the birth or termination of pregnancy (per 100,000)
Lesotho MDG Update
762/100,000 762/100,0006 500/100,000
Adult Mortality Rate Number of deaths of adult aged 15-49 per 1,000 live population
DHS 11/1000 11/10007 11/1000
Mortality Rate of under 5 Number of deaths of under 5 children per 1000 live births
DHS 113 1178 113
Infant Mortality Rate Number of infant deaths (children under 12 months of age) per 1000 live births
DHS 91 949 91
4 2009 National Accounts 5 2009 National Accounts (Exchange rate: US$ 1 = Maloti 7.5 6 DHS 2004 7 DHS 2004. The Figures for LDHS 2009 are yet to be released. Only selected figures have been released in the Preliminary Report. 8 DHS 2009 Preliminary Report 9 DHS 2009
24
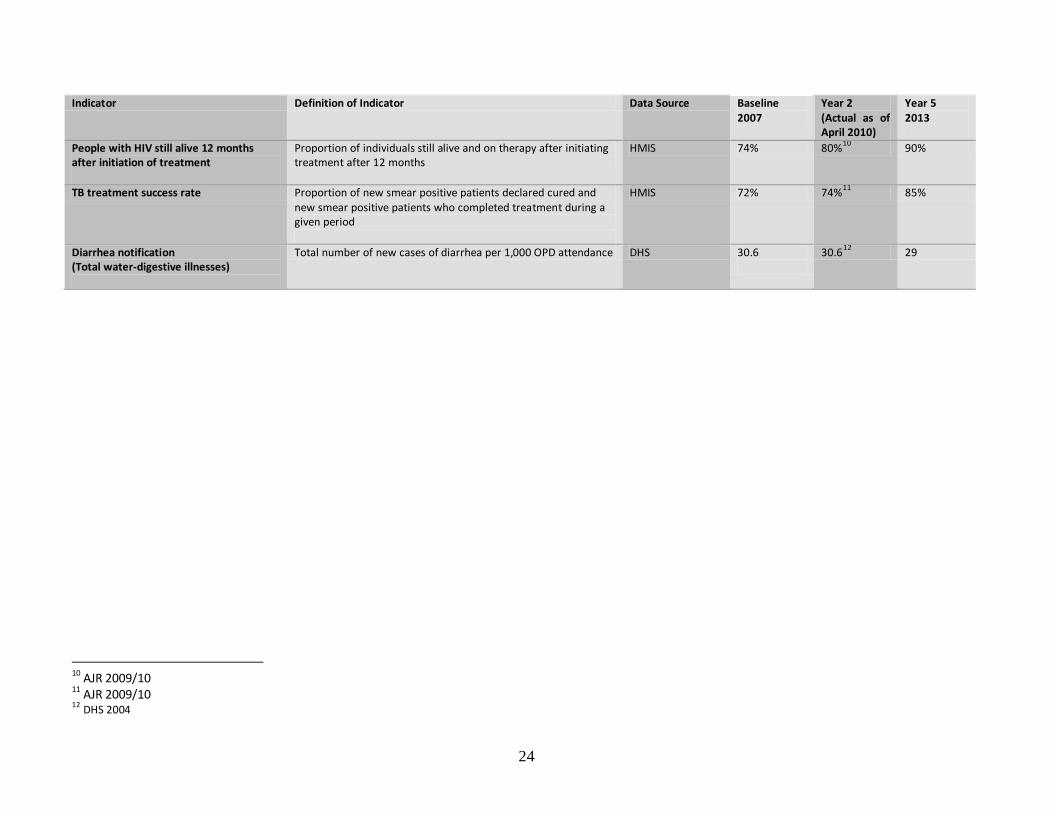
Indicator Definition of Indicator Data Source Baseline 2007
Year 2 (Actual as of April 2010)
Year 5 2013
People with HIV still alive 12 months after initiation of treatment
Proportion of individuals still alive and on therapy after initiating treatment after 12 months
HMIS 74% 80%10 90%
TB treatment success rate Proportion of new smear positive patients declared cured and new smear positive patients who completed treatment during a given period
HMIS 72% 74%11 85%
Diarrhea notification (Total water-digestive illnesses)
Total number of new cases of diarrhea per 1,000 OPD attendance DHS 30.6
30.612 29
10 AJR 2009/10 11 AJR 2009/10 12 DHS 2004
25
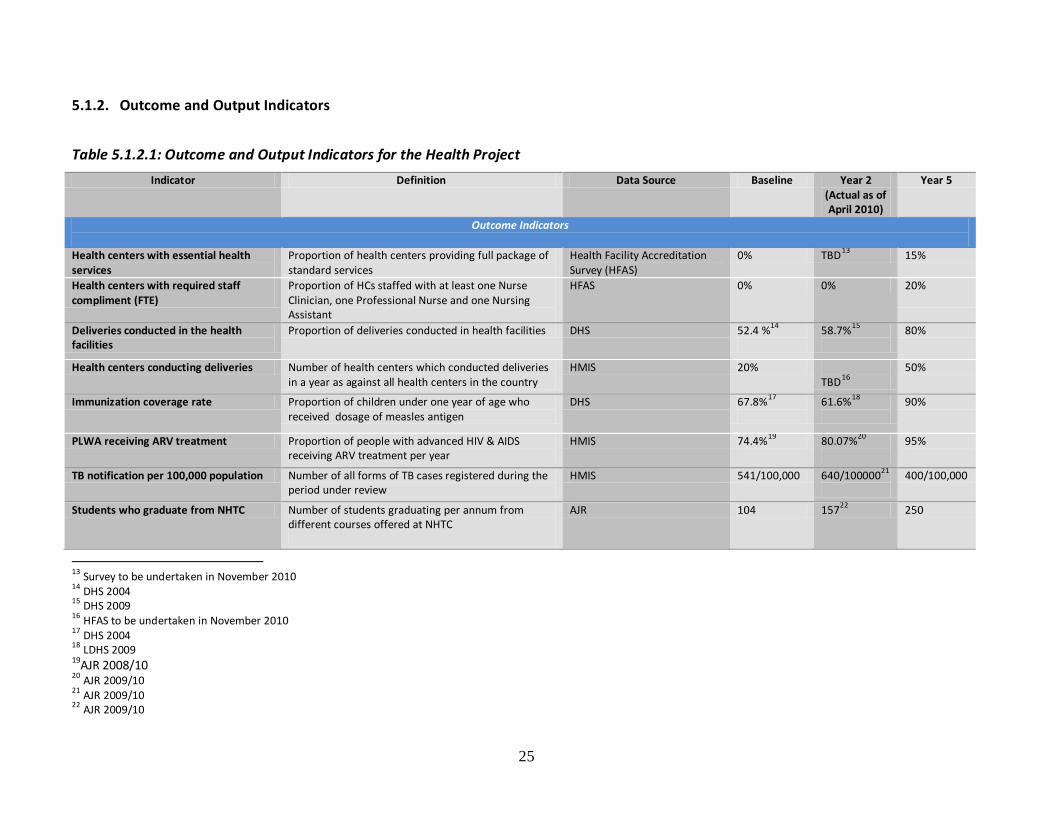
5.1.2. Outcome and Output Indicators
Table 5.1.2.1: Outcome and Output Indicators for the Health Project
Indicator Definition Data Source Baseline Year 2 (Actual as of April 2010)
Year 5
Outcome Indicators
Health centers with essential health services
Proportion of health centers providing full package of standard services
Health Facility Accreditation Survey (HFAS)
0% TBD13 15%
Health centers with required staff compliment (FTE)
Proportion of HCs staffed with at least one Nurse Clinician, one Professional Nurse and one Nursing Assistant
HFAS 0% 0% 20%
Deliveries conducted in the health facilities
Proportion of deliveries conducted in health facilities DHS 52.4 %14
58.7%15
80%
Health centers conducting deliveries Number of health centers which conducted deliveries in a year as against all health centers in the country
HMIS 20% TBD16
50%
Immunization coverage rate Proportion of children under one year of age who received dosage of measles antigen
DHS 67.8%17
61.6%18
90%
PLWA receiving ARV treatment Proportion of people with advanced HIV & AIDS receiving ARV treatment per year
HMIS 74.4%19 80.07% 20
95%
TB notification per 100,000 population Number of all forms of TB cases registered during the period under review
HMIS 541/100,000 640/10000021
400/100,000
Students who graduate from NHTC Number of students graduating per annum from different courses offered at NHTC
AJR 104 15722 250
13 Survey to be undertaken in November 2010 14 DHS 2004 15 DHS 2009 16 HFAS to be undertaken in November 2010 17 DHS 2004 18 LDHS 2009 19AJR 2008/10 20 AJR 2009/10 21 AJR 2009/10 22 AJR 2009/10
26
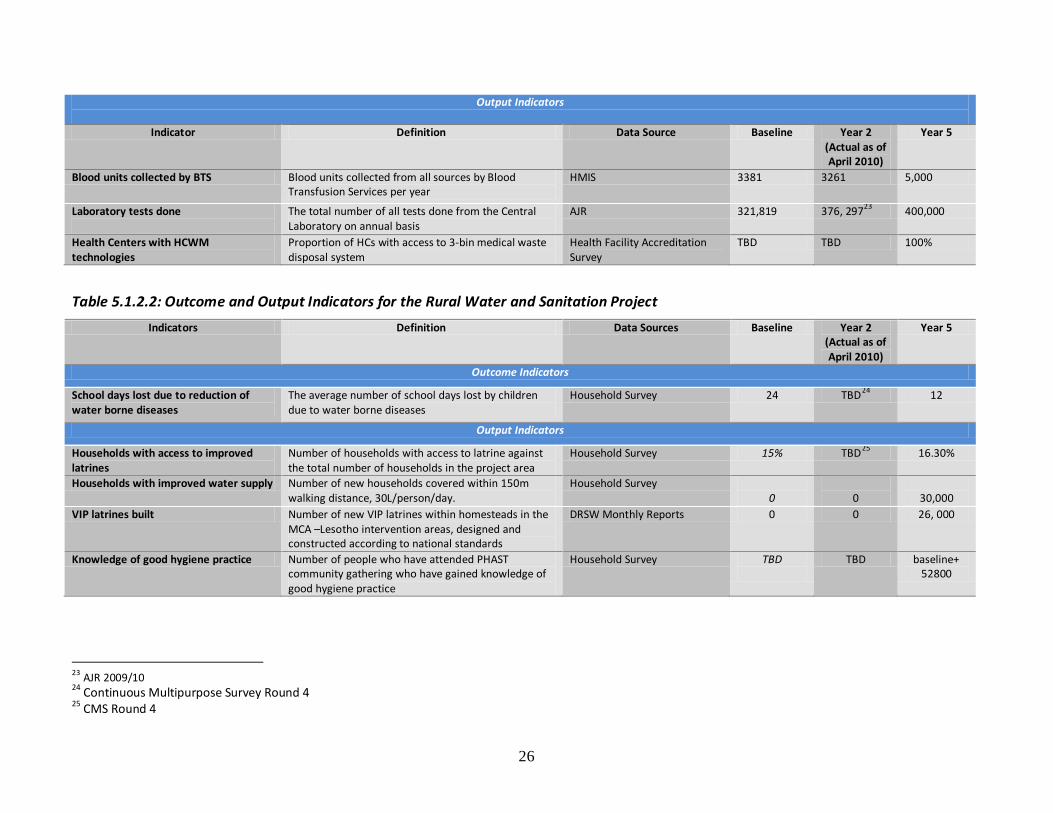
Output Indicators
Indicator Definition Data Source Baseline Year 2 (Actual as of April 2010)
Year 5
Blood units collected by BTS Blood units collected from all sources by Blood Transfusion Services per year
HMIS 3381 3261 5,000
Laboratory tests done
The total number of all tests done from the Central Laboratory on annual basis
AJR 321,819 376, 29723 400,000
Health Centers with HCWM technologies
Proportion of HCs with access to 3-bin medical waste disposal system
Health Facility Accreditation Survey
TBD TBD 100%
Table 5.1.2.2: Outcome and Output Indicators for the Rural Water and Sanitation Project
Indicators Definition Data Sources Baseline Year 2 (Actual as of April 2010)
Year 5
Outcome Indicators
School days lost due to reduction of water borne diseases
The average number of school days lost by children due to water borne diseases
Household Survey 24 TBD24 12
Output Indicators
Households with access to improved latrines
Number of households with access to latrine against the total number of households in the project area
Household Survey 15% TBD25 16.30%
Households with improved water supply Number of new households covered within 150m walking distance, 30L/person/day.
Household Survey 0
0
30,000
VIP latrines built Number of new VIP latrines within homesteads in the MCA –Lesotho intervention areas, designed and constructed according to national standards
DRSW Monthly Reports 0 0 26, 000
Knowledge of good hygiene practice Number of people who have attended PHAST community gathering who have gained knowledge of good hygiene practice
Household Survey TBD
TBD baseline+ 52800
23 AJR 2009/10 24 Continuous Multipurpose Survey Round 4 25 CMS Round 4
27
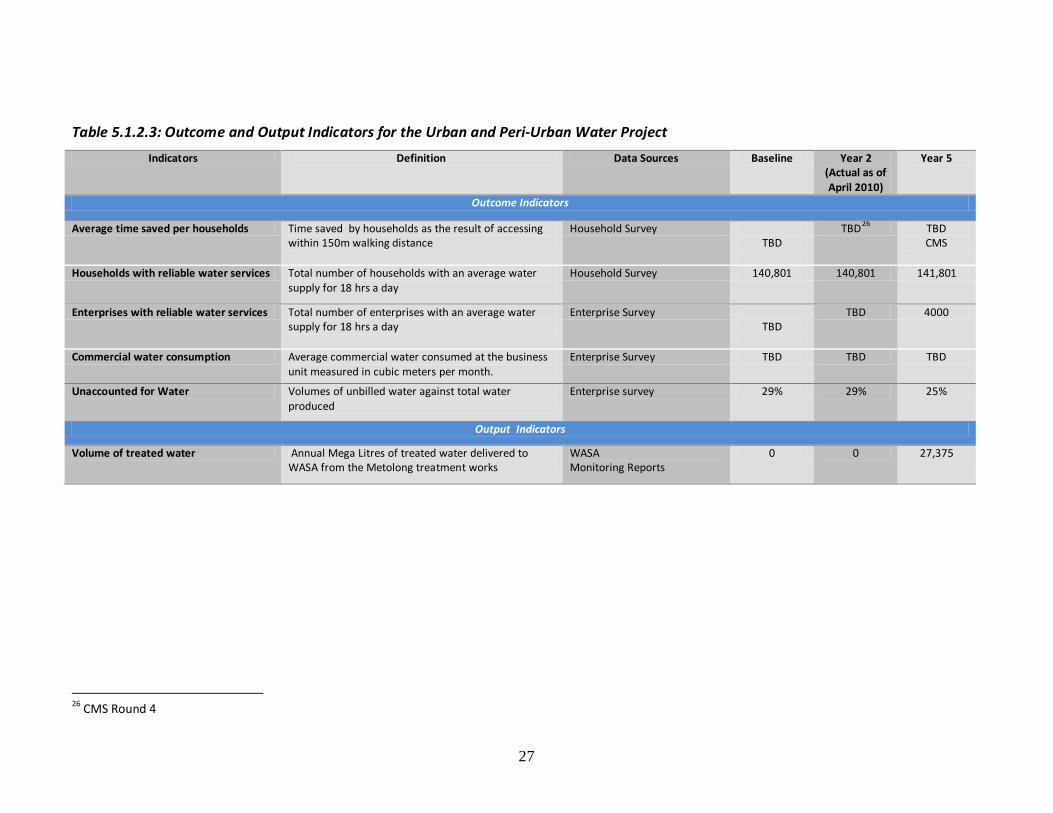
Table 5.1.2.3: Outcome and Output Indicators for the Urban and Peri-Urban Water Project
Indicators Definition Data Sources Baseline Year 2 (Actual as of April 2010)
Year 5
Outcome Indicators
Average time saved per households Time saved by households as the result of accessing within 150m walking distance
Household Survey TBD
TBD26 TBD CMS
Households with reliable water services Total number of households with an average water supply for 18 hrs a day
Household Survey 140,801 140,801 141,801
Enterprises with reliable water services Total number of enterprises with an average water supply for 18 hrs a day
Enterprise Survey TBD
TBD 4000
Commercial water consumption Average commercial water consumed at the business unit measured in cubic meters per month.
Enterprise Survey TBD TBD TBD
Unaccounted for Water Volumes of unbilled water against total water produced
Enterprise survey 29% 29% 25%
Output Indicators Volume of treated water Annual Mega Litres of treated water delivered to
WASA from the Metolong treatment works WASA Monitoring Reports
0 0 27,375
26 CMS Round 4

28
Table 5.1.2.4: Outcome and Output Indicators for the Wetlands Restoration and Rehabilitation Project
Indicators Definition Data Sources Baseline Year 2 (Actual as of April 2010)
Year 5
Outcome Indicators
Grazing Capacity The weighted average number of animals that can be placed on a range land without any harm in the three areas (Lets’eng la Letsie; Kotisphola & Kholong la Lithunya) per year
Wetlands Project Reports
10.5 ha/au/yr
TBD
4.0 ha/au/yr
Area re-vegetation The number of hectors of land where the three areas have been re-vegetated or re-planted
Wetlands Project Reports
0 0 7,195
Output Indicators
People aware of the threats of wetlands Proportion of respondents acknowledging threats to wetlands compared to the total number of respondents
Impact Evaluation Reports 44% 44% 90%
Retention structures Number of construction retention structures in three target areas
Wetlands Project Reports
0 0 195
Table 5.1.2.5: Outcome and Output Indicators for Civil Legal Reform Project
Indicators Definition Data Sources Baseline Year 2 (Actual as of April 2010)
Year 5
Outcome Indicators
Time required to enforce a contract Average number of days taken from filing a payment dispute to full enforcement (settlement) of judgment
World Bank Doing Business Report
695 695 660
Output Indicators
Pending commercial cases Total number of pending cases in commercial courts Commercial Court Register 143 243 50
Cases filed at the commercial court
Total number of cases filed at the commercial court Commercial Court Register 216 427 965
Value of commercial cases
Total value of cases (Maloti) filed in commercial court Commercial Court Register 81,402,989.00 TBD 256,265,550.00
Cases completed under the new small claims procedures
Total number of cases filed and resolved under the new small claims procedures
Commercial Court Register 0 0 194
29
Cases referred to ADR that are successfully completed
Percentage of cases referred annually to Court Annex Mediation
Commercial Court Register 0 0 85%27
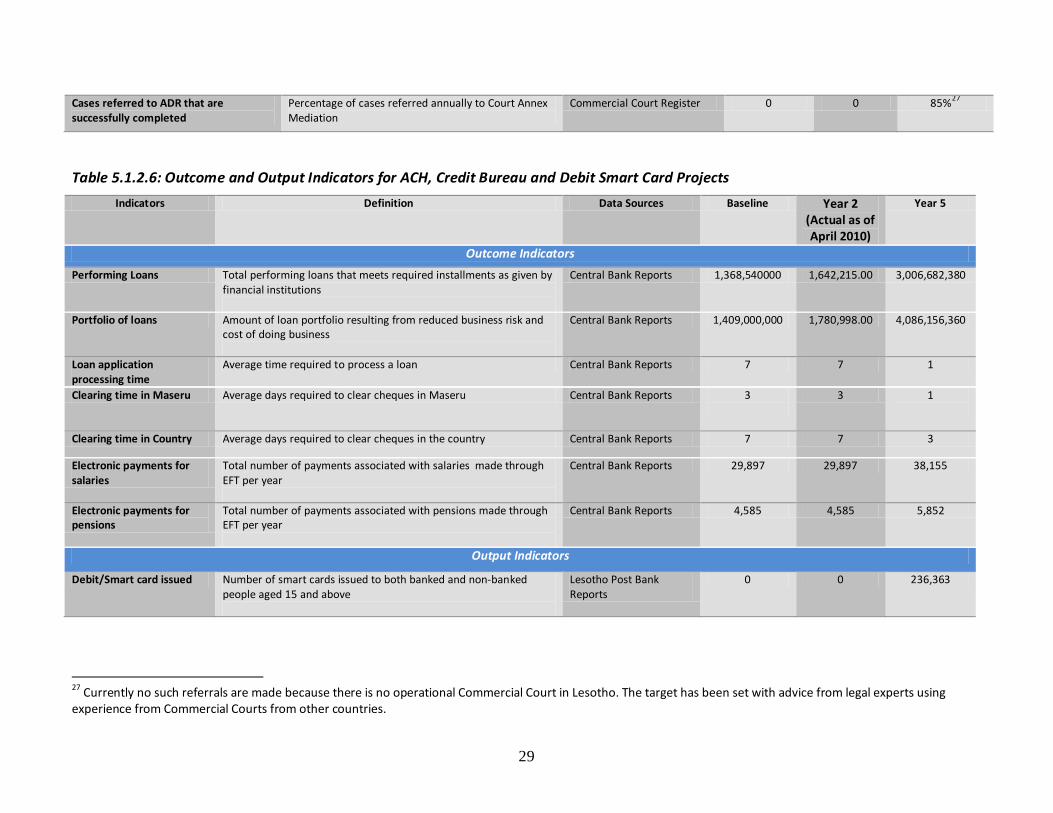
Table 5.1.2.6: Outcome and Output Indicators for ACH, Credit Bureau and Debit Smart Card Projects
Indicators Definition Data Sources Baseline Year 2 (Actual as of April 2010)
Year 5
Outcome Indicators
Performing Loans Total performing loans that meets required installments as given by financial institutions
Central Bank Reports 1,368,540000 1,642,215.00 3,006,682,380
Portfolio of loans Amount of loan portfolio resulting from reduced business risk and cost of doing business
Central Bank Reports 1,409,000,000 1,780,998.00 4,086,156,360
Loan application processing time
Average time required to process a loan Central Bank Reports 7 7 1
Clearing time in Maseru Average days required to clear cheques in Maseru Central Bank Reports 3
3 1
Clearing time in Country Average days required to clear cheques in the country Central Bank Reports 7 7 3
Electronic payments for salaries
Total number of payments associated with salaries made through EFT per year
Central Bank Reports 29,897 29,897 38,155
Electronic payments for pensions
Total number of payments associated with pensions made through EFT per year
Central Bank Reports 4,585 4,585 5,852
Output Indicators
Debit/Smart card issued Number of smart cards issued to both banked and non-banked people aged 15 and above
Lesotho Post Bank Reports
0 0 236,363
27 Currently no such referrals are made because there is no operational Commercial Court in Lesotho. The target has been set with advice from legal experts using experience from Commercial Courts from other countries.

30
Table 5.1.2.7: Outcome and Output Indicators for Land Administration and Reform Project
Indicators Definition Data Sources Baseline Year 2 (Actual as of April 2010)
Year 5
Outcome Indicators
Time to process a lease
Average number of days it takes to process a lease from application to lease registration
World Bank Doing Business 180 180 3028
Mortgage Bonds registered
Number of registered Mortgage Bonds Lands Admin Project Reports 148 29529 1540
Value of registered mortgage bonds
Total annual value of mortgage bonds issued against bank loans and registered at Deeds Registry
Lands Admin Project Reports 1,200,000 1,415,00330 12,486,485
Land parcels regularized and registered
Number of land parcels regularized and issued with leases Lands Admin Project Reports 0 0 55 000
Monetary cost of a lease application
Average administrative cost to title holder to process a lease application
World Bank Doing Business 1,200.00 1,200.00 600.00
Land transactions recorded Total number of leases, transfers, sub-lease agreements, and mortgages transacted at recorded through the digitized system
Lands Admin Project Reports 0 0 10 000
Output Indicators
Stakeholders reached
Number of stakeholders sensitized on land rights and land matters by the Land Administration and Reform Project
Public Outreach Reports 0 141 64,000
Number of Stakeholders trained
Number of stakeholders trained through workshops facilitated by Land Administration and Reform Project
Public Outreach Reports 0 2931 375
28 Based on international practice 29 Deeds Register Report 2008/09 30 Deeds Register Report 2008/09 31 Deeds Register Report 2008/09
31
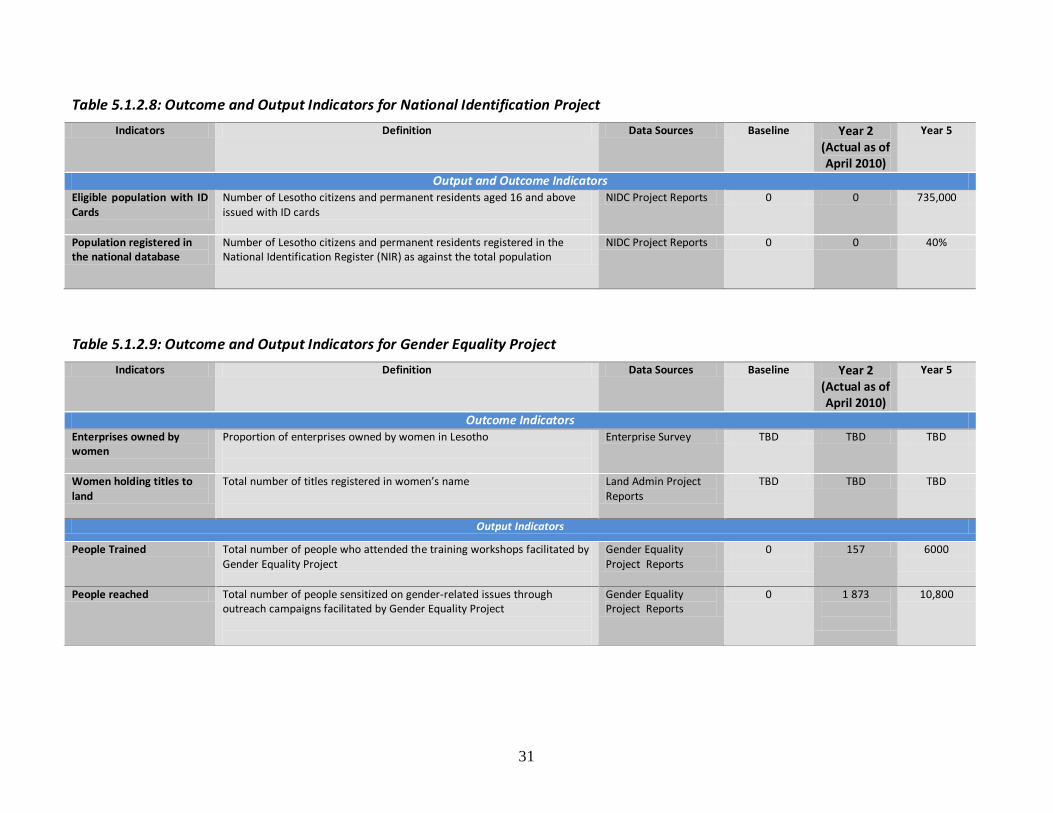
Table 5.1.2.8: Outcome and Output Indicators for National Identification Project
Indicators Definition Data Sources Baseline Year 2 (Actual as of April 2010)
Year 5
Output and Outcome Indicators Eligible population with ID Cards
Number of Lesotho citizens and permanent residents aged 16 and above issued with ID cards
NIDC Project Reports 0 0 735,000
Population registered in the national database
Number of Lesotho citizens and permanent residents registered in the National Identification Register (NIR) as against the total population
NIDC Project Reports 0 0 40%
Table 5.1.2.9: Outcome and Output Indicators for Gender Equality Project
Indicators Definition Data Sources Baseline Year 2 (Actual as of April 2010)
Year 5
Outcome Indicators Enterprises owned by women
Proportion of enterprises owned by women in Lesotho
Enterprise Survey TBD TBD TBD
Women holding titles to land
Total number of titles registered in women’s name
Land Admin Project Reports
TBD TBD TBD
Output Indicators
People Trained Total number of people who attended the training workshops facilitated by Gender Equality Project
Gender Equality Project Reports
0
157 6000
People reached Total number of people sensitized on gender-related issues through outreach campaigns facilitated by Gender Equality Project
Gender Equality Project Reports
0 1 873
10,800

5.1.3. Additional Output and Process Indicators
In addition to the above indicators, regular monitoring and reporting for each of the individual Compact projects will be guided by the Activity Monitoring Plans (AMPs) developed by each Implementing Entity. The AMPs defines a comprehensive list of output indicators and process milestones that will be reported at the level of Project Implementing Unit/Implementing Entity. Information from these indicators will be used to update management and stakeholders on the progress made towards the achievement of the outcomes and subsequently the objectives of each Compact project. The M&E Plan has made provision for resources to support and build the capacity of PIUs/IEs to collect and to report on the output and process indicators as documented in the AMPs.
5.2. Baseline and Targets
The M&E Plan has used established data sources to set baselines for key indicators in the indicator tables. The baselines figures have been derived from various surveys and administrative reports of Government ministries and other Institutions. Baseline data have been cited from the following sources:
a) World Bank Doing Business Report, b) WHO TB Annual Report, c) MOHSW Management Information System and Accreditations Report, d) MOHSW Annual Joint Review Report e) Central Bank of Lesotho Reports, f) Deed Registry Reports g) Bureau of Statistics Surveys Reports h) Wetlands Baseline Survey Reports etc.
The M&E Plan has made a budget provision for establishing collaborations and partnerships with local research institutions and the Bureau of Statistics, which is responsible for conducting national surveys. The collaborations and partnerships are aimed to support commissioning of surveys to finalize baseline data collection for Compact indicators. The surveys that have been identified as sources of baseline include, but not limited to:
a) Continuous Multipurpose Survey (CMS) b) The Enterprise Survey c) The Impact Evaluation Multipurpose Survey (IEMS) d) Impact Evaluation Multi-Purpose Study e) Health Facility Survey f) Land Impact Evaluation Survey

33
To date, the MCA-Lesotho is supporting the Bureau of Statistics to collect baseline information through the CMS specifically focusing of Health and Water and Sanitation. The surveys highlighted above are planned to be implemented by December 2009/January 2011.
The M&E Plan has further projected the targets for each performance indicator throughout the Compact years. The projections were derived from baseline information from feasibility study reports, the initial economic analysis; assumptions for economic benefits expected to be derived from the Compact Projects; existing national surveys; official statistical reports and other sources.
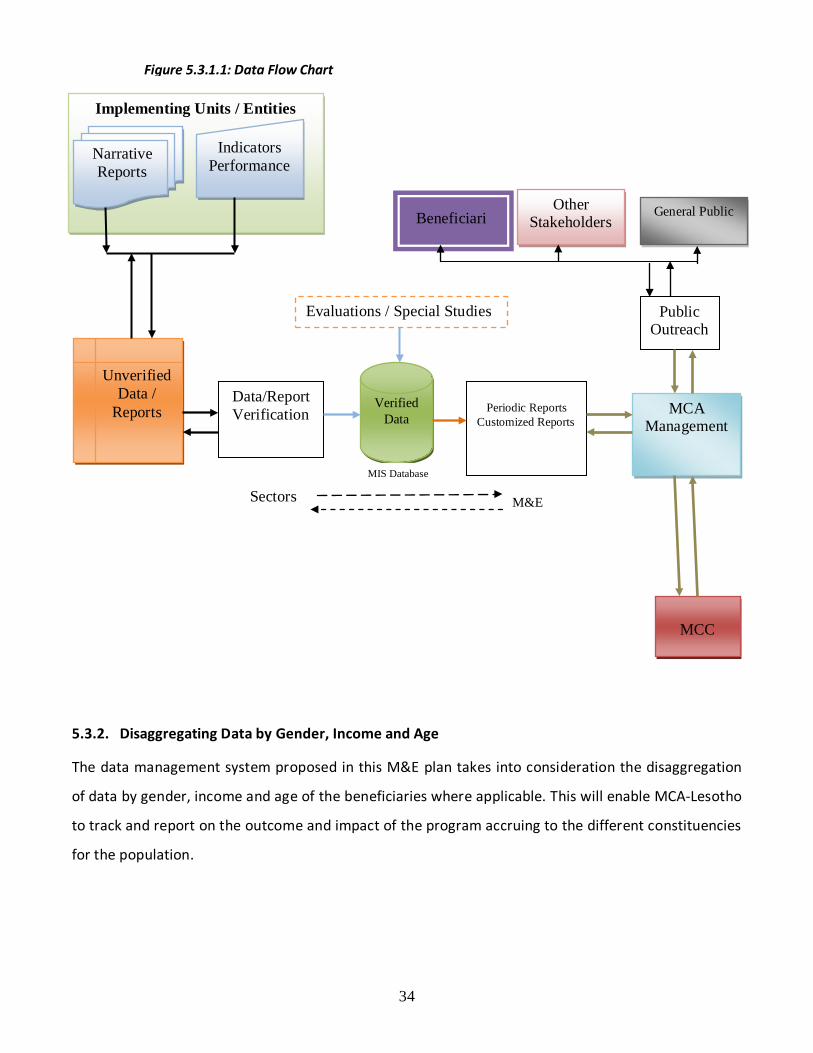
5.3. Data Collection and Reporting System
5.3.1. Data Collection Plan and Data Flow
The M&E plan has made provision to use both qualitative and quantitative methods for collecting data and reporting on results. Tools and instruments for data collection will be developed and established as stipulated in the respective PIU/IE AMPs. These tools and instrument will be part of the reporting framework that has been proposed by the
MCA-Lesotho M&E team (please see Appendix 2); and will be used regularly and systematically to track
the project outcomes, output indicators and process milestones. The MCA-Lesotho M&E have
developed guidelines and procedure that will be associated with the tools and instruments for data
collection tools. This will assist implementing entities and partners in the daily collection of data. MCC
and MCA-Lesotho M&E will provide on-going training and capacity building opportunities for the
Implementing entities and partners in the implementation of the AMPs, including the routine reporting
of data that is generated by their activities. In case of MOHSW the existing HMIS will be adopted to
provide information on quarterly basis. Figure 5.3.1 above illustrates the planned flow of data and
reports into the MCA Lesotho MIS system from and to the various sources / users.
34
5.3.2. Disaggregating Data by Gender, Income and Age
The data management system proposed in this M&E plan takes into consideration the disaggregation
of data by gender, income and age of the beneficiaries where applicable. This will enable MCA-Lesotho
to track and report on the outcome and impact of the program accruing to the different constituencies
for the population.
Implementing Units / Entities
Narrative Reports
Indicators Performance
Verified Data
Unverified Data /
Reports Data/Report Verification
Periodic Reports
Customized Reports MCA
Management
Public Outreach
General Public Other Stakeholders
Sectors MIS Database
M&E
MCC
Beneficiari
Evaluations / Special Studies
Figure 5.3.1.1: Data Flow Chart
35
5.3.3. Methods of Data Collection
The methods of measurement are outlined for each indicator, to ensure uniformity of data collection
across all levels and time. The methods of measurement were jointly designed by MCC and MCA-
Lesotho M&E sections. They include the following:
a) Data compilation from program reports
b) Record abstraction from Key monitoring reports
c) Interviews with key informants
d) Review of national documents
e) Health facility surveys
f) HMIS records
g) PIU/IE periodic progress reports
h) Population-based and target group surveys
i) Special studies
j) Modeling/estimation
k) Surveillance
Program activity level indicators will generally be measured using data collected as outlined in the
respective AMPs. The information collected about programme activities will be used to ensure quality
assurance, compliance with program design, and programme consistency across programme sites.
Special studies and operations research complement both record reviews and interviews to provide in-
depth information for programme planning. Outcome level indicators of behavior change will be
measured using data collected through population based surveys, which will be highly stratified, or
targeted. Impact level indicators will, on the other hand, be measured using population-based surveys,
censuses, health information system records of morbidity and mortality, and special studies.
5.3.4. Frequency for Data Collection
Data will be collected by the implementing entities throughout Compact implementation. Monitoring
data will be collected continuously or periodically depending on the type of indicators being measured,
while evaluation data will be collected at baseline, mid-term and at the end of the compact.
36
The M&E plan makes provision for routine and periodic data collection. Process and output indicators
will be collected and reported by the implementing entities on quarterly and annual basis. Outcome
and impact data will be collected periodically through surveys and special studies. Household surveys
with relevant data for the monitoring and evaluation of the Compact project will be carried out three
times in the five years of project implementation - baseline, mid-term review and end of the project.
Other surveys will be conducted twice in five years; these include the DHS, enterprise survey and the
community profiling survey.
5.3.5. Responsible Entity for Data Collection
The MCA-Lesotho M&E Section will be responsible for supervision, coordination, consolidation and
analysis of data collected for all the projects. It will manage the data base and produce quarterly,
annual, mid-term, and end of the project reports. Products for information dissemination will be the
responsibility of MCA-Lesotho. MCA-Lesotho will also be responsible for special surveys that are not in
the pipeline for the BOS or the implementing entities.
5.3.6. Coordination of M&E Data Collection
MCA Lesotho M&E intends to establish and maintain as much as possible partnerships among in-
country and international partners who are involved in poverty reduction. It is important that all
partners working under Lesotho Compact project work in a harmonious and complementary way.
MCA-Lesotho will participate in M&E partnerships to deliberate on M&E issues of common interest to
the all partners. The M&E Technical Committee will be responsible for the management and
supervision of the M&E system for the all project. This includes gathering of activity level performance
indicators i.e. input, processes, outputs and some outcomes, storage and production of information.
This will be carried out in support of PIUs, implementing entities and will be guided by monitoring and
evaluation plans.
37
MCA-Lesotho has also signed an Implementing Entity Agreement with the Bureau of Statistics (BOS) in
March 2009 worth US$ 2,728,745.00. The Bureau will provide support to MCA-Lesotho in the form of
collecting, processing and analyzing key data for measurement of performance of the Lesotho
Compact. MCA Lesotho will also provide technical support and benefit from the WASA, satisfaction
surveys; and the HSS and HFS implemented by MOHSW. In addition MCA Lesotho will engage DRWS
for possibilities of implementing a similar satisfaction survey.
5.3.7. Data Quality Review
External and internal data quality review is proposed as part of the M&E Plan. MCA Lesotho will
conduct both external and internal data quality reviews to regularly assess the quality of performance
indicators data and the data collection methods. Data quality reviews will be used to verify the
consistency and quality of data over time across the Bureau of statistics, implementing agencies and
other reporting institutions. The objective of data quality review is to verify the quality and consistency
of performance data over time, across different implementing entities, and reporting institutions.
In particular, the DQA will assess the extent to which the Compact data meets the standard data
quality aspects including relevance, validity, accuracy, reliability, timeliness, precision, and integrity.
The external data quality reviews will be conducted three times during the compact period i.e. the first
year, mid-term and towards the end of Compact implementation. This will focus mainly on data
collected by implementing agencies. The M&E Coordinator will be responsible for contracting
independent data quality reviewers in compliance with MCC procurement procedures. The M&E unit
will also conduct ad hoc and planned checks for data quality through field visits and as it will be
deemed necessary.

38
6. Reporting and Communication of M&E Results
6.1. Reporting within the Program
The MCA-Lesotho M&E Section has proposed a reporting framework for guiding progress and
performance reporting for Lesotho Compact. In this Framework, the PIUs/IEs are mandated to report
data on their activities through the proposed MIS on a monthly basis. They will also provide quarterly
narrative reports detailing the progress, successes, challenges and lessons learned to MCA-Lesotho.
The MCA-Lesotho M&E section will be responsible for providing updates on processes on a bi-weekly
basis. Regular and periodic Progress Reports will be provided to management on a monthly and
quarterly basis. Progress reporting refers to tracking the on-going “actual” progress of Project and
Activity indicators against “targeted” progress. The Progress Reports will serve as a vehicle by which
the MCA-Lesotho Management informs MCA-Lesotho Board of the implementation status.
Progress Reports will include data on the indicators described in the Monitoring Component and
analysis of those data. The analysis will compare the actual results to the indicator targets and
determine the reason for variation from projections. Progress Report alerts the MCA-Lesotho and MCC
to any problem and serve as the basis for recommending changes to project or activities. The quarterly
performance assessment provides for each indicator the baseline, targets and results. The assessment
also includes comments on data quality reviews and other unanticipated, negative and positive results.
6.2. Reporting to MCC
MCA-Lesotho is required as part of the Program Implementation Agreement with MCC to provide
quarterly and annually to MCC. MCC’s Reporting Guidelines describe the necessary content of these
Periodic Reports and their due dates. MCC has provided MCA-Lesotho with the guidelines and formats
for the regular performance report. The required performance reports include the tracking of on-going
“actual” progress of Project and Activity indicators against “targeted” progress. These reports, in
addition to other reporting requirements in the QDRP, serve as a vehicle by which the MCA-Lesotho
Management informs MCC of implementation progress, impediments, lessons learned, best practices
and on-going field revisions to Project work plans.

39
Quarterly ITT Reports include data on the indicators described in the Monitoring Component and
analysis of those data. The analysis will compare the actual results to the indicator targets and
determine the reason for deviations from projections (above a certain threshold).
7. Participatory Monitoring and Evaluation
The M&E plan shall outline a process for encouraging participation of program stakeholders in the
collection and dissemination of the information about progress being made towards the achievement
of the program objectives. The effectiveness and efficiency of the program will be jointly monitored
with the beneficiary population and various stakeholders at different levels of decision-making. The
M&E plan will foster national “ownership” of the program and will periodically disseminate program
results and achievements through transparent strategies and a format of communication with the
public.
8. Consultative Process
Consultative activities involve representative participation of direct beneficiaries, civil society
organizations, non-government organizations, microfinance institutions and other stakeholders. MCA-
Lesotho will organize consultative meetings and workshops to discuss evaluation reports and findings
from specific special studies. In such meetings, all relevant stakeholders will be involved.
9. Management Information System
The M&E Plan has proposed the development of an information system that will be used to collect
data, store, process and deliver information to relevant stakeholders in such a way that the program
information is at all times accessible and useful to those who wish to use it.
40
The system development will take into consideration the data requirement for the different
components of the Compact, and will be aligned with MCC existing systems, and with that of other
relevant service providers and government ministries.
A multifunctional Management Information System (MIS) will be designed, which will compile, store,
maintain and distribute the multi-dimensional Lesotho Compact project monitoring data sets. As
described in the previous sections, the datasets include poverty reduction, employment, access to
water, provision of health services, financial and investment data. The system will track progress made
and assist assessment of the impact for each of the three project components on the beneficiaries,
based on the indicators agreed by MCA-Lesotho, MCC and implementing entities. The Management
Information System will be a web-based system with a back up storage and will be linked a GIS system,
also to be developed. The MIS will as much as possible and applicable link to existing systems within
the BOS and MOHSW.
10. Special Studies
MCA-Lesotho has developed a framework for guiding the design and implementation of Special
Studies. The MCA-Lesotho Strategy for Special Studies is planned to serve as an instrument for guiding
the planning and implementation research activities that aim at obtaining an in-depth understanding
of the underlying factors to the observed results, and challenges, as they unfold in course of
implementation of the Compact.
The studies will aim at undertaking more targeted and in-depth analyses of specific project issues to
provide reasons for observed trends, and changes and to clarify the inherent relationship between
project evaluation and implementation. The specifics of the Special Studies to be implemented are
detailed in the Strategy.
41
11. Evaluation
Compact Evaluation is the periodic review and assessment of the relevance, efficiency, effectiveness,
impact and sustainability of the compact intervention and investment on the targeted beneficiaries
and the national economy. The M&E plan describes Evaluations that will be conducted to provide
information on the outcome and impact of the Compact. The Evaluations will provide MCC and MCA
Lesotho stakeholders information on whether or not the outcomes are likely to be achieved and are
attributable to the intervention strategies proposed for the Compact.
MCA-Lesotho and MCC will prepare an evaluation framework for all evaluations of the Compact. All
evaluations will be guided by the core documentation for the Compact activities including the Compact
design documents, Compact Implementation plan, work plans, and the evaluation framework that will
state clearly and specifically the purpose and scope of the evaluation.
There will be a detailed scope of work for all planned evaluations. The Scope of Work (SOW) for each
evaluation will set out what the evaluation will measure and how it will be conducted. The SOW will
further specify the purpose and the target audience for the evaluation, the main evaluation questions,
the indicators to be measured, the data collection methods, a schedule of activities, budget and the
expected outcomes and impacts. Terms of references for contracting consultants for each evaluation
will be prepared by the MCA-Lesotho M&E section and approved by MCC.
There will be four programme evaluations for the Compact:
11.1. Initial or Ex-Ante Evaluation
Part of this evaluation has already been done by MCC and MCA – Lesotho. An Economic Analysis
estimating the Economic Rate of Returns (ERR) were calculated for all the projects. Cost and benefit
analysis have been conducted ex-ante. The rates of return for the ex-ante economic analysis are
already cited in the first section of the M&E Plan. Assumption about the Compact implementation and
the existence of benefit streams and outcomes has been estimated for the Compact.

42
Baseline measures will be constructed and appropriate data will be gathered before the
commencement of the Compact activities implementation.
11.2. Mid-Term Evaluation
MCA-Lesotho in consultation with MCC will commission mid-term evaluation of the Compact. The main
purpose of the mid-term evaluation is to find out the effectiveness of the implementation strategy. The
mid-term evaluation will also assess to what extend the intervention is leading to change in the
outcome indicators. This evaluation will address the following questions:
i. Are the approaches adopted for implementation effective and efficient?
ii. Are Compact activities systematically leading to the desired change?
iii. Is the program making difference in terms of changes in knowledge, attitude, skills,
behavior and practice?
This level of evaluation will also respond to the following issues:
a. Relevance – Is the program addressing the right problems with the right approach taking
into consideration core mandate responsibilities of MCA-Lesotho and national policies?
‘Meeting the real needs of beneficiaries.’
b. Outcomes - the extent to which are outputs resulting into the achievement of the purpose
or component purposes or objectives
c. Effectiveness - extent to which an operation has attained its objectives
d. Coverage and targeting - have targets been met or are they likely to be met; are the right
people benefiting at the right time? ‘Meeting the right needs.’
e. Sustainability – Are there adequate plans to foster self-reliance and continued utilization of
services after completion. ‘Continuation without outside help.’
f. Connectedness – Is the operation responding to acute and immediate needs, as well as
taking longer-term needs and problems into account.

43
The mid-term evaluation will be conducted at the end of year three of the project. It will focus on the
implementation process and short-to-medium term changes and will serve as a useful tool to inform
program management about necessary recourse to be undertaken in order to ensure that the set
objectives are met. It remains critical to track performance on a continuous basis in order to provide
feedback to management so as to identify positive impacts to be reinforced as well as negative impacts
to be mitigated through modification of design and implementation. It is important to note that
recommendations from the mid-term evaluation may lead to a review of the Compact design and/or a
change in implementation strategy.
11.3. Final Program Evaluation
The final program evaluation will be conducted at Compact Close-Out period by independent
evaluators in combination with project management and MCC sector leaders. The focus will be on the
progress towards outcomes and sustainability of the Compact Projects. The final program evaluation
will address the following:
a. The extent to which targets, outcomes and objectives are being achieved;
b. Positive and negative unplanned results of the programme;
c. Effectiveness of programme activities;
d. Success stories and most significant changes attributed to Compact activities;
e. Lessons learned and best practices in project implementation;
f. Comparative analysis of projected against final economic rates of return on projects and;
g. Final beneficiary analysis and income distribution.
11.4. Impact Evaluation
There will be evaluation of selected projects that have been determined in consultation with in country
stakeholders and implementing partners to have the strongest potential for rigorous impact
evaluation. The Impact evaluations attempt to measure and demonstrate cause-and-effect.
44
MCC has engaged an independent consultant to carry out impact evaluation studies. The independent
consulting firm, National Opinion Research Center (NORC) of the University of Chicago, has adopted a a
rigorous impact evaluation methodologies for the health and water projects. The methodologies will
attempt to measure or estimate the counterfactuals of the selected projects in order to assign
attribution of impacts. The impact evaluation will establish a causal relationship between program
interventions and observed changes in impact and outcome indicators by comparing the beneficiaries
of the Program to a comparison group. This will cover evaluation methods consistent with MCC M&E
Guidelines, benefits, and challenges.
The following are a summary of the potential impact evaluation methodologies adopted for various
sectors:
A. Health Sector Project Evaluation
The health sector project evaluation covers data collection methodology, sampling and data analysis.
The impact evaluation of the health sector includes; evaluating the renovation of health centres and
evaluating the established ART clinics and improved management in hospitals.
Hypotheses to be tested by evaluation are stated as follows;
i. Will the health infrastructure activities
a. increase the number of individuals receiving essential health services
b. improve individuals’ health outcomes
ii.Will the health improvements resulting from improved infrastructure increase
beneficiary productivity and health income
These hypotheses will be examined together with a whole list of indicators stated within the M&E Plan.
The evaluation method to be adopted is Randomization. These hypotheses may require further
refinement in collaboration with MOHSW, MCA-Lesotho and MCC.
45
B. Rural Water Supply and Sanitation Project Evaluation Design
The Rural Water Supply and Sanitation (W&S) Projects could be evaluated using rigorous randomized
design methods. In the rural water component, communities could be selected randomly over time to
allow for comparison between unbiased control and treatment groups. The phased-in randomization
design described above for the health centres is recommended also for the rural water and sanitation
projects.
The hypotheses to be tested are:
i. The rural water supply and sanitation activity will:
a. reduce water-related health problems
b. provide time-savings
ii. Time savings from an improved water supply increase beneficiary productivity and
incomes
iii. Improve economic activities due to time saved from collecting water.
iv. Health improvements resulting from an improved water supply increase beneficiary
productivity and incomes
v. The VIP latrines are actually being used as intended and if hygiene issues are being
dealt with by the community, such hand washing.
Because 174 of the 250 water projects have been fully designed and are ready for implementation, the
evaluation may need to take place in two stages. An initial public randomization could be held for the
174 projects, with the remaining 76 projects addressed at a later date. Time constraints may not allow
for a randomized comparison within the 76 later projects and comparison with the original projects
may introduce selection bias.
Consideration will be given to those villages where both rural water supply activities and health center
renovations will be undertaken. This might allow for the interaction affect between water supply and
health center services to be examined.

46
A few key assumptions underlie this design and will need to be perused further before the evaluation
design is finalized. An underlying assumption that there are no significant differences between the
types of systems (hand pump, gravity fed, etc) since they all aim to provide the same quantity and
quality of water per capita.
C. Urban and Peri-Urban Water Network Project Evaluation Design
(i) The following hypotheses will be tested regarding the Urban and Peri-Urban Project:
i. The urban/Peri- Urban water supply project will:
a. Increase enterprise activity (number of enterprises, number of jobs, wages,
and profits)
b. Provide time savings
ii. Time savings from an improved water supply increase beneficiary productivity and
incomes
(ii) Two key options will be considered for impact evaluation of the Urban/ Peri-Urban
Water Network Project:
1. Water availability for 18 or more hours in the Urban and Peri-Urban areas
2. New enterprises opened with employment opportunities created.
(iii) Data for Evaluation of the Urban and Peri-Urban Water Network Activity
1. A regression discontinuity evaluation: The Water and Sewer Authority (WASA) uses
a “distance from main” standard to determine the connection fee for a particular
household or business. The fees are set on a step scale, however; specific distances
and rates need to be confirmed. The rate of household connections may
significantly differ along the boundary between the rate levels; however, households
near either side of the line are unlikely to differ except for their likelihood of having
a household water connection.
47
Therefore, differences in water usage and the other outcomes between these two
groups can be largely attributed to the higher rate of household water connections.
2. A difference-in-difference evaluation. This will be considered with a particular focus
on enterprise activity in areas with newly extended or improved water service.
D. The Land Impact Evaluation Study
MCA-Lesotho is the process of contracting a research institution to carry out rigorous impact
evaluations for the Land Reform and Administration Project. The impact evaluation for the Land
Project will establish the nature and extent of causal relationships between program interventions. It
will also investigate changes on key the outcome and impact of the Project interventions on
beneficiaries.
The evaluations shall test the following key economic hypotheses associated with the project:
i. Reduction in the financial and time burden of conducting land transaction with LAA
ii. Reduction in time for land conflict Resolution
iii. Increased number of land parcels used as collateral for mortgage by the 55,000 urban
household having formally recognized titles to land assets.
iv. Increased investment in the property, increased frequency of transfers, subletting,
rentals, and other economic activities among the 55, 000 urban household having
leases.
v. Increased base case mortgage lending volume
vi. increased land values for the 55,000 urban household with formally recognized titles
vii. Reduction in land related conflicts within the areas where there has been intervention/
amongst the 55 000 lease holders.
viii. Increase in income of beneficiaries

48
The evaluation will be divided into two phases; 1) Outreach and Planning; and 2) Implementation. In
Phase I, the impact evaluation team will work with MCC, MCA-Lesotho, Lesotho Land Implementing
Entities, and any relevant local partners to conduct outreach, develop the impact evaluation design,
develop a work plan, and prepare for implementation. In Phase II, will entail the data collection, data
quality, analysis of the information, and documentation of relevant findings in impact evaluation
reports
12. Hypotheses and Risks
The program logic for the MCA-Lesotho Compact is based on Hypotheses about the linkages between
individual Project activities and the long term Goal of economic growth and poverty reduction. The
following table depicts factors that have been identified, that could influence or affect the progress
and projected benefits of the program.
Table 12.1: Program Hypotheses, Risks and Mitigation Measures
ACCESS TO HEALTH
Hypotheses Risks Mitigation
Provision of health infrastructure will augment the existing health services and improve the health status of all Basotho.
Acute shortage of health care professionals coupled with lack of sound retention strategies
Establishment and filling of positions for health professional to meet the demand for health services.
Development and implementation of a sound human resource retention strategy to reduce drainage
Improved collaboration with all stakeholders – NGO’s, other government departments especially Ministry of Health & Social Welfare (Environmental Health) will enhance performance
Poor cooperation among stakeholders – NGO’s may have negative impact
Establish a stakeholders forum and hold regular meetings and workshops to identify areas of collaboration and responsibilities before and during the implementation phase
ACCESS TO WATER AND SANITATION
Hypotheses Risks Mitigation
Improved access to water and sanitation will reduce water borne diseases, and promote industrial investment for local and foreign firms, thereby improving quality of life and increasing employment
Acute shortage of transport may seriously hamper effective program implementation
Adequate provision of transport for improved service delivery
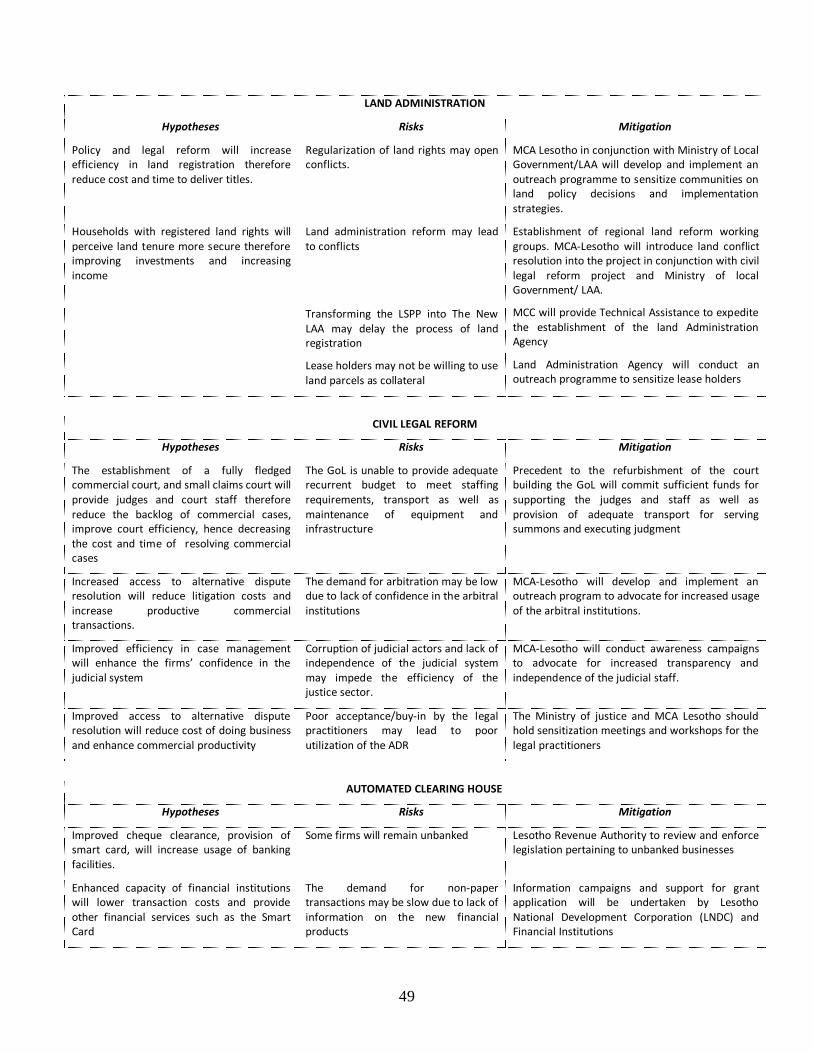
49
LAND ADMINISTRATION
Hypotheses Risks Mitigation
Policy and legal reform will increase efficiency in land registration therefore reduce cost and time to deliver titles.
Regularization of land rights may open conflicts.
MCA Lesotho in conjunction with Ministry of Local Government/LAA will develop and implement an outreach programme to sensitize communities on land policy decisions and implementation strategies.
Households with registered land rights will perceive land tenure more secure therefore improving investments and increasing income
Land administration reform may lead to conflicts
Transforming the LSPP into The New LAA may delay the process of land registration
Lease holders may not be willing to use land parcels as collateral
Establishment of regional land reform working groups. MCA-Lesotho will introduce land conflict resolution into the project in conjunction with civil legal reform project and Ministry of local Government/ LAA.
MCC will provide Technical Assistance to expedite the establishment of the land Administration Agency
Land Administration Agency will conduct an outreach programme to sensitize lease holders
CIVIL LEGAL REFORM
Hypotheses Risks Mitigation
The establishment of a fully fledged commercial court, and small claims court will provide judges and court staff therefore reduce the backlog of commercial cases, improve court efficiency, hence decreasing the cost and time of resolving commercial cases
The GoL is unable to provide adequate recurrent budget to meet staffing requirements, transport as well as maintenance of equipment and infrastructure
Precedent to the refurbishment of the court building the GoL will commit sufficient funds for supporting the judges and staff as well as provision of adequate transport for serving summons and executing judgment
Increased access to alternative dispute resolution will reduce litigation costs and increase productive commercial transactions.
The demand for arbitration may be low due to lack of confidence in the arbitral institutions
MCA-Lesotho will develop and implement an outreach program to advocate for increased usage of the arbitral institutions.
Improved efficiency in case management will enhance the firms’ confidence in the judicial system
Corruption of judicial actors and lack of independence of the judicial system may impede the efficiency of the justice sector.
MCA-Lesotho will conduct awareness campaigns to advocate for increased transparency and independence of the judicial staff.
Improved access to alternative dispute resolution will reduce cost of doing business and enhance commercial productivity
Poor acceptance/buy-in by the legal practitioners may lead to poor utilization of the ADR
The Ministry of justice and MCA Lesotho should hold sensitization meetings and workshops for the legal practitioners
AUTOMATED CLEARING HOUSE
Hypotheses Risks Mitigation
Improved cheque clearance, provision of smart card, will increase usage of banking facilities.
Some firms will remain unbanked Lesotho Revenue Authority to review and enforce legislation pertaining to unbanked businesses
Enhanced capacity of financial institutions will lower transaction costs and provide other financial services such as the Smart Card
The demand for non-paper transactions may be slow due to lack of information on the new financial products
Information campaigns and support for grant application will be undertaken by Lesotho National Development Corporation (LNDC) and Financial Institutions
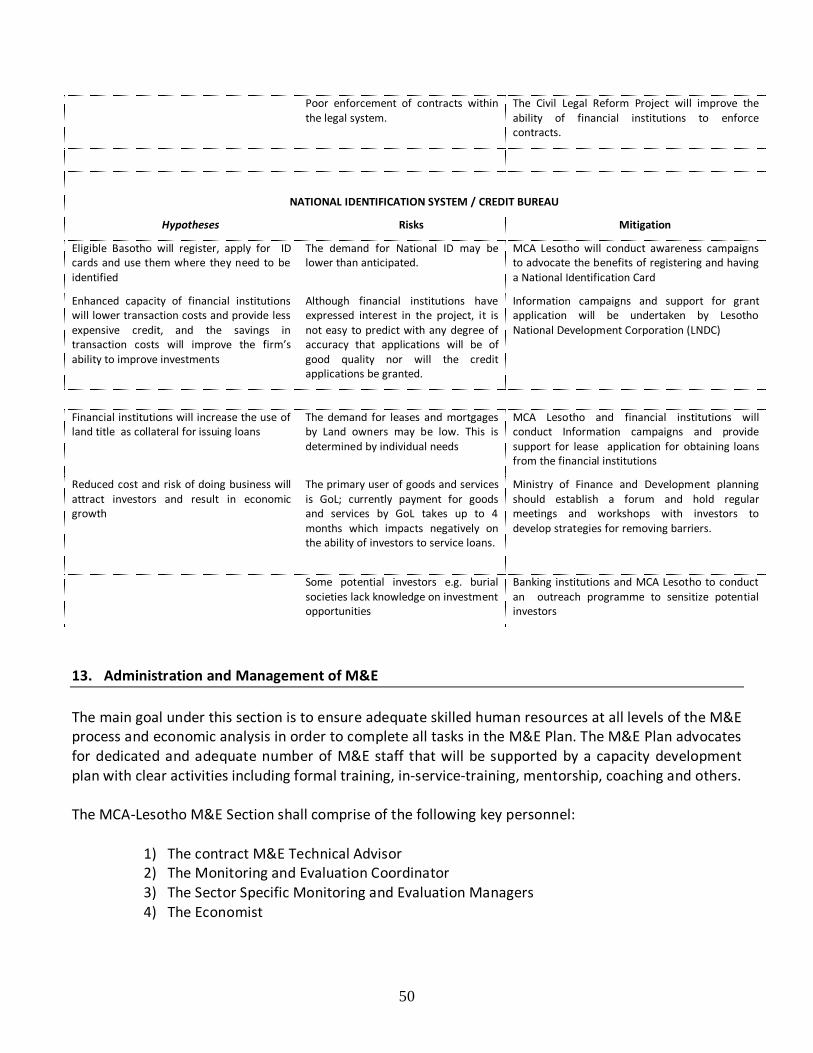
50
13. Administration and Management of M&E
The main goal under this section is to ensure adequate skilled human resources at all levels of the M&E process and economic analysis in order to complete all tasks in the M&E Plan. The M&E Plan advocates for dedicated and adequate number of M&E staff that will be supported by a capacity development plan with clear activities including formal training, in-service-training, mentorship, coaching and others. The MCA-Lesotho M&E Section shall comprise of the following key personnel:
1) The contract M&E Technical Advisor 2) The Monitoring and Evaluation Coordinator 3) The Sector Specific Monitoring and Evaluation Managers 4) The Economist
Poor enforcement of contracts within the legal system.
The Civil Legal Reform Project will improve the ability of financial institutions to enforce contracts.
NATIONAL IDENTIFICATION SYSTEM / CREDIT BUREAU
Hypotheses Risks Mitigation
Eligible Basotho will register, apply for ID cards and use them where they need to be identified
The demand for National ID may be lower than anticipated.
MCA Lesotho will conduct awareness campaigns to advocate the benefits of registering and having a National Identification Card
Enhanced capacity of financial institutions will lower transaction costs and provide less expensive credit, and the savings in transaction costs will improve the firm’s ability to improve investments
Although financial institutions have expressed interest in the project, it is not easy to predict with any degree of accuracy that applications will be of good quality nor will the credit applications be granted.
Information campaigns and support for grant application will be undertaken by Lesotho National Development Corporation (LNDC)
Financial institutions will increase the use of land title as collateral for issuing loans
The demand for leases and mortgages by Land owners may be low. This is determined by individual needs
MCA Lesotho and financial institutions will conduct Information campaigns and provide support for lease application for obtaining loans from the financial institutions
Reduced cost and risk of doing business will attract investors and result in economic growth
The primary user of goods and services is GoL; currently payment for goods and services by GoL takes up to 4 months which impacts negatively on the ability of investors to service loans.
Ministry of Finance and Development planning should establish a forum and hold regular meetings and workshops with investors to develop strategies for removing barriers.
Some potential investors e.g. burial societies lack knowledge on investment opportunities
Banking institutions and MCA Lesotho to conduct an outreach programme to sensitize potential investors
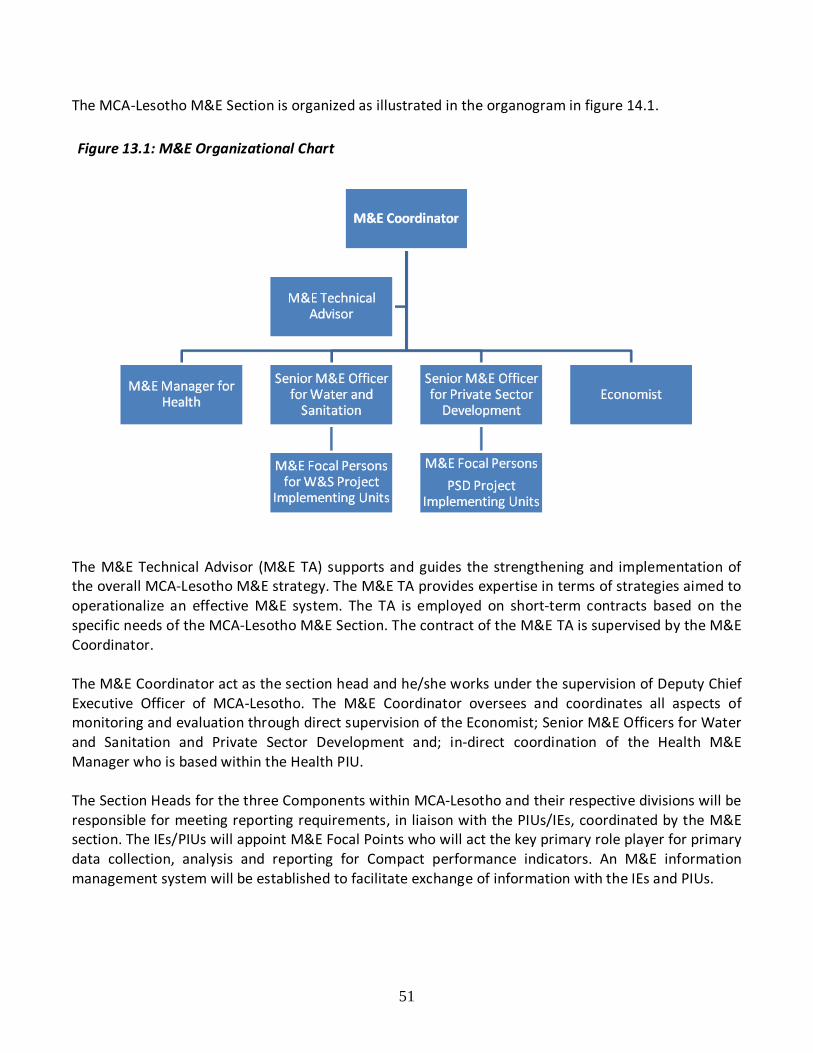
51
The MCA-Lesotho M&E Section is organized as illustrated in the organogram in figure 14.1.
The M&E Technical Advisor (M&E TA) supports and guides the strengthening and implementation of the overall MCA-Lesotho M&E strategy. The M&E TA provides expertise in terms of strategies aimed to operationalize an effective M&E system. The TA is employed on short-term contracts based on the specific needs of the MCA-Lesotho M&E Section. The contract of the M&E TA is supervised by the M&E Coordinator. The M&E Coordinator act as the section head and he/she works under the supervision of Deputy Chief Executive Officer of MCA-Lesotho. The M&E Coordinator oversees and coordinates all aspects of monitoring and evaluation through direct supervision of the Economist; Senior M&E Officers for Water and Sanitation and Private Sector Development and; in-direct coordination of the Health M&E Manager who is based within the Health PIU. The Section Heads for the three Components within MCA-Lesotho and their respective divisions will be responsible for meeting reporting requirements, in liaison with the PIUs/IEs, coordinated by the M&E section. The IEs/PIUs will appoint M&E Focal Points who will act the key primary role player for primary data collection, analysis and reporting for Compact performance indicators. An M&E information management system will be established to facilitate exchange of information with the IEs and PIUs.
Figure 13.1: M&E Organizational Chart
52
14. Responsibilities for M&E The primary MCA-Lesotho monitoring and evaluation responsibilities will be:
prepare and review detailed monitoring and evaluation plan modify the monitoring and evaluation plan as necessary co-ordinate with implementing agencies regarding collection of data prepare monitoring and evaluation reports for MCC maintain monitoring and evaluation data base and incorporate it into the national
accounting system ensure that all monitoring and evaluation reports are published in the MCA website manage contracts with local and international consultants for monitoring and evaluation
services maintain quality and quantity of deliverables co-ordinate special studies and ad hoc evaluations as necessary oversee program and project activities as well as data quality reviews disseminate information on lessons learned and best practices
M&E Coordinator’s responsibilities are:
Establishing the on-going monitoring and evaluation system Developing and supervising an on-going monitoring and evaluation strategy Ensuring that M&E plan is modified and updated as improved information becomes
available (updating indicators, baseline and targets upon the receipt of information from technical studies and in-take surveys)
Ensuring that management staff and implementing entities are receiving adequate support to execute their M&E responsibilities (providing monitoring and evaluation training of MCA Management staff and program implementers)
Overseeing data collection from all sources, and the design of a data management system Participating in the monitoring of performance of individual program components directly
through project visits, reviewing project reports, and reviewing secondary data and analysis Preparing Terms of Reference and conducting procurement of various M&E contracts
(Management Information Systems, data quality review etc.) Organizing and overseeing data quality audits Develop a schedule for interim program evaluations and process for selecting independent
evaluators Cooperating with third party Impact Evaluation specialist(s) for the design, implementation
and dissemination of the interim and final Program Evaluation Publishing periodical reports of the ongoing program monitoring and evaluation that are
submitted to MC-Lesotho’s board and MCC, and making them publicly available on the MCA-Lesotho website
53
Sector Specific Senior M&E Officers responsibilities are to:
Develop and implement and review the monitoring plan Establish the data collection, analysis and reporting system for the overall program. Provide technical support for the PIU M&E personnel on data management Ongoing review of quality of data collected by Project Implementing entities Coordinate reporting process on key performance indicators Identify specific needs for primary data collection processes Develop the M&E Management of Information System Participate in monitoring of each project through site visits Coordinating regular public outreach to stakeholders, NGO’s and other elements of civil
society regarding program design and impact, as a part of the larger ongoing consultative process
The Economist is responsible for:
Undertake economic analysis to provide economic, quantitative justification and rationale
for each Compact project to management Measure and update the Compact’s Projects’ economic rate of return and beneficiary
analysis Communicate to stakeholders economic logic and impact on economic growth for Compact
Projects Build library of economic research results Coordinate the design and implementation of socio-economic surveys Participate in the implementation of baseline, impact evaluations and Special Studies
54
15. Human Capacity Building on M&E
Within the first year of implementation of this plan, the essential M&E staff will be provided with the following set of competencies:
1. Knowledge of the national M&E Plan (including “3 ones” concept) 2. Skills in using data collection tools 3. Knowledge of Basic M&E concepts 4. Positive attitude of M&E oriented towards the production and dissemination of strategic
information 5. Advanced skills in excel (esp. formulas and graphics, including pivot tables) 6. Skills in using electronic databases 7. Basic skills and knowledge in data analysis 8. Knowledge on data quality concepts and skills in conducting data quality assessment
In the remaining 3 years of implementation of the M&E Plan, it is expected to replicate the activities oriented at ensuring that basic competencies are built in new M&E recruits. At the same time, M&E officers will have the opportunity to develop an advanced set of competencies with the possibility of specializing in specific areas. 16. Institutional Strengthening MCA-Lesotho will strengthen the institutional capacity of implementing entities. Support activities will include:
Training of counterpart personnel and specialized software applications in support
of monitoring and evaluation system, project management and technical analysis On-going development of technical management and methodologies Organizing workshops for civil society consultative process Provision of technical assistance Electronic interconnectivity and information exchange Align compact investment in software, data base design and information system
with the national monitoring and evaluation system etc

Annex 1 – Indicator Framework Annex 1.1: Impact Indicators
Indicator Definition of Indicators Unit of
measure Data Source
Frequency of Data Collection
GDP growth (annual percent) The market value of all the goods and services produced by labor and property.
Percentage BOS Reports Baseline, Mid-term and End of Compact
GDP per capita ($US) The GDP of a country divided by its total population US Dollar BOS Report Baseline, Mid-term and End of Compact
Employment (in water related industries) Total number of factory workers employed in water-related industries at Thetsane and Tikoe industrial parks
Number LNDC Reports Baseline, Mid-term and End of Compact
Maternal Mortality Ratio Death during pregnancy, at child birth or within two months after the birth or termination of pregnancy (per 100,000 population)
Ratio MDG Report Update
Baseline, Mid-term and End of Compact
Mortality Rate of adults aged 15-49 Number of deaths of adults aged 15-49 per 1,000 population
Ratio DHS Baseline, Mid-term and End of Compact
Mortality Rate of under 5 Number of deaths of under 5 children per 1,000 live births
Ratio DHS Baseline, Mid-term and End of Compact
Infant Mortality Rate Number of infant deaths (children under 12 months of age) per 1000 live births
Ratio DHS Baseline, Mid-term and End of Compact
People with HIV still alive 12 months after initiation of treatment
Proportion of individuals still alive and on therapy after initiating treatment after 12 months
Percentage HMIS Baseline, Mid-term and End of Compact
TB treatment success rate Proportion of new smear positive patients declared cured and new smear positive patients who completed treatment during a given period
Percentage HMIS Baseline, Mid-term and End of Compact
Value of credit extended The total value of loans granted Maluti CBL Reports Baseline, Mid-term and End of Compact
Diarrhea notification per 1000 (Total Water-Digestive Illnesses)
Total number of new cases of diarrhea per 1,000 OPD attendance
Ratio DHS Baseline, Mid-term and End of Compact

56
Annex 1.2: Outcome and Output Indicators for the Health Project
Indicators Definition Unit of Measurement
Data Sources
Frequency of Data Collection
Health centers with essential health services Proportion of health centers providing full package of standard services
Percentage Health Facility Accreditation Survey (HFAS)
Annually
Health centers with required staff compliment (FTE)
Proportion of HCs staffed with at least one Nurse Clinician, one Professional Nurse and one Nursing Assistant
Percentage HFAS Annually
Deliveries conducted in the health facilities Proportion of deliveries conducted in health facilities Percentage DHS Baseline, Mid-term and end of Compact
Health centers conducting deliveries Number of health centers which conducted deliveries in a year as against total number of health centers in the country
Percentage HMIS Annually
Immunization coverage rate Proportion of children under one year of age who received dosage of measles antigen
Percentage DHS Baseline, Mid-term and End of Compact
PLWA receiving ARV treatment Proportion of people with advanced HIV & AIDS receiving ARV treatment per year
Percentage HMIS Annually
Students who graduate from NHTC Number of students graduating per annum from different courses offered at NHTC
Number AJR Annually
TB notification per 100,000 population Number of all forms of TB cases registered during the period under review per 1,000 population
Ratio HMIS Baseline, Mid-term and End of Compact
Blood units collected by Blood Transfusion Services (BTS)
Blood units collected from all sources by BTS per year Number HMIS Annually
Laboratory tests done
The total number of all tests done from the Central Laboratory on annual basis
Number AJR Annually
Health Centers with HCWM technologies Proportion of health centers with access to 3-Bin Paper Disposable System
Percentage HFAS Annually

57
Annex 1.3: Outcome and Output Indicators for the Water Sector Project
Indicators Definition Unit of Measurement
Data Sources Frequency of Data Collection
School days lost due to reduction of water borne diseases
The average number of school days lost by children due to water borne diseases
Number
Household Survey
Baseline, Mid-term and End of Compact
Households with access to improved Latrines Number of households with access to latrine as against the total number of households in the project area
Percentage Household Survey
Baseline, Mid-term and End of Compact
Households with improved water supply Number of new households covered within 150m walking distance, 30L/person/day.
Number Household Survey
Baseline, Mid-term and End of Compact
VIP latrines built Number of new VIP latrines within homesteads in the MCA–Lesotho intervention areas, designed and constructed according to national standards
Number DRWS Monthly reports
Quarterly
Knowledge of good hygiene practice Number of people who have attended PHAST community gathering who have gained knowledge of good hygiene practice
Percentage Household Survey
Baseline, Mid-term and End of Compact
Average time saved per household Time saved due by households as a result of accessing water within 150m walking distance
Hours Household Survey
Baseline, Mid-term and End of Compact
Households with reliable water services Total number of households with an average water supply for 18 hrs a day
Number Household Survey
Quarterly
Enterprises with reliable water services Total number of enterprises with an average water supply for 18 hrs a day
Number Enterprise Survey
Baseline, Mid-term and End of Compact
Commercial water consumption Average commercial water consumed at the business unit measured in cubic meters per month
Cubic meters Enterprise Survey
Baseline, Mid-term and End of Compact
Unaccounted for water Volumes of unbilled waster against water total water produced
Ratio WASA Monitoring Reports
Annual
Volume of treated water Annual Mega Litres of treated water delivered to WASA from the Metolong treatment works
Cubic meters WASA Monitoring Reports
Annual

58
Annex 1.4: Indicators for Wetlands Restoration and Rehabilitation
Indicators Definition Unit of Measurement
Data Source Frequency of Data Collection
Grazing Capacity The weighted average number of animals that can be placed on a range land without any harm in the three areas (Lets’eng la Letsie; Kotisphola & Kholong la Lithunya per year (Ha/au/yr). The weights are the areas of the three locations where
Ratio
Wetland Project Reports
Baseline, Mid-term
and End of Compact
Area re-vegetation The number of hectors of land where the three areas have been re-vegetated or re-planted
Number Wetlands Project Reports
Baseline, Mid-term and End of Compact
People aware of the threats of wetlands Proportion of respondents acknowledging threats to wetlands compared to the total number of respondents
Percentage Impact Evaluation report
Baseline, Mid-term and End of Compact
Retention Structures Number of construction retention structures in three targeted areas
Number Wetlands Project Reports
Baseline, Mid-term and End of Compact

59
Annex 1.5: Outcome and Output Indicators for the Private Sector Development
Indicators Definition
Unit of Measurement
Data Sources Frequency of
Data Collection Time required to enforce a contract Average number of days taken from filing a payment dispute
to full enforcement (settlement) of judgment Number World Bank
Doing Business Report
Annual
Pending commercial cases Total number of pending cases in commercial courts Number Commercial Court Register
Annual
Cases filed at the commercial court Total number of cases filed at the commercial court Number Commercial Court Register
Quarterly
Value of commercial cases Total value of cases (Maloti) filed in the commercial court Maloti Commercial Court Register
Quarterly
Cases completed under the new small claims court
Total number of cases filed under the new small claims procedures
Number Commercial Court Register
Quarterly
Cases referred to ADR that are successfully completed
Proportion of cases referred annually to ADR Percentage Commercial Court Register
Quarterly
Performing Loans The percent of total loans that meet the required installments
Maloti Central Bank Reports
Quarterly
Portfolio of loans Proportion of loan portfolio resulting from reduced business risk and cost of doing business
Percentage Central Bank Reports
Quarterly
Loan application processing time Average time required to process a loan Days Central Bank Reports
Quarterly
Clearing time in Maseru Average days required to clear cheques in Maseru Days Central Bank Reports
Quarterly
Clearing time in Country Average days required to clear cheques in the country Days Central Bank Reports
Quarterly
Electronic payments for Salaries Total number of payments associated with salaries made through EFT per year
Number Central Bank Reports
Annual
Electronic payments for Pensions Total number of payments associated with pensions made through EFT per year
Number Central Bank Reports
Annual
Debit/Smart card issued Number of smart cards issued to both banked and non-banked people aged 15 and above
Number Lesotho Post Bank Reports
Quarterly
Time to process a lease Average number of days it takes to process a lease from application to lease registration
Number World Bank Doing Business
Baseline, Mid-term and End of Compact
Mortgage Bonds registered
Number of registered Mortgage Bonds Number Land Administration Project Report
Quarterly
Value of registered mortgage bonds Total annual value of mortgage bonds issued against bank loans and registered at Deeds Registry
Maloti Land Administration Project Report
Quarterly
Land parcels regularized and registered
Number of land parcels regularized and issued with leases Number Land Administration Project Report
Quarterly

60
Monetary cost of a lease application Average administrative cost to title holder to process a lease application
Maloti Enterprise Survey (Dec 2010)
Baseline, Mid-term and End of Compact
Land transactions recorded Total number of registered leases, transfers, sub-lease agreements, and mortgages transacted at the Deed Registry within LAA
Number Land Administration Project Report
Annually
Stakeholders reached
Number of stakeholders sensitized on land rights and land matters by the Land Administration Reform Project
Number Public Outreach Reports
Quarterly
Stakeholders trained Number of stakeholders trained through workshops facilitated by Land Administration Reform Project
Number Public Outreach Reports
Quarterly
Eligible population with ID Cards Number of Lesotho citizens and permanent residents aged 16 and above issued with ID cards
Number NIDC Project Reports
Quarterly
Population registered in the National database Number of Lesotho citizens and permanent residents registered in the National Identification Register (NIR) as against the total population
Number NIDC Project Reports
Baseline, Mid-term and End of Compact
Enterprise owned by women Proportion of enterprises owned by women in Lesotho Percentage Enterprise
Survey Baseline, Mid-term
and End of Compact Women holding titles to land Total number of titles registered in women’s name Number Land
Administration Project Report
Quarterly
People trained Total number of people who attended the training workshops facilitated by Gender Equality Project
Number Gender Equality Project Report
Quarterly
People reached Total number of people sensitized on gender related issues through outreach campaigns facilitated by Gender Equality Project
Number Gender Equality Project Report
Quarterly
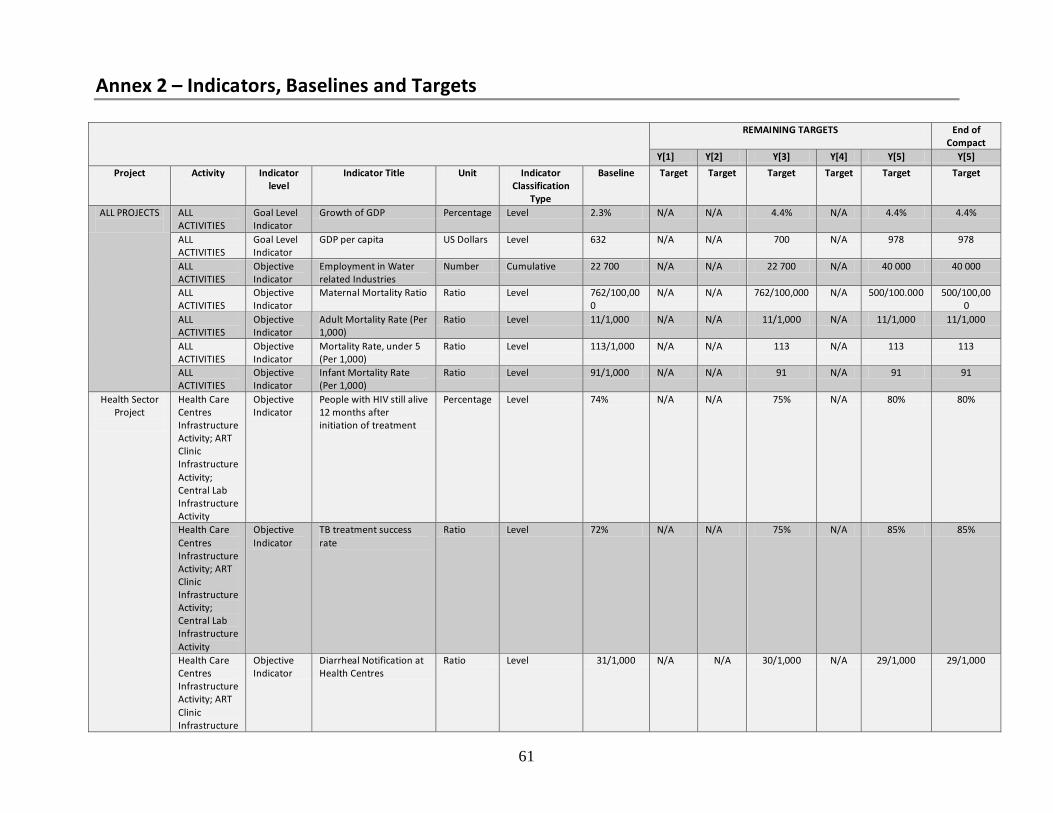
61
Annex 2 – Indicators, Baselines and Targets
REMAINING TARGETS End of Compact
Y[1] Y[2] Y[3] Y[4] Y[5] Y[5]
Project Activity Indicator level
Indicator Title Unit Indicator Classification
Type
Baseline Target Target Target Target Target Target
ALL PROJECTS
ALL ACTIVITIES
Goal Level Indicator
Growth of GDP Percentage Level 2.3% N/A N/A 4.4% N/A 4.4% 4.4%
ALL ACTIVITIES
Goal Level Indicator
GDP per capita US Dollars Level 632 N/A N/A 700 N/A 978 978
ALL ACTIVITIES
Objective Indicator
Employment in Water related Industries
Number Cumulative 22 700 N/A N/A 22 700 N/A 40 000 40 000
ALL ACTIVITIES
Objective Indicator
Maternal Mortality Ratio Ratio Level 762/100,000
N/A N/A 762/100,000 N/A 500/100.000 500/100,000
ALL ACTIVITIES
Objective Indicator
Adult Mortality Rate (Per 1,000)
Ratio Level 11/1,000 N/A N/A 11/1,000 N/A 11/1,000 11/1,000
ALL ACTIVITIES
Objective Indicator
Mortality Rate, under 5 (Per 1,000)
Ratio Level 113/1,000 N/A N/A 113 N/A 113 113
ALL ACTIVITIES
Objective Indicator
Infant Mortality Rate (Per 1,000)
Ratio Level 91/1,000 N/A N/A 91 N/A 91 91
Health Sector Project
Health Care Centres Infrastructure Activity; ART Clinic Infrastructure Activity; Central Lab Infrastructure Activity
Objective Indicator
People with HIV still alive 12 months after initiation of treatment
Percentage Level 74% N/A N/A 75% N/A 80% 80%
Health Care Centres Infrastructure Activity; ART Clinic Infrastructure Activity; Central Lab Infrastructure Activity
Objective Indicator
TB treatment success rate
Ratio Level 72% N/A N/A 75% N/A 85% 85%
Health Care Centres Infrastructure Activity; ART Clinic Infrastructure
Objective Indicator
Diarrheal Notification at Health Centres
Ratio Level 31/1,000 N/A N/A 30/1,000 N/A 29/1,000 29/1,000
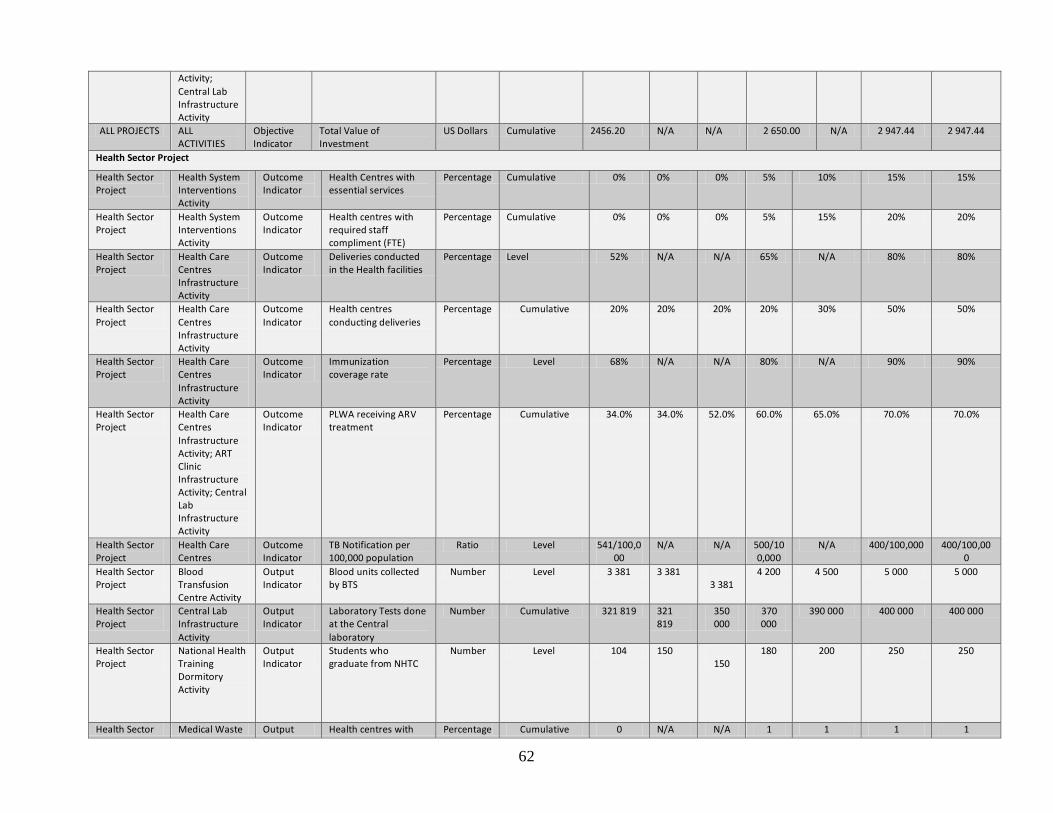
62
Activity; Central Lab Infrastructure Activity
ALL PROJECTS ALL ACTIVITIES
Objective Indicator
Total Value of Investment
US Dollars Cumulative 2456.20 N/A N/A 2 650.00 N/A 2 947.44 2 947.44
Health Sector Project
Health Sector Project
Health System Interventions Activity
Outcome Indicator
Health Centres with essential services
Percentage Cumulative 0% 0% 0% 5% 10% 15% 15%
Health Sector Project
Health System Interventions Activity
Outcome Indicator
Health centres with required staff compliment (FTE)
Percentage Cumulative 0% 0% 0% 5% 15% 20% 20%
Health Sector Project
Health Care Centres Infrastructure Activity
Outcome Indicator
Deliveries conducted in the Health facilities
Percentage Level 52% N/A N/A 65% N/A 80% 80%
Health Sector Project
Health Care Centres Infrastructure Activity
Outcome Indicator
Health centres conducting deliveries
Percentage Cumulative 20% 20% 20% 20% 30% 50% 50%
Health Sector Project
Health Care Centres Infrastructure Activity
Outcome Indicator
Immunization coverage rate
Percentage Level 68% N/A N/A 80% N/A 90% 90%
Health Sector Project
Health Care Centres Infrastructure Activity; ART Clinic Infrastructure Activity; Central Lab Infrastructure Activity
Outcome Indicator
PLWA receiving ARV treatment
Percentage Cumulative 34.0% 34.0% 52.0% 60.0% 65.0% 70.0% 70.0%
Health Sector Project
Health Care Centres
Outcome Indicator
TB Notification per 100,000 population
Ratio Level 541/100,000
N/A N/A 500/100,000
N/A 400/100,000 400/100,000
Health Sector Project
Blood Transfusion Centre Activity
Output Indicator
Blood units collected by BTS
Number Level 3 381 3 381 3 381
4 200 4 500 5 000 5 000
Health Sector Project
Central Lab Infrastructure Activity
Output Indicator
Laboratory Tests done at the Central laboratory
Number Cumulative 321 819 321 819
350 000
370 000
390 000 400 000 400 000
Health Sector Project
National Health Training Dormitory Activity
Output Indicator
Students who graduate from NHTC
Number Level 104 150 150
180 200 250 250
Health Sector Medical Waste Output Health centres with Percentage Cumulative 0 N/A N/A 1 1 1 1
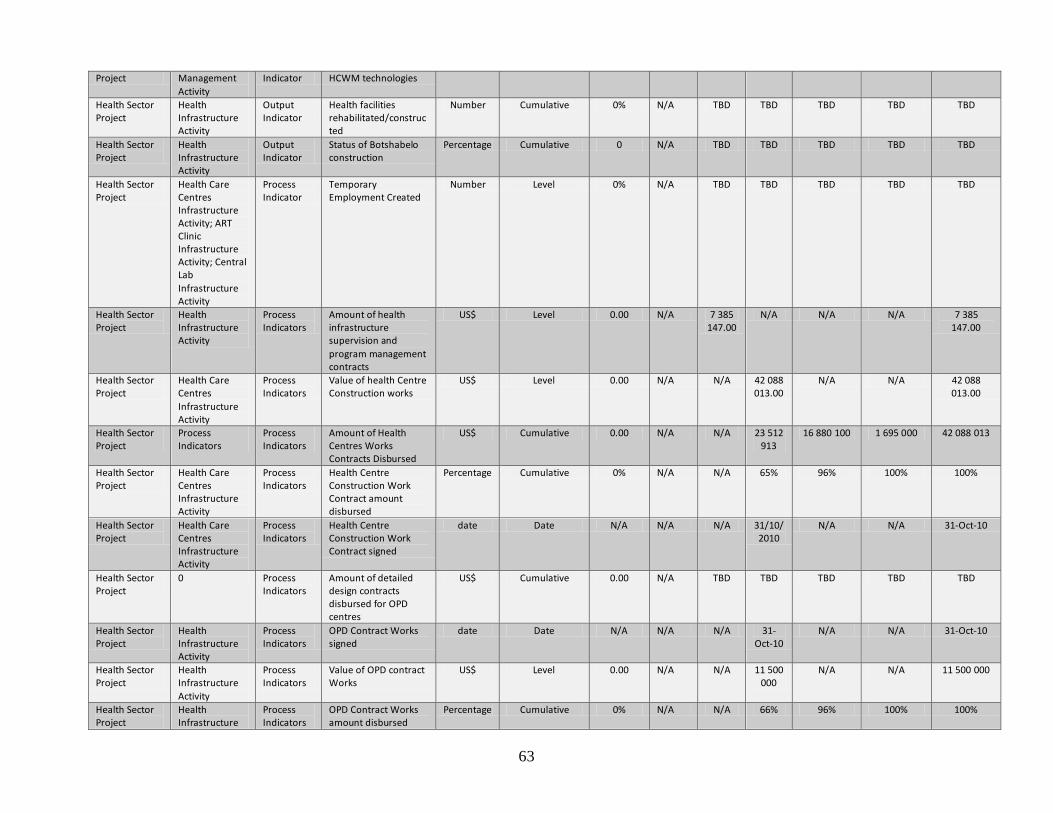
63
Project Management Activity
Indicator HCWM technologies
Health Sector Project
Health Infrastructure Activity
Output Indicator
Health facilities rehabilitated/constructed
Number Cumulative 0% N/A TBD TBD TBD TBD TBD
Health Sector Project
Health Infrastructure Activity
Output Indicator
Status of Botshabelo construction
Percentage Cumulative 0 N/A TBD TBD TBD TBD TBD
Health Sector Project
Health Care Centres Infrastructure Activity; ART Clinic Infrastructure Activity; Central Lab Infrastructure Activity
Process Indicator
Temporary Employment Created
Number Level 0% N/A TBD TBD TBD TBD TBD
Health Sector Project
Health Infrastructure Activity
Process Indicators
Amount of health infrastructure supervision and program management contracts
US$ Level 0.00 N/A 7 385 147.00
N/A N/A N/A 7 385 147.00
Health Sector Project
Health Care Centres Infrastructure Activity
Process Indicators
Value of health Centre Construction works
US$ Level 0.00 N/A N/A 42 088 013.00
N/A N/A 42 088 013.00
Health Sector Project
Process Indicators
Process Indicators
Amount of Health Centres Works Contracts Disbursed
US$ Cumulative 0.00 N/A N/A 23 512 913
16 880 100 1 695 000 42 088 013
Health Sector Project
Health Care Centres Infrastructure Activity
Process Indicators
Health Centre Construction Work Contract amount disbursed
Percentage Cumulative 0% N/A N/A 65% 96% 100% 100%
Health Sector Project
Health Care Centres Infrastructure Activity
Process Indicators
Health Centre Construction Work Contract signed
date Date N/A N/A N/A 31/10/2010
N/A N/A 31-Oct-10
Health Sector Project
0 Process Indicators
Amount of detailed design contracts disbursed for OPD centres
US$ Cumulative 0.00 N/A TBD TBD TBD TBD TBD
Health Sector Project
Health Infrastructure Activity
Process Indicators
OPD Contract Works signed
date Date N/A N/A N/A 31-Oct-10
N/A N/A 31-Oct-10
Health Sector Project
Health Infrastructure Activity
Process Indicators
Value of OPD contract Works
US$ Level 0.00 N/A N/A 11 500 000
N/A N/A 11 500 000
Health Sector Project
Health Infrastructure
Process Indicators
OPD Contract Works amount disbursed
Percentage Cumulative 0% N/A N/A 66% 96% 100% 100%

64
Activity
Health Sector Project
0-Jan Process Indicators
Amount of Construction Contracts Disbursed for OPD centres
US$ Cumulative 0.00 N/A N/A 1 057 100
4 430 200 488 800 5 976 100
Health Sector Project
Health Infrastructure Activity
Process Indicators
Value of Central Laboratory Construction Works
US$ Level 0.00 N/A 1 795 090.00
N/A N/A N/A 1 795 090
Health Sector Project
Health Infrastructure Activity
Process Indicators
Central Laboratory Construction Works amount disbursed
Percentage Cumulative 0% N/A N/A 67% 100% N/A 100%
Health Sector Project
Health System Strengthening
Process Indicators
Value of HSS Contract US$ Level 0.00 12 900 000.00
N/A N/A N/A N/A 12 900 000
Health Sector Project
Health System Strengthening
Process Indicators
HSS Contract amount disbursed
Percentage Cumulative 0% N/A 21% 51% 77% 100% 100%
Health Sector Project
Health System Strengthening
Process Indicators
HSS Contract signed date date N/A 31-Jul-09
N/A N/A NA NA 31-Jul-09
Health Sector Project
Waste Management
Process Indicators
Value of Waste Management Contract
US$ Level 0% 2 153 119.00
N/A N/A N/A N/A 2 153 119
Health Sector Project
Waste Management
Process Indicators
Waste Management Contract amount disbursed
Percentage Cumulative 0% N/A 36% 61% 85% 100% 100%
Health Sector Project
Waste Management
Process Indicators
Waste Management Contract signed
days date N/A 31-Jul-09
N/A N/A NA NA 31-Jul-09
Health Sector Project
National Health Training Dormitory Activity
Process Indicators
Value of NHTC Contract Works
US$ Level 0.00 N/A 5 814 980.00
N/A NA NA 5 814 980
Health Sector Project
National Health Training Dormitory Activity
Process Indicators
NHTC Contract Works amount disbursed
Percentage Cumulative 0% N/A N/A 51% 95% 100% 100%
Health Sector Project
National Health Training Dormitory Activity
Process Indicators
NHTC Contract Works signed
days date N/A N/A 30-Sep-10
N/A N/A N/A 30-Sep-10
Health Sector Project
Blood Transfusion Centre Activity
Process Indicators
Value of Blood Transfusion Services Contract
US$ Level 0.00 N/A 1 495 355.00
N/A N/A N/A 1 495 355
Health Sector Project
Blood Transfusion Centre Activity
Process Indicators
Blood Transfusion Services Works amount disbursed
Percentage Cumulative 0% N/A N/A 51% 95% 100% 100%
Health Sector Project
Blood Transfusion Centre Activity
Process Indicators
Blood Transfusion Services Contract signed
date date N/A N/A 30-Sep-10
N/A N/A N/A 30-Sep-10
Rural Water Supply & Sanitation Water Sector Project
Rural Water Supply and Sanitation Activity
Outcome Indicator
School days lost due to reduction of water borne diseases
Days Level 24 N/A N/A 20 N/A 12 12
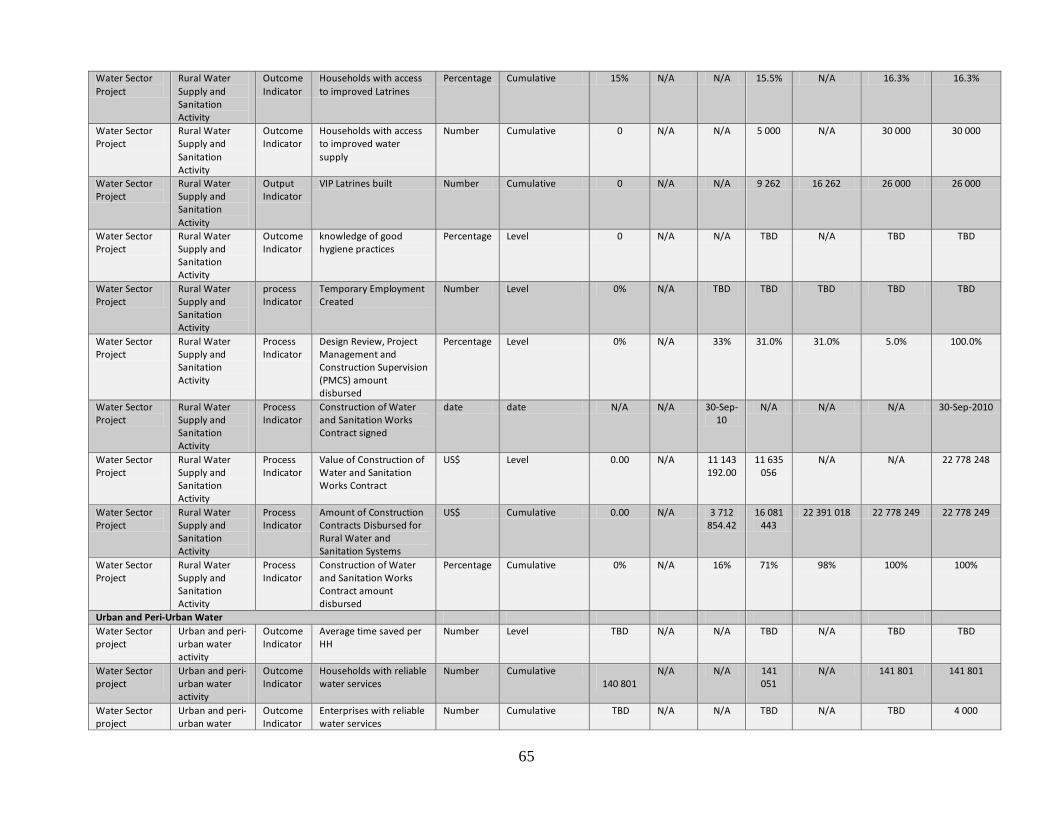
65
Water Sector Project
Rural Water Supply and Sanitation Activity
Outcome Indicator
Households with access to improved Latrines
Percentage Cumulative 15% N/A N/A 15.5% N/A 16.3% 16.3%
Water Sector Project
Rural Water Supply and Sanitation Activity
Outcome Indicator
Households with access to improved water supply
Number Cumulative 0 N/A N/A 5 000 N/A 30 000 30 000
Water Sector Project
Rural Water Supply and Sanitation Activity
Output Indicator
VIP Latrines built Number Cumulative 0 N/A N/A 9 262 16 262 26 000 26 000
Water Sector Project
Rural Water Supply and Sanitation Activity
Outcome Indicator
knowledge of good hygiene practices
Percentage Level 0 N/A N/A TBD N/A TBD TBD
Water Sector Project
Rural Water Supply and Sanitation Activity
process Indicator
Temporary Employment Created
Number Level 0% N/A TBD TBD TBD TBD TBD
Water Sector Project
Rural Water Supply and Sanitation Activity
Process Indicator
Design Review, Project Management and Construction Supervision (PMCS) amount disbursed
Percentage Level 0% N/A 33% 31.0% 31.0% 5.0% 100.0%
Water Sector Project
Rural Water Supply and Sanitation Activity
Process Indicator
Construction of Water and Sanitation Works Contract signed
date date N/A N/A 30-Sep-10
N/A N/A N/A 30-Sep-2010
Water Sector Project
Rural Water Supply and Sanitation Activity
Process Indicator
Value of Construction of Water and Sanitation Works Contract
US$ Level 0.00 N/A 11 143 192.00
11 635 056
N/A N/A 22 778 248
Water Sector Project
Rural Water Supply and Sanitation Activity
Process Indicator
Amount of Construction Contracts Disbursed for Rural Water and Sanitation Systems
US$ Cumulative 0.00 N/A 3 712 854.42
16 081 443
22 391 018 22 778 249 22 778 249
Water Sector Project
Rural Water Supply and Sanitation Activity
Process Indicator
Construction of Water and Sanitation Works Contract amount disbursed
Percentage Cumulative 0% N/A 16% 71% 98% 100% 100%
Urban and Peri-Urban Water Water Sector project
Urban and peri-urban water activity
Outcome Indicator
Average time saved per HH
Number Level TBD N/A N/A TBD N/A TBD TBD
Water Sector project
Urban and peri-urban water activity
Outcome Indicator
Households with reliable water services
Number Cumulative 140 801
N/A N/A 141 051
N/A 141 801 141 801
Water Sector project
Urban and peri-urban water
Outcome Indicator
Enterprises with reliable water services
Number Cumulative TBD N/A N/A TBD N/A TBD 4 000
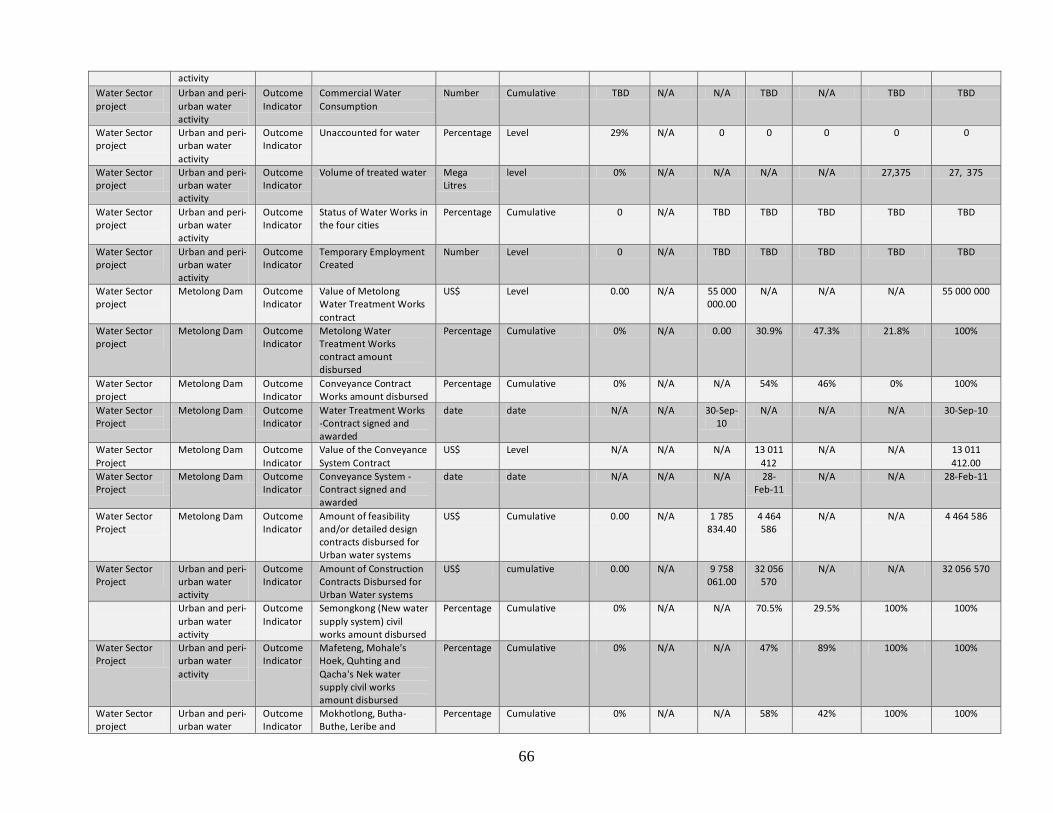
66
activity Water Sector project
Urban and peri-urban water activity
Outcome Indicator
Commercial Water Consumption
Number Cumulative TBD N/A N/A TBD N/A TBD TBD
Water Sector project
Urban and peri-urban water activity
Outcome Indicator
Unaccounted for water Percentage Level 29% N/A 0 0 0 0 0
Water Sector project
Urban and peri-urban water activity
Outcome Indicator
Volume of treated water Mega Litres
level 0% N/A N/A N/A N/A 27,375 27, 375
Water Sector project
Urban and peri-urban water activity
Outcome Indicator
Status of Water Works in the four cities
Percentage Cumulative 0 N/A TBD TBD TBD TBD TBD
Water Sector project
Urban and peri-urban water activity
Outcome Indicator
Temporary Employment Created
Number Level 0 N/A TBD TBD TBD TBD TBD
Water Sector project
Metolong Dam Outcome Indicator
Value of Metolong Water Treatment Works contract
US$ Level 0.00 N/A 55 000 000.00
N/A N/A N/A 55 000 000
Water Sector project
Metolong Dam Outcome Indicator
Metolong Water Treatment Works contract amount disbursed
Percentage Cumulative 0% N/A 0.00 30.9% 47.3% 21.8% 100%
Water Sector project
Metolong Dam Outcome Indicator
Conveyance Contract Works amount disbursed
Percentage Cumulative 0% N/A N/A 54% 46% 0% 100%
Water Sector Project
Metolong Dam Outcome Indicator
Water Treatment Works -Contract signed and awarded
date date N/A N/A 30-Sep-10
N/A N/A N/A 30-Sep-10
Water Sector Project
Metolong Dam Outcome Indicator
Value of the Conveyance System Contract
US$ Level N/A N/A N/A 13 011 412
N/A N/A 13 011 412.00
Water Sector Project
Metolong Dam Outcome Indicator
Conveyance System -Contract signed and awarded
date date N/A N/A N/A 28-Feb-11
N/A N/A 28-Feb-11
Water Sector Project
Metolong Dam Outcome Indicator
Amount of feasibility and/or detailed design contracts disbursed for Urban water systems
US$ Cumulative 0.00 N/A 1 785 834.40
4 464 586
N/A N/A 4 464 586
Water Sector Project
Urban and peri-urban water activity
Outcome Indicator
Amount of Construction Contracts Disbursed for Urban Water systems
US$ cumulative 0.00 N/A 9 758 061.00
32 056 570
N/A N/A 32 056 570
Urban and peri-urban water activity
Outcome Indicator
Semongkong (New water supply system) civil works amount disbursed
Percentage Cumulative 0% N/A N/A 70.5% 29.5% 100% 100%
Water Sector Project
Urban and peri-urban water activity
Outcome Indicator
Mafeteng, Mohale's Hoek, Quhting and Qacha's Nek water supply civil works amount disbursed
Percentage Cumulative 0% N/A N/A 47% 89% 100% 100%
Water Sector project
Urban and peri-urban water
Outcome Indicator
Mokhotlong, Butha-Buthe, Leribe and
Percentage Cumulative 0% N/A N/A 58% 42% 100% 100%
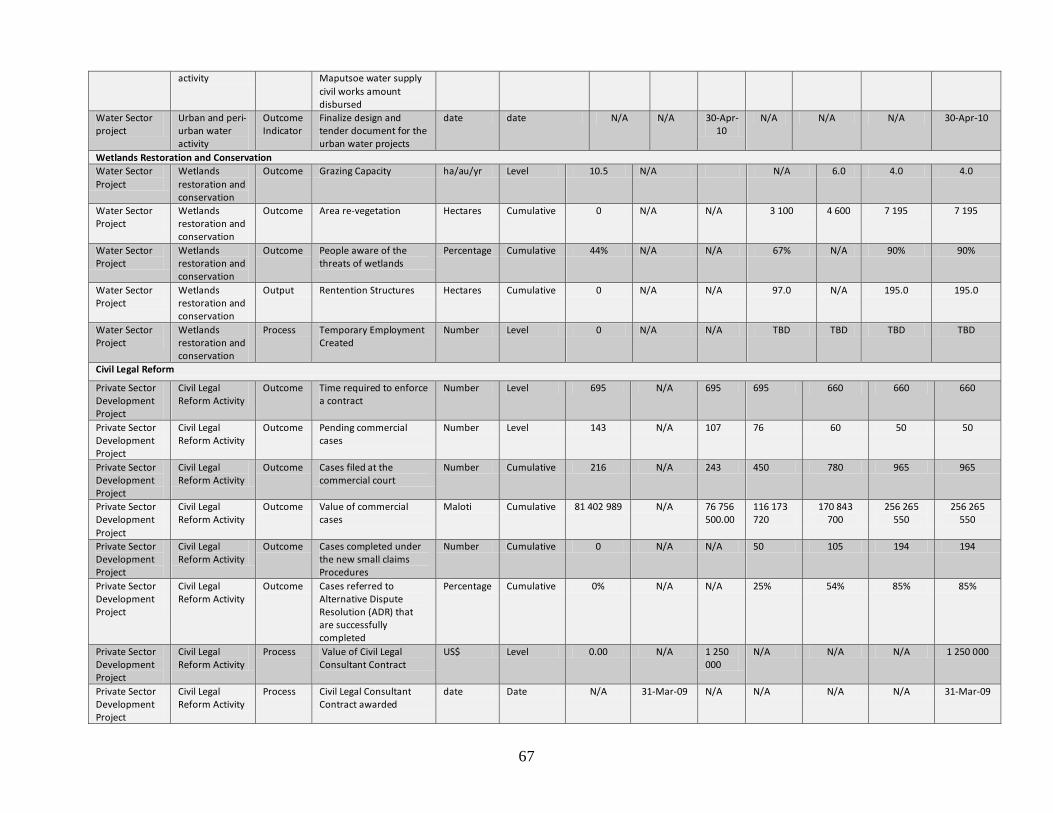
67
activity Maputsoe water supply civil works amount disbursed
Water Sector project
Urban and peri-urban water activity
Outcome Indicator
Finalize design and tender document for the urban water projects
date date N/A N/A 30-Apr-10
N/A N/A N/A 30-Apr-10
Wetlands Restoration and Conservation Water Sector Project
Wetlands restoration and conservation
Outcome Grazing Capacity ha/au/yr Level 10.5 N/A N/A 6.0 4.0 4.0
Water Sector Project
Wetlands restoration and conservation
Outcome Area re-vegetation Hectares Cumulative 0 N/A N/A 3 100 4 600 7 195 7 195
Water Sector Project
Wetlands restoration and conservation
Outcome People aware of the threats of wetlands
Percentage Cumulative 44% N/A N/A 67% N/A 90% 90%
Water Sector Project
Wetlands restoration and conservation
Output Rentention Structures Hectares Cumulative 0 N/A N/A 97.0 N/A 195.0 195.0
Water Sector Project
Wetlands restoration and conservation
Process Temporary Employment Created
Number Level 0 N/A N/A TBD TBD TBD TBD
Civil Legal Reform
Private Sector Development Project
Civil Legal Reform Activity
Outcome Time required to enforce a contract
Number Level 695 N/A 695 695 660 660 660
Private Sector Development Project
Civil Legal Reform Activity
Outcome Pending commercial cases
Number Level 143 N/A 107 76 60 50 50
Private Sector Development Project
Civil Legal Reform Activity
Outcome Cases filed at the commercial court
Number Cumulative 216 N/A 243 450 780 965 965
Private Sector Development Project
Civil Legal Reform Activity
Outcome Value of commercial cases
Maloti Cumulative 81 402 989 N/A 76 756 500.00
116 173 720
170 843 700
256 265 550
256 265 550
Private Sector Development Project
Civil Legal Reform Activity
Outcome Cases completed under the new small claims Procedures
Number Cumulative 0 N/A N/A 50 105 194 194
Private Sector Development Project
Civil Legal Reform Activity
Outcome Cases referred to Alternative Dispute Resolution (ADR) that are successfully completed
Percentage Cumulative 0% N/A N/A 25% 54% 85% 85%
Private Sector Development Project
Civil Legal Reform Activity
Process Value of Civil Legal Consultant Contract
US$ Level 0.00 N/A 1 250 000
N/A N/A N/A 1 250 000
Private Sector Development Project
Civil Legal Reform Activity
Process Civil Legal Consultant Contract awarded
date Date N/A 31-Mar-09 N/A N/A N/A N/A 31-Mar-09

68
Private Sector Development Project
Civil Legal Reform Activity
Process Civil Legal Consultant Contract amount disbursed
US$ Cumulative 0.00 369 565 956 522.00
1 250 000
1 250 000 1 250 000 1 250 000
ACH, Credit Bureau and Debit Smart Card
Credit Bureau Reduction in the cost of doing business
Outcome Performing loans Maloti Level 1 368 540 000
1 505 394 000
1 806 472 800
1 779 102 00
2 312 832 600
3 006 682 380
3 006 682 380
Credit Bureau Reduction in the cost of doing business
Outcome Portfolio of loans Maloti Cumulative 1 409 000 000
1 549 900 000
1 859 880 000
2 417 844 000
3 143 197 200
4 086 156 360
4 086 156 360
Credit Bureau Reduction in the cost of doing business
Outcome Loan Application Processing time
Days Level 7 7 7 3 1 1 1
ACH Reduction in the cost of doing business
Outcome Clearing time Maseru Days Level 3 3 3 2 2 1 1
ACH Improvement of the economic activity
Outcome Clearing time Country Days Level 7 7 7 3 3 3 3
ACH Improvement of the economic activity
Outcome Electronic payments: Salaries
Number Cumulative 29 897 29 897 31 391 32 960 34 608 38 155 38 155
ACH Improvement of the economic activity
Outcome Electronic payments: Pensions
Number Cumulative 4,586 4,815 5 056 5,308 5,576 5,852 5,852
ACH Reduction in the cost of doing business
Output Debit Smart Cards Issued
Number Cumulative 0 N/A N/A 50 000 120 000 236 363 236 363
ACH Reduction in the cost of doing business
Output Payment System Act Date Date N/A N/A N/A 30-Dec-10
N/A N/A 30-Dec-10
ACH Reduction in the cost of doing business
Output Data Protection Act Date Date N/A N/A N/A 30-Dec-10
N/A N/A 30-Dec-10
Credit Bureau Access to finance and determination of credit worthiness
Output Credit Reporting Act Date Date N/A N/A N/A 30-Dec-10
N/A N/A 30-Dec-10
Credit Bureau Access to finance and determination of credit worthiness
Output ACH Regulations Date Date N/A N/A N/A 30-Dec-10
N/A N/A 30-Dec-10
Credit Bureau Access to finance and determination of credit worthiness
Output ACH guidelines rules and procedures
Date Date N/A N/A N/A 16-May-11
N/A N/A 16-May-11
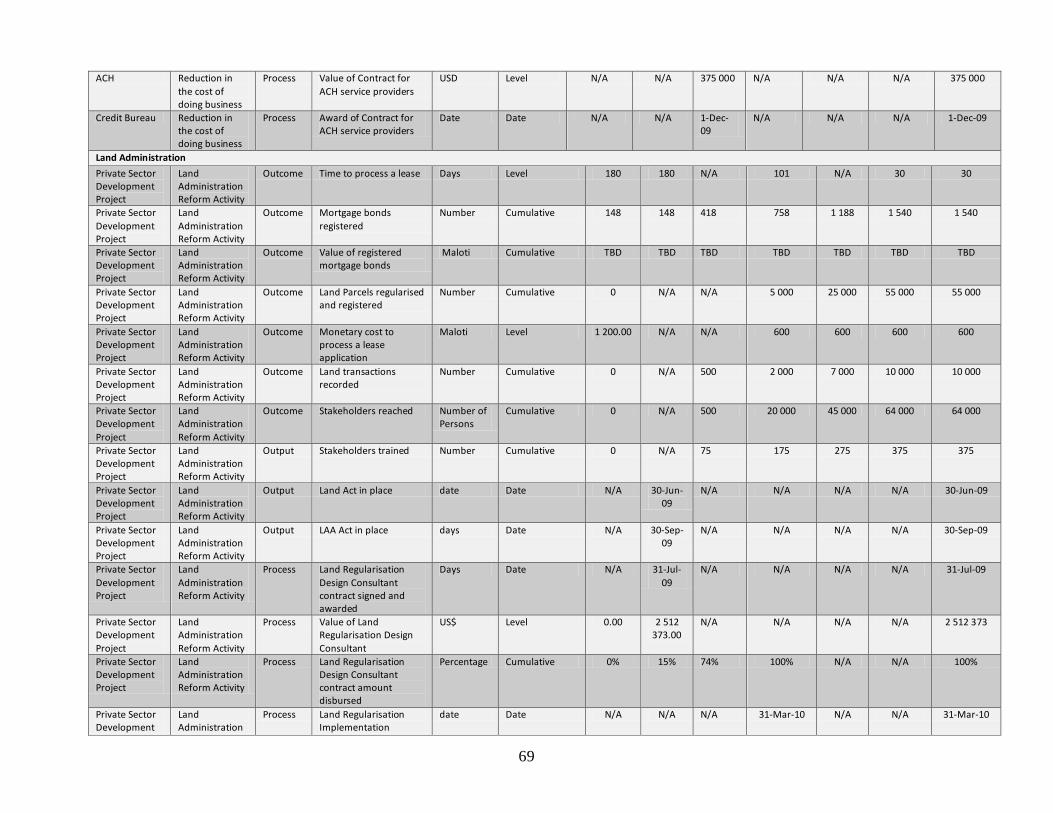
69
ACH Reduction in the cost of doing business
Process Value of Contract for ACH service providers
USD Level N/A N/A 375 000 N/A N/A N/A 375 000
Credit Bureau Reduction in the cost of doing business
Process Award of Contract for ACH service providers
Date Date N/A N/A 1-Dec-09
N/A N/A N/A 1-Dec-09
Land Administration
Private Sector Development Project
Land Administration Reform Activity
Outcome Time to process a lease Days Level 180 180 N/A 101 N/A 30 30
Private Sector Development Project
Land Administration Reform Activity
Outcome Mortgage bonds registered
Number Cumulative 148 148 418 758 1 188 1 540 1 540
Private Sector Development Project
Land Administration Reform Activity
Outcome Value of registered mortgage bonds
Maloti Cumulative TBD TBD TBD TBD TBD TBD TBD
Private Sector Development Project
Land Administration Reform Activity
Outcome Land Parcels regularised and registered
Number Cumulative 0 N/A N/A 5 000 25 000 55 000 55 000
Private Sector Development Project
Land Administration Reform Activity
Outcome Monetary cost to process a lease application
Maloti Level 1 200.00 N/A N/A 600 600 600 600
Private Sector Development Project
Land Administration Reform Activity
Outcome Land transactions recorded
Number Cumulative 0 N/A 500 2 000 7 000 10 000 10 000
Private Sector Development Project
Land Administration Reform Activity
Outcome Stakeholders reached Number of Persons
Cumulative 0 N/A 500 20 000 45 000 64 000 64 000
Private Sector Development Project
Land Administration Reform Activity
Output Stakeholders trained Number Cumulative 0 N/A 75 175 275 375 375
Private Sector Development Project
Land Administration Reform Activity
Output Land Act in place date Date N/A 30-Jun-09
N/A N/A N/A N/A 30-Jun-09
Private Sector Development Project
Land Administration Reform Activity
Output LAA Act in place days Date N/A 30-Sep-09
N/A N/A N/A N/A 30-Sep-09
Private Sector Development Project
Land Administration Reform Activity
Process Land Regularisation Design Consultant contract signed and awarded
Days Date N/A 31-Jul-09
N/A N/A N/A N/A 31-Jul-09
Private Sector Development Project
Land Administration Reform Activity
Process Value of Land Regularisation Design Consultant
US$ Level 0.00 2 512 373.00
N/A N/A N/A N/A 2 512 373
Private Sector Development Project
Land Administration Reform Activity
Process Land Regularisation Design Consultant contract amount disbursed
Percentage Cumulative 0% 15% 74% 100% N/A N/A 100%
Private Sector Development
Land Administration
Process Land Regularisation Implementation
date Date N/A N/A N/A 31-Mar-10 N/A N/A 31-Mar-10

70
Project Reform Activity Consultant contracted
Private Sector Development Project
Land Administration Reform Activity
Process Value of Land Regularisation Implementation Consultant
US$ Level N/A N/A N/A 6 807 144 N/A N/A 6 807 144
Private Sector Development Project
Land Administration Reform Activity
Process Land Regularisation Implementation Contract amount disbursed
Percentage Cumulative 0 N/A N/A 65% 100% N/A 100%
Private Sector Development Project
Land Administration Reform Activity
Process LAA Director contracted date Date N/A N/A 31-Oct-09
N/A N/A N/A 31-Oct-09
Private Sector Development Project
Land Administration Reform Activity
Process Equipment purchased US$ Level 0 N/A 53 550.00
165 000 N/A N/A 218 550
Gender Equity Private Sector Development Project
Gender Equality in Economic Rights Activity
Outcome Enterprises owned by women
Number Cumulative TBD N/A N/A TBD N/A TBD TBD
Private Sector Development Project
Gender Equality in Economic Rights Activity
Outcome Women holding titles to Land
Number Cumulative TBD N/A N/A TBD N/A TBD TBD
Private Sector Development Project
Gender Equality in Economic Rights Activity
Output People trained Number Cumulative 0 2 000 3 000 5 000 6 000 6 000 6 000
Private Sector Development Project
Gender Equality in Economic Rights Activity
Output People Reached Number Cumulative 0 4 800 7 800 9 800 10 800 10 800 10 800
National Identification Private Sector Development Project
National ID/ Credit Bureau Activity
Output Eligible Population with ID cards
Number Cumulative 0 N/A N/A 87 500 437 500 735 000 735 000
Private Sector Development Project
National ID/ Credit Bureau Activity
Outcome Population registered in the National Database
Percentage Cumulative 0% N/A N/A 5% 15% 40% 40%