monitoring and measuring intangibles using value maps: some examples
TRANSCRIPT

Monitoring and measuringintangibles using value maps:
some examplesShital Jhunjhunwala
Institute of Public Enterprise, Osmania University, Hyderabad, India
Abstract
Purpose – The purpose of this paper is to provide an integrated approach to understand and monitorthose intangible assets (IAs) that are the key value drivers of an organization. With the help of threedifferent examples, it attempts to examine the cause-and-effect relationship among differentintangibles and map them to organizational success.
Design/methodology/approach – System thinking approach using examples from three differentindustries.
Findings – The paper finds that the success of any organization depends on a network of interrelatedIAs that affect each other and the crux is to ensure that each of these is performing as desired. The useof a causal model clearly demonstrates the cause-and-effect relationships between key variables andultimate objectives, and helps companies identify which intangibles need to be constantly monitoredusing suitable indicators to achieve the desired goals.
Research limitations/implications – The models have not been verified in practice.
Practical implications – Useful for organizations to monitor and measure intangibles by linkingthem to their objective of maximizing shareholder value. The indicators illustrated can be used to trackthe performance of intangibles.
Originality/value – Three industry specific original generic models are presented that will be usefulto managers and consultants as a basis for identifying and mapping key intangibles (value drivers) totheir organization goals.
Keywords Intangible assets, Value analysis, Knowledge mapping, Shareholder value analysis
Paper type Conceptual paper
IntroductionThe industrial age characterized by enormous manufacturing facilities brought to theforefront of management attention and concerted their effort in managing, measuringand reporting tangible assets like buildings, plant, equipment, and machinery. Theinformation and knowledge age that we live in, with all its complexities and dynamicbehaviour has shifted the focus to intangible assets (IAs). It is well-accepted that brandvalue for a fast-moving consumer goods or employee skills for a software company arethe key assets of the organization and not the buildings or computers or any otherphysical asset they own. IAs have become the indisputable value drivers to success.
Organizations are thus, wanting to closely track their IAs. While traditionalaccounting systems were apt for measuring and reporting tangible assets,organizations today are at loss as to how to monitor the performance of IAs. Tomonitor, first intangibles need to be measured and reported. There are no globallyaccepted methods of doing this. Balance score card, intellectual capital report and IAmonitor are some of the tools that are gaining acceptance. They, however, measureindividual assets and fail to provide a holistic picture.
The current issue and full text archive of this journal is available at
www.emeraldinsight.com/1469-1930.htm
Monitoring andmeasuringintangibles
211
Journal of Intellectual CapitalVol. 10 No. 2, 2009
pp. 211-223q Emerald Group Publishing Limited
1469-1930DOI 10.1108/14691930910952623

The performance of each intangible is linked to others (Figure 1). Human capital(Chen et al., 2004) can convert knowledge into market value only with the support ofthe other three: structural, innovation and customer capitals. Human capital, in turn, isa determining factor of structural capital. “Furthermore, structural and human capitalenable enterprises to form, develop, and use innovation capital [. . .] On the other hand,innovation can give an impetus to growth of customer capital” by developing newproducts to meet customer demands. The promotion of customer capital relies onsupport from human, structural and innovative capital. Customer capital ultimatelygets converted into market value.
Value creation takes place depending on how intangibles interact. There is thus aneed to understand the causal relationship among the intangibles to be able to measureand monitor them so as to steer them towards the firm’s success.
The proponents of system thinking as a tool to study intangiblesLiterature surveySystem thinking and system dynamics (www.systemdynamics.org/) propounded byJay W. Forrester is a methodology for studying and managing complex feedbacksystems, such as one finds in business and other social systems. Feedback refers to thesituation of X affecting Y and Y in turn affecting X perhaps through a chain ofcause-and-effect. One cannot study the link between X and Y and, independently, thelink between Y and X and predict how the system will behave. System thinking usesthe causal loop mapping techniques to understand the relationship among differentvariables in a system. The use of causal diagrams to understand, monitor and measureintangibles has been suggested in different bodies of work.
Ittner and Larker (2003) suggested identifying and measuring those critical(intangible) factors that have a huge impact on the companies using a value drivermap. They used the fish and bone diagrams to study the interrelation betweenintangibles. Survey of 297 senior executives in 157 US manufacturing and servicecompanies indicates that companies make little effort to identify non-financial(intangible) performance and demonstrated a cause-and-effect link betweenimprovements in those non-financial parameters on cash flow profit or stock price.
Figure 1.
Customercapital
Structuralcapital
Humancapital
Source: Chen et al. (2004)
Innovationcapital
JIC10,2
212

Jack (n.d.) suggested the use of value mapping for measuring IAs. Valuing mappinguses value maps to visually communicate desired value outcomes, arising from valueneeds and associated strategy, as well as value drivers, the things that impact on thedesired value outcomes. It starts with a review of stakeholders needs called value needassessment with a clear use and worth within a given time scale. It uses predictivevalue outcome maps to obtain desired value outcomes. Value drivers that havegreatest value in deriving these values are identified. Performance measures are thendeveloped that capture the performance of both the value drivers and the valueoutcomes. Value outcome maps and measures for these predictive value outcomes arethen produced.
The value þ activity-based approach (Bygdas et al., 2004) for measuring IAsfocuses on the dynamic aspects of value creation, visualizing important and complexknowledge processes based on three phases of modeling, measuring and action.The modeling phase begins with a mapping and description of the company’s criticalvalue processes, the activities in those and a description of how they are interrelated. Inthe measuring phase, the resources required for each activity is mapped. For eachactivity there is a mapping of what intellectual (critical and necessary) resources areneeded to give sufficient quality and frequency of the activities.
The MERITUM Guidelines were developed by the Measuring Intangibles toUnderstand and Improve Innovation Management – MERITUM (2001) Project, aconsortium comprising researchers from six European countries (Denmark, France,Finland, Norway, Spain, and Sweden). It recommends linking intangible activities withlong-term strategy. Intangible resources are identified and activities that are like toaffect these resources as well as intangible activities and their impact on crucialintangible resources. As a result of the identification process a causal network ofintangibles emerges which are measured using indicators.
Kaplan and Norton (2004) strategy maps is by far the most well-known use ofsystem thinking in monitoring and measuring IAs. The strategy map provides aframework for linking IAs to shareholder value creation through four interrelatedprospective – financial, customer, internal processes, and learning and growth. Itpresents a way to systematically measure the alignment of the company’s human,information and organizational capital – without which even the best strategy cannotsucceed.
The causal relationship and value mapping: some examplesThe goal of all companies is to enhance share holder value. The key value drivers toachieve this goal are different for different companies based on their vision, mission,long and short-term goals and the strategy they adopt to achieve them. Value iscreated when organizations successful respond to market conditions by making themost of internal resources and capabilities (Marr et al., 2004). Thus, managers needto understand the key resources and drivers of value in the organization. Moreor less, however, the key value drivers, in other words intangibles that drive acompany to success would be common within an industry. For instance, employeeskill and talent is undoubtedly the key value driver for a software company.A generic kind of model with the key success variables is thus being presented forthree different industries for a better understanding of how intangibles ultimatelylead to creating shareholder value.
Monitoring andmeasuringintangibles
213

Hotel industryThe model (Figure 2) depicts the key variables that need to perform satisfactorily for aluxury holiday hotel to be successful. Success of a hotel is measured by its occupancyrate which is dependent on its reputation (an IA) and location advantage (IA) like onthe sea beach or in the centre of the city. Location advantage, good ambience (IA),a spread of well-layout (IA) facilities like swimming pools, multiple restaurants, etc.quality services (IA) whether at the reception, or of the food in the restaurant, or ofhousekeeping or even at the billing counter and the courtesy and helpfulness attitude(IA) of the employees lead to customer satisfaction (IA), which coupled with brand (IA)of the chain enhance reputation (IA) of the hotel. Quality services can be achieved onlyif the operational processes are well-designed (IA) and well-trained motivatedworkforce (IA) ensure the efficiency of the processes (IA). It is the responsibility of themanagement (IA) to select and recruit the right kind of people and provide training andmotivation to them.
The more the employee satisfaction (IA) and motivation, the better will be theirbehaviour and attitude towards customers and towards work leading to highercustomer satisfaction, which in turn will increase reputation of the hotel and therebyincrease occupancy rate ultimately creating shareholder value. Satisfied shareholders
Figure 2.Hotel industry
Shareholdervalue creation
Sustained profitability(occupancy rate)
Customerstatisfaction
ReputationLocationaladvantage
++
Chain brand
Employee behaviourand attitude
+
Assembled, productiveemployee workforce
Top managerialhuman resources
Employeesatisfaction
Training
Appropriate selection andrecruitment policy and
procedure
+
+
+
Investments
Facilities
+
+
+
+
Architectural andinterior desingning
Note: Variables in italic are intangible and underlined variables are the key intangibles
Layout of facilitiesand ambience Quality of service (reception,
restaurants, room service,housekeeping, etc)
Processefficiency
++
+
++
+
++
+
+
+
+
+
+
JIC10,2
214

will then reappoint the top management whose performance has created wealth forthem. If they are dissatisfied they will replace them.
Software (support) industryCustomer retention, customer acquisition, and expanding business from existingcustomer are the key intangibles for sustained profits creating shareholder value for acompany providing software support to its clients (Figure 3).
This is possible only through high levels of customer satisfaction (IA) whichdepends on quality service (IA) – timely delivery of objective without hamperingproduction. Satisfied customers, not only, means customer retention (IA) and newbusiness from them but also builds the companies reputation attracting new customers(IA). Top management (IA) need to design effective and efficient processes (IA) andhave a team of highly skilled, trained and motivated technical workforce with theappropriated competency (IA) available to provide quality services.
Figure 3.Software (support)
industry
Shareholder valuecreation
Sustainedprofitability
Expansion of businessof existing customers
Customer (new)acquisition
+
Reputation
Quality service (timely deliveryof service object withouthampering production)
+
+
Assembled, productivetechnical workforce
Top managerialhuman resources
Skilled,talented and trainedmarketing human
resourses
Training
Note: Variables in italics are intangible and underlined variables are the key intangibles
Appropriate selection andrecruitment policy and
proccedure
+ +
+
Employeesatifaction
Productive marketingworkforce
+
+
Marketingstrategy
Customersatifaction
+
+
Processefficiency
Customerretention +
+
+
+
+
+
+
Skilled, talented andtrained technical human
resourse
+
+
Competency mapping (ofskill set matrix with service
requirements)
+
+
+
+
Monitoring andmeasuringintangibles
215
Suitable selection, recruitment and training policies and procedures (IA) along withright kind of work environment (IA) and reward system (IA) will provide the requiredkind of productive technical work force to delivery the services and the marketingpersonnel (IA) to acquire new customers.
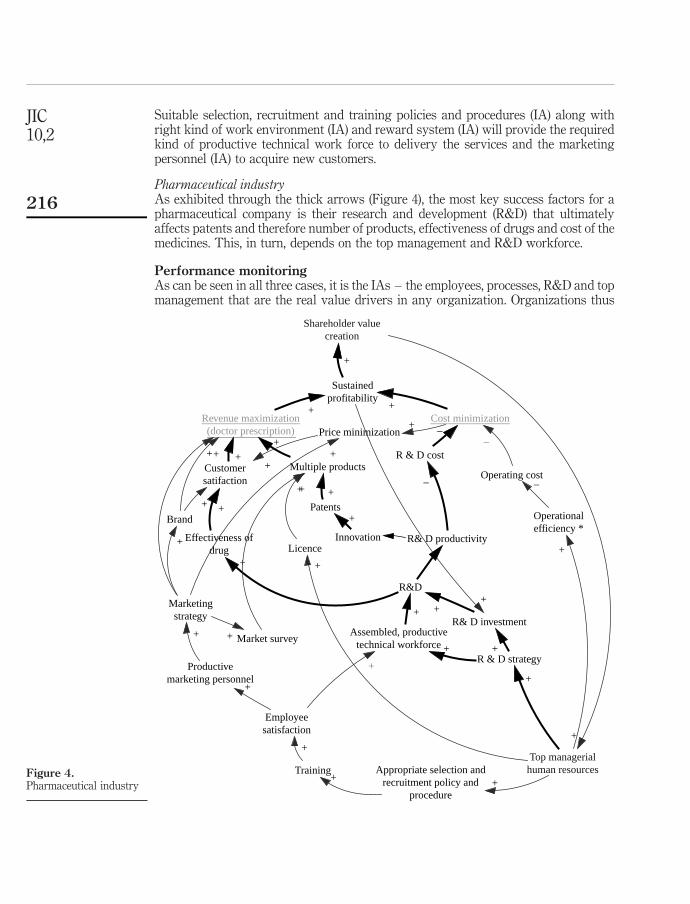
Pharmaceutical industryAs exhibited through the thick arrows (Figure 4), the most key success factors for apharmaceutical company is their research and development (R&D) that ultimatelyaffects patents and therefore number of products, effectiveness of drugs and cost of themedicines. This, in turn, depends on the top management and R&D workforce.
Performance monitoringAs can be seen in all three cases, it is the IAs – the employees, processes, R&D and topmanagement that are the real value drivers in any organization. Organizations thus
Figure 4.Pharmaceutical industry
Shareholder valuecreation
Sustainedprofitability
R & D cost
Cost minimizationRevenue maximization(doctor prescription)
++
Operating cost
Price minimization
R& D productivity
+
–
R & D strategy
Assembled, productivetechnical workforce
Top managerialhuman resources
Employeesatisfaction
Training Appropriate selection andrecruitment policy and
procedure
+ +
+
Productivemarketing personnel
Marketingstrategy
+
+
+
+
–
–
+
Brand
Customersatifaction
Effectiveness ofdrug
+
+ +
++
Multiple products
+
Patents
LicenceInnovation
R&D
R& D investment
+
+
+
+
+
+
+
+
+
+
+
Market survey+
+
Operationalefficiency *
–
+
+
+
+
JIC10,2
216
need to layout their value driver maps (causal model) and identify the key intangiblesthat need to be tracked. The causal network of intangibles provides not only a preciserepresentation of the organization’s current critical IAs but also those that need to bedeveloped in future to meet its strategic objectives. Once the cause-and-effectrelationship is established there is a need to validate the same. We need to assess theusefulness of the measure? In our hotel example, large turnover of sweepers cannot beconsidered in the same light as large turnover of cooks. So which employees’satisfactions are more important have to be identified. Each parameter then needs to bemeasured using a valid and reliable measurement technique. To meet the goals desiredperformance targets are set. Suitable remedial actions can be taken if variables in valuechain are not up to the mark so as to improve future performance. Consistentperformance of the key variables will ultimately lead to the organizations creatingshareholders wealth.
MeasurementOnce critical intangibles have been identified and causal relationship established, thefirm needs to define specific set of indicator for each intangible. Indicators should befeasible, i.e. easy to measure. The effort and cost of measurement should not be so highas to set-off any benefit derived thereby. Indicators must be understandable andbeneficial to the user. The user must know how to improve the measure. Indicator to beuseful must be consistent, comparable, relevant, and reliable (adopted from Statementof Financial Accounting Concepts (CON) 2: Qualitative Characteristics of AccountingInformation, FASB):
(1) Comparable. The characteristic of comparability allows the users to assessthe similarities and differences either among different companies for thesame time period or for the same company over different time periods.Comparisons are usually made on the basis of quantifiable measurements ofa common characteristic. Therefore, to be comparable, the measurements usedmust be reliable with respect to the common characteristic. Non-comparabilitycan result from the use of different inputs, procedures, or systems ofclassification.
(2) Consistent. The characteristic of consistency also contributes to indicatorusefulness. Consistency requires the use of the same principles in measurementfrom one period to another. Consistency does not insure comparability.Non-comparability can also arise when the data measurements lackrepresentational faithfulness.
(3) Relevant. An indicator is relevant if it makes a difference to the user in his/herability to improve performance and create value. To be relevant, it must betimely: although timeliness alone will not make an indicator relevant, indicatorsmust be timely to be relevant. It must be available before it loses its ability toinfluence the users’ actions.
(4) Reliable. Indicators are a reflection of the firm’s activities. To be reliable, theymust be verifiable, neutral, and a truthful representation:. Verifiability means that several independent measures will obtain the same
result. A measure that can be repeated with the same result (consensus) isdesirable because it serves to detect and reduce measurer bias. The direct
Monitoring andmeasuringintangibles
217

verification of a measure would serve to minimize measurer bias andmeasurement bias. The verification of the procedures used to obtain themeasure would minimize measurer bias only. Finally, verifiability does notguarantee representational faithfulness or relevance.
. The characteristic of neutrality means that the indicator should be objectiveand unbiased and not attempt to influence behavior in a particular direction.This does not mean that the indicator should not influence behavior or that itshould affect everyone in the same way. It means that indicator should notfavor certain interest groups.
. The characteristic of representational faithfulness implies that indicatorsmust represent that which it is intended to represent. It should be truthfuland present the real situation that it represents. It should not be bias. Bias isthe tendency for a measure to be consistently too high or too low. Bias mayarise because the measurer does not use the measurement method properlyor because the measurement method does not represent what it purports torepresent.
The indicators may be general, comparing across firms and industries, say, employeeturnover ratio or advertisement expenses to sales or industry specific so that onlycomparison among companies within the same industry is possible, e.g. no. ofprofessors in different subjects in a business school, or even firm specific, the definitiondiffers from company to company and comparisons are hard to make or do not makesense, e.g. ratio of delay in report X and absentees of employee Y.
Indicators derive their data from either financial sources (revenue/R&Dexpenditure) or non-financial sources (number of defects in a batch) or may combineboth (average training expenses per employee category or telephone expenses percustomer, Table I):
The set of indicators (MERITUM Guidelines) used by the firm is a dynamic set. If they are tobe useful for management purposes, they should reflect changes and the learning effectsaccomplished by the organization. Simultaneously, if the company and its stake holders mustvisualize the dynamics of a situation, it may be necessary to make comparisons acrossperiods. Consequently, a core and stable set of indicators should be kept over a relatively longperiod of time.
Finally, the indicators must measure and monitor intangibles serving the process ofvalue creation.
ConclusionThe success of any organization, thus, depends on a network of interrelated IAs thataffect each other and the crux is to ensure that each of these is performing as desired.The use of a causal model clearly demonstrating the cause-and-effect relationshipsbetween key variables and ultimate objectives, help companies identify whichintangibles needed to be constantly monitored using suitable indicators to achieve thedesired goals. A study conducted by Wharton School and PricewaterhouseCoopers(Ittner and Larker, 2003) shows that companies that use causal models laying downcause-and-effect relationship between drivers of success and outcomes had “on average2.95% higher return on assets and 5.14% higher return on equity” than companies that
JIC10,2
218

Sou
rce
ofin
form
atio
nIn
tan
gib
leca
teg
ory
Fin
anci
alF
inan
cial
and
non
-fin
anci
al(R
s)N
on-fi
nan
cial
Hu
man
cap
ital
Tot
alem
plo
yee
exp
ense
sT
rain
ing
exp
ense
sT
rain
ing
exp
ense
/tot
alex
pen
ses
Tra
inin
gex
pen
se/a
dm
inis
trat
ive
exp
ense
s(%
)(S
N)
Tra
inin
gex
pen
ses/
tota
lem
plo
yee
exp
ense
Mar
ket
val
ue/
emp
loy
eeA
sset
s/em
plo
yee
Fix
edas
sets
/em
plo
yee
Inco
me/
emp
loy
eeV
alu
e-ad
ded
/em
plo
yee
Inv
oici
ng
/em
plo
yee
Tra
inin
gex
pen
ses/
emp
loy
ee
Lea
der
ship
ind
ex(%
)M
otiv
atio
nin
dex
(%)
Em
pow
erm
ent
ind
ex(r
esp
onsi
bil
ity
/au
thor
ity
)E
mp
loy
eesa
tisf
acti
onin
dex
No.
ofem
plo
yee
sE
ffici
ency
:ou
tpu
t/em
plo
yee
(un
its)
Av
erag
ew
ork
ing
hou
rsT
rain
ing
/em
plo
yee
(tim
e)In
form
atio
nte
chn
olog
y(I
T)
lite
racy
ofem
plo
yee
s(%
)A
ver
age
sati
sfac
tion
wit
hco
mp
eten
ced
evel
oped
Per
cen
tag
eof
wor
kfo
rce
wit
hy
earl
yjo
bro
tati
onA
ver
age
emp
loy
eere
ten
tion
Av
erag
ey
ears
inco
mp
any
Av
erag
eag
eof
emp
loy
ee(y
ears
)A
ver
age
edu
cati
onle
vel
Per
cen
tag
eof
emp
loy
ees
wit
hp
ost-
gra
du
ate,
gra
du
ate,
and
sch
ool
lev
elq
ual
ifica
tion
sA
ver
age
pro
fess
ion
alex
per
ien
ce(y
ears
)S
kil
led
/un
skil
led
Gra
du
ates
/tot
alP
ost-
gra
du
ates
/tot
alE
mp
loy
eetu
rnov
erE
xp
ert
turn
over
Man
ager
stu
rnov
erW
ork
ers
turn
over
Man
ager
s/w
ork
ers
Mal
e/fe
mal
eF
emal
em
anag
ers
(%)
(continued
)
Table I.Indicators for measuring
performanceof different IAs
Monitoring andmeasuringintangibles
219

Sou
rce
ofin
form
atio
nIn
tan
gib
leca
teg
ory
Fin
anci
alF
inan
cial
and
non
-fin
anci
al(R
s)N
on-fi
nan
cial
Cu
stom
er-r
elat
edS
ales
from
top
cust
omer
(Rs)
Sal
esfr
omto
pfi
ve
cust
omer
(Rs)
Sal
esfr
omto
pcu
stom
er/t
otal
sale
sS
ales
from
top
fiv
ecu
stom
er/t
otal
sale
s
Cu
stom
ersi
ze:
ann
ual
pu
rch
ase
per
cust
omer
Su
pp
ort
exp
ense
s/cu
stom
erS
erv
ices
exp
ense
s/cu
stom
er
Cu
stom
erti
me/
emp
loy
eeat
ten
dan
ce(%
)N
um
ber
ofac
cou
nts
Cu
stom
er/e
mp
loy
eeC
ust
omer
sco
nta
cted
(no.
)C
ust
omer
sco
nta
cted
(%)
Cu
stom
ers
vis
ited
(no.
)C
ust
omer
sv
isit
ed(%
)N
o.of
rep
eat
cust
omer
sR
ate
ofre
pea
tcu
stom
ers
(%)
Cu
stom
erd
ura
tion
ortu
rnov
erra
teA
ver
age
cust
omer
du
rati
on/l
oyal
tyti
me
Cu
stom
ers
vis
itin
gco
mp
any
(no.
)C
ust
omer
sv
isit
ing
web
site
Av
erag
eco
nta
cts
by
cust
omer
sD
ays
spen
tv
isit
ing
cust
omer
s(n
o.)
Dir
ect
com
mu
nic
atio
ns
tocu
stom
er(n
o.)
Cu
stom
erra
tin
gin
dex
Cu
stom
ersa
tisf
acti
onin
dex
No.
ofcu
stom
ers/
no.
ofem
plo
yee
sd
irec
tly
inv
olv
edA
nn
ual
pu
rch
ase
per
cust
omer
(no.
)C
ust
omer
slo
st(n
o.)
Cu
stom
erIT
lite
racy
rate
(%)
Imag
een
han
cin
gcu
stom
ers
Mar
ket
-rel
ated
Mar
ket
ing
exp
ense
s/to
tal
exp
ense
s(%
)S
ales
/mar
ket
ing
exp
ense
s(%
)In
ves
tmen
tin
dev
elop
ing
new
mar
ket
s(R
s)
Sal
es/c
ust
omer
Sal
es/n
ewcu
stom
ers
Sal
es/e
mp
loy
eeS
ales
/fro
nt-
lin
eem
plo
yee
sM
ark
etin
gex
pen
ses
cust
omer
Sal
es/e
mp
loy
eeM
ark
etin
gex
pen
ses/
pro
du
ctli
ne
Mar
ket
ing
exp
ense
s/p
rod
uct
Mar
ket
shar
e(%
)N
o.of
pro
du
cts
Pro
du
cts
sold
Pro
spec
tiv
ecu
stom
ers
vis
ited
orco
nta
cted
(no.
)P
rosp
ecti
ve
cust
omer
sv
isit
edor
con
tact
ed(%
)P
oin
tsof
sale
(no.
)N
o.of
new
acco
un
tsA
ver
age
tim
efr
omcu
stom
erco
nta
ctto
sale
Rat
ioof
con
tact
tosa
les
clos
ed(continued
)
Table I.
JIC10,2
220

Sou
rce
ofin
form
atio
nIn
tan
gib
leca
teg
ory
Fin
anci
alF
inan
cial
and
non
-fin
anci
al(R
s)N
on-fi
nan
cial
Inn
ovat
ion
and
R&
DIn
com
efr
omn
ewb
usi
nes
sop
erat
ion
s(R
s)R
etu
rnon
net
asse
tsfr
oma
new
bu
sin
ess
oper
atio
n(R
s)R
even
ue
from
new
pat
ents
Net
rev
enu
efr
omn
ewp
aten
tsIn
ves
tmen
tin
R&
DR
&D
retu
rnon
inv
estm
ent
R&
Dex
pen
ses/
rev
enu
e(%
)R
&D
exp
ense
s/to
tal
exp
ense
s(%
)R
&D
inv
estm
ent
inb
asic
rese
arch
(%)
R&
Din
ves
tmen
tin
pro
du
ctre
sear
ch(%
)R
&D
inap
pli
edre
sear
ch(%
)R
&D
asse
ts/t
otal
asse
tsIn
ves
tmen
tin
com
pet
itiv
ein
tell
igen
cep
rog
ram
(Rs)
Com
pet
ency
dev
elop
men
tex
pen
ses/
emp
loy
ee(S
N)
Tra
inin
gex
pen
ses/
emp
loy
ee
Per
cen
tag
eof
new
pro
du
cts
reac
hin
gm
ark
etN
o.of
new
pro
du
cts
New
pro
du
cts
ind
evel
opm
ent
Av
erag
ees
tim
ated
age
ofp
rod
uct
sN
o.of
pat
ents
No.
ofn
ewp
aten
tsA
ver
age
age
ofp
aten
tsN
o.of
pat
ent
app
lica
tion
sR
&D
emp
loy
ees/
tota
lem
plo
yee
sT
rain
ing
hou
rs
Pro
cess
-rel
ated
Ad
min
istr
ativ
eex
pen
ses/
tota
lex
pen
ses
(%)
Ad
min
istr
ativ
eex
pen
ses/
tota
lre
ven
ue
(%)
Inv
estm
ent
inIT
/rev
enu
e(%
)
Ad
min
istr
ativ
eex
pen
ses/
emp
loy
ees
Ad
min
istr
ativ
eex
pen
ses/
cust
omer
ITex
pen
ses/
emp
loy
ee
Pro
du
ctiv
ity
Pro
cess
ing
tim
eA
ver
age
ord
erre
spon
seti
me
No.
ofer
rors
Per
cen
tag
eof
erro
rsto
outp
ut
Ou
tpu
t/em
plo
yee
Fu
nct
ion
poi
nt/
emp
loy
eeA
dm
inis
trat
ive
staf
f/to
tal
emp
loy
ees
(%)
Per
cen
tag
eof
crit
ical
pro
cess
esth
ath
ave
am
anu
alR
elat
ion
ship
and
coll
abor
atio
nIn
ves
tmen
tin
stra
teg
icp
artn
ersh
ipd
evel
opm
ent
(Rs)
Com
mon
trai
nin
gp
rog
ram
sof
com
pan
yan
dp
artn
ers
(Rs)
Com
mon
cust
omer
acti
vit
ies
wit
hco
mp
any
and
par
tner
sC
omp
any
pro
du
cts
orco
mp
onen
tsd
esig
ned
by
par
tner
sC
omm
ontr
ain
ing
pro
gra
ms
ofco
mp
any
and
par
tner
s(n
os)
Source:
Com
pli
edfr
omd
iffe
ren
tw
ork
san
dow
n
Table I.
Monitoring andmeasuringintangibles
221

do not use causal models. In a dynamic, complex, and competitive global businessenvironment that is a need to continuously refine the cause-and-effect diagram asrelationships undergo transformation changing the value drivers.
References
Bygdas, A.L., Royrvik, E. and Gjerde, B. (2004), “Integrative visualization and knowledgeenabled value creation: an activity based approach to intellectual capital”, Journal ofIntellectual Capital, Vol. 5 No. 4, pp. 540-55.
Chen, J., Zhu, Z. and Xie, H.Y. (2004), “Measuring intellectual capital: a new model and empiricalstudy”, Journal of Intellectual capital, Vol. 5 No. 1, pp. 196-212.
Ittner, C.D. and Larker, D.F. (2003), “Coming up short on non-financial performancemeasurement”, Harvard Business Review, November, pp. 88-95.
Jack, A. (n.d.), “Value mapping: a second generation performance measurement and performancemanagement solution”, available at: www.valuebasedmanagement.net/articles_jack_value_mapping_second_generation_performance_management.pdf
Kaplan, R.S. and Norton, D.P. (2004), “Measuring the strategic readiness of intangible assets”,Harvard Business Review, February, pp. 52-63.
Marr, B., Suchiuma, G. and Neely, A. (2004), “The dynamics of value creation: mapping yourintellectual performance drivers”, Journal of Intellectual Capital, Vol. 5 No. 2, pp. 312-25.
MERITUM (2001), Guidelines for Managing and Reporting on Intangibles, Programa TargetedSocio Economic Research – TSER, European Union, Brussels, available at: www.urjc.es/innotec/tools/MERITUM%20Guidelines.pdf
Further reading
Allen, D. (2001), “Hard currency”, Financial Management, Caspian Publishing, London,14719185, January.
Edvinsson, L. and Malone, M.S. (1997), Intellectual Capital, Harper Collins, New York, NY.
Epstein, B.J., Nach, R. and Bragg, S.M. (2006), GAAP 2006, Interpretations and Applications ofGenerally Accepted Accounting Principals, Wiley, New York, NY.
Foster, B.P. and Stout, W.D. (2003), “Valuing intangible assets”, CPA Journal, October, pp. 52-4.
Jhunjhunwala, S. (2005), “Does the market understand intangibles”, The CA Journal ICAI, July,pp. 123-7.
Jhunjhunwala, S. (2007), paper presented at National Conference on System Dynamics atInstitute of Public Enterprise, Hyderabad, June 28-29.
Lev, B. (2001), Intangibles, Management, Measurement and Reporting, Brookings InstitutionPress, Washington, DC.
Lev, B. (2004), “Sharpening the intangible edge”, Harvard Business Review, June, pp. 109-16.
Mard, J.M., Hichner, J.R., Hyden, S.D. and Zyla, M.L. (2002), Valuation for Financial Reporting –Intangible Assets, Goodwill and Impairment Analysis, SFAS 141 and 142, Wiley,New York, NY.
Richmond, B. (2001), Introduction to System Thinking, High Performance, Hanover, NH.
Sternman, J. (2000), Business Dynamics: Systems Thinking and Modeling for a Complex World,McGraw-Hill, New York, NY.
Ulrish, D. and Smallwood, N. (2004), “Capitalizing on capabilities”, Harvard Business Review,June, pp. 119-27, available at: www.iseesystems.com
JIC10,2
222

About the authorShital Jhunjhunwala is an Assistant Professor in the Institute of Public Enterprise, she is aFellow Member of the Institute of Chartered Accountants of India, a cost accountant andmanagement graduate from Indian Institute of Management – Calcutta. She has over five yearsof experience in accounting, auditing, and credit appraisal having worked in diverse sectorsincluding manufacturing, dot-com and financial services. She has been teaching and conductingresearch in the areas of cost and management accounting, investment planning, valuation,intangible assets, and corporate social responsibility. She has conducted managementdevelopment programs for senior executives and faculty development program in the area offinance and management. She has also conducted national level conferences. She has publishedarticles in reputed journals and presented papers in a number of international conferences. Shepresented a paper at an International Conference on Business and Information (BAI 2006) atSingapore in July 2006. She is a reviewer for Contemporary Management Review an internationaljournal of Academy of Taiwan Information Systems Research. Shital Jhunjhunwala can becontacted at: [email protected]
To purchase reprints of this article please e-mail: [email protected] visit our web site for further details: www.emeraldinsight.com/reprints
Monitoring andmeasuringintangibles
223