monitoring applications that support the host … measurements manuals...figure 2.8: the tests...
TRANSCRIPT

Monitoring Applications that Support the
Host Resources MIB
eG Enterprise 6

Restricted Rights Legend
The information contained in this document is confidential and subject to change without notice. No
part of this document may be reproduced or disclosed to others without the prior permission of eG
Innovations Inc. eG Innovations Inc. makes no warranty of any kind with regard to the software and
documentation, including, but not limited to, the implied warranties of merchantability and fitness for
a particular purpose.
Trademarks
Microsoft Windows, Windows NT, Windows 2000, Windows 2003 and Windows 2008 are either
registered trademarks or trademarks of Microsoft Corporation in United States and/or other countries.
The names of actual companies and products mentioned herein may be the trademarks of their
respective owners.
Copyright
©2014 eG Innovations Inc. All rights reserved.
Table of Contents INTRODUCTION ................................................................................................................................................................................................... 1
MONITORING AS/400 SERVERS ....................................................................................................................................................................... 2
2.1 THE OPERATING SYSTEM LAYER ................................................................................................................................................................. 3 2.1.1 HostDevice Test .............................................................................................................................................................................. 3 2.1.2 HostStorage Test ............................................................................................................................................................................. 5 2.1.3 HostSystem Test .............................................................................................................................................................................. 7 2.1.4 IbmCpu Test .................................................................................................................................................................................... 9 2.1.5 HostProcessor Test ....................................................................................................................................................................... 11
2.2 THE NETWORK LAYER ............................................................................................................................................................................... 13 2.3 THE TCP LAYER ......................................................................................................................................................................................... 13 2.4 THE APPLICATION PROCESSES LAYER........................................................................................................................................................ 14
2.4.1 HostProcess Test .......................................................................................................................................................................... 14 2.5 THE AS400 SYSTEM LAYER ....................................................................................................................................................................... 17
2.5.1 AS400Pools Test ........................................................................................................................................................................... 17 2.5.2 AS400Services Test ....................................................................................................................................................................... 18 2.5.3 AS400Storage Test ........................................................................................................................................................................ 20 2.5.4 AS400SubSystems Test .................................................................................................................................................................. 21 2.5.5 AS400Users Test ........................................................................................................................................................................... 22
2.6 THE AS400 QUEUES LAYER ....................................................................................................................................................................... 24 2.6.1 AS400MessageQueues Test........................................................................................................................................................... 24 2.6.2 AS400UsrMsgQ Test..................................................................................................................................................................... 25
2.7 THE AS400 JOBS LAYER ............................................................................................................................................................................ 26 2.7.1 AS400Jobs Test ............................................................................................................................................................................. 27 2.7.2 AS400BatchJobs Test .................................................................................................................................................................... 28 2.7.3 AS400ChkJob Test ........................................................................................................................................................................ 30
MONITORING OPENVMS SERVERS.............................................................................................................................................................. 33
3.1 THE OPERATING SYSTEM LAYER ............................................................................................................................................................... 33 3.2 THE NETWORK LAYER ............................................................................................................................................................................... 34 3.3 THE TCP LAYER ......................................................................................................................................................................................... 34 3.4 THE APPLICATION PROCESSES LAYER........................................................................................................................................................ 35
MONITORING GENERIC NETWARE SERVERS .......................................................................................................................................... 36
4.1 THE OPERATING SYSTEM LAYER ............................................................................................................................................................... 36 4.1.1 NwMemory Test ............................................................................................................................................................................ 37 4.1.2 NwFileSystems Test ...................................................................................................................................................................... 39 4.1.3 NwProcessor Test ......................................................................................................................................................................... 41 4.1.4 NwVolumeSpace Test .................................................................................................................................................................... 44
4.2 THE NETWORK LAYER ............................................................................................................................................................................... 46 4.3 THE TCP LAYER ......................................................................................................................................................................................... 47 4.4 THE APPLICATION PROCESSES LAYER........................................................................................................................................................ 47
4.4.1 NwProcesses Test ......................................................................................................................................................................... 47
MONITORING SNMP GENERIC SERVERS ................................................................................................................................................... 51
CONCLUSION ...................................................................................................................................................................................................... 52

Table of Figures
Figure 2.1: Layer model of an AS/400 server ............................................................................................................................................................ 3 Figure 2.2: The tests associated with the Operating System layer ............................................................................................................................. 3 Figure 2.3: The tests associated with the Network layer .......................................................................................................................................... 13 Figure 2.4: The test associated with the Tcp layer ................................................................................................................................................... 14 Figure 2.5: The test associated with the Application Processes layer ...................................................................................................................... 14 Figure 2.6: The tests associated with the AS400 System layer ................................................................................................................................ 17 Figure 2.7: The test mapped to the AS400 Queue layer ......................................................................................................................................... 24 Figure 2.8: The tests mapped to the AS400 Jobs layer ............................................................................................................................................ 27 Figure 3.1: The layer model of an OpenVMS server ............................................................................................................................................... 33 Figure 3.2: The tests associated with the Operating System layer ........................................................................................................................... 34 Figure 3.3: The tests associated with the Network layer .......................................................................................................................................... 34 Figure 3.4: The test associated with the Tcp layer ................................................................................................................................................... 35 Figure 3.5: The test associated with the Application Processes layer ...................................................................................................................... 35 Figure 4.1: The layer model of a Generic Netware server ....................................................................................................................................... 36 Figure 4.2: The tests associated with the Operating System layer ........................................................................................................................... 37 Figure 4.3: The tests associated with the Network layer .......................................................................................................................................... 46 Figure 4.4: The test associated with the Tcp layer ................................................................................................................................................... 47 Figure 4.5: The test associated with the Application Processes layer ...................................................................................................................... 47 Figure 5.1: The layer model of an SNMP Generic server ........................................................................................................................................ 51

I n t r o d u c t i o n
1
Introduction Many server operating systems support the SNMP Host Resources MIB (RFC 2790) that allows
monitoring systems to collect critical performance and usage statistics from the servers. The list
includes: OS400, Novell Netware, OpenVMS etc.
eG Enterprise, by default, monitors such operating systems and servers in an ‘agentless’ manner –
i.e., using a remote agent, which is typically deployed on an external host and not on the monitored
host. For further details on eG Enterprise’s Agentless Monitoring capability, please refer to the eG User
Manual.
This document discusses the monitoring models that eG Enterprise offers for measuring the health of
such servers.
Chapter
1
M o n i t o r i n g A S / 4 0 0 S e r v e r s
2
Monitoring AS/400 Servers The AS/400 server - formally renamed the "IBM iSeries," but still commonly known as AS/400 - is a
midrange server, which executes on the OS/400 operating system, and uses the PowerPC
microprocessor with its reduced instruction set computer technology. The AS/400 is widely installed in
large enterprises at the department level, in small corporations, in government agencies, and in
almost every industry segment, for one/more of the following purposes:
Data warehousing: With multi-gigabytes of RAM and multi-terabytes of hard disk space, the
AS/400 can be a repository for large amounts of company data to which data mining could be
applied.
Java application development: With its closely integrated Java virtual machine and new
tools designed by IBM for building commercial applications with Java, the AS/400 can be used
as a development system.
Web and e-commerce serving: Equipped with a Web server and applications designed to
support e-commerce (taking orders, tracking orders, providing service to customers, working
with partners and suppliers) and with firewall capabilities, the AS/400 can handle Internet
serving.
Corporate groupware services: Assuming that Domino and Notes have been included with
the system, it's designed to quickly provide a corporation with sophisticated e-mail, project file
sharing, whiteboards, and electronic collaboration.
Owing to its wide reach and wider functionality, the AS400 server plays a crucial role in the delivery of
many critical end-user services. The 100% availability and peak performance of the AS400 server is
therefore key to the proper functioning of the service. To ensure this, the health of the server should
be continuously monitored.
eG Enterprise prescribes a specialized AS400 monitoring model (see Figure 2.1), which uses SNMP to
extract and analyze a wealth of performance metrics from the server and the OS400 operating
system, and thus report operational deficiencies.
Chapter
2
M o n i t o r i n g A S / 4 0 0 S e r v e r s
3
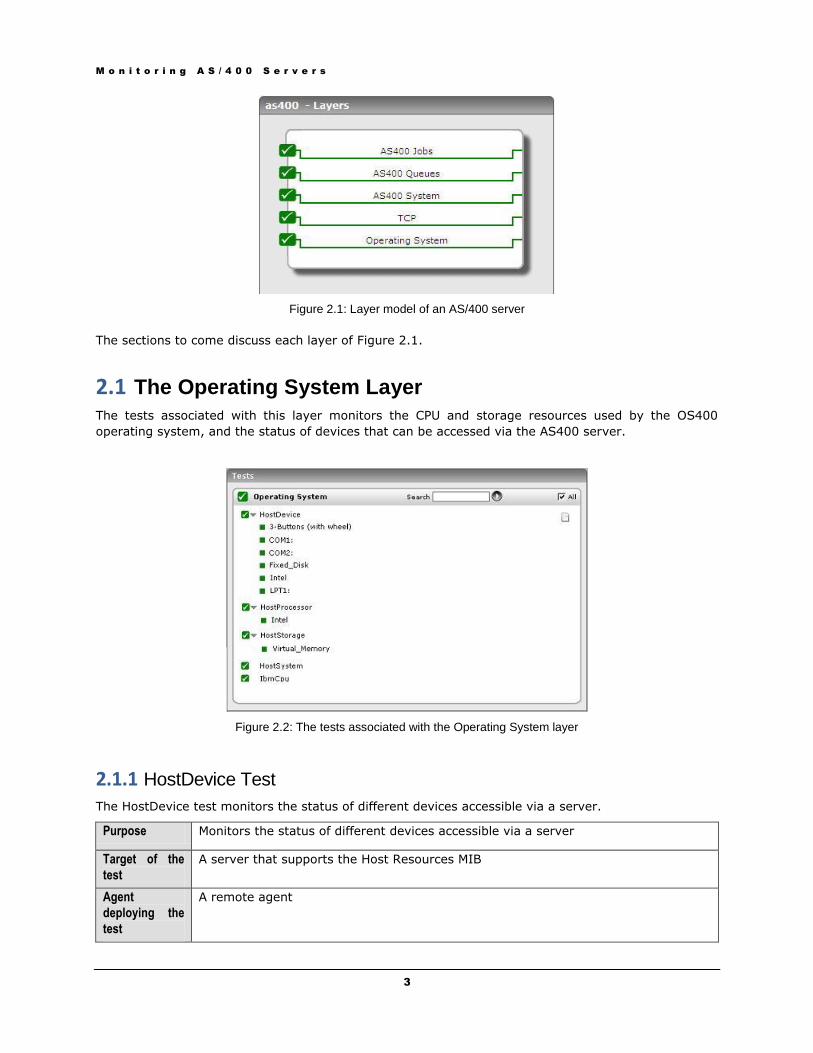
Figure 2.1: Layer model of an AS/400 server
The sections to come discuss each layer of Figure 2.1.
2.1 The Operating System Layer
The tests associated with this layer monitors the CPU and storage resources used by the OS400
operating system, and the status of devices that can be accessed via the AS400 server.
Figure 2.2: The tests associated with the Operating System layer
2.1.1 HostDevice Test
The HostDevice test monitors the status of different devices accessible via a server.
Purpose Monitors the status of different devices accessible via a server
Target of the
test
A server that supports the Host Resources MIB
Agent
deploying the
test
A remote agent

M o n i t o r i n g A S / 4 0 0 S e r v e r s
4
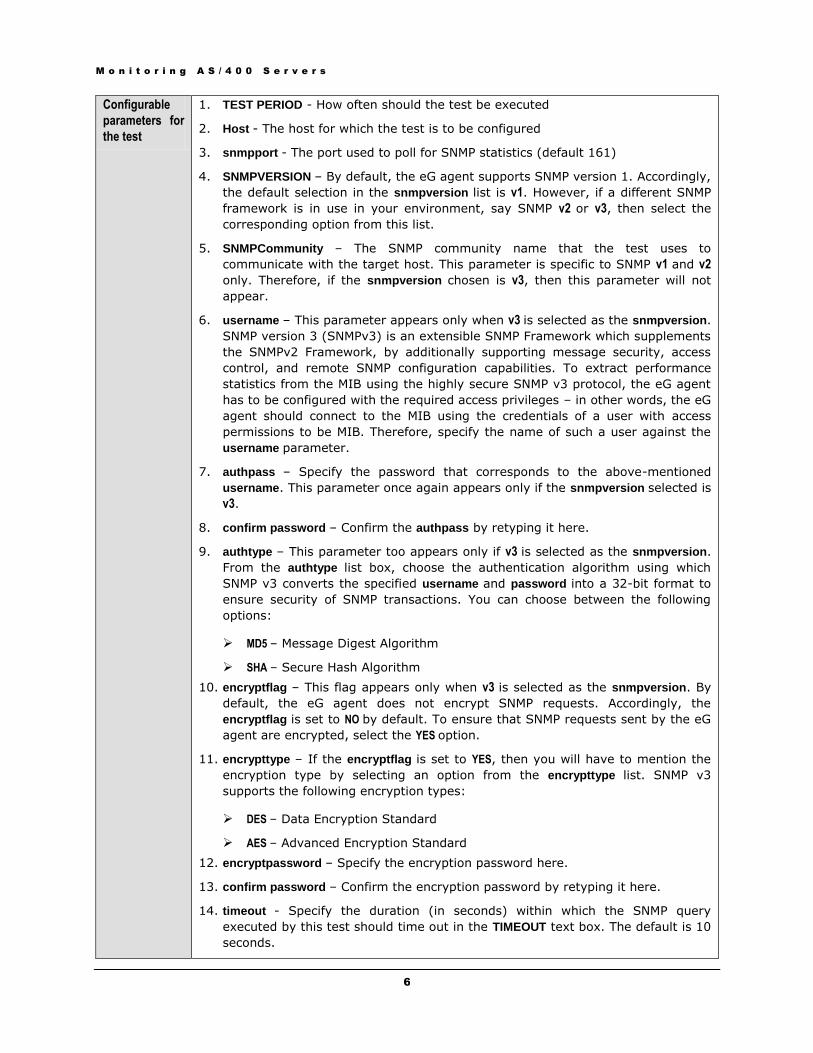
Configurable
parameters for
the test
1. TEST PERIOD - How often should the test be executed
2. Host - The host for which the test is to be configured
3. snmpport - The port used to poll for SNMP statistics (default 161)
4. SNMPVERSION – By default, the eG agent supports SNMP version 1. Accordingly,
the default selection in the snmpversion list is v1. However, if a different SNMP
framework is in use in your environment, say SNMP v2 or v3, then select the
corresponding option from this list.
5. SNMPCommunity – The SNMP community name that the test uses to
communicate with the target host. This parameter is specific to SNMP v1 and v2
only. Therefore, if the snmpversion chosen is v3, then this parameter will not
appear.
6. username – This parameter appears only when v3 is selected as the snmpversion.
SNMP version 3 (SNMPv3) is an extensible SNMP Framework which supplements
the SNMPv2 Framework, by additionally supporting message security, access
control, and remote SNMP configuration capabilities. To extract performance
statistics from the MIB using the highly secure SNMP v3 protocol, the eG agent
has to be configured with the required access privileges – in other words, the eG
agent should connect to the MIB using the credentials of a user with access
permissions to be MIB. Therefore, specify the name of such a user against the
username parameter.
7. authpass – Specify the password that corresponds to the above-mentioned
username. This parameter once again appears only if the snmpversion selected is
v3.
8. confirm password – Confirm the authpass by retyping it here.
9. authtype – This parameter too appears only if v3 is selected as the snmpversion.
From the authtype list box, choose the authentication algorithm using which
SNMP v3 converts the specified username and password into a 32-bit format to
ensure security of SNMP transactions. You can choose between the following
options:
MD5 – Message Digest Algorithm
SHA – Secure Hash Algorithm
10. encryptflag – This flag appears only when v3 is selected as the snmpversion. By
default, the eG agent does not encrypt SNMP requests. Accordingly, the
encryptflag is set to NO by default. To ensure that SNMP requests sent by the eG
agent are encrypted, select the YES option.
11. encrypttype – If the encryptflag is set to YES, then you will have to mention the
encryption type by selecting an option from the encrypttype list. SNMP v3
supports the following encryption types:
DES – Data Encryption Standard
AES – Advanced Encryption Standard
12. encryptpassword – Specify the encryption password here.
13. confirm password – Confirm the encryption password by retyping it here.
14. timeout - Specify the duration (in seconds) within which the SNMP query
executed by this test should time out in the TIMEOUT text box. The default is 10
seconds.

M o n i t o r i n g A S / 4 0 0 S e r v e r s
5
Outputs of the
test
One set of results for every device being accessed via the server being monitored
Measurements
made by the
test
Measurement Measurement
Unit Interpretation
Current status:
This measure indicates
the current status of a
device that is accessible
via the server.
Number A value of 0 indicates that the device is
operating normally. A value of 1
indicates that there is a warning
associated with the device, whereas a
value of 2 signifies an error.
Errors
This measure indicates
the number of errors
associated with a device
that occurred during the
last measurement
period.
Number An unusually high number of device
errors signifies a problem.
2.1.2 HostStorage Test
This test auto-discovers all the storage areas of a server and tracks the usage of each of these areas.
Purpose Auto-discovers all the storage areas associated with a server
Target of the
test
A server that supports the Host Resources MIB
Agent
deploying the
test
A remote agent
M o n i t o r i n g A S / 4 0 0 S e r v e r s
6
Configurable
parameters for
the test
1. TEST PERIOD - How often should the test be executed
2. Host - The host for which the test is to be configured
3. snmpport - The port used to poll for SNMP statistics (default 161)
4. SNMPVERSION – By default, the eG agent supports SNMP version 1. Accordingly,
the default selection in the snmpversion list is v1. However, if a different SNMP
framework is in use in your environment, say SNMP v2 or v3, then select the
corresponding option from this list.
5. SNMPCommunity – The SNMP community name that the test uses to
communicate with the target host. This parameter is specific to SNMP v1 and v2
only. Therefore, if the snmpversion chosen is v3, then this parameter will not
appear.
6. username – This parameter appears only when v3 is selected as the snmpversion.
SNMP version 3 (SNMPv3) is an extensible SNMP Framework which supplements
the SNMPv2 Framework, by additionally supporting message security, access
control, and remote SNMP configuration capabilities. To extract performance
statistics from the MIB using the highly secure SNMP v3 protocol, the eG agent
has to be configured with the required access privileges – in other words, the eG
agent should connect to the MIB using the credentials of a user with access
permissions to be MIB. Therefore, specify the name of such a user against the
username parameter.
7. authpass – Specify the password that corresponds to the above-mentioned
username. This parameter once again appears only if the snmpversion selected is
v3.
8. confirm password – Confirm the authpass by retyping it here.
9. authtype – This parameter too appears only if v3 is selected as the snmpversion.
From the authtype list box, choose the authentication algorithm using which
SNMP v3 converts the specified username and password into a 32-bit format to
ensure security of SNMP transactions. You can choose between the following
options:
MD5 – Message Digest Algorithm
SHA – Secure Hash Algorithm
10. encryptflag – This flag appears only when v3 is selected as the snmpversion. By
default, the eG agent does not encrypt SNMP requests. Accordingly, the
encryptflag is set to NO by default. To ensure that SNMP requests sent by the eG
agent are encrypted, select the YES option.
11. encrypttype – If the encryptflag is set to YES, then you will have to mention the
encryption type by selecting an option from the encrypttype list. SNMP v3
supports the following encryption types:
DES – Data Encryption Standard
AES – Advanced Encryption Standard
12. encryptpassword – Specify the encryption password here.
13. confirm password – Confirm the encryption password by retyping it here.
14. timeout - Specify the duration (in seconds) within which the SNMP query
executed by this test should time out in the TIMEOUT text box. The default is 10
seconds.

M o n i t o r i n g A S / 4 0 0 S e r v e r s
7
Outputs of the
test
One set of results for every storage area on the server being monitored
Measurements
made by the
test
Measurement Measurement
Unit Interpretation
Storage size:
Represents the total
size of a storage area
associated with a
server.
GB
Usage of storage
area:
This metric denotes the
percentage capacity of
a storage area that is
currently allocated.
Percent A value close to 100% denotes a
storage area that is highly used.
Free space on
storage area:
This metric denotes the
amount of storage of a
storage area that is
currently available for
use.
GB
Allocation failures on
storage area:
The number of requests
for storage represented
by this entity that could
not be honored in the
last measurement
period because there
was not enough storage
available to service
application requests
Number Ideally, there should be no allocation
failures.
2.1.3 HostSystem Test
This test monitors the number of users accessing a server and the processes executing on a server.
Purpose Monitors the number of users accessing a server and the processes executing on a
server
Target of the
test
A server that supports the Host Resources MIB
Agent
deploying the
test
A remote agent

M o n i t o r i n g A S / 4 0 0 S e r v e r s
8
Configurable
parameters for
the test
1. TEST PERIOD - How often should the test be executed
2. Host - The host for which the test is to be configured
3. snmpport - The port used to poll for SNMP statistics (default 161)
4. SNMPVERSION – By default, the eG agent supports SNMP version 1. Accordingly,
the default selection in the snmpversion list is v1. However, if a different SNMP
framework is in use in your environment, say SNMP v2 or v3, then select the
corresponding option from this list.
5. SNMPCommunity – The SNMP community name that the test uses to
communicate with the target host. This parameter is specific to SNMP v1 and v2
only. Therefore, if the snmpversion chosen is v3, then this parameter will not
appear.
6. username – This parameter appears only when v3 is selected as the snmpversion.
SNMP version 3 (SNMPv3) is an extensible SNMP Framework which supplements
the SNMPv2 Framework, by additionally supporting message security, access
control, and remote SNMP configuration capabilities. To extract performance
statistics from the MIB using the highly secure SNMP v3 protocol, the eG agent
has to be configured with the required access privileges – in other words, the eG
agent should connect to the MIB using the credentials of a user with access
permissions to be MIB. Therefore, specify the name of such a user against the
username parameter.
7. authpass – Specify the password that corresponds to the above-mentioned
username. This parameter once again appears only if the snmpversion selected is
v3.
8. confirm password – Confirm the authpass by retyping it here.
9. authtype – This parameter too appears only if v3 is selected as the snmpversion.
From the authtype list box, choose the authentication algorithm using which
SNMP v3 converts the specified username and password into a 32-bit format to
ensure security of SNMP transactions. You can choose between the following
options:
MD5 – Message Digest Algorithm
SHA – Secure Hash Algorithm
10. encryptflag – This flag appears only when v3 is selected as the snmpversion. By
default, the eG agent does not encrypt SNMP requests. Accordingly, the
encryptflag is set to NO by default. To ensure that SNMP requests sent by the eG
agent are encrypted, select the YES option.
11. encrypttype – If the encryptflag is set to YES, then you will have to mention the
encryption type by selecting an option from the encrypttype list. SNMP v3
supports the following encryption types:
DES – Data Encryption Standard
AES – Advanced Encryption Standard
12. encryptpassword – Specify the encryption password here.
13. confirm password – Confirm the encryption password by retyping it here.
14. timeout - Specify the duration (in seconds) within which the SNMP query
executed by this test should time out in the TIMEOUT text box. The default is 10
seconds.

M o n i t o r i n g A S / 4 0 0 S e r v e r s
9
Outputs of the
test
One set of results for each server being monitored
Measurements
made by the
test
Measurement Measurement
Unit Interpretation
Current users:
The current number of
users logged in to the
server being monitored.
Number
Current processes:
The current number of
processes executing on
the server being
monitored.
Number
2.1.4 IbmCpu Test
This test monitors the CPU usage of an IBM server (RS6000, AS/400, etc.). This test uses an IBM
proprietary MIB supported on AS/400 and RS 6000 servers for extracting the required measures.
Purpose Monitors the CPU usage of an IBM server (RS6000, AS/400, etc.)
Target of the
test
An IBM AS/400 server
Agent
deploying the
test
A remote agent

M o n i t o r i n g A S / 4 0 0 S e r v e r s
10
Configurable
parameters for
the test
1. TEST PERIOD - How often should the test be executed
2. Host - The host for which the test is to be configured
3. snmpport - The port used to poll for SNMP statistics (default 161)
4. SNMPVERSION – By default, the eG agent supports SNMP version 1. Accordingly,
the default selection in the snmpversion list is v1. However, if a different SNMP
framework is in use in your environment, say SNMP v2 or v3, then select the
corresponding option from this list.
5. SNMPCommunity – The SNMP community name that the test uses to
communicate with the target host. This parameter is specific to SNMP v1 and v2
only. Therefore, if the snmpversion chosen is v3, then this parameter will not
appear.
6. username – This parameter appears only when v3 is selected as the snmpversion.
SNMP version 3 (SNMPv3) is an extensible SNMP Framework which supplements
the SNMPv2 Framework, by additionally supporting message security, access
control, and remote SNMP configuration capabilities. To extract performance
statistics from the MIB using the highly secure SNMP v3 protocol, the eG agent
has to be configured with the required access privileges – in other words, the eG
agent should connect to the MIB using the credentials of a user with access
permissions to be MIB. Therefore, specify the name of such a user against the
username parameter.
7. authpass – Specify the password that corresponds to the above-mentioned
username. This parameter once again appears only if the snmpversion selected is
v3.
8. confirm password – Confirm the authpass by retyping it here.
9. authtype – This parameter too appears only if v3 is selected as the snmpversion.
From the authtype list box, choose the authentication algorithm using which
SNMP v3 converts the specified username and password into a 32-bit format to
ensure security of SNMP transactions. You can choose between the following
options:
MD5 – Message Digest Algorithm
SHA – Secure Hash Algorithm
10. encryptflag – This flag appears only when v3 is selected as the snmpversion. By
default, the eG agent does not encrypt SNMP requests. Accordingly, the
encryptflag is set to NO by default. To ensure that SNMP requests sent by the eG
agent are encrypted, select the YES option.
11. encrypttype – If the encryptflag is set to YES, then you will have to mention the
encryption type by selecting an option from the encrypttype list. SNMP v3
supports the following encryption types:
DES – Data Encryption Standard
AES – Advanced Encryption Standard
12. encryptpassword – Specify the encryption password here.
13. confirm password – Confirm the encryption password by retyping it here.
14. timeout - Specify the duration (in seconds) within which the SNMP query
executed by this test should time out in the TIMEOUT text box. The default is 10
seconds.

M o n i t o r i n g A S / 4 0 0 S e r v e r s
11
Outputs of the
test
One set of results for every IBM AS/400 server being monitored.
Measurements
made by the
test
Measurement Measurement
Unit Interpretation
CPU utilization:
The average, over the
last minute, of the
percentage of time that
a processor was not
idle.
Percent A consistently high value of this
measure indicates that there could be a
CPU bottleneck on the server.
2.1.5 HostProcessor Test
This test monitors the CPU usage of every processor on an AS400 server.
Purpose Monitors the CPU usage of every processor on an AS400 server
Target of the
test
An AS400 server
Agent
deploying the
test
A remote agent

M o n i t o r i n g A S / 4 0 0 S e r v e r s
12
Configurable
parameters for
the test
1. TEST PERIOD - How often should the test be executed
2. Host - The host for which the test is to be configured
3. snmpport - The port used to poll for SNMP statistics (default 161)
4. SNMPVERSION – By default, the eG agent supports SNMP version 1. Accordingly,
the default selection in the snmpversion list is v1. However, if a different SNMP
framework is in use in your environment, say SNMP v2 or v3, then select the
corresponding option from this list.
5. SNMPCommunity – The SNMP community name that the test uses to
communicate with the target hostr. This parameter is specific to SNMP v1 and v2
only. Therefore, if the snmpversion chosen is v3, then this parameter will not
appear.
6. username – This parameter appears only when v3 is selected as the snmpversion.
SNMP version 3 (SNMPv3) is an extensible SNMP Framework which supplements
the SNMPv2 Framework, by additionally supporting message security, access
control, and remote SNMP configuration capabilities. To extract performance
statistics from the MIB using the highly secure SNMP v3 protocol, the eG agent
has to be configured with the required access privileges – in other words, the eG
agent should connect to the MIB using the credentials of a user with access
permissions to be MIB. Therefore, specify the name of such a user against the
username parameter.
7. authpass – Specify the password that corresponds to the above-mentioned
username. This parameter once again appears only if the snmpversion selected is
v3.
8. confirm password – Confirm the authpass by retyping it here.
9. authtype – This parameter too appears only if v3 is selected as the snmpversion.
From the authtype list box, choose the authentication algorithm using which
SNMP v3 converts the specified username and password into a 32-bit format to
ensure security of SNMP transactions. You can choose between the following
options:
MD5 – Message Digest Algorithm
SHA – Secure Hash Algorithm
10. encryptflag – This flag appears only when v3 is selected as the snmpversion. By
default, the eG agent does not encrypt SNMP requests. Accordingly, the
encryptflag is set to NO by default. To ensure that SNMP requests sent by the eG
agent are encrypted, select the YES option.
11. encrypttype – If the encryptflag is set to YES, then you will have to mention the
encryption type by selecting an option from the encrypttype list. SNMP v3
supports the following encryption types:
DES – Data Encryption Standard
AES – Advanced Encryption Standard
12. encryptpassword – Specify the encryption password here.
13. confirm password – Confirm the encryption password by retyping it here.
14. timeout - Specify the duration (in seconds) within which the SNMP query
executed by this test should time out in the TIMEOUT text box. The default is 10
seconds.

M o n i t o r i n g A S / 4 0 0 S e r v e r s
13
Outputs of the
test
One set of results for every processor on the AS400 server being monitored
Measurements
made by the
test
Measurement Measurement
Unit Interpretation
CPU utilization:
The average, over the
last minute, of the
percentage of time that
a processor was not
idle.
Percent A consistently high value of this
measure indicates that there could be a
CPU bottleneck on the server.
2.2 The Network Layer
The tests associated with the Network layer reveal whether a network connection to the AS400 server is
available or not, and also monitors the current status of the network interfaces supported by the
server.
Figure 2.3: The tests associated with the Network layer
Both the tests depicted by Figure 2.3 have been discussed in ample measure in the Monitoring Unix
and Windows Servers document. Therefore, let us proceed to look at the next layer.
2.3 The Tcp Layer
The test associated with the Tcp layer (see Figure 2.4) monitors the TCP connections and
retransmissions to the AS400 server.

M o n i t o r i n g A S / 4 0 0 S e r v e r s
14
Figure 2.4: The test associated with the Tcp layer
The TcpStatistics test displayed in Figure 2.4 has already been discussed in the Monitoring Network
Elements document. Therefore, let us focus on the Application Processes layer instead.
2.4 The Application Processes Layer
Using the HostProcess test mapped to this layer, administrators can determine whether any resource-
intensive processes are executing on the AS400 host.
Figure 2.5: The test associated with the Application Processes layer
2.4.1 HostProcess Test
The HostProcess test monitors the specific processes executing on a server and reports the resource
usage of the processes.
Purpose Monitors the processes executing on a server and reports the resource usage of
specific processes
Target of the
test
A server that supports the Host Resources MIB
Agent
deploying the
test
A remote agent

M o n i t o r i n g A S / 4 0 0 S e r v e r s
15
Configurable
parameters for
the test
1. TEST PERIOD - How often should the test be executed
2. Host - The host for which the test is to be configured
3. snmpport - The port used to poll for SNMP statistics (default 161)
4. SNMPVERSION – By default, the eG agent supports SNMP version 1. Accordingly,
the default selection in the snmpversion list is v1. However, if a different SNMP
framework is in use in your environment, say SNMP v2 or v3, then select the
corresponding option from this list.
5. SNMPCommunity – The SNMP community name that the test uses to
communicate with the target host. This parameter is specific to SNMP v1 and v2
only. Therefore, if the snmpversion chosen is v3, then this parameter will not
appear.
6. username – This parameter appears only when v3 is selected as the snmpversion.
SNMP version 3 (SNMPv3) is an extensible SNMP Framework which supplements
the SNMPv2 Framework, by additionally supporting message security, access
control, and remote SNMP configuration capabilities. To extract performance
statistics from the MIB using the highly secure SNMP v3 protocol, the eG agent
has to be configured with the required access privileges – in other words, the eG
agent should connect to the MIB using the credentials of a user with access
permissions to be MIB. Therefore, specify the name of such a user against the
username parameter.
7. authpass – Specify the password that corresponds to the above-mentioned
username. This parameter once again appears only if the snmpversion selected is
v3.
8. confirm password – Confirm the authpass by retyping it here.
9. authtype – This parameter too appears only if v3 is selected as the snmpversion.
From the authtype list box, choose the authentication algorithm using which
SNMP v3 converts the specified username and password into a 32-bit format to
ensure security of SNMP transactions. You can choose between the following
options:
MD5 – Message Digest Algorithm
SHA – Secure Hash Algorithm
10. encryptflag – This flag appears only when v3 is selected as the snmpversion. By
default, the eG agent does not encrypt SNMP requests. Accordingly, the
encryptflag is set to NO by default. To ensure that SNMP requests sent by the eG
agent are encrypted, select the YES option.
11. encrypttype – If the encryptflag is set to YES, then you will have to mention the
encryption type by selecting an option from the encrypttype list. SNMP v3
supports the following encryption types:
DES – Data Encryption Standard
AES – Advanced Encryption Standard
12. encryptpassword – Specify the encryption password here.
13. confirm password – Confirm the encryption password by retyping it here.
14. timeout - Specify the duration (in seconds) within which the SNMP query
executed by this test should time out in the TIMEOUT text box. The default is 10
seconds.

M o n i t o r i n g A S / 4 0 0 S e r v e r s
16
15. process - Should contain the specific processes to be monitored. Each process to
be monitored is specified in the format "name:pattern". The regular expression
pattern denotes patterns that will be used to match processes on the server. For
instance, to monitor all the Java processes on a server, specify the argument
"java_processes:*java*".
16. useprocesspath - In some operating systems (example, OpenVMS), the process
name in the HOST RESOURCES MIB will be an empty string, and the process
path will include the process name. In such cases therefore, the test should be
explicitly instructed to search the process path strings for the configured process
names/patterns. To ensure this, set the USEPROCESSPATH parameter to true.
By default, this parameter is set to false. Operating systems where process
name (in the HOST RESOURCES MIB) is not an empty string can go with this
default setting.
Outputs of the
test
One set of results for every configured process pattern
Measurements
made by the
test
Measurement Measurement
Unit Interpretation
Processes running:
The number of
processes currently
executing on the server
that match the pattern
specified as parameter.
Number This value indicates if too many or too
few processes corresponding to an
application are executing on the host.
Memory utilization:
The total memory
usage of all processes
executing on the server
that match the pattern
specified as parameter.
The memory usage is
specified as a
percentage of the total
memory available on
the server.
Percent A very high value could indicate that
processes corresponding to the
specified pattern are consuming
excessive memory resources.
Memory size:
The total memory
usage(in MB) of all
processes executing on
the server that match
the pattern specified as
parameter.
MB A sudden increase in memory utilization
for a process(es) may be indicative of
memory leaks in the application.
CPU utilization:
The total CPU utilization
of all processes
executing on the server
that match the
configured process
pattern.
Percent A high value could signify a CPU
bottleneck. The CPU utilization may be
high because a few processes are
consuming a lot of CPU, or because
there are too many processes
contending for a limited resource.
Check the currently running processes
to see the exact cause of the problem.

M o n i t o r i n g A S / 4 0 0 S e r v e r s
17
2.5 The AS400 System Layer
The tests mapped to this layer (see Figure 2.6) monitor the internal operations of an AS400 server.
These tests connect to the AS400 server being monitored and execute native commands to pull out
the statistics of interest from within the server.
Figure 2.6: The tests associated with the AS400 System layer
2.5.1 AS400Pools Test
This test reports key statistics pertaining to the system pools on the AS400 server.
Purpose Reports key statistics pertaining to the system pools on the AS400 server
Target of the
test
An AS400 server
Agent
deploying the
test
An external/remote agent
Configurable
parameters for
the test
1. TEST PERIOD - How often should the test be executed
2. Host - The host for which the test is to be configured
3. port - The port at which the specified host listens. By default, this is NULL.
4. SERVERNAME – This test connects to the AS400 server being monitored to
extract the required metrics. Therefore, specify the name of the AS400 server to
connect to in the SERVERNAME text box.
5. userid – To enable the test to login to the specified AS400 server, you need to
provide the test with the credentials of a valid user to the AS400 server. Hence,
specify a valid userid.
6. password - Provide the PASSWORD that corresponds to the specified USERID.
7. confirm password - Confirm the password by retyping it in the CONFIRM
PASSWORD text box.
M o n i t o r i n g A S / 4 0 0 S e r v e r s
18
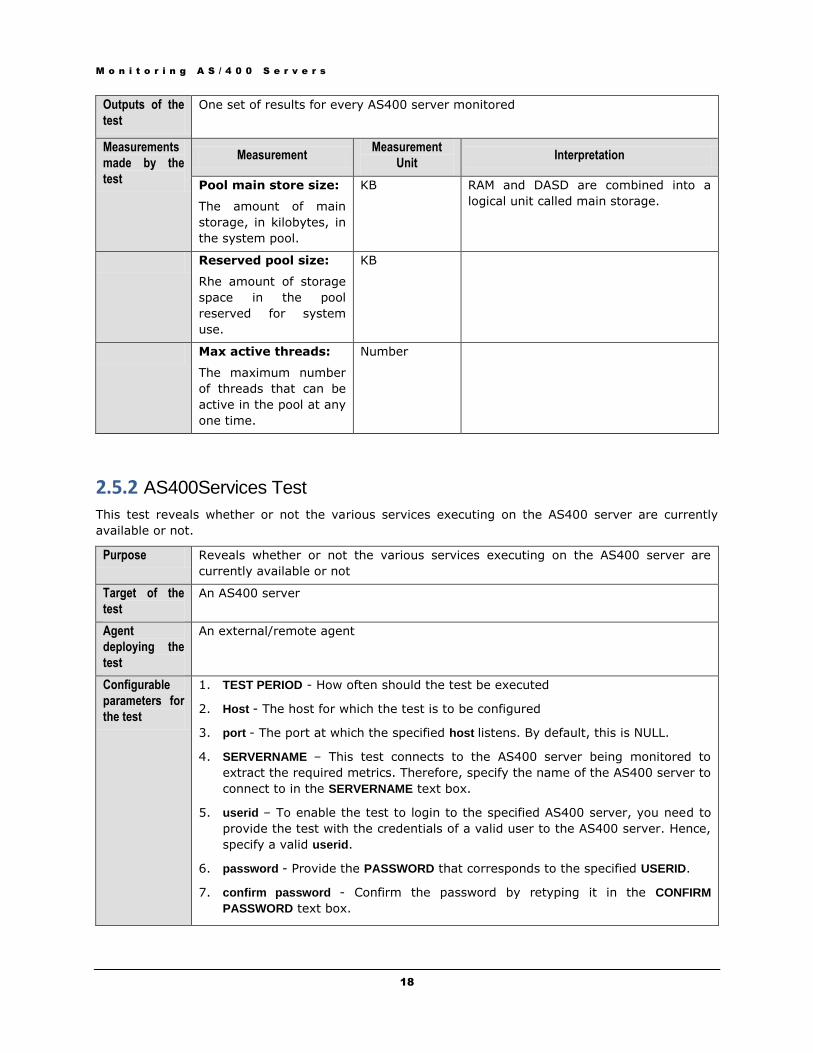
Outputs of the
test
One set of results for every AS400 server monitored
Measurements
made by the
test
Measurement Measurement
Unit Interpretation
Pool main store size:
The amount of main
storage, in kilobytes, in
the system pool.
KB RAM and DASD are combined into a
logical unit called main storage.
Reserved pool size:
Rhe amount of storage
space in the pool
reserved for system
use.
KB
Max active threads:
The maximum number
of threads that can be
active in the pool at any
one time.
Number
2.5.2 AS400Services Test
This test reveals whether or not the various services executing on the AS400 server are currently
available or not.
Purpose Reveals whether or not the various services executing on the AS400 server are
currently available or not
Target of the
test
An AS400 server
Agent
deploying the
test
An external/remote agent
Configurable
parameters for
the test
1. TEST PERIOD - How often should the test be executed
2. Host - The host for which the test is to be configured
3. port - The port at which the specified host listens. By default, this is NULL.
4. SERVERNAME – This test connects to the AS400 server being monitored to
extract the required metrics. Therefore, specify the name of the AS400 server to
connect to in the SERVERNAME text box.
5. userid – To enable the test to login to the specified AS400 server, you need to
provide the test with the credentials of a valid user to the AS400 server. Hence,
specify a valid userid.
6. password - Provide the PASSWORD that corresponds to the specified USERID.
7. confirm password - Confirm the password by retyping it in the CONFIRM
PASSWORD text box.

M o n i t o r i n g A S / 4 0 0 S e r v e r s
19
Outputs of the
test
One set of results for every AS400 server being monitored
Measurements
made by the
test
Measurement Measurement
Unit Interpretation
File service
availability:
Indicates whether the
file service is available
or not.
Percent If the value of this measure is 100%, it
indicates that the file service is
available. A zero value for this measure
indicates that the file service is not
available.
Database service
availability:
Indicates whether the
database service is
available or not.
Percent If the value of this measure is 100%, it
indicates that the database service is
available. A zero value for this measure
indicates that the file service is not
available.
Command service
status:
Indicates the current
status of the command
service.
Percent If the value of this measure is 100%, it
indicates that the command service is
available. A zero value for this measure
indicates that the service is not
available.
Signon service
availability:
Indicates whether the
signon service is
available or not.
Percent If the value of this measure is 100%, it
indicates that the signon service is
available. A zero value for this measure
indicates that the service is not
available.
Central service
status:
Indicates the current
status of the central
service.
Percent If the value of this measure is 100%, it
indicates that the central service is
available. A zero value for this measure
indicates that the service is not
available.
Data queue
availability:
Indicates whether the
data queue is available
or not.
Percent If the value of this measure is 100%, it
indicates that the data queue is
available. A zero value for this measure
indicates that the queue is not
available.
Record access service
status:
Indicates whether the
record access service is
available or not.
Percent If the value of this measure is 100%, it
indicates that the record access service
is available. A zero value for this
measure indicates that the service is
not available.
Print service status:
Indicates the current
status of the print
service.
Percent If the value of this measure is 100%, it
indicates that the print service is
available. A zero value for this measure
indicates that the service is not
available.

M o n i t o r i n g A S / 4 0 0 S e r v e r s
20
2.5.3 AS400Storage Test
This test monitors the storage subsystem of the AS400 server and reveals how effectively the storage
pools on the server are utilized.
Purpose Monitors the storage subsystem of the AS400 server and reveals how effectively the
storage pools on the server are utilized
Target of the
test
An AS400 server
Agent
deploying the
test
An external/remote agent
Configurable
parameters for
the test
1. TEST PERIOD - How often should the test be executed
2. Host - The host for which the test is to be configured
3. port - The port at which the specified host listens. By default, this is NULL.
4. SERVERNAME – This test connects to the AS400 server being monitored to
extract the required metrics. Therefore, specify the name of the AS400 server to
connect to in the SERVERNAME text box.
5. userid – To enable the test to login to the specified AS400 server, you need to
provide the test with the credentials of a valid user to the AS400 server. Hence,
specify a valid userid.
6. password - Provide the PASSWORD that corresponds to the specified USERID.
7. confirm password - Confirm the password by retyping it in the CONFIRM
PASSWORD text box.
Outputs of the
test
One set of results for every AS400 server being monitored
Measurements
made by the
test
Measurement Measurement
Unit Interpretation
Total auxillary
storage:
Indicates the total
auxillary storage space
on the server.
MB
System ASP:
Indicates the storage
capacity of the system
auxillary storage pool.
Number
System ASP used:
Indicates the
percentage of the
system auxillary
storage pool used.
Percent Auxiliary storage pools (ASPs) are
individual disks reserved for particular
objects (such as individual libraries). If
the value of this measure increases
consistently, it is indicative of excessive
usage of the storage pool.

M o n i t o r i n g A S / 4 0 0 S e r v e r s
21
Current unprotected
used:
Indicates the current
amount of storage
space in use by
temporary objects.
MB
Max unprotected
used:
Indicates the largest
amount of storage for
temporary objects used
at any one time since
the last IPL.
MB
Permanent
addresses:
Indicates percentage of
the maximum possible
addresses for
permanent objects that
have been used.
Percent Each object has a single permanent
address to which it is referred by all
users and processes. A high value of
this measure is indicative of a large
number of permanent objects being
created.
Temporary
addresses:
Indicates the
percentage of the
maximum possible
addresses for
temporary objects that
have been used.
Percent A high value of this measure is
indicative of a large number of
temporary objects being created.
2.5.4 AS400SubSystems Test
This test monitors the subsystems on the AS400 server and reports the number of active and inactive
subsystems.
Purpose Monitors the subsystems on the AS400 server and reports the number of active and
inactive subsystems
Target of the
test
An AS400 server
Agent
deploying the
test
An external/remote agent
M o n i t o r i n g A S / 4 0 0 S e r v e r s
22
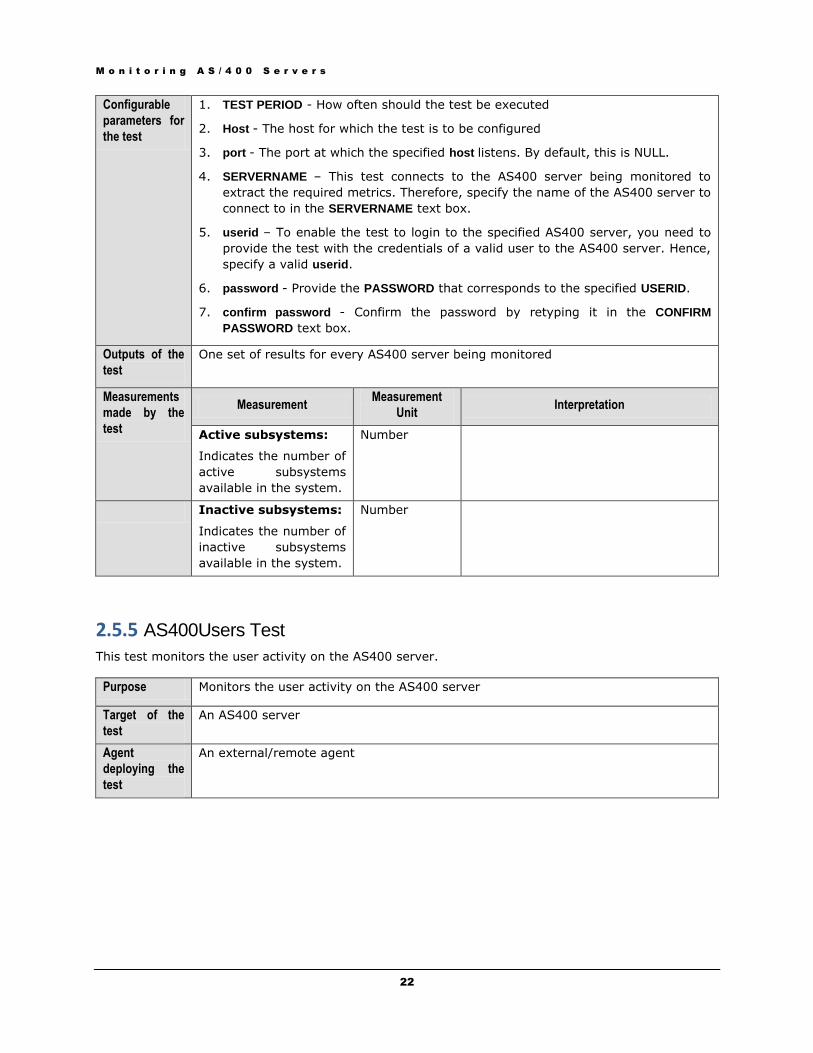
Configurable
parameters for
the test
1. TEST PERIOD - How often should the test be executed
2. Host - The host for which the test is to be configured
3. port - The port at which the specified host listens. By default, this is NULL.
4. SERVERNAME – This test connects to the AS400 server being monitored to
extract the required metrics. Therefore, specify the name of the AS400 server to
connect to in the SERVERNAME text box.
5. userid – To enable the test to login to the specified AS400 server, you need to
provide the test with the credentials of a valid user to the AS400 server. Hence,
specify a valid userid.
6. password - Provide the PASSWORD that corresponds to the specified USERID.
7. confirm password - Confirm the password by retyping it in the CONFIRM
PASSWORD text box.
Outputs of the
test
One set of results for every AS400 server being monitored
Measurements
made by the
test
Measurement Measurement
Unit Interpretation
Active subsystems:
Indicates the number of
active subsystems
available in the system.
Number
Inactive subsystems:
Indicates the number of
inactive subsystems
available in the system.
Number
2.5.5 AS400Users Test
This test monitors the user activity on the AS400 server.
Purpose Monitors the user activity on the AS400 server
Target of the
test
An AS400 server
Agent
deploying the
test
An external/remote agent
M o n i t o r i n g A S / 4 0 0 S e r v e r s
23
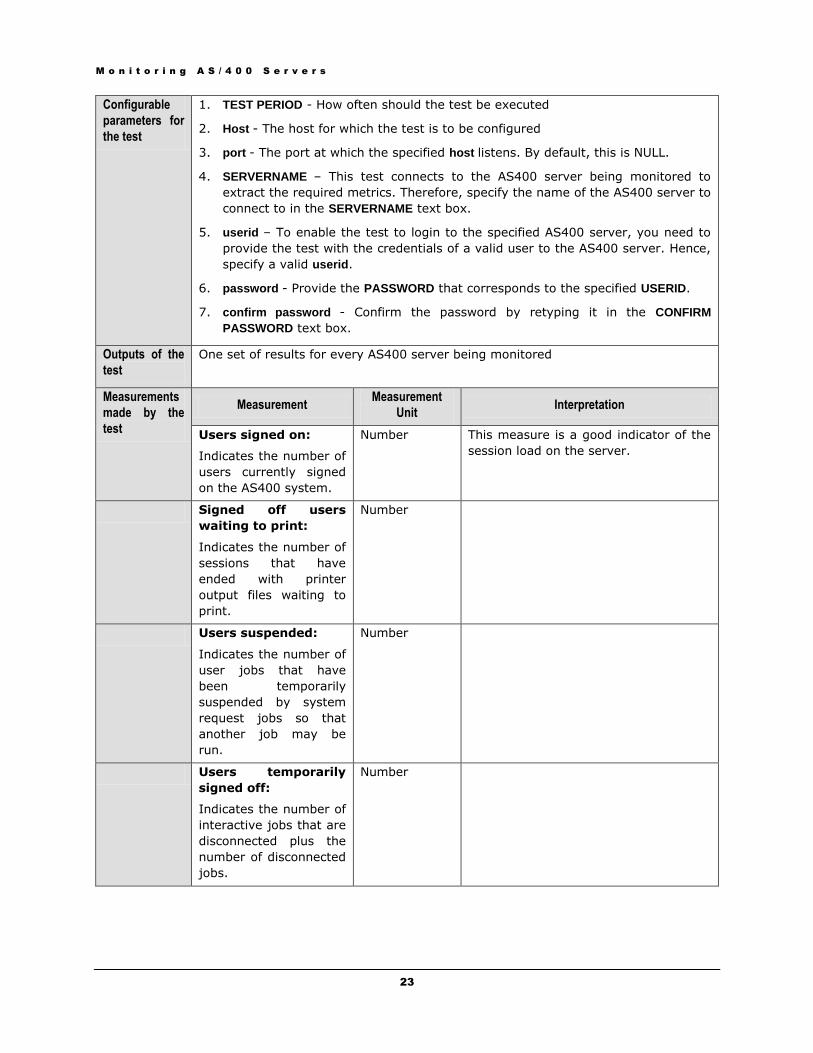
Configurable
parameters for
the test
1. TEST PERIOD - How often should the test be executed
2. Host - The host for which the test is to be configured
3. port - The port at which the specified host listens. By default, this is NULL.
4. SERVERNAME – This test connects to the AS400 server being monitored to
extract the required metrics. Therefore, specify the name of the AS400 server to
connect to in the SERVERNAME text box.
5. userid – To enable the test to login to the specified AS400 server, you need to
provide the test with the credentials of a valid user to the AS400 server. Hence,
specify a valid userid.
6. password - Provide the PASSWORD that corresponds to the specified USERID.
7. confirm password - Confirm the password by retyping it in the CONFIRM
PASSWORD text box.
Outputs of the
test
One set of results for every AS400 server being monitored
Measurements
made by the
test
Measurement Measurement
Unit Interpretation
Users signed on:
Indicates the number of
users currently signed
on the AS400 system.
Number This measure is a good indicator of the
session load on the server.
Signed off users
waiting to print:
Indicates the number of
sessions that have
ended with printer
output files waiting to
print.
Number
Users suspended:
Indicates the number of
user jobs that have
been temporarily
suspended by system
request jobs so that
another job may be
run.
Number
Users temporarily
signed off:
Indicates the number of
interactive jobs that are
disconnected plus the
number of disconnected
jobs.
Number

M o n i t o r i n g A S / 4 0 0 S e r v e r s
24
2.6 The AS400 Queues Layer
This layer monitors the message queues on the AS400 server.
Figure 2.7: The test mapped to the AS400 Queue layer
2.6.1 AS400MessageQueues Test
This test monitors the message queues on the AS400 server.
Purpose Monitors the message queues on the AS400 server
Target of the
test
An AS400 server
Agent
deploying the
test
An external/remote agent
Configurable
parameters for
the test
1. TEST PERIOD - How often should the test be executed
2. Host - The host for which the test is to be configured
3. port - The port at which the specified host listens. By default, this is NULL.
4. SERVERNAME – This test connects to the AS400 server being monitored to
extract the required metrics. Therefore, specify the name of the AS400 server to
connect to in the SERVERNAME text box.
5. userid – To enable the test to login to the specified AS400 server, you need to
provide the test with the credentials of a valid user to the AS400 server. Hence,
specify a valid userid.
6. password - Provide the PASSWORD that corresponds to the specified USERID.
7. confirm password - Confirm the password by retyping it in the CONFIRM
PASSWORD text box.
8. path – Indicate the full path to the message queues to be monitored.
Outputs of the
test
One set of results for every message queue available in the configured path
Measurements
made by the Measurement
Measurement
Unit Interpretation

M o n i t o r i n g A S / 4 0 0 S e r v e r s
25
test Message length:
Indicates the number of
messages in the
message queue.
Number A very high value could indicate a
processing bottleneck.
Message severity:
Indicates the severity of
the message that is
returned.
Number The numerical representation of the
severity for a message queue may be
1-10.
2.6.2 AS400UsrMsgQ Test
This test monitors a specific user’s message queues for configured message patterns.
Purpose Monitors the message queues on the AS400 server
Target of the
test
An AS400 server
Agent
deploying the
test
An external/remote agent

M o n i t o r i n g A S / 4 0 0 S e r v e r s
26
Configurable
parameters for
the test
1. TEST PERIOD - How often should the test be executed
2. Host - The host for which the test is to be configured
3. port - The port at which the specified host listens. By default, this is NULL.
4. SERVERNAME – This test connects to the AS400 server being monitored to
extract the required metrics. Therefore, specify the name of the AS400 server to
connect to in the SERVERNAME text box.
5. userid – To enable the test to login to the specified AS400 server, you need to
provide the test with the credentials of a valid user to the AS400 server. Hence,
specify a valid userid.
6. password - Provide the PASSWORD that corresponds to the specified USERID.
7. confirm password - Confirm the password by retyping it in the CONFIRM
PASSWORD text box.
8. path - Specify the PATH of the user queue to be monitored. If you want to
monitor the default message queue for the configured user, then provide
*CURRENT in the PATH text box. Please note that * is mandatory. If you would
like to monitor the message queue of the specific user, you need to provide
/QSYS.LIB/QUSRSYS.LIB/>>userID<<.MSGQ in the PATH, where user ID
represents the ID of the user whose message queue needs to be monitored.
9. search pattern - Mention the patterns of messages to be monitored by the test in
SEARCH PATTERN text box. The format of your specification should be:
DisplayName:Pattern .Here, DisplayName refers to the display name of the
SEARCH PATTERN that will appear as the descriptor of this test in the eG
monitoring console. Pattern refers to the message pattern(s) to be monitored.
For example, your SEARCH PATTERN can be: RestartDM:*Restart*DM*, where
RestartDM is the display name of the pattern, and *Restart*DM* monitors all
messages containing the strings Restart and DM. Multiple search pattern can be
provided as a comma seperated list. For example,
RestartDM:*Restart*DM*,MSGWaiting:*There*is*MSGW*,DMI
dle:*in*target*DM*status*IDLE*.
Outputs of the
test
One set of results for each DisplayName configured
Measurements
made by the
test
Measurement Measurement
Unit Interpretation
Number of messages:
Indicates the number of
messages in the
message queue during
the last measurement
period, which matched
this pattern.
Number
2.7 The AS400 Jobs Layer
The tests mapped to this layer monitor the jobs on the AS400 server (see Figure 2.8).
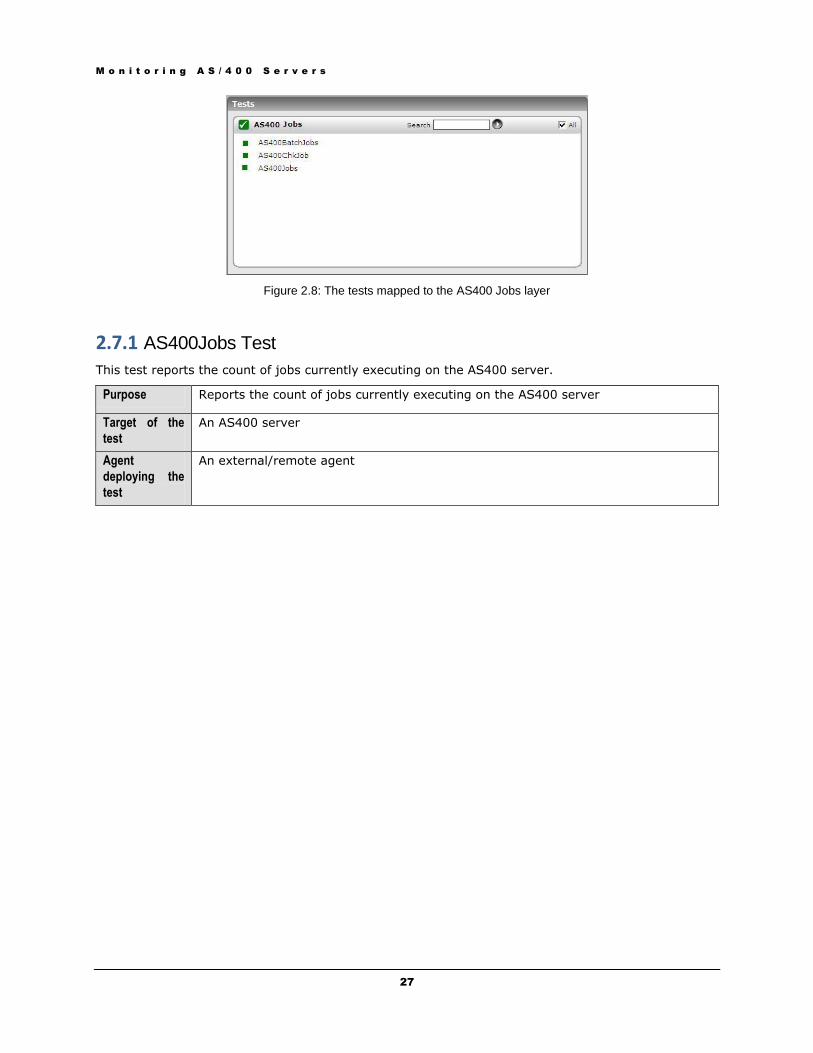
M o n i t o r i n g A S / 4 0 0 S e r v e r s
27
Figure 2.8: The tests mapped to the AS400 Jobs layer
2.7.1 AS400Jobs Test
This test reports the count of jobs currently executing on the AS400 server.
Purpose Reports the count of jobs currently executing on the AS400 server
Target of the
test
An AS400 server
Agent
deploying the
test
An external/remote agent

M o n i t o r i n g A S / 4 0 0 S e r v e r s
28
Configurable
parameters for
the test
1. TEST PERIOD - How often should the test be executed
2. Host - The host for which the test is to be configured
3. port - The port at which the specified host listens. By default, this is NULL.
4. SERVERNAME – This test connects to the AS400 server being monitored to
extract the required metrics. Therefore, specify the name of the AS400 server to
connect to in the SERVERNAME text box.
5. userid – To enable the test to login to the specified AS400 server, you need to
provide the test with the credentials of a valid user to the AS400 server. Hence,
specify a valid userid.
6. password - Provide the PASSWORD that corresponds to the specified USERID.
7. confirm password - Confirm the password by retyping it in the CONFIRM
PASSWORD text box.
8. detailed diagnosis - To make diagnosis more efficient and accurate, the eG
Enterprise suite embeds an optional detailed diagnostic capability. With this
capability, the eG agents can be configured to run detailed, more elaborate tests
as and when specific problems are detected. To enable the detailed diagnosis
capability of this test for a particular server, choose the On option. To disable
the capability, click on the Off option.
The option to selectively enable/disable the detailed diagnosis capability will be
available only if the following conditions are fulfilled:
The eG manager license should allow the detailed diagnosis capability
Both the normal and abnormal frequencies configured for the detailed
diagnosis measures should not be 0.
Outputs of the
test
One set of results for the AS400 server monitored
Measurements
made by the
test
Measurement Measurement
Unit Interpretation
Current jobs:
Indicates the number of
jobs currently executing
on the AS400 server.
Number This measure is a good indicator of the
workload on the server. The detailed
diagnosis of this measure, if enabled,
lists the jobs that are executing and
their current CPU utilization, so that
you can instantly identify the CPU-
intensive operations on the AS400
server.
2.7.2 AS400BatchJobs Test
This test monitors the batch jobs that are executing on the AS400 server.
Purpose Monitors the batch jobs that are executing on the AS400 server
Target of the
test
An AS400 server
Agent An external/remote agent

M o n i t o r i n g A S / 4 0 0 S e r v e r s
29
deploying the
test
Configurable
parameters for
the test
1. TEST PERIOD - How often should the test be executed
2. Host - The host for which the test is to be configured
3. port - The port at which the specified host listens. By default, this is NULL.
4. SERVERNAME – This test connects to the AS400 server being monitored to
extract the required metrics. Therefore, specify the name of the AS400 server to
connect to in the SERVERNAME text box.
5. userid – To enable the test to login to the specified AS400 server, you need to
provide the test with the credentials of a valid user to the AS400 server. Hence,
specify a valid userid.
6. password - Provide the PASSWORD that corresponds to the specified USERID.
7. confirm password - Confirm the password by retyping it in the CONFIRM
PASSWORD text box.
Outputs of the
test
One set of results for the AS400 server monitored
Measurements
made by the
test
Measurement Measurement
Unit Interpretation
Total batch jobs:
Indicates the total
number of batch jobs
currently executing on
the AS400 server.
Number This measure is a good indicator of the
workload on the server.
Jobs running:
Indicates the number of
batch jobs that are
currently running on the
AS400 server.
Number
Ended jobs waiting to
print:
Indicates the number of completed batch jobs that produced printer output that is waiting to print.
Number
Ending jobs:
Indicates the number of batch jobs that are in the process of ending.
Number
Jobs in queue:
Indicates the number of batch jobs that were submitted, but were held before they could begin running.
Number A very high value of this measure is a
cause for concern, and would require
investigation.

M o n i t o r i n g A S / 4 0 0 S e r v e r s
30
Jobs held when
running:
Indicates the number of batch jobs that had started running, but are now held.
Number A very high value of this measure is a
cause for concern, and would require
investigation.
Unassigned jobs:
Indicates the number of
batch jobs on job queues that have not been assigned to a subsystem.
Number
Jobs waiting for
messages:
Indicates the number of batch jobs waiting for a reply to a message before they can continue to run.
Number
Jobs waiting to run:
Indicates the number of batch jobs on the system that are currently waiting to run, including those that were submitted to run at a future date and time.
Number
2.7.3 AS400ChkJob Test
This tests reports the status of jobs of configured patterns.
Purpose Reports the status of jobs of configured patterns
Target of the
test
An AS400 server
Agent
deploying the
test
An external/remote agent

M o n i t o r i n g A S / 4 0 0 S e r v e r s
31
Configurable
parameters for
the test
1. test period - How often this test needs to be executed.
2. host – Specify the host name of the server for which the test is to be configured
has to be specified.
3. port – Indicates the port at which the server listens. By default, this is NULL.
4. servername - Specify the IP Address/hostname of the AS400 server.
5. userid - Enter the user name using which this test should login to the AS400
server.
6. password - Mention the password that corresponds to the configured USERID in
the PASSWORD text box.
7. confirm password - Confirm the PASSWORD by retyping it in the CONFIRM
PASSWORD text box.
8. selectactive - To monitor all the jobs in the active state, set SELECTACTIVE to
True. By default, this flag is set to True.
9. selectjobq - To monitor all the jobs in the JobQ state, set the SELECTJOBQ flag
to True. By default, this flag is set to False, indicating that, by default, this test
monitors only those jobs that are not in the JobQ state.
10. selectoutq - To monitor all the jobs with an OutQ status, select the True option
against SELECTOUTQ. By default, this flag is set to False, indicating that, by
default, this test monitors only those jobs that are not with an OutQ status.
11. count - By default, the COUNT text box is set to 10. This indicates that, by
default, the detailed diagnosis capability of this test, if enabled, will provide the
details of the top-10 CPU consuming jobs that match the configured patterns. If
you want the detailed diagnosis to include more number of CPU consumers,
then you can change the value of the COUNT parameter accordingly.
12. job - In the JOB text box, specify the job patterns to be monitored, in the
following format: Name:JobPattern. Here, Name refers to the display name of
the job pattern that will appear as a descriptor of this test in the eG monitoring
console. Pattern can be the full name of the job, or can include wild cards. For
instance, to monitor all jobs that begin with the string GLNK, your JOB
specification would be: DMIRROR:GLNK*. Note that your job patterns
cannot include wild card characters in the middle or at the beginning -
i.e., for the example above, your specification cannot be:
DMIRROR:*GLNK or DMIRROR:G*LNK. Multiple job patterns can be provided
as a comma-separated list.
Outputs of the
test
One set of results for the every job pattern configured
Measurements
made by the
test
Measurement Measurement
Unit Interpretation
Number of jobs:
Indicates the number of
jobs currently executing
that match this pattern.
Number

M o n i t o r i n g A S / 4 0 0 S e r v e r s
32
CPU usd:
Indicates the CPU
currently used by jobs
of this pattern, in
seconds.
Secs

M o n i t o r i n g O p e n V M S S e r v e r s
33
Monitoring OpenVMS Servers OpenVMS is a multitasking and multiprocessing operating system based on VMS (the original
operating system for VAX). The "Open" suggests the added support for the UNIX-like interfaces of the
POSIX standard.
OpenVMS supports the SNMP Host Resources MIB (RFC 2790). Therefore, if SNMP is enabled on
OpenVMS, then an eG remote agent can execute tests on OpenVMS to extract critical statistics
pertaining to the performance of the operating system. These tests and the measures they collect are
mapped to specific layers of OpenVMS' layer model, which is depicted by Figure 3.1.
Figure 3.1: The layer model of an OpenVMS server
The sections to come will discuss each of the layers and the tests that execute on them.
3.1 The Operating System Layer
The tests mapped to this layer (see Figure 3.2) measure the performance of the OpenVMS host in
terms of the resource utilization of each of its processors, the usage of its storage areas, user traffic
on the server, and the status of the various devices accessible via the server.
Chapter
3

M o n i t o r i n g O p e n V M S S e r v e r s
34
Figure 3.2: The tests associated with the Operating System layer
The tests depicted by Figure 3.2 have already been discussed in Chapter 2 of this document.
3.2 The Network Layer
The tests associated with the Network layer are depicted by Figure 3.3, and measure the health of the
network traffic to the OpenVMS host.
Figure 3.3: The tests associated with the Network layer
For details on the tests depicted by Figure 3.3, refer to the Monitoring Unix and Windows Servers
document.
3.3 The Tcp Layer
The Tcp layer monitors the TCP connectivity of the OpenVMS server with other hosts (see Figure 3.4).

M o n i t o r i n g O p e n V M S S e r v e r s
35
Figure 3.4: The test associated with the Tcp layer
Refer to the Monitoring Network Elements document for a discussion on the test depicted by Figure
3.4.
3.4 The Application Processes Layer
This layer (see Figure 3.5) monitors the availability of the critical processes of the OpenVMS server,
and measures the resource usage of these processes.
Figure 3.5: The test associated with the Application Processes layer
This test has also been discussed in Chapter 2 of this document.

M o n i t o r i n g G e n e r i c N e t w a r e S e r v e r s
36
Monitoring Generic Netware Servers Novell Netware is a local-area network (LAN) operating system developed by Novell Corporation.
NetWare is a software product that runs on a variety of different types of LANs, from Ethernets to IBM
token-ring networks. It provides users and programmers with a consistent interface that is
independent of the actual hardware used to transmit messages.
The eG Enterprise suite offers agentless monitoring of Netware servers, using SNMP support provided
by the Netware operating system. The specialized Netware monitoring model (see Figure 4.1) offered
by eG Enterprise for monitoring the Novell Netware operating system is shown below:
Figure 4.1: The layer model of a Generic Netware server
Each layer of Figure 4.1 and the tests mapped to it are discussed in the sections to come.
4.1 The Operating System Layer
The tests associated with the this layer (see Figure 4.2) monitor the file systems on Netware, and the
usage of the CPU, memory, and storage resources on Netware.
Chapter
4

M o n i t o r i n g G e n e r i c N e t w a r e S e r v e r s
37
Figure 4.2: The tests associated with the Operating System layer
4.1.1 NwMemory Test
This test monitors the Novell Netware system memory.
Purpose Monitors the Novell Netware system memory
Target of the
test
Any host on Novell Netware
Agent
deploying the
test
An remote agent

M o n i t o r i n g G e n e r i c N e t w a r e S e r v e r s
38
Configurable
parameters for
the test
1. TEST PERIOD - How often should the test be executed
2. Host - The host for which the test is to be configured.
3. snmpport – The port at which the server exposes its SNMP MIB. The default is
161.
4. SNMPVERSION – By default, the eG agent supports SNMP version 1. Accordingly,
the default selection in the snmpversion list is v1. However, if a different SNMP
framework is in use in your environment, say SNMP v2 or v3, then select the
corresponding option from this list.
5. SNMPCommunity – The SNMP community name that the test uses to
communicate with the target host. This parameter is specific to SNMP v1 and v2
only. Therefore, if the snmpversion chosen is v3, then this parameter will not
appear.
6. username – This parameter appears only when v3 is selected as the snmpversion.
SNMP version 3 (SNMPv3) is an extensible SNMP Framework which supplements
the SNMPv2 Framework, by additionally supporting message security, access
control, and remote SNMP configuration capabilities. To extract performance
statistics from the MIB using the highly secure SNMP v3 protocol, the eG agent
has to be configured with the required access privileges – in other words, the eG
agent should connect to the MIB using the credentials of a user with access
permissions to be MIB. Therefore, specify the name of such a user against the
username parameter.
7. authpass – Specify the password that corresponds to the above-mentioned
username. This parameter once again appears only if the snmpversion selected is
v3.
8. confirm password – Confirm the authpass by retyping it here.
9. authtype – This parameter too appears only if v3 is selected as the snmpversion.
From the authtype list box, choose the authentication algorithm using which
SNMP v3 converts the specified username and password into a 32-bit format to
ensure security of SNMP transactions. You can choose between the following
options:
MD5 – Message Digest Algorithm
SHA – Secure Hash Algorithm
10. encryptflag – This flag appears only when v3 is selected as the snmpversion. By
default, the eG agent does not encrypt SNMP requests. Accordingly, the
encryptflag is set to NO by default. To ensure that SNMP requests sent by the eG
agent are encrypted, select the YES option.
11. encrypttype – If the encryptflag is set to YES, then you will have to mention the
encryption type by selecting an option from the encrypttype list. SNMP v3
supports the following encryption types:
DES – Data Encryption Standard
AES – Advanced Encryption Standard
12. encryptpassword – Specify the encryption password here.
13. confirm password – Confirm the encryption password by retyping it here.

M o n i t o r i n g G e n e r i c N e t w a r e S e r v e r s
39
14. timeout - Specify the duration (in seconds) within which the SNMP query
executed by this test should time out in the TIMEOUT text box. The default is 10
seconds.
Outputs of the
test
One set of results for every host being monitored.
Measurements
made by the
test
Measurement Measurement
Unit Interpretation
Cache buffers:
Indicates the cache
buffers currently in use.
MB A high value can be an indicative of
poor system performance.
Moveable cache
memory:
Indicates the cache
moveable memory.
MB
Cache non-movable
memory:
Indicates the cache non
moveable memory.
MB
NLM memory usage:
Indicates the memory
allocated for all the
Netware loadable
modules(NLM).
MB A high value can be an indicative of
poor system performance.
4.1.2 NwFileSystems Test
This test monitors the Novell Netware file system.
Purpose Monitors the Novell Netware file system
Target of the
test
Any host on Novell Netware
Agent
deploying the
test
A remote agent

M o n i t o r i n g G e n e r i c N e t w a r e S e r v e r s
40
Configurable
parameters for
the test
1. TEST PERIOD - How often should the test be executed
2. Host - The host for which the test is to be configured.
3. snmpport – The port at which the server exposes its SNMP MIB. The default is
161.
4. SNMPVERSION – By default, the eG agent supports SNMP version 1. Accordingly,
the default selection in the snmpversion list is v1. However, if a different SNMP
framework is in use in your environment, say SNMP v2 or v3, then select the
corresponding option from this list.
5. SNMPCommunity – The SNMP community name that the test uses to
communicate with the target host. This parameter is specific to SNMP v1 and v2
only. Therefore, if the snmpversion chosen is v3, then this parameter will not
appear.
6. username – This parameter appears only when v3 is selected as the snmpversion.
SNMP version 3 (SNMPv3) is an extensible SNMP Framework which supplements
the SNMPv2 Framework, by additionally supporting message security, access
control, and remote SNMP configuration capabilities. To extract performance
statistics from the MIB using the highly secure SNMP v3 protocol, the eG agent
has to be configured with the required access privileges – in other words, the eG
agent should connect to the MIB using the credentials of a user with access
permissions to be MIB. Therefore, specify the name of such a user against the
username parameter.
7. authpass – Specify the password that corresponds to the above-mentioned
username. This parameter once again appears only if the snmpversion selected is
v3.
8. confirm password – Confirm the authpass by retyping it here.
9. authtype – This parameter too appears only if v3 is selected as the snmpversion.
From the authtype list box, choose the authentication algorithm using which
SNMP v3 converts the specified username and password into a 32-bit format to
ensure security of SNMP transactions. You can choose between the following
options:
MD5 – Message Digest Algorithm
SHA – Secure Hash Algorithm
10. encryptflag – This flag appears only when v3 is selected as the snmpversion. By
default, the eG agent does not encrypt SNMP requests. Accordingly, the
encryptflag is set to NO by default. To ensure that SNMP requests sent by the eG
agent are encrypted, select the YES option.
11. encrypttype – If the encryptflag is set to YES, then you will have to mention the
encryption type by selecting an option from the encrypttype list. SNMP v3
supports the following encryption types:
DES – Data Encryption Standard
AES – Advanced Encryption Standard
12. encryptpassword – Specify the encryption password here.
13. confirm password – Confirm the encryption password by retyping it here.

M o n i t o r i n g G e n e r i c N e t w a r e S e r v e r s
41
14. timeout - Specify the duration (in seconds) within which the SNMP query
executed by this test should time out in the TIMEOUT text box. The default is 10
seconds.
Outputs of the
test
One set of results for every host being monitored.
Measurements
made by the
test
Measurement Measurement
Unit Interpretation
File read rate:
Indicates the number of
file reads per second
performed by the file
system during the last
measurement period.
Reads/Sec A dramatic increase in this value may
be indicative of excessive I/O traffic.
File write rate:
Indicates the number of
file writes per second
performed by the file
system during the last
measurement period.
Writes/Sec
Data read rate:
Indicates the KBytes
read per second by the
file system during the
last measurement
period.
Kbytes/Sec
Data write rate:
Indicates the KBytes
written per second by
the file system during
the last measurement
period.
Kbytes/Sec
Files open:
Indicates the number of
open files in the file
system.
Number A very high value can lower the system
performance.
Record locks:
Indicates the current
number of record locks.
Number
4.1.3 NwProcessor Test
This test monitors the Novell Netware system processors.
Purpose Monitors the Novell Netware system processors
Target of the Any host on Novell Netware

M o n i t o r i n g G e n e r i c N e t w a r e S e r v e r s
42
test
Agent
deploying the
test
A remote agent

M o n i t o r i n g G e n e r i c N e t w a r e S e r v e r s
43
Configurable
parameters for
the test
1. TEST PERIOD – How often should the test be executed
2. Host - The host for which the test is to be configured.
3. snmpport – The port at which the server exposes its SNMP MIB. The default is
161.
4. SNMPVERSION – By default, the eG agent supports SNMP version 1. Accordingly,
the default selection in the snmpversion list is v1. However, if a different SNMP
framework is in use in your environment, say SNMP v2 or v3, then select the
corresponding option from this list.
5. SNMPCommunity – The SNMP community name that the test uses to
communicate with the target host. This parameter is specific to SNMP v1 and v2
only. Therefore, if the snmpversion chosen is v3, then this parameter will not
appear.
6. username – This parameter appears only when v3 is selected as the snmpversion.
SNMP version 3 (SNMPv3) is an extensible SNMP Framework which supplements
the SNMPv2 Framework, by additionally supporting message security, access
control, and remote SNMP configuration capabilities. To extract performance
statistics from the MIB using the highly secure SNMP v3 protocol, the eG agent
has to be configured with the required access privileges – in other words, the eG
agent should connect to the MIB using the credentials of a user with access
permissions to be MIB. Therefore, specify the name of such a user against the
username parameter.
7. authpass – Specify the password that corresponds to the above-mentioned
username. This parameter once again appears only if the snmpversion selected is
v3.
8. confirm password – Confirm the authpass by retyping it here.
9. authtype – This parameter too appears only if v3 is selected as the snmpversion.
From the authtype list box, choose the authentication algorithm using which
SNMP v3 converts the specified username and password into a 32-bit format to
ensure security of SNMP transactions. You can choose between the following
options:
MD5 – Message Digest Algorithm
SHA – Secure Hash Algorithm
10. encryptflag – This flag appears only when v3 is selected as the snmpversion. By
default, the eG agent does not encrypt SNMP requests. Accordingly, the
encryptflag is set to NO by default. To ensure that SNMP requests sent by the eG
agent are encrypted, select the YES option.
11. encrypttype – If the encryptflag is set to YES, then you will have to mention the
encryption type by selecting an option from the encrypttype list. SNMP v3
supports the following encryption types:
DES – Data Encryption Standard
AES – Advanced Encryption Standard
12. encryptpassword – Specify the encryption password here.
13. confirm password – Confirm the encryption password by retyping it here.

M o n i t o r i n g G e n e r i c N e t w a r e S e r v e r s
44
14. timeout - Specify the duration (in seconds) within which the SNMP query
executed by this test should time out in the TIMEOUT text box. The default is 10
seconds.
Outputs of the
test
One set of results for every processor being monitored.
Measurements
made by the
test
Measurement Measurement
Unit Interpretation
Processor usage:
Indicates the Processing
load on this processor
for the last second,
expressed as a
percentage.
Percent A high value could signify a CPU
bottleneck. The CPU utilization may be
high because a few processes are
consuming a lot of CPU, or because
there are too many processes
contending for a limited resource.
Check the currently running processes
to figure out the exact cause of the
problem.
Processor interrupts:
Indicates the average
rate per second at
which the processor
handles interrupts from
applications or
hardware devices.
Interrupts/Sec High interrupt rates can indicate
hardware problems. Compare this value
with CPU usage. If this value increases
dramatically without a corresponding
increase in system activity, it can
indicate a hardware problem.
Processor interrupt
time:
Indicates the amount of
time that the processor
spent receiving and
servicing hardware
interrupts during the
measure interval.
Secs This value is an indirect indicator of the
activity of devices that generate
interrupts, such as the system clock,
the mouse, disk drivers, data
communication lines, network interface
cards and other peripheral devices.
These devices normally interrupt the
processor when they have completed a
task or require attention. A high value
indicates a hardware problem.
Processor threads:
Indicates the total
number of threads in
the processor.
Number
4.1.4 NwVolumeSpace Test
This test monitors the volumes (disk drives) in a host on Novell Netware.
Purpose Monitors the Novell Netware volumes
Target of the
test
Any host on Novell Netware
Agent
deploying the
A remote agent

M o n i t o r i n g G e n e r i c N e t w a r e S e r v e r s
45
test
Configurable
parameters for
the test
1. TEST PERIOD – How often should the test be executed
2. Host - The host for which the test is to be configured.
3. snmpport – The port at which the server exposes its SNMP MIB. The default is
161.
4. SNMPVERSION – By default, the eG agent supports SNMP version 1. Accordingly,
the default selection in the snmpversion list is v1. However, if a different SNMP
framework is in use in your environment, say SNMP v2 or v3, then select the
corresponding option from this list.
5. SNMPCommunity – The SNMP community name that the test uses to
communicate with the target host. This parameter is specific to SNMP v1 and v2
only. Therefore, if the snmpversion chosen is v3, then this parameter will not
appear.
6. username – This parameter appears only when v3 is selected as the snmpversion.
SNMP version 3 (SNMPv3) is an extensible SNMP Framework which supplements
the SNMPv2 Framework, by additionally supporting message security, access
control, and remote SNMP configuration capabilities. To extract performance
statistics from the MIB using the highly secure SNMP v3 protocol, the eG agent
has to be configured with the required access privileges – in other words, the eG
agent should connect to the MIB using the credentials of a user with access
permissions to be MIB. Therefore, specify the name of such a user against the
username parameter.
7. authpass – Specify the password that corresponds to the above-mentioned
username. This parameter once again appears only if the snmpversion selected is
v3.
8. confirm password – Confirm the authpass by retyping it here.
9. authtype – This parameter too appears only if v3 is selected as the snmpversion.
From the authtype list box, choose the authentication algorithm using which
SNMP v3 converts the specified username and password into a 32-bit format to
ensure security of SNMP transactions. You can choose between the following
options:
MD5 – Message Digest Algorithm
SHA – Secure Hash Algorithm
10. encryptflag – This flag appears only when v3 is selected as the snmpversion. By
default, the eG agent does not encrypt SNMP requests. Accordingly, the
encryptflag is set to NO by default. To ensure that SNMP requests sent by the eG
agent are encrypted, select the YES option.
11. encrypttype – If the encryptflag is set to YES, then you will have to mention the
encryption type by selecting an option from the encrypttype list. SNMP v3
supports the following encryption types:
DES – Data Encryption Standard
AES – Advanced Encryption Standard
12. encryptpassword – Specify the encryption password here.
13. confirm password – Confirm the encryption password by retyping it here.
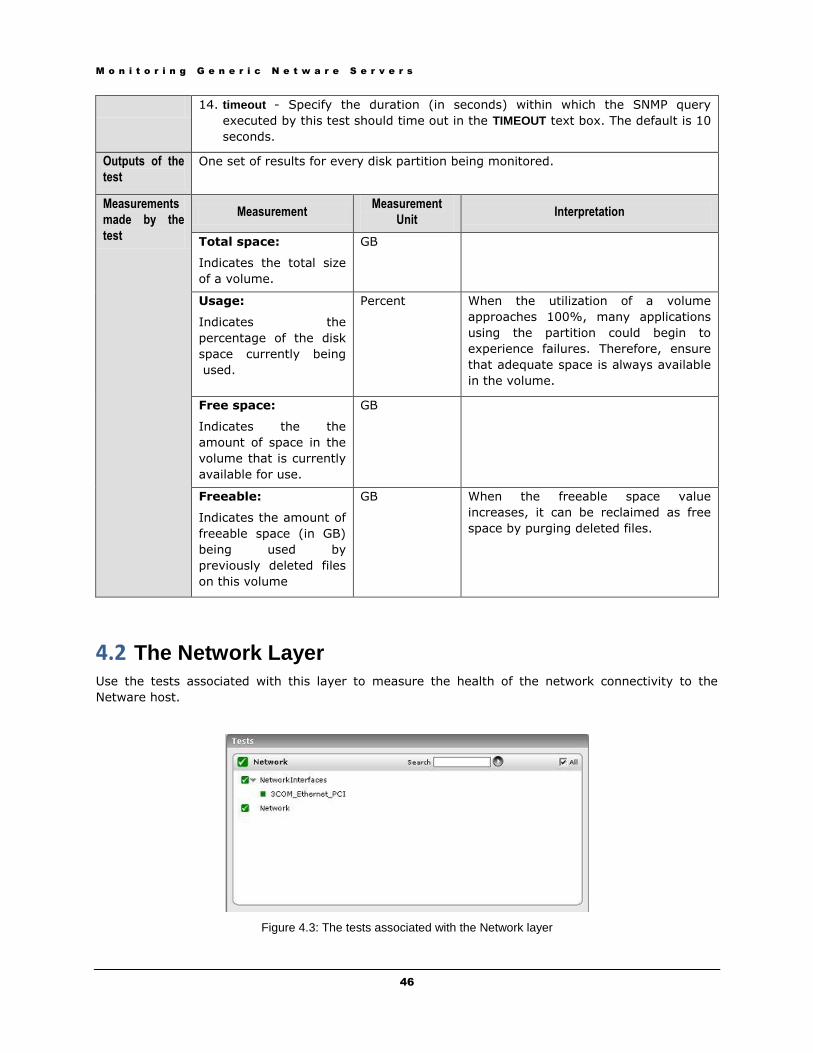
M o n i t o r i n g G e n e r i c N e t w a r e S e r v e r s
46
14. timeout - Specify the duration (in seconds) within which the SNMP query
executed by this test should time out in the TIMEOUT text box. The default is 10
seconds.
Outputs of the
test
One set of results for every disk partition being monitored.
Measurements
made by the
test
Measurement Measurement
Unit Interpretation
Total space:
Indicates the total size
of a volume.
GB
Usage:
Indicates the
percentage of the disk
space currently being
used.
Percent When the utilization of a volume
approaches 100%, many applications
using the partition could begin to
experience failures. Therefore, ensure
that adequate space is always available
in the volume.
Free space:
Indicates the the
amount of space in the
volume that is currently
available for use.
GB
Freeable:
Indicates the amount of
freeable space (in GB)
being used by
previously deleted files
on this volume
GB When the freeable space value
increases, it can be reclaimed as free
space by purging deleted files.
4.2 The Network Layer
Use the tests associated with this layer to measure the health of the network connectivity to the
Netware host.
Figure 4.3: The tests associated with the Network layer

M o n i t o r i n g G e n e r i c N e t w a r e S e r v e r s
47
These tests have been discussed in-depth in the Monitoring Unix and Windows Servers document.
4.3 The Tcp Layer
The test mapped to this layer measures the health of the TCP connections to and from the Netware
host.
Figure 4.4: The test associated with the Tcp layer
This test again has been discussed in the Monitoring Network Elements document.
4.4 The Application Processes Layer
The test associated with this layer monitors the NLMs executing on the Netware host, and the
resource usage of each of the NLMs.
Figure 4.5: The test associated with the Application Processes layer
4.4.1 NwProcesses Test
This test reports a variety of memory statistics for a specified Netware Loadable Module (nlm).
Purpose Reports a variety of memory statistics for a specified Netware Loadable Module
(nlm)
Target of the
test
Any host on Novell Netware

M o n i t o r i n g G e n e r i c N e t w a r e S e r v e r s
48
Agent
deploying the
test
A remote agent

M o n i t o r i n g G e n e r i c N e t w a r e S e r v e r s
49
Configurable
parameters for
the test
1. TEST PERIOD – How often should the test be executed
2. Host - The host for which the test is to be configured.
3. port - The port at which the server listens.
4. snmpport – The port at which the server exposes its SNMP MIB. The default is
161.
5. SNMPVERSION – By default, the eG agent supports SNMP version 1. Accordingly,
the default selection in the snmpversion list is v1. However, if a different SNMP
framework is in use in your environment, say SNMP v2 or v3, then select the
corresponding option from this list.
6. SNMPCommunity – The SNMP community name that the test uses to
communicate with the target host. This parameter is specific to SNMP v1 and v2
only. Therefore, if the snmpversion chosen is v3, then this parameter will not
appear.
7. username – This parameter appears only when v3 is selected as the snmpversion.
SNMP version 3 (SNMPv3) is an extensible SNMP Framework which supplements
the SNMPv2 Framework, by additionally supporting message security, access
control, and remote SNMP configuration capabilities. To extract performance
statistics from the MIB using the highly secure SNMP v3 protocol, the eG agent
has to be configured with the required access privileges – in other words, the eG
agent should connect to the MIB using the credentials of a user with access
permissions to be MIB. Therefore, specify the name of such a user against the
username parameter.
8. authpass – Specify the password that corresponds to the above-mentioned
username. This parameter once again appears only if the snmpversion selected is
v3.
9. confirm password – Confirm the authpass by retyping it here.
10. authtype – This parameter too appears only if v3 is selected as the snmpversion.
From the authtype list box, choose the authentication algorithm using which
SNMP v3 converts the specified username and password into a 32-bit format to
ensure security of SNMP transactions. You can choose between the following
options:
MD5 – Message Digest Algorithm
SHA – Secure Hash Algorithm
11. encryptflag – This flag appears only when v3 is selected as the snmpversion. By
default, the eG agent does not encrypt SNMP requests. Accordingly, the
encryptflag is set to NO by default. To ensure that SNMP requests sent by the eG
agent are encrypted, select the YES option.
12. encrypttype – If the encryptflag is set to YES, then you will have to mention the
encryption type by selecting an option from the encrypttype list. SNMP v3
supports the following encryption types:
DES – Data Encryption Standard
AES – Advanced Encryption Standard
13. encryptpassword – Specify the encryption password here.
14. confirm password – Confirm the encryption password by retyping it here.
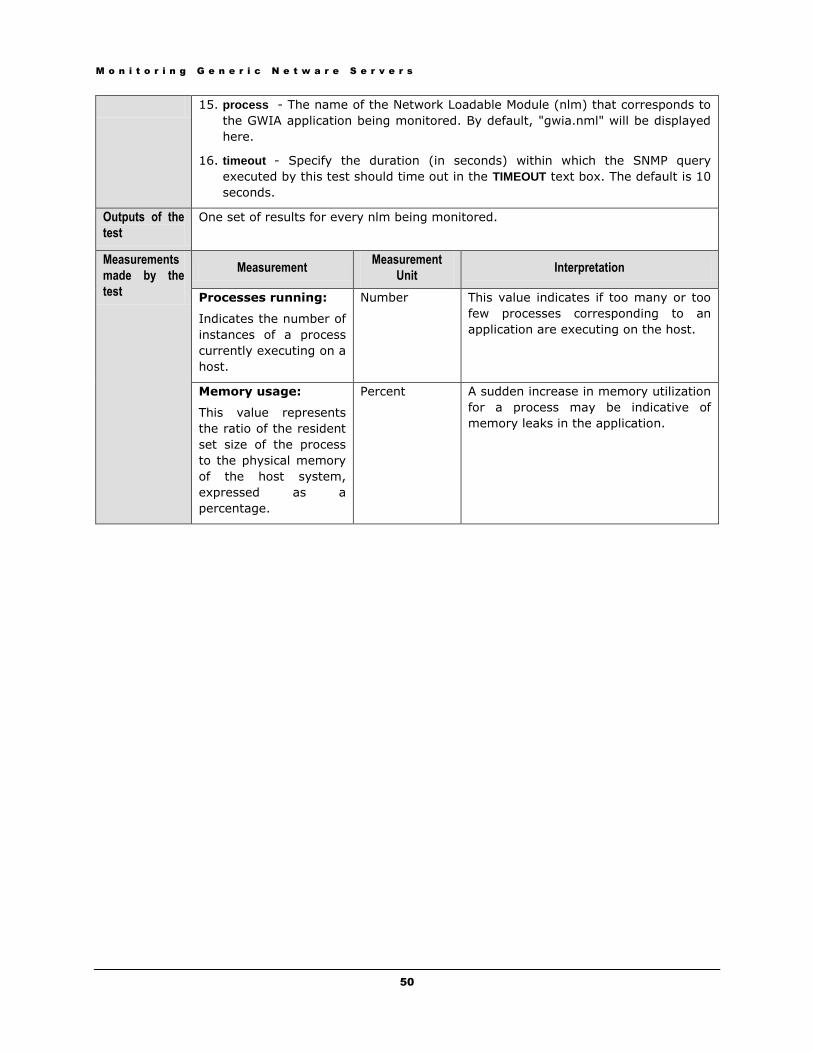
M o n i t o r i n g G e n e r i c N e t w a r e S e r v e r s
50
15. process - The name of the Network Loadable Module (nlm) that corresponds to
the GWIA application being monitored. By default, "gwia.nml" will be displayed
here.
16. timeout - Specify the duration (in seconds) within which the SNMP query
executed by this test should time out in the TIMEOUT text box. The default is 10
seconds.
Outputs of the
test
One set of results for every nlm being monitored.
Measurements
made by the
test
Measurement Measurement
Unit Interpretation
Processes running:
Indicates the number of
instances of a process
currently executing on a
host.
Number This value indicates if too many or too
few processes corresponding to an
application are executing on the host.
Memory usage:
This value represents
the ratio of the resident
set size of the process
to the physical memory
of the host system,
expressed as a
percentage.
Percent A sudden increase in memory utilization
for a process may be indicative of
memory leaks in the application.

M o n i t o r i n g S N M P G e n e r i c S e r v e r s
51
Monitoring SNMP Generic Servers Any server operating system that supports the Host Resources MIB is referred to in the eG Enterprise
system as a SNMP Generic server. This means that if you want to monitor an SNMP-enabled operating
system, that is not of any of the server types discussed in Chapters 2 to 4 of this document, then you
can use the SNMP Generic monitoring model provided by eG Enterprise. This model is depicted by
Figure 5.1 below:
Figure 5.1: The layer model of an SNMP Generic server
The layer model and the tests mapped to each of the layers of an SNMP Generic model is the same as
that of the OpenVMS model. Therefore, please refer to Chapter 3 of this document for a discussion on
each of the layers of Figure 5.1.
Chapter
5

C o n c l u s i o n
52
Conclusion This document has described in detail the monitoring paradigm used and the measurement
capabilities of the eG Enterprise suite of products with respect to applications that support the Host
Resources MIB. For details of how to administer and use the eG Enterprise suite of products, refer to the
user manuals.
We will be adding new measurement capabilities into the future versions of the eG Enterprise suite. If
you can identify new capabilities that you would like us to incorporate in the eG Enterprise suite of
products, please contact [email protected]. We look forward to your support and
cooperation. Any feedback regarding this manual or any other aspects of the eG Enterprise suite can
be forwarded to [email protected].
Chapter
6