monitoring data poor fisheries using a self starting scheme deepak george pazhayamadom university...
TRANSCRIPT

Monitoring data poor fisheries using a self starting scheme
Deepak George PazhayamadomUniversity College Cork, Ireland

Indicator based management using traffic light approach
Limit -
18cm
Precautionary-
25cm
Acceptable -
28cm
• Empirical indicators e.g. Mean length or Mean weight
2 4 6 8 10
15
20
25
30
Year
Me
an
Le
ng
th
• Reference directions e.g. Increased or decreased?
• Reference limit e.g. Whether management required or not?
2 4 6 8 10
15
20
25
30
Year
Me
an
Le
ng
th
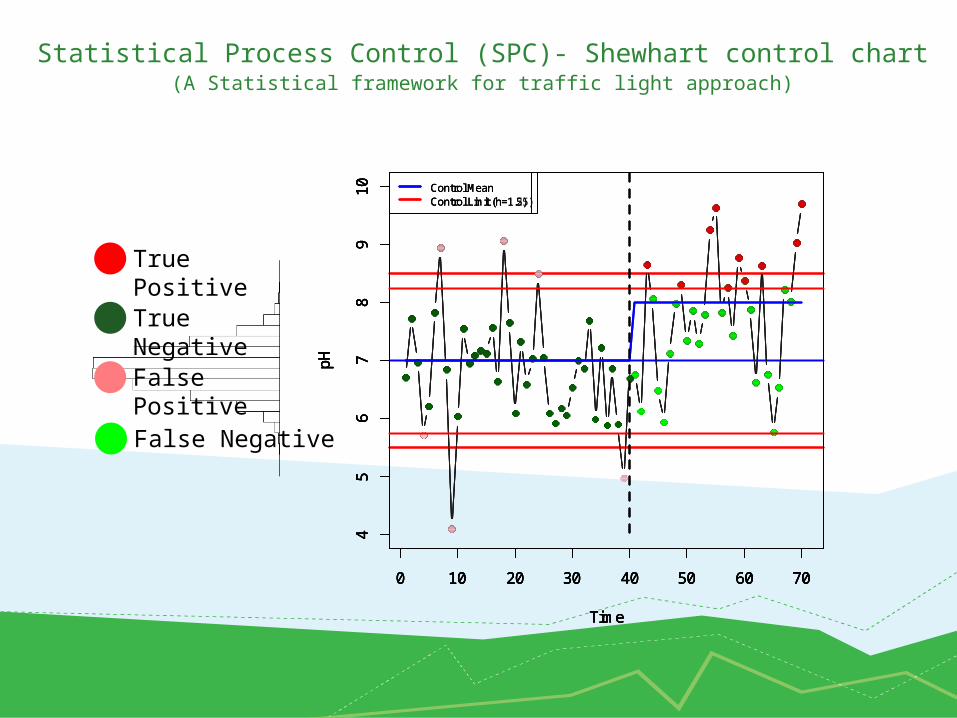
Statistical Process Control (SPC)- Shewhart control chart(A Statistical framework for traffic light approach)
0 10 20 30 40 50 60 70
45
67
89
10
Time
pH
0 10 20 30 40 50 60 70
45
67
89
10
Time
pH
Control MeanControl Limit (h=1.5)
0 10 20 30 40 50 60 70
45
67
89
10
Time
pH
Control MeanControl Limit (h=1.5)
True PositiveTrue Negative
False Positive
False Negative
0 10 20 30 40 50 60 70
45
67
89
10
Time
pH
Control MeanControl Limit (h=1.25)

Statistical Process Control (SPC)- CUSUM control chart
0 10 20 30 40 50 60 70
67
89
Time
Ind
ica
tor
Control Mean
Control Limit (h=1.5)
0 10 20 30 40 50 60 70
02
46
81
01
2Time
CU
SU
M
Control Mean
Control Limit (h=1.5)
Upper CUSUM
Low er CUSUM
[zt=(D-µ)/σ]
D = Indicator(Time Series)µ = Control Mean (Target) σ = Standard Deviation
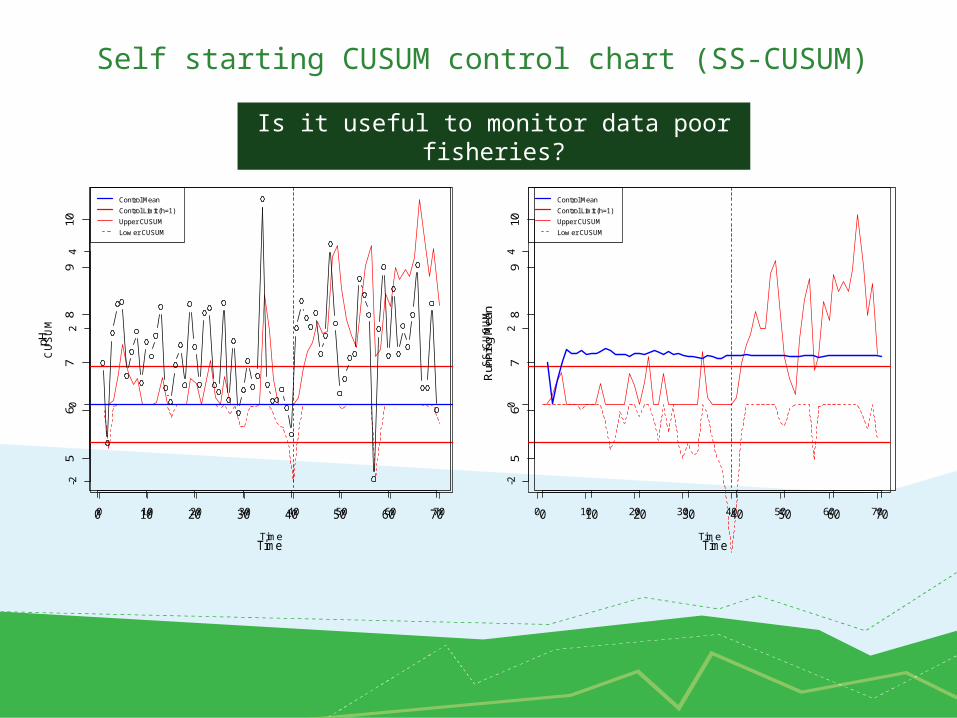
Self starting CUSUM control chart (SS-CUSUM)
0 10 20 30 40 50 60 70
-20
24
Time
CU
SU
M
Control Mean
Control Limit (h=1)
Upper CUSUM
Low er CUSUM
0 10 20 30 40 50 60 70-2
02
4
Time
SS
-CU
SU
M
Control Mean
Control Limit (h=1)
Upper CUSUM
Low er CUSUM
0 10 20 30 40 50 60 70
56
78
910
Time
pH
0 10 20 30 40 50 60 705
67
89
10
Time
Run
ning
Mea
n
Is it useful to monitor data poor fisheries?

Methods - Fisheries Simulation
SS-CUSUM

Methods - Stock Indicators1. Mean Age
2. Mean Length
3. Mean Weight
4. Large Fish Catch Numbers (LFCN)
5. Large Fish Catch Weight (LFCW)
Age 1
Age 2
Age 3
Age 4
Age 5
Age 6
Age 7
n=5n=1
0
n=20
n=35
n=25
n=4
n=1
e.g. LFCN = 30/100

Methods - An example scenario
0 10 20 30 40 50 60 70
-10
-50
51
0
Time
SS
-CU
SU
M
Control MeanControl Limit (h=1)Upper CUSUMLow er CUSUM
1. Monitored 20 years
2. Fixed parameters (k=0.5, h=0)
3. Collected data on TP, TN, FP, FN
4. Repeated 1000 times
Repeated for control limit (h) ranging from 0 to 6 with 0.1 interval

Results - Performance Measures
Sensitivity – Probability of True Positive signalsSpecificity – Probability of True Negatives
1. Receiver Operator Characteristic (ROC) Curve (Sensitivity Vs 1-Specificity)
2. Optimal Performance (Sensitivity=Specificity)
0.0 0.2 0.4 0.6 0.8 1.0
0.0
0.2
0.4
0.6
0.8
1.0
1-Specificity
Se
nsi
tivity
Control Limit (h)
AUC= 87.4 %Optimal Performance
0.0 0.2 0.4 0.6 0.8 1.0
0.0
0.2
0.4
0.6
0.8
1.0
1-Specificity
Se
nsi
tivity
Control Limit (h)
AUC= 87.4 %Optimal Performance
0.2 0.4 0.6 0.8 1.0
01
23
45
67
Sensitivity or Specificity
Co
ntr
ol L
imit
(h)
Optimal PerformanceSensitivitySpecificity

0.0 0.2 0.4 0.6 0.8 1.0
01
23
45
6
Sensitivity/ Specif icity
Con
trol
Lim
it (h
)
LFCN
0.0 0.2 0.4 0.6 0.8 1.0
01
23
45
6
Sensitivity/ Specif icityC
ontr
ol L
imit
(h)
LFCW
0.0 0.2 0.4 0.6 0.8 1.0
01
23
45
6
Sensitivity/ Specif icity
Con
trol
Lim
it (h
)
Mean Age
0.0 0.2 0.4 0.6 0.8 1.0
01
23
45
6
Sensitivity/ Specif icity
Con
trol
Lim
it (h
)
Mean Length
0.0 0.2 0.4 0.6 0.8 1.0
01
23
45
6
Sensitivity/ Specif icity
Con
trol
Lim
it (h
)
Mean Weight
Values at optimal performanceSensitivitySpecificity50% Sensitivity/ SpecificityBase caseUnderfishingShort Lived speciesLong lived speciesSigmoid selectivity (small mesh)Sigmoid selectivity (large mesh)Selectivity (Dome shaped)Growth vary between cohortsGrowth vary within cohortsAutocorrelated recruitment (0.5)Autocorrelated recruitment (0.8)Sample (n=1000)Sample (n=100)Sample (n=10)

Thank You
Acknowledgements
Emer RoganUniversity College Cork, Ireland
Ciaran KellyMarine Institute, Ireland
Edward A. CodlingUniversity of Essex, UK