monitoring ecosystem stress and carbon uptake with ... fluorescence elizabeth m....
TRANSCRIPT

Monitoring ecosystem stress and carbon uptake with reflectance and fluorescence
measurementsnd fluorescence measurementsElizabeth M. Middleton
Fred HuemmrichPetya CampbellQingyuan Zhang
Joanna JoinerHyspIRI team members
NASA Goddard Space Flight Center
Pasadena, CaliforniaOctober 17-19, 2017
I. Prototype HyspIRI Products usingEO-1 Hyperion and other Spectrometers
II. A Study using fAPARchl and Far-Red Solar Induced Fluorescence
TOPICS

• Characterization of canopy biophysical parameters and function Using integrated leaf- canopy models with the spectra to derive
canopy bio-physical and bio-chemistry parameters Using machine learning and empirical models to map productivity
• Spectral time series Calibration sites / deserts: consistency/stability of derived reflectance Vegetation: characterizing the dynamics in canopy function, field data
are key (e. g. flux sites, instrumented, in situ field collections)
• Spectral Continuity of Current Multispectral Bands, VIs and Products
Product Prototypes
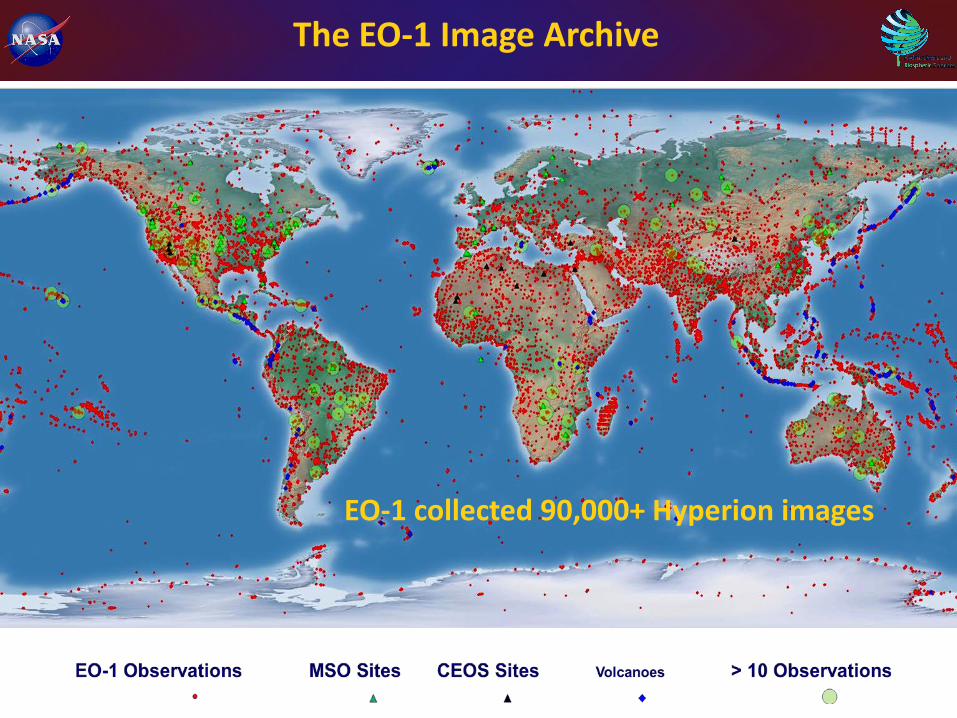
EO-1 collected 90,000+ Hyperion images
The EO-1 Image Archive

CEOS/WGCV
The EO-1 Image Collections
Scenestotal (<10% clouds)
1 ABoVE 1367(293) ALI Arctic-Boreal Vulnerability Experiment, NASA/TE
2 CEOS/WGCV 1022(568) Hyperion The CEOS Working Group on Calibration & Validation
3 FLUXNET 9680(3552) Hyperion Network of eddy covariance flux measurements of carbon, water vapor and energy exchange
4 LTER 1181(412) ALI The Long Term Ecological Research Network5 NEON 973(314) Hyperion The National Ecological Observatory Network
6 SIGEO 1125(298) Hyperion The Smithsonian Institution Global Earth Observatory, ForestGEO
7 SpecNet 1245(305) Hyperion SpecNet - Linking optical measurements with flux sampling
8 Volcanoes 19155(3070) Hyperion Vocano Sensorweb, NASA/JPL
9 UNESCO-WCH Reserves
992(172) ALI/Hyperion UNESCO World Cultural Heritage, Nature Reserves
Field Earth Observation Networks / EffortsCollection Primary sensor
1 km
N
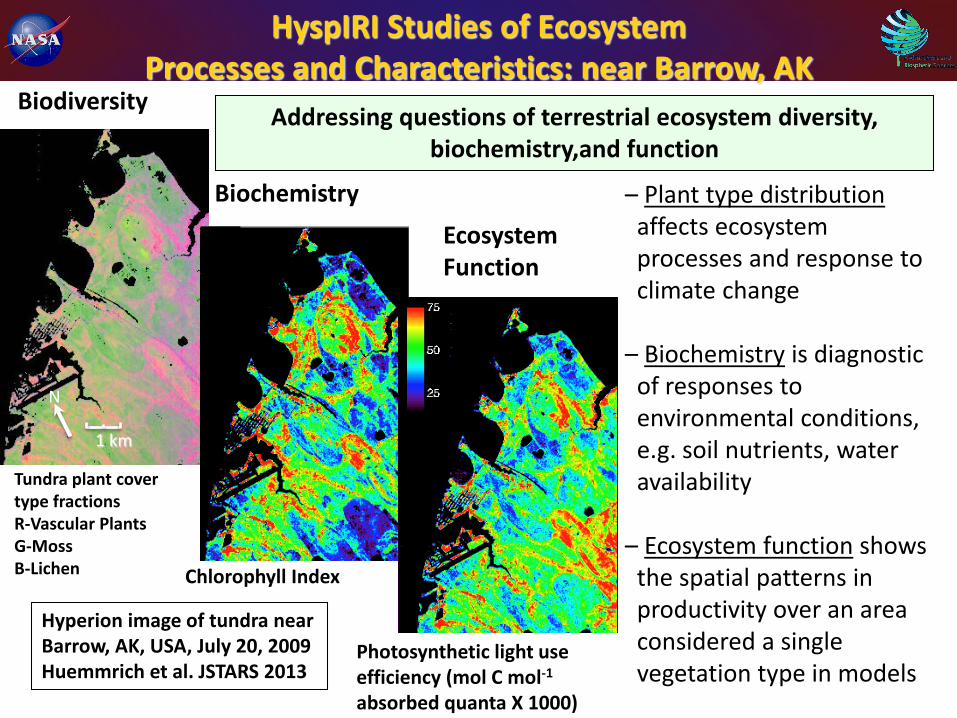
Biodiversity
BiochemistryEcosystemFunction
Tundra plant cover type fractionsR-Vascular PlantsG-MossB-Lichen Chlorophyll Index
Photosynthetic light use efficiency (mol C mol-1
absorbed quanta X 1000)
Addressing questions of terrestrial ecosystem diversity, biochemistry,and function
Hyperion image of tundra near Barrow, AK, USA, July 20, 2009Huemmrich et al. JSTARS 2013
– Plant type distributionaffects ecosystem processes and response to climate change
– Biochemistry is diagnostic of responses to environmental conditions, e.g. soil nutrients, water availability
– Ecosystem function shows the spatial patterns in productivity over an area considered a single vegetation type in models
HyspIRI Studies of Ecosystem Processes and Characteristics: near Barrow, AK
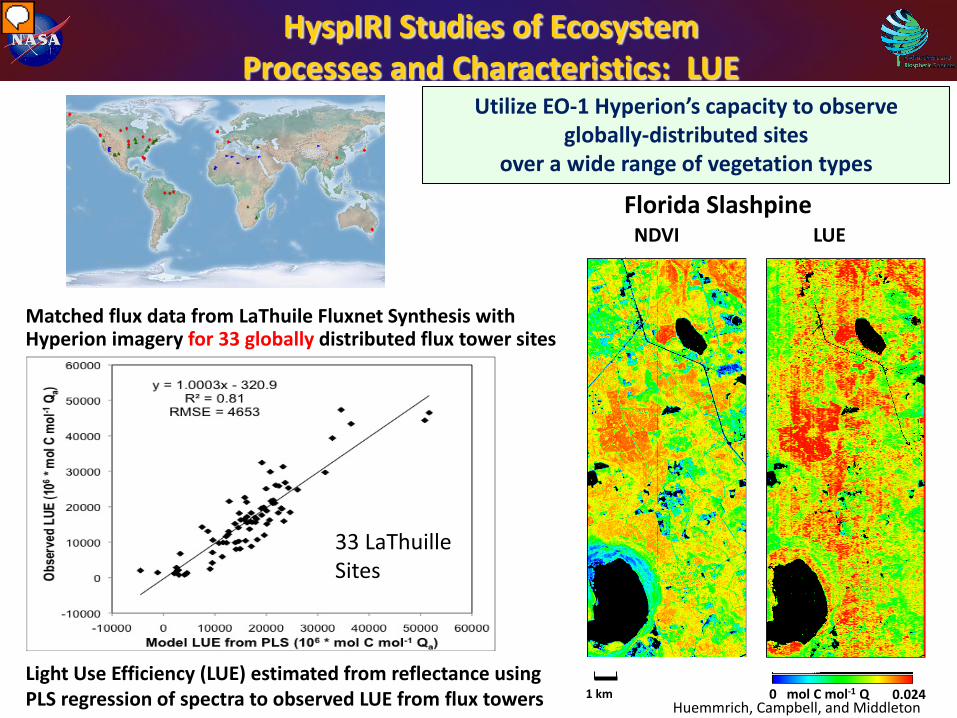
Light Use Efficiency (LUE) estimated from reflectance using PLS regression of spectra to observed LUE from flux towers
Matched flux data from LaThuile Fluxnet Synthesis with Hyperion imagery for 33 globally distributed flux tower sites
Florida Slashpine
1 km
NDVI LUE
0.0240 mol C mol-1 QHuemmrich, Campbell, and Middleton
HyspIRI Studies of Ecosystem Processes and Characteristics: LUE
Utilize EO-1 Hyperion’s capacity to observe globally-distributed sites
over a wide range of vegetation types
33 LaThuilleSites

Using EO-1 / Hyperion for seasonal dynamics and ecosystem functionrelies on spectral stability and repeated coverage
FLUX site locations and number ofHyperion cloud free images EO-1 Time Series at FLUX Sites
HyspIRI Studies of Ecosystem Processes and Characteristics: NEP
Campbell, Huemmrich, and Middleton
MONGU

Midday GEP vs. APAR
y = 0.0106x + 1.728R² = 0.85
y = 0.0166x - 0.2254R² = 0.76
y = 0.0428x - 11.256R² = 0.92
-5
5
15
25
35
45
55
65
75
0 500 1000 1500 2000
Mid
day G
EP (
µmol
m-2
s-1)
Midday APAR (µmol m-2 s-1)
Mongu
Duke
Konza
Av. LUE = 0.011 mol/mol
Av. LUE = 0.017 mol/mol
Av. LUE = 0.043 mol/mol

The spectral bio-indicator associated with chlorophyll content (G32, green line) tracing the CO2 dynamics related to vegetation phenology
Hyperion Chlorophyll (and LAI) VIs and GEP
DOY
DryWet
MONGU

2-5 25P
Spatial Distribution Maps, Capturing the Seasonal Range of CO2 Absorbed by the Vegetation
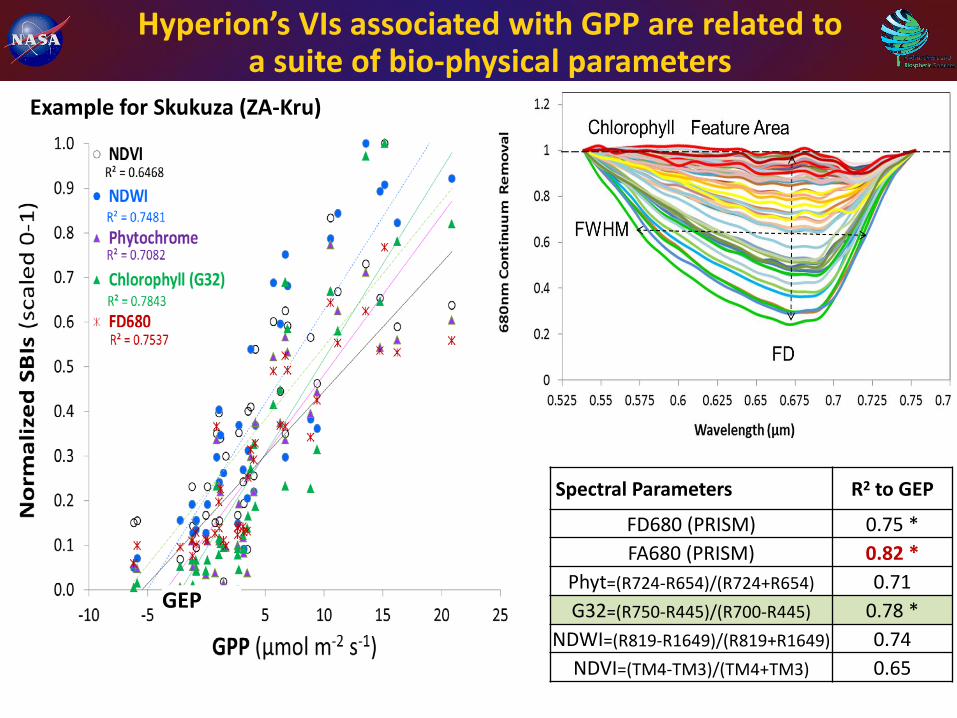
Hyperion’s VIs associated with GPP are related to a suite of bio-physical parameters
Spectral Parameters R2 to GEP
FD680 (PRISM) 0.75 *FA680 (PRISM) 0.82 *
Phyt=(R724-R654)/(R724+R654) 0.71G32=(R750-R445)/(R700-R445) 0.78 *
NDWI=(R819-R1649)/(R819+R1649) 0.74NDVI=(TM4-TM3)/(TM4+TM3) 0.65
Example for Skukuza (ZA-Kru)
GEP

Midday GEP using a PLSR model at Skukuza
Average Hyperion spectral reflectance for Skukuza (black) and the coefficients derived from PLSR vs. Wavelength (red)

Midday GEP using a PLSR model at Howland, ME
Hyperion reflectance PLSR components (black, top) and the coefficients derived from PLSR vs. Wavelength (red, below)
Spruce forestProblems in winter: snow, low GEP

15
HyspIRI Studies of Ecosystem Processes and Characteristics: C4 Grassland
FractionUtilize EO-1 Hyperion’s spectral information to describe distributions of key plant functional types
C3 and C4 plants differ in leaf anatomy and enzymes used in photosynthesis. These differences are important as they determine optimal growing conditions, nitrogen and water-use efficiency, and seasonal growth patterns.
The Konza Prairie in Kansas is a region where there is a range in the relative abundance of C3 and C4 plants, and that abundance varies with location and time of year. Species ground coverage is measured every year for different Konza watersheds.
Partial least squares regression of Hyperion spectra is able to describe C4 cover fractions for different Konza watersheds collected in different years.

Modeling Canopy Bio-physical ParametersHyperion’s Reflectance and RTMo
Refle
ctan
ce (%
)
Wavelength (nm)
RMSE < 0.02
RTMo (part of SCOPE) includes: • 4SAIL - radiative transfer • Fluspect’ - leaf optical • GSV - soil reflectance
Measured EO-1 Hyperion
reflectance
Simulated SCOPE, RTMo module
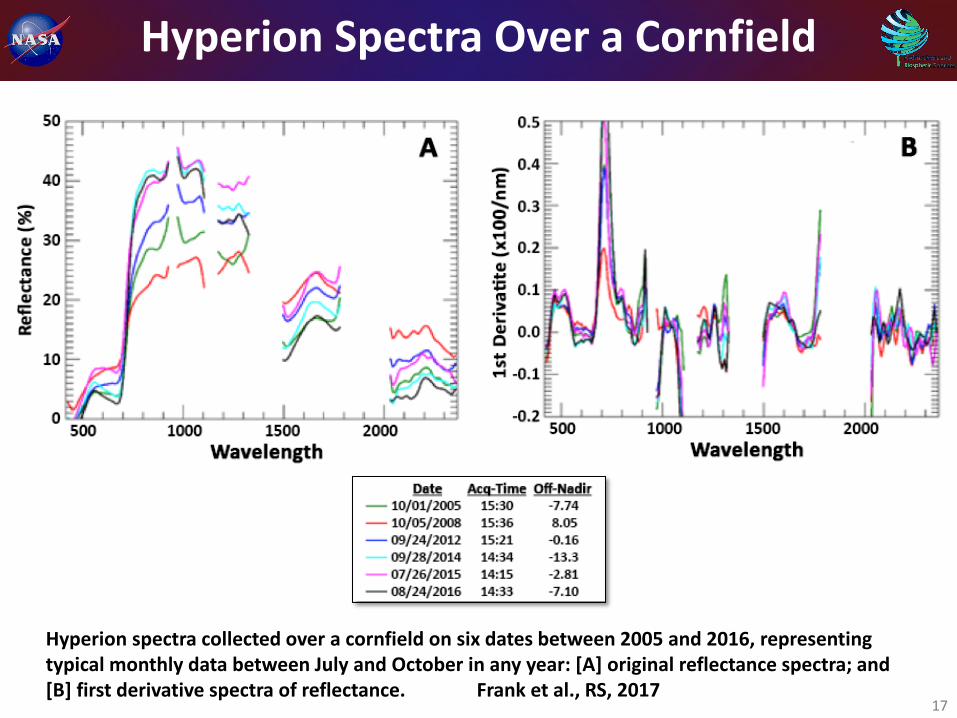
Hyperion spectra collected over a cornfield on six dates between 2005 and 2016, representing typical monthly data between July and October in any year: [A] original reflectance spectra; and [B] first derivative spectra of reflectance. Frank et al., RS, 2017
17
Hyperion Spectra Over a Cornfield
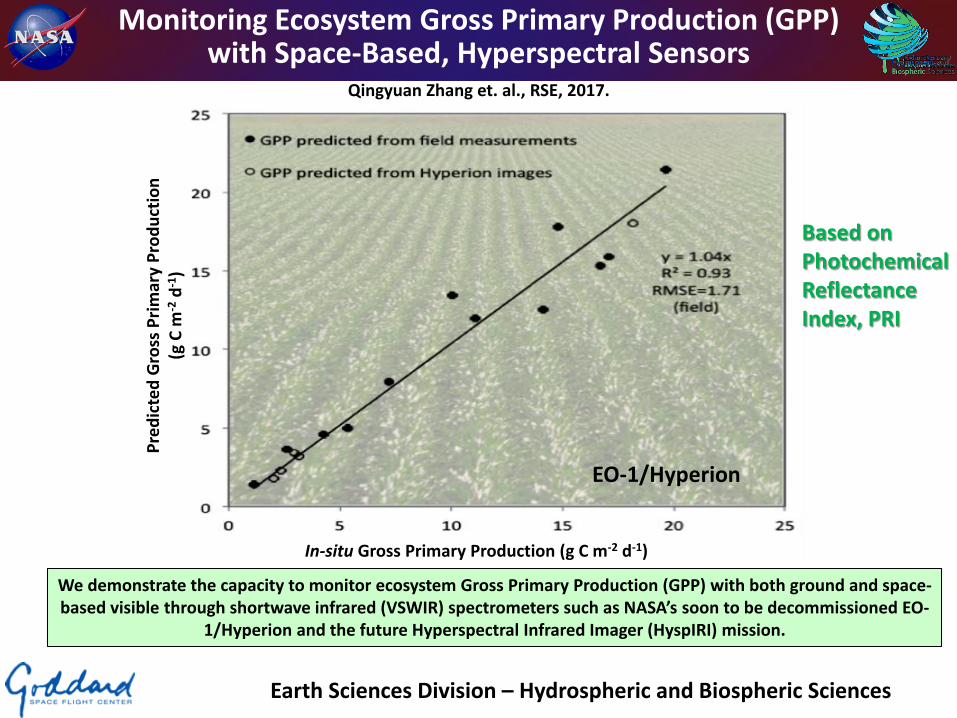
Monitoring Ecosystem Gross Primary Production (GPP)with Space-Based, Hyperspectral Sensors
Qingyuan Zhang et. al., RSE, 2017.
We demonstrate the capacity to monitor ecosystem Gross Primary Production (GPP) with both ground and space-based visible through shortwave infrared (VSWIR) spectrometers such as NASA’s soon to be decommissioned EO-
1/Hyperion and the future Hyperspectral Infrared Imager (HyspIRI) mission.
Earth Sciences Division – Hydrospheric and Biospheric Sciences
EO-1/Hyperion
In-situ Gross Primary Production (g C m-2 d-1)
Pred
icte
d G
ross
Prim
ary
Prod
uctio
n(g
C m
-2d-1
)
Based on PhotochemicalReflectanceIndex, PRI

MODIS Retrievals of Gross Primary Productionusing the Photochemical Reflectance Index (PRI)
MODIS narrow ocean bands are used over land to monitor stress responses that inhibit carbon uptake in Canadian forest ecosystems. This study highlights the additional value of off-nadir directional reflectance
observations along with the pairing of morning and afternoon satellite observations to improve retrievals of photosynthetic light use efficiency.
Earth Sciences Division – Hydrospheric and Biospheric Sciences
MODIS
Average of Morning & Afternoon Photosynthetic Light Use Efficiency
Sum
of S
ame
Day
Terr
a &
Aqu
a Ph
otoc
hem
ical
Re
flect
ance
Inde
x
Middleton et al., RSE, 2016.
Based on PhotochemicalReflectanceIndex, PRI

Diurnal Hysteresis Observed with SIF688 & PRIParker Tract Tower Site
Loblolly Pine: age class = 27-33 y
20

HyspIRI Studies of Ecosystem Processes and Characteristics: fAPARchl
0 0.1 0.2 0.3 0.4 0.5 0.6 0.7 0.8 0.9 1.0
Harvard, June 2008
fAPARchl fAPARcanopy
• Hyperion demonstrates accurate fAPARchlfor vegetation (fAPARchl < fAPARcanopy)
• Hyperion fAPARchl = MODIS fAPARchl• (30 m) (500 m)
Zhang et al. 2012, 2013, 2014, 201621
30 m Hyperion
30 m Hyperion, Howland, June 2015
Utilize EO-1 Hyperion’s imaging spectroscopy for algorithm development and testing for new data products

0
10
20
30
40
50
60
70
80
90
100
12 41 120 135 165 174 176 181 197 209 229 234 272 284 288
2006 2006 2007 2007 2001 2004 2008 2001 2001 2007 2001 2007 2005 2005 2007
Blue447 Green549 Red651
NIR854 FR1003 FR1679
FR2204
Acquisition (Julian day)
ρ(m
ea
ns
at se
lect
ba
nd
s,%
)
EO-1 Hyperion Spectral Bands
Year
Jul. day4 km-1 -0.5 0 0.5 +1
N
N
+ +
Railroad Valley Playa
HyspIRI Reflectance Time Series at Calibration Sites
Evaluating the consistency/stability of derived reflectance from Hyperion
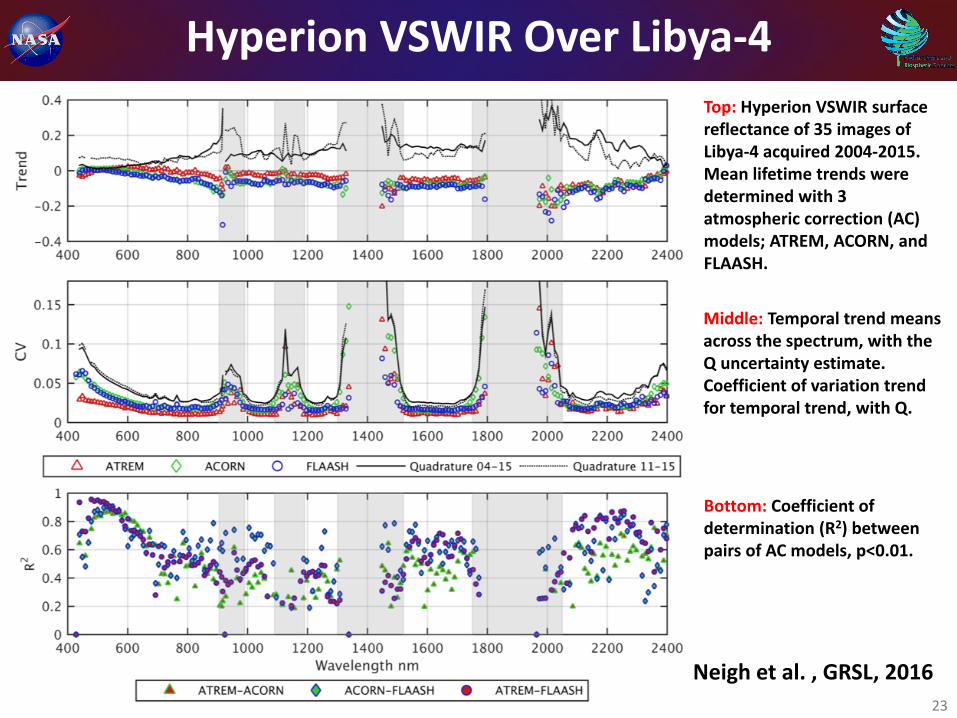
Middle: Temporal trend means across the spectrum, with the Q uncertainty estimate. Coefficient of variation trend for temporal trend, with Q.
23
Hyperion VSWIR Over Libya-4Top: Hyperion VSWIR surface reflectance of 35 images of Libya-4 acquired 2004-2015. Mean lifetime trends were determined with 3 atmospheric correction (AC) models; ATREM, ACORN, and FLAASH.
Bottom: Coefficient of determination (R2) between pairs of AC models, p<0.01.
Neigh et al. , GRSL, 2016

Coastal and Aquatic Products

0.0
0.1
0.2
0.3
0.4
0.5
0.6
0.7
0.8
0.9
1.0
400 600 800 1000 1200 1400 1600 1800 2000 2200 2400
Hype
rion-
deriv
ed S
cale
d Re
flect
ance
Wavelength (nm)
Hyperion Reflectance of Apollo 16 Landing Site
Hyperion Observation
Apollo 16 Soil Sample
A comparison of Hyperion-derived reflectance with high resolution Apollo 16 soil sample spectra provided by the Lunar and Planetary Institute is shown.
Hyperion Reflectance of Apollo 16 Landing Site

GOME-2 SIF and APARchl
3 Years of GOME-2 & MODIS data2008, 2010, 2012
over Nebraska, USA
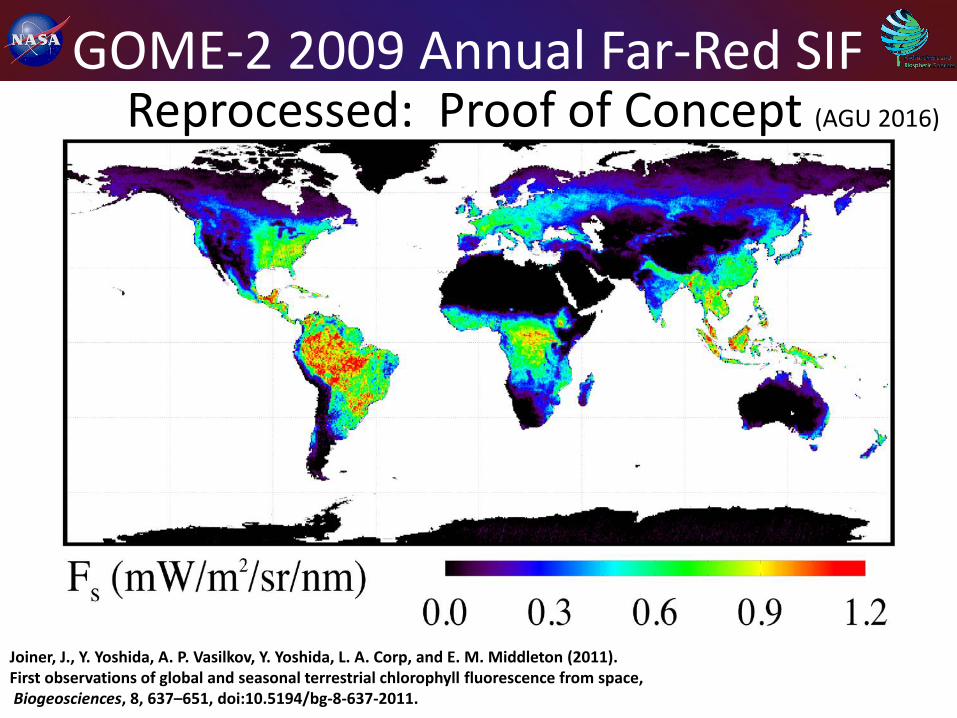
GOME-2 2009 Annual Far-Red SIFReprocessed: Proof of Concept (AGU 2016)
Joiner, J., Y. Yoshida, A. P. Vasilkov, Y. Yoshida, L. A. Corp, and E. M. Middleton (2011). First observations of global and seasonal terrestrial chlorophyll fluorescence from space,Biogeosciences, 8, 637–651, doi:10.5194/bg-8-637-2011.
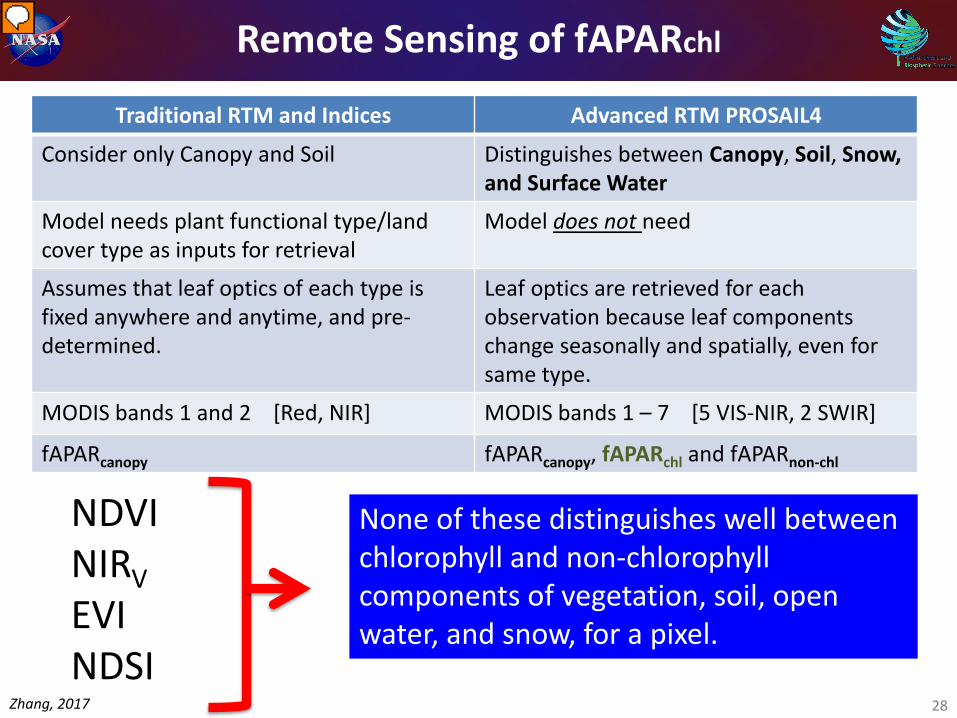
Traditional RTM and Indices Advanced RTM PROSAIL4
Consider only Canopy and Soil Distinguishes between Canopy, Soil, Snow, and Surface Water
Model needs plant functional type/land cover type as inputs for retrieval
Model does not need
Assumes that leaf optics of each type is fixed anywhere and anytime, and pre-determined.
Leaf optics are retrieved for each observation because leaf components change seasonally and spatially, even for same type.
MODIS bands 1 and 2 [Red, NIR] MODIS bands 1 – 7 [5 VIS-NIR, 2 SWIR]
fAPARcanopy fAPARcanopy, fAPARchl and fAPARnon-chl
None of these distinguishes well between chlorophyll and non-chlorophyll components of vegetation, soil, open water, and snow, for a pixel.
Remote Sensing of fAPARchl
28Zhang, 2017
NDVINIRVEVINDSI

Common Reflectance Indices
NDVI = (ρNIR1 – ρred) / (ρNIR1 + ρred)
NIRV = ρNIR1 X NDVI
EVI = 2.5 X [(ρNIR1 – ρred) /( 1 + ρNIR1 + 6 X ρred – 7.5 X ρblue)]
NDSI = (ρgreen – ρSWIR1) / (ρgreen + ρSWIR1)
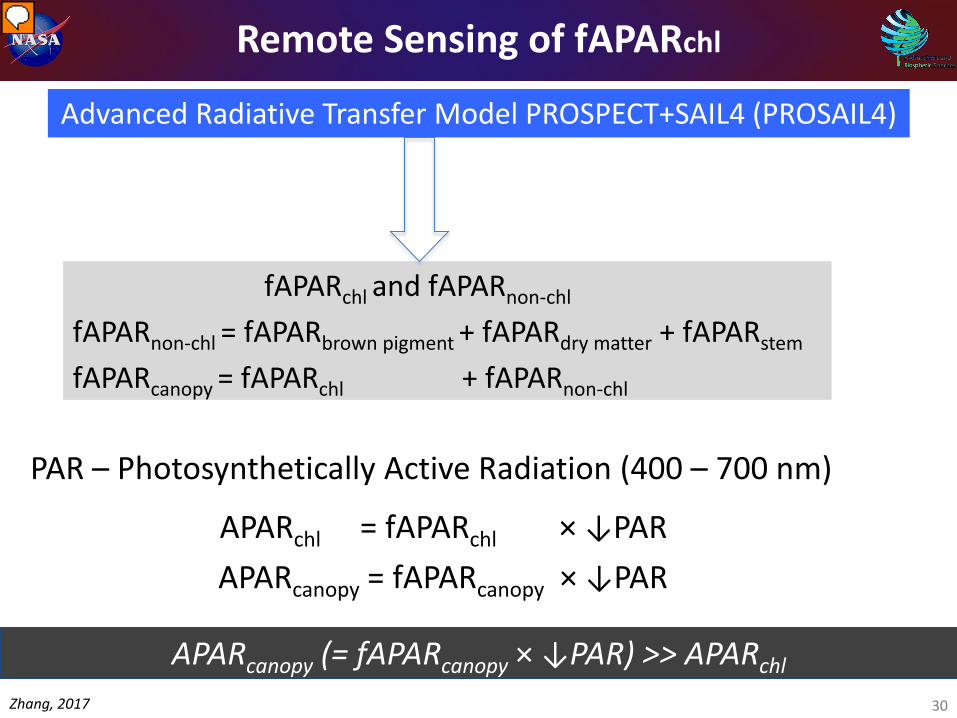
Advanced Radiative Transfer Model PROSPECT+SAIL4 (PROSAIL4)
fAPARchl and fAPARnon-chl
fAPARnon-chl = fAPARbrown pigment + fAPARdry matter + fAPARstem
fAPARcanopy = fAPARchl + fAPARnon-chl
APARcanopy (= fAPARcanopy × ↓PAR) >> APARchl
PAR – Photosynthetically Active Radiation (400 – 700 nm)
APARchl = fAPARchl × ↓PARAPARcanopy = fAPARcanopy × ↓PAR
Remote Sensing of fAPARchl
30Zhang, 2017
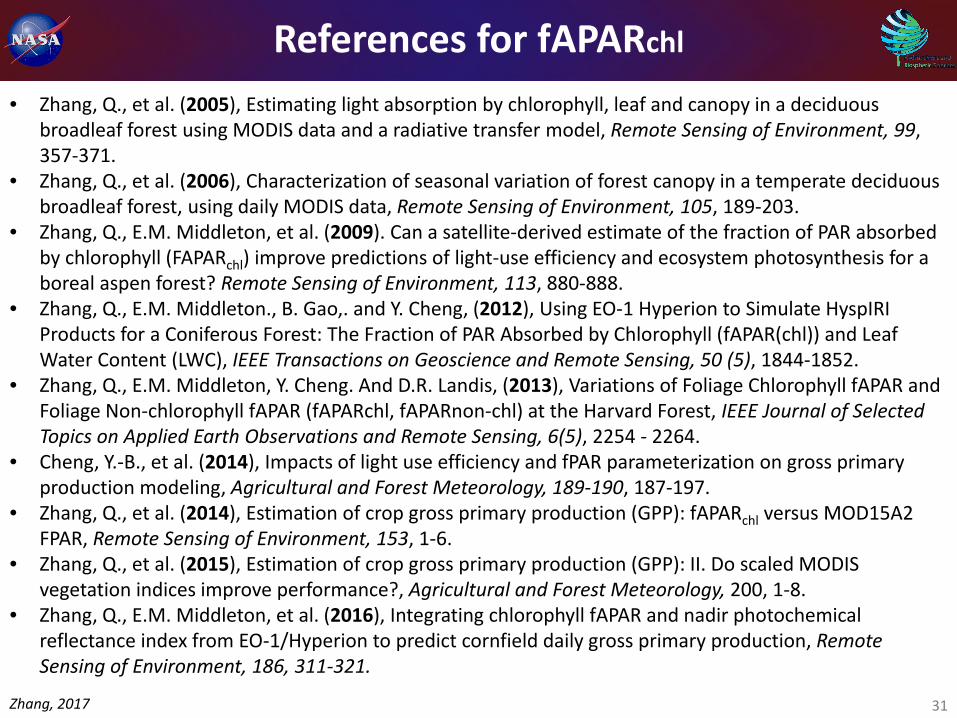
References for fAPARchl
31Zhang, 2017
• Zhang, Q., et al. (2005), Estimating light absorption by chlorophyll, leaf and canopy in a deciduous broadleaf forest using MODIS data and a radiative transfer model, Remote Sensing of Environment, 99, 357-371.
• Zhang, Q., et al. (2006), Characterization of seasonal variation of forest canopy in a temperate deciduous broadleaf forest, using daily MODIS data, Remote Sensing of Environment, 105, 189-203.
• Zhang, Q., E.M. Middleton, et al. (2009). Can a satellite-derived estimate of the fraction of PAR absorbed by chlorophyll (FAPARchl) improve predictions of light-use efficiency and ecosystem photosynthesis for a boreal aspen forest? Remote Sensing of Environment, 113, 880-888.
• Zhang, Q., E.M. Middleton., B. Gao,. and Y. Cheng, (2012), Using EO-1 Hyperion to Simulate HyspIRI Products for a Coniferous Forest: The Fraction of PAR Absorbed by Chlorophyll (fAPAR(chl)) and Leaf Water Content (LWC), IEEE Transactions on Geoscience and Remote Sensing, 50 (5), 1844-1852.
• Zhang, Q., E.M. Middleton, Y. Cheng. And D.R. Landis, (2013), Variations of Foliage Chlorophyll fAPAR and Foliage Non-chlorophyll fAPAR (fAPARchl, fAPARnon-chl) at the Harvard Forest, IEEE Journal of Selected Topics on Applied Earth Observations and Remote Sensing, 6(5), 2254 - 2264.
• Cheng, Y.-B., et al. (2014), Impacts of light use efficiency and fPAR parameterization on gross primary production modeling, Agricultural and Forest Meteorology, 189-190, 187-197.
• Zhang, Q., et al. (2014), Estimation of crop gross primary production (GPP): fAPARchl versus MOD15A2 FPAR, Remote Sensing of Environment, 153, 1-6.
• Zhang, Q., et al. (2015), Estimation of crop gross primary production (GPP): II. Do scaled MODIS vegetation indices improve performance?, Agricultural and Forest Meteorology, 200, 1-8.
• Zhang, Q., E.M. Middleton, et al. (2016), Integrating chlorophyll fAPAR and nadir photochemical reflectance index from EO-1/Hyperion to predict cornfield daily gross primary production, Remote Sensing of Environment, 186, 311-321.

US-NE1
2006 NLCD Map of 50x50km Area Around US-NE1
32Zhang, 2017
√

* Terra MODIS: MAIAC 8-day 500 m surface reflectancefAPARcanopy, fAPARchl & fAPARnon-chl - bands 1 - 7
NDVI and NIRV - bands 1, 2
EVI - bands 1, 2, 3
SIF (λemission=740 nm), swath width 1920 kmPixel spatial resolution (nadir): ~ 0.5o
Spectral resolution ~ 0.5 nm (S/N ~1000)
* GOME-2 (Global Ozone Monitoring Experiment -2)
ftp://ftp.gfz-potsdam.de/home/mefe/GlobFluo/GOME-2/ungridded/
* Tower ↓PAR at US-Ne1
Data Sources

DOY 016 02032 040 048 056 064 072 080 088 096 104 112 120 128 136 144 152 160 168 176 184 192 200 208 216 224 232 240 248 256 264 272 280 288 296 304 312 320 328 336 344 352 360 3662008
2010
2012
MODIS Products:RGB, fAPARcanopy, fAPARchl, fAPARnon-chl, NDVI, & EVI
34Zhang, 2017
DOY 016 02032 040 048 056 064 072 080 088 096 104 112 120 128 136 144 152 160 168 176 184 192 200 208 216 224 232 240 248 256 264 272 280 288 296 304 312 320 328 336 344 352 360 366
DOY 016 02032 040 048 056 064 072 080 088 096 104 112 120 128 136 144 152 160 168 176 184 192 200 208 216 224 232 240 248 256 264 272 280 288 296 304 312 320 328 336 344 352 360 366
ABCDEF
ABCDEF
ABCDEF
A: RGB image D: fAPARnon-chl
B: fAPARcanopy E: NDVIC: fAPARchl F: EVI
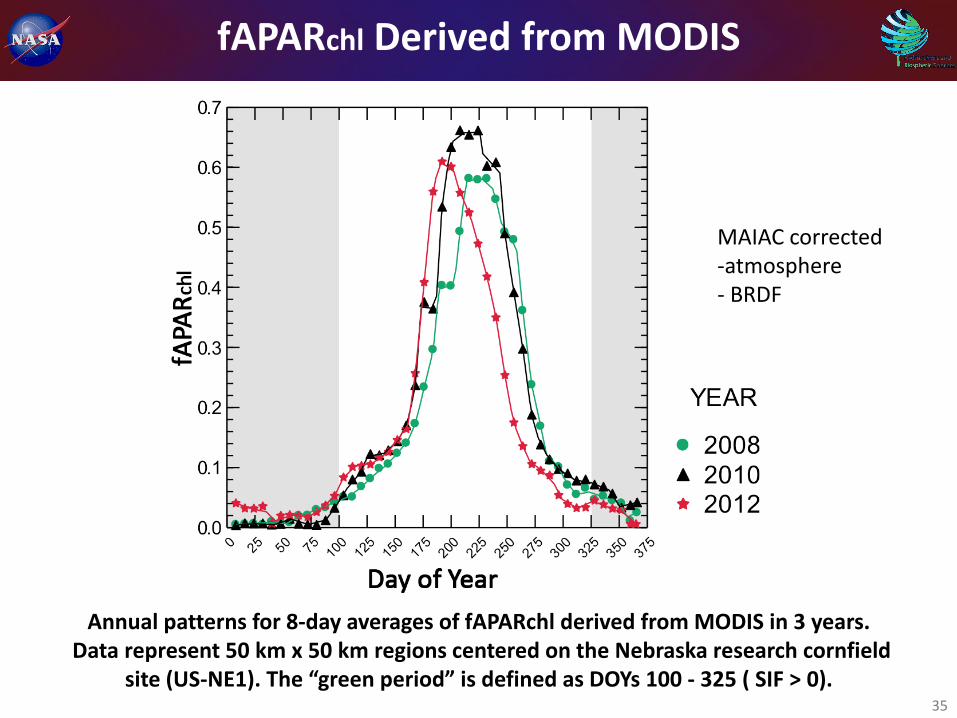
fAPARchl Derived from MODIS
35
Annual patterns for 8-day averages of fAPARchl derived from MODIS in 3 years.Data represent 50 km x 50 km regions centered on the Nebraska research cornfield
site (US-NE1). The “green period” is defined as DOYs 100 - 325 ( SIF > 0).
MAIAC corrected-atmosphere- BRDF

APARchl Derived from MODIS & NE-1
36
Annual patterns for 8-day averages of APARchl derived in 3 years from MODIS and from PAR measured at the NE-1 flux tower site (Meade, NE, USA). Data represent 50 km x 50 km regions centered on NE-1. The “green period” is defined as DOYs 100 - 325 ( SIF > 0).
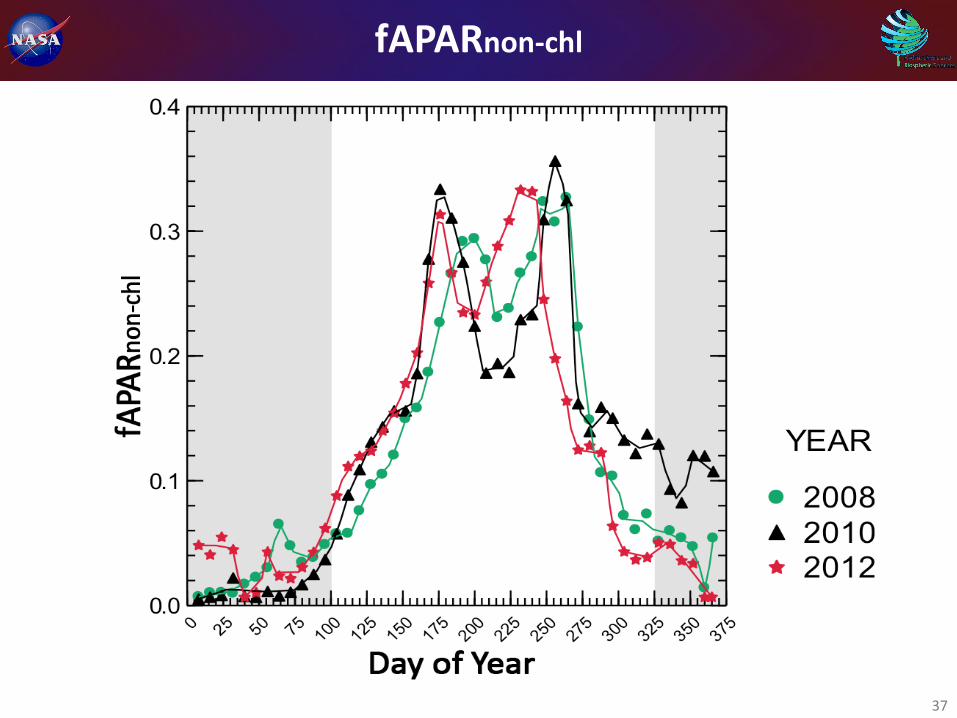
fAPARnon-chl
37

fAPARcanopy
38
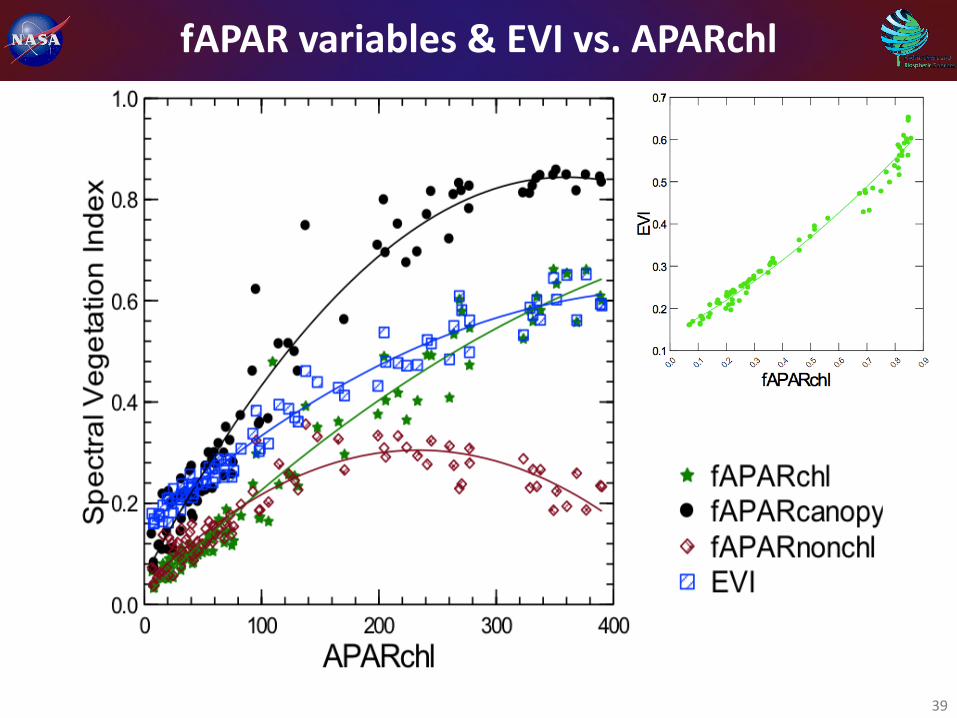
fAPAR variables & EVI vs. APARchl
39
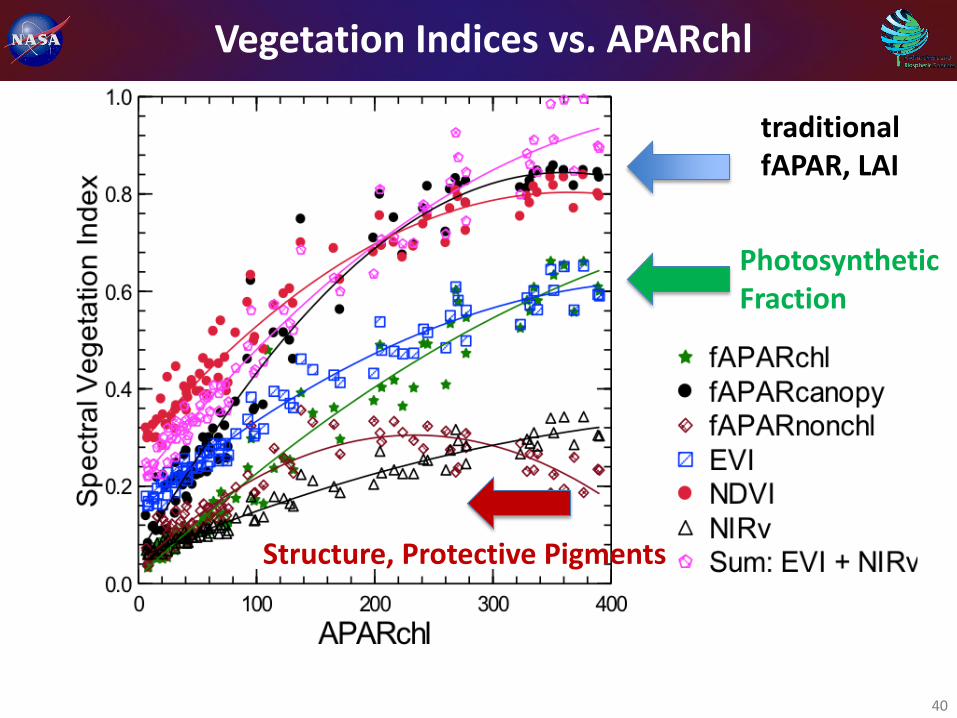
Vegetation Indices vs. APARchl
40
traditionalfAPAR, LAI
PhotosyntheticFraction
Structure, Protective Pigments

Far-Red SIF/cos(SZA) from GOME-2
41
Annual patterns for 8-day averages of far-red SIF/cos(SZA) radiance (mW m-2 m-1 sr-1) in 3 years retrieved from GOME-2, normalized with cos(SZA). Data represent 50 km x 50 km
regions centered on the Nebraska research cornfield site (US-NE1).The “green period” is defined as DOYs 100 - 325 ( SIF > 0).
← norm SIF Values > 0 →
y = 0.0136x + 0.350R² = 0.848
0
1
2
3
4
5
6
7
0 50 100 150 200 250 300 350 400
SIF/
cos(
SZA)
(mW
m-2
nm-1
sr-1
)
SIF/cos(SZA)
Linear (SIF/cos(SZA))
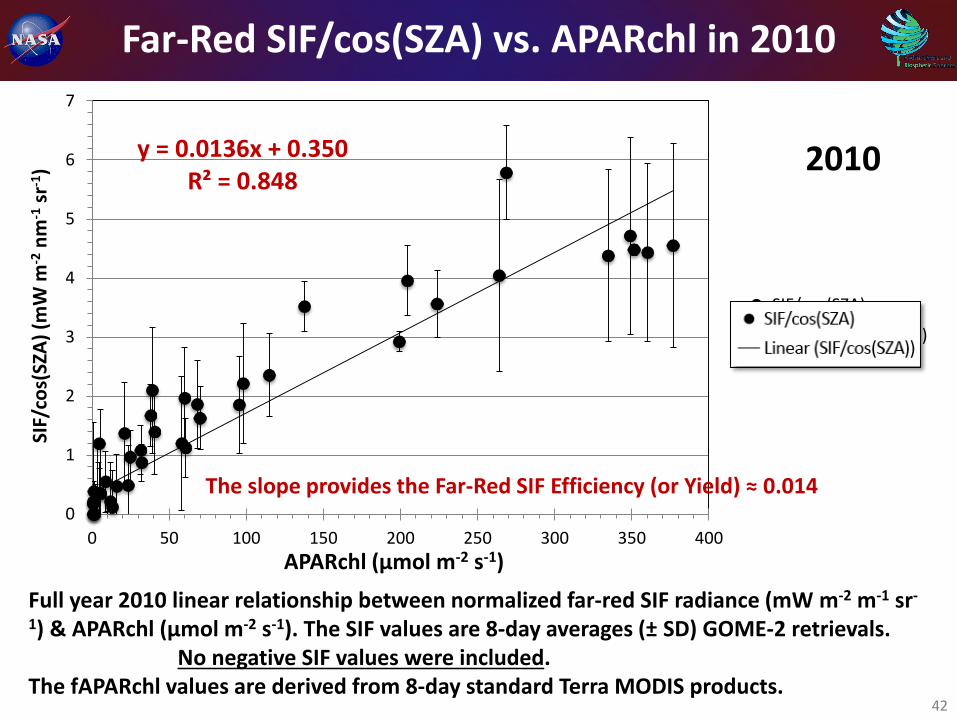
Far-Red SIF/cos(SZA) vs. APARchl in 2010
42
Full year 2010 linear relationship between normalized far-red SIF radiance (mW m-2 m-1 sr-
1) & APARchl (µmol m-2 s-1). The SIF values are 8-day averages (± SD) GOME-2 retrievals.No negative SIF values were included.
The fAPARchl values are derived from 8-day standard Terra MODIS products.
2010
APARchl (µmol m-2 s-1)
The slope provides the Far-Red SIF Efficiency (or Yield) ≈ 0.014
y = 7.5418x + 0.1313R² = 0.890
0
1
2
3
4
5
6
7
0 0.1 0.2 0.3 0.4 0.5 0.6 0.7
SIF/
cos(
SZA)
(mW
m-2
nm-1
sr-1
)
SIF/cos(SZA)
Linear (SIF/cos(SZA))
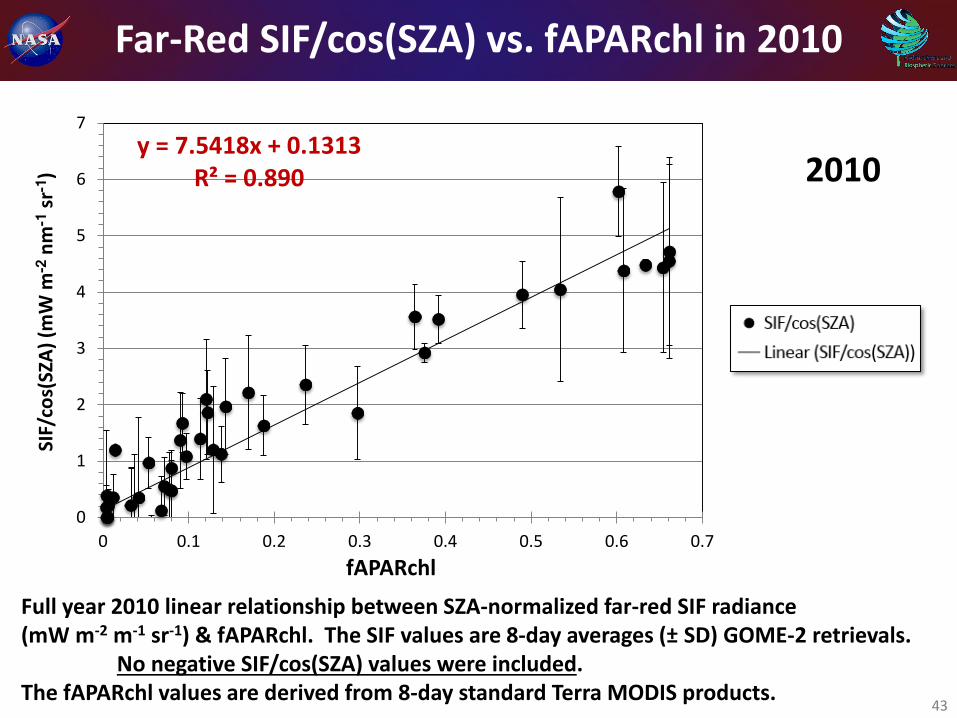
Far-Red SIF/cos(SZA) vs. fAPARchl in 2010
43
Full year 2010 linear relationship between SZA-normalized far-red SIF radiance(mW m-2 m-1 sr-1) & fAPARchl. The SIF values are 8-day averages (± SD) GOME-2 retrievals.
No negative SIF/cos(SZA) values were included. The fAPARchl values are derived from 8-day standard Terra MODIS products.
2010
fAPARchl

SIF Yields from SIF/cos(SZA) vs. APARchl
44
Linear relationships in 3 years: SIF/cos(SZA) (mW m-2 m-1 sr-1) & APARchl (µmol m-2 s-1),for the “green” season period (DOY 100 – 325).
The annual and regional SIFyields (J µmol-1 APAR sr-1 nm-1) were estimated from the slopes:1 % to 1.4% (p ≤ 0.01): 2008 (0.0165); 2010 (0.0136); and 2012 (0.0115).

Vegetation Indices vs. SIF/cos(SZA)
45
fAPAR, LAI
Photosynthetic Fraction
Structure, Protective Pigments
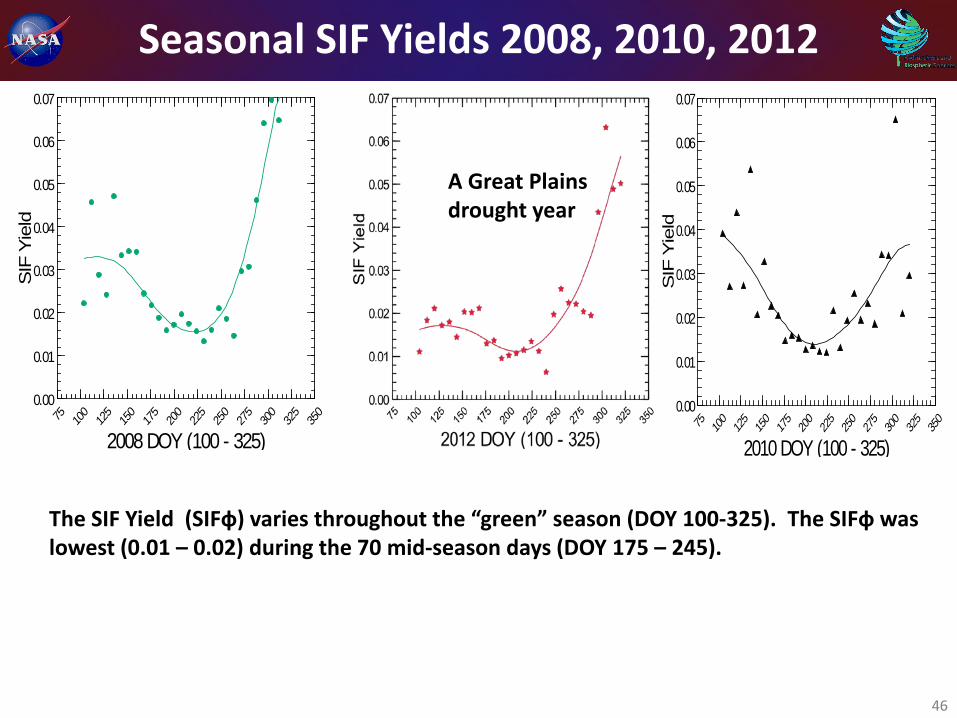
Seasonal SIF Yields 2008, 2010, 2012
46
The SIF Yield (SIFф) varies throughout the “green” season (DOY 100-325). The SIFф was lowest (0.01 – 0.02) during the 70 mid-season days (DOY 175 – 245).
75 100
125
150
175
200
225
250
275
300
325
350
2008 DOY (100 - 325)
0.00
0.01
0.02
0.03
0.04
0.05
0.06
0.07
SIF
Yie
ld
75 100
125
150
175
200
225
250
275
300
325
350
2010 DOY (100 - 325)
0.00
0.01
0.02
0.03
0.04
0.05
0.06
0.07
SIF
Yie
ld
A Great Plainsdrought year
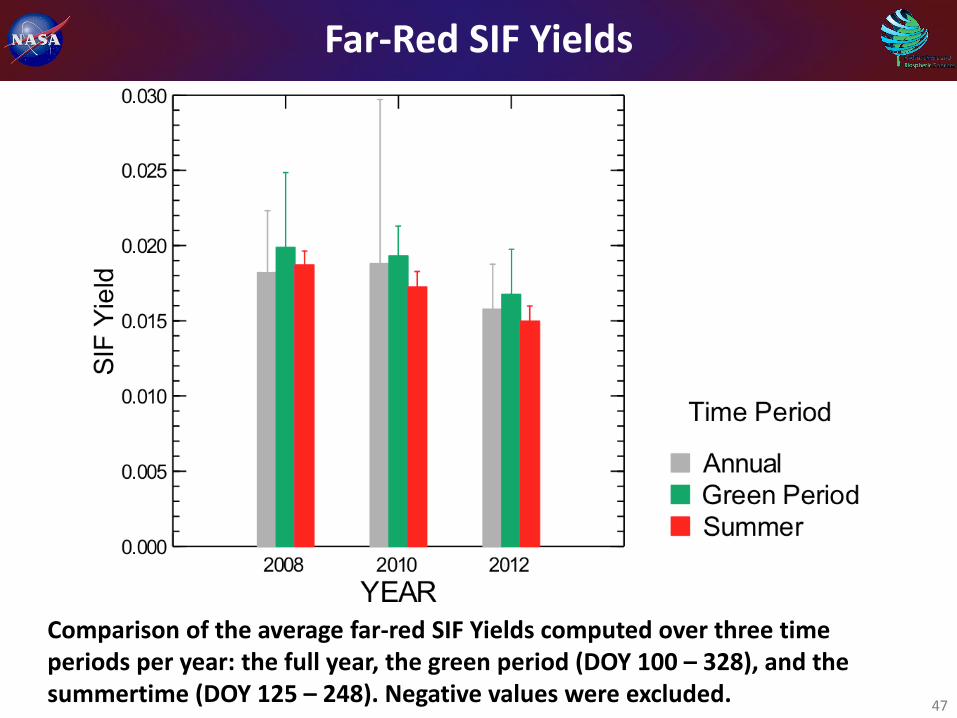
Far-Red SIF Yields
47
Comparison of the average far-red SIF Yields computed over three time periods per year: the full year, the green period (DOY 100 – 328), and the summertime (DOY 125 – 248). Negative values were excluded.
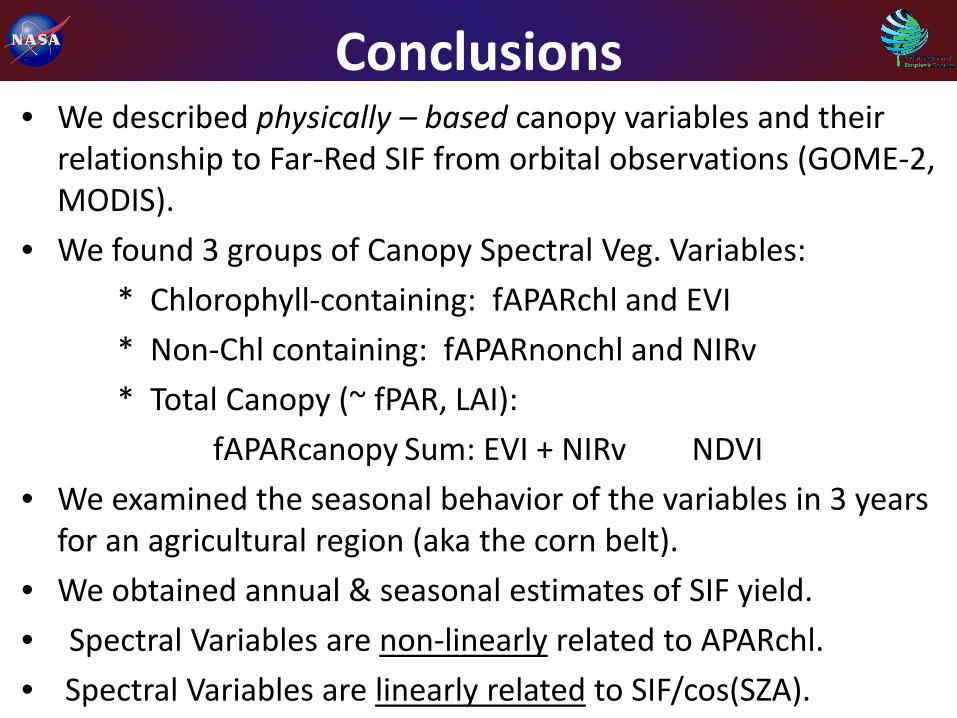
Conclusions• We described physically – based canopy variables and their
relationship to Far-Red SIF from orbital observations (GOME-2, MODIS).
• We found 3 groups of Canopy Spectral Veg. Variables:* Chlorophyll-containing: fAPARchl and EVI* Non-Chl containing: fAPARnonchl and NIRv* Total Canopy (~ fPAR, LAI):
fAPARcanopy Sum: EVI + NIRv NDVI• We examined the seasonal behavior of the variables in 3 years
for an agricultural region (aka the corn belt).• We obtained annual & seasonal estimates of SIF yield.• Spectral Variables are non-linearly related to APARchl.• Spectral Variables are linearly related to SIF/cos(SZA).

FLEX mission concept
ESA’s 8th Earth Explorer mission:FLuorescence EXplorer (FLEX)will be the first global space missionspecifically dedicated to map SIFof the terrestrial vegetation.
49

NASA Corn MazeMars RoverCornbelly's
in Lehi, Utah
50
THANK YOU!
Special thanks to David Landis SGT, NASA/GSFCFor graphics
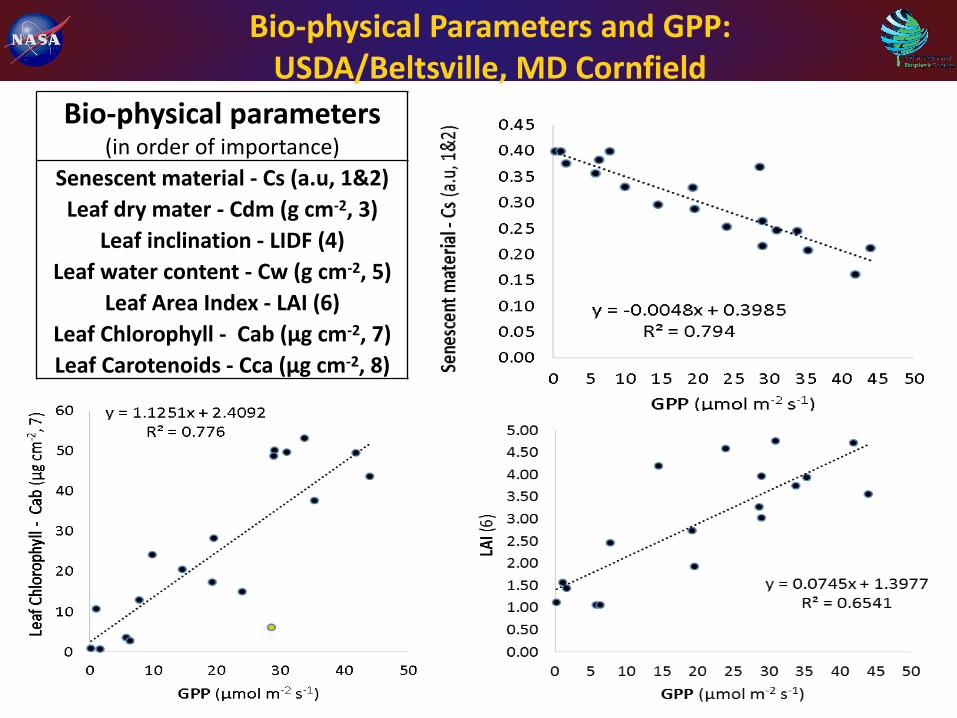
Bio-physical parameters(in order of importance)
Senescent material - Cs (a.u, 1&2)Leaf dry mater - Cdm (g cm-2, 3)
Leaf inclination - LIDF (4)Leaf water content - Cw (g cm-2, 5)
Leaf Area Index - LAI (6)Leaf Chlorophyll - Cab (µg cm-2, 7)Leaf Carotenoids - Cca (µg cm-2, 8)
Bio-physical Parameters and GPP:USDA/Beltsville, MD Cornfield