monitoring exports of used electrical and electronic
TRANSCRIPT

Monitoring Exports of used Electrical and Electronic Equipment (EEE) from the Netherlands
Authors: C.P. Baldé and S. van den Brink Contact information: For enquiries, please contact the corresponding author C.P. Baldé at [email protected]. Please cite this publication as: Baldé, C.P., van den Brink, S., (2020). Monitoring Export for Reuse in the Netherlands. United Nations University (UNU) / United Nations Institute for Training and Research (UNITAR) - co-hosted by the SCYCLE Programme, Bonn, Germany. Disclaimer: The designations employed and the presentation of the material in this publication do not imply the expression of any opinion whatsoever on the part of the United Nations University (UNU)/United Nations Institute for Training and Research (UNITAR) concerning the legal status of any country, territory, city, or area, or of its authorities, or concerning delimitation of its frontiers or boundaries. Trademark names and symbols are used in an editorial fashion with no intention on infringement of trademark or copyright laws. Moreover, the views expressed in this publication are those of the authors and do not necessarily represent those of UNU/UNITAR, nor does citing of trade names, companies, schemes, or commercial processes constitute endorsement. We regret any errors or omissions that may have been unwittingly made.

2
Contents Introduction ......................................................................................................................... 3 Method 1: The National WEEE Register (high quality) ........................................................ 4 1.1 Data sources and data collection .................................................................................. 4 1.2 Method ......................................................................................................................... 4 1.3 Results ......................................................................................................................... 5 Method 2: Desktop research of previous studies (high quality) ........................................... 5 2.1 Data sources and data collection .................................................................................. 5 2.2 Method ......................................................................................................................... 6 2.3 Results ......................................................................................................................... 6 Method 3: Trade data price analysis: export of mixed new and used electrical and electronic equipment (medium quality)................................................................................ 6 3.1 Data sources and data collection .................................................................................. 6 3.2 Method ......................................................................................................................... 7 3.3 Results ......................................................................................................................... 9 Method 4: Trade data: used electrical and electronic equipment exported in vehicles (medium quality) ............................................................................................................... 10 4.1 Data sources and data collection ................................................................................ 10 4.2 Method ....................................................................................................................... 11 4.3 Results ....................................................................................................................... 12 Method 5: Expert guess of the reusability per UNU-KEY (low quality):.............................. 12 5.1 Data ............................................................................................................................ 12 5.2 Methods ...................................................................................................................... 13 5.3 Results ....................................................................................................................... 14 Method 6: Luca Test Centre (high quality) ........................................................................ 15 6.1 Data sources and data collection ................................................................................ 15 6.2 Methods ...................................................................................................................... 15 6.3 Results ....................................................................................................................... 16 7. Method: Integration of data ........................................................................................... 16 7.1 Method ....................................................................................................................... 16 7.2 Results ....................................................................................................................... 22 7.3 Timelines to produce data ........................................................................................... 25 8. Recommendations for Monitoring Exports for Reuse .................................................... 26 ANNEX 1: UNU-KEYs with conversion to the EU (WEEE Directive) categories and NWR categories. ........................................................................................................................ 27

3
Introduction This monitoring plan provides a summary of the methods and results of the “export for reuse” extracted from the study “The Dutch WEEE flows 2020, What happened between 2010 and 2018”. The project has been conducted by United Nations University SCYCLE, in cooperation with FFACT and it was commissioned by the NVMP. The report quantifies the entire Dutch WEEE (Waste Electrical and Electronic Equipment) flows for the year 2018. The report presents the EEE Placed on the Market (POM), WEEE generated, the compliantly regulated WEEE collection, and the (W)EEE flows outside the regulated WEEE management system in the Netherlands, including the export for reuse. The methodologies are based on the report of the Dutch WEEE flows from 2011, that quantified the flows for the year 20101. In the Dutch WEEE flows study from 2012, the export for reuse has been quantified for the reference year 2010. The methodology for export for reuse was based on visual inspections, although other methods were also used to cross check the validity of the data point. The methodology and the results (44 kton) were therefore not transferable to assess exports for reuse in 2018. In the meantime, the National WEEE Register started to monitor exports for reuse through a voluntary registration. Data from the National WEEE Register is available for 2017 and 2018. As this registration is still in the pilot phase and there is limited information, other methods to assess the exports for reuse were used to cross check the data in the National WEEE Register. It appears that the 2017 and 2018 data in the National WEEE Register is not complete. Consequently, the aim was to calculate an improved figure on the exported tonnages EEE for reuse. There was not one data source that covers the exports for reuse entirely for all products. Therefore, the following six methods and data sources have been used. A conservative estimation approach has been taken to ensure higher certainty that the products are indeed exported. The six data sources / methods were:
The National WEEE Register
Desktop research of recently conducted studies
Trade data price analysis: export of mixed new and used electrical and electronic equipment
Trade data: used electrical and electronic equipment exported in vehicles
Expert guess of the reusability per UNU-KEY
Data from LUCA test center The outcomes per method were compared per UNU-KEY. Then the outcomes of the best method per UNU-KEY was chosen, and it was ensured that no double counting took place. This is explained in chapter 7 (integration of data). The outcomes are in line with the overall results of the Dutch WEEE Flows study 2020. This monitoring plan was commissioned by the Dutch monitoringsberaad WEEE. This monitoring council brings together representatives of all parties involved in the collection and processing of WEEE. Together with the Dutch Ministry of Infrastructure and Water Management, a total of 19 parties from the recycling
1 The Dutch WEEE Flows, 2010. https://www.nvmp.nl/uploads/pdf/nieuws/2012/raportfuture/Report%20The%20Dutch%20WEEE%20Flows.pdf

4
industry, retail, municipalities and producers and importers of electronic and electrical equipment are represented2. Method 1: The National WEEE Register (high quality)
1.1 Data sources and data collection The National WEEE Register (NWR) did a pilot for registration by producers of Export for Reuse in 2017 and in 2018. The results are included in the report “Rapportage over 2018”.
1.2 Method The data from the NWR was obtained in the categories of the National WEEE Register. It had to be converted into the UNU-KEYs. The following conversions were done: Category 2 was completely allocated to 0204, vacuum cleaner. This allocated might have to be refined in the future, if more weight is reported in this category. In 2018, only 114 kg was reported. Category 3b (IT- en telecom apparatuur – flatpanels), has been allocated to UNU-KEY 0309 (Flat Display Panel Monitors (LCD, LED). The breakdown of category 3c (IT- en telecom apparatuur - overig huishoudelijk) into the UNU-KEYs was done with the UNU-KEY fractions in mass% obtained from method 2, and is shown below.
UNU-KEY
Description Fraction
0301 Small IT equipment (e.g. routers, mice, keyboards, external drives & accessories)
98,864%
0302 Desktop PCs (excl. monitors, accessoires)
1,037%
0303 Laptops (incl. tablets) 0,091%
0304 Printers (e.g. scanners, multi functionals, faxes)
0,000%
0305 Telecommunication equipment (e.g. (cordless) phones, answering machines)
0,000%
0306 Mobile Phones (incl. smartphones, pagers)
0,009%
Table 1: UNU-KEY fractions in mass% obtained from method 2. Category 3d (IT- en telecom apparatuur - overig professioneel) was allocated to UNU-KEY 0307 (Professional IT equipment (e.g. servers, routers, data storage, copiers). Category 6 was completely allocated to professional tools UNU-KEY 0602, as it was suspected that reuse would occur most for professional tools, and in a lesser extend for household tools (UNU-KEY 0601). Category 10b (Automaten – ongekoeld) was allocated to UNU-KEY 1001 (non-cooled dispensers).
2 NVMP (2015). Monitoringsberaad moet helpen doelstellingen e-waste te realiseren. https://www.nvmp.nl/nieuws/nieuwsarchief-2015/monitoringsberaad-moet-helpen-doelstellingen-e-waste-te-realiseren.html

5
1.3 Results The data from the NWR was provided to the United Nations University shown below:
Cat. Description kton
2 Klein Huishoudelijk 0,000114 3b IT- en telecom apparatuur - flatpanels 0,222707
3c IT- en telecom apparatuur - overig huishoudelijk 0,120643
3d IT- en telecom apparatuur - overig professioneel 2,652934
9 Tools 1,280
10b Automaten - ongekoeld 0,110670
Table 2: Data from the NWR provided to the United Nations University The converted data into the UNU-KEYs is shown below:
UNU-KEY Description NWR (kton)
0204 Vacuum Cleaners (excl. professional) 0,000114
0301 Small IT equipment (e.g. routers, mice, keyboards, external drives & accessories)
0,12
0302 Desktop PCs (excl. monitors, accessoires) 0,00125
0303 Laptops (incl. tablets) 0,00011
0306 Mobile Phones (incl. smartphones, pagers) 0,00001
0307 Professional IT equipment (e.g. servers, routers, data storage, copiers)
2,65
0309 Flat Display Panel Monitors (LCD, LED) 0,222707
0602 Professional Tools (e.g. for welding, soldering, milling)
0,00128
1001 Non- cooled Dispensers (e.g. for vending, hot drinks, tickets, money)
0,111
Total 3,108
Table 3: Conversion of the NWR Data in the UNU-KEYs Method 2: Desktop research of previous studies (high quality)
2.1 Data sources and data collection A study on data center equipment (AmEcBoard, 2018), using market information
provided by Dutch data centers, recyclers and refurbishers;
Research on export for reuse of professional electronics (RTA/ICTM, 2019), using market information provided by partners in several Dutch producer responsibility schemes (producers, traders, recyclers, refurbishers); Both studies potentially show overlap with NWR pilot registrations from method 1.

6
2.2 Method The methodology is described in detail in the report “circulaire dataservers” from FFACT.3 The selected enterprises have received a questionnaire, and additional information was received from 14 follow-up interviews. The quality of the responses sometimes had to be supplemented with assumptions and estimations. The assumptions and estimations were tested with experts.
2.3 Results The outcomes were copied from the internal reports.
UNU-KEY
Description kton
0301 Small IT equipment (e.g. routers, mice, keyboards, external drives & accessories)
3,09
0302 Desktop PCs (excl. monitors, accessoires) 0,0324
0303 Laptops (incl. tablets) 0,0028
0306 Mobile Phones (incl. smartphones, pagers) 0,0003
0307 Professional IT equipment (e.g. servers, routers, data storage, copiers)
4,81
Total 7,9355
Table 4: Results Desktop research of previous studies Method 3: Trade data price analysis: export of mixed new and used electrical and electronic equipment (medium quality)
3.1 Data sources and data collection A query was made in Eurostat (the statistical office of the European Union) database on trade statistics. Data in Eurostat is reported in the Combined Nomenclature (CN), the EU's eight-digit coding system, comprising the Harmonized System (HS) codes with further EU subdivisions. The Eurostat international trade website can be accessed here. Step 1 is the selection of data for different dimensions.
1. “Reporter” (the exporting country): “NL- Netherlands” 2. “Flow” (import or export): “export” 3. “Partner”: here all partners were selected except for the codes for the European
Union (EU28) and the no data codes (ZZ-NO Data). 4. “Period”: yearly data was selected (code 52) for 2010 – 2018. 5. “Product”: United Nations University conversed the 54 UNU Keys to CN Codes. The
783 linked CN codes were selected in the query. All the CN codes linked to the UNU Keys can be found in the supplementary information excel file.
6. “Indicators”: “value in euros”, “quantity in 100KG”, “supplementary quantity” Step 2 is the lay out selection.
1. “Slice”: Codes and Labels

7
2. “Rows”: dimension 1: products (format Labels), Dimension 2 : Period (format labels), dimension 3 : flow (format codes and labels), simension 4 : partners (format codes), Dimension 5 : Reporter (format codes).
3. Columns : Dimension 1 : Indicators. Step 3 is the output selection. Output was generated in excel, empty rows, columns and tables were removed and the query was saved. In future, the same data can be downloaded from the database from Statistics Netherlands. This data is usually published a few months earlier.
3.2 Method Data conversion In addition, “supplementary quantities” and “Quantity in 100 KG” of lower than 2 were removed as this is likely to contain errors. The UNU Keys (linked to the CN codes), European Union Collection categories and the UN regions were added to the file. An overview of the UN Regions and CN code descriptions can be found in the excel supplementary information. Seventeen small countries did not have a conversion code to the UN regions, these were added manually. The files were divided per year from 2010 to 2018. Price analysis In Eurostat, the trade data on electrical and electronic equipment (EEE) can include new and used products. The first step was to calculate the average price per piece (per product). The data was also reviewed for outliers, such as prices of more than €100.000,00 and less then €0,10 (of which the product descriptions were reviewed). It can also be considered to calculate the average weight per piece as an additional validation step. Although, this step is not per se necessary for the analysis, costs additional time, but could increase the quality of the outcomes. The second step was to analyze the prices. Then the median price of the average price per UNU-KEY was calculated for each year. The median was used instead of the mean, because outliers and skewed data have a smaller effect on the median than on the mean. The consistency between the years was also cross checked, and corrected where needed. Please note that the median price was not calculated per CN code, it would cost a lot of resources to create consistent time series all 784 CN for the 2010-2018 time series. UNU Key 0301 and 0405 were excluded because of the wide range of (small) products. The lamps (UNU-KEY 0501 to 0507) are also excluded from the analysis. A review was made of the median per UNU Key for the years 2010 – 2018, and the underlying data of the outliers were reviewed and adjusted. Secondly, all products with a price of 30% of the median price were selected. For example, kitchen equipment (such as furnaces and ovens) had a median export price of €230,00 in 2018. All products with 30% of this price, a price of €69,00 or less, were assumed to be used-EEE exports.
3 Circulaire Dataservers, FFACT, juni 2018. https://www.nldigital.nl/wp-content/uploads/2018/07/Circulaire-
Dataservers-Rapport-2018.pdf

8
Only for category 6 (Small IT) of the WEEE Directive 10% per UNU key was selected because we expected that the price variation was larger, and therefore, for precautionary principle, a lower percentage was used. 10% to 30% of the median of the price per UNU Key is a relatively low price for used equipment. There could be more second-hand products in reality. However, at this level of detail, reporting errors in the records of the trade statistics are also likely to be present. This lower share was chosen so that there is more certainty that the data are actually used-EEE exports. Finally, the total weight of the products with a price lower than 30% of the UNU Key were summed up for the following regions Africa, Asia (including the Middle East), Eastern Europe, Central and South America and Polynesia/ Melanesia, as literature shows there is higher export of used products to these regions. Per analysed data point (year, trade from Netherlands to another country, UNU-KEY) the exports are probably a mix of new and used equipment. By using a conservative method (30% or 10% of the median price) was used as a threshold. The method leads to both under coverage, and over coverage of the data. Since the price new units weight in larger in the price, the effect of under coverage is more likely with the ratio of 30% of the new price. See both examples: Unfortunately, it is currently not known, and depends per appliance and country what the ratio of new vs second hand EEE imports is. Therefore, the chosen threshold remains an expert guess. Example 1 – under coverage: Reality: New price = 100 EUR, threshold = 30 Euro 20 laptops – new 100 Euro / unit = 2’000 EUR 130 laptops – used 20 Euro / unit = 2’600 EUR What is recorded is the average of both shipments: Price = 3000/70= 31 EURO / unit This would not be counted as used-EEE, whereas the majority is used-EEE, leading to an under coverage of 130 units. Example 2 – over coverage: Reality: New price = 100 EUR, threshold = 30 Euro 20 laptops – new 100 Euro / unit = 2’000 EUR 200 laptops – used 20 Euro / unit = 4’000 EUR What is recorded is the average of both shipments: Price = 6000/220= 27 EURO / unit This would be counted as used-EEE, and 20 laptops are ‘over- covered’, which is 10% of the total.
9
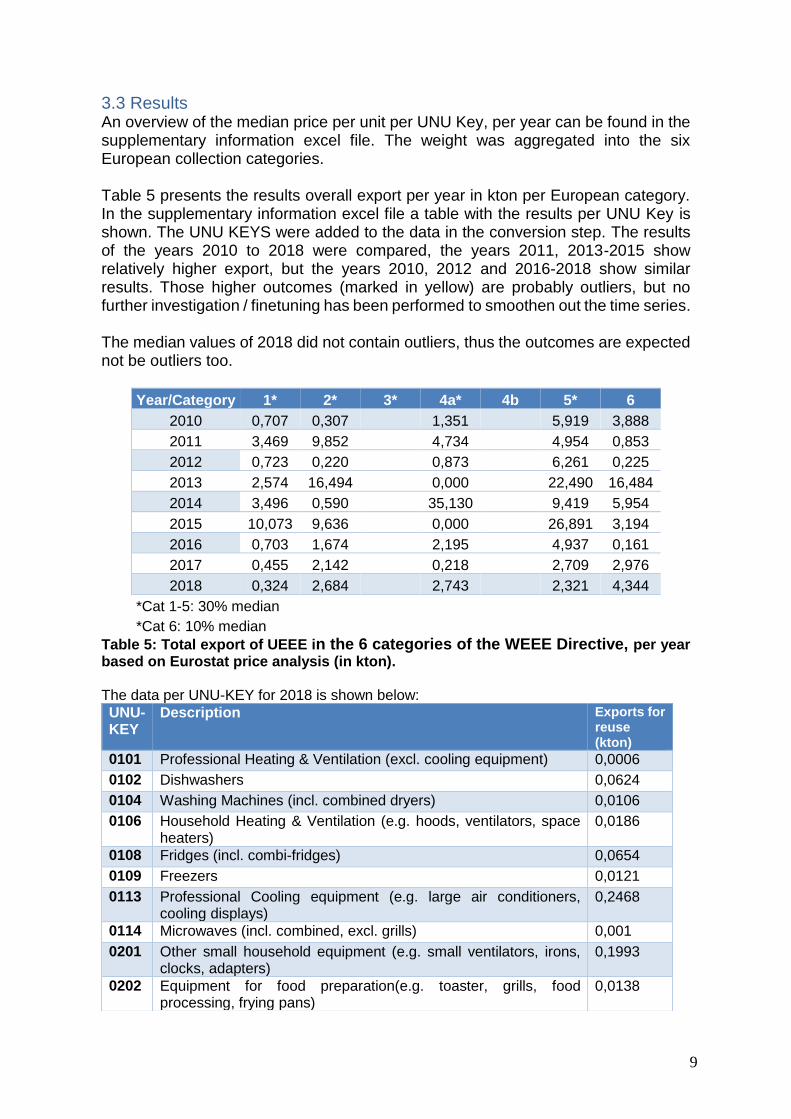
3.3 Results An overview of the median price per unit per UNU Key, per year can be found in the supplementary information excel file. The weight was aggregated into the six European collection categories. Table 5 presents the results overall export per year in kton per European category. In the supplementary information excel file a table with the results per UNU Key is shown. The UNU KEYS were added to the data in the conversion step. The results of the years 2010 to 2018 were compared, the years 2011, 2013-2015 show relatively higher export, but the years 2010, 2012 and 2016-2018 show similar results. Those higher outcomes (marked in yellow) are probably outliers, but no further investigation / finetuning has been performed to smoothen out the time series. The median values of 2018 did not contain outliers, thus the outcomes are expected not be outliers too.
Year/Category 1* 2* 3* 4a* 4b 5* 6
2010 0,707 0,307 1,351 5,919 3,888
2011 3,469 9,852 4,734 4,954 0,853
2012 0,723 0,220 0,873 6,261 0,225
2013 2,574 16,494 0,000 22,490 16,484
2014 3,496 0,590 35,130 9,419 5,954
2015 10,073 9,636 0,000 26,891 3,194
2016 0,703 1,674 2,195 4,937 0,161
2017 0,455 2,142 0,218 2,709 2,976
2018 0,324 2,684 2,743 2,321 4,344
*Cat 1-5: 30% median
*Cat 6: 10% median Table 5: Total export of UEEE in the 6 categories of the WEEE Directive, per year based on Eurostat price analysis (in kton). The data per UNU-KEY for 2018 is shown below:
UNU-KEY
Description Exports for reuse (kton)
0101 Professional Heating & Ventilation (excl. cooling equipment) 0,0006
0102 Dishwashers 0,0624
0104 Washing Machines (incl. combined dryers) 0,0106
0106 Household Heating & Ventilation (e.g. hoods, ventilators, space heaters)
0,0186
0108 Fridges (incl. combi-fridges) 0,0654
0109 Freezers 0,0121
0113 Professional Cooling equipment (e.g. large air conditioners, cooling displays)
0,2468
0114 Microwaves (incl. combined, excl. grills) 0,001
0201 Other small household equipment (e.g. small ventilators, irons, clocks, adapters)
0,1993
0202 Equipment for food preparation(e.g. toaster, grills, food processing, frying pans)
0,0138

10
0203 Small household equipment for hot water preparation (e.g. coffee, tea, water cookers)
0,9526
0204 Vacuum Cleaners (excl. professional) 0,145
0205 Personal Care equipment(e.g. tooth brushes, hair dryers, razors) 0,0026
0302 Desktop PCs (excl. monitors, accessoires) 2,2984
0303 Laptops (incl. tablets) 0,0309
0304 Printers (e.g. scanners, multi functionals, faxes) 0,0518
0305 Telecommunication equipment (e.g. (cordless) phones, answering machines)
1,5888
0306 Mobile Phones (incl. smartphones, pagers) 0,4046
0307 Professional IT equipment (e.g. servers, routers, data storage, copiers)
2,6275
0308 Cathode Ray Tube Monitors 0,0076
0309 Flat Display Panel Monitors (LCD, LED) 2,5961
0402 Portable Audio & Video (e.g. MP3, e-readers, car navigation) 0,0115
0403 Music Instruments, Radio, Hi-Fi (incl. audio sets) 0,4324
0404 Video (e.g. Video recorders, DVD, Blue Ray, set-top boxes) and projectors
0,2505
0406 Cameras (e.g. camcorders, photo & digital still cameras) 0,1082
0407 Cathode Ray Tube TVs 0,0176
0408 Flat Display Panel TVs (LCD, LED, Plasma) 0,0314
0601 Household Tools (e.g. drills, saws, high pressure cleaners, lawn mowers)
0,0003
0703 Leisure equipment (e.g. sports equipment, electric bikes, juke boxes)
0,0121
0901 Household Monitoring & Control equipment (alarm, heat, smoke, excl. screens)
0,2039
0902 Professional Monitoring & Control equipment (e.g. laboratory, control panels)
0,0086
1001 Non- cooled Dispensers (e.g. for vending, hot drinks, tickets, money)
0,0024
Total 12,4154
Table 6: Trade data price analysis per UNU-KEY for 2018
Method 4: Trade data: used electrical and electronic equipment exported in vehicles (medium quality)
4.1 Data sources and data collection The fourth method is based on the study “Person in the Port” project.4 The actual “person in the port” inspected in Nigeria in 2015 and in 2016 the content of containers, vehicles and import documents of used electronics. From these inspections it was found that 49% of the cars contained used electronics, with an average used content of 220 kg, 56% of the buses contained used electrical and electronic equipment, with a used-EEE content of 500 kg and 68% of the trucks contained used electrical and electronic equipment, with an average content of 1560 kg. See table 7 below.
4 Person in the Port Project, 2017. https://collections.unu.edu/eserv/UNU:6349/PiP_Report.pdf

11
Vehicle Types
Vehicles with UEEE
Average UEEE content per vehicle (kg)
Cars 49% 220
Buses 56% 500
Trucks 68% 1560
Table 7: Percentages of vehicles and weight of UEEE from UNU’s Person in Port report. Data was downloaded from Eurostat using the same approach as in method 3. from the Netherlands to different dimensions.
1. “Reporter” (the exporting country): “NL- Netherlands” 2. “Flow” (import or export): “export” 3. “Partner”: Nigeria and its neighboring countries: Benin, Cameroon, Ghana and Togo. 4. “Period”: yearly data was selected (code 52) for 2010 and 2015-2018. 5. “Product”: In EUROSTAT there are specific CN codes on used vehicles (cars, trucks
and busses). See Table 8. 6. “Indicators”: “value in euros”, “quantity in 100KG”, “supplementary quantity”
The “lay-out” and “output” selection in Eurostat were the same as in method 3.
Cars Trucks Bus
Motor cars and other motor vehicles principally designed for the transport of persons
(other than those of heading 8702), including station
wagons and racing cars
Motor vehicles for the transport of goods
Motor vehicles for the transport of ten or more persons, including the
driver
Used 87032190 87032290 87032390 87032490 87033190 87033290 87033390 87034090 87036090 87038090
Used 87042139 87042199 87042299 87042399 87043139 87043199 87043299
Used 87021019 87021099 87029019 87029039
Table 8: CN codes of used vehicles
4.2 Method The percentages of vehicles with UEEE (49% cars, 56% buses and 68% trucks) were applied to the total number of pieces exported. The number of vehicles with UEEE were multiplied with the average UEEE content per vehicle. The Person in the Port Project also listed the categories of products. The categories listed in the report were linked to the relevant UNU-KEYS and 6 categories in the WEEE Directive. An overview of these conversion tables can be found in the supplementary information excel file.

12
4.3 Results Table 9 presents the total export of UEEE in vehicles per year. Year Total UEEE
kton EU 1 (17%)
EU 2 (35%)
EU 3 EU 4a (19%)
EU 4b
EU 5 (16.7%)
EU 6 (12.3%)
2010 11,0 1,9 3,9
2,1
1,8 1,4
2011 12,6 2,1 4,4
2,4
2,1 1,6
2012 12,5 2,1 4,4
2,4
2,1 1,5
2013 15,4 2,6 5,4
2,9
2,6 1,9
2014 8,0 1,4 2,8
1,5
1,3 1,0
2015 7,1 1,2 2,5
1,3
1,2 0,9
2016 4,9 0,8 1,7
0,9
0,8 0,6
2017 4,4 0,7 1,5
0,8
0,7 0,5
2018 4,7 0,8 1,7
0,9
0,8 0,6
Table 9: Total export of UEEE in vehicles in the 6 categories of the WEEE Directive, per year based on EUROSTAT Analysis (in kton) The data per UNU-KEY is shown below: UNU-KEY
Description kton
0104 Washing Machines (incl. combined dryers) 0,282
0108 Fridges (incl. combi-fridges) 0,517
0111 Air Conditioners (household installed and portable) 0,282
0114 Microwaves (incl. combined, excl. grills) 0,188
0203 Small household equipment for hot water preparation (e.g. coffee, tea, water cookers)
0,0188
0302 Desktop PCs (excl. monitors, accessories) 0,329
0303 Laptops (incl. tablets) 0,141
0304 Printers (e.g. scanners, multi functionals, faxes) 0,235
0306 Mobile Phones (incl. smartphones, pagers) 0,0141
0307 Professional IT equipment (e.g. servers, routers, data storage, copiers)
0,611
0309 Flat Display Panel Monitors (LCD, LED) 0,846
0403 Music Instruments, Radio, Hi-Fi (incl. audio sets) 0,0752
0404 Video (e.g. Video recorders, DVD, Blue Ray, set-top boxes) and projectors
0,188
0405 Speakers 0,2867
0407 Cathode Ray Tube TVs 0,658
Total 4,6718
Table 10: Total export of UEEE in vehicles per UNU-KEY Method 5: Expert guess of the reusability per UNU-KEY (low quality):
5.1 Data Several data sources are needed to perform this method:

13
WEEE Generated per UNU-KEY.
WEEE Collected in NWR (per UNU-KEY)
WEEE in Waste Bin (per UNU-KEY) Based on an expert judgement it was decided which UNU Keys are likely to be exported for re-use.
5.2 Methods As a first step, the UNU-KEYs were grouped into three likelihoods considering export for reuse: small likelihood, medium likelihood, high likelihood. All UNU-KEYs with a small likelihood were excluded from the further analysis. Then, three estimations were made for all medium and high likelihood exports. In this step, a low, mid or high fraction is chosen, as shown below. These percentages applied to the gap of WEEE (GAP = WEEE Generated – WEEE collected – WEEE in the waste bin).
UNU-KEY
Description Perc. (low)
Perc. Mid
Perc. (high)
0108 Fridges (incl. combi-fridges) 10% 15% 20%
0109 Freezers 10% 15% 20%
0113 Professional Cooling equipment (e.g. large air conditioners, cooling displays)
20% 30% 40%
0114 Microwaves (incl. combined, excl. grills) 10% 15% 20%
0202 Equipment for food preparation(e.g. toaster, grills, food processing, frying pans)
10% 15% 20%
0204 Vacuum Cleaners (excl. professional) 10% 15% 20%
0205 Personal Care equipment(e.g. tooth brushes, hair dryers, razors)
10% 15% 20%
0301 Small IT equipment (e.g. routers, mice, keyboards, external drives & accessories)
20% 30% 40%
0302 Desktop PCs (excl. monitors, accessoires) 20% 30% 40%
0303 Laptops (incl. tablets) 20% 30% 40%
0304 Printers (e.g. scanners, multi functionals, faxes) 20% 30% 40%
0307 Professional IT equipment (e.g. servers, routers, data storage, copiers)
20% 30% 40%
0308 Cathode Ray Tube Monitors 20% 30% 40%
0309 Flat Display Panel Monitors (LCD, LED) 20% 30% 40%
0407 Cathode Ray Tube TVs 20% 30% 40%
0602 Professional Tools (e.g. for welding, soldering, milling)
10% 15% 20%
0802 Professional Medical equipment (e.g. hospital, dentist, diagnostics)
10% 15% 20%
0902 Professional Monitoring & Control equipment (e.g. laboratory, control panels)
20% 30% 40%
1001 Non- cooled Dispensers (e.g. for vending, hot drinks, tickets, money)
20% 30% 40%
1002 Cooled Dispensers (e.g. for vending, cold drinks)
20% 30% 40%

14
Table 11: The model parameters for the UNU-KEYS to be exported for reuse.
5.3 Results The gap per UNU-KEY was positive for all selected UNU-KEYs, as described in section 5.2, except for UNU-KEY 1001 (non-cooled dispensers). Therefore, UNU-KEY 1001 it is omitted from the results. The percentage was subjected to the gap and yielded in the following numbers.
UNU-KEY
Name Export for reuse (kt) - Low
Export for reuse (kt) - Mid
Export for reuse (kt) - High
0108 Fridges (incl. combi-fridges) 1,4 2,2 2,9
0109 Freezers 1,1 1,6 2,2
0113 Professional Cooling equipment (e.g. large air conditioners, cooling displays)
1,1 1,6 2,2
0114 Microwaves (incl. combined, excl. grills)
0,7 1,1 1,5
0202 Equipment for food preparation(e.g. toaster, grills, food processing, frying pans)
0,3 0,5 0,7
0204 Vacuum Cleaners (excl. professional) 0,2 0,3 0,3
0205 Personal Care equipment(e.g. tooth brushes, hair dryers, razors)
0,2 0,3 0,5
0301 Small IT equipment (e.g. routers, mice, keyboards, external drives & accessories)
0,4 0,5 0,7
0302 Desktop PCs (excl. monitors, accessoires)
1,1 1,6 2,2
0303 Laptops (incl. tablets) 0,5 0,8 1,1
0307 Professional IT equipment (e.g. servers, routers, data storage, copiers)
2,2 3,2 4,3
0308 Cathode Ray Tube Monitors 0,9 1,4 1,8
0309 Flat Display Panel Monitors (LCD, LED)
0,9 1,3 1,8
0407 Cathode Ray Tube TVs 0,6 0,8 1,1
0602 Professional Tools (e.g. for welding, soldering, milling)
0,1 0,1 0,1
0802 Professional Medical equipment (e.g. hospital, dentist, diagnostics)
0,3 0,4 0,6
0902 Professional Monitoring & Control equipment (e.g. laboratory, control panels)
0,7 1,0 1,3
1002 Cooled Dispensers (e.g. for vending, cold drinks)
0,5 0,7 0,9
13,0 19,6 26,1
Table 12: Results Expert guess of the reusability per UNU-KEY

15
Method 6: Luca Test Centre (high quality)
6.1 Data sources and data collection The LUCA test Centre is a testing facility set up in the port of Amsterdam where small exporters of used-EEE can test the devices, and export them to Africa.
6.2 Methods The units of EEE that are tested are counted in the test center for 2018. The data was provided in “tested and approved material”, and “tested and disqualified material”. For this analysis, the data from “tested and approved material” was used. The data from the LUCA test center was aggregated in four categories, and recorded in units. It was unclear whether the breakdown into those four categories was recorded like this, or already disaggregated by the data provider based on an estimate:
Cooling & Freezing
CRT TV / screens
LCD TV / screens
Small Household Appliances The data was converted by using the average weights from the United Nations University (see table 13). The breakdown into the UNU-KEYs has been made by an expert who has visited the site several times.
Category UNU-KEY
Description Average Weight (kg/unit)
Percentage within Category
Cooling & Freezing
0108 Fridges (incl. combi-fridges)
44 80%
0109 Freezers 40 15%
0111 Air Conditioners (household installed and portable)
27 5%
CRT TV / screens
0308 Cathode Ray Tube Monitors
19 40%
0407 Cathode Ray Tube TVs 30 60%
LCD TV / screens
0309 Flat Display Panel Monitors (LCD, LED)
5,5 40%
0408 Flat Display Panel TVs (LCD, LED, Plasma)
10 60%
Small Household Appliances
0202 Equipment for food preparation(e.g. toaster, grills, food processing, frying pans)
3,27 50%
0204 Vacuum Cleaners (excl. professional)
5,8 50%
Table 13: Conversion of the Luca Test Centre data to UNU-KEYS

16
6.3 Results A total of 55.182 units have been tested at LUCA, of which 53.736 were tested and approved.
Category Units
Tested and approved 53.736
Tested and disqualified
1.446
Total tested 55.182
Table 14: Total units approved and disqualified at the Luca Test Centre With the following breakdown:
Category Breakdown Amount in pieces
Cooling & Freezing 65% 34.928
CRT TV / screens 20% 10.747
LCD TV / screens 10% 5.374
Small Household Appliances 5% 2.687
100% 53.736
Table 15: Breakdown of the total units tested at the Luca Test Centre This was converted into the following breakdown per UNU-KEY.
UNU-KEY
kg kton Average Weight
Percentage in CAT
0108 1.229.480 1,23 44 80%
0109 209.570 0,21 40 15%
0111 47.153 0,05 27 5%
0308 81.679 0,08 19 40%
0407 193.450 0,19 30 60%
0309 11.822 0,01 5,5 40%
0408 32.242 0,03 10 60%
0202 4.393 0,00 3,27 50%
0204 7.792 0,01 5,8 50%
Total 1.817.580 1,82
Table 16: Conversion of the Luca Test Centre data to UNU-KEYS based on average weight
7. Method: Integration of data
7.1 Method The outcomes are ranked by data quality, in which the LUCA (method 6) and data from the National WEEE Register (method 1) were ranked as “high quality”. This is data that is updatable for future years and based on real detailed registrations. The data provided from the desktop research (method 2), mostly the ‘server’ research from ICT Milieu has been ranked also as high quality. This is data based on real registrations, however, not easily updatable. Although, it is expected that there will

17
be continuously servers exported for reuse, and it might also be covered more in the NWR after 2018. The data based on a model on trade data, (method 3 and 4) were ranked as “medium quality”. This is also relatively easily updatable, but the model parameters have to be updated over time. The data based on the expert guess (method 5) were ranked as “low quality”. The outcomes were compared and the export for reuse was determined based on the best method per UNU-Key. The following rationale was used: - If it was suspected that two datasets had overlap, then the highest value was taken. If there was data available for a higher quality data source, then the part is allocated to the highest quality preferably. Thus, first high quality, then rest to medium quality, and the rest to highest low quality. - If there is only one data point available, then that value has been used. The matrix that was used for that is shown below: UNU-KEY
Description 1: NWR
2: Reports
3: Trade Data Price
4: Second hand vehicle exports
5: expert guess
6: Luca
Remark
0001 Central Heating (household installed)
No data
0002 Photovoltaic Panels (incl. inverters)
No data
0101 Professional Heating & Ventilation (excl. cooling equipment)
Yes
0102 Dishwashers Yes
0103 Kitchen equipment (e.g. large furnaces, ovens, cooking equipment)
No data
0104 Washing Machines (incl. combined dryers)
Yes Yes Highest taken (method 4)
0105 Dryers (wash dryers, centrifuges)
No data
0106 Household Heating & Ventilation (e.g. hoods, ventilators, space heaters)
Yes

18
0108 Fridges (incl. combi-fridges)
Yes Yes, subset of Method 5
0109 Freezers Yes Yes, subset of Method 5
0111 Air Conditioners (household installed and portable)
Yes Yes, subset of Method 4
0112 Other Cooling equipment (e.g. dehumidifiers, heat pump dryers)
No data
0113 Professional Cooling equipment (e.g. large air conditioners, cooling displays)
Yes Yes Highest is taken
0114 Microwaves (incl. combined, excl. grills)
Yes Yes Highest is taken
0201 Other small household equipment (e.g. small ventilators, irons, clocks, adapters)
No data
0202 Equipment for food preparation(e.g. toaster, grills, food processing, frying pans)
Yes Yes Yes, subset of total
Highest is taken of three and 5.
0203 Small household equipment for hot water preparation (e.g. coffee, tea, water cookers)
No data
0204 Vacuum Cleaners (excl. professional)
Yes Yes Yes, subset of total
Highest is taken of three and 5.
0205 Personal Care equipment(e.g. tooth brushes, hair dryers, razors)
Yes Yes Highest is taken of three and 5.
0301 Small IT equipment (e.g. routers, mice,
Yes, subset
Yes Yes Highest is taken of

19
keyboards, external drives & accessories)
of the total
method 2 and 5.
0302 Desktop PCs (excl. monitors, accessoires)
Yes, subset of the total
Yes Yes Highest is taken of method 2 and 5.
0303 Laptops (incl. tablets)
Yes, subset of the total
Yes Yes Highest is taken of method 2 and 5.
0304 Printers (e.g. scanners, multi functionals, faxes)
Yes Yes Highest taken (method 4)
0305 Telecommunication equipment (e.g. (cordless) phones, answering machines)
Yes
0306 Mobile Phones (incl. smartphones, pagers)
Yes Yes Highest taken (method 4)
0307 Professional IT equipment (e.g. servers, routers, data storage, copiers)
Yes, subset of the total
Yes 4.8 kt was from the desktop research, NWR records 1.7 kt.
0308 Cathode Ray Tube Monitors
Yes Yes Yes, subset of total
Highest is taken from 3 and 5.
0309 Flat Display Panel Monitors (LCD, LED)
Yes Yes Yes Yes, subset of method 3 and 4
Highest is taken from 3, 4 and 5.
0401 Small Consumer Electronics (e.g. headphones, remote controls)
No data
0402 Portable Audio & Video (e.g. MP3, e-readers, car navigation)
Yes
0403 Music Instruments, Radio, Hi-Fi (incl. audio sets)
Yes Yes Highest taken (method 4)
0404 Video (e.g. Video recorders, DVD, Blue Ray, set-top boxes) and projectors
Yes Yes Highest taken (method 4)

20
0405 Speakers Yes
0406 Cameras (e.g. camcorders, photo & digital still cameras)
Yes
0407 Cathode Ray Tube TVs
Yes Yes Yes, subset of method 3 and 4
Highest taken (method 4)
0408 Flat Display Panel TVs (LCD, LED, Plasma)
Yes Yes, subset of method 3
0501 Small lighting equipment (excl. LED & incandescent)
No data
0502 Compact Fluorescent Lamps (incl. retrofit & non-retrofit)
No data
0503 Straight Tube Fluorescent Lamps
No data
0504 Special Lamps (e.g. professional mercury, high & low pressure sodium)
No data
0505 LED Lamps (incl. retrofit LED lamps)
No data
0506 Household Luminaires (incl. household incandescent fittings & household LED luminaires)
No data
0507 Professional Luminaires (offices, public space, industry)
No data
0601 Household Tools (e.g. drills, saws, high pressure cleaners, lawn mowers)
Yes
0602 Professional Tools (e.g. for welding, soldering, milling)
Yes, subset of method 5
Yes

21
0701 Toys (e.g. car racing sets, electric trains, music toys, biking computers, drones)
No data
0702 Game Consoles No data
0703 Leisure equipment (e.g. sports equipment, electric bikes, juke boxes)
Yes
0801 Household Medical equipment(e.g. thermometers, blood pressure meters)
No data
0802 Professional Medical equipment (e.g. hospital, dentist, diagnostics)
Yes
0901 Household Monitoring & Control equipment (alarm, heat, smoke, excl. screens)
Yes
0902 Professional Monitoring & Control equipment (e.g. laboratory, control panels)
Yes Yes Highest of method 3 and method 5
1001 Non- cooled Dispensers (e.g. for vending, hot drinks, tickets, money)
Yes
1002 Cooled Dispensers (e.g. for vending, cold drinks)
Yes, subset of method 5
Yes
Table 17: Overview of data and ranking of data quality

22
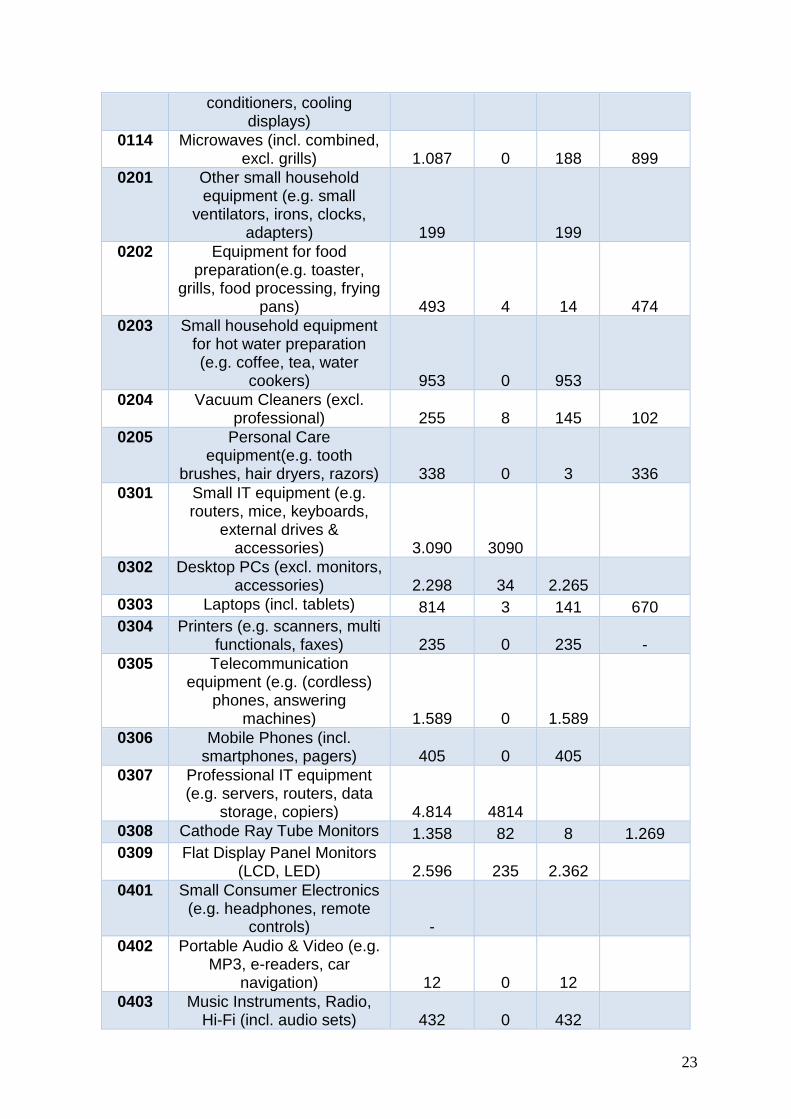
7.2 Results For 2018, the export data reported in the National WEEE register are on a voluntary basis and only amount to 3 kton. Of this weight, 2.8 is small IT and 0.1 kton large equipment. As described in the methodology, five other methods were used to calculate the export of reused electrical and electronic equipment from the Netherlands. The outcome of the second method (desktop research) of FFACT, AmEcBoard and RTA/ICTM is export of 8 kton to 25 kton of used EEE. The outcome of the third and fourth method (based on trade statistics) is export of 17 kton of used EEE. The outcome of the fifth method (the analysis of reusability of UNU Key product groups) is export of 31 kton used EEE. The results from the Luca test centre is export of 2.4 kton of used EEE.
The data point for exports for reuse (31 kt) was calculated by adding up the data sources of “high quality” with the ones from “medium quality”, and the mid end estimate of method 5 (expert guess). The detailed The breakdown of the total (31 kt) per UNU-KEY is shown below in tonnage.
Total (t) High Qual.
Med. Qual.
Low Qual.
0001 Central Heating (household installed) - -
0002 Photovoltaic Panels (incl. inverters) - -
0101 Professional Heating & Ventilation (excl. cooling
equipment) 1 0 1 0102 Dishwashers 62 0 62 0103 Kitchen equipment (e.g.
large furnaces, ovens, cooking equipment) - 0 -
0104 Washing Machines (incl. combined dryers) 282 0 282
0105 Dryers (wash dryers, centrifuges) - 0 -
0106 Household Heating & Ventilation (e.g. hoods,
ventilators, space heaters) 19 0 19 0108 Fridges (incl. combi-fridges) 2.150 1229 920
0109 Freezers 1.642 210 1.432
0111 Air Conditioners (household installed and portable) 282 47 235
0112 Other Cooling equipment (e.g. dehumidifiers, heat
pump dryers) 0113 Professional Cooling
equipment (e.g. large air 1.631 0 247 1.385
23
conditioners, cooling displays)
0114 Microwaves (incl. combined, excl. grills) 1.087 0 188 899
0201 Other small household equipment (e.g. small
ventilators, irons, clocks, adapters) 199 199
0202 Equipment for food preparation(e.g. toaster,
grills, food processing, frying pans) 493 4 14 474
0203 Small household equipment for hot water preparation (e.g. coffee, tea, water
cookers) 953 0 953 0204 Vacuum Cleaners (excl.
professional) 255 8 145 102
0205 Personal Care equipment(e.g. tooth
brushes, hair dryers, razors) 338 0 3 336
0301 Small IT equipment (e.g. routers, mice, keyboards,
external drives & accessories) 3.090 3090
0302 Desktop PCs (excl. monitors, accessories) 2.298 34 2.265
0303 Laptops (incl. tablets) 814 3 141 670
0304 Printers (e.g. scanners, multi functionals, faxes) 235 0 235 -
0305 Telecommunication equipment (e.g. (cordless)
phones, answering machines) 1.589 0 1.589
0306 Mobile Phones (incl. smartphones, pagers) 405 0 405
0307 Professional IT equipment (e.g. servers, routers, data
storage, copiers) 4.814 4814 0308 Cathode Ray Tube Monitors 1.358 82 8 1.269
0309 Flat Display Panel Monitors (LCD, LED) 2.596 235 2.362
0401 Small Consumer Electronics (e.g. headphones, remote
controls) - 0402 Portable Audio & Video (e.g.
MP3, e-readers, car navigation) 12 0 12
0403 Music Instruments, Radio, Hi-Fi (incl. audio sets) 432 0 432

24
0404 Video (e.g. Video recorders, DVD, Blue Ray, set-top boxes) and projectors 251 0 251
0405 Speakers 287 0 287 0406 Cameras (e.g. camcorders,
photo & digital still cameras) 108 0 108 0407 Cathode Ray Tube TVs 658 193 465 0408 Flat Display Panel TVs
(LCD, LED, Plasma) 32 32 0501 Small lighting equipment
(excl. LED & incandescent) - 0502 Compact Fluorescent Lamps
(incl. retrofit & non-retrofit) - 0503 Straight Tube Fluorescent
Lamps - 0504 Special Lamps (e.g.
professional mercury, high & low pressure sodium) -
0505 LED Lamps (incl. retrofit LED lamps) -
0506 Household Luminaires (incl. household incandescent fittings & household LED
luminaires) - 0507 Professional Luminaires
(offices, public space, industry) -
0601 Household Tools (e.g. drills, saws, high pressure
cleaners, lawn mowers) 0 0 0 0602 Professional Tools (e.g. for
welding, soldering, milling) 87 1 86
0701 Toys (e.g. car racing sets, electric trains, music toys, biking computers, drones) - 0
0702 Game Consoles - 0 0703 Leisure equipment (e.g.
sports equipment, electric bikes, juke boxes) 12 0 12
0801 Household Medical equipment (e.g.
thermometers, blood pressure meters) - 0
0802 Professional Medical equipment (e.g. hospital,
dentist, diagnostics) 425 0 - 425
0901 Household Monitoring & Control equipment (alarm,
heat, smoke, excl. screens) 204 0 204

25
0902 Professional Monitoring & Control equipment (e.g.
laboratory, control panels) 1.003 0 9 994
1001 Non- cooled Dispensers (e.g. for vending, hot drinks,
tickets, money) 111 111 - 1002 Cooled Dispensers (e.g. for
vending, cold drinks) 709 0 - 709
30.922 10.09
3 11.12
9 9.701
Table 18: Total breakdown in data quality per UNU-KEY
Category High Quality
Medium Quality
Low Quality
Total
TEE 1.486 482 4.446 6.413
Screens, ... 545 2.975 1.939 5.459
Lamps - - - -
Large Eq. (ex. PV) 4.926 384 1.506 6.816
PV - - - -
Small Eq. 12 2.795 1.811 4.618
Small IT 3.124 4.493 - 7.617
Total 10.093 11.129 9.701 30.922
Table 19: Results from the different methods ranked by quality in the 6 WEEE Directive categories in ton
The low end was calculated by adding up the data sources of “high quality” with the ones from “medium quality”, and the lower end estimate of method 5 (expert guess). This yielded in 27 kt.
The high end was calculated by adding up the data sources of “high quality” with the ones from “medium quality”, and the higher end estimate of method 5 (expert guess). This yielded in 35 kt. The bandwidths due to the low and high-end estimates were calculated for each of the six grouped categories. Then, the band width on the total was calculated by taking the root of the squares of all added-up bandwidths. This yielded 2,3 kton. In conclusion, the exports for reuse in the Netherlands was 31 ± 2,3 kton in 2018.
7.3 Timelines to produce data The timelines to produce the data differs per data source. This is shown in table 20. It appears that not all data sources will be available when the reporting of the NWR to the Ministry occurs (t+6 months).
Data source Replicability for yearly monitoring
Timeliness Remark

26
1. NWR Good t + 6 months Can be part of regular monitoring tasks of NWR
2. Studies Low One-time studies
3. Price trade data
Good t + 6 for CBS data. Then ± 1 month for calculations
4. Vehicle exports data
Medium t + 6 for CBS data. Then ± 1 week for calculations.
Conversion factors will soon be outdated.
5. Gap Exportability
Medium t + 9 Can only be implemented if the NWR, and other WEEE Flows are monitored per UNU-KEY is yearly updated. This is possible, but not yet the case.
6. LUCA Good t + 6 months should be doable
Table 20: Timelines to produce data 8. Recommendations for Monitoring Exports for Reuse The recommendations how to monitor export for reuse in the future in the Netherlands are shown below. 1) The exports for reuse in year t (for instance t = 2019) should be subtracted from the WEEE collection target in the same year (2019). It is recommended to be included to the NWR reporting to the Ministry. 2) It is recommended to have a mandatory registration and reporting obligation for all national and international enterprises that export for reuse in the UNU-KEYs (ANNEX 1) into the NWR. This data will be ready with the current time lines for reporting from the NWR to the Ministry (t+6 months). The current time lines for reporting by producers to the schemes is (t+3 months). 3) It is recommended to add the small exporters of EEE from the test site LUCA into the NWR, to coordinate and facilitate their registration & reporting obligation centrally. This data will have to be provided by LUCA to the NWR, on behalf of the many small exporters, and preferably in the UNU-KEYs. It is expected that this can be realized within (t+3 months). 4) Since the registration of exports for reuse is relatively new, and the population of companies / persons engaged in this is not known, a cross check, or additional substantiated estimate, on LUCA and NWR data is needed for the coming years. This cross check can be done with method 3 (price trade data) and method 4 (exports

27
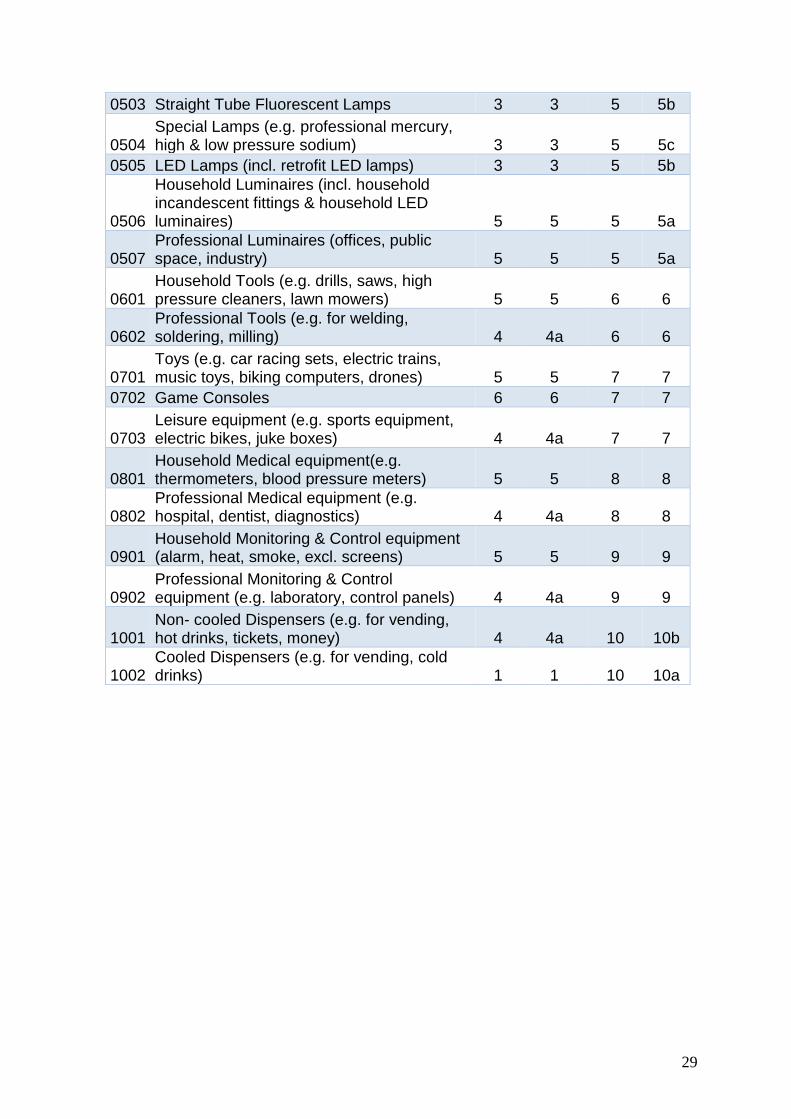
in vehicles) using existing statistical data for the specific UNU-KEYs. Where needed, the under-coverage of the data can be calculated using method 3 (price trade data) and method 4 (exports in vehicles), and function as a substantiated estimate. This data will be ready around t+7 or t+8. Therefore, it is too late to be included of the NWR reporting to the Ministry (t+6 months). It is our suggestion to include the latest available data in the t+6 months reporting to the ministry. Thus, the actualized LUCA and NWR data, and the data of trade statistics of the year before in the reporting to the Ministry at t+6 months. The final data have to be actualized prior to submission of the data to DG Environment / Eurostat (t+18). 5) It is also recommended that WEEE Generated and WEEE Waste Bin have to be yearly monitored too by the NWR. Then an essential final quality check can be performing a gap assessment per UNU-KEY (or reporting category of WEEE Register) with method 5. It can be done by using this formula: GAP = WEEE Generated - WEEE NWR - WEEE Waste Bin – Exports for Reuse (with the data from NWR, LUCA and Eurostat Trade Statistics). This can be done approximately at t+9. 6) The inclusion of exports for reuse for all recommended steps will add a new layer of complexity to the work of the NWR, and therefore delay the current reporting of the to the Ministry at t+6. Inclusion of Eurostat (recommendation 4) analysis can be done realized approximately t+8, and the final gap assessment (recommendation 5) at t+9. 7) When the recommendations are assigned to the NWR this will add new tasks to the NWR. 8) The parameters of the model for method 3 (price trade data) can be yearly adapted. The method 4 (exports in vehicles) should be adapted every 5 years, thus in 2021, to reflect the real behavior. This can be done by visual inspections, and generating new data of used-EEE in exported second hand cars to Western Africa. Maybe these types of statistics can be generated by already ongoing inspections from environmental inspection agencies. ANNEX 1: UNU-KEYs with conversion to the EU (WEEE Directive) categories and NWR categories.
UNU Full name EU-6 EU-6PV EU-10 NWR
0001 Central Heating (household installed) 4 4a 1 1c
0002 Photovoltaic Panels (incl. inverters) 4 4b 4 4d
0101 Professional Heating & Ventilation (excl. cooling equipment) 4 4a 1 1d
0102 Dishwashers 4 4a 1 1c
0103 Kitchen equipment (e.g. large furnaces, ovens, cooking equipment) 4 4a 1 1c
0104 Washing Machines (incl. combined dryers) 4 4a 1 1c
0105 Dryers (wash dryers, centrifuges) 4 4a 1 1c
0106 Household Heating & Ventilation (e.g. hoods, ventilators, space heaters) 4 4a 1 1c

28
0108 Fridges (incl. combi-fridges) 1 1 1 1a
0109 Freezers 1 1 1 1a
0111 Air Conditioners (household installed and portable) 1 1 1 1a
0112 Other Cooling equipment (e.g. dehumidifiers, heat pump dryers) 1 1 1 1a
0113 Professional Cooling equipment (e.g. large air conditioners, cooling displays) 1 1 1 1b
0114 Microwaves (incl. combined, excl. grills) 5 5 1 1c
0201 Other small household equipment (e.g. small ventilators, irons, clocks, adapters) 5 5 2 2
0202 Equipment for food preparation(e.g. toaster, grills, food processing, frying pans) 5 5 2 2
0203 Small household equipment for hot water preparation (e.g. coffee, tea, water cookers) 5 5 2 2
0204 Vacuum Cleaners (excl. professional) 5 5 2 2
0205 Personal Care equipment(e.g. tooth brushes, hair dryers, razors) 5 5 2 2
0301 Small IT equipment (e.g. routers, mice, keyboards, external drives & accessories) 6 6 3 3c
0302 Desktop PCs (excl. monitors, accessoires) 6 6 3 3c
0303 Laptops (incl. tablets) 2 2 3 3b
0304 Printers (e.g. scanners, multi functionals, faxes) 6 6 3 3c
0305 Telecommunication equipment (e.g. (cordless) phones, answering machines) 6 6 3 3c
0306 Mobile Phones (incl. smartphones, pagers) 6 6 3 3c
0307 Professional IT equipment (e.g. servers, routers, data storage, copiers) 4 4a 3 3d
0308 Cathode Ray Tube Monitors 2 2 3 3a
0309 Flat Display Panel Monitors (LCD, LED) 2 2 3 3b
0401 Small Consumer Electronics (e.g. headphones, remote controls) 5 5 4 4c
0402 Portable Audio & Video (e.g. MP3, e-readers, car navigation) 5 5 4 4c
0403 Music Instruments, Radio, Hi-Fi (incl. audio sets) 5 5 4 4c
0404 Video (e.g. Video recorders, DVD, Blue Ray, set-top boxes) and projectors 5 5 4 4c
0405 Speakers 5 5 4 4c
0406 Cameras (e.g. camcorders, photo & digital still cameras) 5 5 4 4c
0407 Cathode Ray Tube TVs 2 2 4 4a
0408 Flat Display Panel TVs (LCD, LED, Plasma) 2 2 4 4b
0501 Small lighting equipment (excl. LED & incandescent) 3 3 5 5b
0502 Compact Fluorescent Lamps (incl. retrofit & non-retrofit) 3 3 5 5b
29
0503 Straight Tube Fluorescent Lamps 3 3 5 5b
0504 Special Lamps (e.g. professional mercury, high & low pressure sodium) 3 3 5 5c
0505 LED Lamps (incl. retrofit LED lamps) 3 3 5 5b
0506
Household Luminaires (incl. household incandescent fittings & household LED luminaires) 5 5 5 5a
0507 Professional Luminaires (offices, public space, industry) 5 5 5 5a
0601 Household Tools (e.g. drills, saws, high pressure cleaners, lawn mowers) 5 5 6 6
0602 Professional Tools (e.g. for welding, soldering, milling) 4 4a 6 6
0701 Toys (e.g. car racing sets, electric trains, music toys, biking computers, drones) 5 5 7 7
0702 Game Consoles 6 6 7 7
0703 Leisure equipment (e.g. sports equipment, electric bikes, juke boxes) 4 4a 7 7
0801 Household Medical equipment(e.g. thermometers, blood pressure meters) 5 5 8 8
0802 Professional Medical equipment (e.g. hospital, dentist, diagnostics) 4 4a 8 8
0901 Household Monitoring & Control equipment (alarm, heat, smoke, excl. screens) 5 5 9 9
0902 Professional Monitoring & Control equipment (e.g. laboratory, control panels) 4 4a 9 9
1001 Non- cooled Dispensers (e.g. for vending, hot drinks, tickets, money) 4 4a 10 10b
1002 Cooled Dispensers (e.g. for vending, cold drinks) 1 1 10 10a