monitoring habitat change - harte research institute · •structured vocabulary for data and ......
TRANSCRIPT

James C. Gibeaut, Ph.D.Coastal and Marine Geospatial SciencesHarte Research Institute for Gulf of Mexico Studies
Ocean and Coastal Observing WorkshopHavana, Cuba, July 8, 2017 1
Monitoring Habitat Change


Impact of Variability on Sampling
8From: FGDC-STD-018-2012

• Structured vocabulary for data and information exchange
• Facilitates habitat characterization and change analysis across projects, researchers, and nations
9
Habitat Classification Standards

• Developed by representatives from U.S. federal and state governments, academia, and NGOs
• Became U.S. federal standard in 2012
• Designed to be interdisciplinary, span spatial and temporal scales, flexible, and expandable
10
CMECSCoastal and Marine Ecological Classification Standard

CMECS Framework
11From: FGDC-STD-018-2012

Example from Key West
12From: FGDC-STD-018-2012

Classification
Biogeographic Setting:
Realm: Tropical Atlantic
Province: Tropical Northwestern Atlantic
Ecoregion: Floridian
Aquatic Setting:
System: Marine
Subsystem: Marine Nearshore
Tidal Zone: Marine Nearshore Subtidal
13

14
Water Column Component: Water Column Layer: Marine Nearshore Lower Water Column Salinity Regime: Euhaline Water Temperature Regime: Warm Water Geoform Component: Tectonic Setting: Passive Continental Margin Physiographic Setting: Barrier Reef Geoform Origin: Biogenic Level 1 Geoform: Shallow/Mesophotic Coral Reef Level 1 Geoform Type: Patch Coral Reef Level 2 Geoform: Lagoon Level 2 Geoform Type: Aggregate Patch Coral Reef
Classification…

15
Substrate Component:Substrate Origin: Biogenic Substrate Substrate Class: Coral Substrate Substrate Subclass: Coral Reef Substrate Modifier: Layering: Sand Veneer Biotic Component: Biotic Setting: Benthic Biota Biotic Class: Reef Biota Biotic Subclass: Shallow/Mesophotic Coral Reef Biota Biotic Group: Massive Coral Reef Biotic Community: Massive Montastraea Reef
Classification…

Example from Key West
16From: FGDC-STD-018-2012
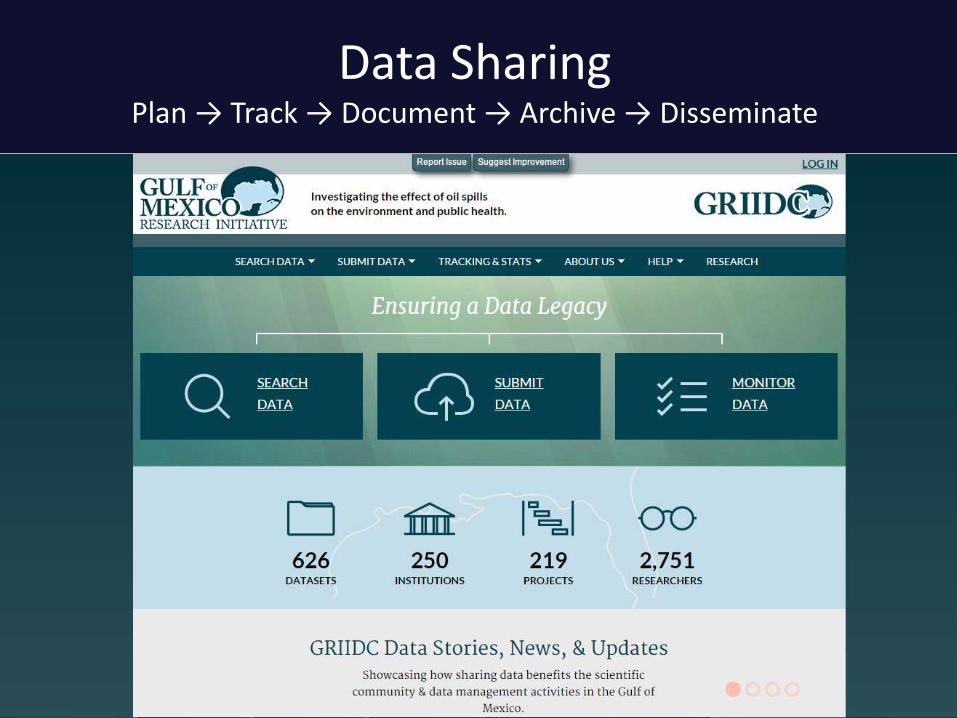
Data SharingPlan → Track → Document → Archive → Disseminate

GRIIDC Is a GoMRI Legacy
• Committed to serving GoMRI data until at least 2030
• Expanding services beyond GoMRI-funded research
• Integration with other repositories (e.g., NCEI, DataOne)
• Harte Research Insititute committed to expanding a data sharing culture through GRIIDC
Two Prospects for Gulf-wide Expansion
• Coastal Change Analysis Program (C-CAP)– NOAA program since 1990s– Landsat (30 m)– Standardized classification– 5-year intervals
• Shoreline type mapping (Environmental Sensitivity Index (ESI) used for oil spill planning
• Shoreline change analysis programs
19

C-CAP Wetland Change 1996 - 2010
20From: Gulf of Mexico Regional Land Cover Change Report 1996- 2010, NOAA

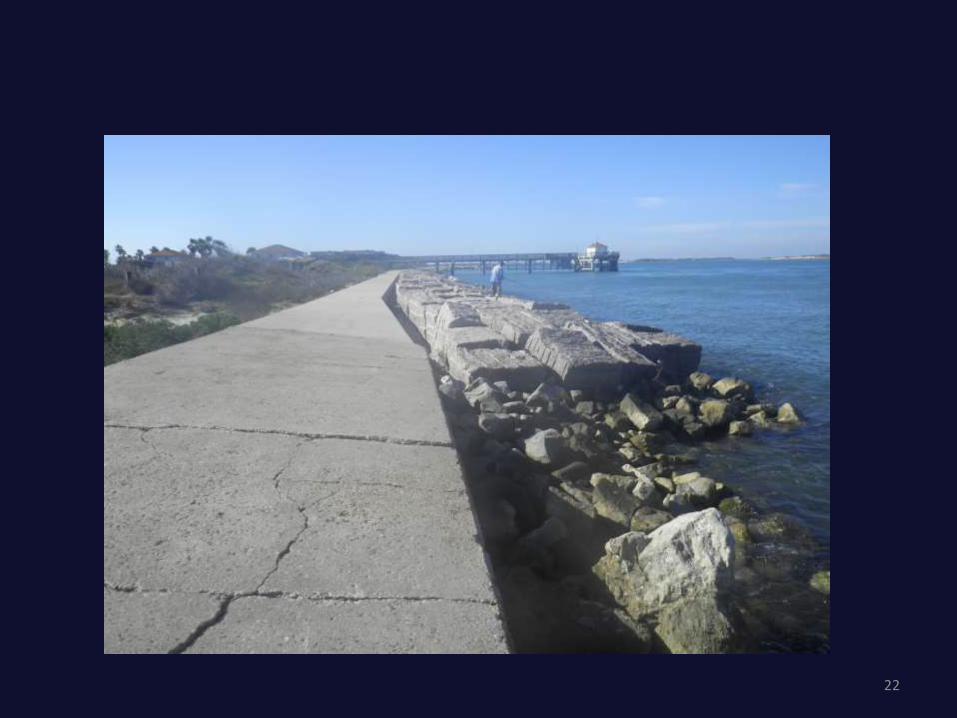
ESI for Shoreline Types1 Exposed walls and other structures made of concrete, wood, or metal
2A Scarps and steep slopes in clay
2B Wave-cut clay platforms
3A Fine-grained sand beaches
3B Scarps and steep slopes in sand
4* Coarse-grained sand beaches
5 Mixed sand and gravel (shell) beaches
6A Gravel (shell) beaches
6B Exposed riprap structures
7 Exposed tidal flats
8A Sheltered solid man-made structures, such as bulkheads and docks
8B Sheltered riprap structures
8C Sheltered scarps
9 Sheltered tidal flats
10A Salt- and brackish-water marshes
10B Fresh-water marshes (herbaceous vegetation)
10C Fresh-water swamps (woody vegetation)
1OD Mangroves21
22

23

24

• Common mapping scheme• Effective data sharing• Bridge existing programs across the Gulf

26
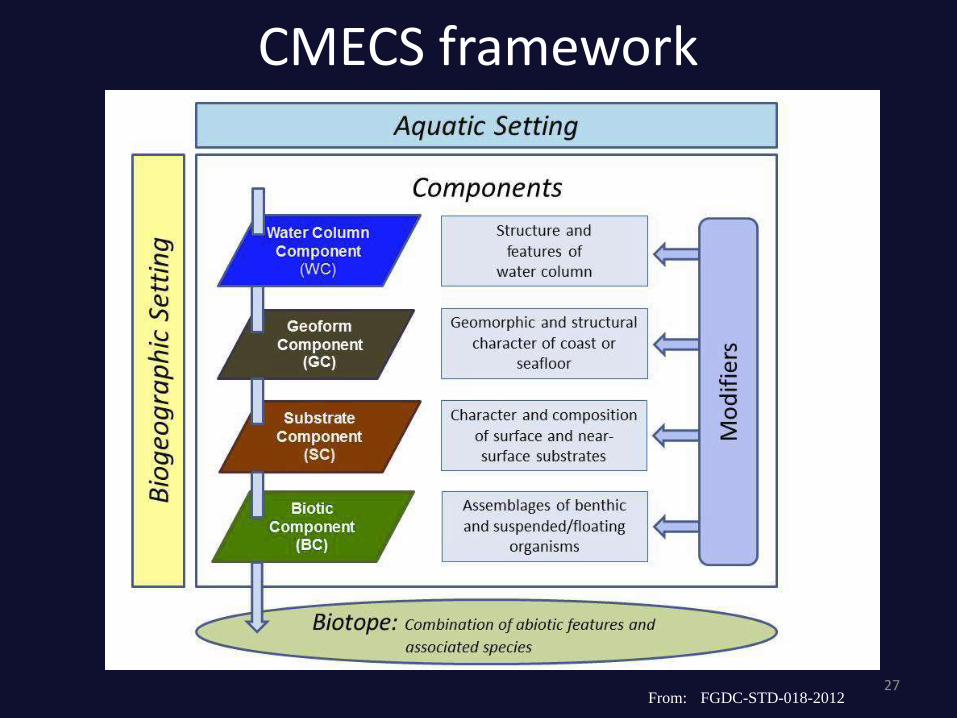
CMECS framework
27From: FGDC-STD-018-2012

28

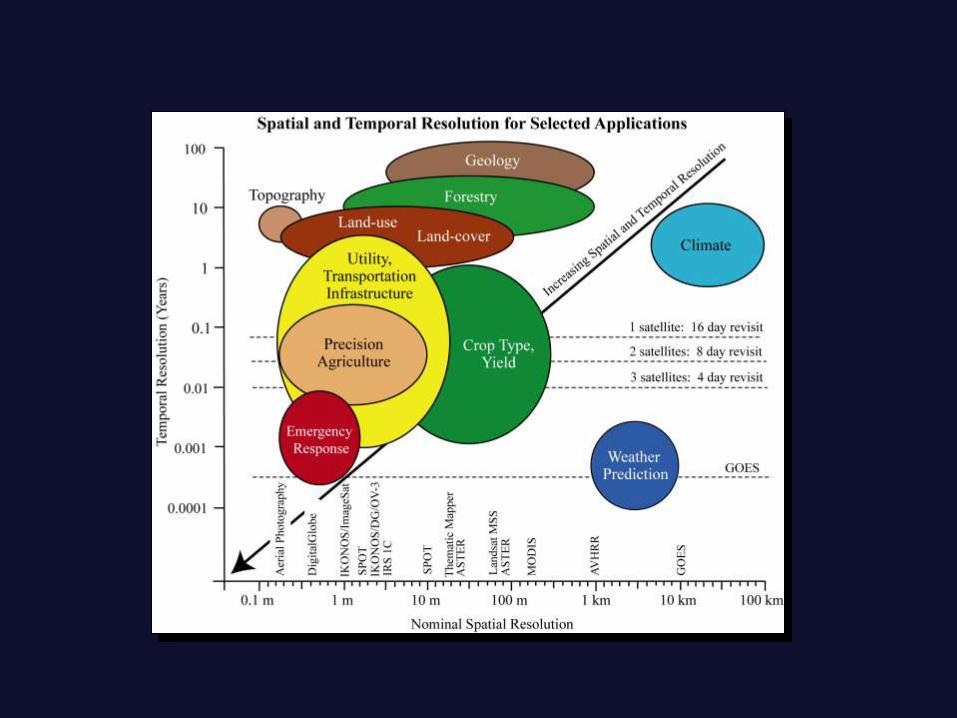
Resolution in Time and Space
29
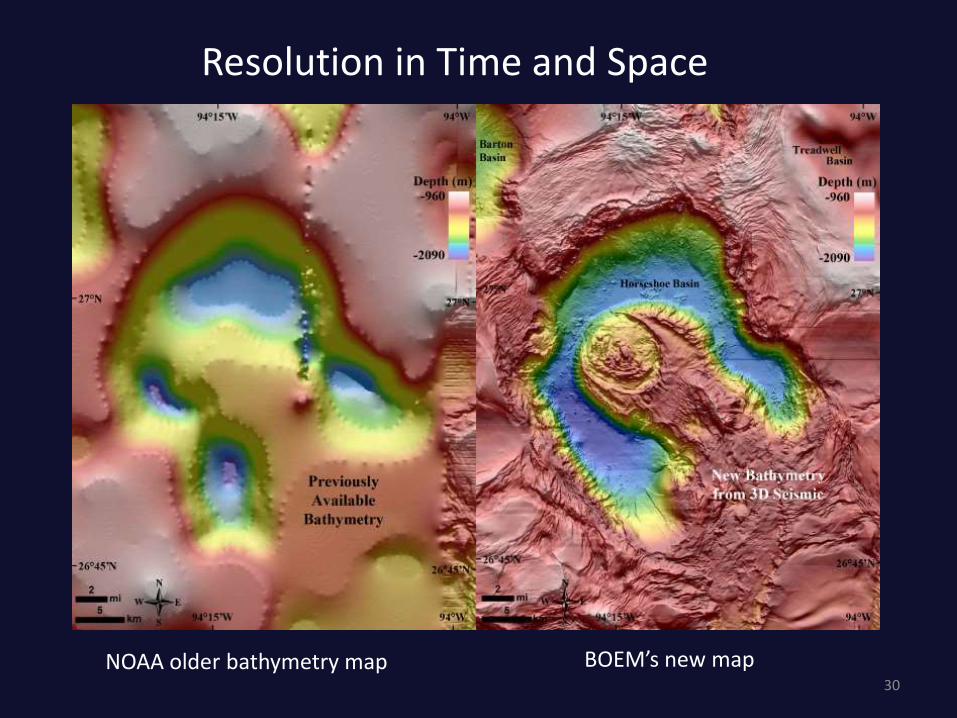
Resolution in Time and Space
30
NOAA older bathymetry map BOEM’s new map

*Simulated
1-2m 30m 79m 1.1kmQuickBird, Landsat TM, Landsat MSS AVHRR
IKONOS ETM+
Slide courtesy of Amy Nuenschwander, Univ of Texas, Center for Space Research
Resolution in Time and Space

33

34

35

36

37
NOAA's Coastal Change Analysis Program (C-CAP) 1985 to 2010 Regional Land Cover Change Data - Coastal United States (NODC Accession 0121254) Metadata Updated: February 2, 2017
The NOAA Coastal Change Analysis Program (C-CAP) produces national standardized land cover and change products for the coastal regions of the U.S. C-CAP products inventory coastal intertidal areas, wetlands, and adjacent uplands with the goal of monitoring changes in these habitats, on a one-to-five year repeat cycle. C-CAP data exists nationwide for the coastal regions of the lower 48 states for 1996, 2001, 2006, and 2010, and in selected locations for 1985 and 1992. These maps are developed utilizing Landsat Thematic Mapper imagery, and can be used to track changes in the landscape through time. This trend information gives important feedback to managers on the success or failure of management policies and programs and aid in developing a scientific understanding of the Earth system and its response to natural and human-induced changes. This understanding allows for the prediction of impacts due to these changes and the assessment of their cumulative effects, helping coastal resource managers make more informed regional decisions. NOAA C-CAP is a contributing member to the Multi-Resolution Land Characteristics consortium and C-CAP products are included as the coastal expression of land cover within the National Land Cover Database. Purpose: C-CAP is dedicated to the development, distribution, and application of land cover and change data for the coastal regions of the U.S. This effort is being conducted in close coordination with state coastal management agencies, the interagency Multi-Resolution Land Characteristics (MRLC) consortium, and the National Land Cover Database (NLCD).

Ensuring a data and information legacy that
promotes continual scientific discovery and
public awareness of the Gulf of Mexico.
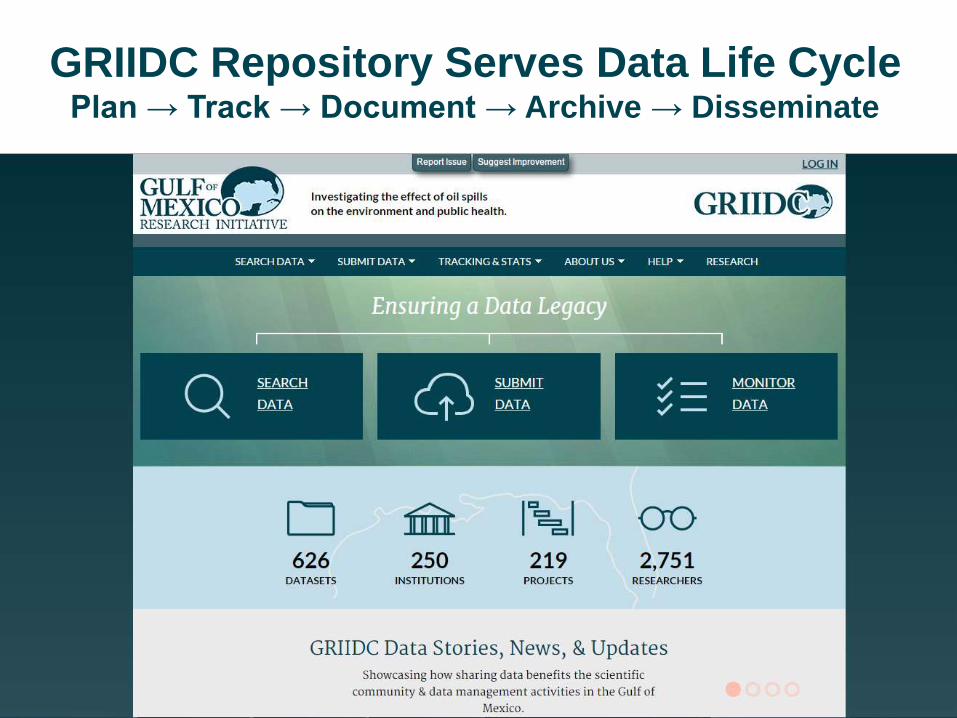
GRIIDC Repository Serves Data Life CyclePlan → Track → Document → Archive → Disseminate

GRIIDC Is a GoMRI Legacy
• Committed to serving GoMRI data until at least 2030
• Expanding services beyond GoMRI-funded research
• Integration with other repositories (e.g., NCEI, DataOne)
• Harte Research Insititute committed to expanding a data sharing culture through GRIIDC

41

42

Geophyscial
processes
(short- &
long-term)
Infrastructure
Property
Population
Hazard

Texas Coast
Gulf of MexicoShoreline Length:
Gulf = 600 km
Bays = 9,400 km
44

45

Relative sea-level rise trends from tide gauges
(NOAA, 2014)
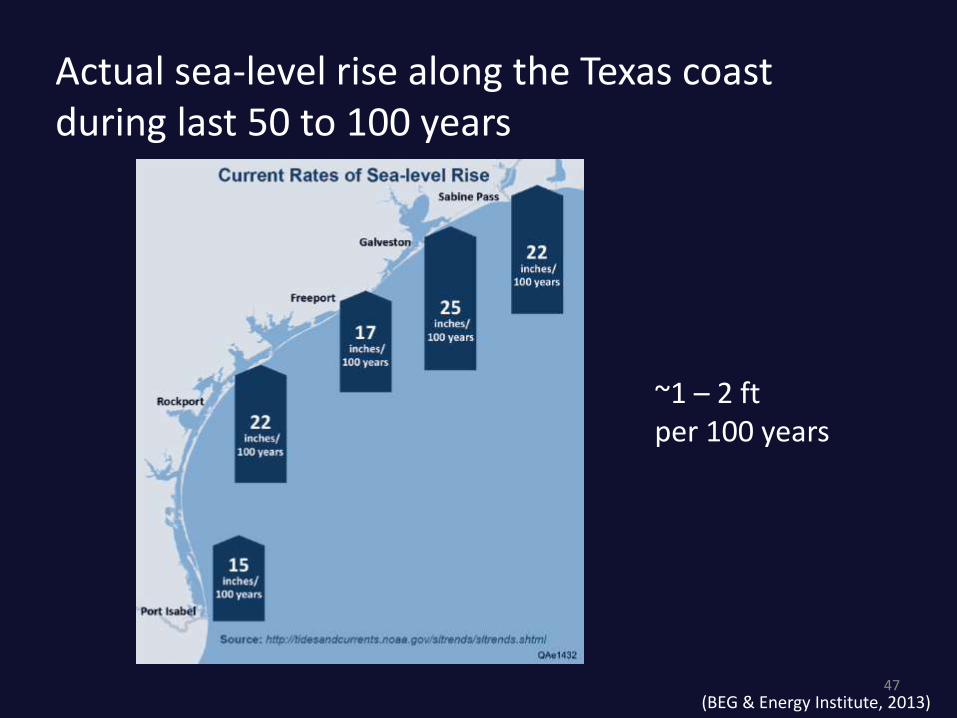
Actual sea-level rise along the Texas coast during last 50 to 100 years
(BEG & Energy Institute, 2013)
~1 – 2 ftper 100 years
47

Projections of global mean sea-level rise
Upper bound: 0.98 m (3.2 ft)
Lower bound: 0.26 m (.85 ft)
(IPCC 5th Assessment Report, 2013)48

Texas Coastal Plain Topography/Bathymetry
Sensitivity to Sea Level Rise• Low lying• Gently sloping• Small tide range• Land subsidingPlus:• 64% Gulf coast and most
bay shorelines retreating• 25% of Texas population
in 18 coastal counties
49

Protective barrier islands have and will change because of sea level rise
50
Mustang Island will tend to become more like Matagorda Peninsula
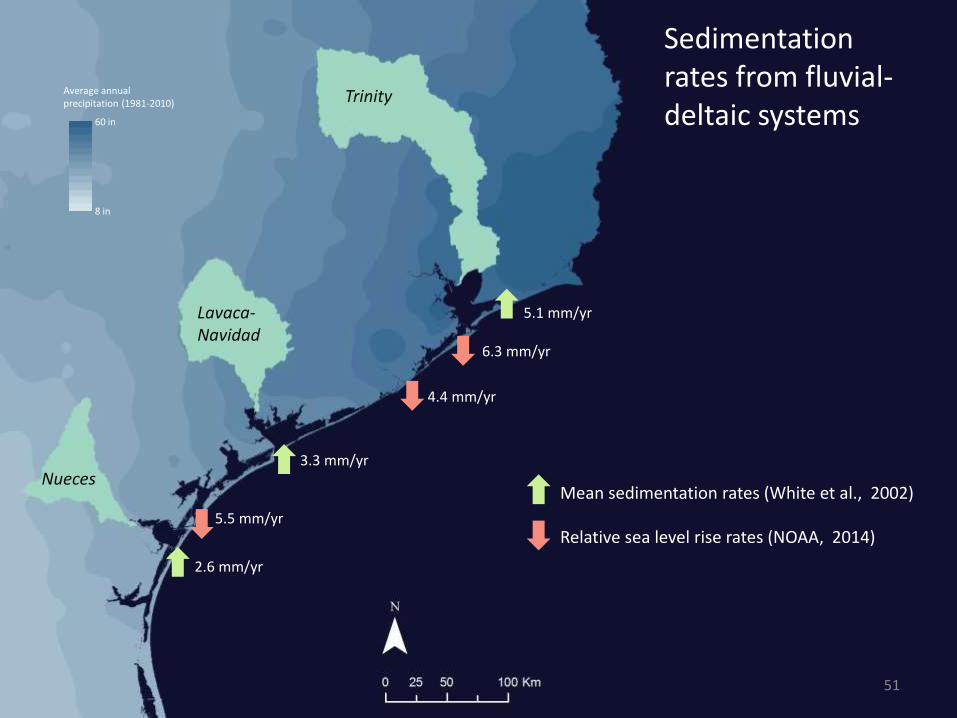
5.1 mm/yr
3.3 mm/yr
2.6 mm/yr
Nueces
Lavaca-Navidad
Trinity60 in
8 in
Average annualprecipitation (1981-2010)
4.4 mm/yr
5.5 mm/yr
6.3 mm/yr
Sedimentation rates from fluvial-deltaic systems
Mean sedimentation rates (White et al., 2002)
Relative sea level rise rates (NOAA, 2014)
51
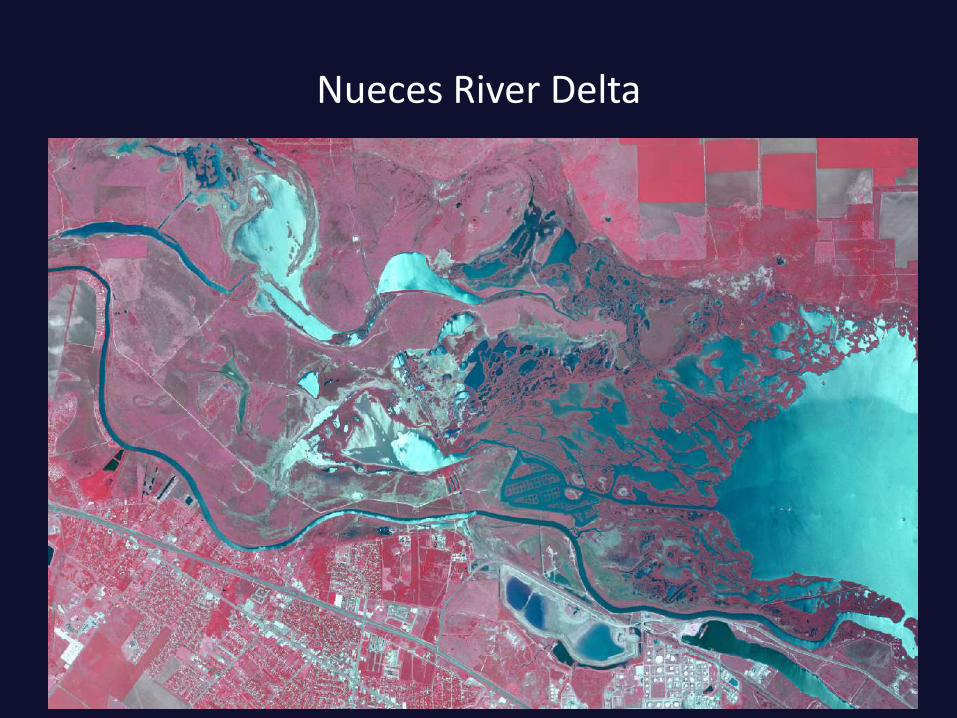
Nueces River Delta

Hurricane strikes in Texassince 1848
Hurricane Return Period for Cameron County:
Hurricanes (>=74 mph) -13 yrsMajor hurricanes (>=111 mph) - 30 yrs
(Blake and Landsea 2011)
Hurricane Return Period for Galveston County:
Hurricanes (>=74 mph) -9 yrsMajor hurricanes (>=111 mph) - 25 yrs

Maximum Storm-Surge Elevation during Hurricane Ike 2008

Maximum Storm-Surge Elevation during Hurricane Ike 2100

Nuisance Flooding: Changes in
Inundation Frequency
As the century progresses coastal communities will have to deal with increasingly frequent small to medium inundations resulting in growing insurance claims.
Corpus ChristiNorth Beach2 inundations in 2008
Tissot & Reisinger, 2016 GCAGS

57
(Minogue/VIMS, 2013)
(Based on Brinson et al., 1995)

Wetlands in the Corpus Christi Area
Wetland Categories Area (hectares)
Tidal Flat 1,264
Tidal Fresh Marsh 3
Inland Fresh Marsh 8,648
Irregularly Flooded Marsh 1,245
Regularly Flooded Marsh 3,390
Transitional Marsh 670
Total Area 15,220

Difference in Surge with and without Marshes
Key Findings:
Additional 385 hectare of land is inundated with
the loss of marshes in the area.
Largest difference in inundation levels are
observed in the Nueces River floodplain,
upstream of Oso Creek, and regions adjacent to
the barrier island.

Socio-economic Loss Analysis
Key Findings:(This analysis considers both Nueces and San Patricio County in 2010 US $ value and Census data.)
The loss of marshes in the region resulted in total $95 million direct
economic losses for buildings, $55.7 million depreciated direct
economic losses for buildings, $22 million economic losses for
vehicles, and $637,750 economic losses for utilities.
The loss of marshes in the region resulted in 67 buildings to be
damaged.
The loss of marshes in the region resulted in total of 101 displaced
household, 303 displaced people, and 299 people needing short-term
shelter.
The storm surge protection value provided by the marshes in the region
is $6,244 per hectare of marsh, considering only the direct economic
losses for buildings.

Imminent Geohazard Potential
High Geohazard PotentialFuture critical environments: Areas expected to become critical environments in 60 years' time (2062)
Moderate Geohazard PotentialLow upland areas not expected to become critical environments but are inundated by low-intensity storms
Low Geohazard Potential Island core upland: Centrally located upland areas generally more than 5 feet above sea level
Geohazards MapMustang and North Padre Islands
61

Summary
Sea level rise has and will continue to drive major changes in coastal Texas during the next decades.
We need space and sediment to ensure survival of low-lying and intertidal environments.
We need these environments for the ecosystem services they provide us.
62

63