monitoring health determinants with an equity … d... · castellanos1, jairnilson paim1, celia...
TRANSCRIPT
MONITORING HEALTH DETERMINANTS WITH AN EQUITY FOCUS
Assessing the relevance of indicators in tracking socialdeterminants and progress toward equitable populationhealth in Brazil
Davide Rasella1,2*, Daiane Borges Machado1, Marcelo Eduardo PfeirrerCastellanos1, Jairnilson Paim1, Celia Landmann Szwarcwald3, Diana Lima1,Laio Magno1, Leo Pedrana1, Maria Guadalupe Medina1, Gerson OliveiraPenna2,4 and Mauricio Lima Barreto1,5
1Instituto de Saude Coletiva, Federal University of Bahia, Salvador, Brazil; 2Fundacao Oswaldo Cruz(Fiocruz), Brasilia, Brazil; 3ICICT, Fundacao Oswaldo Cruz (Fiocruz), Rio de Janeiro, Brazil; 4Nucleo deMedicina Tropical, University of Brasilia, Brasilia, Brazil; 5Centro de Pesquisas Goncalo Muniz, FundacaoOswaldo Cruz (Fiocruz), Salvador, Brazil
Background: The importance of the social determinants of health (SDH) and barriers to the access and
utilization of healthcare have been widely recognized but not previously studied in the context of universal
healthcare coverage (UHC) in Brazil and other developing countries.
Objective: To evaluate a set of proposed indicators of SDH and barriers to the access and utilization of
healthcare � proposed by the SDH unit of the World Health Organization � with respect to their relevance in
tracking progress in moving toward equitable population health and UHC in Brazil.
Design: This study had a mixed methodology, combining a quantitative analysis of secondary data from
governmental sources with a qualitative study comprising two focus group discussions and six key informant
interviews. The set of indicators tested covered a broad range of dimensions classified by three different
domains: environment quality; accountability and inclusion; and livelihood and skills. Indicators were stratified
according to income quintiles, urbanization, race, and geographical region.
Results: Overall, the indicators were adequate for tracking progress in terms of the SDH, equity, gender, and
human rights in Brazil. Stratifications showed inequalities. The qualitative analysis revealed that many of the
indicators were well known and already used by policymakers and health sector managers, whereas others
were considered less useful in the Brazilian context.
Conclusions: Monitoring and evaluation practices have been developed in Brazil, and the set of indicators
assessed in this study could further improve these practices, especially from a health equity perspective.
Socioeconomic inequalities have been reduced in Brazil in the last decade, but there is still much work to be
done in relation to addressing the SDH.
Keywords: monitoring; social determinants of health; inequality; equity; universal healthcare coverage
Responsible Editor: Jennifer Stewart Williams, Umea University, Sweden.
*Correspondence to: Davide Rasella, Instituto de Saude Coletiva, Federal University of Bahia, Rua Basılio
da Gama s/n � Canela, 40110-040 Salvador, Bahia, Brazil, Email: [email protected]
This paper is part of the Special Issue: Monitoring health determinants with an equity focus.
More papers from this issue can be found at www.globalhealthaction.net
Received: 3 July 2015; Revised: 8 October 2015; Accepted: 9 October 2015; Published: 5 February 2016
IntroductionEvidence of the importance of socioeconomic status
as a determinant of population health has been growing
in recent years (1), highlighting the need to include the
social determinants of health (SDH) in public health
policymaking (2).
Brazil is a middle-income country which has undergone
substantial improvements in terms of socioeconomic
conditions and health in the last decade (3, 4). Per capita
income increased on average by 36.0% from 2002 to 2012
with major benefits realized by those with low education.
Unemployment rates also fell in this period. In 2008, Brazil
met the Millennium Development Goal on poverty reduc-
tion, but poverty remains high in some rural areas and city
slums (3). Income inequality in Brazil � among the highest
in the world � has also decreased (4). Average educational
Global Health Action�
Global Health Action 2016. # 2016 Davide Rasella et al. This is an Open Access article distributed under the terms of the Creative Commons Attribution 4.0International License (http://creativecommons.org/licenses/by/4.0/), allowing third parties to copy and redistribute the material in any medium or format and toremix, transform, and build upon the material for any purpose, even commercially, provided the original work is properly cited and states its license.
1
Citation: Glob Health Action 2016, 9: 29042 - http://dx.doi.org/10.3402/gha.v9.29042(page number not for citation purpose)
levels in the population have improved, and there has been a
remarkable decrease in illiteracy rates (5).
Health indicators have improved in Brazil in the last
decade, with the greatest reductions being in morbidity
and mortality from infectious diseases in all age groups (6)
but also specifically in children (7). These trends are accom-
panied by an increase in life expectancy (8). The rapid ageing
of the population in Brazil is creating new challenges for the
healthcare system, one of which is the increasing burden
resulting from non-communicable chronic diseases (9).
These remarkable improvements in health conditions in
Brazil have been attributed to several factors, including
economic growth, increased minimum wages, and effective
social and health policies (6, 7, 10). In general, there has
been an expansion of the unified health system (Sistema
Unico de Saude or SUS) and improvements in equity
of access to healthcare, mainly in primary care (11).
Although the importance of the SDH and barriers to
access and utilization of healthcare have been recognized
worldwide (2), these factors have not been well researched
in Brazil or other developing countries moving toward
universal healthcare coverage (UHC) (11). It is worth noting
that in Brazil, health is the constitutional right of all citizens
and the provision of healthcare is a State duty. The SUS
is publicly operated and free of charge to users (12).
Ongoing monitoring of actors and conditions that have
an impact on the distribution of health in a population
is needed in all countries (13). The importance of data
gathering and monitoring has also been highlighted in the
sustainable development goals (SDGs) (14). In order
to monitor intersectoral factors which influence equity-
oriented progress toward achieving UHC using indicators
that are comparable and relevant between and within
countries, the SDH unit of the World Health Organiza-
tion (WHO) has proposed a set of agreed indicators as
shown in Fig. 1 (unpublished result). The indicators,
which cover a broad range of SDH dimensions, are
classified into three cluster domains � environment
quality; accountability and inclusion; and livelihood and
skills � and 12 domains, falling under the WHO equity-
oriented analysis of linkages between health and other
sectors (EQuAL) framework (unpublished result). The
objective of this study in Brazil was to assess these
indicators with respect to their relevance in tracking
progress toward equitable population health and UHC.
MethodsThis study has a mixed methodology, combining a quan-
titative analysis of secondary data from official sources
with a qualitative study comprising two focus group dis-
cussions (FGDs) and six key informant interviews (KIIs).
For the quantitative analysis, the available data � both
microdata at the individual-level and/or household-level
and aggregate-level data � were collected from different
sources, these being the National Household Sample
Survey (PNAD), the Health Supplement of the PNAD,
the National Demographic Census, the National Health
Survey, the National Program for Access and Quality
Improvement in Primary Care (PMAQ), the World Health
Survey (WHS), and the Matrix of Social Information of
the Ministry of Social Development (15�21). Some
indicators are reported in the Discussion section because
they were only available in published studies (22�24). The
analysis of microdata took into account the complex
sampling design of each specific survey. Summary mea-
sures of the distribution of the indicators, including means
and percentages, were calculated. In order to evaluate
inequalities, indicators were stratified, where possible,
according to income quintiles, urbanization, race, and
geographical regions. Some double stratifications were
also performed. Specific measures of inequality such as
rate differences, rate ratios, and the concentration index
were also used (25). Where indicators were not available,
proxy indicators were used. Analyses were performed in
STATA Version 12.
For the qualitative analysis, a brief summary of the main
points that emerged from the FGDs and KIIs is presented.
A more detailed description of the results � in a country-
comparative perspective � is presented elsewhere (26). The
main objective of the qualitative component was to evalu-
ate the policy and programmatic feasibility and relevance
of the indicators in terms of being understood and com-
municated by the target audience, and being useful within
the specific policy context. Participants in the qualitative
study were mainly from the health sector.
Two sets of FGDs of about 1.5 h duration were led by a
coordinator and an observer. Participants were executives
of the Bahia State, one of Brazil’s largest states, and occu-
pied strategic leadership positions. The initial FGD was
conducted with six policymakers from different sectors who
were responsible for the formulation and implementation
of sectoral and intersectoral policies. Participants discussed
the indicators in the domains of income and poverty, social
protection, and discrimination. Participants in the second
FGD were health sector managers. They discussed the
indicators as a whole, covering the domains of inclusion
and accountability, knowledge, livelihood/social support,
and material circumstances. The FGDs allowed in-depth
discussion and critique about the relevance of indicators for
the orientation of public policies and programs.
KIIs of 1.5�3 h in duration were also conducted.
The discussions covered the full set of indicators. Four
interviews were conducted with a policymaker, a senior
health sector manager, a civil society leader, and a media
professional. For logistical reasons, two telephonic KIIs
and two face-to-face KIIs were conducted. Key informants
occupied prominent places in the government and non-
government sectors at the national level and had a wealth
of experience in relation to health policy and the organiza-
tion of the health system.
Davide Rasella et al.
2(page number not for citation purpose)
Citation: Glob Health Action 2016, 9: 29042 - http://dx.doi.org/10.3402/gha.v9.29042
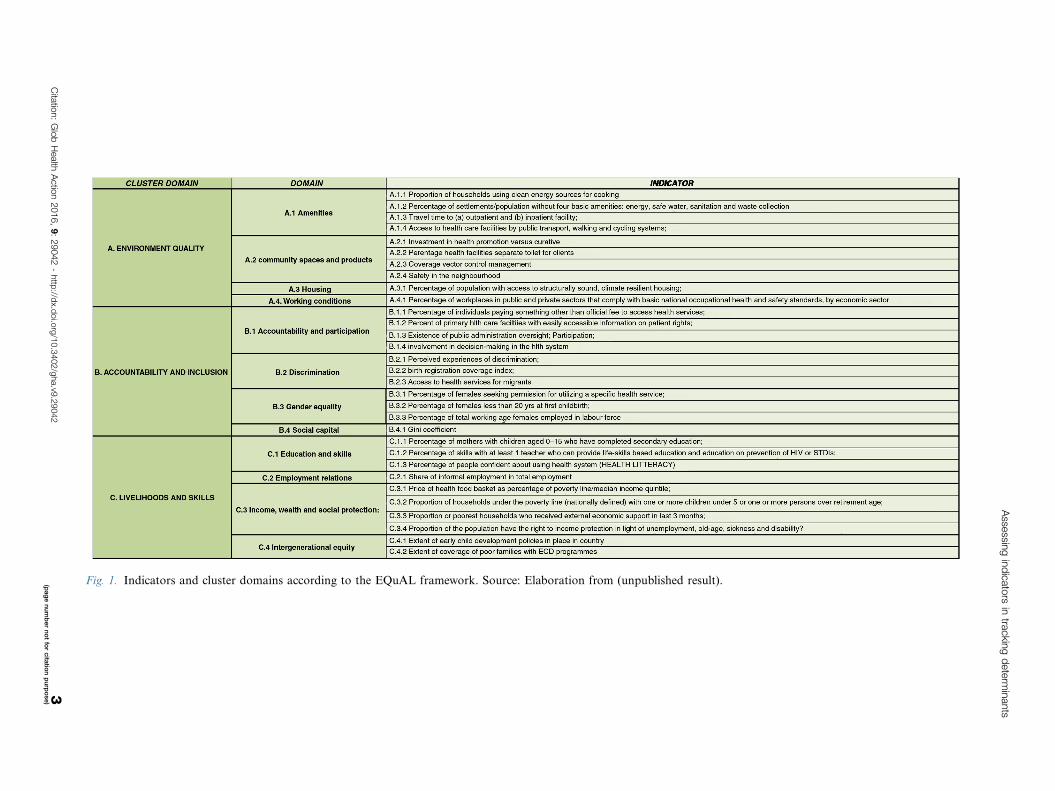
Fig. 1. Indicators and cluster domains according to the EQuAL framework. Source: Elaboration from (unpublished result).
Asse
ssing
ind
icato
rsin
trackin
gd
ete
rmin
ants
Cita
tion:
Glo
bH
ealth
Actio
n2016,
9:
29042
-http
://dx.d
oi.o
rg/1
0.3
402/g
ha.v9
.29042
3(p
ag
en
um
ber
no
tfo
rcita
tion
pu
rpo
se)
Results
Quantitative analysis
In Brazil in 2012, among households under the poverty
line (140 BRL per capita per month), 36.0% had at
least one child under age 5 and 4.7% had a member
older than 64 years, compared with 23.9% and 38.2%,
respectively, in other households. The Gini index was
higher in municipalities in the poorest income quintile
(54.5) and lower in those in the richest quintile (48.6)
(Table 1). When the municipalities were classified based
on urbanization, the Gini index was lower in urban areas
(49.0) than rural areas (51.6) (Table 2). The percentage of
mothers with children aged 0�15 years with secondary
education was 35.1%, with a large difference between the
lower income quintile (11.7%) and the higher income
quintile (68.1%), and a concentration index of 0.3. Almost
all the houses (98.6%) used clean energy sources for
cooking, such as gas and electricity, but this percentage
was lower in the poorest quintile (86.6%) compared with
the richest quintile (98.6%) (Table 1). Among the Brazilian
households, 5.3% were without piped water, 35.1% had
inadequate sanitation, 11.2% had no garbage collection,
and 0.5% had no electricity in the house. When these
indicators were stratified by income quintiles, strong
socioeconomic gradients were evident (Table 1).
According to the WHS, conducted in 2003 in Brazil,
the mean travel time to reach a hospital (secondary care)
was 45.4 min, being 59.1 min for patients in the poorest
income quintile and 38.1 min for those in the richest
income quintile, 63.7 min for residents of rural munici-
palities and 41.1 min for urban residents (Tables 1 and 2).
According to the PMAQ, in 2012, 38.4% of the users
were more than 1 km away from a primary healthcare
facility, this being 42.5% for users in the poorest income
quintile. In Brazil in 2012, the informal employment
rate was 40.5%, reaching 58.5% in the Northeast region
and 30.6% in the Southeast region. About 48.7% of the
mothers at their first childbirth were under 20 years.
The PMAQ for 2012 showed that 62.1% of primary
healthcare users who submitted a complaint procedure to a
health facility, obtained a formal reply. This percentage was
higher in the richest income quintile which had a greater
proportion of people with higher educational levels.
Table 1. Indicators according to income quintiles (first the poorest, fifth the richest), rate differences, rate ratios and
concentration index
Income quintilesDiff.
First to
Ratio
First/
Concentration
index
First Second Third Fourth Fifth Total fifth Fifth First to fifth
Environment quality: amenities, community, housing
% of hh using clean energy for cooking 88.4 95.3 95.9 98.3 99.4 95.7 �11.0 0.9 0.02
% hh without piped water 15.1 5.8 4.5 1.8 0.5 5.3 14.6 28.6 �0.48
% households without toilet 8.5 2.4 2.0 0.6 0.2 2.6 8.3 52.1 �0.54
% hh with inadequate sanitation 57.7 42.1 36.7 27.9 17.7 35.1 39.9 3.3 �0.21
% hh without garbage collection 27.5 12.8 10.8 5.1 2.2 11.2 25.4 12.8 �0.40
% hh without electricity 1.5 0.5 0.4 0.2 0.0 0.5 1.5 � �0.51
% PHC users distant �1 km from health facility 42.4 37.8 37.8 36.5 36.9 38.3 5.5 1.1 �0.03
Mean time to reach health facility (in min) 59.1 51 38.1 39.9 38.1 45.4 21.0 1.6 �0.09
Accountability and inclusion: social capital and
discrimination
Municipal Gini index 53.8 51.0 48.1 46.0 47.7 49.3 6.2 1.1 �0.03
% PHC users who received reply to complaint 58.7 60.4 60.8 63.5 68.2 62.1 �9.4 0.9 0.03
% of population perceiving discrimination 17.1 21.2 19.5 12.6 11.4 15.9 5.7 1.5 �0.10
% mothers under 20 years 54.1 49.6 45.9 43.3 45.6 48.7 8.5 1.2 �0.04
Livelihood and skills: education, income
% of mothers with children aged 0�15 completing
secondary education
11.7 21.8 33.8 48.8 68.1 35.1 �56.3 0.2 0.30
Bolsa Familia Program coverage (%) 126.4 122.6 106.8 95.9 83.1 107.0 43.3 1.5 �0.10
Hh, household; PHC, primary healthcare.
All possible stratifications of the available indicators have been included in the table. When an indicator is not stratified according
to a specific stratifier is because this information was not available.
Source: National Household Sample Survey (PNAD), Health Supplement of the National Household Sample Survey (PNAD), National
Demographic Census, National Health Survey, National Program for Access and Quality Improvement in Primary Care, Mortality
Information System, World Health Survey (2003).
Davide Rasella et al.
4(page number not for citation purpose)
Citation: Glob Health Action 2016, 9: 29042 - http://dx.doi.org/10.3402/gha.v9.29042

In Brazil in 2010, the coverage of birth registration
was 98.1%, being lower in the North region (94.9%)
and in rural areas (96.7%) and higher in the Southeast
region (99.0%). According to the WHS, 15.9% of the
population perceived some discrimination in using health-
care services, and this was higher among females (16.5%),
in the two poorest income quintiles (17.1 and 21.2%), and
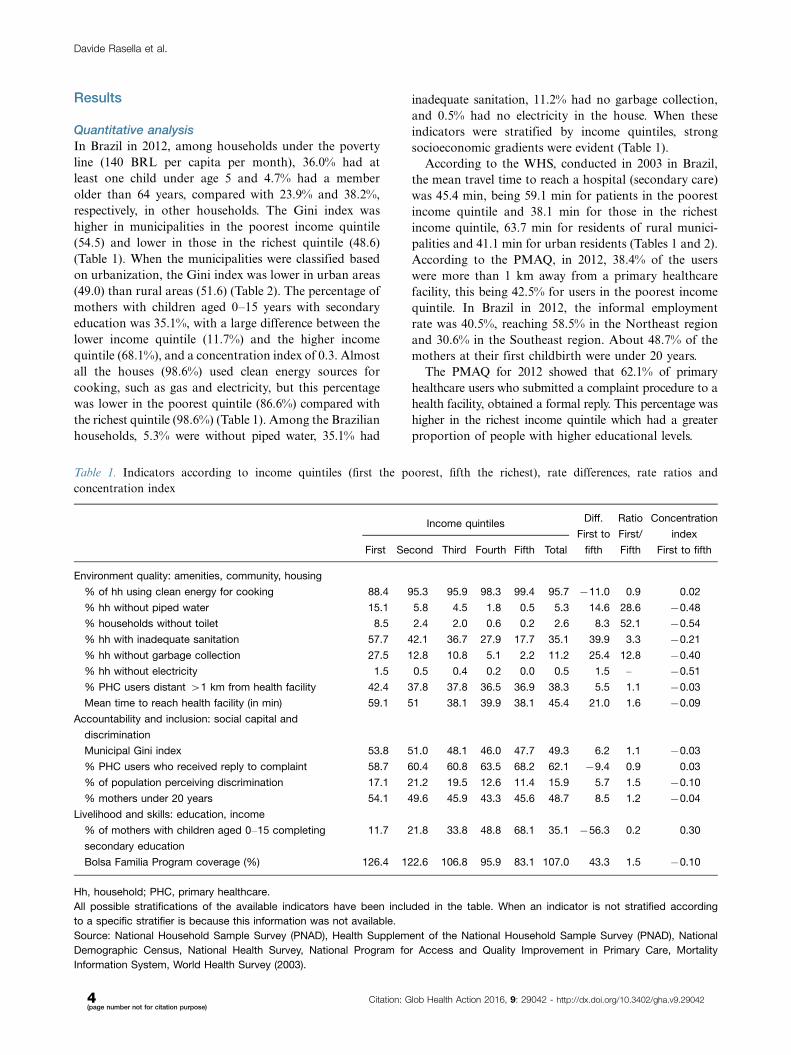
for younger users (18�29 years, 18.6%). Figure 2 shows
the 2010 geographical patterns in poverty and illiteracy
rates in Brazil. These are higher in the North and
Northeast regions where life expectancies are lower.
Inequalities are also evident when the same indicators
are stratified according to administrative regions (Table 3),
race (Table 4), and double stratification with urbanization
and income quintiles (Table 5).
Qualitative analysis
Focus group discussions with policymakers
In relation to the income and poverty domain, the view
expressed in the FGDs was that the indicator ‘propor-
tion of households under poverty line with one or more
persons over retirement age/with one or more children
under 5 has great relevance and policy and programmatic
viability, being useful for intersectoral policies, especially
with regard to the elderly population. The participants
suggested that families with individuals with physical and/
or mental handicaps should not be overlooked as vulner-
able families. The Gini coefficient was regarded as having
clarity and high feasibility, but participants claimed that it
has low political and programmatic relevance in small
areas. With regard to the social protection and employment
domain, the indicator ‘share of informal employment in
total employment’ was perceived as being highly commu-
nicable, but impractical. One reason for this was that there
are no available reliable data on informal employment;
however in general, there was controversy about the
relevance of this indicator. Some participants pointed out
that, especially in rural areas, there are situations where
informal work is more profitable and sustainable over time
than formal work. Participants understood that there was
great political and programmatic relevance and viability
for poverty-reduction policies involving social cash transfer
policies, such as the Bolsa Familia Program, for which
data are available. There was consensus about the policy
and programmatic relevance of the discrimination domain.
Table 2. Indicators according to urbanization
Urban Rural Total Diff Ratio
Municipal Gini index 47.9 50.7 49.3 �2.9 0.9
% of PHC users distant �1 km from health facility 36.2 48.7 39.74 �12.5 0.7
Mean time taken to reach health facility (in min) 41.1 63.7 45.4 �22.6 0.6
% Coverage of birth registration 98.5 96.7 97.2 1.8 1.0
% Population perceiving discrimination in healthcare facility 16.4 14.8 15.9 1.6 1.1
Bolsa Familia Program coverage (%) 110.8 103.1 107.0 �7.8 0.9
PHC, primary healthcare.
All possible stratifications of the available indicators have been included in the table. When an indicator is not stratified according
to a specific stratifier is because this information was not available.
Source: National Household Sample Survey (PNAD), Health Supplement of the National Household Sample Survey (PNAD), National
Demographic Census, National Health Survey, National Program for Access and Quality Improvement in Primary Care, Mortality
Information System, World Health Survey (2003).
Fig. 2. Geographical patterns of poverty rate, illiteracy rate, and life expectancy in the year 2010 in Brazil. Source: Elaboration
from the Brazilian Institute of Geography and Statistics (IBGE).
Assessing indicators in tracking determinants
Citation: Glob Health Action 2016, 9: 29042 - http://dx.doi.org/10.3402/gha.v9.29042 5(page number not for citation purpose)
Key informant interviews
All key informants felt that the indicators concerning
income and poverty, such as knowledge and education,
home and infrastructure, had high relevance and policy
and programmatic feasibility. In addition, all key infor-
mants perceived that ‘discrimination’ had high relevance
and policy and programmatic feasibility. However, their
views differed somewhat for the other domains. For the
areas of community and infrastructure, responses varied
between low and medium relevance and viability; social
protection and employment ranged between high and
medium relevance and viability; and early childhood deve-
lopment, ranged from high to low relevance and viability.
All discussants considered gender indicators highly rele-
vant but views on viability varied and opinions diverged
regarding transparency.
Focus group discussions with health sector managers
Health sector managers expressed the view that, as awhole,
all indicators had high programmatic relevance. However,
there were some concerns about technical feasibility, with
regard to the existence of reliable and affordable sources
of information. There was consensus in FGDs that this
set of indicators could promote the planning and evalua-
tion of intersectoral interventions, supporting bringing
health into the public policy agenda. Discussants saw
the indicators as allowing the identification of vulnerable
populations, often with barriers faced in accessing social
protection systems, such as maternity leave, unemploy-
ment insurance, retirement pay, and pensions. They offer
the potential to make an important, strong, and consistent
contribution to the dialogue and the planning of inter-
sectoral actions. Moreover, these indicators were consid-
ered relevant for assessing the impact of health programs
and intersectoral actions on vulnerable populations.
Discussion
Utility, feasibility, and relevance of the indicators
The set of indicators tested in this study are highly relevant
for tracking progress toward UHC in Brazil within the
context of the SDH, equity, gender, and human rights. In
the quantitative analysis, all the indicators for which data
were available showed some inequality when stratified.
In particular, this was the case when household living
conditions (absence of piped water, toilet, and electricity,
among others) were stratified by income quintiles. There
were also gradients and differences between population
subgroups, based on geographic region and race.
In terms of technical feasibility � by which we mean ease
of acquiring, analyzing and interpreting the data � the
majority of the indicators were collected regularly through
reliable surveys. In terms of policy and programmatic
feasibility � as shown by the results of the qualitative
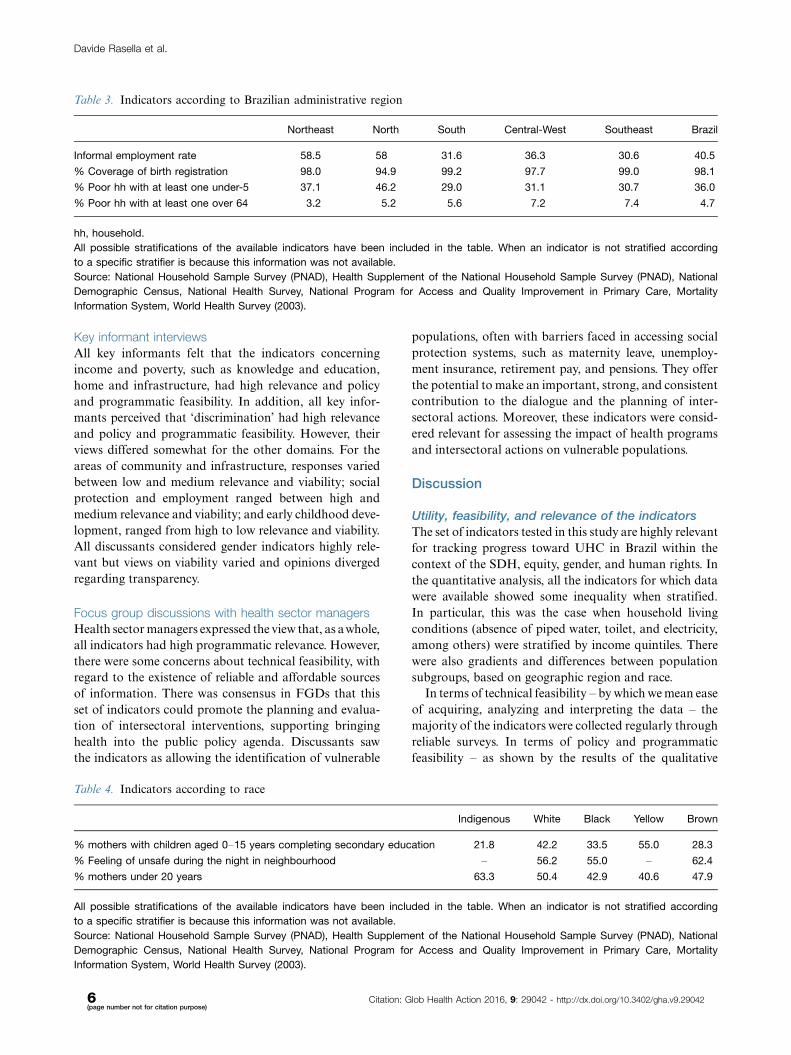
Table 3. Indicators according to Brazilian administrative region
Northeast North South Central-West Southeast Brazil
Informal employment rate 58.5 58 31.6 36.3 30.6 40.5
% Coverage of birth registration 98.0 94.9 99.2 97.7 99.0 98.1
% Poor hh with at least one under-5 37.1 46.2 29.0 31.1 30.7 36.0
% Poor hh with at least one over 64 3.2 5.2 5.6 7.2 7.4 4.7
hh, household.
All possible stratifications of the available indicators have been included in the table. When an indicator is not stratified according
to a specific stratifier is because this information was not available.
Source: National Household Sample Survey (PNAD), Health Supplement of the National Household Sample Survey (PNAD), National
Demographic Census, National Health Survey, National Program for Access and Quality Improvement in Primary Care, Mortality
Information System, World Health Survey (2003).
Table 4. Indicators according to race
Indigenous White Black Yellow Brown
% mothers with children aged 0�15 years completing secondary education 21.8 42.2 33.5 55.0 28.3
% Feeling of unsafe during the night in neighbourhood � 56.2 55.0 � 62.4
% mothers under 20 years 63.3 50.4 42.9 40.6 47.9
All possible stratifications of the available indicators have been included in the table. When an indicator is not stratified according
to a specific stratifier is because this information was not available.
Source: National Household Sample Survey (PNAD), Health Supplement of the National Household Sample Survey (PNAD), National
Demographic Census, National Health Survey, National Program for Access and Quality Improvement in Primary Care, Mortality
Information System, World Health Survey (2003).
Davide Rasella et al.
6(page number not for citation purpose)
Citation: Glob Health Action 2016, 9: 29042 - http://dx.doi.org/10.3402/gha.v9.29042
approach � the majority of the indicators were commu-
nicable and comprehensible for policy-makers and sector
managers. Overall, the indicators were considered to have
high political and programmatic relevance.
The indicators in Brazilian context
Brazil is a country where � even if great improvements in
terms of socioeconomic conditions have been reached �there are still problems with regard to poverty, gender
equality, and equity of access to healthcare (3, 4, 11).
Travel time and geographical distance are significant
barriers to accessing healthcare facilities in developing
countries (27), and in poor rural areas in these countries,
transportation costs are a major inhibitor (28). In Brazil
today, travel time is of relevance when considered in rela-
tion to access to hospitals and healthcare facilities that are
commonly situated in urban centers (12, 29). The recent
efforts of the Family Health Program (FHP) strategy to
increase the coverage of primary healthcare was a welcome
and important step in reducing access barriers for primary
healthcare (30). The initiative has achieved important
results in terms of reducing unattended child deaths and
improving the collection of vital statistics and health
information (31).
Discrimination is an issue in Brazil (32, 33). This occurs
in relation to income and socioeconomic status as shown
in WHS data (20). Brazilian women are also more
susceptible to discrimination if they are black, unmarried,
have a low income, or are pregnant and adolescent (34,
35). However, progress has been made in improving gender
equality. The gender gap index, which is an international
measure of gender equality, improved from 0.654 to
0.695 in Brazil during the period 2006�2011, ranking the
country in 62th position in the world. However, Brazil
does not rate high when compared with some other
developing countries (36). In Brazil, women have more
access to healthcare than men, and are not judged by men
for seeking healthcare (37). They seek more preventive
care than men, in particular for routine examinations and
curative care (38). Concerning early child development, in
2001 laws were introduced to protect the health and rights
of children and adolescents (39). The Brazilian government
has also implemented programs, such as the National
Policy of Alimentation and Nutrition, and the Milk
Program for Life, the main objective of which is to reduce
the malnutrition and child mortality (40).
In the last two decades, the Brazilian public health
system increased investment in health promotion and
prevention (41), but, as is the case in other countries, it
is difficult to quantify the amount of money invested
because health promotion/prevention and curative bud-
gets are often combined (42, 43). The Brazilian unified
health system (SUS) is still based on curative care. With
rapid population ageing, there needs to be more invest-
ment in preventive care (9, 44, 45).
The involvement of the population in the decision
making process for health was institutionalized in Brazil
in 1988. This involved the establishment of the ‘Conselhos
de Saude’ (CS), permanent commissions composed by
representatives of government, of other non-governmental
health providers, health professionals, and users of the
health system (12). However, the CS faces many challenge
in ensuring the smooth running and consolidation of
processes (46).
Informal workers in developing countries are usually
strongly disadvantaged due to the lack of protection and
in Brazil work in the private sector, businesses, and
domestic services (22, 47).
Corruption, at different levels, is still a major problem,
with a Corruption Perception Index of 42 in 2012 (48, 49).
During the last decade, several laws have been implemen-
ted to increase accountability and transparency in the
management of public funds, including the compulsory
provision of budget information in internet (50). Violence
represents one important cause of death and of hospital
admissions in Brazil (51). Homicide alone accounts for
36.4% of all deaths from external causes and has major
negative social impacts in communities throughout the
population (52).
The main limitation of this study was that we used and
assessed a high number of wide ranging indicators. This
limited the possibility of analyzing individual indicators in
any depth, either in the quantitative or qualitative analysis.
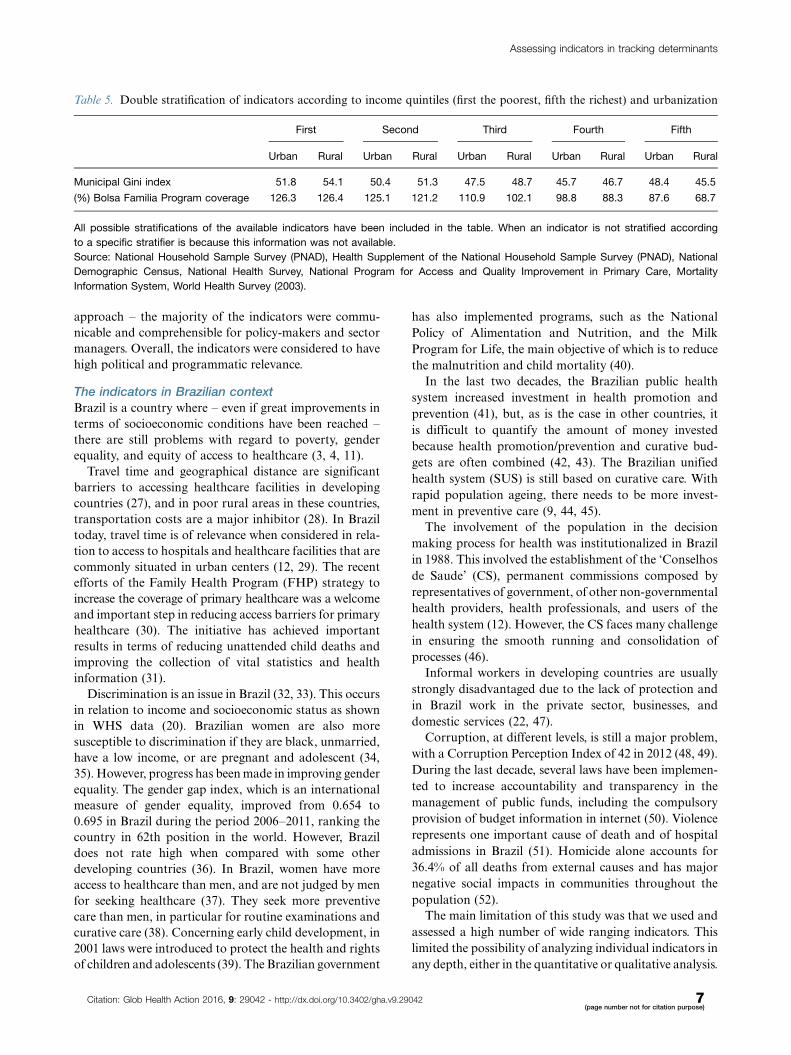
Table 5. Double stratification of indicators according to income quintiles (first the poorest, fifth the richest) and urbanization
First Second Third Fourth Fifth
Urban Rural Urban Rural Urban Rural Urban Rural Urban Rural
Municipal Gini index 51.8 54.1 50.4 51.3 47.5 48.7 45.7 46.7 48.4 45.5
(%) Bolsa Familia Program coverage 126.3 126.4 125.1 121.2 110.9 102.1 98.8 88.3 87.6 68.7
All possible stratifications of the available indicators have been included in the table. When an indicator is not stratified according
to a specific stratifier is because this information was not available.
Source: National Household Sample Survey (PNAD), Health Supplement of the National Household Sample Survey (PNAD), National
Demographic Census, National Health Survey, National Program for Access and Quality Improvement in Primary Care, Mortality
Information System, World Health Survey (2003).
Assessing indicators in tracking determinants
Citation: Glob Health Action 2016, 9: 29042 - http://dx.doi.org/10.3402/gha.v9.29042 7(page number not for citation purpose)

This study has many strengths. To our knowledge, this is
the first study of its kind. The setting is important because
Brazil is an information-rich country, where most of the
indicators of the EQuAL framework are already or can
potentially be collected.
The importance of monitoring population conditions
in developing countries has been recently highlighted in
the 2030 Agenda for Sustainable Development, with two
SDGs (17.18 and 17.19) dedicated to data, monitoring,
and accountability (14). Data on the SDH should be
gathered to not only identify inequalities under an equity
focus (13), but also in order to understand how health
outcomes are or will be played out under future scenarios
such as UHC. The variety of domains for SDH monitor-
ing, such as the EQuAL framework, highlights the need
for an interdisciplinary approach, both at academic and
policymaking levels (2, 53, 54).
ConclusionsIn Brazil, inequalities among the population are still
present and the monitoring of the SDH and barriers
to healthcare is an essential step toward achieving UHC
in the context of the country’s unified health system.
In order to be useful for policymakers and health sector
managers, the indicators from the different domains
need to be reliable, valid, feasible, and relevant, as well as
up-to-date. Most of the indicators discussed here in the
context of Brazil have these characteristics. As shown by
recent studies, intersectoral policies which address the
SDH can be extremely effective in reducing health inequal-
ities (10, 55). Great advances have been achieved in Brazil
in the last decade, but large inequities still exist. Public
policies should be focused on achieving a more equitable
distribution of health as the country moves toward UHC.
Ethics and consentNo ethical approval was necessary for this study. The
quantitative datawere analyzed in aggregated de-identified
format. In the qualitative component, all discussions were
of a professional nature and were conducted in workplace
settings.
Authors’ contributionsDR and MLB were involved in the study’s conception
and design. DR, DBM, MEPC, DL, LM, LP, and MGM
were involved in data acquisition and analysis and, with
MLB, GOP, and CLS, data interpretation. DR wrote the
first draft of the article, and all authors revised it for
important intellectual content and approved the final
version for publication. DR is the guarantor of the study,
and all authors had full access to all of the data in the
study and take responsibility for the integrity of the data
and the accuracy of the data analysis.
Authorship statementThe manuscript has been read and approved by all the
authors, the requirements for authorship have been met,
and each author believes that the manuscript represents
honest work if that information is not provided in another
form.
Conflict of interest and funding
The study has been funded by the SDH unit of the WHO,
APW n.200934934, and by the Brasil Sem Miseria/Coordina-
tion for the Improvement of Higher Education Personnel
(CAPES) Fund. All authors declare no conflict of interest.
References
1. Pedrana L, Pamponet M, Costa F, Rasella D. Scoping review:
national monitoring frameworks for social determinants of
health and health equity. Glob Health Action 2016; 9: 28831,
doi: http://dx.doi.org/10.3402/gha.v9.28831
2. Commission on Social Determinants of Health (2008). Closing
the gap in a generation: health equity through action on the social
determinants of health: final report of the Commission on Social
Determinants of Health. Geneva: World Health Organization.
3. IPEA (2013). Duas decadas de desigualdade e pobreza no Brasil
medidas pela Pnad/IBGE. Brasilia: The Instituto de Pesquisa
Economica Aplicada.
4. IPEA (2011). A Decada Inclusiva (2001�2011): Desigualdade,
Pobreza e Polıticas de Renda. Brasilia: The Instituto de Pesquisa
Economica Aplicada.
5. IBGE (2013). Brazil in numbers, 2013. Brasilia: Instituto
Brasileiro de Geografia e Estatıstica.
6. Barreto ML, Teixeira MG, Bastos FI, Ximenes RA, Barata RB,
Rodrigues LC. Successes and failures in the control of infectious
diseases in Brazil: social and environmental context, policies,
interventions, and research needs. Lancet 2011; 377: 1877�89.
7. Victora CG, Barreto ML, do Carmo Leal M, Monteiro CA,
Schmidt MI, Paim J, et al. Health conditions and health-policy
innovations in Brazil: the way forward. Lancet 2011; 377:
2042�53.
8. Ministry of Health. Datasus. Available from: http://www2.
datasus.gov.br/ [cited 5 March 2015].
9. Schmidt MI, Duncan BB, Azevedo e Silva G, Menezes AM,
Monteiro CA, Barreto SM, et al. Chronic non-communicable
diseases in Brazil: burden and current challenges. Lancet 2011;
377: 1949�61.
10. Rasella D, Aquino R, Santos CA, Paes-Sousa R, Barreto ML.
Effect of a conditional cash transfer programme on childhood
mortality: a nationwide analysis of Brazilian municipalities.
Lancet 2013; 382: 57�64.
11. Barreto ML, Rasella D, Machado DB, Aquino R, Lima D, Garcia
LP, et al. Monitoring and evaluating progress towards universal
health coverage in Brazil. PLoS Med 2014; 11: e1001692.
12. Paim J, Travassos C, Almeida C, Bahia L, Macinko J. The
Brazilian health system: history, advances, and challenges. Lancet
2011; 377: 1778�97.
13. WHO (2013). Handbook on health inequality monitoring: with
a special focus on low- and middle-income countries. Geneva:
World Health Organization.
14. UN (2014). Sustainable Development Goals. Available from:
https://sustainabledevelopment.un.org/?menu�1300 [cited 15
September 2015].
Davide Rasella et al.
8(page number not for citation purpose)
Citation: Glob Health Action 2016, 9: 29042 - http://dx.doi.org/10.3402/gha.v9.29042

15. IBGE. National Household Sample Survey (PNAD). Available
from: http://www.ibge.gov.br/home/estatistica/pesquisas/pesquisa_
resultados.php?id_pesquisa�40 [cited 5 March 2015].
16. IBGE. National Demographic Census. Available from: http://
www.ibge.gov.br/english/estatistica/populacao/censo2010/ [cited
5 March 2015].
17. Ministry of Health. National Health Survey. Available from:
http://www.pns.icict.fiocruz.br/ [cited 5 March 2015].
18. Ministry of Health. National Program for Access and Quality
Improvement in Primary Care (PMAQ). Available from: http://
dab.saude.gov.br/portaldab/cidadao_pmaq2.php [cited 5 March
2015].
19. Ministry of Health. Mortality Information System. Available
from: http://datasus.saude.gov.br/sistemas-e-aplicativos/eventos-v/
sim-sistema-de-informacoes-de-mortalidade [cited 5 March 2015].
20. WHO. World Health Survey. Available from: http://apps.who.
int/healthinfo/systems/surveydata/index.php/catalog/116 [cited 5
March 2015].
21. MI, Matriz de Informacao Social. Available from: http://www.
mds.gov.br/gestaodainformacao/gestao-da-informacao/tipos-de-
ferramentas/matriz-de-informacao-social [cited May 2014].
22. Menezes WF, Dedecca CS. A Informalidade no Mercado de
Trabalho Brasileiro: Rendimentos e principais caracterısticas. Rev
Nexos Econ 2012; 7: 11�41.23. MP, Ministerio do Planejamento, Orcamento e Gestao Instituto
Brasileiro de Geografia e Estatıstica � IBGE Diretoria de
Pesquisas Coordenacao de Contas Nacionais. Contas Nacionais
numero 29. Tabela 20 � Despesa de consumo final da admin-
istracao publica com bens e servicos de saude � Brasil � 2005�2007.
24. Borges D. Vitimizacao e Sentimento de Inseguranca no Brasil
em 2010: Teoria, Analise e Contexto. Mediacoes Londrina 2013;
18: 141�63.
25. World Bank. Concentration index. Available from: http://
siteresources.worldbank.org/INTPAH/Resources/Publications/
459843-1195594469249/HealthEquityCh8.pdf [cited 5 March
2015].
26. Blas E, Ataguba JE, Huda TM, Bao GK, Rasella D, Gerecke
MR. The feasibility of measuring and monitoring social deter-
minants of health and the relevance for policy and programme �a qualitative assessment of four countries. Glob Health Action
2016; 9: 29002, doi: http://dx.doi.org/10.3402/gha.v9.29002
27. Assis MA, Jesus WA. Acesso aos servicos de saude: abordagens,
conceitos, polıticas e modelo de analise. Cien Saude Colet 2012;
17: 2865�75.
28. Kassouf AL. Acesso aos Servicos de Saude nas areas Urbana e
Rural do Brasil. Vol. 43. Rio de Janeiro: RER; 2005.
29. Oliveira E, Marilia SC, Travassos C. Territorios do Sistema
unico de Saude � mapeamento das redes de atencao hospitalar.
Cad Saude Publica 2004; 20: 386�402.
30. Starfield B. Atencao Primaria. Equilıbrio entre necessidades de
saude, servicos e tecnologia. 2nd ed. Brasılia: Ministerio da
Saude; 2004.
31. Rasella D, Aquino R, Barreto ML. Impact of the Family Health
Program on the quality of vital information and reduction of
child unattended deaths in Brazil: an ecological longitudinal
study. BMC Public Health 2010; 10: 380.
32. Gouveia GC, Souza WV, Luna CF, Souza PR, Szwarcwald CL.
Health care users’ satisfaction in Brazil. Vol. 21. Suppl 1. Rio de
Janeiro: Cadernos de Saude Publica; 2003.
33. Kalckmann S. Racismo institucional: um desafio para a
equidade no SUS?. Saude Soc 2007; 16: 146�55.
34. Fleury S. Desigualdades injustas: o contradireito a saude. Psicol
Soc 2011; 23: 45�52.35. Mattar LD, Diniz CG. Hierarquias reprodutivas: maternidade e
desigualdades no exercıcio de direitos humanos pelas mulheres.
Interface 2012; 16: 107�20.36. WEF (2013). Global gender gap report 2013. Davos: World
Economic Forum.
37. Travassos C, Martins M. Uma revisao sobre os conceitos de
acesso e utilizacao de servicos de saude. Cad Saude Publica
2004; 20(Suppl 2): S190�8.
38. Alves RFI. Genero e saude: O cuidar do homem em debate.
Psicol Teoria Prat 2011; 13: 152�66.
39. ECA (2001). Estatuto da crianca e do adolescente (ECA), Lei n.
8.069. Brasılia: ECA.
40. Otenio CCM, Otenio MH, Mariano ER. Polıticas publicas
para crianca no brasil: o contexto historico-social e da saude.
Estacao Cientıfica Online 2008; 6: 1�14.41. Passanezi PMS. Os investimentos em saude preventiva no Brasil
e seus efeitos na expansao do produto da economia. Saude
Colet 2007; 4: 124�30.
42. Paim JS, Teixeira CF. Planejamento e gestao em saude: balanco
do estado da arte. Rev Saude Publica 2006; 40: 73�8.
43. OECD, Eurostat, WHO (2011). A system of health accounts.
Paris: OECD Publishing.
44. Sousa MF, Hamann EM. Programa Saude da Famılia no Brasil:
uma agenda incompleta? Cien Saude Colet 2009; 14(Suppl 1):
1325�35.
45. Veras RP. Envelhecimento populacional contemporaneo: de-
mandas, desafios e inovacoes. Rev Saude Publica 2009; 43:
548�54.
46. Paiva FS, Stralen CV, Costa PA. Participacao social e saude
no Brasil: Revisao sistematica sobre o tema. Cien Saude Colet
2014; 19: 487�98.
47. Kon A. Mercado de trabalho, assimetrias de genero e polıticas
publicas: consideracoes teoricas. RP3 � Rev Pesquisa Polıt
Public 2013; 2: 33�58.48. Ribeiro MB. Desempenho e eficiencia do gasto publico: uma
analise comparativa entre o Brasil e um conjunto de paıses da
America Latina. Texto para discussao N8 1368. Rio de Janeiro:
IPEA; 2008.
49. TI (2013). Corruption perception index 2013. Berlin: Transparency
International.
50. Pinho JG. Investigando portais de governo eletronico de estados
no Brasil: muita tecnologia, pouca democracia. Rev Administr
Publica 2008; 3: 471�93.
51. Reichenheim ME, de Souza ER, Moraes CL, de Mello Jorge
MH, da Silva CM, de Souza Minayo MC. Violence and injuries
in Brazil: the effect, progress made, and challenges ahead.
Lancet 2011; 377: 1962�75.
52. Diniz AA. A geografia do medo, reflexoes sobre o sentimento de
inseguranca em Belo Horizonte. O Alferes Belo Horizonte 2003;
18: 119�33.
53. WHO, World Bank (2014). Monitoring progress towards universal
health coverage: framework, measures and targets. Geneva:
World Health Organization.
54. Choi BC, Pak AW. Multidisciplinarity, interdisciplinarity and
transdisciplinarity in health research, services, education and
policy: 1. Definitions, objectives, and evidence of effectiveness.
Clin Invest Med 2006; 29: 351�64.
55. Guanais FC. The combined effects of the expansion of primary
health care and conditional cash transfers on infant mortality
in Brazil, 1998�2010. Am J Public Health 2013; 103: 2000�6.
Assessing indicators in tracking determinants
Citation: Glob Health Action 2016, 9: 29042 - http://dx.doi.org/10.3402/gha.v9.29042 9(page number not for citation purpose)