monitoring investments for social inclusion-manuh.ppt
TRANSCRIPT

MONITORING INVESTMENTS FOR SOCIAL INCLUSION
S O C I A L D E V E LO P M E N T P O L I C Y D I V I S I O N ( S D P D )U N EC A , A D D I S A BA BA
2 7 - 2 9 M ay 2 0 1 5
Expert and Inter-Agency Technical Meeting on:IMPLEMENTATION OF THE SECOND UNITED
NATIONS DECADE FOR THE ERADICATION OF
POVERTY (2008-17)

Outline
� Background
� Paradox of Growth in Africa
� Inclusive development in Africa
� Status of external flows and FDI in Africa
� ODA and social investments
� Monitoring social investments through the ASDI
� Conclusion
2

The Paradox of Growth in Africa
� Growth in Africa has been strong since 2000 (about 4.5% on avg.); several countries are among the fastest growing in the world.
� This growth has not always led to more jobs, social progress, or reduction in inequality.
� There has been progress on poverty, but the number of people in poverty has increased.
� Growth has not had an impact –a transformative, inclusive effect – on people’s lives
350
370
390
410
430
450
470
490
1999 2001 2003 2005 2007 2009 2011 2014 2016 2018
Number of People in Poverty
GDP annual growth (selected regions)
3

Inclusive Development in Africa
� Like the developing world, countries in Africa characterised by
unemployment and under-employment – especially among the
youth, and increasing inequality.
� Demographic window of opportunity can become a challenge for
Africa as more than 12 million young people likely to join the labour
market per year in 2014-2024.
� Informal sector with low productivity, low wages and poor working
conditions often the only alternative to youth unemployment.
� Access to decent jobs and social protection necessary for inclusive,
equitable and sustainable development as emphasized in Agenda
2063.
4

Monitoring Social Investments
� Inclusive development - as envisioned in Africa 2063 –requires robust monitoring and evaluation mechanisms on the impact of social policies and investments.
� Monitoring improves information flows, effectiveness and mutual accountability of development interventions and investments
� But first, how is development financed in Africa?
5
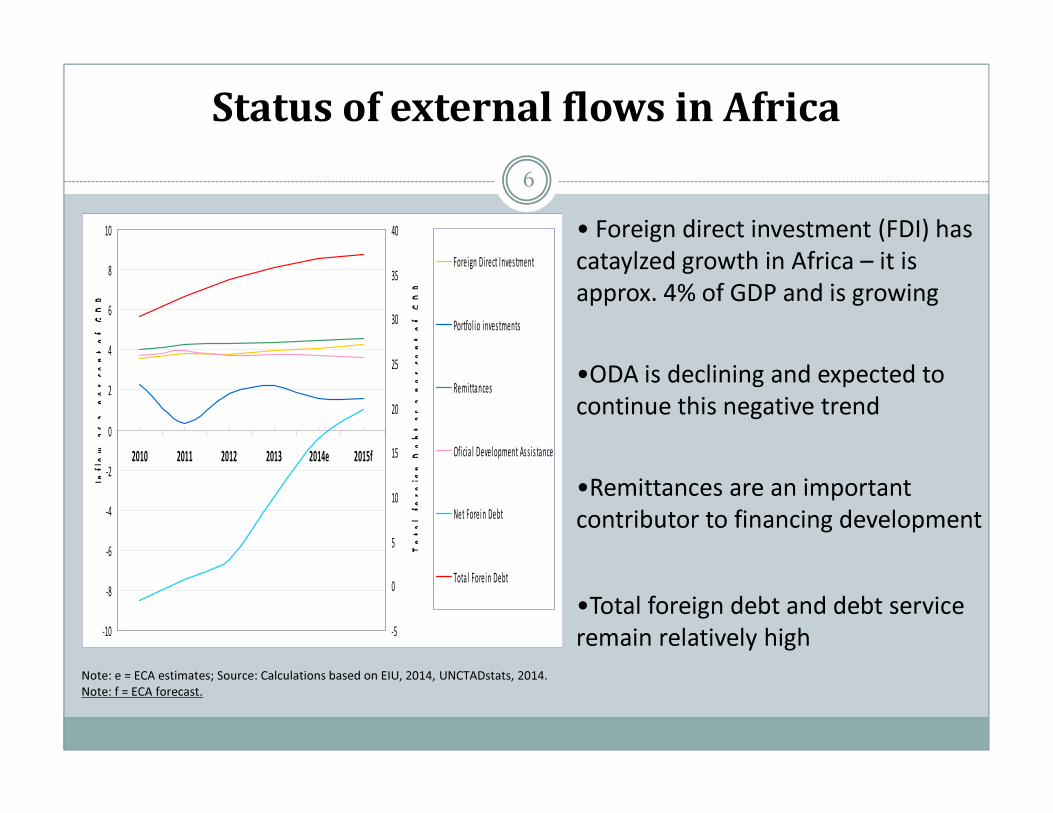
Status of external flows in Africa
-10
-8
-6
-4
-2
0
2
4
6
8
10
2010 2011 2012 2013 2014e 2015f
Infl
ow
as
a
pe
r ce
nt
of
GD
P
-5
0
5
10
15
20
25
30
35
40
To
tal
fo
reig
n D
eb
t a
s a
pe
r ce
nt
of
GD
P
Foreign Direct Inves tment
Portfol io inves tments
Re mittances
Ofi cia l Development Assi s tance
Net Forein De bt
Total Fore in Debt
• Foreign direct investment (FDI) has
cataylzed growth in Africa – it is
approx. 4% of GDP and is growing
•ODA is declining and expected to
continue this negative trend
•Remittances are an important
contributor to financing development
•Total foreign debt and debt service
remain relatively high
Note: e = ECA estimates; Source: Calculations based on EIU, 2014, UNCTADstats, 2014.
Note: f = ECA forecast.
6

Status of FDI in Africa
0
5
10
15
20
25
30
35
40
45
2005 2006 2007 2008 2009 2010 2011 2012 2013 2014 2015
FD
I a
s a
p
er
ce
nt
of
GD
P Non-oi l and Non-
minera l
Minera l -rich
Oi l Exporting
Oi l Importi ng
• FDI increasing, but skewed
towards mineral rich and oil
exporting countries
• Growth employment
elasticities less than 1 in many
countries – i.e. economic
growth has not created
enough jobs
• Social inclusion is limited and
policies for improved inclusion
are “residuals”Source: Calculations based on EIU, 2014,
7

ODA – Quantity and composition
0
5
10
15
20
25
30
Bot
swan
a
Bur
kina
Fas
o
Bur
undi
Cen
tral
Afr
ican
Cha
d
Eth
iopi
a
Leso
tho
Mal
awi
Mal
i
Nig
er
Rw
anda
Sou
thS
udan
Sw
azila
nd
Uga
nda
Zam
bia
Zim
babw
e
1990
2000
2012
•ODA is decreasing
relative to 1990, and
reflects a changing donor
landscape
•Aid to the African
continent fell by 5.6% to
USD 28.9 billion.
•Excluding debt relief, net
aid to sub-Saharan Africa
rose by 1.2% (in real
terms) but fell by about
1% in Africa as a whole.
Source: UNSD 2015 (Note: Missing data for Rwanda and Zimbabwe for 2012)
8

ODA – Quality and composition
� ODA is increasingly become MDG-oriented - in most African
countries, ODA exceeds 25% of government expenditure
� Education and health allocation among aid recipients has
remained stable since 2000 at around 8 and 6 percent
respectively
� Investment in public services has pushed school enrolment
figures up to nearly 80% on average and reversed HIV prevalence
in most African countries
� Still, lack of sufficient ownership by countries and most ODA
driven by an external agenda
9

Africa’s Agenda 2063: Based on the Guiding
Principles of SDGs
Agenda 2063
Achieving a prosperous,
inclusive and sustainable
development
Social development in
line with structural economic
transformation
Social development
central to development
planning
Leaving no one behind
Equity
Inclusion
Equality
Social cohesion
Post-2015 Common African Position
and the SDGs
NEED FOR MONITORING
POLICIES AND INVESTMENTS
10

Monitoring Investments in Africa
How can we ensure that
sufficient investments are
channelled and effective in
reducing exclusion and
implement inclusive
development policies?
The Marrakech Consensus
(9th ADF 2014) provides a
roadmap which can be
useful in the discussions
during the International
Conference on Financing
for Development (July
2015)
Reaffirm the value of the principles of the 2002 Monterrey Consensus and the Doha Declaration
Exploit the potential of the extractive industries to ensure that current and future generations benefit from resource earnings
Commit to using fiscal policies to address poverty and unemployment
Improve the necessary internal conditions for increasing domestic savings
Establish strong institutions and efficient regulatory and enforcement frameworks
Develop and implement innovative policies to encourage public-private partnerships
Explore ways to lower the cost of remittances, introduce diaspora Explore ways to lower the cost of remittances, introduce diaspora bonds, and employ insurance and pension funds for social
investments
A roadmap for““““Innovative Financing for Africa’s Transformation ””””
From the Marrakech Consensus, 9th African Development Forum (Oct 2014)
11

Monitoring Social Investments through the
ASDI
� The African Social Development Index (ASDI) developed to
measure exclusion and assess the impact of social policies and
investments. ASDI:
� A tool to identify the drivers of exclusion
� Maps out and improve the effectiveness of social policies
� Monitors/enhances investments in social sectors
� Social investments can be monitored through a policy mapping
exercise
12

Key features of the ASDI
Focused on exclusion/inclusion
Based on the life-cycle
Disaggregated by gender, location and sub -national levels
Anchored on Africa’s priorities
13

ASDI for Social Policy Mapping
Assess the “inclusiveness” of
social policies
Analyse the drivers of exclusion (improving targeting of social programmes)
Guide social budgeting at sub -
national levels
Enhance the impact of social
investments
ASDI
14

Application of the ASDI in Africa
� ASDI piloted in five countries: Cameroon, Kenya, Morocco,
Senegal and Zambia
� Roll-out underway in the rest of the region - through a series of
subregional training for national experts
Key Objectives:
� Build national capacities for tracking exclusion within countries
and groups of population
� Equip member States with a tool to monitor and enhance the
effectiveness of social policies and investments - at national and
subnational levels
15

Initial Results - Senegal
Historical trends, by sub-regions
� Overall, exclusion in Senegal has dropped by 21% between 2002 and 2011
� South and Central regions remain the most affected, but their situation
improved by 9 and 19% respectively
16

Initial Results - Morocco
The drivers of exclusion vary significantly across subgroups…
17
Unemployment is the most important driver of exclusion in urban
areas, while men face challenges with survival in infancy.
Conclusion
� Need to refocus the development agenda towards a more people-centered, inclusive and sustainable path
� Increase the quantum of domestic and foreign resources to social programmes
� Develop robust M&E mechanisms to carefully monitor social investments
� ASDI a useful tool to guide implementation and monitoring of Agenda 2063 and design of socially inclusive national policies.
18