monitoring of benthic effects of the wdc outfall outfall
TRANSCRIPT

BENTHIC EFFECTS MONITORING OF THE
WAIROA DISTRICT COUNCIL MUNICIPAL
WASTEWATER OUTFALL AT SITES IN THE LOWER
WAIROA ESTUARY: 2017 SURVEY.
MAY 2018
REPORT No: 17009
PROJECT No: TFN17005
[Triplefin, 2018:A3I1b]
Benthic effects monitoring of the Wairoa District
Council municipal wastewater outfall at sites in the
Lower Wairoa River Estuary, Hawke’s Bay: 2017
survey.
Report prepared by:
Shade Smith Prepared for:
Wairoa District Council.
May 2018
Triplefin report no. 17009
Triplefin Project No. TFN17005
© All rights reserved. This publication may not be reproduced or copied in any form without the permission
of the client. Such permission is to be given only in accordance with the terms of the clients contract with
Triplefin. This copyright extends to all forms of copying and storage of material in any kind of information
system.

MONITORING OF BENTHIC EFFECTS OF THE WDC OUTFALL DISCHARGE: 2017 SURVEY
PROJECT: TFN17005 REPORT STATUS: DRAFT
TABLE OF CONTENTS
1. INTRODUCTION ................................................................................................................................... 1 1.1 Background ..................................................................................................................................... 1 1.2 This study .......................................................................................................................................... 3 1.3 Receiving Environment ................................................................................................................. 3
2. SEDIMENT CHARACTERISTICS ............................................................................................................. 5 2.1 Introduction ..................................................................................................................................... 5 2.2 Methodology .................................................................................................................................. 5 2.3 Results ............................................................................................................................................... 7 2.3.1 Present survey ................................................................................................................................. 7 2.3.2 Temporal analyses ....................................................................................................................... 14 2.4 Summary ........................................................................................................................................ 18
3. BIOLOGICAL CHARACTERISTICS...................................................................................................... 20 3.1 Methodology ................................................................................................................................ 20 3.2 Results ............................................................................................................................................. 21 3.2.1 Present survey ............................................................................................................................... 21 3.2.2 Temporal analyses ....................................................................................................................... 24 3.3 Summary ........................................................................................................................................ 28
5. DISCUSSION ....................................................................................................................................... 30 Sediment characteristics .......................................................................................................................... 30 Biological characteristics ......................................................................................................................... 31
6. CONCLUSION .................................................................................................................................... 32
7. REFERENCES ....................................................................................................................................... 33
APPENDIX ONE .......................................................................................................................................... 35 Sampling sites ............................................................................................................................................. 35
APPENDIX TWO .......................................................................................................................................... 36 Sediment core profiles .............................................................................................................................. 36
APPENDIX THREE ........................................................................................................................................ 38 Site Apparent RDP layer depths ............................................................................................................. 38
APPENDIX FOUR ......................................................................................................................................... 39 Sediment texture, organic matter & trace element data ................................................................. 39
APPENDIX FIVE ........................................................................................................................................... 40 Infaunal data .............................................................................................................................................. 40
APPENDIX SIX ............................................................................................................................................. 41 Report Limitations ....................................................................................................................................... 41

MONITORING OF BENTHIC EFFECTS OF THE WDC OUTFALL DISCHARGE: 2017 SURVEY
PROJECT: TFN17005 REPORT STATUS: DRAFT PAGE: 1
1. INTRODUCTION Wairoa District Council (WDC) operates a municipal wastewater outfall 2.7km south of the
Wairoa town centre near the mouth of the Wairoa River. The outfall services the needs of some
2,200 properties and around 4,400 residents in the reticulated urban area of the Wairoa
township. The wastewater stream is largely from residential and light industry sources. However
infiltration of the wastewater reticulation network by stormwater and groundwater during and
after rainfall can significantly elevate flows. The only large industrial source of wastewater in the
town is from the AFFCO freezing works which has its own onsite treatment units and outfall into
the river at a site located approximately 2km upstream of the WDC outfall.
The reticulation network conveys wastewater to the Wairoa Wastewater Treatment Plant
(WWWTP) which consists of a two pond aerobic and anaerobic decomposition system. Built in
1981 the plant incorporates coarse screening (<5mm), prior to influent entering the oxidation
ponds. Pond 1 is a mixed primary pond which provides for facultative decomposition. The
second stage of treatment occurs in a larger primarily anaerobic pond (pond 2), where some
facultative decomposition occurs, but primarily pond 2 is described as a maturation pond.
From the elevated situation of the ponds at Pilot Hill the treated effluent exits the final stage
anaerobic pond and is gravity fed to the outfall discharge port. The discharge port is located at
or about E1982510 N5667389 (NZTM NZGD2000), in the sub-tidal area of the lower Wairoa River
Estuary, approximately 150m from the shoreline (opposite the entrance to Fitzroy Street, Wairoa)
and approximately 590 m north of the present location of the river mouth which opens into
northern Hawke Bay (Figure 1).
The outfall is constructed of high density black polyethylene (internal Ф 300mm) and has in the
past become buried in the sediment. In 2017 WDC attached a PVC riser to the outfall terminus
to ensure blockages of the outfall were minimised. The outfall discharge port is simply the
terminus of the outfall pipe. Effluent discharge occurs into the overlying water column, which
during typical discharge conditions (i.e. during ebb tide beginning 30mins after high tide and
between 6pm and 6am) varies in depth between 1 – 2m. The area immediately above the
outfall terminus is termed the ‘boil’ given that the upwelling wastewater can at times be visible
at the water’s surface.
1.1 BACKGROUND WDC currently holds consent (CD940404W), to discharge treated municipal wastewater into the
Lower Wairoa River Estuary. Although the consent does not specifically address monitoring of
the receiving environment three surveys, including the present one, have been carried out to
assess the effect of treated wastewater discharge on macrobenthos and sediments around the
outfall since 2007.
In April 2007 an assessment of ecological effects, incorporating high resolution dye dilution
studies and a benthic survey and assessment of flatfish tissue was undertaken (Barter 2007; Smith
2007). In June of 2011 another benthic survey and assessment of effects on the receiving
environment from the discharge was conducted (Smith 2011).
Prior to these studies the estuarine/riverine environment in the vicinity of the WDC outfall had
been the subject of only a limited number of studies over the last 20 years. These include a
coarse dye dilution study, and benthic and water quality surveys in 1996 at sites around the
WWTP outfall (Larcombe 1996). In an attempt to disentangle the effects of upstream discharges
from that of the WDC outfall a dye dilution study, benthic and water quality assessment around
the AFFCO freezing works outfall was also conducted around the same time (Larcombe 1996).
Aside from the confounding effects of the AFFCO outfall on downstream assessments there are
a number of other problems that have been identified by WDC with the outfall and associated
WWTP and reticulation network. As mentioned above the outfall terminus has at times become
covered in sediment and blocked, leading to the fitting of a short extension in May 2017.
Another key issue is the occasional restriction of the estuary mouth, which can become partially

MONITORING OF BENTHIC EFFECTS OF THE WDC OUTFALL DISCHARGE: 2017 SURVEY
PROJECT: TFN17005 REPORT STATUS: DRAFT PAGE: 2
or fully blocked heavily restricting river discharge into Hawke Bay. This generally occurs during
heavy sea conditions when the shingle bar is built up particularly during easterly generated
swell. Although the consent requires WDC to store effluent during these periods the WWTP
storage capacity is often exceeded and thus effluent has to be discharged into the estuary
during these ‘restricted flow’ conditions.
FIGURE 1: OVERVIEW OF THE LOWER WAIROA RIVER ESTUARY SHOWING THE LOCATIONS OF BENTHIC MONITORING SITES AROUND THE OUTFALL AND THE LOCATION OF THE RIVERMOUTH ON THE DAY OF SURVEY. (INSET: OUTFALL TERMINUS AT LOW TIDE ON THE DAY OF SURVEY).
The other key issue relates to the WWTP storage capacity being occasionally exceeded, largely
as a result of infiltration of the aging reticulated wastewater network by stormwater and shallow
groundwater. WDC records indicate a spike in flows during and immediately after rainfall
events, with a study of infiltration indicating elevated flows of up to 2.4x normal up to six days
following the cessation of rainfall (EAM 2011). This additional loading can overload the WWTP
decreasing treatment efficacy and increasing the risk of flooding at the treatment ponds and
consequently the potential for the discharge of treated wastewater into the estuary outside
operational resource consent conditions. The potential effects on human health from a worst
case scenario for outfall discharge, i.e. under ‘restricted flow’ conditions where the estuary
mouth is partially or fully blocked, was undertaken as part of the dye study in 2007.
During this worst case scenario the treated wastewater plume does not disperse and remains
close to the ‘boil’ with minimal transport, and effected only by wind. Dilutions of 5:1 at the ‘boil’
where typical while the plume moved only a maximum of 150m from the ‘boil’ (Barter 2007).
Under these conditions there is a significant human health risk when using the lower estuary for
contact recreation, especially if these conditions persist for an extended period of time. A

MONITORING OF BENTHIC EFFECTS OF THE WDC OUTFALL DISCHARGE: 2017 SURVEY
PROJECT: TFN17005 REPORT STATUS: DRAFT PAGE: 3
second dye study under normal flow conditions (i.e. where the estuary mouth was not blocked)
indicated wastewater dilutions were 5:1 at the ‘boil’, 50:1 at 125m downstream and 250:1 at
350m downstream (Barter 2007). Under these conditions, wastewater exits the estuary in a
relatively short timeframe with the risk to human health moderate during discharge and less than
minor at other times.
In terms of benthic effects, the 1996 survey found that the discharge had “no obvious effects on
benthic biology or sediment quality” although nutrient enrichment of sediments was suggested
as likely during ‘restricted flow’ conditions (Larcombe 1996). The 2007 survey found that
“discharge effects on benthic infaunal communities around the outfall are evident, and may
continue to alter composition over time” and that “sediments at sites around the outfall have
declined in quality over time”. The 2007 survey also included an examination of trace metal
concentrations in flatfish tissue, and found that levels were well within food safety limits with no
evidence of accumulation. Overall, it was considered the scale of effects from the discharge
were within the assimilative capacity of the receiving environment and that the presence of a
sensitive bivalve species, pipi (Paphies australis), at sites around the outfall suggested effects
were not large enough to constitute an undue adverse effect. In the 2011 survey and
assessment there was “…no indication of a discharge related effect, and results (sediment
texture and chemistry) are similar to those observed at the upstream reference site, site C”, while
“assessment and analysis of the biota living in the sediments surrounding the outfall did not
detect any significant differences in the community assemblages between sites suggesting that
the outfall discharge has a limited influence on community structure”.
1.2 THIS STUDY To assess the effects of the treated wastewater discharge on the macrobenthos and physical
environment at monitoring sites surrounding the outfall (Figure 1), WDC engaged Triplefin
Environmental Consulting (Triplefin) to conduct a benthic survey of the receiving environment
including the following components:
Assessment of apparent redox depth of sediment cores, surficial sediment texture,
organic content, trace elements including nutrient levels at outfall monitoring sites and at
a suitable reference site.
Assessment of benthic macroinfaunal communities at outfall monitoring sites and at a
suitable reference site.
This report presents the findings of field survey work conducted in June 2017, subsequent data
analyses, comparison to previous survey results and an assessment of effects. Previous surveys of
the area around the existing outfall are referred to continuously throughout this report to provide
a comparison to the present findings.
Where possible, the methods used in this survey were in keeping with those used in previous
surveys. All methods used are fully detailed in the respective sections of this report.
1.3 RECEIVING ENVIRONMENT The Wairoa River Estuary is commonly referred to as a barrier enclosed lagoon or drowned valley
and is classified, according to the New Zealand estuary classification system (Hume, Snelder et
al. 2007), as a category F estuary. Category F estuaries are characterised by a spit or shingle bar
enclosing a large primary basin from which numerous arms lead off. This system gives rise to
complex shoreline structure and supports extensive intertidal areas cut by deep channels. Wind
mixing and wave driven re-suspension of sediments is generally minor given the limited fetch.
Sediments tend to be muddier in the arms and sandier in the primary basin. The volume of river
flow delivered over a tidal cycle is typically small compared to the total volume of the basin,
and is generally less than the tidal volume entering the basin. Thus hydrodynamic processes
tend to be dominated by the tides, meaning that these estuaries are moderately to poorly
flushed.

MONITORING OF BENTHIC EFFECTS OF THE WDC OUTFALL DISCHARGE: 2017 SURVEY
PROJECT: TFN17005 REPORT STATUS: DRAFT PAGE: 4
In terms of wildlife and conservation values, the estuary and associated lagoons, the Ngamotu
(western lagoon), and Whakamahi (eastern lagoon) are part of the nationally significant
wetland lagoon system that stretches for 20km from the Whakamahi lagoon to the Whakaki
lagoon (Seymour, Hogan et al. 1990). This system is the largest of its type in Hawke’s Bay and
supports endangered, threatened and rare species of wildlife. The expansive estuarine area
enclosed within the unstable shingle bar at the mouth is approximately 200 Ha and includes
extensive intertidal areas including large areas of permanent open water, ephemeral wetlands
and intertidal mudflat habitat (approximately 81ha). This variety of habitat conditions
consequently provide for recognised high biodiversity and Protected Natural Area (PNA) values
(Seymour, Hogan et al. 1990). Formal protective designations include the Ngamotu Lagoon
being a gazetted wildlife management reserve while the Whakamahi Lagoon is a conservation
area managed by DOC (Seymour, Hogan et al. 1990).
Protected species occupying these habitats include the endangered white heron (Egretta alba
modesta), the threatened banded dotterell (Charadrus bicincta bicincta) and the rare golden
plover (Pluvialis fulva) (Seymour, Hogan et al. 1990). Migrant waders e.g. royal spoonbills
(Platelea regia) also occur ephemerally in small numbers. The fisheries values of the estuary are
also significant, particularly in terms of Anguilla sp. (eels), yellow-bellied flounder (Rhombosolea
leporina), grey mullet (Mugil cephalus) and Galaxias sp (whitebait) especially inanga (Galaxia
maculata).
Within the immediate surrounds of the outfall the environment is characterised as intertidal going
to shallow subtidal mudflat, with the outfall located at or about Mean Low Water Springs (MLWS)
and approximately 40m shoreward of the edge of the main channel.
Relevant literature that discusses the benthic habitat and epifauna of the area includes previous
monitoring reports and data produced as part of the HBRC Estuarine State of the Environment
(ESoE) monitoring program. Since 2010 the HBRC has monitored a site located approximately
600m upstream of the outfall for sediment and infaunal characteristics. These studies reveal a
substratum predominantly comprised of sandy mud with some areas muddier and others
sandier. Upstream of the outfall the intertidal flats are characterised by rippled muddy sand,
while downstream of the outfall the substratum is muddier and rippling is absent. These
sediments support a moderately diverse array of infaunal and epifaunal organisms, including
polychaete worms, various bivalve and gastropod species, and small crustacea, particularly
Corophid amphipods, and are indicative of a low energy, low salinity estuarine setting.
Complex habitat is limited with the occasional large tree or tree limb held fast in the mud
providing some complex 3D structure.

MONITORING OF BENTHIC EFFECTS OF THE NCC OUTFALL DISCHARGE: 2016 SURVEY
PROJECT: TFN17005 REPORT STATUS: DRAFT PAGE: 5
2. SEDIMENT CHARACTERISTICS 2.1 INTRODUCTION Sediment characteristics can influence the distribution of benthic (bottom dwelling)
invertebrates by affecting the ability of various species to burrow, build tubes or feed. In
addition, demersal fish (fish that live on or near the bottom) are often associated with specific
sediment types that reflect the habitats of their preferred prey. Both natural and anthropogenic
factors affect the distribution, stability, quality and composition of sediments. Outfalls are one of
many human derived (anthropogenic) factors that can directly influence the composition and
distribution of sediments, and this occurs through the discharge of wastewater and subsequent
deposition of a variety of compounds. In discharges from municipal wastewater treatment
plants of the type WDC operate the most common effects result from input of fine sediment,
predominantly as organic carbon, in the form of biosolids. Other contaminants of concern are
volatile organic compounds, trace elements and bacterial and viral biomass. Moreover, the
presence of outfall pipes or associated structures can alter the hydrodynamic regime in the
immediate area surrounding the outfall.
This section presents a summary and analysis of sediment composition (grain size), organic
matter and trace metal data collected in June 2017 in the vicinity of the WDC outfall. The aim is
to assess the distribution and magnitude of any effects on sediments from the treated
wastewater discharge.
2.2 METHODOLOGY
SAMPLING SITES The location of sampling sites in the present survey were consistent with those sampled in
previous surveys in 1996, 2007 and 2011, with the exception of site D, which has not been
sampled previously and was included in the present survey (Figure 1, Appendix 1). Therefore,
three “impact‟ sites were sampled, located in close proximity to the terminus of the outfall
consisting of site A; approximately 100m south-west or downstream, site B; approximately 100m
north-east or upstream of the outfall, site D 100m north-west, or inshore, of the outfall and a
control, or “reference‟ site, site C; approximately 500m north-east of the outfall. These sites are
deemed representative of the benthic environment surrounding the outfall while the pattern of
their siting, allows adequate detection of the magnitude of outfall related effects in sediments.
METHODOLOGY A handheld GPS unit was used to locate each site (± 3m). Samples were collected at low tide
on the 29th June 2017. At each site, five haphazardly selected replicate sediment cores were
collected using a PVC 60mm (internal Ф) x 150mm long corer. Cores were collected by pushing
the corer into the sediment to a depth of 150mm and digging down the outside of the corer
and placing a hand over the bottom of the corer when extracting the core from the
surrounding sediment in order to maintain the integrity of the core profile. Cores were then
ejected onto a clean white tray and split vertically. Each core was visually assessed for the
presence/absence of anoxic areas within the core and the apparent Redox Potential
Discontinuity (aRPD) layer1 measured. Cores were then photographed and the top 2cm of
sediment from each half of the core placed into separate pre-labelled resealable plastic bags
and immediately stored on ice. Each replicate sediment core was analysed for chemical
composition, while the sediment texture samples from each site were composited, and a single
sub sample prepared for analysis. The samples for organic matter assessment, trace elements
and nutrients were analysed by Hill laboratories, Hamilton, while the sediment texture samples
were analysed in-house. A summary of the analytical methods used are presented in Table 1.
1apparent Redox Potential Discontinuity (aRPD) layer - the brown coloured, oxygenated surface layer of sediments,
distinct from the black anoxic layer beneath. Few macrobenthic species are able to live in anoxic sediments without
some form of burrow, tube or respiratory siphon extended into the overlying sediments or water column.

MONITORING OF BENTHIC EFFECTS OF THE WDC OUTFALL DISCHARGE: 2017 SURVEY
PROJECT: TFN17005 REPORT STATUS: DRAFT PAGE: 6
Table 1: Summary of analytical methods used for sediment analyses
Parameter Method Description
Total recoverable elements
As,Cd,Cr,Cu,Hg,Ni,Pb,Zn Dry/sieve sample, Digestion
US EPA 200.2 Total recoverable metals
As,Cd,Cr,Cu,Hg,Ni,Pb,Zn
Texture Wet sieving, gravimetric, Air
drying 105°C overnight
Gravel >2mm
Very Coarse Sand 1mm - 2mm
Coarse Sand 500µm - 1mm
Medium Sand 250µm - 500µm
Fine Sand 125µm - 250µm
Very Fine Sand 63µm - 125µm
Silt and Clay <63µm
Total Recoverable P USEPA 200.2 Dried sample, sieved as specified (if
required). Nitric/Hydrochloric acid
digestion, ICP-MS, screen level.
Total N
Catalytic Combustion (900°C, O2),
separation, Thermal Conductivity
Detector [Elementar Analyser].
Total volatile solids (organic
matter) USEPA 2540 G 22nd ed. 2012
Ash - dried at 103°C. Ignition in muffle
furnace 550°C, 1hr, gravimetric, TVS -
calculation: 100 - Ash (dry wt).
DATA ANALYSIS Trace element results were firstly compared against national sediment quality guidelines
(ANZECC 2000) to assess relative toxicity and contamination status. These Interim Sediment
Quality Guidelines (ISQG) consist of upper (ISQG-high) and lower (ISQG-low) thresholds above
which biological effects can be expected. Where trace metal concentrations are below ISQG-
low values then adverse biological effects are expected only on rare occasions. Trace metal
concentrations falling between ISQG-low and ISQG-high are expected to cause adverse
biological effects occasionally, while a result above the ISQG-high would be expected to cause
adverse biological effects frequently. Currently there are no guidelines for assessing the effects
of sediment-bound nutrient contaminants such as nitrogen or phosphorus, on the environment. If
there are no obvious signs of enrichment at a site it may be difficult to assess a particular site for
the effects of enrichment. Therefore concentrations of these contaminants were compared
against other local and national reference sites.
In areas where anthropogenic influences are negligible, sediment trace element concentrations
largely reflect the surrounding geology. Sediments formed under these conditions, contain
trace elements at levels described as ‘baseline/background concentrations. Therefore trace
elements were also compared against a set of relevant trace metal “Regional Background
Concentration” (RBC) levels (Strong 2005). The RBC’s were derived from sediment trace metal
levels at 17 study areas, comprising 67 sites, located throughout Hawke’s Bay’s estuarine, riverine
and lagoon systems. The RBC’s provide a relevant regional basis for assessing the impact of a
particular activity on sediment quality.
Concentrations of certain elements, particularly metals, vary according to sediment properties2.
Thus, normalization of metal concentrations is usually needed to differentiate between natural
variability and anthropogenic input of contaminants. A commonly employed normalisation
method for coastal marine and estuarine sediments is to normalise elemental constituents to the
2 Trace metals have been shown to preferentially adhere to fine sediments in the silt/clay fraction that have reactive
surface properties. Therefore, differences in trace metal concentrations between sites may simply reflect differences in
the proportion of sediments in this fraction. Normalising sediment contaminant data allows standardisation of sediment
contaminants to sediment composition.

MONITORING OF BENTHIC EFFECTS OF THE WDC OUTFALL DISCHARGE: 2017 SURVEY
PROJECT: TFN17005 REPORT STATUS: DRAFT PAGE: 7
silt/clay (‘fines’) fraction of the sediment. Thus for spatial and temporal analyses of trace
element levels data were normalised to the percentage of fines found at each site.
Spatial differences in sediment characteristics (texture, normalised TVS, normalised trace
elements including P and N) between sites in the present survey were explored using one way
ANOVA (StatSoft 2004). Results were reported as significantly different when p-values were <5%
(i.e. testing at the 95% level of significance). The assumption of homogeneity of variance for
ANOVA was checked using Levene’s test. Tukey’s HSD tests were used to assess differences
between sites for each parameter. Results below detection limits were included in analyses at
half detection limits in order to calculate means and standard errors.
To compare TVS data against the previous 1996 study the values for % organic carbon
presented in the 1996 report had to be converted to % organic matter, or TVS, by multiplying by
1.724 (Metson, Saunders et al. 1971) before normalising.
Temporal analyses of sediment texture, organic matter content, and trace elements (within sites)
were conducted using the non-parametric Mann-Kendall trend test (NIWA 2008). Trends in
sediment characteristics were examined by computing a Mann-Kendall statistic, S, and
associated p-value. Trends were considered to be significantly positive (i.e. increasing with time)
or negative (i.e. decreasing with time) if the probability (two-sided p-value) of rejecting a
correct hypothesis (in this case, no trend) was ≤ 0.05. Statistically significant trends were
considered to be ecologically meaningful if the difference was more than 1% of the median
value per annum.
For analyses of sediment texture the all sand fractions and the clay/silt fraction were tested while
for analyses of trace elements, TVS, N & P the normalised levels for each site and year were
calculated.
2.3 RESULTS
2.3.1 PRESENT SURVEY Observations of the physical characteristics of benthic monitoring sites B, C and D were able to
be made given they were uncovered at low tide, whereas site A remained covered by the tide
to a depth of 0.6m throughout. Among sites B, C, and D the sediment surface had
characteristic muddy sand ripples, oriented parallel to shore with the distance between peaks
approximately 10cm.
SEDIMENT CORE PROFILES & REDOX STATUS Photos of sediment core profiles showing aRDP depths are presented in Appendices 2 and 3.
Cores were assessed for evidence of an outfall impact (e.g. colour, sheen, and odour) and the
depth of the aRDP was measured.
At site A core profiles were fairly consistent with the aRDP layer depth very shallow among all
cores (Table 2). In general site A cores were characterised by a muddy, organically rich,
oxygenated layer of light brown sediment down to the aRDP layer depth. In the core photos,
this layer is apparent as a light brown slurry at the top of the core that was not able to maintain
its shape upon ejection of the core from the corer. Below the aRDP layer depth, sediments had
a slightly blackened colour without sheen and a slight hydrogen sulphide odour was evident.
Below the blackened layer sediments were dark grey coloured. These characteristics indicate
sediments at site A are hypoxic, or poorly oxygenated, at shallow depths and potentially anoxic
in places.
At site B core profiles were also consistent throughout the site with little variability in the aRDP
layer depth (Table 2). Site B sediments were characterised as sandy, with a light grey slightly
hypoxic zone down to the aRDP layer depth. No hydrogen sulphide odour was evident. Below
this layer sediments were light brown in colour. These characteristics indicate moderate
oxygenation to deeper layers of sediments.

MONITORING OF BENTHIC EFFECTS OF THE WDC OUTFALL DISCHARGE: 2017 SURVEY
PROJECT: TFN17005 REPORT STATUS: DRAFT PAGE: 8
At site D core profiles were more variable among replicates than sites A and B, though the
average depth of the aRDP layer was similar to site B (Table 2). Despite the variability there were
some general characteristics of core profiles noted, including the presence of a light grey layer
of muddy sand at the surface, down to the aRDP layer depth. Below this sediments were
variously light brown and light grey. However, among selected sites there was a distinctive
blackened sediment layer, with light/dark grey sediments below. This layer occurred at various
depths, and is likely the result of past accumulation of organic material at the surface that has
been subsequently buried (e.g. sites D1, D2 and D5). No hydrogen sulphide odour was evident
throughout the cores. These characteristics indicate moderate oxygenation of sediments to
shallow depths with sediments below likely hypoxic.
At the upstream reference site C core profiles were similar among replicates with a fairly shallow
aRDP depth. Despite surficial sediments being muddy and a shallow aRDP layer depth
sediments were largely light or dark grey coloured with patches of blackened sediments in
selected cores, e.g. C1 and C5. This was the only site where infaunal tubes were apparent, with
each signalled by a thin rust coloured lining to the tube. There was no hydrogen sulphide odour
detected among cores. These characters indicate sediments are poorly to moderately
oxygenated.
Table 2: Mean depth of the redox potential discontinuity layer (RDPL) at WDC outfall monitoring sites (± 1 SE)
Site RPDL depth (cm) Sediment matrix
A 1.9 ± 0.1 Sandy mud
B 5.6 ± 0.4 Sand
C 2.6 ± 0.4 Sandy mud
D 5.7 ± 1.8 Muddy sand
Given the distinct differences in core profile characters among sites, it was not surprising that a
one-way ANOVA comparing aRDP layer depths detected a significant difference among sites.
However, post hoc Tukey’s HSD tests did not detect which sites accounted for the difference.
This suggests the strength of the overall among site difference was weak.
In general these results suggest that sites close to the outfall, and predominantly downstream
and inshore, have reduced levels of oxygenation of sediments, which is likely a result of exposure
to higher levels of deposited organic matter. The response to increased deposition of organic
material differs among sites, with material at site D subjected to reworking and, or burial by
currents, wave/tidal action and bioturbation, while at site A this material appears to be
accumulating at the sediment surface.
SEDIMENT TEXTURE Sediment texture data are detailed in Appendix 4. These show that surficial sediments at site A
and reference site C were very similar in terms of composition with sites comprised primarily of
silt/clay (‘fines’ or mud) (<63µm), with a secondary very fine sand fraction (63 – 125µm) and a
subsidiary fine sand fraction (125 – 250µm)(Figure 2). In contrast site B was composed of sand,
and primarily of fine sand, with a secondary very fine sand fraction and a small amount of fines.
Compared to the other sites, sediments at site D were more evenly distributed among the
various fractions, with approximately equal levels of fines and fine sand with the remainder very
fine sand.

MONITORING OF BENTHIC EFFECTS OF THE WDC OUTFALL DISCHARGE: 2017 SURVEY
PROJECT: TFN17005 REPORT STATUS: DRAFT PAGE: 9
Site A Site B Site C Site D
se
dim
en
t (%
dw
)
0
20
40
60
80
100
Gravel >2mm
Very Coarse Sand 1.18mm - 2mm
Coarse Sand 500µm - 1.18mm
Medium Sand 250µm - 500µm
Fine Sand 125µm - 250µm
Very Fine Sand 63µm - 125µm
Silt/clay <63µm
FIGURE 2: COMPARISON OF SEDIMENT TEXTURE AMONG WDC OUTFALL MONITORING SITES A, B, D (‘IMPACT’) AND C (‘REFERENCE’) DURING THE PRESENT (2017) SURVEY.
SEDIMENT TRACE ELEMENTS The focus of this section is on concentrations of chemical elements: arsenic (As), cadmium (Cd),
chromium (Cr), copper (Cu), mercury (Hg), nickel (Ni), lead (Pb) and zinc (Zn). These elements
are often referred to as ‘heavy metals.’ However, given its ambiguity, e.g. arsenic is not
regarded as a true metal, but a metalloid, the term ‘trace elements’ is used.
Concentrations of sediment trace elements are detailed in Appendix 4 and plotted by site in
Figure 3. It should be noted that concentrations of Cd at site A (replicate A5) and site D
replicates 3, 4, 5) were below laboratory detection limits of 0.1mg/kg. These detection limits
were an order of magnitude higher than those for other samples. The reason for the increased
detection limit was the requirement for a dilution as a result of matrix interference on Cd for
these samples.
Comparison of levels to relevant national sediment quality guidelines (ANZECC 2000) showed
that concentrations at all sites were well below ANZECC ISQG – Low sediment quality guidelines
(Figure 3). At these levels the contaminant load at each site would rarely be expected to
induce adverse biological effects, with all sites not considered to be contaminated. It is worth
noting that the elevated level of Hg at site D is the result of an unusually high record in replicate
D1 (0.67 mg/kg). The reason for this outlier is not clear.
It should also be noted that the ANZECC (2000) guidelines are designed to protect aquatic
ecosystems rather than to protect human health. Although ISQG – Low values are lower than
equivalent soil quality guidelines designed to protect human health, the aim of this study and
the guidelines used in this study are related to the protection of aquatic ecosystems rather than
human health.
The results were also compared to a set of relevant regional sediment background levels (RBC’s)
developed for estuarine/lagoon environments in Hawke’s Bay (Strong 2005) (Figure 3). In
general, concentrations of trace elements were below or within the confidence limits of
background levels. The exception was Ni, which was slightly elevated at site A and C
compared to the relevant Ni RBC.

MONITORING OF BENTHIC EFFECTS OF THE WDC OUTFALL DISCHARGE: 2017 SURVEY
PROJECT: TFN17005 REPORT STATUS: DRAFT PAGE: 10
Site A Site B Site C Site D
Ars
en
ic (
mg
/kg
) +
/- s
e
0
1
2
3
4
Site A Site B Site C Site D
Le
ad
(m
g/k
g)
+/-
se
0
2
4
6
8
10
12
Site A Site B Site C Site D
Zin
c (
mg
/kg
) +
/- s
e
0
20
40
60
80
Site A Site B Site C Site D
Ca
dm
ium
(m
g/k
g)
+/-
se
0.00
0.02
0.04
0.06
0.08
0.10
Site A Site B Site C Site D
Ch
rom
ium
(m
g/k
g)
+/-
se
0
5
10
15
20
Site A Site B Site C Site D
Co
pp
er
(mg
/kg
) +
/- s
e
0
2
4
6
8
10
12
Site A Site B Site C Site D
Nic
ke
l (m
g/k
g)
+/-
se
0
2
4
6
8
10
12
14
16
ISQG-Low: 1.5mg/kg ISQG- Low: 80mg/kg
ISQG-Low: 65mg/kg ISQG-Low: 21mg/kg
ISQG-Low: 50mg/kg ISQG-Low: 200mg/kg
ISQG-Low: 20mg/kg
Site A Site B Site C Site D
Me
rcu
ry (
mg
/kg
) +
/- s
e
0.00
0.05
0.10
0.15
0.20
0.25
0.30ISQG-Low: 0.15mg/kg
RBC-mean: 9.08mg/kg RBC-mean: 50.9mg/kg
RBC-mean: 0.07mg/kg RBC-mean: 17.3mg/kg
RBC-mean: 9.08mg/kg RBC-mean: 12.3mg/kg
RBC-mean: 3.23mg/kg no RBC available
FIGURE 3: SEDIMENT TRACE ELEMENT CONCENTRATIONS AMONG WDC OUTFALL MONITORING SITES DURING THE PRESENT (2017) SURVEY. RELEVANT ANZECC ISQG TRIGGER LEVELS AND HAWKE’S BAY REGIONAL BACKGROUND CONCENTRATION (RBC) LEVELS OF TRACE ELEMENTS FOR ESTUARINE AND LAGOON SYSTEMS (± 95%CI) ALSO SHOWN FOR EACH RESPECTIVE PLOT (STRONG 2005). RESULTS EXPRESSED ON A DRY WEIGHT BASIS.

MONITORING OF BENTHIC EFFECTS OF THE NCC OUTFALL DISCHARGE: 2016 SURVEY
PROJECT: TFN17005 REPORT STATUS: DRAFT PAGE: 11
SEDIMENT TRACE ELEMENTS – COMPARISON BETWEEN SITES Using normalised log10 transformed data, the comparison between sites estimated few
significant differences, with the exception being site B which had significantly higher normalised
levels of all trace elements compared to all other sites and site D which was significantly higher
in Zn, Cr and Ni than sites A and C (Figure 3). These results however, are likely an artefact of the
normalisation process wherein moderate trace element levels and a comparatively small ‘fines’
fraction result in high normalised levels. With this in mind it is worth noting that the two sites with
very similar levels of fines, i.e. site A and site C, and for which comparison of normalised levels is
meaningful, there was no significant differences detected. An alternative normalisation process
that will provide for meaningful comparison among all sites is to conduct analyses on the sieved
<63µm fraction, however it should be noted that these additional analyses will increase
laboratory costs.
In general the results
suggest sediments are not
contaminated by trace
elements, with levels
immediately downstream
of the outfall, i.e. at site A,
no different to those found
at the upstream reference
site C. Moreover, given
the effect on analyses
from artefacts of the
normalisation procedure,
it is recommended that in
future specific monitoring
of trace element levels
associated with the 63µm
(fines) fraction to verify
these observations is
recommended.
FIGURE 4: COMPARISON OF TRACE ELEMENT LEVELS NORMALISED TO 100% OF THE ‘FINES’ (SILT/CLAY OR MUD) CONTENT AMONG WDC OUTFALL MONITORING SITES DURING THE PRESENT SURVEY (2017). FOR A GIVEN ELEMENT BARS WITH THE SAME LETTER ARE NOT SIGNIFICANTLY DIFFERENT AT α = 0.05
Site A Site B Site C Site D
no
rmalis
ed
N
ickel (+
/- s
e)
0
20
40
60
80
100
120
Site A Site B Site C Site D
no
rmalis
ed
C
hro
miu
m (
+/-
se
)
0
20
40
60
80
100
Site A Site B Site C Site Dno
rmalis
ed
Z
inc (
+/-
se)
0
100
200
300
400
Site A Site B Site C Site D
no
rmalis
ed
Le
ad
(+
/- s
e)
0
10
20
30
40
50
60
70
Site A Site B Site C Site D
no
rmalis
ed
C
adm
ium
(+
/- s
e)
0.00
0.05
0.10
0.15
0.20
0.25
0.30
0.35
Site A Site B Site C Site D
no
rmalis
ed
C
opp
er
(+/-
se)
0
10
20
30
40
50
Site A Site B Site C Site D
no
rmalis
ed
A
rsen
ic (
+/-
se)
0
5
10
15
20
25
30
35
Site A Site B Site C Site D
no
rmalis
ed
Merc
ury
(+
/- s
e)
0.0
0.2
0.4
0.6
0.8
b
b
b
b
b
aa a
a
cc
a a a
a aa
b
a
cc
b
a
cc
a aa
a
a a
a

MONITORING OF BENTHIC EFFECTS OF THE WDC OUTFALL DISCHARGE: 2017 SURVEY
PROJECT: TFN17005 REPORT STATUS: DRAFT PAGE: 12
SEDIMENT NUTRIENTS Concentrations of sediment nutrient species nitrogen (N) and phosphorus (P) are detailed in
Appendix 4 and plotted by site in Figure 5.
Although there are no New Zealand national sediment quality guidelines to compare against,
from experience working in Hawke’s Bay estuaries and waterways, it is typical to consider sites
with phosphorus concentrations between 200-500mg/kg as low-moderately enriched, while
levels between 500-1000mg/kg sites are considered enriched, and highly enriched for levels
>1000mg/kg. In terms of total nitrogen, sites with levels between 0.05-0.2g/100g are viewed as
low-moderately enriched while those with levels between 0.2-0.4g/100g are enriched and
above 0.4g/100g, highly enriched.
These data therefore suggest that on average sediments at all sites are low – moderately
enriched in both phosphorus and nitrogen. The effect of this level of enrichment on benthic
communities is minor – moderate stress on sensitive organisms. A typical obvious sign of
sediment nutrient enrichment is the proliferation of nuisance algae during summer, however as
the survey was conducted during early winter (consistent with previous years) when benthic
algal production is typically at its lowest no algae was expected and indeed none was evident.
However, from experience in working in the Wairoa River estuary and associated tributaries
during summer months, nuisance algal growth in the main basin and particularly in the area
around the outfall has never been observed (pers. obs.).
Nutrient concentrations in sediment, similar to trace elements can vary depending on a variety
of factors. These include the chemistry of overlying water e.g. pH, hardness and dissolved
organic matter but chief among these is particle size and mineral composition of the sediment.
To account for differences in sediment composition among sites, and on order to more
accurately compare between sites sediment data were normalised to 100% of the silt/clay
(mud/fines).
Using normalised log10 transformed data, the comparison between sites showed that, similar to
the various trace elements, site B was significantly higher in both N and P compared to all other
sites, while site D was significantly higher in P and lower in N than sites A and C, which were not
significantly different to each other (Figure 6). As noted above the small amount of fines at site B
has resulted in a high normalised level for N and P, however as also noted above the similar
levels of fines at site A and site C make for a more meaningful comparison of normalised levels,
and indeed there was no significant difference detected between these sites.
Site A Site B Site C Site D
Nitro
gen
(g/1
00g
) +
/- s
e
0.00
0.02
0.04
0.06
0.08
0.10
0.12
Site A Site B Site C Site D
Pho
sph
oru
s(m
g/k
g)
+/-
se
0
100
200
300
400
500
FIGURE 5: COMPARISON OF SEDIMENT NUTRIENT CONCENTRATIONS (TOTAL NITROGEN AND TOTAL RECOVERABLE PHOSPHORUS) AMONG WDC OUTFALL MONITORING SITES DURING THE PRESENT SURVEY. RESULTS EXPRESSED ON A DRY WEIGHT BASIS.

MONITORING OF BENTHIC EFFECTS OF THE WDC OUTFALL DISCHARGE: 2017 SURVEY
PROJECT: TFN17005 REPORT STATUS: DRAFT PAGE: 13
Site A Site B Site C Site D
No
rma
lise
d n
itro
ge
n +
/- s
e
0.00
0.05
0.10
0.15
0.20
0.25
0.30
Site A Site B Site C Site D
No
rma
lise
d p
ho
sp
ho
rus +
/- s
e
0
500
1000
1500
2000
2500
3000
3500b
a
a
c
b
a a
c
FIGURE 6: COMPARISON OF SEDIMENT NUTRIENT LEVELS NORMALISED TO 100% OF THE ‘FINES’ (SILT/CLAY OR MUD) CONTENT AMONG WDC OUTFALL MONITORING SITES DURING THE PRESENT SURVEY (2017). FOR A GIVEN ELEMENT BARS WITH THE SAME LETTER ARE NOT SIGNIFICANTLY DIFFERENT AT α = 0.05.
TOTAL VOLATILE SOLIDS Total volatile solids (TVS), also referred to as Ash Free Dry Weight (AFDW) represents the amount
of organic matter present in the sediments. Site averages are shown in Figure 7 and data are
detailed in Appendix 4.
Interim thresholds for organic matter for a wide range of New Zealand estuaries have been
developed as part of the national Estuarine Trophic Index (ETI) that provides recommended
rating thresholds for a variety of estuarine trophic health indicators (Robertson, Stevens et al.
2016). However these have been developed using total organic carbon and not TVS. Therefore
in order to compare results from monitoring sites in the present survey to the thresholds the
thresholds were converted to TVS by multiplying by 1.724. Therefore sites with %TVS < 0.9 are
placed within the ‘A’ band characterised as no stress caused by the indicator on any aquatic
organisms, TVS of 0.9 – 1.724% is in the ‘B’ band characterised as minor stress on sensitive
organisms caused by the indicator, 1.724 – 3.45% places a site in the ‘C’ band, characterised by
moderate stress on a number of aquatic organisms caused by the indicator exceeding
preference levels for some species and a risk of sensitive macroinvertebrate species being lost,
while the lowest quality band is for sites with TVS > 3.45% and is classed as in the ‘D’ band, and
characterised as significant, persistent stress on a range of aquatic organisms caused by the
indicator exceeding tolerance levels with a likelihood of local extinctions of keystone species
and loss of ecological integrity.
Examining TVS results from the present survey in the context of these ecological quality bands it is
clear that site A would be rated in the ‘D’ band, sites B and C would be rated in the ‘B’ band
and site D would be rated in the ‘C’ band (Figure 7).
As with trace elements and nutrients, organic matter in sediments is assumed to be higher at
sites with a higher fines fraction, and therefore TVS data were also normalised to 100% of the
fines fraction for each site in order to compare between sites. Comparing normalised TVS
between sites it was apparent that all sites differed significantly from each other (Figure 8). As
previously noted the high normalised level at site B is likely an artefact of the normalisation
process given the small amount of fines compared to all other sites. Of the two sites with
comparable levels of fines, i.e. site A and C, ANOVA estimated that site A was significantly
higher than site C, with site D significantly higher than site C, but lower than site A. Because the
amount of organic matter in sediments can have a significant influence on the depth of the
aRDP layer depth, the presence of differences in normalised results between sites provides
additional confidence in the results comparing aRDP layer depths.

MONITORING OF BENTHIC EFFECTS OF THE WDC OUTFALL DISCHARGE: 2017 SURVEY
PROJECT: TFN17005 REPORT STATUS: DRAFT PAGE: 14
Site A Site B Site C Site D
Tota
l vo
latile
so
lids (
%)
± 1
SE
0
1
2
3
4
5
6
FIGURE 7: COMPARISON OF % SEDIMENT TVS (ORGANIC MATTER CONTENT) AMONG WDC OUTFALL MONITORING SITES A, B, D (‘IMPACT’) AND C (‘REFERENCE’) DURING THE PRESENT (2017) SURVEY.
Cd_Av
Site A Site B Site C Site D
norm
alis
ed T
VS
± 1
SE
0
2
4
6
8
10
12
14
16
a
b
c
d
FIGURE 8: COMPARISON OF SEDIMENT TVS LEVELS NORMALISED TO 100% OF THE ‘FINES’ (SILT/CLAY OR MUD) CONTENT AMONG WDC OUTFALL MONITORING SITES DURING THE PRESENT SURVEY (2017).
2.3.2 TEMPORAL ANALYSES
SEDIMENT TEXTURE The temporal variation of sediment texture among sites is shown in Figure 9. Given the present
survey is the first time site D has been sampled it was not included in temporal analyses.
At site A the amount of fines increased between 1996 and 2011 with a slight reduction recorded
in the present survey. At site B dominant fractions have tended to be more variable over time,
with the results from the present survey more similar to those in 1996 and 2007 than the 2011
survey. Site C appears to have been the most consistent through time though there has been a
change in the dominant fractions around the time of the 2011 survey, from sand (1996 and 2007)
to fines (2011 and 2017).

MONITORING OF BENTHIC EFFECTS OF THE WDC OUTFALL DISCHARGE: 2017 SURVEY
PROJECT: TFN17005 REPORT STATUS: DRAFT PAGE: 15
To provide an estimate of whether these observations within sites, and over time, were significant
or not, the data were subjected to Mann-Kendall trend testing (Jowett 2012). These tests
estimated no significant trends for any of the fractions, and among any of the sites.
Site A
1996 2007 2011 2017
se
dim
en
t (%
d/w
)
0
20
40
60
80
100
Gravel >2mm
Very Coarse Sand 1mm - 2mm
Coarse Sand 500µm - 1mm
Medium Sand 250µm - 500µm
Fine Sand 125µm - 250µm
Very Fine Sand 63µm - 125µm
Silt and Clay < 63µm
Site C
1996 2007 2011 2017
se
dim
en
t (%
d/w
)
0
20
40
60
80
100
Site B
1996 2007 2011 2017
se
dim
en
t (%
d/w
)0
20
40
60
80
100
FIGURE 9: TEMPORAL COMPARISON OF SEDIMENT TEXTURE AMONG WDC OUTFALL MONITORING SITES DURING SURVEYS IN 1996, 2007, 2011, AND THE PRESENT (2017).
TRACE ELEMENTS For an analysis of within site temporal variability, concentrations were normalised to 100% of the
fines fraction, plotted (Figure 10), log10 transformed and subjected to Mann-Kendall trend
testing. No analyses of sediment trace elements were conducted in the 1996 survey.
At site A, 6 statistically significant positive trends, i.e. increasing over time, were estimated, with
As and Hg the only trace elements where a trend was not detected. The mean rate of increase
among trace elements where positive trends were estimated was 3.6% ± 0.32 (1SE) per annum.
At site B, the large proportion of fines in the 2011 survey had an effect on normalised levels, and
as a result no significant trends were detected.
At site C a total of 3 statistically significant trends were detected, and these were all negative,
i.e. decreasing levels of normalised As, Cr, and Zn. The mean rate of decrease for these
elements was estimated to be 2.55% ± 0.47 (1SE) per annum.

MONITORING OF BENTHIC EFFECTS OF THE WDC OUTFALL DISCHARGE: 2017 SURVEY
PROJECT: TFN17005 REPORT STATUS: DRAFT PAGE: 16
In summary, although normalised data has been used to undertake trend testing which has
precluded a meaningful analysis of site B data, the more consistent sediment texture over time
among sites A and C allowed a greater level of confidence in trend test results. These generally
suggest sediment quality at site A, in terms of Cd, Cr, Cu, Ni, Pb and Zn is deteriorating over time.
At the reference site C levels are relatively stable, if not slightly improving over time.
2007 2011 2017
no
rma
lise
d C
ad
miu
m ±
1S
E
0.00
0.05
0.10
0.15
0.20
0.25
0.30
0.352007 2011 2017
no
rma
lise
d C
hro
miu
m ±
1S
E
0
20
40
60
80
100
2007 2011 2017
no
rma
lise
d
Co
pp
er
± 1
SE
5
10
15
20
25
30
35
40
45
2007 2011 2017
no
rma
lise
d
Le
ad
± 1
SE
0
10
20
30
40
50
60
70
2007 2011 2017
no
rma
lise
d Z
inc ±
1S
E
0
50
100
150
200
250
300
350
2007 2011 2017
no
rma
lise
d
Ars
en
ic ±
1S
E
0
5
10
15
20
25
30
35
2007 2011 2017
no
rma
lise
d
Me
rcu
ry ±
1S
E
0.00
0.05
0.10
0.15
0.20
0.25
0.30
Site A
Site B
Site C
*site C -ve
*site A +ve
*site A +ve *site C -ve
*site A +ve *site C -ve
*site A +ve
*site A +ve
2007 2011 2017
no
rma
lise
d
Nic
ke
l ± 1
SE
0
20
40
60
80
100
120
*site A +ve
FIGURE 10: TEMPORAL COMPARISON OF TRACE ELEMENT LEVELS NORMALISED TO 100% OF THE ‘FINES’ (SILT/CLAY OR MUD) CONTENT AMONG WDC OUTFALL MONITORING SITES DURING SURVEYS IN 1996, 2007, 2011 AND THE PRESENT (2017). STATISTICALLY SIGNIFICANT TRENDS ARE MARKED WITH AN ASTERISK {*) WITH DIRECTION OF TREND; POSITIVE (+VE) OR NEGATIVE (–VE), ALSO SHOWN.

MONITORING OF BENTHIC EFFECTS OF THE WDC OUTFALL DISCHARGE: 2017 SURVEY
PROJECT: TFN17005 REPORT STATUS: DRAFT PAGE: 17
NUTRIENTS
NITROGEN Examination of the inter-survey normalised nitrogen plot for site A reveals a slight increase in
each successive survey and a low overall level of variability. Trend testing detected a significant
positive trend, estimated to be 2.6% per annum (Figure 11). These results suggest that there has
been a gradual increase in the normalised levels of N in sediments at site A over time.
A significant positive trend was also detected in normalised nitrogen at site B despite the
extreme inter year variability. However, given the low concentrations of nitrogen in sediments at
site B during the present survey, which were all at levels below the laboratory detection limit,
and known limitation of normalisation to the fines fraction at sites with a small fines content the
positive trend at site B should be viewed with some scepticism.
Temporal variability at site C was limited with levels fairly stable and no apparent trends
detected.
PHOSPHORUS Normalised inter-survey phosphorus levels at site A were similarly fairly stable with Mann-Kendall
trend testing verifying the absence of any trend (Figure 11). Conversely normalised levels at site
B exhibited a high degree of inter-survey variability, though in this case no trend was detected.
At reference site C there was an apparent slight decrease in each successive survey. This
reduction over time was confirmed as a significant negative trend.
1996 2007 2011 2017
norm
alis
ed N
itro
gen ±
1S
E
0.00
0.05
0.10
0.15
0.20
0.25
0.30
1996 2007 2011 2017
norm
alis
ed P
hosphoru
s ±
1S
E
0
500
1000
1500
2000
2500
3000
3500
Site A
Site B
Site C
*site A +ve *site C -ve *site B +ve
FIGURE 11: TEMPORAL COMPARISON OF SEDIMENT NUTRIENTS NITROGEN AND PHOSPHORUS NORMALISED TO 100% OF THE ‘FINES’ (SILT/CLAY OR MUD) CONTENT AMONG WDC OUTFALL MONITORING SITES DURING SURVEYS IN 1996, 2007, 2011 AND THE PRESENT (2017). STATISTICALLY SIGNIFICANT TRENDS ARE MARKED WITH AN ASTERISK {*) WITH DIRECTION OF TREND; POSITIVE (+VE) OR NEGATIVE (–VE), ALSO SHOWN.
TOTAL VOLATILE SOLIDS The temporal variation of sediment TVS among sites is shown in the fines normalised plots of
Figure 12.
These results show normalised TVS levels at site A increasing over time which was confirmed by
trend testing that estimated a significant positive trend with levels increasing by 4.98% per
annum. A significant positive trend was also estimated at site B while no trends were detected
at site C.

MONITORING OF BENTHIC EFFECTS OF THE WDC OUTFALL DISCHARGE: 2017 SURVEY
PROJECT: TFN17005 REPORT STATUS: DRAFT PAGE: 18
Another interesting observation is the striking similarity between the pattern of organic matter
results among sites and the pattern observed for total nitrogen (see Figure 11). The close
resemblance between organic matter and nitrogen patterns in this system suggests that much
of the nitrogen present is from the degradation of organic matter, i.e. much of the nitrogen is
produced by bacteria involved in nitrogen fixation.
FIGURE 12: TEMPORAL COMPARISON OF TOTAL VOLATILE SOLIDS (ORGANIC MATTER CONTENT) NORMALISED TO 100% OF THE ‘FINES’ (SILT/CLAY OR MUD) CONTENT AMONG WDC OUTFALL MONITORING SITES DURING SURVEYS IN 1996, 2007, 2011 AND THE PRESENT (2017). STATISTICALLY SIGNIFICANT TRENDS ARE MARKED WITH AN ASTERISK {*) WITH DIRECTION OF TREND; POSITIVE (+VE) OR NEGATIVE (–VE), ALSO SHOWN.
2.4 SUMMARY
PRESENT SURVEY Sediment oxygenation, indicated by depth of the aRDP layer, at the upstream reference site
C was moderate, at the site immediately upstream and inshore of the outfall, sites B and D
respectively, oxygenation was moderate – good, whereas at the site located immediately
downstream of the outfall, site A, sediments were hypoxic at a shallow depth and, in places,
anoxia was developing and therefore oxygenation was poor.
Sediment texture among sites A and C was similar and characterised primarily by mud, or
‘fines’(<63µm) with a sand subsidiary while sites B and D were predominantly very fine/fine
sand with site B more sandy and site D more muddy.
Trace element levels at all sites were low with all results below ANZECC ISQG – Low sediment
quality guidelines, and were in general within the range of average background
concentrations of Hawke’s Bay estuarine and lagoonal systems. Evidence of a significant
outfall effect in terms of sediment trace elements was absent with normalised levels not
significantly different between site C and site A.
Concentrations of sediment nutrients, N and P, at all sites were within the moderate range
among Hawke’s Bay estuaries suggesting low-moderate enrichment of sediments.
Normalised levels of N and P at site A where not significantly different to the comparable
reference site C, indicating the absence of a significant outfall effect on sediment nutrient
levels.
Total volatile solids, or organic content, of sediments differed significantly among all sites,
with the most polluted site being site A where levels are likely to induce persistent and
significant stress on resident infauna and loss of ecological integrity. Levels at the inshore site
D were rated as likely to induce moderate stress on infauna. The least polluted sites in terms
of TVS were sites B and reference site C which were rated as likely to induce only minor stress
on infauna with ecological integrity unlikely to impact ecological integrity.
1996 2007 2011 2017
norm
alis
ed T
VS
± 1
SE
0
2
4
6
8
10
12
14
16
Site A
Site B
SIte C
*site B +ve *site A +ve

MONITORING OF BENTHIC EFFECTS OF THE WDC OUTFALL DISCHARGE: 2017 SURVEY
PROJECT: TFN17005 REPORT STATUS: DRAFT PAGE: 19
TEMPORAL ANALYSES Sediment texture at site A and C were relatively more consistent over time, compared to site
B, which returned to a predominantly sandy composition in the present survey compared to
being predominantly mud in the previous 2011 survey. Trend testing did not provide any
evidence of significant trends among any sites for any of the sediment fractions.
Temporal trend testing of trace elements normalised to the fines fraction revealed 6
statistically significant positive trends, i.e. increasing levels, in Cd, Cr, Cu, Ni, Pb and Zn at site
A, and 3 significant negative trends in As, Cd and Zn at reference site C. These results
suggest a slight deterioration in sediment quality over time at site A in terms of these
elements and a slight improvement at site C.
Trend testing of sediment nitrogen levels estimated increasing trends at site A and B, though
the result for site B is considered tenuous, and no trends at site C. In terms of phosphorus,
levels among all sites were fairly stable, with the only significant trend among sites, a
negative trend at site C.
TVS at site A was estimated to be increasing over time, while at site C levels were stable with
no trends detected. A positive trend was also estimated at site B, though this result is viewed
with some scepticism. It was also noted that the levels of TVS were likely to be driving the
sediment N levels given the similarity in variability over time of N and TVS.

MONITORING OF BENTHIC EFFECTS OF THE WDC OUTFALL DISCHARGE: 2017 SURVEY
PROJECT: TFN17005 REPORT STATUS: DRAFT PAGE: 20
3. BIOLOGICAL CHARACTERISTICS Benthic infauna (species residing within the sediment matrix) form diverse communities that are
important to the coastal and estuarine ecosystems. These animals serve vital functions in a wide
variety of capacities, for example some species decompose organic matter, aiding nutrient
cycling, while other species filter particulate matter from the water, affecting water clarity.
Many species of benthic macroinfauna are also prey for fish and other organisms. Human
activities such as wastewater disposal impact the benthos in a number of ways; including
smothering, oxygen depletion, toxic contamination, and organic enrichment. Some
macrofaunal species are highly sensitive to such effects and rarely occur in impacted areas,
while other, more opportunistic species can thrive under altered conditions. Different species
respond differently to environmental stress, so monitoring macrobenthic assemblages can help
to identify anthropogenic impact. Also, since the animals in these assemblages are relatively
stationary and long-lived, they integrate environmental conditions spatially and over time.
Consequently, the assessment of benthic community structure is a major component of many
marine monitoring programs, which document both existing conditions and trends over time.
This section presents analyses and interpretations of benthic macrofaunal data collected at
outfall monitoring sites during June 2017 in the vicinity of the WDC outfall, with the aim to assess
any effects on the benthic biology from the treated wastewater discharge.
3.1 METHODOLOGY
SAMPLING SITES Biological sampling sites were the same as those described in section 2.2, Sediment
Characteristics and are shown in Figure 1.
METHODOLOGY Infaunal sampling was carried out at the same time as the respective sediment sample was
collected. At each site five replicate infaunal cores were collected a 5m radius of the sites GPS
position. Infaunal cores were collected using a circular PVC 130mm (internal Ф) x 200mm long
core (total area 0.013m2). Samples were collected by pushing the core into the sediment to a
depth of 150mm and digging down the outside of the core, placing a hand over the bottom,
extracting the core and intact sample and ejecting the sample into a 0.5mm mesh bag, which
was attached to the top of the core. The mesh bag was then detached from the core and the
sediment in the sample was gently washed through the bag, leaving only the infauna. Samples
were washed into labelled jars with 80% ethanol and fixed in same. After transporting samples
back to the lab a few drops of Rose Bengal solution was added to each sample, and left for
several hours to allow the biota to uptake the stain. Samples were then poured into shallow
trays and all biological material carefully picked out. The material was then examined under a
dissecting microscope, and fauna enumerated and identified to the lowest possible taxonomic
group.
DATA ANALYSIS Spatial differences in the number of individuals - N and diversity indices (collectively called
biological summary indices) consisting of S - number of taxa, H’ - Shannon-Weiner diversity index,
J’ - Pielou’s evenness and d - Margalef’s richness) between sites in the present survey were
explored using one-way ANOVA (STATISTICA 7), with post hoc analysis of individual terms by
Tukeys HSD tests. Levene’s test was used to test the assumption of homogeneity of variance for
parametric analyses.
Temporal analyses were conducted using the non-parametric Mann-Kendall trend test {NIWA,
2008 #90}. Trends in biological summary indices were examined by computing a Mann-Kendall
statistic, S, and associated p-value. Trends were considered to be significantly positive (i.e.
increasing with time) or negative (i.e. decreasing with time) if the probability (two-sided p-value)
of rejecting a correct hypothesis (in this case, no trend) was ≤ 0.05. Statistically significant trends
were considered to be ecologically meaningful if the difference was more than 1% of the
median value per annum.

MONITORING OF BENTHIC EFFECTS OF THE WDC OUTFALL DISCHARGE: 2017 SURVEY
PROJECT: TFN17005 REPORT STATUS: DRAFT PAGE: 21
To assess the benthic community composition, both spatially and temporally,, data were
analysed using a permutational multivariate analysis of variance (PERMANOVA) (Anderson
2005). This method of data analysis is regarded as a powerful way to test the significance of
taxonomic compositional changes (Walters and Coen 2006).
The model was based on permutation of raw data for the fixed factor ‘site’ and or ‘year’. Data
were log(x+1) transformed before analysis, as this type of transformation scales down the effect
of highly abundant species thus increasing the equitability of the dataset (variance
standardisation). Data were also contrasted using non-metric multidimensional scaling (Kruskal
and Wish 1978) ordination based on the Bray-Curtis distance matrix in PRIMER v5.
Additionally, major taxa contributing to the similarities of each site were identified using analysis
of similarities (SIMPER) (Clarke and Warwick 1994; Clarke and Gorley 2001).
Although the size of the infaunal samples collected in the 1996 monitoring survey was 0.05m2,
compared to 0.013m2 used in subsequent surveys, data were compared without scaling. The
reason for not scaling results is that the number of species detected in a sample usually changes
much more in relation to sample size or sampling intensity than the distribution of relative
abundances (Huston 1997).
3.2 RESULTS
3.2.1 PRESENT SURVEY
BIOLOGICAL SUMMARY INDICES
SPECIES ABUNDANCE, DIVERSITY, RICHNESS AND EVENNESS A complete list of benthic infaunal data from the present survey is included in Appendix 5.
Biological summary indices are presented in Figure 13.
The most commonly encountered species among sites was the polychaete worm Boccardia sp.
accounting for just under half of all individuals counted, though this species was absent from
sites A and C. The second most common species was another polychaete worm, Nicon
aestuariensis, (except for site D). The third most common species was the estuarine snail
Potamopyrgus estuarinus (except for site A), followed by the amphipod Paracorophium
excavatum (except for site D). The fifth most common species was the filter feeding bivalve,
pipi, Paphies australis (except for site A). In general polychaete species dominated the
abundance among all sites except for site D where molluscs were numerically dominant.
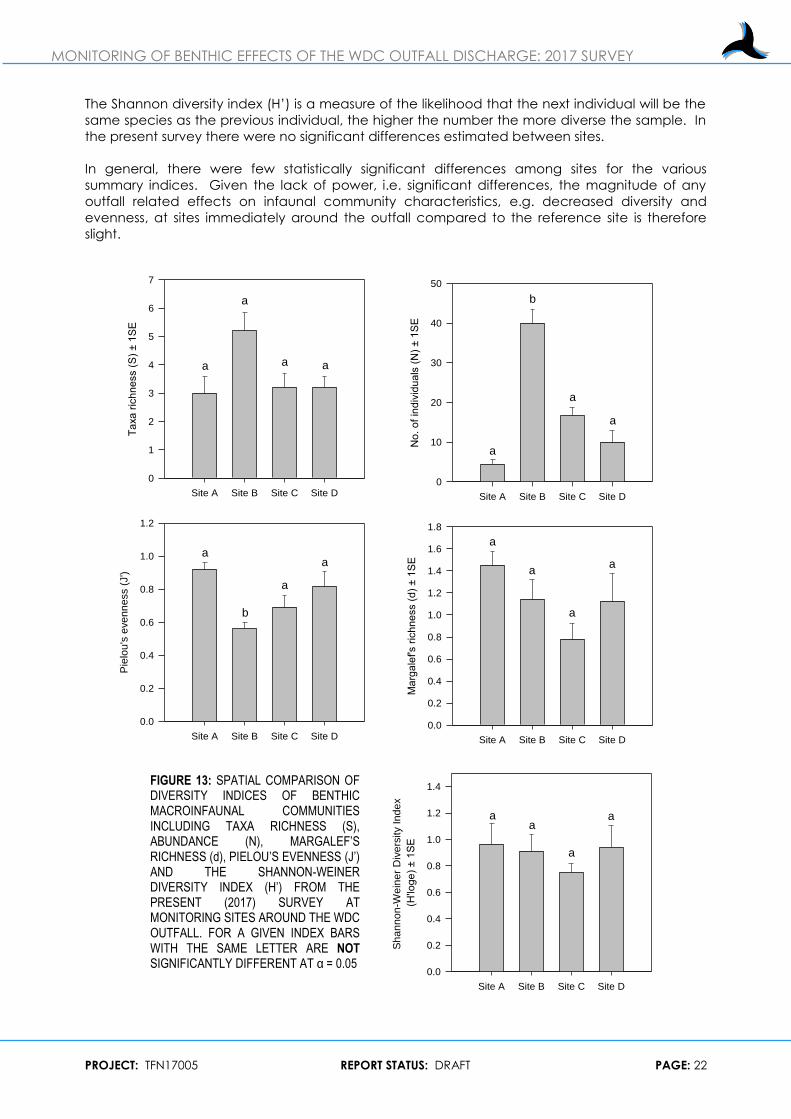
The number of taxa (S), taxa richness at each site was low, with a total of 12 species identified
across all sites. Site B had the highest average diversity (3-7 species) however no significant
differences were detected between sites.
Number of individuals in each core, or abundance, (N) was low-moderate across all sites, with
site B recording the highest average abundance that was estimated to be significantly higher
than all other sites. Although the lowest abundance was recorded at site A there was no
significant difference between sites A, C and D.
Margalef’s Richness (d), is described as a measure of biodiversity based on the number of
species adjusted for the number of individuals sampled. Values increase with the number of
species and decrease with relative increases in number of individuals. The highest average
score was at site A, followed by sites B and D and then site C. However, these differences were
estimated as non-significant.
Pielou’s evenness (J’) is a measure of the similarity of the abundances of different species in a
group or community, and the nearer values are to 1 the more even abundances are among
species. In the present survey evenness at sites A, C and D was estimated as significantly higher
than site B, likely as a result of the inconsistency in occurrence of some taxa throughout site B.
MONITORING OF BENTHIC EFFECTS OF THE WDC OUTFALL DISCHARGE: 2017 SURVEY
PROJECT: TFN17005 REPORT STATUS: DRAFT PAGE: 22
The Shannon diversity index (H’) is a measure of the likelihood that the next individual will be the
same species as the previous individual, the higher the number the more diverse the sample. In
the present survey there were no significant differences estimated between sites.
In general, there were few statistically significant differences among sites for the various
summary indices. Given the lack of power, i.e. significant differences, the magnitude of any
outfall related effects on infaunal community characteristics, e.g. decreased diversity and
evenness, at sites immediately around the outfall compared to the reference site is therefore
slight.
Site A Site B Site C Site D
Ta
xa
ric
hn
ess (
S)
± 1
SE
0
1
2
3
4
5
6
7
Site A Site B Site C Site D
No
. o
f in
div
idu
als
(N
) ± 1
SE
0
10
20
30
40
50
Site A Site B Site C Site D
Pie
lou
's e
ve
nn
ess (
J')
0.0
0.2
0.4
0.6
0.8
1.0
1.2
Site A Site B Site C Site D
Sh
an
no
n-W
ein
er
Div
ers
ity I
nd
ex
(H'lo
ge
) ± 1
SE
0.0
0.2
0.4
0.6
0.8
1.0
1.2
1.4
Site A Site B Site C Site D
Ma
rga
lef's r
ich
ne
ss (
d)
± 1
SE
0.0
0.2
0.4
0.6
0.8
1.0
1.2
1.4
1.6
1.8
a
a
a a
a
b
a
a
a
b
a
a
a
a
a
a
aa
a
a
FIGURE 13: SPATIAL COMPARISON OF DIVERSITY INDICES OF BENTHIC MACROINFAUNAL COMMUNITIES INCLUDING TAXA RICHNESS (S), ABUNDANCE (N), MARGALEF’S RICHNESS (d), PIELOU’S EVENNESS (J’) AND THE SHANNON-WEINER DIVERSITY INDEX (H’) FROM THE PRESENT (2017) SURVEY AT MONITORING SITES AROUND THE WDC OUTFALL. FOR A GIVEN INDEX BARS WITH THE SAME LETTER ARE NOT SIGNIFICANTLY DIFFERENT AT α = 0.05

MONITORING OF BENTHIC EFFECTS OF THE WDC OUTFALL DISCHARGE: 2017 SURVEY
PROJECT: TFN17005 REPORT STATUS: DRAFT PAGE: 23
INFAUNAL COMMUNITY STRUCTURE Multivariate analysis of infaunal data allows a comparison of community structure between sites,
and years. Similarities in species abundance between sites and years are expressed on a two
dimensional plane called a non-metric multi-dimensional scaling (nMDS) plot. The plot
comparing infaunal communities between sites in the present survey (2017) shows distinct
separation between all sites (Figure 14).
PERMANOVA results confirm this graphical separation observed in the plot as significant (pMC =
0.001) (Table 3). Pair-wise a posteriori comparisons among sites estimated that community
structure at each site was significantly different to every other site.
Table 3: PERMANOVA results examining the effect of site on benthic macroinfauna during the present (2017) survey. All data were ln(x+1) transformed, and analysis was based on Bray-Curtis similarities. P (perm) indicates the permutational p-value,
P(MC) indicates the Monte Carlo p-value.
Source df SS Mean
Square F-Value P (perm) P (MC)
Site 3 31483.2 10494.4 12.1 0.001* 0.001*
Residual 16 13782.9 861.4
Total 19 45266.2
‘*’ indicates significant result
A SIMPER analysis was used to assist identification of species associations that account for the
observed differences in community structure between sites and are shown in Table 4. The key
species at site D was the estuarine snail, Potamopyrgus estuarinus which is in fact classed as
epifauna, i.e. they reside at the sediment surface, and so are somewhat less affected by
adverse sediment conditions than infauna. Among sites A and C and to a lesser extent at site B
the estuarine omnivorous polychaete worm Nicon aestuariensis was key. This species is found in
sediments with a wide range of fines content however in general its presence is strongly
positively correlated with increasing fines. Another polychaete, the surface deposit feeding
worm Boccardia spp. which typically occurs at sites with an intermediate level of fines,
characterised the assemblage at site B and was of secondary importance at site D. Also of
secondary importance in driving the assemblages at site A and B was the estuarine amphipod
Paracorophium excavatum.
FIGURE 14: NON-METRIC MDS PLOT OF BENTHIC MACROINFAUNA DATA FROM THE PRESENT (2017) SURVEY AT MONITORING SITES AROUND THE WDC OUTFALL. DATA WERE LOG(X+1) TRANSFORMED PRIOR TO ANALYSIS AND GROUPINGS ARE BASED ON BRAY-CURTIS SIMILARITIES.
-2 -1 0 1 2
-2
-1
0
1
2
A1
A2
A3
A4
A5B1
B2
B3
B4
B5
C1
C2C3
C4
C5
D1
D2
D3
D4
D5
2D Stress: 0.14

MONITORING OF BENTHIC EFFECTS OF THE WDC OUTFALL DISCHARGE: 2017 SURVEY
PROJECT: TFN17005 REPORT STATUS: DRAFT PAGE: 24
Table 4: Infaunal species that contribute most to the similarity among WDC outfall monitoring sites during the present (2017) survey. (SIMPER log(x+1) transformed data, PRIMER). Species at each site contributing to 90% of observed similarity listed.
Site Species Av.
abund Av. Sim Sim/SD Contrib % Cum%
Site A
(av. sim.
35.12%)
Nicon aestuariensis 1.8 26.7 1.09 76.04 76.04
Paracorophium excavatum 0.6 8.41 0.61 23.96 100
Site B
(av. sim.
47.22%)
Boccardia sp. 21 24.64 1.14 52.18 52.18
Nicon aestuariensis 2.6 14.12 2.77 29.9 82.09
Paracorophium excavatum 2 5.74 1.14 12.16 94.25
Site C
(av. sim.
45.96%)
Nicon aestuariensis 10.6 38.22 2.25 83.15 83.15
Potamopyrgus estuarinus 1.8 3.65 0.6 7.93 91.08
Site D
(av. sim.
52.26%)
Potamopyrgus estuarinus 7 34.08 3.77 65.23 65.23
Boccardia sp. 1.4 11.34 1.12 21.7 86.93
Paphies australis 1 5.04 0.62 9.64 96.57
Given the similarity in the % fines between site A and reference site C and shared key species,
i.e. Nicon aestuariensis, but significantly higher levels of organic matter content in sediments at
site A, it is suggested that the assemblage is not majorly affected by the increased organic
content. In general results suggest a spatially variable community structure at monitoring sites
around the outfall that can be broadly explained by species preferences to sediment texture,
and specifically fines content.
3.2.2 TEMPORAL ANALYSES
BIOLOGICAL SUMMARY INDICES
SPECIES ABUNDANCE, DIVERSITY, RICHNESS AND EVENNESS For an analysis of temporal variability and detection of trends within sites, diversity indices were
plotted (Figure 15), and subjected to Mann-Kendall trend testing.
Comparison of how the various summary indices have varied over time at reference site C
provides a yardstick against which the temporal variation in summary indices at sites A and B
could be assessed. Overall site A exhibited the highest degree of inter-survey variability across
all indices, with multiple significant differences estimated between years among the various
indices, this compared to site B where there were no significant differences detected between
years in any of the indices and site C where the only significant inter-survey difference estimated
was in N where the 1996 result was higher than all other results. As stress is generally considered
to increase variability the increased variability at site A suggests this site is subject to higher levels
of stress than sites B and C.
To assess whether or not stress has resulted in deterioration in benthic community health trend
tests were conducted on within site data for the various indices. These tests revealed a number
of significant trends including; significant negative (i.e. decreasing) trends at site A in both taxa
richness, S, and abundance, N (Figure 15), with the mean rate of decrease for S estimated to be
5.3% per annum and for N 7.7% per annum. Similarly, at the reference site C significant negative
trends were also detected for taxa richness and abundance, with mean rates of decrease
estimated to be 2.5% and 22.4% per annum for S and N respectively. At site B a significant
negative trend in N was also detected, with the mean decrease estimated to be 8.9% per
annum. No other trends among the other indices were detected.
In general these results indicate the community at site A is subjected to increased levels of stress
compared to upstream site B and reference site C, and that over time benthic community
‘health’ at all sites has deteriorated but is particularly pronounced at site A.
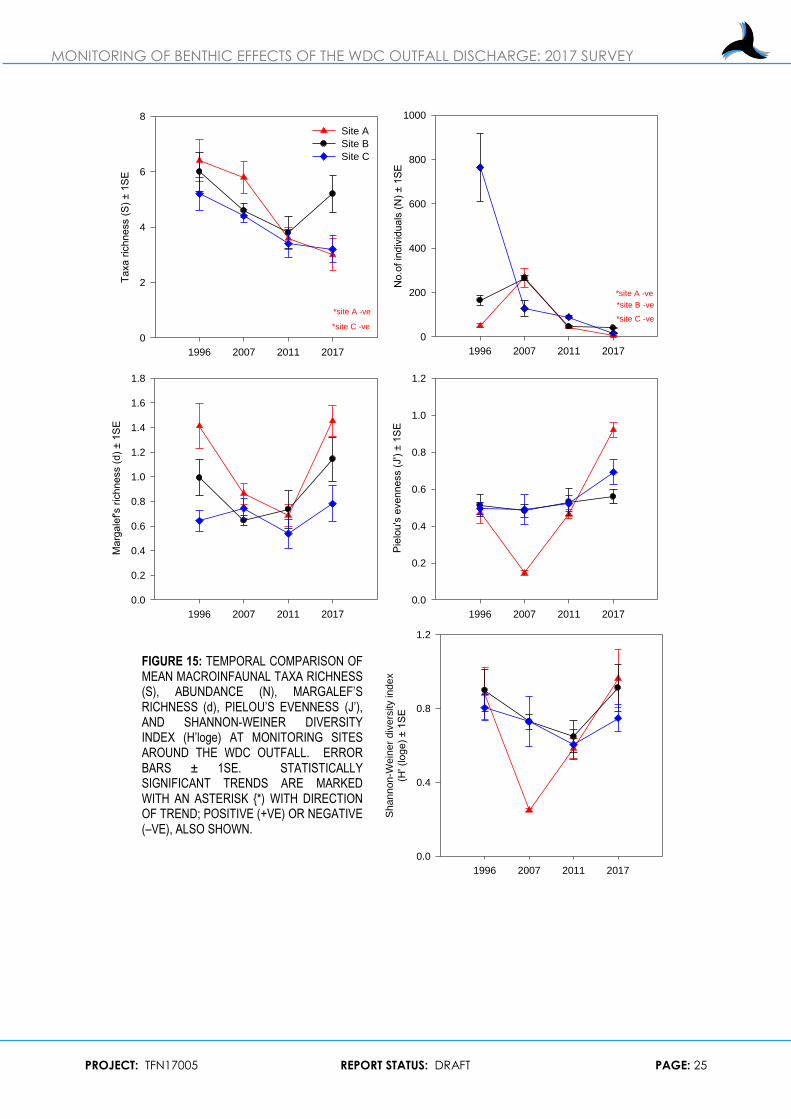
MONITORING OF BENTHIC EFFECTS OF THE WDC OUTFALL DISCHARGE: 2017 SURVEY
PROJECT: TFN17005 REPORT STATUS: DRAFT PAGE: 25
1996 2007 2011 2017
Marg
ale
f's r
ichness (
d)
± 1
SE
0.0
0.2
0.4
0.6
0.8
1.0
1.2
1.4
1.6
1.8
1996 2007 2011 2017
Taxa r
ichness (
S)
± 1
SE
0
2
4
6
8
Site A
Site B
Site C
1996 2007 2011 2017
No.o
f in
div
iduals
(N
) ± 1
SE
0
200
400
600
800
1000
1996 2007 2011 2017
Shannon-W
ein
er
div
ers
ity index
(H' (loge)
± 1
SE
0.0
0.4
0.8
1.2
1996 2007 2011 2017
Pie
lou's
evenness (
J') ±
1S
E
0.0
0.2
0.4
0.6
0.8
1.0
1.2
*site A -ve
*site C -ve
*site A -ve
*site B -ve
*site C -ve
FIGURE 15: TEMPORAL COMPARISON OF MEAN MACROINFAUNAL TAXA RICHNESS (S), ABUNDANCE (N), MARGALEF’S RICHNESS (d), PIELOU’S EVENNESS (J’), AND SHANNON-WEINER DIVERSITY INDEX (H’loge) AT MONITORING SITES AROUND THE WDC OUTFALL. ERROR BARS ± 1SE. STATISTICALLY SIGNIFICANT TRENDS ARE MARKED WITH AN ASTERISK {*) WITH DIRECTION OF TREND; POSITIVE (+VE) OR NEGATIVE (–VE), ALSO SHOWN.

MONITORING OF BENTHIC EFFECTS OF THE WDC OUTFALL DISCHARGE: 2017 SURVEY
PROJECT: TFN17005 REPORT STATUS: DRAFT PAGE: 26
INFAUNAL COMMUNITY STRUCTURE An nMDS plot illustrating the variation in community structure both temporally and spatially is
shown in Figure 16.
Examining the nMDS plot it is apparent that the degree of temporal variability (i.e. distance
between years, within sites) is greater than spatial variability (i.e. distance between sites within a
survey year). This suggests temporal variability has a relatively stronger influence on community
composition than spatial, or site, related effects. Also apparent is that temporal variability of
sites A and B is relatively greater than at site C, which suggests these sites are subject to higher
levels of stress than site C. The other observation of note is the reduced dispersion within sites
and distance between site data during the 2007 and 2011 surveys compared to the 1996 and
present (2017) surveys. This suggests that spatial effects, within and between sites in the 1996
survey, with the possible exception of site C, and 2017 surveys, was relatively more pronounced
than in the 2007 and 2011 surveys.
FIGURE 16: NON-METRIC MDS PLOT OF BENTHIC MACROINFAUNA DATA FROM THE 1996, 2007, 2011, AND PRESENT (2017) SURVEYS AT MONITORING SITES SURROUNDING THE WDC OUTFALL. DATA WERE TRANSFORMED LOG(X+1) PRIOR TO ANALYSIS AND GROUPINGS ARE BASED ON BRAY-CURTIS SIMILARITIES. LINES
The 2-factor PERMANOVA (examining all years, and sites) confirms that both site and year were
significant factors estimating infaunal community structure (Table 5). However, evidence of a
significant interaction term (year*site) indicates these differences were not consistent between
either years or sites. To investigate the source of this inconsistency pair-wise a posteriori
comparisons between years and sites (including within sites and years), were conducted. These
showed that overall community structure did not differ significantly between site A and B (when
all survey data were pooled) but differed significantly between all years (within sites). Between
sites (within years) non-significant differences occurred between sites A and B and sites B and C
(2011 survey only).
Table 5: PERMANOVA results examining the effect of site and year on infauna data. All data were ln(x+1) transformed, and analysis was based on Bray-Curtis dissimilarities. P (perm) indicates the permutational p-value, P(MC) indicates the Monte
Carlo p-value. Significant results denoted by asterisk.
Source df SS Mean
Square F-Value P (perm) P (MC)
Site 2 16237.2 8118.6 21.4 0.001* 0.001*
Year 3 58750.3 19583.4 51.7 0.001* 0.001*
Site x Year 6 21635.5 3605.9 9.5 0.001* 0.001*
Residual 48 18177.0 378.7
Total 59 114800.2
-2 -1 0 1 2
-2
-1
0
1
2
A
AA
A
A
AAAA
AA
A
AA
A
B
B
B
B
B
BB
BB
B
BBB
B
B
CCC
CC
CC
CCC
C
CC
CC
A
A
A
A
A
B
B
BB
B
C
C
C
C
C
2D Stress: 0.14
site A
site B
site C
2017
2017
2017
2011
2011
2011
2007
2007
2007
1996
1996
1996

MONITORING OF BENTHIC EFFECTS OF THE WDC OUTFALL DISCHARGE: 2017 SURVEY
PROJECT: TFN17005 REPORT STATUS: DRAFT PAGE: 27
The important points to note are that there are distinctly different communities at each site with
a significant level of natural variability from year to year. However, at sites A and B the
communities are more similar to one another and the magnitude of temporal variation is
relatively greater compared to site C. Thus it is suggested that as well as natural variability there
are other factors operating at sites A and B that significantly influence community structure, e.g.
wastewater discharge.
SIMPER analyses provide for a detailed examination of the underlying key species and species
dynamics that account for the significant differences in assemblages between sites and over
time (Table 6). From these analyses species that were key community drivers during the 1996
survey were Scolelepis sp. (polychaete), Potamopyrgus estuarinus, Paracorophium excavatum,
Chironomus zelandica, and Agalophamous macroura. In 2007 key species were P. excavatum,
P. estuarinus, Nicon aestuariensis, and Scolecolepides spp. In 2011 key species were P.
excavatum, and N. aestuariensis, and as mentioned above in 2017 key species were N.
aestuariensis, P. excavatum, P. estuarinus and Boccardia sp.
Table 6: List of infauna species that contribute most to the similarity among survey years (1996, 2007, 2011, 2017) at monitoring sites around the WDC outfall during the surveys. (SIMPER log(x+1) transformed data, PRIMER). Top 80% of contributing
species listed.
Site Year Species Av.
abund Av. Sim Sim/SD
Contrib
% Cum%
A
1996
(av. sim.
70.99%)
Scolelepis sp. 39 37.02 10 52.16 52.16
Potamopyrgus estuarinus 2.8 13.14 9.3 18.51 70.66
Chironomus zelandica 2.2 5.91 1.07 8.33 79
Agalophamous macroura 1.4 5 1.12 7.04 86.03
2007
(av. sim.
78.34%)
Paracorphium excavatum 254.4 47.74 24.15 60.93 60.93
Potamopyrgus estuarinus 5.4 12.49 7.26 15.94 76.87
Nicon aestuariensis 2.2 8.97 3.2 11.46 88.33
2011
(av. sim.
69.95 %)
Paracorophium excavatum 35.4 51.12 14.62 73.07 73.07
Nicon aestuariensis 4.6 13.99 1.11 20 93.08
2017
(av. sim.
56.85%)
Nicon aestuariensis 2 48.44 3.08 85.2 85.2
Paracorophium excavatum 0.6 8.41 0.61 14.8 100
B
1996
(av. sim.
74%)
Potamopyrgus estuarinus 90.8 30.36 5.22 41.02 41.02
Scolelepis sp. 59 27.51 7.7 37.18 78.2
Paracorophium excavatum 6.6 5.16 0.97 6.97 85.17
2007
(av. sim.
92.58%)
Paracorphium excavatum 202.2 38.74 40.17 41.84 41.84
Scolecolepides sp. 42 26.71 15.86 28.85 70.69
Potamopyrgus estuarinus 18.6 21.45 18.88 23.16 93.86
2011
(av. sim.
78.3 %)
Paracorophium excavatum 36.8 48.3 10.02 61.69 61.69
Nicon aestuariensis 7.6 28.12 7.24 35.92 97.61
2017
(av. sim.
70.4%)
Boccardia sp. 28.4 41.51 8.62 58.96 58.96
Nicon aestuariensis 3 13.29 2.68 18.88 77.85
Paracorophium excavatum 2.4 10.23 6.55 14.54 92.38
C
1996
(av. sim.
90.05%)
Paracorophium excavatum 508.6 31.72 13 35.23 35.23
Potamopyrgus estuarinus 220.6 27.54 23.1 30.59 65.81
Scolecolepides sp. 21.2 16.45 23.09 18.27 84.08
2007
(av. sim.
83.97%)
Paracorophium excavatum 105.2 36.95 7.64 44.01 44.01
Nicon aestuariensis 14 23.93 9.34 28.5 72.51
Potamopyrgus estuarinus 4.6 13.81 5.17 16.45 88.96
2011
(av. sim.
83.34 %)
Paracorophium excavatum 72.2 48.06 11 57.67 57.67
Nicon aestuariensis 12.2 27.91 9.75 33.49 91.16
2017
(av. sim.
60.13%)
Nicon aestuariensis 11.8 50.1 8.26 83.32 83.32
Potamopyrgus estuarinus 2.2 5.98 0.52 9.95 93.26

MONITORING OF BENTHIC EFFECTS OF THE WDC OUTFALL DISCHARGE: 2017 SURVEY
PROJECT: TFN17005 REPORT STATUS: DRAFT PAGE: 28
These results demonstrate a general shift in the polychaete assemblage, particularly at site A,
from species that are typically associated with sandier sediments (e.g. Scolelepis sp. and
Agalophamous macroura) to species more tolerant of fines (e.g. N. aestuariensis and
Scolecolepides sp.). There has also been a marked reduction in the abundance of the
amphipod P. excavatum at all sites over time.
3.3 SUMMARY
PRESENT SURVEY Dominant taxa encountered during the present survey included: the spionid polychaete
worm, Boccardia sp., the nereid worm Nicon aestuariensis, the estuarine snail
Potamopyrgus estuarinus, the amphipod Paracorophium excavatum, and pipi, Paphies
australis.
In general polychaete species dominated the abundance among all sites except for site
D where molluscs were numerically dominant.
Taxa richness (S) was low at all sites, with no significant differences estimated between
sites. Similarly there were no differences among sites in Margalef’s richness (d) or the
Shannon-Weiner diversity index (H’). Abundance (N) was low-moderate among all sites,
with site B estimated to have significantly more individuals than any other site. However
the distribution of individuals or evenness (J’) at sites A, C and D was significantly higher
than site B.
Given the few statistically significant differences among sites for the various summary
indices, the magnitude of any outfall related effect on infaunal community
characteristics at sites immediately around the outfall compared to the reference site is
therefore slight.
Infaunal community structure analyses however indicated a high level of spatial
variability, with each sites assemblage significantly different to every other site.
Given the similarity in the % fines between site A and reference site C and shared key
species, i.e. Nicon aestuariensis, but significantly higher levels of organic matter content
in sediments at site A, it is suggested that the assemblage is not majorly affected by the
increased organic content.
In general the spatially variable infaunal assemblage can be broadly explained by
species preferences to sediment texture, and specifically fines content.
INTER SURVEY COMPARISON The highest degree of inter-survey variability across all indices and among sites was site
A, suggesting this site is subject to higher levels of stress than sites B and C.
Trend testing of abundance, and diversity indices indicated an ecologically significant
decrease in taxa richness and abundance at both site A and reference site C. At site B
an ecologically significant decrease in abundance was also detected.
In general these results indicate the community at site A is subjected to increased levels
of stress compared to upstream site B and reference site C, and that over time benthic
community ‘health’ at all sites has deteriorated but is particularly pronounced at site A
In terms of community structure, communities varied greatly both temporally and
spatially though the factor ‘year’ (i.e. temporal variability) is the primary explanatory
variable, followed by ‘site’ (i.e. spatial variability).

MONITORING OF BENTHIC EFFECTS OF THE WDC OUTFALL DISCHARGE: 2017 SURVEY
PROJECT: TFN17005 REPORT STATUS: DRAFT PAGE: 29
Despite the variability, generally over time, the communities at sites A and B have been
more similar to one another compared to site C and the magnitude of temporal
variation is relatively greater at these sites compared to site C.
Therefore it is suggested that as well as natural variability there are other factors at sites A
and B that significantly influence community structure, e.g. wastewater discharge.
The differences between years may be attributable to a shift in the key drivers of
community composition from polychaetes typically associated with sandier sediments
(e.g. Scolelepis sp. and Agalophamous macroura) to species more tolerant of fines (e.g.
N. aestuariensis and Scolecolepides sp.). There has also been a marked reduction in the
abundance of the amphipod P. excavatum at all sites over time.

MONITORING OF BENTHIC EFFECTS OF THE WDC OUTFALL DISCHARGE: 2017 SURVEY
PROJECT: TFN17005 REPORT STATUS: DRAFT PAGE: 30
5. DISCUSSION The WDC municipal wastewater discharge via an outfall into the lower Wairoa River estuary is an
existing activity subject to compliance with a number of resource consent conditions set out in
resource consent CD940404W. Although the consent does not specifically require monitoring of
the receiving environment, WDC have nonetheless undertaken monitoring to determine the
magnitude of any effects occurring as a result of the discharge.
The approach used was an upstream/downstream comparison of physico-chemical sediment
quality and biological communities and then how these sites compare to relevant national and
regional guidelines, background levels, and biological indicators of health.
SEDIMENT CHARACTERISTICS The results of previous dye dilution studies have shown that when the river mouth is unrestricted
and discharge occurs on an ebb tide, wastewater exits the estuary in a relatively short
timeframe (30 – 40 mins) (Barter 2007). In this situation discharge related effects may be
expected at the monitoring site immediately downstream of the outfall only, i.e. site A. During
periods of restriction at the mouth potentially all three monitoring sites around the outfall, i.e. sites
A, B and D, could be exposed to the plume and be affected by the discharge. During the
present survey, at two of the three sites surrounding the outfall (sites A and D), there was some
evidence of the discharge affecting sediment characteristics, with the most pronounced effects
evident at site A.
Potential negative effects on sediment characteristics from wastewater discharge include the
accumulation of contaminants such as fine sediments, organic matter, trace elements and
nutrients. In the present survey negative effects related to wastewater discharge were
principally concerned with the deposition of organic matter, with current and past organic
matter accumulation evident at site A and site D respectively. This resulted in reduced levels of
sediment oxygenation at site A compared to the similarly comprised upstream reference site C.
Moreover normalised levels of TVS at site A were 3.8x higher than the normalised levels at
reference site C. At the levels of TVS, or organic matter, found at site A induction of persistent
and significant stress on resident infauna and loss of ecological integrity is likely. While at site D it
is suggested that the levels of TVS would likely induce moderate stress on infauna. These effects
also appear to be compounding over time with a statistically significant and ecologically
meaningful increasing trend in organic matter detected at site A.
Aside from the accumulation of organic matter at site A there was no evidence to suggest
contamination by trace elements of sediments with no difference in normalised levels among
site A and C and all sites well within ANZECC guidelines and comparable to Hawke’s Bay
estuarine and lagoonal background concentrations. Although adverse effects from these
contaminants are unlikely at present there appears to have been a slight deterioration of
sediment quality over time at site A, with Cd, Cr, Cu, Ni and Pb increasing over time.
In terms of nutrients, levels at all sites were within the moderately enriched range, but well within
results observed for other Hawke’s Bay estuaries (Madarasz-Smith 2016).
Based on these results, it is suggested that the discharge is likely to be having a persistent
adverse effect on sediment quality from organic loading at site A immediately downstream from
the discharge.
When assessing temporal and spatial trends in sediment contaminants it is standard practice to
normalise contaminant concentrations to 100% of the mud/fine component to account for
changes in sediment composition. It is possible that these results could be an artefact of this
process. Direct monitoring of the fine fraction (63µm) is recommended to provide more
certainty around the results obtained.

MONITORING OF BENTHIC EFFECTS OF THE WDC OUTFALL DISCHARGE: 2017 SURVEY
PROJECT: TFN17005 REPORT STATUS: DRAFT PAGE: 31
BIOLOGICAL CHARACTERISTICS Given evidence of accumulation of organic matter at site A it may be expected that the
infaunal community there responds in a manner that is different and perverse compared to
other sites. Certainly the infaunal community structure during the present survey was spatially
variable and significantly different among sites, with communities tending to reflect differences
in sediment texture, and to some extent, level of organic matter. However, the temporal
component of variability, or natural variability, was also significant and indeed had a stronger
influence on community structure than that explained by site, or spatial, differences.
Notwithstanding this finding the highest degree of inter-survey variability across all summary
indices and among sites was site A, while the magnitude of variation in community structure,
both within and between years, was relatively greater at sites immediately surrounding the
outfall (particularly site A) compared to the reference site C. This suggests that despite
significant year to year variation there is a discernible site effect with those sites immediately
surrounding the outfall not as resilient to perturbations in the environment as reference site C.
In terms of infaunal summary indices, apart from significantly higher abundance at site B
compared to all other sites, few other differences were detected among sites for any of the
other indices. This suggests that the despite the differences in community structure and
increased levels of stress at sites around the outfall, the magnitude of effects from organic
matter accumulation on infaunal community characteristics is slight-minor. Moreover the
dominance of polychaete species among all sites and the generally low numbers of filter
feeding bivalve species suggests the infaunal assemblages among all sites is subjected to one or
more stressors that have a greater influencing effect on community characteristics than the
outfall discharge.
A comparison of biological summary indices from the present survey against other Hawke’s Bay
estuary sites (Table 7) does tend to support this view with scores for taxa richness and
abundance in particular from the present survey in the lower half of the range, suggesting that
the overall health of the Wairoa River estuary may be compromised. Further evidence of
broader scale deterioration in the estuary infaunal health was provided by the detection of
significant negative trends in taxa richness and abundance at site C and site A and abundance
at site B.
Table 7: Summary of average abundance, taxa richness, Pielou’s evenness, Margalef’s richness and Shannon-Weiner diversity index scores at estuarine monitoring sites in the Hawke’s Bay region from recent benthic surveys, including the present survey.
Estuary
(site)
Abundance
(N)
±1SE
Taxa richness (S)
±1SE
Margalef’s
richness (d)
±1SE
Pielou’s
evenness (J’)
±1SE
S-W diversity
index (H’loge)
±1SE
Wairoa
(site A)1 4.3 ± 1.2 3 ± 0.6 1.45 ± 0.12 0.92 ± 0.04 0.96 ± 0.16
Wairoa
(site B)1 40.0 ± 3.5 5.2 ± 0.7 1.14 ± 0.18 0.55 ± 0.04 0.91 ± 0.13
Wairoa
(site C)1 16.6 ± 2.1 3.2 ± 0.5 0.78 ± 0.14 0.69 ± 0.07 0.74 ± 0.07
Wairoa
(site D)1 10.0 ± 2.8 3.2 ± 0.4 1.12 ± 0.24 0.81 ± 0.09 0.93 ± 0.17
Ahuriri
(site A)2 44.4 ± 7.9 9.4 ± 0.8 2.30 ± 0.16 0.84 ± 0.02 1.85 ± 0.08
Porangahau
(site A)2 6.6 ± 2.1 3.1 ± 0.3 1.31 ± 0.14 0.88 ± 0.04 0.94 ± 0.08
Waitangi
(site A)2 89 ± 12.7 4.8 ± 0.5 0.83 ± 0.09 0.43 ± 0.04 0.68 ± 0.09
Tukituki
(site A)2 72.8 ± 13.4 6.2 ± 0.6 1.25 ± 0.18 0.76 ± 0.06 1.36 ± 0.12
1Present survey (2017), 2Hawke’s Bay Regional Council Estuarine Monitoring Programme - 2016 results.
There appears to be several factors influencing the biological characteristics of sites including
both the discharge and other up catchment sources of contaminants, e.g. organic matter and
fine sediments. In summary, ecological condition among all sites is poor-moderate, though

MONITORING OF BENTHIC EFFECTS OF THE WDC OUTFALL DISCHARGE: 2017 SURVEY
PROJECT: TFN17005 REPORT STATUS: DRAFT PAGE: 32
evidence indicates infaunal communities around the outfall are responding negatively to
wastewater discharge. The magnitude of this effect on infauna however is slight-minor, though
there is also some evidence of a deterioration of infaunal characteristics of the Wairoa River
estuary as a whole. In situations where the wastewater is able to exit the estuary in a timely
manner the contribution of this effect to the suggested overall estuary deterioration is likely to be
less than minor. At times of rivermouth restriction, and wastewater lingers in the primary basin, it
is suggested that the discharge constitutes a significant adverse effect.
6. CONCLUSION There is a persistent adverse effect on sediment quality from organic loading in the area 100m
downstream of the outfall that results in an infaunal community that despite being subject to
higher stress than upstream sites remains similar in terms of biological ‘health’ indices. The
discharge therefore appears to be enriching the downstream area adjacent to the outfall in a
manner in which adverse effects are minor. The contribution of this effect to deterioration of
whole estuary health is therefore less than minor in circumstances where the wastewater is able
to exit the estuary basin rapidly. Where wastewater is prevented from exiting the estuary basin in
a timely manner then the effect from wastewater discharge likely significantly affects the
receiving environment, with adverse effects considered more than minor.

MONITORING OF BENTHIC EFFECTS OF THE WDC OUTFALL DISCHARGE: 2017 SURVEY
PROJECT: TFN17005 REPORT STATUS: DRAFT PAGE: 33
7. REFERENCES Anderson, M. J. (2005). PERMANOVA: a FORTRAN computer program for permutational
multivariate analysis of variance., Department of Statistics, University of Auckland, New Zealand.
ANZECC (2000). Australian and New Zealand guidelines for fresh and marine water quality 2000,
Volume 1., National Water Quality Management Strategy Paper No. 4. Australian and New
Zealand Environment and Conservation Council and Agriculture and Resource Management
Council of Australia and New Zealand, Canberra.
Barter, P. (2007). Wairoa District Council Wastewater Outfall Dye Dilution Study. Report prepared
for EAM Ltd. and Wairoa District Council., Cawthron.
Clarke, K. R. and R. N. Gorley (2001). PRIMER v5: User manual. Plymouth Marine Laboratory,
United Kingdom, PRIMER-E Ltd.
Clarke, K. R. and R. M. Warwick (1994). Changes in marine communities; an approach to
statistical analysis and interpretation., Natural Environment Research Council, United Kingdom.
EAM (2011). Investigation of groundwater infiltration of the Wairoa District Council reticulated
wastewater network., Environmental Assessments and Monitoring Limited (EAM Ltd).
Hume, T. M., T. Snelder, et al. (2007). "A controlling factor approach to estuary classification."
Ocean & Coastal Management 50 905-929.
Huston, M. A. (1997). "Hidden treatments in ecological experiments: re-evaluating the ecosystem
function of biodiversity." Oecologia 110(4): 449-460.
Kruskal, J. B. and M. Wish (1978). Multidimensional scaling. Beverely Hills, California, Sage
University.
Larcombe, M. F. (1996). AFFCO Wairoa Liquid Waste Discharge Effects on the Wairoa Estuary.
Report prepared for AFFCO. . Auckland, Bioresearches.
Larcombe, M. F. (1996). Wairoa Sewage Treatment Plant Discharge Effects on the Wairoa
Estuary. Report prepared for Wairoa District Council., Bioresearches.
Madarasz-Smith, A. L. (2016). The estuaries of the TANK Catchments: Ahuriri and Waitangi
estuaries, values, State and Trends., HBRC.
Metson, A. J., W. M. H. Saunders, et al. (1971). "Some chemical properties of soils from areas of
Barley grass (Hordeum murinum L) infestation. ." New Zealnd Journal of Agricultural Research,
14(2): 334-351.
NIWA (2008). Time Trends, Ian Jowett: Analysis of trends in water quality data.
Robertson, B. M., L. Stevens, et al. (2016). NZ Estuary Trophic Index Screening Tool 2. Determining
Monitoring Indicators and Assessing Estuary Trophic State. Report Prepared for Envirolink Tools
Project: Estuarine Trophic Index, MBIE/NIWA: 68.
Seymour, T., K. Hogan, et al. (1990). Coastal Resource Inventory First Order Survey East Coast
Conservancy, Department of Conservation Wellington.
Smith, S. (2007). Assessment of Ecological Effects on the Wairoa River Estuary from the Wairoa
Wastewater Treatment Plant Outfall. Report prepared for the Wairoa District Council. , EAM Ltd.:
47.

MONITORING OF BENTHIC EFFECTS OF THE WDC OUTFALL DISCHARGE: 2017 SURVEY
PROJECT: TFN17005 REPORT STATUS: DRAFT PAGE: 34
Smith, S. (2011). Monitoring of benthic effects of the Wairoa District Council wastewater
treatment plant outfall discharge at sites in the Lower airoa River estuary: 2011 survey. Report
Prepared fro Wairoa District Council, EAM Environmental Consultants.
StatSoft (2004). STATISTICA version 7. data analysis software system, www.statsoft.com.
Strong, J. M. (2005). Background sediment trace metal concentrations of major estuarine, and
lagoon systems in the Hawke's Bay region, New Zealand. School of Environmental and Marine
Science. Auckland, University of Auckland.
Walters, K. and L. D. Coen (2006). "A comparison of statistical approaches to analyzing
community convergence between natural and constructed oyster reefs." Journal of
Experimental Marine Biology and Ecology(330): 81-95.

MONITORING OF BENTHIC EFFECTS OF THE WDC OUTFALL DISCHARGE: 2017 SURVEY
PROJECT: TFN17005 REPORT STATUS: DRAFT PAGE: 35
APPENDIX ONE SAMPLING SITES
Table A1-1: Location of WDC outfall monitoring sites sampled during the present (2017) survey.
Site Distance from outfall Description NZTM (NZGD2000)
East North
A 100 Upstream “impact” 1982449 5667310
B 100 Downstream
“impact” 1982583 5667455
C 500 Upstream
“reference” 1982840 5667752
D 100 Inshore “impact” 1982432 5667454

MONITORING OF BENTHIC EFFECTS OF THE WDC OUTFALL DISCHARGE: 2017 SURVEY
PROJECT: TFN17005 REPORT STATUS: DRAFT PAGE: 36
APPENDIX TWO SEDIMENT CORE PROFILES
FIGURE A2-1: SEDIMENT CORE PROFILES OF THE WDC OUTFALL MONITORING SITES A (100M DOWNSTREAM) AND B (100M UPSTREAM).

MONITORING OF BENTHIC EFFECTS OF THE WDC OUTFALL DISCHARGE: 2017 SURVEY
PROJECT: TFN17005 REPORT STATUS: DRAFT PAGE: 37
FIGURE A2-2: SEDIENT CORE PROFILES OF THE WDC OUTFALL MONITORING SITES C (500M UPSTREAM) AND D (100M INSHORE OF OUTFALL).

MONITORING OF BENTHIC EFFECTS OF THE WDC OUTFALL DISCHARGE: 2017 SURVEY
PROJECT: TFN17005 REPORT STATUS: DRAFT PAGE: 38
APPENDIX THREE SITE APPARENT RDP LAYER DEPTHS
Table A3-1: Apparent Redox Discontinuity Potential layer depths.
Site aRDP depth (cm)
WAI A1 1.8
WAI A2 2.3
WAI A3 2.1
WAI A4 1.6
WAI A5 1.9
WAI B1 6.4
WAI B2 6.0
WAI B3 5.9
WAI B4 4.2
WAI B5 5.5
WAI C1 2.9
WAI C2 2.6
WAI C3 3.3
WAI C4 3.2
WAI C5 1.0
WAI D1 1.8
WAI D2 2.1
WAI D3 11.5
WAI D4 6.9
WAI D5 6.3 .

MONITORING OF BENTHIC EFFECTS OF THE WDC OUTFALL DISCHARGE: 2017 SURVEY
PROJECT: TFN17005 REPORT STATUS: DRAFT PAGE: 39
APPENDIX FOUR SEDIMENT TEXTURE, ORGANIC MATTER & TRACE ELEMENT DATA
Site Clay and Silt
(%d/w) <63µm
Very Fine Sand (%d/w)
63 - 125µm
Fine Sand (%d/w)
125 - 250µm
Medium Sand (%d/w)
250 - 500µm
Coarse Sand (%d/w)
500µm - 1mm
Very Coarse
Sand (%d/w)
1 - 2mm
Gravel (%d/w)
>2mm
WAI A 62.9 26 9.6 0.6 0.2 0.8 0
WAI B 9.3 21.5 68.2 0.8 0.1 0.2 0
WAI C 63.7 23.6 11.2 0.9 0.4 0.1 0.1
WAI D 37.6 21.3 39.2 1.5 0.1 0.4 0
Site As
mg/kg (dry wt)
Cd mg/kg (dry wt)
Cr mg/kg (dry wt)
Cu mg/kg (dry wt)
Hg mg/kg (dry wt)
Ni mg/kg (dry wt)
Pb mg/kg (dry wt)
Zn mg/kg (dry wt)
P mg/kg (dry wt)
N g/100g
(dry wt)
TVS g/100g
(dry wt)
WAI A1 3 0.098 14.8 10 0.036 16 8.8 61 480 0.11 4.8
WAI A2 3 0.076 12.9 8.5 0.034 14.8 7.7 47 450 0.09 5.2
WAI A3 3 0.061 11.5 7.4 0.034 12.6 6.7 40 380 0.06 3.6
WAI A4 4 0.069 13.1 9 0.035 14 8.1 55 430 0.09 4.8
WAI A5 3.5 <0.1 13.4 9.1 0.035 14.9 8.5 58 450 0.09 4.7
WAI B1 2.6 0.024 7.9 3.9 0.018 9.1 4.6 30 270 <0.05 1.36
WAI B2 2.7 0.027 8.3 3.7 0.021 9.1 4.6 31 300 <0.05 1.21
WAI B3 2.5 0.027 8.2 3.8 0.024 9.3 6.7 30 260 <0.05 1.31
WAI B4 2.6 0.029 8.3 4 0.022 9.3 4.5 31 270 <0.05 1.29
WAI B5 3 0.034 8.5 3.9 0.022 9.5 4.7 32 270 <0.05 1.32
WAI C1 4 0.11 13.3 9.5 0.04 15.8 9.3 49 440 0.09 1.64
WAI C2 3.3 0.077 11.9 8.3 0.045 14.6 8.5 45 410 0.08 1.41
WAI C3 2.7 0.034 8.5 4.3 0.024 9.7 6 34 290 <0.05 0.44
WAI C4 2.9 0.07 11.5 7.6 0.034 13.8 8.1 42 380 0.07 1.26
WAI C5 3 0.08 11.9 8.1 0.043 14.5 8.2 44 400 0.08 1.33
WAI D1 2 0.033 8.9 4 0.67 9 5.2 38 310 <0.05 1.43
WAI D2 3 0.046 9.4 5 0.019 11 5.7 41 340 <0.05 1.63
WAI D3 2.7 <0.1 10 5.9 0.024 11.7 6.1 44 360 <0.05 1.73
WAI D4 2 <0.1 9.6 5 0.03 10 6 40 320 <0.05 1.76
WAI D5 3 <0.1 10.3 6 0.02 12 6.4 44 360 <0.05 2.3

MONITORING OF BENTHIC EFFECTS OF THE WDC OUTFALL DISCHARGE: 2017 SURVEY
PROJECT: TFN17005 REPORT STATUS: DRAFT PAGE: 40
APPENDIX FIVE INFAUNAL DATA WDC OUTFALL 2017 SURVEY WAI A WAI B WAI C WAI D
General group Taxa 1 2 3 4 5 1 2 3 4 5 1 2 3 4 5 1 2 3 4 5
Bivalvia Paphies australis 2 1
Bivalvia Austrovenus stutchburyi 1 3 1 1 3 1 1
Gastropoda Potamopyrgus estuarinus 2 13 2 1 6 4 3 2 9 17
Nemertea Nemertea 1
Oligochaeta Oligochaete 1 4 1 2
Polychaeta: Nereididae Nicon aestuariensis 3 3 1 2 1 3 6 1 2 3 11 17 10 12 9 1
Polychaeta: Spionidae Scolecolepides sp. 1 1 1 1 3
Polychaeta: Spionidae Boccardia spp. 24 30 22 29 37 1 1 3 2 2
Decapoda Halicarcinus whitei 2 1
Decapoda Helice crassa
Mysidacea Mysid shrimp 1
Amphipoda Paracorphium excavatum 1 1 1 1 1 6 2 2 3 1
Trichoptera Trichopteran 1
NO OF INDIVIDUALS 6 5 2 2 1 30 37 37 47 49 15 24 12 18 14 6 8 12 20 4
NO OF TAXA 4 3 2 1 1 5 3 7 5 6 3 5 3 2 3 4 4 2 3 3

MONITORING OF BENTHIC EFFECTS OF THE WDC OUTFALL DISCHARGE: 2017 SURVEY
PROJECT: TFN17005 REPORT STATUS: DRAFT PAGE: 41
APPENDIX SIX REPORT LIMITATIONS
Triplefin Consulting Ltd (Triplefin) has provided this Document, and is subject to the following
limitations:
I. This Document has been prepared for the particular purpose outlined in Triplefin's
proposal and no responsibility is accepted for the use of this Document, in whole or in part, in
other contexts or for any other purpose.
II. The scope and the period of Triplefin's Services are as described in Triplefin’s proposal,
and are subject to restrictions and limitations. Triplefin did not perform a complete assessment of
all possible conditions or circumstances that may exist at the site referenced in the Document. If
a service is not expressly indicated, do not assume it has been provided. If a matter is not
addressed, do not assume that any determination has been made by Triplefin in regards to it.
III. Conditions may exist which were undetectable given the limited nature of the enquiry
Triplefin was retained to undertake with respect to the site. Variations in conditions may occur
between investigatory locations, and there may be special conditions pertaining to the site
which have not been revealed by the investigation and which have not therefore been taken
into account in the Document. Accordingly, additional studies and actions may be required.
IV. In addition, it is recognized that the passage of time affects the information and
assessment provided in this Document. Triplefin's opinions are based upon information that
existed at the time of the production of the Document. It is understood that the services
provided allowed Triplefin to form no more than an opinion of the actual conditions of the site at
the time the site was visited and cannot be used to assess the effect of any subsequent
changes in the quality of the site, or its surroundings, or any laws or regulations.
V. Any assessments made in this Document are based on the conditions indicated from
published sources and the investigation described. No warranty is included; either express or
implied, that the actual conditions will conform exactly to the assessments contained in this
Document.
VI. Where data supplied by the Client or other external sources, including previous site
investigation data, have been used, it has been assumed that the information is correct unless
otherwise stated. No responsibility is accepted by Triplefin for incomplete or inaccurate data
supplied by others.
VII. The Client acknowledges that Triplefin may have retained sub-consultants affiliated with
Triplefin to provide Services for the benefit of Triplefin. Triplefin will be fully responsible to the
Client for the Services and work done by all of its sub-consultants and subcontractors. The Client
agrees that it will only assert claims against and seek to recover losses, damages or other
liabilities from Triplefin and not Triplefin's affiliated companies, and their employees, officers and
directors.
VIII. This Document is provided for sole use by the Client and is confidential to it and its
professional advisers. No responsibility whatsoever for the contents of this Document will be
accepted to any person other than the Client. Any use which a third party makes of this
Document, or any reliance on or decisions to be made based on it, is the responsibility of such
third parties. Triplefin accepts no responsibility for damages, if any, suffered by any third party as
a result of decisions made or actions based on this Document.