monitoring of coastal marine and estuarine ecology … · 2 monitoring of coastal marine and...
TRANSCRIPT


2
MONITORING OF COASTAL MARINE AND ESTUARINE ECOLOGY OF MAHARASHTRA: PHASE I Part-A (Main Report)

3
1 Background
The Maharashtra coast that stretches between Bordi/Dahanu in the North and Redi/Terekhol in the South is about 720 km long and 30-50 km wide. The shoreline is indented by numerous west flowing river mouths, creeks, bays, headlands, promontories and cliffs. There are about 18 prominent creeks/estuaries along the coast many of which harbour mangrove habitats. Like elsewhere in the world, the coastal region of the State is thus a place of hectic human activity, intense urbanization in pockets and enhanced industrialization, resulting in degradation, directly or indirectly, of marine environment through indiscriminate releases of domestic and industrial effluents, reclamation, offshore constructions, movement of ships and loading and unloading of a variety of cargo at ports etc. Several coastal ecosystems along the west coast of India are now thus highly disturbed and threatened, encountering problems like pollution, siltation and erosion, flooding, saltwater intrusion, storm surges and other hazards. Hence, appropriate management strategies are needed to ensure the sustainable development and management of coastal areas and their resources. Marine environmental management through proper assessment of water quality vis-à-vis the existing wastewater discharges, and reliable impact prediction on the coastal ecosystem due to ongoing activities are prerequisite for optimum utilization of marine areas without harming the ecosystem. A comprehensive programme for coastal area development in a sustainable manner, therefore, requires detailed information on levels of pollutants, quality and quantity of wastewater entering the system, physicochemical characteristics as well as biological productivity at different levels, the flora and fauna inhabiting the area and their community structure, sediment nature, circulation, dispersion potential, tidal flushing etc. Evidently, environmental data requirements are extremely high and it is necessary to adopt a multidisciplinary approach for proper evaluation of ecosystems enabling corrective measures. With this view Maharashtra Pollution Control Board (MPCB) approached the National Institute of Oceanography, NIO (Mumbai) to undertake two seasons monitoring studies in order to assess the status of coastal ecology along the Maharashtra coast. NIO conducted these studies during February-May 2007 (premonsoon) and October-February 2008 (postmonsoon) as a part (Phase I) of the following long term objectives.
2 Objectives (i) To monitor ecology of inshore and coastal areas in order to identify changes, if any, in water quality, sediment quality and biological characteristics and utilize the findings to suggest suitable corrective measures (Phase-I). (ii) To monitor for indicator pollutants in areas identified to be contaminated with specific pollutants and assess recovery of the ecosystems (Phase II).

4
(iii) To undertake predictive modelling of selective marine areas for planned disposal of industrial and domestic effluents (Phase III). The findings of the Phase I studies are presented in the two parts. Part A: The brief description of the study area, nature of wastewater influxes,
prevailing environment, ecological assessment, predictive modelling (as available with NIO for regions along Maharashtra coast), summary and conclusions and recommendations based on the studies conducted during Phase I and the past data available with NIO are presented in this report. Part B: The data that have emerged from field studies of Phase I monitoring is presented as Part B of the report.
3 Study area During the present study the sampling stations along the open coast were selected, to represent inshore (0 to 0.5 km), nearshore (2 to 3 km) and offshore (4 to 5 km) region. Estuaries/Creeks were sampled at their lower, middle and upper zones and in many cases the transect extended to the open sea. At least one station on each transect was operated over a tidal cycle and the remaining stations were spot sampled in duplicate. Particular attention was given to sample marine and estuarine areas in the vicinity of significant urban, industrial or maritime establishments. The locations of sampling stations are given in the following table:

5
Station Sr. No. Transect
1 2 3 4 5 6 7 8 9
1 Dahanu (Coastal/creek) DH1 DH2 DH3 DH4 DH5 DH6 - -
2 Tarapur (Coastal/creek) TP1 TP2 TP3 TP4 TP5 TP6 - -
3 Bassein/Ulhas River (Coastal/estuary) BS1 BS2 BS3 BS4 BS5 BS6 BS7 -
4 Manori/ Gorai (Creek) - - - BYMa4 BYMa5 BYMa6 - -
5 Versova (Creek) - - - BYV4 BYV5 - - -
6 Mahim (Creek) - - - BYM4 BYM5 BYM6 - -
7 Bandra Outfall (Coastal) BYB1 BYB2 - - - - -
8 Worli Outfall (Coastal) BYW1 BYW2 - - - - - -
9 Thane/Mumbai Harbour (Coastal/creek) BY1 BY2 BY3 BY4 BY5 BY6 - -
10 Patalganga (Estuary) - - - PT4/4A PT5 PT6 PT7 PT8 PT9
11 Amba Estuary - - - AB4 AB5 AB6 AB7 -
12 Thal RCF, DP (Coastal) DP - - - - - - -
13 Alibaug (Coastal) A1 A2 A3 - - - - -
14 Kundalika (Coastal/estuary) K1 K2 K3 K4 K5 K6 K7 -
15 Murud/Rajpuri (Coastal/creek) MR1 MR2 MR3 MR4 MR5 MR6 MR7 -
16 Savitri (Coastal/estuary) S1 S2 S3 S4 S5 S6 S7 -
17 Dabhol/Vashishti (Coastal/estuary) VS1 VS2 VS3 VS4 VS5 VS6 VS7 -
18 Enron D.P. (Coastal) - - ENDP - - - - -
19 Jaigad/Shastri (Estuary) J1 J2 J3 J4 J5 J6 - -
20 Ratnagiri/Mirya Harbour (Coastal/bay) R1 R2 R3 R4 R5 - - -
21 Bhatye (Bhatye River) - - - B4 B5 B6 - -
22 Pawas (Creek) - - - P4 P5 P6 - -
23 Vijaydurg/Waghotan (Coastal/estuary) VJ1 VJ2 VJ3 VJ4 VJ5 VJ6 - -
24 Deogad (Coastal/estuary) D1 D2 D3 D4 D5 D6 - -
25 Malvan (Coastal/Harbour) M1 M2 M3 M4 - - - -
26 Vengurla (Coastal) V1 V2 V3 - - - - -
27 Redi (Coastal) RD1 RD2 RD3 - - - - -

6
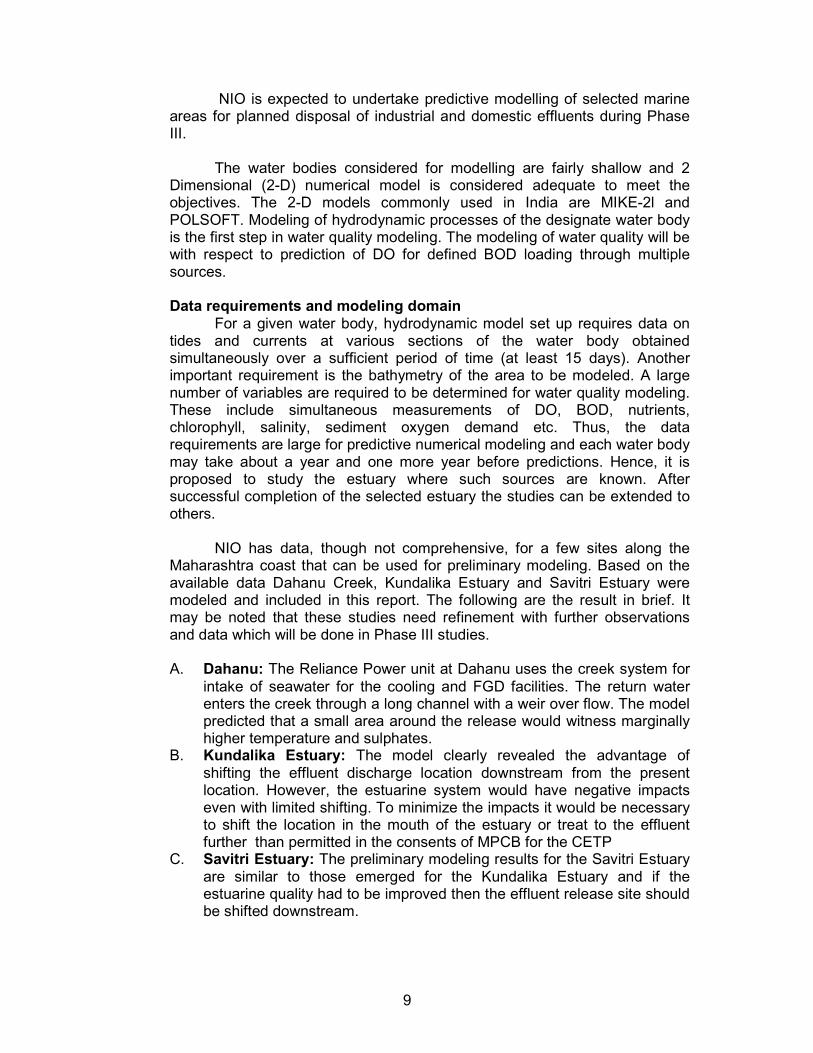
The station locations were plotted on satellite imageries and presented under respective Section. Typical examples are illustrated in Figures 1 and 2. Nearly 25 environmental parameters were monitored at about 125 sampling locations with more than 1100 sampling events.
4 Parameters Water quality Temperature, pH, salinity, Suspended Solids (SS), Dissolved Oxygen (DO), Biochemical Oxygen Demand (BOD), Nitrate (NO3), Nitrite (NO2), Ammonia (NH4), Dissolved phosphate, Petroleum Hydrocarbons (PHc), Phenols.
Sediment quality Texture, Organic Carbon (Corg), Phosphorous (P), PHc, Total Viable counts (TVC), Total coliforms (TC), Feacal coliforms (FC) etc.
Aluminium (Al), Chromium (Cr), Manganese (Mn), Iron (Fe), Cobalt (Co), Nickel (Ni), Copper (Cu), Zinc (Zn), Cadmium (Cd), Lead (Pb) and Mercury (Hg) Flora and Fauna Microbiology - TVC, TC, FC etc. Phytoplankton - phytopigments, cell counts and total genera Zooplankton - biomass, population and total groups Macrobenthos - biomass, population and total groups
5 Wastewater influx The nature of significant point releases of wastewater received at different transects were as follows. 1. Dahanu - Industrial and domestic wastes 2. Tarapur - Industrial and domestic wastes 3. Bassein - Industrial and domestic wastes 4. Manori - Industrial and domestic wastes 5. Versova - Industrial and domestic wastes 6. Bandra - Domestic waste through marine outfall 7. Mahim - Industrial and domestic wastes 8. Worli - Domestic waste through marine outfall 9. Thane - Industrial, domestic and port-based wastes 10. Patalganga - Industrial waste 11. Amba - Industrial and port-based wastes 12. Thal - Industrial waste (RCF, DP) 13. Alibaug - Domestic (minor) waste 14. Kundalika - Industrial and domestic (minor) wastes 15. Murud - Domestic (minor) waste 16. Savitri - Industrial and domestic (minor) wastes 17. Vashishti - Industrial and domestic (minor) wastes 18. Enron - Industrial waste 19. Jaigad - Domestic (minor) and Port-based wastes 20. Ratnagiri - Industrial (minor), Port-based and domestic wastes

7
21. Bhatye - Domestic (minor) waste 22. Pawas - Domestic (minor) and port-based wastes 23. Vijaydurg - Domestic (minor) and port-based wastes 24. Deogad - Domestic (minor) waste 25. Malvan - Domestic (minor) and fishery harbour wastes 26. Vengurla - Domestic (minor) waste 27. Redi -Port-based waste
6 Results
Results of the present monitoring are discussed transectwise in the Chapter 4 of the report “Prevailing environment” under the sub-heads water quality, sediment quality and flora and fauna. To facilitate discussion the data have been grouped under different segments like coastal water, lower segment, middle segment and upper segment. Stations 1 to 3 were the part of the open coastal area. The stations operated in the bay / creek / river / estuary were grouped appropriately depending on the length of the respective water body sampled. Comparison of the two season data i.e. premonsoon and postmonsoon for a given transect is also included in this Chapter. An illustrative example for chlorophyll and phaeophytin is illustrated in the following table:
Chlorophyll a (mg/m3)
Phaeophytin (mg/m3)
Zone (Dabhol / Vashishti Estuary) Min Max Av Min Max Av
Premonsoon
Coastal water (Sts VS1 to VS3)
0.2 0.4 0.3 0.5 6.2 2.5
Lower estuary (Sts VS4 and VS5)
0.2 4.9 1.6 0.2 6.7 2.1
Upper estuary (Sts VS6 and VS7)
0.2 2.3 0.7 0.2 12.4 4.7
Postmonsoon
Coastal water (Sts VS1 to VS3)
1.0 2.3 1.9 0.1 0.7 0.4
Lower estuary (Sts VS4 and VS5)
1.4 1.9 1.8 0.1 2.0 0.5
Upper estuary (Sts VS6 and VS7)
1.4 20.3 4.4 0.1 5.0 1.3
The results of temporal variations which would reveal tidal variability of selected parameters were plotted graphically for each parameter and included in this Chapter. An example is shown in Figure 3 and 4.
7 Ecological assessment For assessment of the data generated during monitoring, it is crucial to define the baseline against which the results of monitoring could be

8
compared. Fixing the baseline in itself is not easy in the absence of long-term database because a natural marine environment is prone to spatial and temporal changes associated with tidal movements and seasonal fluctuations. The impact of anthropogenic activities on the marine ecosystems can be achieved in a limited manner by comparing the data for a particular parameter obtained prior to the commencement of anthropogenic release. Unfortunately, for several areas such data are not available for the Maharashtra coast. Since, the pre-effluent release baseline for these ecosystems is not available, database generated by NIO over the years through studies conducted from time to time in these areas was considered as the best available approach to assess the impacts. The ecological assessment of selected parameters for all the 27 transect was done separately for coastal waters and creek/estuarine waters by diving areas in to two regions. (I) North Maharashtra –Dahanu to Murud and (II) South Maharashtra – Murud to Redi The parameters considered for the assessment were Water quality - Temperature, pH, salinity, SS, DO, BOD, phosphorous and
nitrogen compounds, phenols and PHc Sediment quality -Texture, heavy metals, Corg, Phosphorous, PHc
Flora and Fauna - Bacteria (FC and TC), phytoplankton, zooplankton and
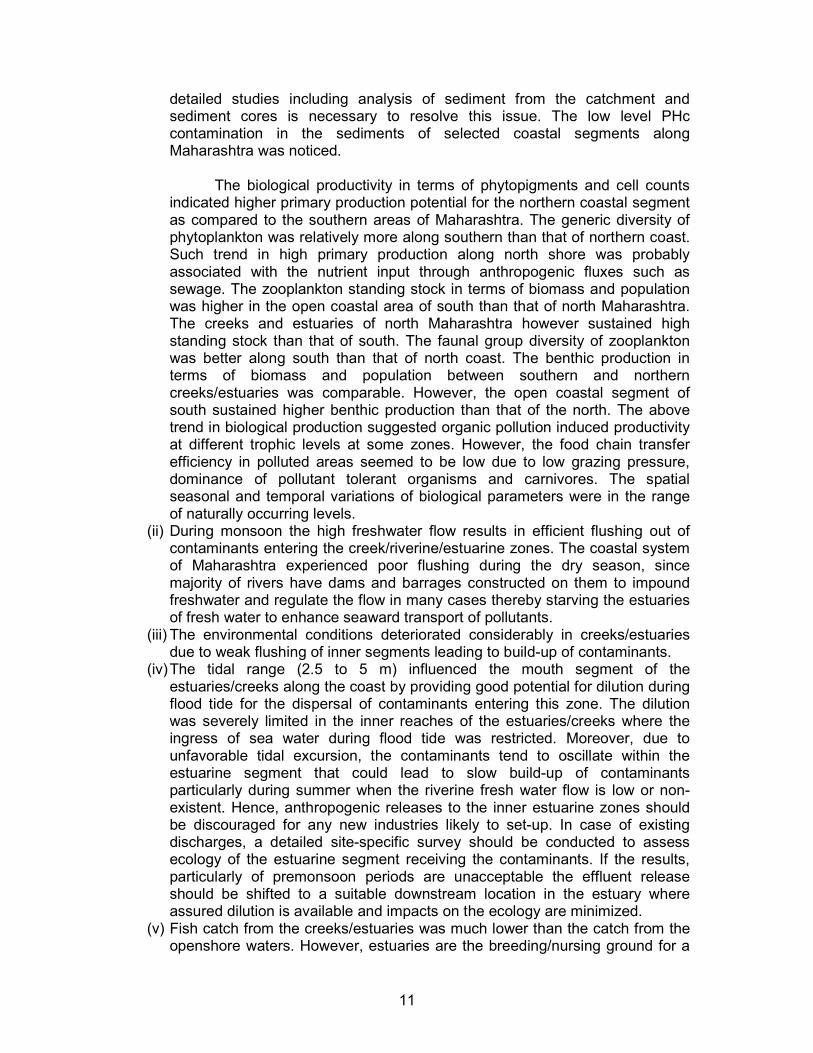
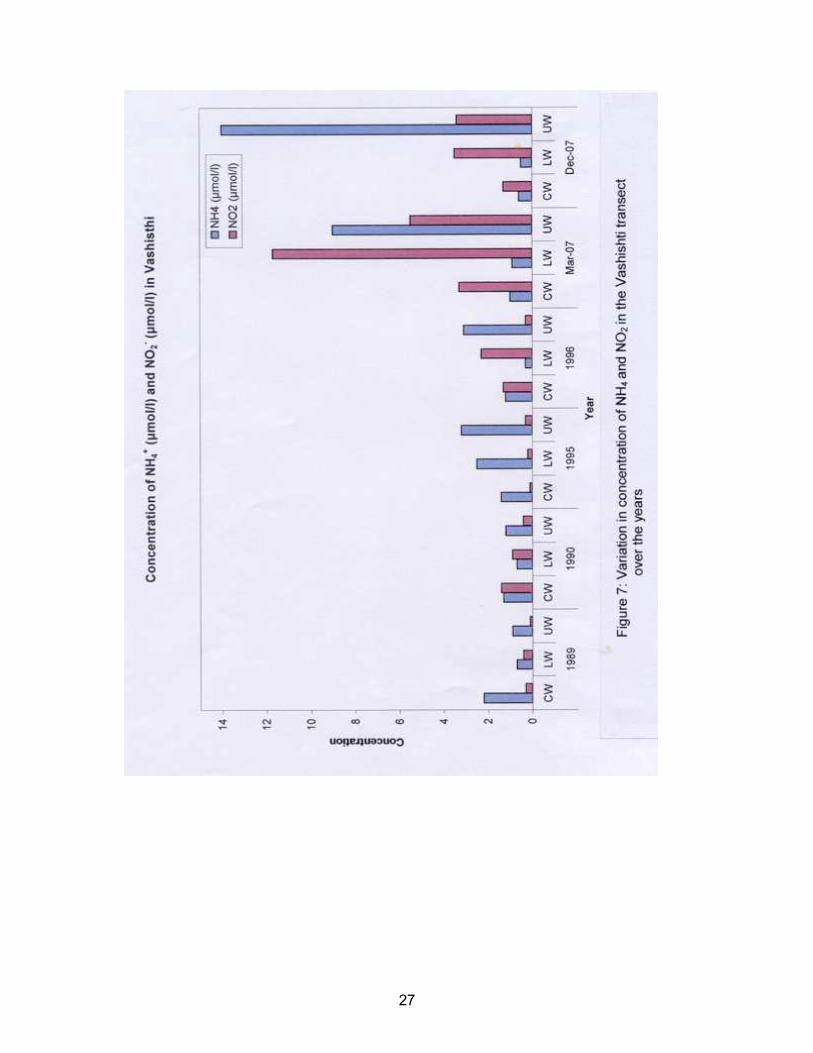
macrobenthos Transectwise average values are presented in the figures and as a representative case reproduced in Figures 5 and 6. Segmentwise assessment of all transects in combination with the historical data (wherever available) was also made and plotted as bar-carts, illustrations of which are reproduced in Figures 7 and 8. The analysis of all the results so processed is made in Chapter 5 entitled “Ecological assessment” wherein prevailing status of marine environment along the transects investigated is made to the extent possible.
8 Prediction modelling Industrialization and urbanization is bound to increase in coastal areas of Maharashtra. This means effluent loadings on various water bodies will progressively increase requiring their integrated management to prevent deterioration in their ecology. This can be scientifically managed if designate water bodies are modeled aimed at quantitative prediction of proposed activity on the water body to enable suitable decision making. In the context of effluent release, the water bodies could be considered for modelling are the Versova, Mahim and Thane Creeks, and Ulhas, Patalganga, Amba, Kundalika, Savitri, Vashishti and Shastri estuaries.
9
NIO is expected to undertake predictive modelling of selected marine areas for planned disposal of industrial and domestic effluents during Phase III. The water bodies considered for modelling are fairly shallow and 2 Dimensional (2-D) numerical model is considered adequate to meet the objectives. The 2-D models commonly used in India are MIKE-2l and POLSOFT. Modeling of hydrodynamic processes of the designate water body is the first step in water quality modeling. The modeling of water quality will be with respect to prediction of DO for defined BOD loading through multiple sources. Data requirements and modeling domain For a given water body, hydrodynamic model set up requires data on tides and currents at various sections of the water body obtained simultaneously over a sufficient period of time (at least 15 days). Another important requirement is the bathymetry of the area to be modeled. A large number of variables are required to be determined for water quality modeling. These include simultaneous measurements of DO, BOD, nutrients, chlorophyll, salinity, sediment oxygen demand etc. Thus, the data requirements are large for predictive numerical modeling and each water body may take about a year and one more year before predictions. Hence, it is proposed to study the estuary where such sources are known. After successful completion of the selected estuary the studies can be extended to others. NIO has data, though not comprehensive, for a few sites along the Maharashtra coast that can be used for preliminary modeling. Based on the available data Dahanu Creek, Kundalika Estuary and Savitri Estuary were modeled and included in this report. The following are the result in brief. It may be noted that these studies need refinement with further observations and data which will be done in Phase III studies. A. Dahanu: The Reliance Power unit at Dahanu uses the creek system for
intake of seawater for the cooling and FGD facilities. The return water enters the creek through a long channel with a weir over flow. The model predicted that a small area around the release would witness marginally higher temperature and sulphates.
B. Kundalika Estuary: The model clearly revealed the advantage of shifting the effluent discharge location downstream from the present location. However, the estuarine system would have negative impacts even with limited shifting. To minimize the impacts it would be necessary to shift the location in the mouth of the estuary or treat to the effluent further than permitted in the consents of MPCB for the CETP
C. Savitri Estuary: The preliminary modeling results for the Savitri Estuary are similar to those emerged for the Kundalika Estuary and if the estuarine quality had to be improved then the effluent release site should be shifted downstream.

10
The further refining of the models would consider better (longer term) inputs of tide and water quality to predict DO depletion due to different constituents of the effluent. These need be studied in Phase II of the studies and incorporated in modeling proposed in Phase III studies.
9 Summary and Conclusion
The tentative findings of the present study along with summary are given in the chapter 7 entitled “Summary and Conclusions” and selective findings are discussed under (i) General findings and (ii) Segmentwise findings
9.1 General
(i) The data on Water quality as evaluated from various physico-chemical and biological parameters indicated that the coastal waters (unto 5 km) between Dahanu and Redi are healthy except for a few areas near highly industrialized centres of Mumbai along the north Maharashtra. Overall, most of environmental parameters showed normal values along the south Maharashtra coast compared to the north Maharashtra with noticeable deviations. Salinity was generally lower in creeks/estuaries and increase towards open coastal waters. Also, surface waters had lower salinity which increased with the depth, thus indicating some influence of river discharge on coastal salinity. Salinity of the open coast, creek/estuary of north and south Maharashtra was closely comparable suggesting absence of significant freshwater influx to the coastal area during dry season.. The DO of both north and south Maharashtra open coastal waters and southern estuaries was in the range normally recorded for marine areas. However, the creeks/ bays of coastal Maharashtra as well as the estuarine of north Maharashtra indicated occasionally very low DO (<0.5 ml/l) suggesting the impact of organic load in them. BOD levels indicated that the organic load entering the open coast through various creeks/estuaries is effectively consumed and mineralized. The nutrients like PO4
3--P, NO3 --N, NO2
--N, and NH4+-N indicated higher
values in the creeks and some estuarine segments with considerable reduction towards the sea. The higher levels of NO2
--N and NH4+-N in
inshore waters along the north Maharashtra as compared to the south segment suggested high organic input to the northern coast through anthropogenic activities leading to severe deterioration in environmental activity in many instances. The values of PHc and phenols indicated relatively more petroleum contamination in the creeks/estuaries of northern than that of southern Maharashtra suggesting high industrial activities along northern shore. High bacterial counts in terms of TVC, TC and FC occurred in water and sediment along the coastal Maharashtra. In general, the bacterial counts were high in selected creeks and estuaries than the open coast suggesting high organic input to these coastal areas. Mumbai coast and the southern estuaries were more affected as compared to the rest of the coastal regions.
Bed sediments were by and large free from anthropogenic trace metals except for Hg in some instances around Mumbai. Elevation from normal trend particularly Cr in the northern area and Cu in the south and occasional high values of Co, Zn, Cd and Pb appeared to be of lithogenic origin. Further
11
detailed studies including analysis of sediment from the catchment and sediment cores is necessary to resolve this issue. The low level PHc contamination in the sediments of selected coastal segments along Maharashtra was noticed.
The biological productivity in terms of phytopigments and cell counts indicated higher primary production potential for the northern coastal segment as compared to the southern areas of Maharashtra. The generic diversity of phytoplankton was relatively more along southern than that of northern coast. Such trend in high primary production along north shore was probably associated with the nutrient input through anthropogenic fluxes such as sewage. The zooplankton standing stock in terms of biomass and population was higher in the open coastal area of south than that of north Maharashtra. The creeks and estuaries of north Maharashtra however sustained high standing stock than that of south. The faunal group diversity of zooplankton was better along south than that of north coast. The benthic production in terms of biomass and population between southern and northern creeks/estuaries was comparable. However, the open coastal segment of south sustained higher benthic production than that of the north. The above trend in biological production suggested organic pollution induced productivity at different trophic levels at some zones. However, the food chain transfer efficiency in polluted areas seemed to be low due to low grazing pressure, dominance of pollutant tolerant organisms and carnivores. The spatial seasonal and temporal variations of biological parameters were in the range of naturally occurring levels.
(ii) During monsoon the high freshwater flow results in efficient flushing out of contaminants entering the creek/riverine/estuarine zones. The coastal system of Maharashtra experienced poor flushing during the dry season, since majority of rivers have dams and barrages constructed on them to impound freshwater and regulate the flow in many cases thereby starving the estuaries of fresh water to enhance seaward transport of pollutants.
(iii) The environmental conditions deteriorated considerably in creeks/estuaries due to weak flushing of inner segments leading to build-up of contaminants.
(iv) The tidal range (2.5 to 5 m) influenced the mouth segment of the estuaries/creeks along the coast by providing good potential for dilution during flood tide for the dispersal of contaminants entering this zone. The dilution was severely limited in the inner reaches of the estuaries/creeks where the ingress of sea water during flood tide was restricted. Moreover, due to unfavorable tidal excursion, the contaminants tend to oscillate within the estuarine segment that could lead to slow build-up of contaminants particularly during summer when the riverine fresh water flow is low or non-existent. Hence, anthropogenic releases to the inner estuarine zones should be discouraged for any new industries likely to set-up. In case of existing discharges, a detailed site-specific survey should be conducted to assess ecology of the estuarine segment receiving the contaminants. If the results, particularly of premonsoon periods are unacceptable the effluent release should be shifted to a suitable downstream location in the estuary where assured dilution is available and impacts on the ecology are minimized.
(v) Fish catch from the creeks/estuaries was much lower than the catch from the openshore waters. However, estuaries are the breeding/nursing ground for a

12
variety of commercially important fish and shell fish, therefore deterioration of their ecology could result in decline in marine fish production in the long run. Hence, while considering developments in the vicinity of these estuaries it should be ensured that their ecological quality does not deteriorate.
(vii) Release of effluents meeting MPCB/CPCB norms in the estuarine segment where tidal flushing is high, should be permitted only after proper studies to quantify initial and far-field dilutions as well as after examining the probable impacts of release on the estuarine ecology. Wherever feasible, the new industry should be persuaded to convey the treated effluent to the open sea at a properly identified site.
(viii) Organic waste, particularly sewage; has been the major contaminant in the estuaries/creeks and costal waters along Maharashtra. Domestic sewage if treated and disinfected is not harmful to aquatic life provided its release does not cause DO depletion (except in the immediate vicinity of release), it is therefore vital to assess quantitatively the capacity of different segments of each creeks/estuary to assimilate organic waste. The best approach for this purpose is to model each creek/estuary using a proven numerical model with well-defined objectives. Numerical modelling of estuaries requires detailed information on bathymetry, tides, currents, salinity, freshwater inflow, DO, BOD, nutrients, chlorophyll, primary productivity etc of the entire creek/estuarine stretch. Though it is ideal to model a creek/estuary for different freshwater flow conditions, summer environmental setting must be considered for the creek/estuaries since it is the critical period with respect to effluent release. It should be appreciated that such a study would take 2-3 years to complete for each estuary but the output would be extremely useful to integrate plans for developments along the estuarine banks within acceptable impacts on the water quality.
(ix) The coastal water of Maharashtra has a high potential to dilute and disperse contaminants and coastal industries should be encouraged to release the treated effluents meeting MPCB norms to the coastal waters and not in creeks/estuaries.
9.2 Area-Specific The findings and recommendations made below are intended to be a general guideline while planning developments particularly setting-up of industries in the area adjoining coastal water bodies like creeks/estuaries. However, since the impact of release of effluent on the aquatic ecology depends on several factors such as the quality and quantity of effluent released, location of the release, local ecology etc. adequate studies are generally required to identify the site for the discharge of effluent as well as to assess the impact of release on ecology. Most of the creeks/estuaries are relatively free from contamination by anthropogenic heavy metals (except for low level accommodation in some instances), however contamination by nutrients was evident. The major anthropogenic contaminants in these estuaries were therefore organic wastes that depleted DO in the waste-receiving waters.

13
i) Dahanu The water and sediment qualities were within expected ranges, however, organic pollution induced biological productivity especially at the primary level was recorded. The diversity of phytoplankton and zooplankton were in the normal ranges but benthos was poor. The existing effluent releases had not grossly deteriorated the creek ecology except for relatively high temperature in the immediate vicinity of the cooling water release location. ii) Tarapur
The creek transporting effluents to the coastal waters was highly degraded and resembled a sewer during low tide. The effluents entering the creek had caused severe deterioration of the creek ecology with low DO and pH and high SS, and nutrients in water; elevated levels of Zn and Cr in sediment: high bacterial counts (TVC and TC): and high primary production, phytopigments and cell counts supported by good benthic standing stock instead of zooplankton. The results indicated organic pollution induced biological production. A detailed study should be undertaken aimed at collection, treatment and release of effluents from establishments discharging in this creek to a suitable location off the open coast in the Arabian Sea. iii) Bassein (Ulhas Estuary)
The coastal water of Bassein did not reveal any gross impact of fluxes of pollutant transported through the Ulhas Estuary. Inner and middle estuarine segments, which received a variety of wastes from a large number of industries and urban-areas however exhibited low pH and low DO and high concentrations of nutrients. The sediment from the inner estuary had high burden of selective metals (Cr, Co, Zn, Hg etc). The microbial populations (TVC, TC, FC) were elevated both in water and sediment. Phytopigments were in very high concentrations in the inner segment of the estuary with unusually high phytoplankton cell counts associated with organic pollution. Zooplankton standing stock was high in the estuary than coastal waters. Zooplankton community structure though comparable between coastal and estuarine segments revealed modifications with congregations of the carnivores. Low benthic productivity off Bassein revealed an enhancement at middle and upper segment. The pollution induced high primary production was not adequately supported by secondary grazing cycle but partially supported by pollutant tolerant benthic organisms especially in the inner segments. Such trends were common in the organic polluted coastal system along Maharashtra.
iv) Manori Manori Creek which received domestic waste water was under considerable environmental strain with low and variable pH and DO and high nutrients and probability of active denitrification. The sediment contamination in the creek was limited to Pb and Hg. Creek sustained high bacterial populations (TVC, TC, FC) in water and sediment. Phytoplankton standing stock indicated an enhanced primary production probably due to enrichment

14
of nutrients, however zooplankton and benthic productivities remained above normal and high respectively, suggesting their inducement by primary production - a trend normally noticed in the organic polluted coastal system. v) Versova Versova Creek which received voluminous domestic wastewater was also under environmental stress with variable DO falling to zero at low tide in some instances. Relatively higher level of PO4
3--P and NH4+-N while low
concentration of NO3--N could be an indication of depleted DO levels
occurring in the area. Sediments did not indicate any serious metal contamination except for marginal increase in Cu and Hg concentrations. Bacteria populations were very high both in water and sediment. Biological productivity in terms of phytoplankton and zooplankton was high and macrobenthos was low. The generic/faunal diversity of phytoplankton and zooplankton was in the normal range but group diversity of benthos was low. Organic pollution induced biological production was noticed in the creek segments. vi) Mahim The impact of wastewater on the water quality of the Mahim Creek was clearly evident. Significant reduction in DO and high levels of PO4
3-P, NH4+-N
and PHc observed at creek station indicated the severity of organic pollution. The impact of pollution was however low along the open coast. The sediment contamination was in terms of relative high values of Hg, Cd, Pb and Zn. Bacterial counts were very high both in water and sediment. Standing stock of phytoplankton, zooplankton and benthos were high in the inner creek with normal generic/faunal diversity. vii) Bandra The water in the vicinity of the Bandra marine outfall had a fairly good water quality. However occasional drop in DO and high NH4
+-N indicated some impact of sewage released at this site. The metal levels in sediment were generally in the expected ranges . Bacteria counts were comparatively low both in water and sediment. Phytoplankton and zooplankton standing stock were high and variable with normal diversity. However, benthic biomass and group diversity were poor. viii) Worli The water quality in the vicinity of the Worli marine outfall was good with high DO, low BOD, normal nutrients and low PHc. The metal content in sediment did not indicate any serious contamination except a marginal increase in Hg. Bacterial population was low. Biological productivity in terms of phytoplankton, zooplankton and benthos were variable but as expected for coastal waters. ix) Thane Creek Although Thane Creek received large volumes of domestic as well as industrial wastewater, good tidal flushing rendered this creek in a relatively better health than the near by Versova and Mahim creeks.

15
In the land locked inner segment of the creek, the DO levels were tide dependent with values sometimes falling to <1 ml/l during low tide. The increase in concentration of nutrients however occurred in the inner creek. The openshore coastal waters had good water quality and the impact of wastewater releases was only marginal in this zone. Heavy metal content of sediment indicated wide spatial and temporal variability. Part of the creek recorded marginally high content of Pb, Cd, Hg and Zn. Bacteria counts were high both in the creek and open coastal segments. Phytoplankton distribution revealed wide spatial, seasonal and temporal variation with higher values and bloom formations confined to inner segment. Zooplankton and macrobenthic standing stock were high especially in the upper creek which coincided with high primary production during dry periods and the trend was comparable with earlier data. The creek revealed organic pollution induced biological production which may not represent a diverse ecosystem. x) Patalganga Estuary
The water quality was tide-dependant in different segments of the estuary. The pH, DO and nutrients values were highly variable in the inner and the middle segments. Low DO (0.2 ml/l) indicated excess loading of organic matter that lead to high BOD and high nutrients. Heavy metals in sediment varied widely with marked elevations of Cr, Co, Ni, Mn, Zn and Hg. However bacterial counts were relatively low both in water and sediment. Biological standing stock in terms of phytoplankton, zooplankton and macrobenthos varied widely, temporally, spatially as well as seasonally. The estuary sustained high primary productivity associated with organic loading, high standing stock of zooplankton and low benthic production and diversity. The estuary indicated organic pollution induced biological productivity. xi) Amba Estuary The Amba Estuary was characterized by normal water quality expected for unpolluted environments and the impacts of releases of domestic and industrial effluents appeared to be minor in terms of marginal increase in NO3
-
-N and NH4+-N than expected. Negative impact of anthropogenic release was
not evident on the sediment quality. Bacterial counts were low both in water and sediment. The distribution of phytoplankton, zooplankton and macrobenthos were highly variable with normal generic/faunal diversity. However, organic load induced high primary production during dry period was evident. The high primary production supported high benthic production instead of secondary production suggesting reduction in transfer efficiency of the food chain. The biological production during postmonsoon was better than premonsoon. xii) Thal (RCF, DP) Though this site received industrial wastewater, the water quality was relatively good with normal seasonal and temporal variation. The metal content generally represented lithogenic concentration. Bacterial counts were low in water and sediment. Standing stock of phytoplankton and zooplankton were generally high with high generic/group diversity. Macrobenthic standing stock was low with low diversity.

16
xiii) Alibaug The water quality of the region was as expected for a clean nearshore marine environment. However, elevation in nutrients was occasionally noticed. The heavy metal content in sediment represented lithogenic source The bacterial counts in water and sediment were low. The standing stock of phytoplankton, zooplankton and macrobenthos were in the normal ranges with expected faunal/generic diversity. xiv) Kundalika Estuary
Water quality of Kundalika Estuary varied widely with polluted upper and middle segments due to poor flushing. However, coastal water revealed good and comparable water quality in both seasons. The heavy metal contents varied widely with high values at upper segment. Higher concentration of Cd, Hg, and Pb occurred at the effluent disposal site. Bacterial counts were relatively high in the estuary than open coastal system under the influence of sewage. Phytoplankton, zooplankton and macrobenthic standing stocks were high and varied widely with spatial, seasonal and temporal trends. Generic/faunal diversity of these parameters in the estuary did not reveal any significant modifications. The estuary revealed organic enrichment associated biological productivity at different trophic levels. xv) Murud The coastal water of Murud was relatively free from anthropogenic pollutants and the prevailing water quality represented natural background levels. The sediment sustained relatively high levels of chromium and copper which in absence of significant anthropogenic source appear to be associated with rich basaltic hinterland. Microbiological counts in water and sediment were low. Phytoplankton both in terms of pigments and population indicated good primary productivity with high generic diversity. Zooplankton and benthic standing stock and diversity were variable with normal to high values. In general, the creek sustained better biological production potential as compared to the open coastal waters. xvi) Savitri Estuary The impact of the wastewater on the estuarine ecology at different segments was clearly evident. Thus the status of water quality in the inner estuary is distinctly different from that of the lower estuary. The environmental deterioration in respect of phosphate, nitrate, nitrite and ammonia was observed at the effluent release site. Metals in sediment varied widely without any discernible trends. Bacterial counts were relatively low in the coastal area but increased in the estuarine segments. Phytoplankton, zooplankton and benthic standing stocks were low with wide spatial, temporal and seasonal variability. Phytoplankton generic counts were high. Zooplankton and benthic faunal diversity was normal with relatively low values at the upper segment of the estuary. xvii) Vashishti estuary
The coastal water quality had not changed appreciably over the years. However, in the estuarine segments wide variation in water quality

17
parameters with spatial, temporal and seasonal trends was evident. Reduction in DO with high nutrients indicated that the estuary occasionally was under stress due to ongoing discharges. The contents of heavy metals like Cr, Mn, Co, Ni, Cu and Zn were higher at the upper segment but further studies are required to identify the source of these metals which is suspected to be anthropogenic. Bacterial counts were high both in the coastal and estuarine segments. Biological productivity indicated spatial, temporal and seasonal variability. The standing stock of phytoplankton and zooplankton was relatively high in the estuary than the open coastal waters suggesting organic pollution induced biological productivity in the estuary. However, benthic standing stock was better at the coastal segment than that of estuary. Diversity of phytoplankton and benthos was comparable between coastal and estuarine segments, but, the zooplankton diversity was reduced in the estuary. xviii) Enron DP Enron jetty area though received discharges from power plant, the water quality, sediment quality and biological parameters were in normal ranges with expected natural variation for coastal water. xix) Jaigad/Shastri Estuary The estuary does not receive any discharges of wastewater and sustained normal water quality. Hence, it represented a water body with normal water quality and sediment quality along with expected biological characteristics. However, bacterial counts were high both in water and sediment. xx) Ratnagiri The coastal water off Ratnagiri was relatively free from anthropogenic fluxes of pollutants and the water quality represented the natural background. However, inner part of Mirya Bay was severely affected by pollution due to very poor flushing and was characterized by low DO, high phosphate, ammonia and phenols. The heavy metal content in sediment was highly variable with high values of Mn, Cr, Fe, Cu and Hg in the immediate nearshore area. Higher populations of bacteria in water and sediment were recorded in the Bay than the coastal waters. Biological standing stock in terms of phytoplankton, zooplankton and macrobenthos were in the normal range and exhibited spatial, temporal and seasonal changes. xxi) Bhatye Creek In the absence of any known source of anthropogenic effluents, the creek represented the normal water quality with stable pH, low BOD, high DO and nutrients as generally observed in the unpolluted coastal waters. Sediment and biological characteristics were also normal and comparable with the rest of the unpolluted environments of the west coast. However, bacterial counts were high and comparable with the adjacent coastal segments.

18
xxii) Pawas Creek Overall, in absence of any major anthropogenic release the creek water quality represented unpolluted environment. Bacterial counts were relatively low as compared to that at Ratnagiri. Sediment quality and biological characteristics revealed normal trend and compared well with rest of the coastal segments of south Maharashtra. xxiii) Vijaydurg In the absence of anthropogenic fluxes, the water quality of Vijaydurg Creek may be considered to represent unpolluted marine environment. Water and sediment qualities were normal with some variability as expected for coastal areas. Bacterial counts were higher than that of adjacent coastal segments. Biological characteristics also indicated normal distribution of phytoplankton, zooplankton and macrobenthos with variable generic/faunal diversity. xxiv) Deogad
As the creek did not receive any industrial and domestic effluents, the water quality represented a least polluted marine environment off Maharashtra. Sediment was free from any contamination. Bacterial counts were relatively low than that of adjacent coastal system. Biological characteristics also exhibited normal standing stock with variable generic/faunal diversity. xxv) Malvan In the absence of any known anthropogenic source of effluent, Malvan coast represented an unpolluted marine environment. Some influence of fishery generated waste aided by inefficient flushing in the Bay was however a possibility. Metal contents in the creek and the coastal area were comparable and there was no evidence of enrichment of any particular trace metal in sediments, as expected. Phytoplankton, zooplankton and macrobenthic standing stock were high with good diversity as well as spatial and seasonal variability. xxvi) Vengurla The prevalence of good water quality, sediment quality and biological characteristics in the absence of any known anthropogenic release was as expected. Biologically Vengurla represented a very productive natural coastal ecosystem. xxvii) Redi
Negative impacts due to the ongoing port activities were not evident. The prevailing water quality was good . Sediment was also free from contamination by trace metals, organic carbon P and PHc. However, bacterial counts were high and comparable with those of the adjacent coastal ecosystems. Biological characteristics also revealed normal trend in their distribution with highly productive natural coastal ecosystem. Overall, it can be concluded that the present study on the ecology assessment of coastal marine system of Maharashtra clearly revealed healthy

19
water & sediment qualities as well as biological productivity in the open coastal waters of the south than north Maharashtra. However, the bays / creeks and estuaries along coastal Maharashtra showed deterioration to various degrees. Inspite of deterioration the coastal system of north indicated relatively high primary production with low diversity as compared to that of south Maharashtra. However, the zooplankton standing stock showed mixed trend with better diversity in the south than north coastal segments. In general, benthic standing stock and diversity were more in the south than north. The above trends clearly indicated organic load induced biological productivity in the coastal system of Maharashtra. The major source of organic input to the coastal system is through the coastal wetland and end product of biological production apart of anthropogenic fluxes. In this context, the coastal system of north Maharashtra receives more organic load through anthropogenic origin as compared to southern segments. Whereas, the southern coast receives higher organic input through the vast coastal wetland ecosystem than that of north where it is getting reduced due to rapid urbanization and industrialization. Hence, the high biological productivity of the southern coast is mainly attributed to more of natural origin of carbon input to the coastal system, while in the north it was induced by anthropogenic fluxes. As a result, the high organic load induced primary production which is less likely to support expected level of zooplankton and benthic standing stocks, although in some cases, they are high with reduced diversity and dominance of opportunistic species like carnivores which indicates certain imbalance in the food chain accounting for less transfer of tropic efficiency in the marine food chain. Such ecosystem in polluted areas may likely to represent a modified ecosystem rather than normal as noticed at many places along north Maharashtra than south. In contrast, in the unpolluted areas, the high primary productivity is adequately supported by a balanced and healthy secondary and benthic production with high diversity as noticed in many places along south Maharashtra. However, a detailed study on the carbon and nutrient fluxes to the coastal system is essential for a better understanding of the behavior of coastal ecosystem of Maharashtra.
10 Recommendations The recommendations given in this report are based on the two sets of studies with respect to water quality, sediment quality and biological parameters conducted at 27 transects along the Maharashtra coast, information made available by MPCB, data-base at NIO and available published literature. Though these water bodies of Konkan region vary considerably in morphology and environmental setting, they have certain common features. Typically (a) the creeks/estuaries are shallow with wide mouth and tidal ingress is substantial in the outer segment but decreases considerably in the inner segment, (b) riverine fresh water discharge into the creek/estuary that is high during July-September decreases considerably over the dry season and becomes insignificant after about December, and (c) presence of prominent sand bars in the mouth zone hinders the out flow of water particularly during springs low tides. These characteristics of the

20
creek/estuaries have considerable bearing on their flushing behaviour. The general findings/recommendations based on their characteristics are discussed in the previous section (Section 9) and general recommendations given below need to be implemented urgently (i) Effluent releases to inner creek/estuarine zone should be discouraged (ii) For existing effluent discharges
• Detailed site specific survey for assimilative capacity for the receiving water body should be conducted
• The effluent release site should be shifted down stream or additional treatment should be provided to the effluent based on model studies.
(iii) Effluent releases may be permitted in the lower estuary only after asserting its assimilative capacity.
•••• More recommendations will be finalized after forthcoming deliberations between NIO Scientists, stake holders and officers of MPCB.

21
22

23

24

25

26
27

28

29
MONITORING OF COASTAL MARINE AND ESTUARINE ECOLOGY OF MAHARASHTRA: PHASE I Part-B (Data sheet)

30
Individual parameterwise/stationwise data of all transects are given in this
section. One set of total tables for Dabhol/Vashishti estuary given here as a
representative data sheet.

31
Table 4.17.1: Water quality off Vashishti Estuary during March 2007
VS1 VS2 VS3 VS4 VS5 VS6 VS7 Parameter Level
Min Max Av Min Max Av Min Max Av Min Max Av Min Max Av Min Max Av Min Max Av
S 28.3 28.5 28.4 28.8 28.9 28.9 28.8 28.8 28.8 27.0 30.2 28.8 29.2 29.5 29.4 26.3 30.2 28.6 25.8 25.8 25.8
B 28.3 28.5 28.4 28.3 28.4 28.4 28.5 28.5 28.5 27.0 29.3 28.3 29.2 29.8 29.5 28.3 30.0 29.2 25.2 25.2 25.2
Temperature (oC)
(29.5) (29.5) (29.5) (28.0) (28.0) (28.0) (29.5) (29.5) (29.5) (24.5) (31.5) (30.0) (28.8) (29.0) (28.9) (24.0) (36.3) (30.7) (25.0) (25.0) (25.0)
S 7.9 7.9 7.9 8.0 8.0 8.0 7.9 7.9 7.9 7.6 8.0 7.8 7.3 7.3 7.3 7.1 7.3 7.2 7.0 7.1 7.1 pH
B 8.0 8.1 8.1 8.0 8.0 8.0 8.0 8.0 8.0 7.6 8.1 7.9 7.6 7.7 7.7 7.0 7.1 7.1 7.2 7.2 7.2
S - - 22* - - 40* - - 34* 26 28 27 - - 14* 8 12 10 - - 8* SS (mg/l)
B - - 50* - - 70* - - 60* 44 64 54 - - 18* 10 16 13 - - 56*
S 35.4 35.4 35.4 31.1 31.1 31.1 29.9 30.1 30.0 18.6 32.7 23.4 1.8 1.8 1.8 0.7 12.5 3.1 0.2 0.3 0.3 Salinity (ppt)
B 35.4 35.6 35.5 35.3 35.4 35.4 35.3 35.3 35.3 27.6 34.7 32.8 1.7 1.8 1.8 6.1 16.3 12.1 0.2 0.2 0.2
S 4.7 4.7 4.6 4.4 4.4 4.4 4.2 4.2 4.2 4.2 5.1 4.6 4.1 4.1 4.1 3.4 5.3 4.6 5.3 5.3 5.3 DO (ml/l)
B 4.4 4.7 4.6 4.4 4.7 4.6 4.4 4.4 4.4 4.2 4.7 4.4 3.9 4.1 4.0 1.1 3.9 2.6 5.3 5.5 5.4
S - - 2.5* - - 2.8* - - 2.8* 1.9 3.4 2.7 - - 5.2* 3.7 5.4 4.6 - - 7.5* BOD (mg/l)
B - - 3.5* - - 2.4* - - 1.4* 1.8 2.4 2.1 - - 3.0* 3.8 5.8 4.8 - - 5.4*
S 1.2 1.5 1.4 1.5 1.6 1.6 1.4 1.4 1.4 1.6 2.5 2.0 0.5 0.6 0.6 0.1 1.2 0.4 ND 0.1 0.1 PO43--P
(µmol/l) B 1.7 1.8 1.8 1.8 1.9 1.9 1.8 2.0 1.9 1.3 2.5 1.7 0.8 0.9 0.9 1.5 11.4 4.0 0.1 0.2 0.2
S 4.4 5.0 4.7 4.4 6.8 5.6 7.2 6.2 6.7 7.4 16.1 11.3 17.0 23.0 20.0 4.9 32.5 20.4 1.2 1.3 1.3 NO3--N
(µmol/l) B 5.1 5.3 5.2 4.7 5.3 5.0 3.5 4.2 3.9 4.8 10.0 7.6 14.5 16.1 15.3 1.3 18.9 13.8 1.1 2.7 1.9
S 1.9 2.0 2.0 5.0 5.8 5.4 7.0 7.2 7.1 3.7 18.9 13.1 18.5 20.2 19.4 0.7 6.2 3.1 0.1 0.2 0.2 NO2--N
(µmol/l) B 1.2 1.6 1.4 1.7 1.7 1.7 1.8 2.6 2.2 2.4 8.9 4.0 8.3 11.8 10.1 1.2 20.4 13.3 0.1 0.2 0.2
S 0.9 1.1 1.0 0.6 0.8 0.7 0.4 1.3 0.9 0.1 2.4 0.8 1.5 2.0 1.8 2.1 15.5 6.1 4.6 8.4 6.5 NH4+-N
(µmol/l) B 0.7 0.7 0.7 0.5 2.4 1.5 0.8 0.9 0.9 0.2 1.0 0.6 0.3 0.5 0.4 7.3 38.7 21.7 0.7 2.3 1.5
PHc (µg/l) 1 m - - 8* - - 11* - - 5* 17 17 17 - - 9* 14 22 18 - - 3*
Phenol (µg/l) S - - 12* - - 36* - - 15* 15 34 25 - - 8* 2 5 3 - - ND
*Single Value Air temperature given in parenthesis
32
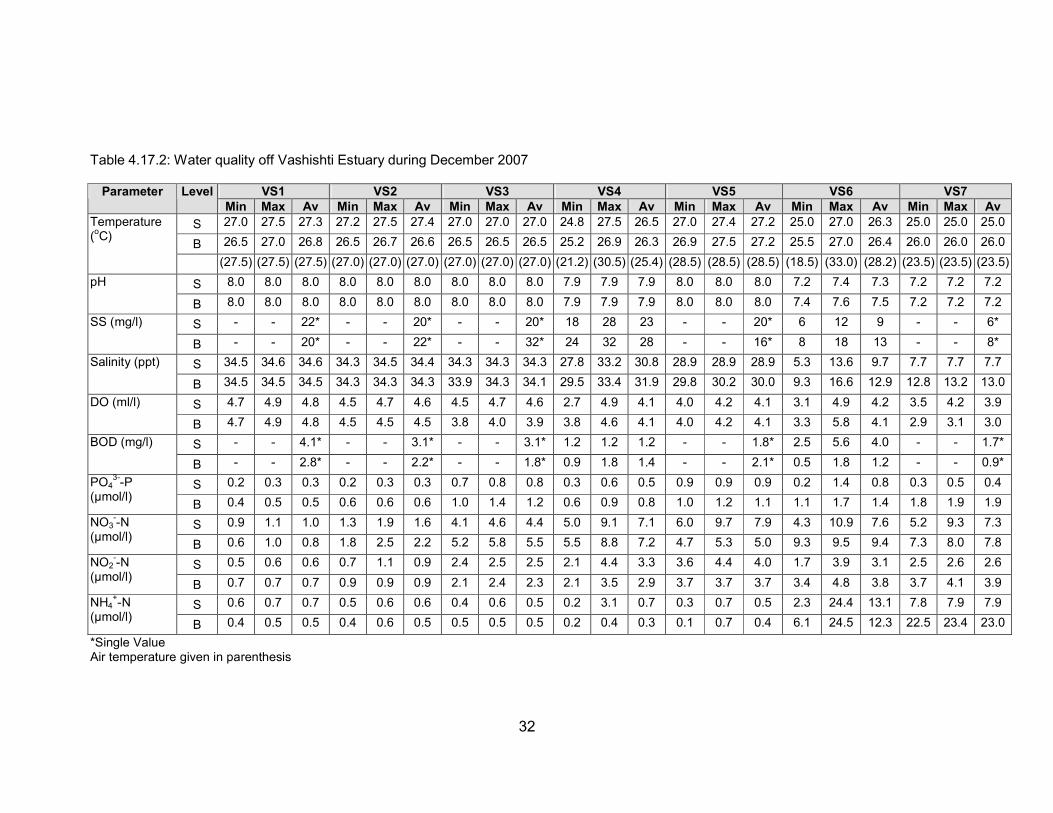
Table 4.17.2: Water quality off Vashishti Estuary during December 2007
VS1 VS2 VS3 VS4 VS5 VS6 VS7 Parameter Level
Min Max Av Min Max Av Min Max Av Min Max Av Min Max Av Min Max Av Min Max Av
S 27.0 27.5 27.3 27.2 27.5 27.4 27.0 27.0 27.0 24.8 27.5 26.5 27.0 27.4 27.2 25.0 27.0 26.3 25.0 25.0 25.0
B 26.5 27.0 26.8 26.5 26.7 26.6 26.5 26.5 26.5 25.2 26.9 26.3 26.9 27.5 27.2 25.5 27.0 26.4 26.0 26.0 26.0
Temperature (oC)
(27.5) (27.5) (27.5) (27.0) (27.0) (27.0) (27.0) (27.0) (27.0) (21.2) (30.5) (25.4) (28.5) (28.5) (28.5) (18.5) (33.0) (28.2) (23.5) (23.5) (23.5)
S 8.0 8.0 8.0 8.0 8.0 8.0 8.0 8.0 8.0 7.9 7.9 7.9 8.0 8.0 8.0 7.2 7.4 7.3 7.2 7.2 7.2 pH
B 8.0 8.0 8.0 8.0 8.0 8.0 8.0 8.0 8.0 7.9 7.9 7.9 8.0 8.0 8.0 7.4 7.6 7.5 7.2 7.2 7.2
S - - 22* - - 20* - - 20* 18 28 23 - - 20* 6 12 9 - - 6* SS (mg/l)
B - - 20* - - 22* - - 32* 24 32 28 - - 16* 8 18 13 - - 8*
S 34.5 34.6 34.6 34.3 34.5 34.4 34.3 34.3 34.3 27.8 33.2 30.8 28.9 28.9 28.9 5.3 13.6 9.7 7.7 7.7 7.7 Salinity (ppt)
B 34.5 34.5 34.5 34.3 34.3 34.3 33.9 34.3 34.1 29.5 33.4 31.9 29.8 30.2 30.0 9.3 16.6 12.9 12.8 13.2 13.0
S 4.7 4.9 4.8 4.5 4.7 4.6 4.5 4.7 4.6 2.7 4.9 4.1 4.0 4.2 4.1 3.1 4.9 4.2 3.5 4.2 3.9 DO (ml/l)
B 4.7 4.9 4.8 4.5 4.5 4.5 3.8 4.0 3.9 3.8 4.6 4.1 4.0 4.2 4.1 3.3 5.8 4.1 2.9 3.1 3.0
S - - 4.1* - - 3.1* - - 3.1* 1.2 1.2 1.2 - - 1.8* 2.5 5.6 4.0 - - 1.7* BOD (mg/l)
B - - 2.8* - - 2.2* - - 1.8* 0.9 1.8 1.4 - - 2.1* 0.5 1.8 1.2 - - 0.9*
S 0.2 0.3 0.3 0.2 0.3 0.3 0.7 0.8 0.8 0.3 0.6 0.5 0.9 0.9 0.9 0.2 1.4 0.8 0.3 0.5 0.4 PO43--P
(µmol/l) B 0.4 0.5 0.5 0.6 0.6 0.6 1.0 1.4 1.2 0.6 0.9 0.8 1.0 1.2 1.1 1.1 1.7 1.4 1.8 1.9 1.9
S 0.9 1.1 1.0 1.3 1.9 1.6 4.1 4.6 4.4 5.0 9.1 7.1 6.0 9.7 7.9 4.3 10.9 7.6 5.2 9.3 7.3 NO3--N
(µmol/l) B 0.6 1.0 0.8 1.8 2.5 2.2 5.2 5.8 5.5 5.5 8.8 7.2 4.7 5.3 5.0 9.3 9.5 9.4 7.3 8.0 7.8
S 0.5 0.6 0.6 0.7 1.1 0.9 2.4 2.5 2.5 2.1 4.4 3.3 3.6 4.4 4.0 1.7 3.9 3.1 2.5 2.6 2.6 NO2--N
(µmol/l) B 0.7 0.7 0.7 0.9 0.9 0.9 2.1 2.4 2.3 2.1 3.5 2.9 3.7 3.7 3.7 3.4 4.8 3.8 3.7 4.1 3.9
S 0.6 0.7 0.7 0.5 0.6 0.6 0.4 0.6 0.5 0.2 3.1 0.7 0.3 0.7 0.5 2.3 24.4 13.1 7.8 7.9 7.9 NH4+-N
(µmol/l) B 0.4 0.5 0.5 0.4 0.6 0.5 0.5 0.5 0.5 0.2 0.4 0.3 0.1 0.7 0.4 6.1 24.5 12.3 22.5 23.4 23.0
*Single Value Air temperature given in parenthesis

33
Table 4.17.3: Selected metals and P (µg/g, except Al, Fe, Corg, in (%), dry wt) in subtidal sediment off Vashishti Estuary during March 2007
Station Code
Sand (%)
Silt (%)
Clay (%)
Al (%)
Cr
(µµµµg/g)
Mn
(µµµµg/g)
Fe (%)
Co
(µµµµg/g)
Ni
(µµµµg/g)
Cu
(µµµµg/g)
Zn
(µµµµg/g)
Cd
(µµµµg/g)
Hg
(µµµµg/g)
Pb
(µµµµg/g)
Corg (%)
P
(µµµµg/g)
PHc
(µµµµg/g)
VS1 10.4 81.4 8.2 8.4 142 590 9.7 31 94 114 56 0.12 0.06 12.3 2.5 1433 0.6
VS2 0.4 89.8 9.8 8.3 155 639 9.6 32 93 113 68 0.33 0.04 10.1 2.6 592 0.4
VS3 1.7 90.9 7.4 8.4 134 662 9.6 34 95 125 60 0.15 0.05 9.7 2.6 85 2.6
VS4 87.4 8.8 3.8 6.3 348 2395 23.3 130 161 417 248 0.15 0.008 6.3 0.3 122 0.3
VS5 11.1 54.9 34.0 9.4 186 1097 14.2 63 120 224 102 0.25 0.1 3.2 1.5 106 1.6
VS6 92.4 7.6 0 8.0 318 1662 19.6 87 144 319 187 0.23 0.02 4.4 0.3 355 0.3
VS7 87.2 10.2 2.6 7.3 336 1704 20.0 88 146 303 226 0.05 0.02 3.7 0.1 235 0.4
*Dry wt basis except PHc which is in wet wt.
Table 4.17.4: Selected metals and P (µg/g, except Al, Fe, Corg, in (%), dry wt) in subtidal sediment off Vashishti Estuary during December 2007
Station Code
Sand (%)
Silt (%)
Clay (%)
Al (%)
Cr
(µµµµg/g)
Mn
(µµµµg/g)
Fe (%)
Co
(µµµµg/g)
Ni
(µµµµg/g)
Cu
(µµµµg/g)
Zn
(µµµµg/g)
Cd
(µµµµg/g)
Hg
(µµµµg/g)
Pb
(µµµµg/g)
Corg (%)
P
(µµµµg/g)
PHc
(µµµµg/g)
VS1 69.6 24.2 6.2 8.4 163 692 7.1 47 97 106 75 0.13 0.02 10.8 2.4 1757 0.1
VS2 24.4 70.2 5.4 8.8 156 805 8.6 49 102 132 85 0.23 0.01 9.9 2.2 1699 0.2
VS3 58.8 34.0 7.2 8.0 196 1651 14.0 78 128 256 162 0.18 ND 9.1 2.2 908 4.8
VS4 96.8 2.0 1.2 5.9 270 2796 20.6 119 175 436 317 0.17 0.01 7.0 0.5 849 0.3
VS5 21.5 72.5 6.0 9.4 169 1386 12.2 79 125 263 131 0.24 0.04 9.0 2.5 1090 0.5
VS6 29.7 61.1 9.2 9.6 159 1317 12.0 78 28 290 136 0.22 0.07 9.2 3.8 1333 4.0
VS7 97.0 2.8 0.2 9.0 208 1371 13.3 76 119 190 113 0.18 0.01 5.0 0.6 1308 0.3
*Dry wt basis except PHc which is in wet wt

34
Table 4.17.5: Microbial counts (no/ml) in water off Vashishti Estuary during 2007
Premonsoon Postmonsoon
VS4 VS4
Type of Bacteria VS1 VS2 VS3
Eb Fl
VS1 VS2 VS3
Eb Fl
TVC 4.2x10³ 6.6x10³ 16x103 9.9x10³ 5.9x10³ 6x10³ 4.5x10³ 9.8x10³ 9.4x10³ 6.5x10³
TC 466 826 1142 938 582 810 682 1218 920 615
FC 460 286 722 304 196 316 92 776 430 454
ECLO 312 416 642 372 112 188 108 916 575 220
SHLO ND ND ND 104 ND 10 12 16 95 70
SLO ND ND ND ND ND ND ND ND ND ND
PKLO ND ND 12 ND ND 13 26 ND ND 0
VLO 736 ND 246 186 60 26 24 72 425 380
VPLO ND ND ND ND ND 12 14 ND 30 ND
VCLO 736 ND 246 186 60 14 10 72 395 380
PALO ND ND ND ND ND ND ND ND ND 14
SFLO 148 16 212 ND 192 18 ND ND ND ND

35
Table 4.17.5 (Contd 2)
Premonsoon Postmonsoon
VS6 VS6
Table of Bacteria VS5
Eb Fl
VS7 VS5
Eb Fl
VS7
TVC 8x10³ 4.7x10³ 1.6x10³ 2.1x10³ 7.2x10³ 13.8x10³ 7.8x10³ 1.6x10³
TC 990 518 141 348 850 2250 860 176
FC 662 162 38 112 464 1010 366 92
ECLO 300 210 61 24 384 1240 420 78
SHLO ND ND 26 ND 510 420 225 540
SLO ND ND ND ND ND ND ND ND
PKLO N ND ND ND ND 160 385 10
VLO 632 28 16 ND 524 716 82 375
VPLO 632 ND ND ND 490 690 70 365
VCLO ND 28 16 ND 34 26 12 10
PALO ND 22 ND ND 145 360 310 860
SFLO 106 116 6 ND ND ND 15 2195
ND – Below Detectable Level

36
Table 4.17.6: Microbial counts (no/g; dry wt) in sediment off Vashishti Estuary during 2007
Premonsoon Postmonsoon Type of Bacteria VS1 VS2 VS3 VS4 VS1 VS2 VS3 VS4
TVC 12.5x10³ 13x103 18.8x10³ 30x103 5.1x10³ 8x10³ 13.6x10³ 23.9x10³
TC 2312 2672 7320 17828 736 520 5812 15200
FC 1320 1748 5210 8500 508 112 1956 7700
ECLO 1068 886 2100 1526 244 236 3800 7100
SHLO ND ND ND ND ND ND ND ND
SLO ND ND ND ND ND ND ND ND
PKLO ND ND ND ND ND ND ND ND
VLO 1010 ND 2176 3488 ND 50 1236 1620
VPLO ND ND ND ND ND 28 ND ND
VCLO 1010 ND 2176 3488 ND 22 1236 1620
PALO ND ND ND ND ND ND ND ND
SFLO 288 276 310 ND ND ND ND ND
ND – Below Detectable Level

37
Table 4.17.6 (Contd 2)
Premonsoon Postmonsoon Type of Bacteria VS5 VS6 VS7 VS5 VS6 VS7
TVC 19.4x10³ 24.2x10³ 12.6x10³ 17.6x10³ 22.7x10³ 9.4x10³
TC 6730 14342 4818 5970 10192 4280
FC 4140 6926 1024 3140 6410 2300
ECLO 2560 7300 3628 2800 3700 1854
SHLO ND ND ND ND 175 ND
SLO ND ND ND ND ND ND
PKLO ND ND ND ND ND ND
VLO ND 1016 ND ND 792 ND
VPLO ND ND ND ND ND ND
VCLO ND 1016 ND ND 792 ND
PALO ND ND ND ND ND ND
SFLO 38 ND ND ND ND ND
ND – Below Detectable Level
38
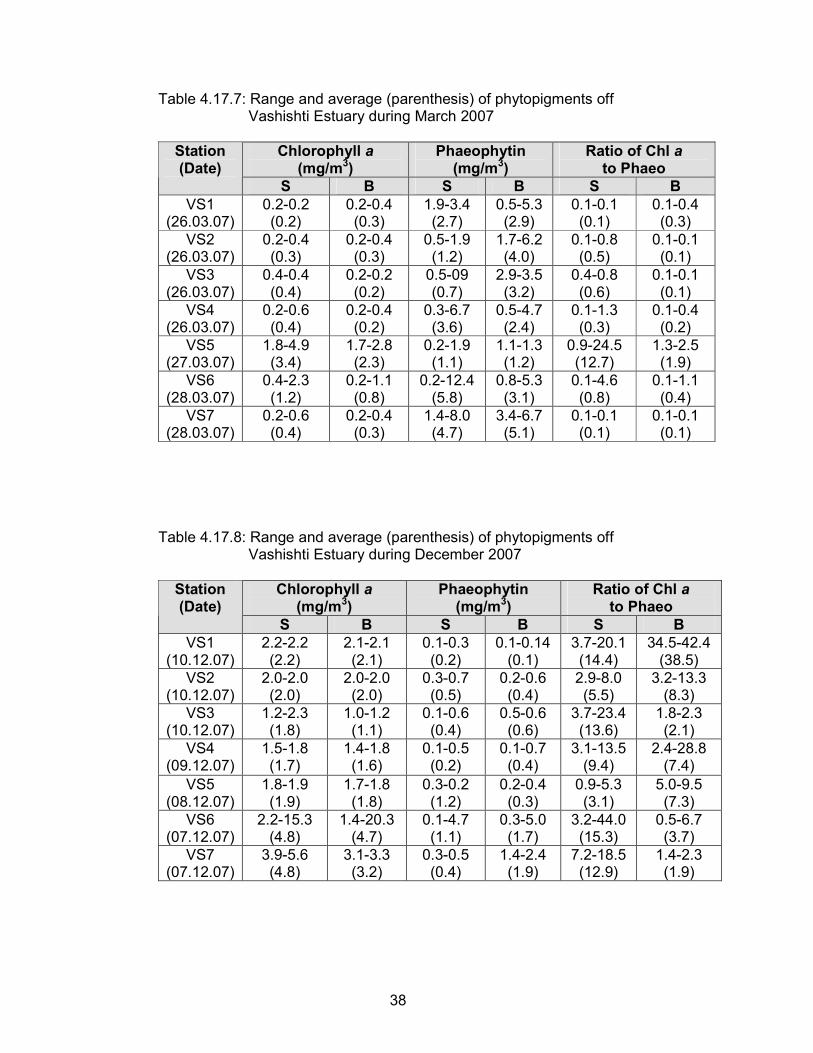
Table 4.17.7: Range and average (parenthesis) of phytopigments off Vashishti Estuary during March 2007
Chlorophyll a
(mg/m3) Phaeophytin
(mg/m3) Ratio of Chl a
to Phaeo Station (Date)
S B S B S B
VS1 (26.03.07)
0.2-0.2 (0.2)
0.2-0.4 (0.3)
1.9-3.4 (2.7)
0.5-5.3 (2.9)
0.1-0.1 (0.1)
0.1-0.4 (0.3)
VS2 (26.03.07)
0.2-0.4 (0.3)
0.2-0.4 (0.3)
0.5-1.9 (1.2)
1.7-6.2 (4.0)
0.1-0.8 (0.5)
0.1-0.1 (0.1)
VS3 (26.03.07)
0.4-0.4 (0.4)
0.2-0.2 (0.2)
0.5-09 (0.7)
2.9-3.5 (3.2)
0.4-0.8 (0.6)
0.1-0.1 (0.1)
VS4 (26.03.07)
0.2-0.6 (0.4)
0.2-0.4 (0.2)
0.3-6.7 (3.6)
0.5-4.7 (2.4)
0.1-1.3 (0.3)
0.1-0.4 (0.2)
VS5 (27.03.07)
1.8-4.9 (3.4)
1.7-2.8 (2.3)
0.2-1.9 (1.1)
1.1-1.3 (1.2)
0.9-24.5 (12.7)
1.3-2.5 (1.9)
VS6 (28.03.07)
0.4-2.3 (1.2)
0.2-1.1 (0.8)
0.2-12.4 (5.8)
0.8-5.3 (3.1)
0.1-4.6 (0.8)
0.1-1.1 (0.4)
VS7 (28.03.07)
0.2-0.6 (0.4)
0.2-0.4 (0.3)
1.4-8.0 (4.7)
3.4-6.7 (5.1)
0.1-0.1 (0.1)
0.1-0.1 (0.1)
Table 4.17.8: Range and average (parenthesis) of phytopigments off Vashishti Estuary during December 2007
Chlorophyll a
(mg/m3) Phaeophytin
(mg/m3) Ratio of Chl a
to Phaeo Station (Date)
S B S B S B
VS1 (10.12.07)
2.2-2.2 (2.2)
2.1-2.1 (2.1)
0.1-0.3 (0.2)
0.1-0.14 (0.1)
3.7-20.1 (14.4)
34.5-42.4 (38.5)
VS2 (10.12.07)
2.0-2.0 (2.0)
2.0-2.0 (2.0)
0.3-0.7 (0.5)
0.2-0.6 (0.4)
2.9-8.0 (5.5)
3.2-13.3 (8.3)
VS3 (10.12.07)
1.2-2.3 (1.8)
1.0-1.2 (1.1)
0.1-0.6 (0.4)
0.5-0.6 (0.6)
3.7-23.4 (13.6)
1.8-2.3 (2.1)
VS4 (09.12.07)
1.5-1.8 (1.7)
1.4-1.8 (1.6)
0.1-0.5 (0.2)
0.1-0.7 (0.4)
3.1-13.5 (9.4)
2.4-28.8 (7.4)
VS5 (08.12.07)
1.8-1.9 (1.9)
1.7-1.8 (1.8)
0.3-0.2 (1.2)
0.2-0.4 (0.3)
0.9-5.3 (3.1)
5.0-9.5 (7.3)
VS6 (07.12.07)
2.2-15.3 (4.8)
1.4-20.3 (4.7)
0.1-4.7 (1.1)
0.3-5.0 (1.7)
3.2-44.0 (15.3)
0.5-6.7 (3.7)
VS7 (07.12.07)
3.9-5.6 (4.8)
3.1-3.3 (3.2)
0.3-0.5 (0.4)
1.4-2.4 (1.9)
7.2-18.5 (12.9)
1.4-2.3 (1.9)

39
Table 4.17.9: Range and average of phytoplankton population off Vashishti Estuary during March 2007
Cell count (nox103/l)
Total genera (no)
Major genera Station (Date)
S B S B S B
VS1 (26.03.07)
24.8* 42.4* 14* 17* Pleurosigma Navicula Thalassiosira Leptocylindrus
Thalassionema Pleurosigma Navicula Thalassiosira
VS2 (26.03.07)
46.4* 32.0* 16* 15* Guinardia Thalassiosira Skeletonema Pleurosigma
Guinardia Thalassiosira Skeletonema Navicula
VS3 (26.03.07)
40.0* 31.2* 18* 15* Thalassiosira Thalassionema Ditylium Guinardia
Thalassionema Thalassiosira Guinardia Navicula
VS4 (26.03.07)
25.6-40.8 (33.2)
23.0-24.8 (23.9)
14-16 (15)
13-15 (14)
Ditylium Guinardia Thalassiosira Navicula
Thalassiosira Thalassionema Ditylium Guinardia
VS5 (27.03.07)
153.6* 104.0* 20* 22* Skeletonema Anabaena Guinardia Thalassiosira
Skeletonema Thalassionema Thalassiosira Chaetoceros
VS6 (28.03.07)
61.6-99.2 (80.4)
68.8-96.8 (82.8)
16-21 (19)
13-17 (15)
Skeletonema Peridinium Bacteriastrum Thalassiosira
Skeletonema Bacteriastrum Thalassiosira Peridinium
VS7 (28.03.07)
53.6* 47.2* 21* 19* Leptocylindrus Skeletonema Navicula Chaetoceros
Leptocylindrus Chaetoceros Skeletonema Thalassiosira
* Single Value

40
Table 4.17.10: Range and average of phytoplankton population off Vashishti Estuary during December 2007
Cell count (nox103/l)
Total genera (no)
Major genera Station (Date)
S B S B S B
VS1 (10.12.07)
62.4* 56.0* 20* 20* Thalassiosira Thalassionema Leptocylindrus Skeletonema
Thalassiosira Leptocylindrus Thalassionema Skeletonema
VS2 (10.12.07)
52.8* 52.0* 20* 19* Thalassiosira Leptocylindrus Guinardia Skeletonema
Skeletonema Chaetoceros Leptocylindrus Thalassiosira
VS3 (10.12.07)
51.2* 38.4* 18* 17* Thalassiosira Guinardia Thalassionema Rhizosolenia
Leptocylindrus Guinardia Thalassiosira Rhizosolenia
VS4 (09.12.07)
32.8-37.6 (35.2)
30.4-36.8 (33.6)
15-18 (17)
16-18 (17)
Navicula Thalassiosira Guinardia Thalassionema
Guinardia Thalassiosira Navicula Thalassionema
VS5 (08.12.07)
44.0* 36.0* 14* 19* Bacteriastrum Nitzschia Thalassiosira Guinardia
Skeletonema Guinardia Thalassiosira Bacteriastrum
VS6 (07.12.07)
68.0-162.4 (115.2)
61.6-105.6 (83.6)
10-14 (12)
11-13 (12)
Skeletonema Peridinium Bacteriastrum Guinardia
Skeletonema Biddulphia Leptocylindrus Peridinium
VS7 (07.12.07)
158.4* 87.2* 14* 12* Skeletonema Peridinium Cyclotella Thalassiosira
Skeletonema Navicula Thalassiosira Peridinium
* Single Value

41
Table 4.17.11: Phytoplankton composition (%) off Vashishti Estuary during March 2007
Station Algal genera
VS1 VS2 VS3 VS4 VS5 VS6 VS7 VS8
Amphiprora 2.4 - - - - 0.2 1.6 -
Anabaena - - - - 14.0 0.2 - -
Bacteriastrum - - 1.1 3.5 4.7 17.9 1.6 1.1
Biddulphia 8.3 - 2.2 1.4 0.6 0.7 4.8 3.4
Campyloneis - - - - 0.3 - - -
Ceratium 2.4 - - - - 0.2 1.6 2.2
Chaetoceros 1.2 4.1 - 2.8 3.4 - 9.5 -
Corethron - - 1.1 0.7 0.3 - - -
Coscinodiscus 4.8 3.1 2.2 2.8 0.6 1.0 1.6 2.2
Cyclotella 2.4 2.0 2.2 2.1 0.9 2.9 1.6 -
Cymbella - - - - 0.3 - - -
Diploneis - - 1.1 1.4 0.3 - - 2.2
Ditylium 8.3 2.0 12.4 16.8 3.7 0.7 - 1.1
Dityocha - - 2.2 0.7 - - - -
Eucampia - 2.0 - - - - - -
Fragilaria - - - - 0.3 - - -
Guinardia - 24.7 10.1 11.9 14.9 1.5 - 5.6
Gyrosigma 2.4 2.0 1.1 2.1 0.6 1.2 2.4 2.2
Leptocylindrus 6.0 3.1 - 3.5 0.3 0.7 21.4 1.1
Navicula 13.1 6.1 11.2 8.4 1.2 1.2 8.7 16.9
Nitzschia 2.4 2.0 2.2 4.9 0.9 2.5 3.2 4.5
Oscillatoria 1.2 - - - - - - -
Peridinium 1.2 - - 0.7 1.2 5.6 7.1 2.2
Pharmidium - - - 0.7 - 5.6 - -
Pinnularia - - - - 0.3 0.2 - -
Pleurosigma 17.7 7.1 5.6 4.2 0.3 0.7 0.8 4.5
Prorocentrum - - 1.1 - - - 1.6 -
Rhizosolenia - 4.1 3.4 - - 0.2 3.2 -
Staurastrum - - - - - 0.2 6.3 -
Skeletonema - 10.2 - 4.2 32.6 38.1 11.1 -
Streptotheca - - 1.1 - 0.3 - - -
Surirella 2.4 2.0 2.2 2.1 - 0.2 1.6 3.4
Thalassionema 10.7 6.1 19.5 7.7 7.5 0.7 0.8 18.0
Thalassiosira 10.7 19.4 16.9 16.7 9.0 14.2 7.9 27.0
Thalassiothrix 2.4 - 1.1 0.7 1.2 2.5 - 2.2
Triceratium - - - - - 0.2 - -
Trichodesmium - - - - - 0.2 - -
Total 100 100 100 100 100 100 100 100

42
Table 4.17.12: Phytoplankton composition (%) off Vashishti Estuary during December 2007
Station Algal genera
1 2 3 4 5 6 7
Amphiprora - - 0.9 - - - -
Amphora 0.7 - - - - - -
Asterionella - 3.8 - - - - -
Bacteriastrum 1.4 1.5 8.0 3.5 41.0 2.2 0.3
Biddulphia 1.4 1.5 1.8 1.7 1.0 2.0 -
Ceratium 0.7 0.8 1.8 - - - -
Ceratoulina 1.4 0.8 12.8 1.2 - - -
Chaetoceros 3.4 12.2 - 5.8 2.0 - -
Coscinodiscus 0.7 - - 1.7 2.0 0.6 0.7
Cyclotella 0.7 0.8 2.7 2.3 2.0 0.8 1.0
Cymbella - - - - - 0.2 0.3
Dinophysis - - - - 2.0 - -
Diploneis - 0.8 1.8 0.6 - - -
Ditylium - 0.8 - - 1.0 0.2 -
Dityocha - - 1.8 0.6 - - -
Guinardia 4.7 10.7 25.4 14.0 7.0 2.0 -
Gyrosigma - - - - - - 0.7
Hemiaulus 2.0 - - 2.3 1.0 - -
Leptocylindrus 14. 12.2 12.0 5.8 1.0 - -
Melosira - 1.5 - - 1.0 0.2 -
Navicula 4.7 5.3 5.4 15.0 2.0 0.6 1.3
Nitzschia 1.4 2.3 2.7 1.7 7.0 0.4 0.7
Oscillatoria 0.7 - - - - - -
Peridinium 4.7 3.8 2.7 3.5 2.0 5.4 2.6
Pinnularia - - - - - - 0.3
Planktoniella 1.4 - - - - - -
Pleurosigma 2.0 2.3 1.8 1.7 1.0 0.6 0.3
Prorocentrum 1.4 0.8 0.9 1.2 1.0 - -
Rhizosolenia 7.4 4.6 8.9 4.1 2.0 - -
Skeletonema 8.1 14.4 - 1.2 13.0 81.8 88.7
Streptotheca - 0.8 - 0.6 - - -
Surirella 1.4 2.3 0.9 2.3 - - -
Synedra - - - - - - 0.7
Thalassionema 14. 3.8 8.0 8.7 4.0 0.4 0.7
Thalassiosira 21. 12.2 9.8 15.3 6.0 0.8 1.0
Thalassiothrix - - 0.9 5.2 1.0 0.8 0.7
Total 100 100 100 100 100 100 100

43
Table 4.17.13: Range and average (parenthesis) of zooplankton off Vashishti Estuary during March 2007
Station (Date)
Biomass (ml/100m³)
Population (nox10³/100m³)
Total groups (no)
Major group (%)
VS1 (26.03.07)
0.8-1.0 (0.9)
11.4-18.5 (15.0)
11-13 (12)
Copepods (77.9), decapod larvae (10.2), Lucifer sp (4.8), fish eggs (3.6), fish larvae (1.3), chaetognaths (1.2), stomatopods (0.5), lamellibranchs (0.2), gastropods (0.2), others (0.1)
VS2 (26.03.07)
1.0-2.5 (1.8)
33.3-74.2 (53.7)
11-11 (11)
Copepods (96.4), fish eggs (1.4), decapod larvae (1.1), Lucifer sp (0.8), lamellibranchs (0.1), fish larvae (0.1), others (0.1)
VS3 (26.03.07)
1.2-4.3 (2.8)
73.3-192.5 (132.9)
10-11 (11)
Copepods (97.5), Lucifer sp (0.9), decapod larvae (0.8), lamellibranchs (0.5), appendicularians (0.2), others (0.1)
VS4 (26.03.07)
0.8-3.6 (1.7)
2.8-61.2 (25.3)
10-14 (12)
Copepods (78.3), lamellibranchs (12.7), decapod larvae (5.3), Lucifer sp (1.8), gastropods (1.2), fish larvae (0.4), fish eggs (0.1), siphonophores (0.1), others (0.1)
VS5 (27.03.07)
0.5-0.5 (0.5)
7.4-14.6 (11.0)
9-9 (9)
Copepods (90.9), lamellibranchs (5.9), decapod larvae (2.7), Lucifer sp (0.2), fish larvae (0.1), gastropods (0.1), others (0.1)

44
Table 4.17.13 (Contd 2)
Station (Date)
Biomass (ml/100m³)
Population (no x 10³/100m³)
Total groups (no)
Major group (%)
VS6 (28.03.07)
0.1-0.7 (0.4)
0.1-2.0 (1.0)
5-9 (07)
Copepods (88.2), gastropods (6.7), decapod larvae (1.8), lamellibranchs (1.6), fish larvae (0.5), Lucifer sp (0.3), amphipods (0.2), cladocera (0.1), marine insects (0.1), polychaetes (0.1), fish eggs (0.1), others (0.3)
VS7 (27.03.07)
0.1-0.3 (0.2)
0.1-0.3 (0.2)
8-8 (8)
Copepods (80.4), lamellibranchs (6.7), cladocera (4.6), decapod larvae (3.6), gastropods (2.1), amphipods (0.8), fish eggs (0.8), fish larvae (0.5), foraminiferans (0.5), others (0.0)

45
Table 4.17.14: Range and average (parenthesis) of zooplankton off Vashishti Estuary during December 2007
Station (Date)
Biomass (ml/100m3)
Population (nox103/100m3)
Total groups (no)
Major group (%)
VS1 (10.12.07)
1.8-1.9 (1.9)
5.6-12.4 (9.0)
13-14 (14)
Copepods (85.2), decapod larvae (6.0), fish eggs (4.3), ostracods (3.2), Lucifer sp (1.1), siphonophores (0.1), others (0.1)
VS2 (10.12.07)
2.0-3.8 (2.9)
35.1-76.3 (55.7)
14-16 (15)
Copepods (94.9), decapod larvae (1.9), Lucifer sp (1.0), fish eggs (1.0), appendicularians (0.6), ostracods (0.3), fish larvae (0.1), chaetognaths (0.1), others (0.1)
VS3 (10.12.07)
5.2-8.7 (7.0)
87.4-97.2 (92.3)
13-13 (13)
Copepods (96.2), fish eggs (1.8), decapod larvae (1.3), Lucifer sp (0.3), fish larvae (0.2), foraminiferans (0.1), others (0.1)
VS4 (09.12.07)
0.1-2.5 (1.0)
1.4-18.6 (8.2)
10-14 (13)
Copepods (72.7), fish eggs (15.1), decapod larvae (5.4), lamellibranchs (3.5), siphonophores (1.3), fish larvae (0.9), chaetognaths (0.3), appendicularians (0.2), medusae (0.2), gastropods (0.2), Lucifer sp (0.1), others (0.1)

46
Table 4.17.14 (Contd 2)
Station (Date)
Biomass (ml/100m3)
Population (nox103/100m3)
Total groups (no)
Major group (%)
VS5 (08.12.07)
0.2-0.2 (0.2)
3.0-3.6 (3.3)
12-13 (13)
Copepods (81.7), decapod larvae (9.3), Lucifer sp (2.9), fish larvae (2.7), appendicularians (2.0), chaetognaths (0.4), medusae (0.3), siphonophores (0.2), cladocerans (0.1), marine insects (0.1), lamellibranchs (0.1), gastropods (0.1), others (0.1)
VS6 (07.12.07)
0.1-5.1 (1.3)
0.2-11.5 (2.8)
7-11 (9)
Copepods (48.3), medusae (24.7), gastropods (11.7), lamellibranchs (8.0), amphipods (1.8), decapod larvae (1.7), polychaetes (1.4), chaetognaths (1.2), fish larvae (0.7), Lucifer sp (0.2), marine insects (0.1), fish eggs (0.1), others (0.1)
VS7 (07.12.07)
0.1-0.4 (0.3)
0.2-0.8 (0.5)
5-12 (9)
Copepods (93.2), amphipods (2.5), gastropods (1.5), fish larvae (1.1), Lucifer sp (0.4), lamellibranchs (0.4), marine insects (0.2), fish eggs (0.2), isopods (0.1), appendicularians (0.1), decapod larvae (0.1), medusae (0.1), others (0.1)

47
Table 4.17.15: Abundance of zooplankton off Vashishti Estuary
during March 2007
Station Faunal group
VS1 VS2 VS3 VS4 VS5 VS6 VS7
Foraminiferans + + + + + + +
Siphonophores + - - + - - -
Medusae - - - + - - -
Ctenophores - - - + - - -
Chaetognaths + + + + + + -
Polychaetes + - - + - + -
Cladocerans - - - - - + +
Ostracods - - - - + - -
Copepods + + + + + + +
Amphipods + - + + + + +
Mysids - - - + - - -
Lucifer sp + + + + + + -
Decapod larvae + + + + + + +
Stomatopods + + - - - - -
Gastropods + + + + + + +
Lamellibranchs + + + + + + +
Appendicularians + + + + - - -
Fish eggs + + + + + + +
Fish larvae + + + + + + +
Isopods - - + + - - -
Acetes sp - - - + - - -
Marine insects - - - - - + -
(+) Present; (-) Absent

48
Table 4.17.16: Abundance of zooplankton off Vashishti Estuary during December 2007
Station Faunal group
VS1 VS2 VS3 VS4 VS5 VS6 VS7
Foraminiferans + + + + - - -
Siphonophores + + + + + - -
Medusae - + + + + + +
Ctenophores - - - + - - -
Chaetognaths + + + + + + -
Polychaetes + + + + - + -
Cladocerans + + - + + - -
Ostracods + + + + - - -
Copepods + + + + + + +
Amphipods + + - + + + +
Mysids - - - + - - -
Lucifer sp + + + + + + +
Decapods larvae + + + + + + +
Gastropods + + + + + + +
Lamellibranchs + + + + + + +
Appendicularians + + + + + - +
Fish eggs + + + + + + +
Fish larvae + + + + + + +
Isopods - - - - - - +
Marine insects - + - + + + +
(+) Present; (-) Absent

49
Table 4.17.17: Range and average (parenthesis) of subtidal macrobenthos off Vashishti Estuary during March 2007
Station
Biomass (g/m
2; wet wt)
Population (no/m
2)
Faunal groups (no)
Major group
VS1 2.26-4.68 (3.56)
1375-4100 (2363)
3-8 (6)
Polychaetes, foraminiferans
VS2 0-1.03 (0.63)
0-975 (468)
0-5 (3)
Polychaetes, foraminiferans
VS3 0.26-1.63 (0.70)
375-950 (744)
2-4 (3)
Polychaetes, pelecypods
VS4 0.01-3.28 (1.48)
25-175 (94)
1-2 (2)
Pelecypods, polychaetes
VS5 0.3-2.15 (1.02)
600-2125 (1114)
1-6 (2)
Polychaetes
VS6 0.08-0.50 (0.36)
150-1225 (818)
3-4 (3)
Polychaetes, tanaids, pelecypods
VS7 0.07-0.7 (0.39)
250-1575 (1039)
3-4 (3)
Tanaids, polychaetes
Overall average
0-4.68 (1.16)
0-4100 (949)
0-8 (3)
Polychaetes, tanaids, pelecypods
Table 4.17.18: Range and average (parenthesis) of subtidal macrobenthos off Vashishti Estuary during December 2007
Station
Biomass
(g/m2; wet wt)
Population (no/m
2)
Faunal groups (no)
Major group
VS1 1.40-3.80 (2.37)
1125-2675 (1956)
1* Polychaetes
VS2 2.70-6.74 (4.27)
1450-2475 (2094)
1-3 (2)
Polychaetes
VS3 3.57-18.98 (9.55)
2650-9975 (5212)
1-5 (3)
Polychaetes
VS4 0.2-2.33 (0.97)
125-275 (212)
1-3 (2)
Polychaetes
VS5 9.48-48.12 (23.33)
2800-4625 (3163)
3-7 (5)
Polychaetes
VS6 37.19-72.51 (49.9)
52450-80275 (63625)
4-6 (5)
Pelecypods, amphipods
VS7 0.17-9.62 (3.37)
250-24675 (8139)
2-6 (4)
Amphipods, pelecypods
Overall average
0.17-72.51 (13.39)
125-80275 (12057)
1-7 (3)
Pelecypods polychaetes, amphipods
*Single value

50
Table 4.17.19: Percentage composition (%) of subtidal macrobenthos off Vashishti Estuary during March 2007
Station Faunal group
VS1 VS2 VS3 VS4 VS5 VS6 VS7 Average
Phylum Protozoa
Foraminiferans 16.4 16.0 3.4 - - - - 7.35
Phylum Cnidaria
Anthozoans 0.3 1.3 - - 1.7 - - 0.47
Hydrozoans - 1.3 - - - - - 0.09 Phylum Aschelminthes
Nematodes 5.8 - - - - - - 2.08 Phylum Chaetognatha
Chaetognaths 0.3 - - - - - - 0.09 Phylum Mollusca
Gastropods 5.8 9.4 0.8 - 1.7 0.7 - 3.21
Pelecypods 7.7 6.6 16.0 67.0 0.5 22.1 1.3 8.95 Phylum Annelida
Polychaetes 62.5 65.4 79.0 33.0 93.2 45.9 30.7 62.32 Phylum Arthropoda
Copepods 0.6 - - - - - - 0.2
Cumaceans - - - - - - 10.8 1.7
Tanaidaceans 0.3 - - - 1.2 31.3 57.2 13.09
Amphipods 0.3 - - - - - - 0.09 Phylum Echinodermata
Ophiuroids - - - - 1.7 - - 0.29
Phylum Vertebrata
Fish Larvae - - 0.8 - - - - 0.09

51
Table 4.17.20: Percentage composition (%) of subtidal macrobenthos off Vashishti Estuary during December 2007
Station Faunal group
VS1 VS2 VS3 VS4 VS5 VS6 VS7 Average
Phylum Cnidaria
Anthozoans - - 0.1 - 3.0 - - 0.1 Phylum Rhynchocoela
Nemertines - - 0.4 - - - - 0.02 Phylum Aschelminthes
Nematodes - - - - - - 0.5 0.1 Phylum Mollusca
Gastropods - - 0.1 2.8 0.4 6.6 - 5.0
Pelecypods - 0.3 0.1 2.8 0.6 79.4 39.7 63.7
Phylum Annelida
Polychaetes 100.0 98.9 98.7 91.5 94.1 2.2 2.4 16.5 Phylum Sipuncula
Sipunculan worm
- 1.2 0.2 - - - - 0.03
Phylum Echiurida
Echiurids - - - - 0.2 - - 0.01
Phylum Arthropoda
Cumaceans - - - - - 0.01 - 0.01
Anomurans - - 0.1 - - - 0.2 0.02
Amphipods - 0.6 0.1 2.8 0.2 11.8 51.9 13.9
Tanaids - - - - - 0.1 0.2 0.1 Phylum Echinodermata
Ophiuroids - - - - 1.4 - - 0.1
Invertebrate larvae
- - - - - - 5.1 0.5
Phylum Chordata
Fish larvae - - 0.1 - 0.2 - - 0.01