monitoring of market power -
TRANSCRIPT

A Review of the Monitoring of Market Power:The Possible Roles of TSOs in Monitoring for Market Power
Issues in Congested Transmission Systems
by
05-002 March 2005
Paul Twomey, Richard Green, Karsten Neuhoff, andDavid Newbery
WP
A Review of the Monitoring of Market Power The Possible Roles of TSOs in Monitoring for Market Power Issues in
Congested Transmission Systems
Paul Twomey, Richard Green, Karsten Neuhoff, David Newbery 1
The paper surveys the literature and publicly available information on market power monitoring in electricity wholesale markets. After briefly reviewing definitions, strategies and methods of mitigating market power we examine the various methods of detecting market power that have been employed by academics and market monitors/regulators. These techniques include structural and behavioural indices and analysis as well as various simulation approaches. The applications of these tools range from spot market mitigation and congestion management through to long-term market design assessment and merger decisions. Various market-power monitoring units already track market behaviour and produce indices. Our survey shows that these units collect a large amount of data from various market participants and we identify the crucial role of the transmission system operators with their access to dispatch and system information. Easily accessible and comprehensive data supports effective market power monitoring and facilitates market design evaluation. The discretion required for effective market monitoring is facilitated by institutional independence. JEL: D43, L13, L51, L94 Keywords: Electricity, liberalisation, market power, regulation
1 We would like to thank Michael Metcalf for helpful comments. Financial support from the Association of European Electricity Transmission System Operators (ETSO) and UK research council grant RG37889 (Supergen) is gratefully acknowledged. [email protected] is at the University of Hull Business School, [email protected], [email protected], [email protected] are at the Faculty of Economics, University of Cambridge.
1

1. Introduction The experience of countries that have liberalized their electricity markets has shown that the assumption that markets will naturally produce a competitive result is not always justified. Part of the problem derives from the difficulty of defining the relevant market. The number of different generation companies that directly compete with each other depends on the strength of the transmission system and the capacity of interconnectors between regions and countries. The present European reality is that although many countries have internally densely meshed networks with mostly adequate capacity, interconnections between countries are often inadequate and frequently congested. Congestion fragments markets into smaller zones behind the congested interconnections, and within these zones, the relevant market may be very concentrated. Even within countries, a transmission system that was efficient for a centrally dispatched vertically integrated monopoly may still give rise to potential internal transmission constraints that can be exploited by companies with generation capacity located in some parts of the country. In addition, electricity is a non-storable product with low demand responsiveness, and so markets are distinguished by time – electricity at 0800 is a different product that electricity at 0900 on the same day. Congestion varies over time and space, changing the size of the relevant market and the problem of market power from place to place and moment to moment. All these special features of the nature of electricity have led to concern over the existence of market power. Transmission system operators (TSOs) are concerned with the secure and efficient operation of the electricity system. Market power adversely affects this objective. First, it can induce generation companies to withhold output and lead to short-term supply shortages. Second, it results in distortions of price signals, resulting in inefficient dispatch and investment decisions. It may be argued that market monitoring is expensive, possibly costing some tens of millions of euros per year, and at best leads to a redistribution of rents between companies and consumers. This argument is readily countered. In a 300 TWh/year market such as Britain, the wholesale market may have a value of 10 billion euros per year. Inefficiencies of 0.1 of 1% of this amount to 10 million euros per year, and the extra production costs of inefficient dispatch will almost surely be considerably greater than this. For example, changing the merit order to cause a switch in a marginal plant of 1000 MW running 5000 hours per year that costs 2 euros/MWh more, amounts to an extra cost of 10 million euros/year. Such inefficiencies increase system costs and may induce regulators to impose further controls that risk further inefficiencies. Distorted price signals also make it more difficult for the TSO to assess the system conditions and therefore increases operational risks. TSOs should therefore be interested in contributing to measures that limit market power to avoid these negative effects, and are also well placed to provide information to aid the monitoring of market power.
2

The possible consequences of such market power include not only wealth transfers between customers and operators (which are politically important) but also impacts on operational and investment efficiency. The issue is of particular importance to policy makers and legislators as the effects of market power can substantially erode the benefits of deregulating an electricity market. The California experience showed how rapidly problems can arise in situations of unexpected scarcity (with inadequate contract coverage), and how easy it is for poorly informed policy makers and politicians to make hasty and costly decisions. Very high prices in wholesale markets can induce a flurry of investment and contracting (in California’s case, effectively by the State) that can precipitate market collapse and the financial distress of power companies. If future investment decisions are then left to the willingness of banks to finance an industry that they poorly understand and with which they have had recent bad lending experiences, the quality of investment decisions and future security of supply may be prejudiced. Thus the process of monitoring markets as a means of detecting and remedying market power has taken on an increased level of importance in liberalized markets as well as countries planning to take the liberalization route. In the Californian case market surveillance concentrated on the local market, and failed to monitor developments in the interconnected Pacific Northwest. An awareness of the interdependence of related markets is therefore important for timely and effective market surveillance, and may well suggest improvements elsewhere. Thus price spikes in the Netherlands electricity spot markets were linked to an inefficient market design for gas balancing. In California, the market design of the NOx market contributed to high electricity prices. Without detailed information on the hourly behavior of individual plants such assessments would not have been possible. However, detecting and proving the existence of market power in electricity markets is not an easy task. Economists and regulators have yet to develop a generally accepted, standardized set of market power monitoring procedures. Rather there exists a range of tools, techniques and measures - some drawn from standard industrial organization theory, some especially developed for electricity markets - which are employed to varying degrees by the different market monitors and regulators throughout the world. The development of electricity market monitoring has varied across nations. In most cases of market deregulation, the focus of the various participants has been on developing the operational systems, particularly the hardware, software and communications systems, needed to support the newly deregulated energy markets. Market monitoring systems have often been neglected in the initial specification and have thus subsequently evolved in a home-grown and somewhat piecemeal fashion. In some countries the neglect of market monitoring was intentional, such as in New Zealand where the problems of market power were expected to be dealt with by the market and general competition law. Even in the United States, where the federal regulator FERC is required to ensure that wholesale prices occur at “just and reasonable” rates, until the late 1990s market power
3
concerns were mainly limited to mergers and the issuing of licences for trading at market rates. However, dissatisfaction with the level of competitiveness in these markets has led to changes in the role of market power monitoring and control in both countries. New Zealand recently set up a regulator, the Electricity Commission, whose roles will include market monitoring. In the US, various market monitoring units have been implemented in different regions, and FERC has used Order 2000 and the Standard Market Design proposal (2002) to specify market monitoring as one of the eight essential functions that a Regional Transmission Operator (RTO) must provide. The US experience is of particular relevance to transmission system operators, since market power monitoring in that country is normally carried out by the Independent System Operator, some of which have, or hope to, become Regional Transmission Operators. The system operator naturally has access to much of the data that is required for effective monitoring, including a complete description of the transmission system, and continuous records of generator outputs, demands, and power flows. These system operators are also independent of any market participant, which should ensure their objectivity in dealing with sensitive matters. A system operator that is still integrated with generation or retailing, however, is unlikely to be a suitable host for an independent market monitor. Later in the paper, we discuss independent system operators’ incentives for undertaking market monitoring, and show that it can be to their advantage even if there is no formal requirement to do so. The aim of this paper is to examine the methods developed by economists for detecting market power, and to look at the actual practice of market power monitoring in a number of countries. Most of the coverage of this paper is on countries outside the European Union. This is mainly due to the availability of information and the more advanced development of market monitoring units outside Europe. While some EU regulators have established market surveillance units and provide information on their web-sites,2 it is unusual for these web-sites to provide the depth of information to be found on the examples we discuss, and for that reason we have concentrated our attention on examples of international best practice. Along with this analysis, we will look at the requirements for effective monitoring and analysis of market power and the role played by various organizations in the process of collecting and analysing information. We give particular attention to what is required of the transmission system operators in the market monitoring process. The focus of this paper is on the detection of market power. This includes the detection of the potential for market power as well as the actual exercise of market power. We will not, however, be examining the broader role of market monitoring which includes identifying and analysing the market rules that may have efficiency effects outside of those related to market power. There will also be little emphasis on the techniques that are
2 See for example, http://www.dte.nl/en/msc.asp
4

employed to mitigate market power. However, to the extent that mitigation techniques are linked to particular market detection methods such mitigation techniques will be mentioned. The outline of the paper is as follows. Section 2 introduces some of the key concepts of market power, including the various definitions of market power, strategies of exercising market power, categories of market power detection and methods of market power mitigation. Section 3 reviews the theory and empirical work on detecting potential and actual exercise of market power. These include structural indices, behavioural indices, simulation models and transmission analysis. Section 4 looks at the practice of market monitoring including the organizational forms of market monitors and the data and indices examined by market monitors. In light of this discussion of the theory and practice of market monitoring, section 5 discusses the requirements for effective monitoring and analysis of market power with particularly emphasis on the role of TSOs. Section 6 concludes the paper. The appendix is available in the online version of this paper at the Cambridge-MIT Institute (CMI) Electricity Project website3 and reviews a number of markets where there is available information of the data and indices monitored in practice.
2. Market Power 2.1 Defining Market Power Market power is typically defined as the ability to profitably alter prices away from competitive levels (Stoft 2002, p.318). The European Union defines Significant Market Power (SMP, specifically, in communications markets) as equivalent to the concept of dominance. An undertaking is defined as having SMP if, alone or jointly with others, it has “the power to behave to an appreciable extent independently of competitors, customers and ultimately consumers” (OJ, 2002). There are, however, a number of variants of this definition. Most definitions include the requirement that the exercise of market power be profitable. If this was not the case, for example, a company with a single large base-load plant that shuts off its plant and that has no other market positions could be defined as exercising substantial market power (in terms of ability to affect the market price) even though this strategy would be completely unprofitable for the company. In order to fully determine whether an action is profitable, however, one would need to know the complete portfolio position of the company. This is a very onerous requirement. As such, most market power indices based on company conduct typically rely on the assumption of rationality: if we assume companies are profit-maximizing, then we can assume that observed company conduct which alters prices is profitable for the company.
3 http://www.econ.cam.ac.uk/electricity/
5

The above example also raises the question of whether a company’s behaviour that appears to profitably exploit market power is necessarily intentional. Plants do break down and it would seem unfair to penalize a company just because that breakdown happened to be profitable for the company. As we will see later, statistical measures are sometimes used to examine this issue. For example, if the breakdowns of a plant are correlated with periods when such breakdowns significantly raise prices, then we may infer that the conduct is intentional and not accidental. This statistical information can be used as a trigger for further investigation or, depending on the burden of proof required for market power cases, used as prima facie evidence for the existence of market power abuse. Some definitions of market power include the provision that the ability to alter prices away from the competitive level be maintained for a ‘significant period of time’. In the view of the U.S Department of Justice (DOJ) and Federal Trade Commission (FTC), for example, this period is measured in years (e.g. one or two years). However, experience with electricity markets has shown that huge transfers of wealth can occur in the period of months rather than years. A short-lived but dramatic price increase can injure consumers and competition as much as a longer-lived but more modest price increase. As such, market power definitions for electricity markets, such as with FERC’s definition in the Standard Market Design (SMD), do not include a specific time limitation. In the UK, the main regulatory agency Ofgem (the Office of Gas and Electricity Markets) unsuccessfully tried to introduce a so-called Market Abuse Condition in the licences of generators which included the recognition of both the magnitude and duration of market power. The condition stated that a generator had the ability to exercise market power if it could bring a wholesale market price change of: 5% or more for a duration of more than 30 days in a one-year period; 15% over ten days in a one-year period, or 45% over 160 half-hours (approximately 1% of the year) in a one year period.
These periods did not have to be continuous periods. Note that the effect of this test is to define market power as the ability to increase wholesale market prices in such a way as to increase annual wholesale market revenue by rather less than ½ of 1 percent. This might seem an unreasonably stringent test of potential market power, but the idea of relating the potential price increase to annual revenue is clearly sensible.4
There are a number of implications and distinctions that arise from the above definitions of market power. First, high prices, while often recognized as a symptom of market power, do not prove that market power exists. High prices can be consistent with a well-performing, competitive market where supply is scarce. Similarly, high profits for an
6

individual generator may also be due to a number of factors other than exercising market power. It should also be noted that market power may be exercised so as to lower prices below the competitive level. This may occur with a dominant generator which is operating a predatory pricing strategy or be the result of monopsony power of consumers. Low wholesale prices may also be indicative of other structural problems with insufficiently unbundled companies securing their overall profit objectives by increasing profits in protected market segments and deterring entry into potentially competitive segments. A distinction should also be made with respect to the industry structure to which the concept of market power is being applied. Horizontal market power concerns company behaviour in a single market activity (e.g. generation) and is often exercised via control of a significant market share. Vertical market power concerns companies involved in two or more related activities, such as electricity generation and transmission, where dominance in one area is used to raise prices and increase profits in the other activities. Concerns related to vertical market power in the electricity sector are commonly understood and will not be discussed here. The mechanisms for addressing them, such as requirements for independent operation of the transmission system and non-discriminatory access to it are now becoming more widely accepted. There is also an important relationship between the various electricity energy markets including the spot, day-ahead and forward markets. It is often assumed that as long as the spot market is competitive, this will discipline the other forward markets (Stoft, 2002). Also, as first noted by Green (1992), in a simple two-period model, generators that have contracted all their energy in the forward market have no incentive to distort the spot price, and will therefore bid competitively. That is, the forward market is a powerful means of mitigating market power in the spot market. Joskow and Kahn (2002) confirm this theory by their observation that “the one supplier for which we do not find any significant evidence of withholding had apparently contracted most of the output of its capacity forward.” However, as McDiarmid (2002) points out, spot market mitigation deals only with the component of forward prices that depends upon spot price expectations. It does not mitigate the part of forward prices that depends upon buyers’ risk aversion. If market monitors do not directly mitigate market power in forward markets, sellers in regions with limited competition may be able to extract market power rents from buyers’ willingness to pay for price certainty. In other words, they will obtain in the forward market rents that they cannot obtain in the spot market. Thus, to the extent that load serving entities cannot afford to wait around for the spot market to ensure long-term supply stability, short-term mitigation will not necessarily put adequate competitive pressure on sellers with market power with regard to the forward market (McDiarmid, 2002). Given that the forward 4 Two companies successfully appealed to the British Competition Commission against being
7

price risk premium is related to spot price volatility, Robinson and Baniak (2002) theoretically demonstrated that generators with market power have an incentive to create volatility in the spot market. Examining the period in the UK market when the two major generators were subject to price caps and no longer subject to regulated vesting contracts (1994-1996), they found evidence to support this hypothesis. Another common distinction of relevance here is the separation of system-wide market power from local market power. The former refers to market power occurring at the broad market level, typically due to the existence of dominant generators and/or tight supply conditions. Local market power arises when transmission constraints create isolated geographic markets in which the broader market players can only minimally participate. Particularly around large population centers and in geographically remote areas, there are often only a small number of generation units able to meet a local energy or reserve capacity requirement. In such cases the incumbent generators face little competition and have the potential to exercise market power. As well as having the obvious consequence of extracting substantial profits from the market in these regions, a secondary, somewhat less obvious consequence lies in the impact of this local market power on the broader market. Knowing that there is a chance that a portion of a generator’s output must be taken, it will bid that output less aggressively into the market than it otherwise would. Other companies, knowing that their competitors are likely to compete less aggressively, will also find it profitable to bid less aggressively. This creates a process of negative feedback that can lead to higher prices throughout the entire region. The transmission constraints that give rise to local market power may occur naturally or by the manipulation of transmission facilities or generator dispatch patterns. It is important to note that the problem exists regardless of the methods used to price transmission congestion, whether by physical transmission contracts with separate energy markets or with integrated energy and transmission markets (nodal pricing, zonal pricing, market coupling) with financial transmission contracts. However, designs that deviate from nodal pricing with financial transmission contracts ignore or simplify physical reality and thereby create additional opportunity for the exercise of market power. Section 3.4 will examine some of these issues. Finally, there is an important distinction between the potential for market power and the actual exercise of market power. To the extent that prevention is often better than cure, we will see that interest in detecting potential market power is deemed by most market monitors as just as important a tool as detecting the actual exercise of market power.
required to accept the Market Abuse License Condition, which was then abandoned by Ofgem.
8

2.2 Strategies of Exercising Market Power How market power is exercised depends on the exact structure of the market, and in particular the price-setting mechanism. However, the primary methods of exercising market power are:
(1) Physical or quantity withholding, which involves deliberately reducing the output that is bid into the market even though such output could still be sold at prices above marginal cost. Withholding can be done through not bidding, de-rating, or declaring unit outages.
(2) Financial or economic withholding, which involves bidding in prices higher than the competitive bid for the particular unit.
(3) Transmission related strategies, which involves creating or aggravating transmission congestion in order to raise prices in a particular zone or node. Insufficiently unbundled generators can achieve this through outages of transmission, understating transmission ratings/capacity, and dispatch of generation deviating from marginal cost
From an analytical perspective these strategies (especially the first two) are often equivalent. For example, a shift in the supply curve could be a leftward shift due to reduced output or an upward shift due to increased price depending on which company has withdrawn output or raised their bid price (Stoft, 2002). In either case, the unifying idea is that these strategies would not be profitable in a competitive market - raising the bid price or physically withholding output would just result in a smaller market share without receiving any additional revenue on the rest of the company’s portfolio. However, in some cases, the strategies have differing effects on the resulting merit order. 2.3 Detecting Market Power Detecting market power is never an easy task and doing so in electricity markets is no exception. However, there are features of electricity markets that assist in the detection of market power that are not present in most other markets. For example, in electricity pools and most spot-markets generators bid their willingness to provide output for their entire range of market prices (whereas in other markets we typically only observe the market clearing price and quantity data). One useful consequence is that it is possible to construct actual residual demand curves for individual market participants. The elasticity of this residual demand curve provides a direct measure of potential market power, as discussed below. Another feature of most electricity markets is that technological data such as generation heat rates and capacity are often available to monitors because many generation units were formerly state-owned or under a cost-regulation regime or are technologically standard units for which there is publicly available cost data. Thus forming estimates of costs is perhaps more precise than in other industries. Another useful
9

feature of the electricity industry is that the overwhelming contribution to short-run variable costs is the cost of fuel, for which prices are usually readily available. Indeed, several price reporting services such as Platts provide estimates of the spark and dark spread – the margin of spot or forward electricity prices over the spot or forward cost of fuel used (either gas or coal respectively) in plant of standardised thermal efficiency. In classifying the various methods of detecting market power a useful distinction is between techniques that are applied ex ante - looking for the potential for market power - and those that are applied ex-post - usually looking for the actual exercise of market power. A second useful distinction is between those techniques that are applied over longer time horizons, often in the context of merger analysis or market design evaluation, and those techniques that are applied close to the real time market, often in the context of immediately mitigating market conduct. Table 1 gives some examples of the market power detection techniques, categorize under these two distinctions, which will be discussed in this paper. Table 1 - Categories of Market Power Detection Techniques5
Ex-Ante Ex-Post
Long-Term Analysis
- Structural indices, e.g. Market share, HHI, residual supply index - Simulation models of strategic behaviour
- Competitive benchmark analysis based on historical costs - Comparison of market bids with profit maximizing bids
Short-Term Analysis
- Bid screens comparing bids to references bids - Some use of structural indices such as pivotal supplier indicator and congestion indicators
- Forced outage analysis and audits - Residual demand analysis
Other classifications of market power detection techniques are also possible. Some techniques are applied to the market as a whole and thus do not identify particular companies as causing or likely to cause market power problems (e.g. the Herfindahl-Hirschman index). Other market power measures are applied at the company level in the market and identify individuals companies (e.g. the pivotal supply index). Most of the techniques can be applied at both the system-wide market level and the local market level. However some indices are exclusively concerned with transmission market conditions and local market power issues. 2.4 Mitigating Market Power
5 This table is inspired by a similar table in Helman (2004)
10

It is not the aim of this paper to examine or evaluate the various proposed remedies for reducing market power. However, it is useful to have some idea of the types of market mitigation methods that may be implemented by a market monitoring or regulatory authority in order to determine what market detection techniques are more likely to be useful for their purpose. For example, if it is deemed that mitigation should be applied ex-ante (e.g. requiring suppliers with potential market power to bid at cost) then an ex-ante detection technique such as the pivotal supplier index is more likely to be useful than an ex-post econometric study of price-cost margins. Before examining some of the market power mitigation methods, it may be useful to be reminded why the electricity industry requires special remedial treatment as compared to other industries. In most countries there is a general competition or anti-trust authority that covers the role of investigating and remedying possible abuses of market power. As such, most industries do not require a special market monitor or regulator. However, as most economists argue, the nature of electricity production and consumption make it particularly susceptible to market power. The two most important factors are: Electricity cannot be stored cheaply (except in hydro facilities), which, along with
binding, short-run capacity constraints, makes the supply response relatively inelastic;
Demand price-responsiveness of electricity customers is limited and therefore very inelastic. Typically only large industry customers are exposed to real time prices. Steps to expand real-time pricing to larger consumer groups are often discussed by economists. However, given the comparatively low cost of electric input to most production and consumption decisions it is unclear how much real-time metering would alter the situation.6
The combination of inelastic supply and demand facilitates the exercise of market power when total demand moves closer to total supply capacity during peak demand periods. The electricity industry also has characteristics that tend to assist in tacit collusion among its participants. The European Commission uses the term ‘collective dominance’ to describe those markets that are susceptible to tacit co-ordination and lists characteristics of these markets. These include concentration, transparency, maturity, frequent market interaction with a homogenous product produced by companies with similar costs and
6 See Patrick and Wolak (2001) for an analysis of demand elasticity for medium and large industrial companies in the UK during the period 1991 through 1995. They found that price elasticities varied considerably across industries as did the pattern of within-day substitution in electricity consumption. During high price periods, they found that, despite small elasticities, significant load reduction occurs for these participants. See Lafferty et al. (2001) for further discussion of demand responsiveness in electricity markets.
11

market shares, facing an inelastic demand, and with barriers to entry.7 To varying degrees, electricity markets display most of these characteristics, which supports the case for the special treatment of the electricity industry. Market mitigation methods can be loosely collected into three main categories:
Structural solutions, Regulatory solutions, and Market rules solutions.
The classical structural solution to the problem of market power is to mandate or encourage the divestiture of the dominant generator or generators. One of the earliest examples of this was in the UK, where the conventional generation units of the formerly state-owned monopoly were split into two new companies, which in turn were later encouraged to further divest their assets. In addition, encouraging new market participants by reducing or removing barriers to entry is also recommended as a useful means of encouraging a competitive electricity market. Barriers may include licence conditions, generation site permits, and non-discriminatory access to the transmission network. Expansion of the transmission system is also another means of decreasing concentration of generation by expanding the geographic market over which suppliers are competing. On the demand side, various means of increasing price responsiveness of electricity customers is also seen as a promising way of reducing market power. Regulatory forms of market mitigation include the imposition of system wide constraints such as market-price caps. Many countries include such caps as a ‘safety-net’ measure. Another regulatory tool is to require dominant generators to sell a certain amount of their capacity under long-term contracts at a pre-negotiated or regulated rate. Where governments have privatised generation companies they have frequently provided them with so-called ‘vesting’ contracts as a transitional tool in the development of competitive electricity markets.8 In other cases, governments may provide private generation companies with Competition Transition Contracts to allow them to recover stranded costs incurred under a previous cost-based regulatory regime (as in Spain and California). Similarly, where divestiture was found to be institutionally or politically difficult, there have been cases where the right to use electricity generation units has been auctioned off rather than ownership of the assets themselves (e.g. Alberta, or in Virtual Power Plant
7 For a theoretical discussion of the factors affecting the sustainability of tacit collusion in the context of supergame theory, see Tirole (2002). 8 Vesting the company takes place when it changes its form to a limited liability company, hence the term vesting contracts, put in place at that date. These may be intended to provide predictability to the revenue stream to facilitate a convincing privatisation prospectus, but have the indirect effect of reducing the incentive to manipulate the spot market. Problems of market power may thus be concealed until the contracts fall due for replacement, at which point they re-emerge, as in Britain in 1993 (Newbery, 1995).
12

auctions in e.g. France and The Netherlands). In general, the encouragement of forward contracting is regarded as an important means of reducing market power (Allaz & Vila, 1992). The third type of market mitigation methods are those market rules or behavioural regulations aimed at the actual operations or decisions of the generators in electricity markets. The most important of these include caps on unit-specific bidding. These are often regarded as the most heavy-handed form of regulation and most liable to have unintended undesirable side effects. They also often require specific company related information that may be difficult to acquire. Most economists would argue that the regulatory and market rules mitigation solutions should be used as transitional devices on the road to fully competitive markets or only under rare market conditions, rather than a foundation upon which to operate the market. But even in the short term there is a need to balance the cost of mitigating market power against the costs of the market power itself. Most economists would agree that it is far more costly to eliminate all market power than to allow some market power to exist. For example, there are efficiency benefits of providing flexibility to supply bids but there are potential market power consequences as well. Unfortunately there is little empirical work examining these trade-offs. Similarly, the use of price caps has created an enormous debate regarding their effect on revenue sufficiency for peaking plants (e.g. Stoft, 2003). If price caps lead to plants only covering their marginal costs, there will not be enough revenue to cover the fixed costs of the plant. For this reason, perfect competition is not necessarily the appropriate standard to be aiming at. Economists generally refer to ‘workable competition’ as a competitive standard with an acceptable level of market power. However, economists are not always clear as to what this acceptable level of market power should be. It should also be mentioned that the electricity sector varies from most other sectors in that a variety of different technologies are applied to produce electricity. If market power distorts prices, then both operational and investment decisions between these technologies can be seriously distorted. For example, some economists argue that the exercise of market power during times of capacity scarcity might provide a way to finance fixed costs. However, it might over-reward units available during this period and thereby discriminate against intermittent (renewable) energy generation. As with market detection techniques, the applications of market mitigation methods can be classified on an ex-ante/ex-post and short term/long term basis. Table 2 gives an example of the applications of market mitigation as sorted by this classification.
13

Table 2 - Applications of Market Power Mitigation Systems Ex-Ante Ex-Post
Long-Term
-Mergers rulings -Assessing applications for market-based rates (in US) - Determining potential must-run generators
-Litigation cases (e.g. California refund case) - Changing market design
Short-Term
- Spot market bid mitigation - Must-run activation & other system operator contracting
-Short term price re-calculations - Penalties for withholding
3. Indices and Models of Detecting Market Power An ideal index of market power is one that provides in a simple number a measure of the ability to exercise market power. The test of its suitability is its ability to predict the exercise of market power, or its correlation with the excess of the market price above a reference benchmark competitive level. On this criterion, some measures that work well for other markets perform poorly in electricity markets, and more sophisticated measures are therefore required. 3.1 Structural Indices A natural starting point in discussing measures of market power is the structural indices of traditional industrial organization theory. Some of the earliest work in market power in electricity markets (e.g. Schmalensee and Golub, 1984) was based on analyzing market share and the Herfindahl-Hirschmann Index. Criticisms of these measures, in particularly the appropriateness of these static measures in a dynamic market such as electricity, has led to the development of other indices which take into account demand conditions and not just the supply side (e.g. the pivotal supply index). The aim of this section is to briefly review the features and applications of these indices. 3.1.1 Market Share Concentration indices are usually simple scalar metrics that measure the supplier concentration of a market. The motivation behind these indices is that the more concentrated a market, the more likely is the ability of its participants to exercise market power. The two most commonly used concentration indices are market share and Herfindahl-Hirschman Index (HHI).
14
The market share concentration ratio is the percentage of market share of the largest n companies in the industry. The number of companies, n, is often 4, but for the purposes of discussion here we will assume that the index is used for a single company. Thus, if company A is producing 30 MW in a market of 100 MW, company A is said to have a market share of 30%. Shapiro (1989) provides a theoretical justification for the use of this index as a measure of potential of market power by showing that a company’s profit is maximized in a Cournot equilibrium when the price-cost margin (a measure of the exercise of market power, discussed later) is proportional to the market share of the company and inversely proportional to the market-wide price elasticity of demand. In order to calculate this index, some preliminary definitions need to be made which are not uncontroversial. Firstly, the relevant product needs to be identified. In electricity markets the choices can include energy production, energy plus reserves, short-term capacity or long-term capacity. As mentioned above, electricity in different half-hours may not be readily substitutable, so a time dimension (e.g. weekday winter peak-hours) may also be needed. As it is not always clear what is the most appropriate product, many studies include a number of different market share indices based on these products. The second preliminary definition concerns the geographic boundaries of the market: who should be considered competitors of a company? A number of methods have been employed. Two of the traditional approaches have been the classical ‘law of one price’ test and the ‘small but significant non-transitory increase in price’ (SSNIP) test. The SSNIP test asks: If all the generators in a particular geographical location combined into a single company, could a price rise, say 5%, in that region be sustainable? The classical “law of one price” test defines a market as the geographic area within which the same thing is sold for the same price at the same time, allowance being made for transportation costs (in this case, transmission losses but not congestion rents which arise where markets are separated). While this is easy to implement in electricity markets due to the vast amounts of price data available, its use for antitrust purposes has been met with criticism (Werden and Froeb,1993; Scheffman and Spiller, 1987; Haddock et al, 2003). In the US in the 1990s, FERC adopted a market size definition called the ‘hub and spoke’ test. The market size was simply the total capacity controlled by the targeted applicant plus that of all utilities directly interconnected with that applicant ignoring any transmission constraints might exist. This definition was used by FERC originally to assess the impacts of electric utility mergers on market concentration and later employed in the assessment of market-based rates. Having established a product and market size definition and calculated the market share, a benchmark for the resulting market share needs to be defined: what is a significant market share such that authorities should be concerned about the possibility of market power? In the US, FERC identified 20% as the benchmark for finding lack of market power,
15

although there were a number of cases where it approved market-based rates even where this threshold is exceeded.9 European case law in normal markets defines significant market power (SMP) as equivalent to dominance, and notes that market shares are not conclusive, but if no company has a share greater than 25%, there is a presumption of a lack of SMP, and a finding of SMP normally requires a market share of greater than 40%, with a share above 50% presumptive of SMP. Clearly this is unlikely to be a useful test for electricity markets, which have very different characteristics from normal markets. Indeed, in a recent merger inquiry, the Dutch Competition Commission (NMa) imposed remedies to offset concerns of market power when the merged company would have had less than 30% of the Dutch electricity market. Market share indices are a popular tool and have been with academics and, as we shall see in section 4, market monitors. Once the product and market boundaries have been determined, the index is easy to calculate and can be used in long term studies as well as close-to-real-time screening. However, most users of this index are aware that it has serious limitations which we will examine after discussing another popular concentration index. 3.1.2 Herfindahl-Hirschman Index (HHI) One of the criticisms of the market share index is that the ability of a company with a 20% market share to exercise market power may be different when that company is the largest player in a largely deconcentrated market, versus being the second or third largest player in a highly concentrated market. An attempt to address this systems aspect of market power is the Herfindahl-Hirschman Index (HHI). The HHI is calculated by taking the sum of the squares of the respective market participant’s market shares:
HHI = S12+S2
2+…+Sn2
Where Si is the percentage market share of company i. For example where there are 10 equal sized companies in the market, the HHI would be equal to 10*102=1000. As the HHI is composed of company level market shares, the same issues of product and market size definitions obviously have to be addressed here as well.
9 See, e.g., Vantus Energy Corp., 73 F.E.R.C. ¶ 61,099, at 61,315-16 (1995) (26% installed generation market share acceptable), clarified, 74 F.E.R.C. ¶ 61,258 (1996); Southern Co. Services, Inc., 72 F.E.R.C. ¶ 61,324, at 62,405-06 (1995) (26% installed capacity in one market, with shares in excess of 20% in 13 of 15 relevant markets, acceptable), order on reh’g, 74 F.E.R.C. ¶ 61,141 (1996). In the context of the PJM independent system operator, the Commission has also accepted market-based rates where market shares exceeded 25%. Atlantic City Electric Co., 86 F.E.R.C. ¶ 61,248 (1999). (Source: Bogorad and Penn, 2001)
16

One justification for use of the HHI is that under certain conditions, most critically constant marginal costs and no capacity constraints, the HHI divided by the elasticity of demand is equal to the Cournot equilibrium Lerner index, which is another indicator of market power discussed below (Tirole, 2002). In evaluating the significance of a particular HHI, the results can be broadly characterized into three regions: unconcentrated (HHI below 1000), moderately concentrated (HHI between 1000 and 1800), and highly concentrated (HHI above 1800).
In an early study, Schmalensee and Golub (1984) calculated values of the Herfindahl-Hirschmann Index (HHI) for electricity markets throughout the United States for 170 generation markets serving nearly three-quarters of the U.S. population. They found that, depending on the cost and demand assumptions used, 35 percent to 60 percent of all generation markets had HHI values above 1800. A more recent study by Cardell, Hitt and Hogan (1997) suggests that electricity markets are still highly concentrated. Using 1994 data and a narrower definition of the geographic scope of electricity markets, they calculate HHI values for 112 regions based on State boundaries and North American Electric Reliability Council (NERC) subregions. Approximately 90 percent of the markets examined in this study had HHI values above 2500. A major criticism of market share and HHI analysis for electricity markets is that even where the most dominant net seller has a relatively small market share (say less than 10%) they may still be able to exercise market power. This is seen as a consequence of being a static measure and examining only the supply side of the market. Electricity market conditions change hour by hour due to changing demands levels, generation outages, transmission failures, etc. Most significantly, during periods when the system demand is close to capacity, a supply can become ‘pivotal’ and exercise market power even with a relatively small market share. Sheffrin (2001) points out that under certain definitions of the relevant market, no single supplier in California had a 20% market share during the California crises10, yet many would argue that the market was not workably competitive. William and Rosen (1999) found that a daily HHI based on actual power delivered had no ability to predict actual market power as measured by the price-cost margin index (discussed below). In the U.S, the use of market share using the hub-and-spoke methods was dropped in November 2001 when it was replaced by the Supply Margin Assessment criteria (see below). However, in April 2004 FERC announced that is would again be using market share (but with a new method for determining the market size) as one of two “indicative
10 Similarly, Blumsack and Lave (1999) calculate a HHI of 664.
17

screens” (along with the Pivotal Supplier Indicator discussed below) to determine whether utilities should be permitted to sell electricity at market-based rates (FERC 2004). Their market share analysis considers the percentage of the total uncommitted generating supply in a market that is owned or controlled by the applicant during each of the four seasons of the year. If the applicant has more than a 20 percent market share of the total uncommitted capacity in the market in any season, it is presumed to have market power. 3.1.3 Pivotal Supplier Indicator The pivotal supplier indicator is an attempt to incorporate demand conditions, in addition to supply conditions, in a measure of potential market power. This indicator examines whether a given generator is necessary (or ‘pivotal’) in serving demand. In particular, it asks whether the capacity of a generator is larger than the surplus supply (the difference between total supply and demand) in the wholesale market. Bushnell, et. al. (1999) defined the Pivotal Supplier Index (PSI) as a binary indicator for a supplier at a point in time which is set equal to one if the supplier is pivotal, and zero if the supplier is not pivotal. The PSI from each hour over a period of time (e.g. one year) can then aggregated to determine the percentage of time for which a company achieves pivotal status. For example, Bushnell et al (1999), in an ex-ante study of the Wisconsin/Upper Michigan (WUMS) region, found that the largest supplier would have pivotal supplier status in 55% of the hours in a year.11
The Supply Margin Assessment (SMA) is the name of the pivotal supplier indicator adopted by FERC in 2001 as a market power screen to replace the 20% market share screen.12 However, the SMA has subsequently been criticized on a number of accounts (McBeidle 2002, Vasssipolous 2003): The measure is highly restrictive and is triggered by a single hour being pivotal; The measure does not account for net buying or selling positions in the market It only applies to peak hours and thus may miss other opportunities to exercise
market power. For example, many US markets have found price spikes in non-peak periods due to maintenance outages and unexpected weather patterns. Furthermore, the relevant market is defined by transmission constraints that can be sensitive to the precise combination of generation and load on a system at a particular time (McBeidle, 2002)
11 For other examples of the use of the PSI see Morris (2003) and Patton (2002). The latter uses the PSI to examine location market power. 12 The SMA methodology was articulated in AEP Power Marketing, Inc., et al.6 97 FERC ¶61,219 (2001).
18

By only looking at whether a single supplier is pivotal during peak hours, the SMA overlooks the potential for coordinated interaction among generators, ranging from explicit collusion to conscious parallelism. Kirsch (2002) and Blumsack et al (2002) argued that the SMA or pivotal supply indicator should be supported by an HHI metric applied specifically to groups of suppliers who, together, are pivotal.
The definition of market supply surplus ignores the necessity of maintaining an operating reserve.
Many of these criticisms, however, are not of the concept of the pivotal supplier index but of its implementation. 3.1.4 Residual Supply Index The Residual Supply Index (RSI) is similar to the PSI but is measured on a continuous scale rather than a binary scale. As such the index addresses the criticism of the PSI in that it may be possible for a company to exercise market power when it is nearly, but (as the PSI shows) it is not actually pivotal. The RSI was developed by the California Independent System Operator (CAISO).13 The residual supply index for a company i measures the percent of supply capacity remaining in the market after subtracting company i’s capacity of supply.
RSIi = (Total Capacity-Company i’s Relevant Capacity)/Total Demand where:
Total Capacity is the total regional supply capacity plus total net imports, Company i’s Relevant Capacity is company’s i’s capacity minus company i’s contract obligations, and Total Demand is metered load plus purchased ancillary services.
When RSI is greater than 100 percent, the suppliers other than company i have enough capacity to meet the demand of the market, and company i should have little influence on the market clearing price. On the other hand if residual supply is less than 100 percent of demand, company i is needed to meet demand, and is, therefore a pivotal player in the market. As well as calculating an individual company’s RSI, an RSI can be calculated for the market and a whole. It is usually defined as the lowest company RSI among all the companies in the market and will correspond to the largest supplier in the market. Empirically, the RSI has been used successfully in predicting actual market power as measured by the price-cost mark-up (discussed in section 3.2). CAISO analysis of actual
13 See Sheffrin (2001, 2002a, 2002b, 2002c)
19

hourly market data found a significant relationship between hourly RSI and hourly price-cost markup in the California market. The relationship indicates that on average an RSI of about 120% will result in a market price outcome close to the competitive market bench-mark. (Sheffrin, 2001). CAISO has also evaluated the market power mitigation benefit of the expansion of a transmission path by analyzing the market benefits of more imports into a region which can increase RSI and reduce prices. The price-cost-RSI analysis can also be used to test the level of reserve margin necessary to yield competitive market results. (Sheffrin 2001)
Based on this analysis, Sheffrin (2002a) argues for the usefulness of market screening rules of the type:
RSI must not be less than, say, 110% for more more than 5% of the hours in a year (about 438 hours); or
RSI must be more than, say, 110% for 95% of the hours in a year The advantage of using the RSI over PSI is that there is flexibility is setting thresholds compared with the PSI, which is implicitly set at 100%. Thus using a higher threshold (e.g 110%) may account for possible collusion. Furthermore, RSI thresholds can be adjusted on the base of experience. 3.1.5 Residual Demand Analysis Residual demand analysis is a more sophisticated measure of the incentive of a company to exercise market power that is derived from examining the residual demand curve faced by a company (Baker & Bresnahan, 1992). The residual demand curve is calculated by subtracting from the total demand curve all the offer curves bid into the market by other participants. Of course, in real time the company does not know exactly the residual demand curve it faces. However, it can be constructed ex-post.14 As mentioned earlier, one of the advantages of electricity markets is that such data for constructing residual demand curves actually exists. However, whether such data is archived and available to the market monitor or regulator is another issue (see section 5). In a competitive market, a company will face a highly elastic residual demand curve and will have no ability to raise prices above the competitive level via any amount of withholding. At the other extreme, if a company is pivotal (as defined above), then it faces a highly inelastic residual demand curve and will suffer little loss in sales by charging a high price. In the intermediate cases, a company may not be strictly pivotal (in
14 An interesting feature of the ex-ante uncertainty of the residual demand curve that a company faces, is that it in turn affects the elasticity of its own bid curve. The more uncertainty a company faces, the range of possible equilibrium supply curves narrows away from both the high price supply curve (full Cournot pricing) and the competitive pricing supply curve. This feature is an important part of Klemperer and Meyer’s (1989) supply function equilibrium analysis.
20
terms of total market capacity) but may still face a range of prices for which it may be able to exercise some market power depending of the degrees of residual demand elasticity. Baker & Bresnahan (1992) and Wolak (2000) have demonstrated a theoretical equivalence between the inverse of the residual demand elasticity and the Lerner Index – a popular measure of market power discussed in the next section. The results of residual demand analysis are usually expressed in this manner. In electricity markets, the main empirical work employing residual demand analysis has been conducted by Frank Wolak (2000, 2003). For example, Wolak (2003) measured the incentives of the five largest electricity suppliers in California to exercise power in the state’s wholesale market during 1998-2000. Using actual bids submitted to the California Independent System Operator’s (CAISO) real time energy market he computed the hourly price elasticity of the ex-post residual demand curve faced by each supplier evaluated at the market clearing price for that hour. Using the average hourly value of the inverse of the company-level residual demand elasticity over the period Jun 1 to September 30 of each year as a summary measure of the extent of unilateral market power possessed by each supplier, Wolak found that this measure increased substantially in 2000 relative to the corresponding company-level values in 1998 and 1999. He uses these results to argue that the enormous increase in market power documented in other studies (e.g. Borenstein et al. (2002)) was due to increases in unilateral market power and thus there is no need to use collusion as an explanation. A limitation of this analysis is that it has, so far, not taken into account transmission constraints in constructing the residual demand curves. Such constraints would have the effect of decreasing the residual demand elasticity and thus increasing the potential to exercise market power. 3.2 Behavioural Indices and Analysis Whereas structural indices look to find the potential for market power, behavioural indices typically examine the actual conduct of companies, looking for evidence of the exercise of market power. This often involves examining individual bid prices and quantities. As mentioned earlier, high prices (or low quantities offered) are not, in and of themselves, evidence of market power. The challenge therefore is to develop meaningful indices and analyses that can discriminate between high prices resulting from genuine scarcity as opposed to the exercise of market power. The problem that often arises, however, is that such analysis often requires detailed data for which there are issues of availability, access and confidentiality.
21

3.2.1 Bid-Cost Margins In a competitive market, price-taking companies should bid at marginal cost. Therefore, the comparison of a generator’s bid with its marginal cost is an important measure in determining the exercise of market power in electricity markets. If a company is frequently bidding in prices well in excess of marginal cost (whether it is setting the system price or not), it may well be exercising market power. Therefore there have been a number of empirical studies examining bid and cost data seeking to determine the extent to which market power has been exercised. The results of these studies are usually expressed in terms of the Lerner Index (LI) or Price-Cost Margin Index (PCMI):
PMCPLI −
=
MCMCPPCMI −
=
Under a uniform price auction, the indices can be applied to individual company bids, in which case the appropriate marginal cost is that of the bidding company. Under discriminatory price auctions, the application of price-cost margin is only appropriate to the marginal generator. In either case, a perfectly competitive market is presumed to offer no margin above marginal cost, and hence the LI and PCMI are zero. One of the earliest examples of price-cost margin analysis was by von der Fehr and Harbord (1993) who analysed bid and marginal cost data for the two large conventional generating companies in the England and Wales pool from May 1990 to April 1991, using the electricity pool bid data and generator cost estimates derived from published thermal efficiencies and fuel prices. Their evidence showed that for the first 7-9 months of the market’s operation, both National Power and PowerGen bid very close to their (estimated) marginal costs in most periods. By early 1991 however, bidding behaviour had changed and both of the generators were increasingly bidding above their costs. More recent studies include Short and Swan (2002), Fabra and Toro (2003) and Evans and Green (2003), where the authors not only try to demonstrate the existence of market power but also attempt to explain the variations in the Lerner Index with reference to structural and other factors. One of the great difficulties of this empirical work is determining the appropriate marginal cost. The approximation most commonly used is the variable fuel cost of the generator, calculated from fuel prices and thermal efficiencies (heat rates). However there are problems with this approach:
22

There are other variable costs that are difficult to quantity, such as commitment decisions and increased cost of equipment degradation if used outside of designated parameters.
Variable costs do not necessarily approximate marginal costs for units with substantial opportunity costs (e.g. hydro electricity resources, generation with significant environmental restrictions, export market alternatives) (Brennan, 2003).
Variable costs data may be confidential and difficult to obtain and audit. Questions remain over whether the appropriate measure is long run marginal
cost rather than short run marginal cost. Furthermore, even in a perfectly competitive market, the market price can exceed the marginal cost of the marginal producer if supply is constrained. The above-cost pricing is sometimes referred to as scarcity pricing and is not a demonstration of market power. Furthermore it fluctuates and cannot be easily ‘factored out’. In many electricity markets, the design of the electricity auction is such that the market price is set at the offer price of the last accepted supply bid. If this price does not clear the market (demand is still greater than supply), then raising the bid of the marginal generator has the beneficial effect of raising the price towards the competitive price. Stoft (2002) describes this as “negative market power”. Some studies set the price-cost margin to zero in hours where there is no spare capacity, ensuring that high prices at these times are not seen as evidence of market power. Thus given all these issues, even if a study uncovers a large price-cost margin, it is still difficult to say conclusively whether this is due to abuse of market power or estimation error. This was well illustrated in the highly contentious hearings to determine the refunds to utilities from suspected market power abuse by a number of generators during the California crises, 2000-2001. An alternative to comparing bids with estimates of marginal costs is to compare bids with prior bids submitted by the same company when the market was assessed to be competitive (Power Pool of Alberta, 2002). However, variations in bids are still possible, given changes in costs, even in a competitive market, so prior bids or ‘reference’ bids are usually indexed to fuel and other costs, thus reintroducing most of the previous criticisms of estimating marginal costs. Nevertheless, screening tools using such approximated reference bids can be used to identify changes in bidding patterns that fall outside of established thresholds. 3.2.2 Net Revenue Benchmark Analysis Another type of analysis employing cost data is net revenue benchmark analysis. As was mentioned earlier, high net revenue is not proof of market power (just as high prices are not proof). Nevertheless, net revenue is still considered by many researchers to be a
23

useful figure to monitor and some empirical work has been conducted to attempt to estimate the net revenue of classes of generation. As well as indicating the possibility of abnormal profits due to market power, tracking net revenue in markets with price-cap mitigation may also useful to determine if peak generation earns enough revenue to cover fixed costs. In the long run, the revenues from the energy, capacity, and ancillary services markets should cover the costs of a new generating plant, including a competitive return on investment. Revenues consistently below this level would discourage entry into the market, eventually putting upward pressure on prices. On the other hand, revenues above this level should lead to new entrants and exert downward pressure on prices. The margin between a plant’s market revenues and its variable costs (primarily fuel for fossil units) contributes to the recovery of its fixed costs, including non-variable operating and maintenance expenses and capital costs. This margin can be estimated, given the variable costs of a typical new generating unit, hourly energy-clearing prices in the region, and estimates of capacity and ancillary services revenue. In a competitive market without market failures competitive entry would occur with the most cost effective technology, this suggests that net-revenue does not need to cover fixed costs of existing technologies. In a recent study of the New England electricity markets, Joskow (2003) used a form of net revenue benchmark analysis to demonstrate that the energy markets do not provide sufficient scarcity rents to recover the annualized fixed costs (defined as amortized capital costs plus fixed operating and maintenance costs) of a unit operating only during periods of scarcity. He concludes that, without enhancements, the existing New England energy and reserves markets are unlikely to provide the necessary incentives for investment in new generating capacity to maintain existing reliability levels. 3.2.3 Economic Withholding Stoft (2001, p.371) has argued that the most basic approach to detecting market power is to look for “missed opportunities”: If a generator would profit (in expectation) from the sale of an additional unit of electricity, assuming the market price would not change, and the generator chooses not to sell, it has exercised market power. Thus, according to this view, the focus on assessment of market power in electricity should not be on price but on output, looking for generation capacity that would have been profitable to run at prevailing market prices, but was not.15 The aim of ‘withholding analysis’ is to identify generation capacity that would have been profitable at prevailing market prices but was withheld from sale. As mentioned earlier, there are two types of withholding – economic withholding, where output is reduced because it is bid into the market above competitive prices, and physical withholding,
24

where output is not bid into the market at all. Economic withholding is examined here and physical withholding is discussed in the next section. Economic withholding is measured by estimating an “output gap”, which is defined as the difference between the unit’s capacity that is economic at the prevailing market price and amount that is actually produced by the unit (Patton et.al., 2002). This measure was introduced by Joskow and Kahn (2002) in an analysis of market power in the California electricity market. The simplest definition of the output gap is:
Qiecon – Qi
prod
where Qiecon is the economic level of output for unit i given the market
price and competitive bid for the unit, and Qi
prod is actual production of unit i.
In order to determine, Qi
econ, the economic level of output, a proxy is required for the competitive bid for the unit. As with the bid-cost margin discussion above, this is usually based on estimating the variable costs of the unit (fuel, etc) and/combined with previous bids from presumed competitive periods. Obviously, all the previously mentioned criticisms of these estimates similarly apply. In order to avoid this issue, Joskow and Kahn (2002) only examined those hours where prices were very high, such that it could be presumed that most or all of the production units would have competitive bids below the market price. The actual production, Qi
prod, of a unit also needs to be adjusted in order to take account of transmission constraints, forced outages, and other factors that affect the actual production which are not due to market power conduct. A positive value of an estimate of the output gap implies the existence of economic withholding, to the extent that there is no other explanation for the gap. Where this gap is small (e.g. less than 1% of capacity) it may provide some comfort that economic withholding is not a serious problem. However, as with price-cost margins, the margin of error in estimating a number of inputs to this index leaves open to question the significance of any particular result. What may be more useful is relating the output gap to incentives to exploit market power. Here we examine the variation in the gap and determine if it is related to factors that are theoretically known to influence the ability to exercise market power. For example, Patton et.al., (2002) proposed two empirical hypotheses in their analysis of the output gap:
15 Brennan (2002, 2003) has also argued strongly for a output focused approach to analysing market power in light of the difficulties of estimating and interpreting the price-cost margins.
25
the incentive to withhold should increase during periods of high demand when prices are relatively sensitive to changes in output and thus, ceteris paribus, withholding should increase under high demand;
the incentive to withhold should be greater in a company with a larger generation portfolio and thus, ceteris paribus, withholding will be greater in larger companies.
They found that in New England, the output analysis rejected the hypothesis of the exercise of market power as there were declining levels of the output gap with increasing demand and lower levels of output gap for larger participants. 3.2.4 Physical Withholding With physical withholding, the generator’s resources are not bid into the market (physically withdrawn) by declaring a ‘derating’ of the generating unit, i.e., lowering the unit’s high operating limit (“HOL”). There are generally two categories of generator deratings – generator outages where the HOL is generally reduced to zero, and other deratings where the HOL is set at a positive value below the unit’s maximum capability (Patton et.al., 2002). The derating quantities analyzed usually exclude planned outages and long-term forced outages because they are much less likely to constitute strategic physical withholding and including them could mask true physical withholding. Using deratings data to determine the exercise of market power faces very similar issues to output gap analysis: unit outages and other deratings occur under perfectly competitive conditions as well as noncompetitive condition. The evidence of deratings alone cannot provide evidence for the exercise of market power. However, similar statistical methods to those described in output analysis can be used to evaluate the pattern of deratings that may signal a physical withholding concern. The main problem here is estimating the counterfactual reliability of each unit, which may depend on the intensity of previous use and the care with which it has been maintained. The first question is whether the observed outage rate over some period can be demonstrated to be significantly higher than that expected for this unit (observed over a comparable period in the past) or a similar unit (type, age, maintenance history). There may be disagreements on what the counterfactual reliability is (e.g. because the unit may be claimed to be less worth maintaining than “comparable” units), in which case it may be preferable to look for a systematic relationship between outage and periods when the outage raised company profits. The difficulty of such analysis is illustrated by the debate on the California crisis. Joskow and Kahn (2002) identified evidence of companies withholding output. However, Hogan et.al. (2004) were provided with a data set of a company involved in California. Outage rates of the selected plants increased during the crisis - as suggested by Joskow and Kahn.
26

But Hogan et.al. (2004) suggest that higher utilisation could explain the increased outage rate. If utilisation is assumed to be the main driver for outage rates, then a hazard rate analysis explains the higher outages during the crisis. The effect of sample selection bias, the question about the relationship between utilisation and outage rate, the expected impact of liberalisation to increase availability, and the expected impact that higher demand would induce generators to postpone and accelerate maintenance etc. might still be addressed in further work on this topic - the discussion illustrates the challenge of identifying and proving physical withholding. 3.3 Simulation Models Most of the above indices are constructed as simple ratios or differences using market or structural data. In this section we look at more sophisticated modelling exercises which attempt to simulate some aspects of the market for the purposes of ex-post comparison with actual market outcomes or ex-ante simulations of possible market outcomes given a particular market structure and design. 3.3.1 Competitive Benchmark Analysis The basic idea of competitive benchmark analysis is to develop an estimate of the market price that would result if all companies behaved as price-takers (i.e. if no company attempted to exercise market power) and to compare that price to the observed market price. Compared to the simple application of the Lerner Index to the actual price-setting (marginal) producer (as discussed above with bid-cost margins), this form of analysis does not assume that the marginal producer in reality is the same as the marginal producer under competitive conditions. As with simple bid-cost margin indices, the determination of an appropriate competitive benchmark is not uncontroversial. The most common form of competitive benchmark analysis involves estimating the marginal cost of production of the marginal generator by simulating a hypothetical competitive market. This is done by collecting data on the generation technologies that are present in the market and then estimating a supply curve for each trading period by stacking generators from least expensive to most expensive. Applied to the U.K electricity market by Wolfram (1999), this approach was refined to include detailed production data (Borenstein, Bushnell and Wolak, 1999) as well as environmental costs (Joskow and Kahn 2001) in studies of the California market. Mansur (2001) adapts this approach to the PJM market. FERC’s Standard Market Design Notice of Proposed Rule-making (2002) has recommended that the annual assessment of market performance should include the comparison of actual market results with a simulated
27
benchmark for competitive market, but does not specify how the benchmark should be obtained. As with the use of simple bid-cost margin, the major concern with this type of analysis is the simplifications that are typically required in order to construct the marginal costs estimates. Examples of these simplifications include modeling in a static setting, not incorporating start-up costs or minimum load effects, and condensing the market into a single location with a single price. The danger is that these simplifications may in fact underestimate marginal cost by not correctly incorporating the complexities of the real electricity market (Guthrie and Bidbeck, 2001). Thus in a review of a number of competitive benchmark market simulation models, Harvey and Hogan (2002) conclude:
Drawing inferences regarding competition based on comparisons between actual prices and those simulated in these simple models could produce substantial errors. The difference between the actual and simulated prices could arise from the real-world constraints omitted from the model in conjunction with purely competitive behavior, or the difference could arise from the exercise of market power by sellers that are able to raise prices because of constraints omitted from the model. One simply cannot tell from these simulations. The error is larger than the effect being estimated.
As with bid-cost margin indices, another means of calculating a competitive benchmark which tries to avoid cost data is to base it on some estimate from in-merit bids during prior periods that are deemed competitive (FERC 2002b). The advantage of this approach is that the data needed are easier to obtain in the normal course of business and raise fewer issues of information confidentiality than approaches based on detailed generator production costs. However, reliance on generator bids rather than independent assessment of costs leaves open the relationship between competitive benchmark and the costs of production, raising the issue of whether this approach satisfies the need to assess whether loads are being served at least cost. 3.3.2 Oligopoly Simulation Models Oligopoly simulation models are perhaps one of the most powerful tools in exploring market power by explicitly incorporating into one model many of the structural, behavioural and market design factors that are related to market power, including concentration, demand elasticity, supply curve bidding, forward contracting, and in some cases transmission constraints. Using a game theoretic framework these models can be calibrated with cost data to predict the market prices or Lerner Index of a market with a given structure and design. Probably the most popular model of behaviour is Cournot competition under which companies choose their levels of output knowing that their strategy and the strategies of other companies will affect the market equilibrium. However, it is not clear whether it is the best model of the behaviour of electricity generators, as generally companies can also
28

choose the prices at which they offer electricity. The well known alternative is the Bertrand model of oligopoly in which participants choose prices to sell their output. However, Borenstein et al. (1999) contend that Bertrand competition is inappropriate because it assumes that each company can expand output sufficiently to serve the entire market, which is unlikely to be the case in electricity markets. Indeed, Tirole (2002) has shown that models of Bertrand competition with capacity constraints may have equilibria that are closer to the Cournot outcome. Klemperer and Meyer (1989) provide a solution to a model of oligopoly in which companies choose a “supply function” relating their quantity of output to the market price, which is close approximation of what usually happens in electricity marketplace. However, a drawback of this method is that there may be a wide range of possible equilibria. The cost of such flexibility in modelling market power is the difficulty associated with determining a number of inputs into the model. For example, the level of forward contracting or demand elasticity is often an educated guess and unfortunately the results are often sensitive to these assumptions. However, to the extent that these assumptions remain constant under comparative analysis (e.g. how will the competitiveness of the market change if the number of market participants increase from 2 to 4) the analysis is still valuable. Following the early ‘small-scale’ simulations of Green and Newbery (1992) and Lucas and Taylor (1993), Harbord and von der Fehr (1995) undertook the first large-scale simulation study of the potential for the exercise of market power in a wholesale electricity market for the Industry Commission of Australia. A number of researchers have since taken up this approach, including Borenstein and Bushnell (1999) and Borenstein, Bushnell and Knittel (1999). An interesting recent European example of a market simulation model, especially since it has been developed by a TSO (Eltra) in conjunction with regulatory authorities, is the MARS model of the Nord Pool area. The model accounts for thermal, hydro, nuclear and wind power, and includes transmission constraints. Prices, exchanges, etc. are calculated on an hourly basis. The model has been applied to investigate the market power potential of the dominant producers in the region. In another interesting line of research, some researchers have used detailed data on demand and generator bids and marginal costs to compare actual bid curves to the theoretical benchmark ex-post optimal bids. This work is in some sense an extension of the residual demand analysis of Frank Wolak. In an analysis of the Texas balancing market, Hortacsu and Puller (2003) found, for large companies, a close fit between the actual bid schedule and the ex-post optimal bid schedule. They believe that this is a confirmation that strategic equilibrium models such as the supply function equilibria (SFE) models are accurate descriptors of strategic agents. There are subtleties that need to be addressed carefully if this approach is employed, for most markets (and certainly the
29
Texas balancing market) required market participants to submit step-function bids, not smooth curves. The resulting residual demand schedule is therefore typically also a step function, and its associated marginal revenue will coincide with the flat steps but be discontinuous at the steps. This problem can be handled once it is accepted that market participants bid in expectation of the realised residual demand schedule, but the econometrics are considerably more demanding, as Wolak (2003) shows. Transmission constraints can isolate markets and enhance market power. Several models of strategic interaction on networks have been developed (see reviews by Daxhalet and Smeers, 2001; Day et al., 2002; Ventosa et al., 2004). Most models of generator competition take a general approach of defining a market equilibrium as a set of prices, generation amounts, transmission flows, and consumption that satisfy each market participant's first-order conditions for maximizing their net benefits while clearing the market. If a market solution exists that satisfies this set of conditions, it will have the property that no participant will want to alter their decisions unilaterally (as in a Nash equilibrium). Although it is recognized that no modelling approach can precisely predict prices in oligopolistic markets, there appears to be agreement that equilibrium models are valuable for gaining insights on modes of behaviour and relative differences in efficiency, prices, and other outcomes of different market structures and designs (Smeers, 1997). Equilibrium market models differ in many ways, including the market mechanisms modelled, the type of game assumed, fidelity to the physics of power transmission, and computational methods. Regarding market clearing mechanisms, most studies of generation markets implicitly or explicitly assume a single buyer or “pool”-type centralized bidding process supervised by an Independent System Operator (ISO) (e.g., Cardell et al., 1997). This process results in a set of publicly disclosed market clearing prices. Other studies model bilateral trading with or without the presence of traders/arbitrageurs (Metzler et al., 2003; Wei and Smeers, 1999). Some studies assume that that transmission services and energy markets are cleared simultaneously or are well arbitraged, while others assume a sequential process. The practical differences between these formulations are assessed in Neuhoff e.a. (2004).
3.4. Transmission Related Issues Transmission constraints can allow for the exercise of market power along at least four categories. First, most European markets allow market participants to trade within the country as if the network were permanently unconstrained. In such designs the TSO has to redispatch generation capacity in order to resolve transmission constraints. The original English electricity Pool offered a single price and firm transmission rights, so that plant that could not be dispatched because of constraints would be paid its theoretical lost profit (Pool Purchase Price less its own bid) to not generate. A generator assured that he is not required and facing little local competition might then submit very low decrement bids to maximize income. It may then pay to locate in an export-constrained zone to enjoy these
30

profits, even though this is exactly the wrong place to locate. The counterpart is that generation in import-constrained zones can bid high (and be paid its bid price if constrained to run out of the unconstrained merit order) and will therefore be more strongly motivated to locate in such zones by the presence of market power. This was identified as an issue by the regulator as early as 1992, and discussed in Offer’s Report on Constrained-on Plant (Offer, 1992). This drew a distinction between acceptable and unacceptable bidding. National Power set the bids of some plants inside import constraints so as to recover their costs and a reasonable profit over the course of a year, even reducing one plant’s bids once it appeared to be on course to over-recover. PowerGen, in contrast, submitted extremely high bids for two small stations shortly to be closed, which were constrained on while NGC carried out work to accommodate the closures, and was criticized for this. NGC was encouraged to sign long-term contracts with plants inside import constraints, since this reduced risks for both the generator and the transmission operator. Two years later, NGC was exposed to a share of the cost of constraints, giving the company a financial incentive to minimize them. Obviously generators can not only amplify the impact of existing constraints, but can also create constraints with their bids and require redispatch where a competitive system would be unconstrained. Second, if transmission constraints are explicitly addressed in the market design, either using nodal or zonal pricing or using physical transmission contracts, then bids that create constraints change the price received by all local generators. This can make an import constraint even more profitable for the generators affected by it, since all of their output, rather than just the (perhaps relatively small) amount needed to relieve the constraint, gets a high price. In contrast, it is no longer profitable to create export constraints, as they reduce local spot prices and therefore revenue, rather than increasing revenue in redispatch. Borenstein, Bushnell and Stoft (2000) show for explicit treatment of transmission constraints that it can be profitable for generators to withhold output in order to constrain a transmission line into the location of the generator that would not have been constrained under perfect competition. Borenstein et al. (1996) cite empirical evidence from Northern California to this effect. Oren (1997) presents an alternative scenario with the transmission constraint located between two strategic generators in a three-node network. Stoft (1998) solves the corresponding Cournot game and Joskow and Tirole (2000) give the following interpretation: the transmission configuration can turn the output of generators at two different nodes into ‘local complements’, thereby increasing the incentive for a generator to withhold output, as this constrains the output of the other generator and increases price levels. Cardell, Hitt and Hogan (1997) show that, if strategic generators own generation assets at node A and B of a three-node network, they might increase output at node A relative to a competitive scenario if this reduces the total energy delivered to node B due to loop flows and therefore increases prices at node B.
31
Third, transmission contracts, both physical and financial, can enhance the market power of generators and provide financial incentives to change output decisions of generators even as transmission constraints are and remain constrained. This was first addressed by Hogan (1997). Joskow and Tirole (2000) show that physical and financial transmission rights have almost identical properties. However, in real networks, a complete set of physical transmission contracts is too complex, so designs were developed to aggregate and simplify property rights for each individual link. Joskow and Tirole discuss different approaches and point out the need for rights to be obligations to transmit rather than just options to use the network, to ensure an efficient use of meshed networks. More to the point, if generators hold contracts equal to their planned output, they will have no incentive to misrepresent their bids. In a network with transmission constraints this requires that generators hold transmission contracts to complement energy contracts with counter parties at other locations. Joskow and Tirole (2000) assess how such transmission contracts can impact the exercise of market power and Gilbert et al. (2004) show how auction design and restrictions on ownership can reduce the exercise of market power by strategic generators. Since generators may choose to contract for hedging reasons, the problem may not be too serious, provided shortages (that greatly amplify market power) are not readily predicted. Where there are predicted and potentially lengthy shortages (e.g. a systematic shortfall in capacity that will require new build that cannot come on stream for some considerable time) then market power may spread to the contract market. Price caps on contracts are typically far less distorting than on spot markets, and a requirement to offer such capped contracts defensible. Fourth, particular opportunities to exploit market power might arise in settings with physical transmission contracts, as for example between Germany and the Netherlands. Market participants might, for example, participate in the transmission auction but subsequently not use their transmission contracts. In principle such behaviour is supposed to be avoided by ‘use-it-or-lose-it’ provisions. In practice it turns out to be difficult to re-use contracts on short time frames and therefore generators in the importing region might benefit from reduced use of import capacity. Monitoring the level of unused contracts might reduce inappropriate behaviour. Joint auctions for physical transmission contracts provided by TSOs, rather than designs that integrate energy and transmission markets, could create a further opportunity for the abuse of market power. The allocation of scarce transmission capacity of individual bottlenecks to transmission contracts between different countries is based on the bids for transmission contracts. By increasing the bids for transmission contracts between countries A and B a market participant could in such a design reduce the volume of transmission contracts available for transmission between countries A and C. This might serve the purpose of increasing prices in country C. Only in the last case is the use of transmission contracts instrumental to the exercise of market power. In the remaining cases transmission contracts provide incentives, and therefore a motive for the exercise of market power. Therefore information on
32
transmission contracts or constraints can be a preliminary guide to situations where economic or physical withholding might be expected. Given that transmission contracts influence the incentives to exercise market power there is some discussion on restricting ownership of transmission contracts. If such rules are implemented, then they need to be monitored and in this case explicit information on ownership of transmission contracts needs to be collected 3.5 Summary The traditional approach to measuring market competitiveness is based on the concentration indices, the most important being market share and HHI. There is some theoretical justification for using these measures as an indicator of potential market power and they have the further advantage of being easy to understand. Nevertheless, as has often been pointed out, they ignore many factors that contribute to the potential exercise of market power. In particular, demand conditions, strategic incentives (such as from forward contracting) and market contestability are ignored. The static nature of these measures may also not be appropriate for dynamic markets such as electricity where demand and supply conditions can change rapidly. In practice, when calculating these indices there are also difficulties with regard to appropriately defining the product and geographic markets. In particular, transmission constraints should be an important factor in such calculations but have often been ignored or crudely approximated. Empirically, there is surprisingly little evidence supporting the usefulness of market share and HHI in predicting market power in electricity markets. The California experience, where market designers relied heavily upon low market share and HHI indices to allay fears of market power, clearly demonstrates the potentially misleading nature of these metrics. Accordingly, it is unlikely that these indices will be the primary tool of market power analysis but they will most likely still serve a role in the potential screening of market power in long term ex-ante studies of market design or merger proposals. Perhaps the most important point to make is that the normal EU screens for Significant Market Power used in other markets are likely to greatly underestimate the potential market power in electricity markets. It is perhaps not surprising that the market monitor and academics most closely involved with the California crisis have been interested in developing alternative structural indices to try to address at least some of the weaknesses of the classical concentration indices. The Pivotal Supplier Index (PSI) introduces demand-side conditions by addressing the extent to which a generator’s capacity is necessary to supply the market after taking into account other generators’ capacity. The index can be applied on an hour by hour basis, thus providing a dynamic image of the market structure and the potential to exercise market power. When aggregated across a period of time, the PSI essentially detects the frequency of monopoly power. The closely related Residual Supply Index tries to extract
33

more information by classifying the results as a continuous variable rather than a dichotomous variable. Unfortunately, the measurement difficulties associated with defining the product and geographic market still remain. These indices have only recently been introduced as a tool for market power analysis, but the initial empirical results in the US are encouraging and have found significant correlation between the RSI and measures of the actual exercise of market power. From originally being applied to the California markets, the PSI and RSI have now been calculated for Eastern US electricity markets and we expect these tools to become a standard technique in market power analysis. A more sophisticated approach to market power detection is the Residual Demand Analysis developed by Frank Wolak. Like the PSI and RSI, both the demand and supply side of the market are accounted for, but with the added dimension of explicitly including the price elasticities of supply and demand. Obviously the disadvantage of incorporating such information into the market power analysis is the added burden of requiring data on generator bids. At present, it is difficult to evaluate whether this methodology is likely to become a more frequently employed tool of market power analysis, although it is undoubtably one of the most powerful and convincing methods currently available While the structural indices examine the potential for market power, we also examined indices and methods that look for evidence of the actual exercise of market power. The most standard are the price-cost margin and the closely related Lerner index. Indeed, Borenstein et al. (1999) have described the Lerner Index as the “fundamental measure of the exercise of market power”. The most immediate advantage of such indices is that complex product and geographic market definitions are unnecessary. The most significant practical obstacle to broader application of the Lerner Index is determining the company's marginal cost of production at any given point in time. Without a measurement or reasonable estimate of marginal cost, the ratio is incalculable. Here the main practical question is the time period over which to measure the marginal cost. If plant can never sell at more than short-run marginal cost, it will fail to recover its fixed costs and the market will not be sustainable. Nor does a high value of the short-run Lerner Index indicate that the market is not competitive if capacity is scarce. While the short-run Lerner Index can provide some insights into the transitory exercise of market power, it needs to be associated with an estimate based on the long-run marginal cost of generation before any finding of abusive behaviour can be demonstrated. Moreover, exogenous economic factors, such as shifts in consumer demand or the cost of inputs, can result in dramatic and misleading changes to the index that are unrelated to market power. Nonetheless, despite these criticisms, the Lerner index continues to be a prominent measure of market power as both an index to be calculated from actual market data as well as a measure of market power in market simulation models. There is no reason to believe that this will change.
34

The issue of marginal cost estimation is also central to Net Revenue Benchmark analysis. This tool is not solely used as a method of detecting market power but is still of interest. As well as involving all the difficulties associated with estimating marginal cost, there are difficulties to interpreting the results of such net revenue benchmark analysis. Competitive companies and markets go through natural swings of profitability and unprofitability that are not necessarily related to any exercise of market power. Given the amount of effort required to conduct such analysis, along with the ambiguity of results, it is perhaps not surprising that we could not find many examples of net revenue benchmark studies. Withholding Analysis shifts attention away from prices and towards output – or more specifically, the withholding of output. The idea is to determine if output, which could have been sold profitably at the competitive price, was nevertheless withheld from the market. The so-called ‘output gap’ can be examined on its own or regressed against factors which are believed to be related to incentives for exercising market power. In general it would be necessary to have an estimate of the marginal cost of production in order to determine whether production is economic or not. It may be possible to avoid this issue for high-demand high- periods where prices are clearly above avoidable costs. At present, like a number of other techniques already mentioned, the few applications of output-gap analysis are only very recent and there is still much debate over the robustness of this methodology. However, we do see the potential for this tool to become a standard technique of market power analysis. Competitive Benchmark Analysis is a more refined form of price-cost margin analysis that involves simulating the competitive market price by constructing a competitive market supply curve. The output metric of such analysis is typically a Lerner index that compares the actual market price to the simulated competitive price. This form of analysis has only been developed over the last five years and is becoming increasingly more sophisticated in terms of accounting for constraints and other factors that affect the real market price outcome. The analysis is typically applied to long-term time-series (e.g. several years of monthly or daily data) for the purpose of market assessment reports or studies. However, there is nothing to prevent the real-time adoption of such models for daily market monitoring. The methodology only applies to the market as a whole and cannot be used as a means of specifically identifying which company is exercising market power. Once the presence of market power is established, further investigative tools are required to determine the source of market power. The chief controversy associated with this tool comes, again, from the difficulties involved in defining and estimating the marginal costs. The debate still continues as to the reliability of competitive benchmark analysis in light of such potential estimation errors. However, given the difficulties associated with other ex-post market power assessment tools, competitive benchmark analysis is likely to remain as an important monitored metric, especially for longer term analysis.
35

The most sophisticated forms of market power analysis are the Oligopoly Simulation Models. These models have been developed over the last decade and have been applied to many electricity markets throughout the world. Their main application has been in ex-ante analysis of prospective market designs and (de)merger analysis. Their flexibility in accounting for a number of factors known to influence market power, including demand elasticity, forward contracting and transmission constraints, are their chief attractive feature. However, the large number of assumptions necessary to build these models means that the results of such analysis, while certainly interesting and indicative of certain market power conclusions, are almost always open to dispute. Nevertheless, we see these models, which are becoming increasingly more sophisticated, as continuing to be employed in long term ex-ante market power analysis. Recent results, such as Hortascu and Puller (2003) and Wolak (2003), indicate that simulated bidding behaviour can provide useful insights into actual market behavior. While most electricity systems exhibit transmission constraints, so far only few empirical assessments take explicit account of the impacts of transmission constraints in the system. Transmission constraints increase the incentives and opportunities to exercise market power along various pathways. First, the UK experience showed that even where the energy market design ignores transmission constraints and allows generation companies to trade as if there were no constraints, the generation companies can deliberately distort their bids to exploit potential constraints. Generation companies can then profit by their bids and offers to the system operator who needs to resolve these transmission constraints to achieve a feasible dispatch schedule. Second, when the market design within or between areas explicitly addresses transmission constraints then market participants can no longer ‘abuse’ export constraints, but can increase or even create import constraints. Third, ownership of transmission contracts influences the revenue streams of generation companies, and can therefore provide incentives to mitigate or enhance market power. Fourth, in systems with physical transmission contracts, market participants can exercise market power to change flow patterns and therefore influence equilibrium prices in different regions, typically by withholding transmission rights. ‘Use it or lose it’ provisions address such behaviour, but require monitoring. If the allocation of transmission capacity between various regions is based on a joint auction, then physical transmission contracts allow market participants to distort their bids in order to distort the flow pattern. The long list of incentives and opportunities to exercise market power in networks suggests that market monitoring cannot ignore this aspect of market power. The TSOs are crucial in providing information on flow patterns and location-specific demand and generation. However, as TSOs have discretion in their decisions, it is impossible to deduce from the flow patterns whether TSOs detected that a flow-gate/corridor is transmission constrained. It is therefore also important to record which transmission lines were announced to be constrained, how much capacity was made available in short-term markets and which transmission lines were actually constrained during the dispatch. The
36

objective is to replicate the information set available to strategic players at different decision points and to capture their actions. Data on the ownership and the price paid for transmission contracts is required to assess the impact on the incentive to exercise market power and to verify whether distorted bids resulted in distorted flow patterns. A second motivation to collect information on the allocation of transmission capacity by the TSO relates to the understanding of the TSO behaviour. Currently the only criteria available to evaluate TSOs behaviour is whether the system was operating uninterrupted. However, efforts of TSOs to use the transmission network effectively are not monitored or evaluated. If flow patterns and system conditions are recorded, then the performance of TSOs, the set of dispatch rules and the market design can be better evaluated. The relative strengths and weakness of the various market power detection techniques are summarized in Table 3. The main conclusion of this chapter is that the range of market power detection tools has expanded over the last 5-10 years, and although there is no definitive method for each of the four main categories of market power detection previously outlined in table 1, the more recent tools are better able to capture relevant factors and dynamic considerations that are not present in traditional tools such as concentration ratios or the Lerner index. However, with these advances come associated theoretical or data estimation issues that can blur the reliability of the results. As such, the pragmatic approach to market power detection is to gather together a number of metrics with the hope of constructing a consistent story of the competitiveness of the companies or market as a whole. Such a pragmatic approach is evident in the next section where we examine the range of data and indices tracked by market monitoring units.
37

Table 3 - Summary of Market Power Detection Methods Category Strengths Weaknesses Popularity
Structural Indices and Analysis
Market Share and HHI
Ex-ante Easy to understand. Theoretical justification under
certain assumptions. Simplest versions only require
sales or capacity data.
Little empirical justification. Ignores demand side,
strategic incentives and often congestion issues.
Does not fit well to dynamic market conditions.
Difficulties in determining appropriate geographic region.
Standard tool for many decades.
Increasingly recognized as a limited metric.
Pivotal Supplier Indicator and Residual Supply Index
Ex-ante Ex-post
Takes into account demand side conditions.
Can track dynamically changing markets.
Applicable at local market level as well as system level.
Some empirical support.
Difficulties in determining appropriate geographic region.
Ignores potential of correlated behaviour (e.g. Cournot or collusive behaviour).
Ignores elasticities and market contestability (entry/exit) factors.
Recent tool (c2000) but increasingly being applied.
Residual Demand Analysis
Ex-post Takes into account elasticities of supply and demand.
Theoretical justification – link to Lerner Index.
Requires bid data. So far limited empirical
work.
Recent tool (c2000). Uncertain as to future popularity.
Behavioural Indices and Analysis
Bid-Cost Margins (Lerner Index)
Ex-ante Ex-post
Easy to understand Does not require a geographic
market definition. Useful metric for ex-ante
theoretical models as well as ex-post empirical analysis.
Difficulties in determining costs or appropriate competitive ‘reference’ levels.
Margins affected by factors other than market power -interpretation difficulties.
Standard tool. Confidence should
grow as cost estimation techniques continue to improve.
Net Revenue Benchmark Analysis
Ex-post Considers long run considerations such as investment incentives and entry/exit issues.
Difficulties in determining costs.
Results are difficult to interpret in light of other factors affecting profits.
Relatively recent tool but may grow in popularity.
Withholding Analysis (Output gap analysis)
Ex-post Focuses directly on most basic MP strategy – withholding
Under certain assumptions can avoid cost estimation.
Correlation analysis can trigger further analysis without preliminary auditing of outages.
Accounting for all ‘small’ details of production decision (e.g. ramp rates etc) is difficult.
Actual auditing of deratings/outages is difficult.
Initial empirical results still controversial.
Recent tool (c2002) and still controversial, but its important complementary role to price analysis will ensure continued development.
Simulation Models
Competitive Benchmark Analysis
Ex-post Takes account of entire market in a refined version of price-cost margin analysis.
Can provide quantitative estimate of efficiency and welfare loss from market power.
Difficulties in determining costs or appropriate competitive ‘reference’ levels.
Cannot identify individual generators exercising market power.
Introduced in 1999 and has lead to numerous studies since.
Still controversial given the many estimation issues.
Oligopoly Models Ex-ante Integrates many market power factors into one framework (e.g. demand, contracting incentives, transmission constraints).
Large number of assumptions negates certitude of quantitative conclusions.
Introduced in early 1990s and applied widely since.
Still controversial.
Transmission Monitoring
Ex-ante Ex-post
Transmission constraints are an important issue in market power monitoring and are often ignored.
Analysis usually requires data on bidding, output, transmission rights ownership and constraints.
Given the interaction with market design and network structure, case specific analysis is very often required.
An important aspect of many analyses of market power, but will continue to be constrained by the difficulties of carrying out analysis.
38

4. Market Monitoring and Analysis in Practice 4.1 Approaches to Market Monitoring Units As we might expect, different countries have taken different approaches to the issue of how to monitor their electricity markets. Practically every country which has liberalised its electricity industry has an economic regulator for the industry. The economic regulator often has some overall responsibility for the state of the electricity wholesale market, but does not necessarily carry out the detailed monitoring itself. In many cases, the body set up to run an electricity market was required to set up a market monitoring unit when it was established. Typically, these units are located within the market operator and have access to its data, but are given some functional independence to ensure that they cannot be captured by the operator. This might just imply direct reporting lines to the operator’s board, but many monitoring units are headed, or at least supervised, by independent expert committees. It is hardly surprising that it is easiest to obtain information on market monitoring where a formal unit has been established in this way. We provide more information on the market monitoring units of four US markets, Ontario, Australia, Singapore and Nord Pool in the appendix to this paper. The main reason for concentrating on market monitors from outside the EU is that such countries have, in general, developed market monitoring further than most European countries. In this section, we summarise the main themes that emerge from the detailed studies. Many other markets, however, do not have a formal market monitor of this kind. Does this mean that they are not monitored? In England and Wales, the electricity regulator was responsible for competition in the wholesale market, and had a number of powers to enforce this. A small team in the Office of Electricity Regulation was tasked with monitoring events in the Electricity Pool. The team received price information and attended the meetings of the Pool Executive Committee and other groups, but did not have the resources for detailed analysis of factors behind price movements. The team largely relied upon industry participants to alert it to problems beyond the most obvious ones. There were many large buyers with the ability and incentive to spot trouble when it occurred, and the National Grid Company, which operated the market, also provided information. To some extent, this was because the company’s regulatory licence required it to give the regulator any information he required. NGC was happy to cooperate at a “working level” on a day-to-day basis, presumably to promote a good relationship with its regulator, although it is worth stressing that the staff involved in monitoring the wholesale market were separate from those involved in regulating transmission prices. When the regulator wanted to carry out a more detailed investigation of market behaviour, this was often with the help of outside consultants.
39

If a transmission operator does not have to give market monitoring information to its regulator under a legal duty, it may still have a financial incentive to act against market power. While a “pure” independent system operator has few financial resources, and can only pass the costs of running the system through to buyers, a transmission owner may be exposed to some of these costs. From 1994 onwards, the National Grid Company in England and Wales was given an incentive scheme to reduce “Uplift”, the part of the Pool price that covered the cost of keeping the system stable, including the cost of resolving transmission constraints. The company therefore had a financial incentive to act against market power that might raise this cost. Other transmission companies may not face an explicit incentive scheme, but could find that they cannot pass cost increases straight on to consumers, perhaps for reasons of regulatory lag. In these circumstances, they also have an incentive to cooperate with regulators to combat market power that could increase system costs. However it is organised, what makes a market monitor effective? Wolak (2004) suggests some desirable features: A forward-looking process can seek out small flaws in the market design or market
structure before they have time to become significant market failures. It is extremely hard to undo the wealth transfers caused by high prices after the event, and much better to prevent them from occurring in the first place.
Support from the regulator is important if the unit is to be more than a commentator on market events, and to obtain a response to the issues that it identifies as important.
A consistent approach will help to ensure that the market monitor’s actions are understood by all market participants, and that they do not act in undesirable ways because they did not understand the likely consequences
A transparent approach, releasing data on a timely basis (whether submitted to or produced by the market monitor) will help to promote confidence in the efficient operation of the market, and can aid the market monitoring process as well. Allowing outsiders to perform their own analyses may aid the detection of market power.
Independence of the market monitor is the best way of avoiding the risk that its analysis would be distorted to favour one stakeholder over another.
While the details vary from market to market, the three key activities of a market monitoring unit are to: Analyse the market on a continuous basis to identify potential problems that need
more study, and to screen for undesirable behaviour. In some markets, this can lead to automatic real-time mitigation.
Investigate any problems identified by its own screening, or by complaints from other stakeholders
40

Report on the results of its analysis and investigations on a regular basis 4.2 Data and Indices Tracked by Market Monitoring Divisions There is no universally accepted set of market monitoring statistics and indices. In practice there is a large set of data and indices that are monitored on varying time scales. The appendix gives detailed information on the practices of a number of formal market monitoring units, while in this section we identify the common themes. No single set of metrics can cover all possibilities within a category, and there are grey areas between defined categories. Nevertheless the following groupings serve as a useful guide: Market Prices, Demand and System Conditions Market Structure Indices Supplier Indices and Analysis Market Performance Indices and Analysis
4.2.1 Market Prices and System Conditions The level of market prices is perhaps the most obvious thing there is to monitor! However, a moderate market price can be a sign of market abuse if it comes at a time when demand is low. This means that prices must be related to system conditions; most importantly, the level of demand, but also the level of available capacity, and indicators of transmission congestion. Although not all these measurements are directly tied to a particular index of market power, they can sometimes indicate irregularities in the market that may be symptomatic of market power problems. Furthermore, such data may also facilitate the development of other standard metrics of market power. These statistics are typically reported on a monthly, seasonal, and an annual basis, but should be collected for every period in which the market is operating. We can differentiate between the raw data collected by the market monitor, and the statistics that are subsequently derived from them. The raw data can include: Prices
Energy prices in the real-time market, day-ahead market, and forward or futures markets (which may depend on price reporters in an over-the-counter market where there is no formal exchange).
Energy prices in adjacent markets (which should move together with prices in this market, unless congested transmission separates the markets).
Prices for ancillary services, such as reserve
41

Prices in the capacity market(s), if they exist Fuel prices determine the costs of most generators, and so it should be
useful to record spot and forward prices for the fuels used in the market, typically natural gas, coal and oil.
The identity of the price-setting unit(s), in markets where identifiable units set prices; otherwise, of the price-setting company or companies
Demand Conditions
Forecasted system demand will be a key driver of the price in day-ahead markets
Actual system total demand will affect the real-time markets, particularly when it differs significantly from the forecast
Capacity Availability
The total generating capacity owned by each generator will show whether the market is generally well-supplied relative to demand
Actual declared availability at each point in time shows whether the market is well-supplied, relative to demand, at that time
The number and size of generating unit planned, unplanned and forced outages may explain why available capacity is less than total capacity
Transmission Congestion
The number and size of transmission planned, unplanned and forced outages can affect the number of constraints on the system
Transmission constraints on the system, with the nature of each constraint (thermal, voltage, stability), and the limiting element in the grid; information on which transmission lines were announced to be constrained and which transmission lines were actually constrained during the dispatch.
Counter-trades (where these are used to resolve congestion), including the identity of the constrained plants, the MW constrained on and off, and the payments made
Total MW constrained on and off (in a counter-trading system) Total constrained on and off payments Information on transmission contracts
Given that this raw data is available, there are some statistics that can usefully be derived and monitored for signs of any problems in the market: Price Trends
Moving averages or other trend analysis of prices can reveal patterns which might be hidden by day-to-day volatility.
42

Frequency of price hitting market price cap, when a cap exists, is an indicator of how prices might change if the cap were adjusted or removed
Frequency of other bid mitigation if some is permitted Volatility measures (variance, min-max prices)
Price Comparisons
Comparing the real-time price with the day-ahead price or forecasted price can show whether the earlier markets are an efficient predictor of real-time events, and highlight unexpected deviations.
Comparing the market price with the prices in adjacent markets can show whether efficient arbitrage is taking place, although this depends upon the availability of transmission capacity
Comparing the price for energy and for ancillary services can show whether the prices reflect the relevant opportunity costs of offering the services
Comparing the market price with the system load can show whether high prices are due to high demand levels
Comparing the market price with fuel costs can show whether changes in final prices reflect changes in input prices, and vice versa
Price Setting Analysis
Is the frequency with which particular units (or companies) set the market price correlated with whether they are a net buyer or net seller in that market, with the level of demand, the time of day, or some other market characteristic?
Are there any correlations with the level of the market price they set? A net seller will generally want higher prices, and a net buyer will want lower prices, for example.
Demand and Capacity Comparisons
Capacity margin – the ratio of maximum generation capacity (ignoring outages) to demand is an indicator of the general tightness of the market, and likely to be related to the level of prices
Supply cushion – the ratio of the difference between total offered volume and system demand to total offered volume measures the tightness of the market at a particular time.
Congestion Analysis
Is it possible to identify units which have caused constraints by their bidding?
Does the price-setting algorithm ever set nodal prices above the highest bid taken?
43

Is there are correlation between changes in a unit’s bid price and the frequency with which it is constrained on or off
4.2.2 Market Structure Indices A second set of indicators relate to the market structure, underlying features of the market that will, in most cases, change only gradually. This means that some of the data need only be collected periodically, rather than on a continuous basis. The raw data in this area consist of information on generator market shares and on the price responsiveness of demand. That information can then be analysed to give the pivotal supplier index and residual supply index described in section 3: Market Shares
Market shares for each company can be collected, and concentration indices can be calculated. These can be based on shares of capacity, or of output. In some contexts, market shares within a particular sub-set of units can be of particular interest, which could include a subdivision on the basis of :
Fuel type Price setting units Location (i.e., units within a given load pocket.)
When output shares are used, these can be collected at various frequencies, ranging from hourly to annual; monthly and daily shares are also sometimes reported
Hirschman-Herfindahl Indices
The market share data can also be used to calculate HHI figures, on exactly the same bases as the concentration ratios.
Demand Responsiveness
The responsiveness of demand to changes in price affects generators’ ability to exploit a large share of the supply side of the market and drive up its price. It can be measured by: MW of demand response capabilities in energy and ancillary service
markets Load weighted % of demand bids that are price responsive % of load with real-time metering capability Price elasticity of demand Changes in those demand response capabilities (spread of technology)
Pivotal Supply Analysis
44

This can be performed in each of the hourly, day-ahead and ancillary services markets
Residual Supply Indices
Similarly, these can be calculated for each market, including hourly, day-ahead and ancillary services.
Having calculated these indices, the market monitor can seek to establish the relationship between the market price and these measures of market competitiveness. If it is possible to establish the levels at which market performance will be broadly acceptable, then these levels can be used as a screen for analyzing merger proposals as described in section 3. 4.2.3 Supplier Indices and Analysis
The focus of supplier analysis is on the behaviour of individual suppliers who might have market power. In this area, the raw data consist of bid and outage information. The first transformation may be to produce reference bids16, which indicate how each unit behaves in normal conditions. These will not identify a sustained abuse of market power, but a change in conduct in response to a short-term change in circumstances will be spotted. Further analysis can then focus on identifying the circumstances that might make such a change in behaviour profitable, and checking whether the generator’s behaviour does indeed change in response. Similar analyses can relate unit outages to market conditions.
Market bids
The full set of bids to each organized market must be available to the market monitor, including prices, availability, and any technical constraints (such as ramp rates) that are taken into account when setting prices.
Outages
Data should be held on the number and duration of Deratings, including the number of MW by which the unit’s capacity is
reduced
Scheduled and forced outages
Reference Bids These should be constructed for each market into which a unit normally bids (e.g. day-ahead markets, real-time markets, and reserve markets), and can be estimated in various ways: The mean or the median of the unit’s bids over the previous X (e.g. 90)
days for similar hours or load levels, adjusted for changes in fuel prices
16 The term ‘bid’ in this report is generally used in a broad sense and can refer to both buying and selling. More narrowly, a ‘bid’ refers to a buying submission and ‘offer’ to selling submission.
45

The mean of the nodal price at the unit’s location during the lowest-priced X (e.g. 25) percent of hours that the unit was dispatched over the previous X (e.g. 90) days, adjusted for changes in fuel prices;
The mean of the bids supplied by all units of similar types. The unit’s estimated marginal cost.
Bid variation
Changes in the unit’s bids, which may be related to the abuse of market power, can be identified by: Deviation of bids from reference price levels. Deviation of bids from longer or shorter-term moving averages of prior
bids. Frequency of re-bidding from standing orders (i.e. bids which were
automatically submitted every time unless over-ridden).
Analysis of bidding
This can include: Correlation between bids and the level of demand
Correlation between unit schedules or bids and the existence or magnitude of congestion.
Correlation between unit schedules or bids and the market price. Comparing bid patterns between participants.
Output analysis
The load factor, or capacity ratio, of a generation unit is equal to its actual output divided by its maximum generation capacity multiplied by the length of the time period being considered. A falling load factor can be a sign of withholding, although it can also be a competitive response to market conditions.
Analysis of Outages
This can include: Correlation between outages and the market price. Comparison of outage frequencies with similar generators. Output gap analysis – the ratio of actual hourly output to economically
available capacity. Correlation between generator forced outages and the nodal price or
congestion. Correlation between transmission facility forced outages and the nodal
price or congestion. In some markets in North America, price bids are automatically screened, and the impact of each bid on the market price is calculated. Where this is found to be unacceptable, the bid may be automatically mitigated to the level of a reference price.
46

4.2.4 Market Performance There are some indicators of market performance that are easily collected. Others require complicated calculations. Liquidity Measures
The number of suppliers in short term and long term markets, and in particular the number of traders who do not have physical positions in the market, can indicate the level of confidence held in the market, and affects how easily a market participant can find a counter-party for a trade.
The volume of trade in a market, relative to the underlying physical demand, is another useful measure of liquidity
Spot Market Exposure
Research on forward markets, and the experience in California, teaches us that undue reliance on electricity spot markets is likely to lead to bad results. We can measure this by monitoring:
The percent of load that is bought in under long term forward contracts. The percent of load that is supplied by insufficiently unbundled companies
with no use of market mechanisms
Competitive Price Benchmark Analysis Using a suitable model, it is possible to compute a competitive price benchmark. This can then be used to obtain a derived Lerner Index.
The absolute level of this index can be an indicator of problems Comparisons can be made over time, and with other markets
Net Revenue Analysis
This analysis is used to compare revenues with estimates of costs on a medium-term basis, typically taking a year at a time. Comparisons can be made between revenues and:
Entry costs (the full annualized costs of a new plant)
Exit costs (the costs that could be avoided if a plant was to shut down for a year)
The cost of transmission alternatives to generation.
These comparisons can be made for plant operating at a range of load factors, such as base load, intermediate and peaking plants.
Table 4 summarizes the market monitoring indices used in practice.
47

Table 4 - Summary of Market Monitoring Indices used in Practice17
Category Frequency Implementation Data Required Market Prices and System Conditions
Price Trends Close-to-real time, ex-post
Hourly, daily, monthly Straightforward Spot, forward & fuel
prices
Price Comparisons Close-to-real time, ex-post
Hourly, daily, monthly Straightforward Spot, forward & fuel
prices
Price Setting Analysis Ex-post Daily, monthly Straightforward Spot, forward & fuel prices
Demand and Capacity Comparisons Ex-post Daily, monthly Straightforward
Demand data, generation capacity and generation offered
Congestion Analysis Ex-post Daily, monthly Considerable effort required
Transmission constraints data, Nodal prices or constrained on/off payments
Market Structure
Market Share Usually ex-ante Daily, monthly, annually
Straightforward but requires defining appropriate zone
Generator capacity or sales. Possibly transmission constraint data
HHI Usually ex-ante Daily, monthly, annually
Straightforward but requires defining appropriate zone
Generator capacity or sales. Possibly transmission constraint data
Demand Responsiveness Close to real time, ex- post Monthly, annually Straightforward Demand data
Pivotal Supplier Analysis Ex ante, close to real time, ex-post Hourly, daily
Straightforward but requires defining appropriate zone
Demand data and generator capacity. Possibly transmission constraint data
Residual Supply Index Ex ante, close to real time, ex-post Hourly, daily
Straightforward but requires defining appropriate zone
Demand data and generator capacity. Possibly transmission constraint data
Supplier Indices
Lerner Index Exa-ante, close-to-real time, ex-post Daily, monthly
Moderate effort in using cost data and congestion data.
Bid data. Possibly Marginal Cost data.
Bid Correlation Analysis Close-to-real time, ex-post Daily, monthly
Moderate effort if using cost data and congestion data
Bid data. Possibly demand & congestion data
Load Factor Analysis Close-to-real time, ex-post Daily, monthly Straightforward Output and capacity
data
Outage Analysis Ex-post Monthly, annually Moderate effort required Outage data. Possibly demand, cost & price data.
Market Performance
Liquidity Measures Close-to-real time, ex post Daily, monthly Straightforward Bid prices and volumes
Spot Market Exposure Close-to-real time, ex post Daily, monthly Straightforward Bid prices and volumes
Competitive Benchmark Analysis Ex-post Monthly, annually Considerable effort in
model development Marginal costs, market prices
Net Revenue Analysis Ex post Annually Considerable effort in model development
Capital and operating costs, technological data
Simulation Models Ex-ante Periodic studies Considerable effort in model development
Cost data, demand elasticities, transmission constraints
17 Inspired by a similarly framed table in NE-ISO (2002)
48

4.3 Powers of Market Monitoring Divisions The title “market monitoring division” implies the role of an observer, rather than of an enforcer. Many market monitors are established within commercial organizations, rather than within governments, and it would be inappropriate to give them any kind of judicial powers over other market participants. This means that when the monitor believes that a company has behaved in an inappropriate way, the monitor will generally need to report the behaviour to a regulator or to the competition authorities, rather than taking action itself. There are exceptions to this. Some US markets involve automatic bid mitigation in particular circumstances. A bid may be mitigated if it has a significant impact on the market price, and if the bid is above the reference level for the unit – typically, the reference level is based on its past bids. Both the price impact that can trigger mitigation, and the reference bid, need to be tightly defined in the market rules, of course. The market monitoring unit (or rather the market operator, given the tight timescales observed) will check bids for possible automatic mitigation. This could be an automatic check of all bids (which would be resource-intensive) or it could be a response to “exceptional” prices coming out of the initial market solution. If a bid meets the category for automatic mitigation, it is replaced with the reference bid and the market software is re-run. A second automatic approach, also commonly used in the US, is to have price caps in some or all markets. This does not require action on the part of the market monitor, for the price cap is generally hard-wired into the market algorithms, so that a price exceeding the cap should never be produced. The market monitor, however, should note the number of times that the price is at the cap, as this is likely to be an indicator of problems in the market, whether insufficient capacity, market power, or inappropriate rules. Apart from this, the powers of market monitors are generally limited to investigation and report. This does not mean that the market monitor has no influence, however. In PJM in the US, for example, the monitor will investigate behaviour that it believes could be an abuse of market power. Since that market is generally competitive, the abuses that do occur tend to involve complex strategies to take advantage of the details of the market rules, or to exploit congestion to raise prices in the generator’s locality. As the investigation proceeds, the market monitoring unit will write to the generator responsible, to alert it to the investigation and ask for information about (and possible justification of) its conduct. From the point of view of the market monitoring unit, this letter is confidential. From the point of view of the company receiving the letter, however, it is a warning that the company could find itself in trouble with the competition authorities in a few months’ time. The company is likely to release the letter, since non-disclosure could be illegal under Securities legislation in the US. The publicity is likely to stop the company from continuing with its actions, unless it is very confident that it can in fact
49

justify them. In fact, the threat of publicity may be sufficient to prevent some attempts to exploit market power, without needing the backstop of legal action. In other cases, such ‘sunshine’ regulation will be insufficient, and companies will only be dissuaded from exploiting their market power if they know that they run the risk of substantial legal penalties. These cannot be imposed by a market monitor inside a commercial organisation, and depend upon an efficient relationship between the market monitor and the regulator or the competition authorities. The details of that relationship are beyond the scope of this paper. 5. The Roles of Market Participants in Effective Market Monitoring Having examined the techniques available to detect market power, including the types of data that are required for such indices and analysis, we are now in a position to discuss the role of the various market participants in the process of effective market monitoring. The data of interest for market monitoring has been summarized in table 4 and consists of both physical flows and financial transactions and prices. In high-level terms, data is held by the following agents: TSO/ISO
Physical flow patterns Bids to balancing markets Bids in pools (if run by ISO)
Transmission right auctioneer (if independent of TSO/ISO)
Bids, market clearing prices and allocation of transmission rights
Power Exchanges Bids, market clearing price and allocation for spot market and forward
contracts of transactions through the power exchange. If there is a pool setting then all day-ahead transactions can be traced.
However, most pools (e.g. PJM) allow bilateral transactions and only require nomination of the flows. For such transactions price information is not available to or at the pool.
Brokers, market makers
Information on bilateral contracts brokered
Market participants Information on directly negotiated bilateral contracts
Generators
50

Information of costs, derating, outages and capacities. The following figure shows that data is increasingly centrally located, the closer the interaction occurs to dispatch. This is caused by the increasing level of centralised coordination and liquidity required in the shorter time frame.
Time frame of interaction
Dis
pers
ion
of In
form
atio
n
Real time Day ahead Longer-term
ISO/TSO• Flows• Balancing price
Pool (if existent)Transmission auction
Bilateral contracts
Broker
Forward markets
Power exchange
Bilateral contracts
LT-Transmissionauction
Time frame of interaction
Dis
pers
ion
of In
form
atio
n
Real time Day ahead Longer-term
ISO/TSO• Flows• Balancing price
Pool (if existent)Transmission auction
Bilateral contracts
Broker
Forward markets
Power exchange
Bilateral contracts
LT-Transmissionauction
Time frame of interaction
Dis
pers
ion
of In
form
atio
n
Real time Day ahead Longer-term
ISO/TSO• Flows• Balancing price
Pool (if existent)Transmission auction
Bilateral contracts
Broker
Forward markets
Power exchange
Bilateral contracts
LT-Transmissionauction
Time frame of interaction
Dis
pers
ion
of In
form
atio
n
Real time Day ahead Longer-term
ISO/TSO• Flows• Balancing price
Pool (if existent)Transmission auction
Bilateral contracts
Broker
Forward markets
Power exchange
Bilateral contracts
LT-Transmissionauction
Figure 1: Source of data on market interactions
This also explains why most market monitoring focuses on day-ahead markets, rather than long-term markets - more data is available. The economic argument for focusing on the spot or day-ahead market has already been briefly mentioned in section 2. A functioning and competitive day-ahead market provides information and a default alternative to long-term contracting. This reduces (but does not eliminate) the ability of generators to exercise market power on long-term contracts and should relieve the monitor from evaluating the prices in long-term contracts. On the other hand, the incentive to manipulate the spot and other markets depends on the extent to which market participants are contracted, and so this information is relevant for market surveillance. While it is difficult to obtain data on bilateral contracts, some monitoring of these markets seems important. Some of this data may be held by centralised power exchanges. These exchanges face an apparent dilemma – they need to assure market participants that they provide a fair and unbiased platform, and therefore have an incentive to monitor the market, independently of outside requirements. But at the same time they might worry that large market players will be reluctant to trade on voluntary exchanges if their actions are visible to competitors. While power exchanges might be reluctant to grant competition authorities access to all their information (for fear that it might be disclosed
51
to their competitors), they may already fall under financial service control, like the Financial Service Authority (FSA) in the UK. In June 2004 UKPX changed its status from a recognized investment exchange to an alternative trading system. It now conducts itself as if it were a broker, but still has the principal duties as an exchange, including market monitoring, financial surveillance and investigations. In France, Powernext SA is overseen both by CRE (the Energy Regulator) and the Authorité des Marches Financiers, the regulator in charge of monitoring France’s financial markets. Powernext SA has the responsibility to conduct market surveillance and compliance activities. The very nature of a TSO/ISO requires that all physical transactions have to be reported to this institution, so that it is well-placed to hold a complete, centrally stored record. As such it is the logical prime source of information on market evolution. It would be difficult to get an adequate picture of the total production volumes of different players from other sources, given that most power exchanges only handle a small fraction of total production. This quantity data provides valuable information for understanding both the incentives for the behaviour of market participants and also their final actions, and is essential to the proper investigation of market behaviour. As the market participants are already obliged to report to the TSO this creates no additional burdens on market participants and the TSO (except perhaps changes in IT systems to ensure compatibility between TSOs). TSOs might argue that their working relationship with generation companies might suffer if they suspect that the TSO passes on excessive amounts of information to regulatory authorities. This concern can be best dealt with by clearly specifying the information requirements and demonstrating that it is no greater than that required in many other markets (particularly those in the US). Some parties voice concerns that confidentiality requirements of their customers could be infringed. The natural solution is to agree which information is to remain confidential to the authorities and how any data to be published may be delayed, aggregated or anonymised to protect justifiable commercial confidentiality. The Dutch TSO, TenneT, provides a good example of the timely publication of availability and other market relevant data (see e.g. http://www.tennet.nl/english/other/ where availability data is published pursuant to Article 2.5 of the Netherlands System Code). There are a number of further aspects that should be considered when deciding on an appropriate strategy to deal with the data: The information should be stored for sufficient time to allow ex-post investigation
of various events. The data should ideally be stored in a homogeneous format all over Europe. Such
requirements reduce the cost of analysis and also increase the integrity of data. At the very least the format should be agreed with the regulator so that it cannot be adjusted to make market power more difficult to detect.
52

Access rights to the data should be clearly specified. In some countries many data requests are routinely rejected on grounds of confidentiality of client-specific data (such as individual plant outputs). This does not appear to be a problem in the US and the UK.
As much of the data as possible should be made publicly available, possibly with some time delay (to allay concerns over tacit collusion and confidentiality). A search of the web-sites of European TSOs revealed that there is currently limited data available online. Such data would facilitate academic and third party research, which can offer a cheap addition to market analysis and provides a check on and hence a disincentive to regulatory capture.
Regulatory authorities should receive access to the data either automatically or on request, without the need for legal proceedings. In some countries (such as The Netherlands) the original Electricity Law may fail to specify that the regulatory authority has the power to demand information on a regular basis (as opposed to as part of a formal investigation), and this may require legislative correction or clarification. License conditions are a straightforward way of imposing such disclosure conditions, and can usually be changed by agreement or reference to the competition authorities, but not all countries require generators to hold licences.
In some countries significant fractions of generation capacity are connected to the distribution network. This may require that the system operator of the distribution network reports similar information as the TSO for monitoring purposes.
Where bilateral contracts are reported to TSOs, particularly contracts corresponding to international transactions, they have a high value for market monitoring purposes and should also be provided.
The market monitoring function should be clearly separated from the regulation of the transmission network. This becomes more important as incentive mechanisms become more complex and are based on the performance of the network. In such cases the TSO might become more reluctant to share information with the regulation authority that sets the revenue cap. It may be desirable to institutionally separate the market monitoring activities from the transmission regulator.
The analysis of generator behaviour and network use requires experts familiar with the particular network and generation park of the kind that TSOs are best placed to provide. This suggests the need for close cooperation between the monitoring unit and the TSO. The level of TSO expertise required is likely to depend on the accuracy expected from the analysis. The previous sections showed that some interpretation of data can be automated, but more complex patterns of exercise of market power can only be identified with a carefully tailored analysis. If these analyses are to command credibility they will have to be conducted by a market monitor independent of those potentially exercising market power. In the case studies presented in the appendix, market monitors are closely linked to the
53
ISO. The independence condition is satisfied in these cases because the ISO is independent of interests in generation or demand. In some European countries the TSO is financially linked with large generation or distribution companies and except in the case of very special governance rules for the TSO company under tight regulatory control, it is therefore constrained towards market monitoring. In such cases the monitoring function will need to be located in the regulatory office (or as an independent body), and many of the potential benefits of drawing on the TSO expertise will be lost. 6. Conclusions There is a growing consensus that the market monitoring process is an essential part of a well functioning electricity market. There are sound theoretical reasons (and supporting evidence) for suspecting that electricity markets may be unusually susceptible at times to the exercise of market power, compared to other markets. The peculiar features of the electricity supply industry make normal antitrust or competition law an inadequate base for addressing issues of market power and constitute the main argument for market monitoring. In some markets, the monitor can mitigate some kinds of abusive behaviour automatically, but the presence of an adequately resourced market monitor should act as a deterrent to the exercise of market power. Resources here include both information and analytic capabilities. Transmission operators are well-placed to provide the main data required for market monitoring, given their access to much of the data required. They also have the expertise to analyse that data and support it from their understanding of the behaviour of generating companies. That suggests that where they are truly independent of other market participants, they may provide a home for a market monitoring unit. Even in such cases, there is considerable merit in having an independently appointed Board of experts (perhaps 2-3) who can call for additional information and analysis, and which can impartially comment on the actions of the TSO, thus reassuring market participants of the impartiality of the analysis. This approach has worked with reasonable success so far in the United States and other non-European electricity markets. In Europe, the cooperation between Eltra and the Nordic Competition Authorities in the development of the MARS model of the Nord Pool area, which has been applied to analysing the market power of dominant generators, provides a good example of the potentially beneficial involvement of a TSO in the market monitoring process. Where unbundling between TSOs and generation is not sufficient, it is clearly more difficult to assure complete impartiality, and any market monitoring unit that depends on information and analysis from the TSO will need a carefully designed oversight and governance structure if it is to maintain a reputation for effective and impartial market surveillance. In this paper, we discuss the techniques used by economists to identify the potential for, and exercise of, market power in electricity wholesale markets. A wide range of techniques have been proposed and adopted. Simpler measures have their drawbacks, and
54

more complex techniques have yet to prove that they are necessary to justify their considerable additional resource requirements, but progress over the past few years in defining best practice has been impressive, if not conclusive. Network congestion potentially provides a number of opportunities for the exercise of market power. It is therefore important that congestion is monitored and taken into account in market power monitoring in practice. TSOs clearly have a central role to play in this regard. Our survey revealed relatively little empirical work published relating directly to transmission-related means of exercising market power. This is perhaps surprising given that, for example in Europe, transmission constraints are responsible for creating market power by effectively fragmenting markets. It will be particularly important to consider the market power implications of new proposals for cross-border access and congestion management in the European market. The TSOs have to allocate transmission capacity for commercial national and international transactions and for system security purposes. Given the large implications of small changes of available transmission capacity on local prices and the exercise of market power, a credible and transparent process has to be developed to guide these decisions. To assist in this process, system and flow patterns need to be stored for verification. Our investigation suggests three key lessons. First, it is desirable to employ a range of techniques, and market monitors should be open to new evidence of their success and weaknesses. Second, there should be a presumption in favour of retaining data, so that it is available for any tests that may be developed or adopted in future. Third, as much data as possible should be published, to allow independent analysts to refine techniques for the detection, and hence the deterrence, of market power. Politically sustainable electricity markets require market participants, consumers and politicians to have confidence that market abuse will be detected and deterred, and ensuring market sustainability is therefore in the interest of all participants.
55

References Allaz B., Vila J.L. (1993) “Cournot Competition, Forward Markets and Efficiency”, Journal of
Economic Theory 59, 1-16. Baker, J. and Bresnahan, T. F. (1992) Empirical Methods of Identifying and Measuring Market
Power, 61 Antitrust Law Journal. 3, 9-13. Blumsack, S., and Lave, L. (2003) “Mitigating Market Power in Deregulated Electricity Markets”
mimeo, available at http://www.andrew.cmu.edu/user/sblumsac/pivotal_04.doc Blumsack, S., Perekhodtsev, D., and Lester, L., (2002) “Market Power in Deregulated Wholesale
Electricity Markets: Issues in Measurement and the Cost of Mitigation,” Electricity Journal, November, pp. 11-24.
Bogorad, S. and Penn, D. (2001) “Cost-of-Service Rates to Market-Based Rates to Price Caps to ?!#?#!?”, Electricity Journal, April 2001.
Borenstein, S. and Bushnell, J. (1999) “An Empirical Analysis of the Potential for Market Power in California’s Electrcity Industry”, Journal of Industrial Economics, 47.
Borenstein S., Bushenl J., Kahn E., Stoft S. (1996) Market Power in California’s Electricity Market, Utilities Policy 5, 1-12.
Borenstein,S., Bushnell, J. and Knittel, C. (1997), “A Cournot-Nash Equilibrium Analysis of the New Jersey Electricity Market ” New Jersey Board of Public Utilities. Review of Public Utilities Restructuring Petition.
Borenstein S., Bushnell J., Stoft S. (2000) The competitive effects of transmission capacity in a deregulated electricity industry, RAND Journal of Economics 31 (2), 294-325.
Borenstein, S., J. Bushnell and F. Wolak (2002) “Measuring Market Inefficiencies in California’s Restructured Wholesale Electricity Market,” American Economic Review, December
2002, 92(5), pp. 1376-1405. Bower, J. (2002) “Why did electricity prices fall in England & Wales: Market mechanism or
market structure?” Working Paper EL02, Oxford Institute for Energy Studies. Brennan, T. J. (2003) “Preventing Monopoly or Discouraging Competition? The Perils of Price-
Cost Tests for Market Power in Electricity”, Discussion Paper 02–50 Resources for the Future, Washington. D.C.
Brennan, T. J. (2003) “Mismeasuring Electricity Market Power”, Regulation Spring 2003. Bushnell, J., Day, C., et al. (1999) “An International Comparison of Models for Measuring
Market Power in Electricity”, EMF Working Paper 17.1, Energy Modeling Forum Stanford University.
Bushnell, J., Mansur, E. and Saravia, C. (2004) “Market Structure and Competition: A Cross-Market Analysis of U.S. Electricity Deregulation”, Working Paper No 126, Centre for the Study of Electricity Markets, University of California Energy Institute.
Bushnell, J., Knittel, C. R, and Wolak, F. (1999) “Estimating the Opportunities for Market Power in a Deregulated Wisconsin Electricity Market”, The Journal of Industrial Economics, vol.47, September 1999.
Bushnell, J.B., and Saravia, C. (2002). “An Empirical Analysis of the Competitiveness of the New England Electricity Market.” CSEM Working Paper WP-101, University of California Energy Institute. May.
Cardell,J., Hitt,C., Hogan,W. (1997) “Market Power and Strategic Interaction in Electricity Networks ” Ressource and Energy Economics,Vol 19.
Crespo, J. (2003) “Improving Market Power Mitigation Rules for Peaking Units”, Electricity Journal, October 2003, 47-60.
Day, C.J., B.F. Hobbs, and J.-S. Pang, 2002, Oligopolistic competition in power networks: A conjectured supply function approach, IEEE Transactions on Power Systems 17(3), 597-607.
Daxhelet, O., and Y. Smeers, 2001, Variational inequality models of restructured electric sys-tems, in: M.C. Ferris, O.L. Mangasarian, and J.-S. Pang, Applications and Algorithms of Comple-mentarity (Kluwer, Dordrecht).
Evans, J., and Green, R. (2003). “Why did British electricity prices fall after 1998?” Working Paper. Center for Economic Policy. University of Hull.
Fabra, N. and Toro, J. (2003) "The Fall in British Electricity Prices: Market Rules, Market Structure, or Both?," Industrial Organization
56
FERC (2002) “Notice, Agenda and Staff Paper for the October 2nd Staff Conference on Market Monitoring” Docket No. RM01-12-000 (September 20, 2002)
FERC (2002b) “ ‘Strawman’ Staff Discussion Paper on Market Metrics SMD Staff Conference on Market Monitoring”, Mimeo, October 2, 2002.
FERC (2002), Remedying Undue Discrimination Through Open Access Transmission Service and Standard Electricity Market Design, Notice of Proposed Rulemaking, Washington DC, July 31, 2002. FERC (2004) “Order on rehearing and modifying interim generation market power analysis and
mitigation policy” Docket No. ER96-2495-016, et al. Gilbert R., Neuhoff, K., Newbery D. (2004) “Allocating Transmission to Mitigate Market Power
in Electricity Networks”, RAND Journal of Economics, forthcoming. Goldman, C., Lesientre, B., and Bartholomew,E. (Jan 2004) “A Review of Market Monitoring
Activities at U.S. Independent System Operators.” Ernst Orlando Lawrence Berkeley National Laboratory.
Green R. (1992) Contracts and the Pool: The British Electricity Market, DAE Mimeo. Green,R.J, (1996) “Increasing Competition in the British Electricity Spot Market” Journal of
Industrial Economics 44(2): 205-216. Green,R.J and Newbery,D.M, (1992) “Competition in the British Electricity Spot
Market,”Journal of Political Economy 100(5): 929-953. Grimston, M. (2004) Generating Profits? Experience of liberalised electricity market. Mimeo. Guthrie, G. and Videbeck, S. (2003) “Approaches to Assessing Market Power in Electricity
Markets” New Zealand Institute for the Study of Competition and Regulation, Seminar Presentation September 2003.
Haddock, D., Mcchesney, F. and Shughart, W. (2003) “On the Internal Contradictions of the Law of One Price”, Northwestern Law and Econ Research Paper No 3-10.
Harbord, D. and N-H. von der Fehr (in collaboration with London Economics Australia Pty) (1995) Market Power in the Australian Electricity Market, A Report to the Industry Commission, Melbourne, August (published as Annex 2 of Generation Reform Working Group,1995).
Harvey,S. and Hogan,W. (2001) “On the Exercise of Market Power Through Strategic withholding in California”.
Harvey, S. and Hogan, W. (2001) “Identifying the Exercise of Market Power in California”, LECG Research Paper, December 28, 2001.
Harvey, S. and W. Hogan (2000) “Nodal and Zonal Congestion Management and the Exercise of Market Power.”
Harvey, S. and Hogan, W. (2002) “Market Power and Market Simulations”, Mimeo. Helman, U. (2004) “Generation Market Power: Some Trends in Regulation and Research
Topics”, Presentation at NEMS/AEO Conference, Washington DC, March 23, 2004. Hogan W. (1997) A Market Power Model with Strategic Interaction in Electricity Networks, The
Energy Journal 18(4), 107-141. Hogan, W. (2004) “Local Market Power Mitigation”, Comments for Technical Conference on
Compensation for Generating Units Subject to Local market Power Mitigation in Bid Based Markets, Submitted to FERC February 4 2004.
Hogan, W., Scott Harvey and Todd Schatzki (2004) “A Hazard Rate Analysis of Mirant’s Generating Plant Outages in California”, Toulouse Conference paper.
Hortacau,S., and Puller, S. (2003) “Testing Strategic Models of Firm Behavior in Restructured Electricity Markets: A Case Study of ERCOT” Center for the Study of Energy Markets. Paper CSEMWP-125.
Hulbut, D., Rogas, K. and Oren, S. (2003) “Protecting the Market from “Hockey Stick” Pricing: How the Public Utility Commission of Texas is Dealing with Potential Gouging”, The Electricity Journal, April 2004.
Hunt, S. (2003) Making Competition Work in the Electricity, John Wiley and Sons. ISO-NE (2002) “A Catalog of Market Metrics”, Presentation, Market Monitoring and Working
Group, EISG April 2002, Alberta Canada. ISO-NE (2004) Annual Report 2003.
57

Joskow, P. J.(2003). “The Difficult Transition to Competitive Electricity Markets in the U.S.,”Electricity Restructuring: Choices and Challenges. J. Griffen and S. Puller, eds. University of Chicago Press.
Joskow, P. and Kahn, E. (2002) “A Quantitative Analysis of Pricing Behavior in California’s Wholesale Electricity Market During Summer 2000” The Energy Journal, Vol 23, No. 4,
Joskow, P. and J. Tirole (2000) “Transmission Rights and Market Power on Electric Power Networks.” RAND Journal of Economics, Vol. 31, No. 3, pp. 450-487.
Kahn, E. (1998) “Numerical Techniques for Analyzing Market Power in Electricity”, Electricity Journal, July 1998.
Kirsch, l. D. (2002)”Affidavit of Dr Laurence D Kirsch on Behalf of the Transmission Access Policy Study Group” Appendix of McDiarmid et. al. (2002) .
Klemperer, P.D., and Meyer,M.A. (1989). “Supply Function Equilibria in Oligopoly Under Uncertainty,” Econometrica. November. 57(6): 1243-77.
Lafferty, R., Hunger,D., Ballard, J.,Mahrenholz,G., Mead, D., and Bandera, T. (2001) “Demand Responsiveness in Electricity Markets”, Office of Markets, Tariffs and Rates, Federal Energy Regulatory Commission.
Lucas, N. and Taylor, P. (1993) “Characterizing Generator Bidding Behaviour: Bidding Strategies in the Pool.” Utilities Policy, April, pp. 129-135.
Macatangay, R. (2001) “Market Definition and Dominant Position Abuse under the new Electricity Trading Arrangements in England and Wales”, Energy Policy 29, 337-340
Mansure, E.T. (2001) “Pricing Behavior in the Initial Summer of the Restructured PJM Wholesale Electricity Market”, POWER Working Paper PWP-083, University of California Energy Institute, April.
Mansur, E.T. (2001) “Environmental Regulation in Oligopoly Markets: A Study of Electricity Restructuring”, POWER Working Paper PWP-088, University of California Energy Institute.
Market Analysis (2000) “Market Power in Electricity Markets: Do Electricity Markets Require Special Regulatory Rules? A Report Concerning the Competition Commission Electricity Generators Inquiry”, Mimeo.
Massey, M. L (2001) Address before the Energy Bar Association 4th Annual Midwest Energy Conference, entitled “Is the FERC Keeping its Part of the Regulatory Bargain?”
McDiarmid, R., Bogorad, C. S. and Hegedus, M. S. (2002) “Comments of the American Public Power Association and Transmission Access Policy Study Group on Market Power, Market Monitoring, and Market Mitigation Issues in S upply Margin Assessment and Standard Market Design”, FERC Conference on Supply Margin Assessment, Docket No. PL02-08-000.
Metzler, C., B.F. Hobbs, and J.S. Pang, 2003, Nash-Cournot equilibria in power markets on a linearized DC network with arbitrage: Formulations and properties, Networks & Spatial Econom-ics 3(2), 123-150.
Meritet, S. (2002) “Market Power in Restructured Electricity Markets: the Case of the United States”, mimeo, Centre de Geopolitique de l’Energie et des Matieres Premieres.
Morris, J (2003) “Weston 4 Effect on Wholesale Competition in WUMS” Research Report for Wisconsin Public Service Corporation.
Neuhoff K., Barquin J., Boots M.G., Ehrenmann A., Hobbs B.F., Rijkers F.A.M. (2004) “Network-constrained Cournot models of liberalized electricity markets: The devil is in the details”, CMI working paper..
Offer (1992) Report on Constrained-on Plant, Birmingham, Office of Electricity Regulation. OJ (2002), Directive 2002/21/EC Of The European Parliament And Of The Council of 7 March
2002 on a common regulatory framework for electronic communications networks and services (Framework Directive), Official Journal of the European Communities, 24.4.2002 L 108/33.
Oren S.S. (1997) Economic inefficiency of passive Transmission Rights in Congested Electricity Systems with competitive Generation, The Energy Journal 18(1), 63-83.
Patten, D. B., Sinclair, R. A. and Pallas, M. (2002) Competitive Assessment of the Energy Market in New England, Potomac Economics, May 2002.
58

Patrick, D. B. and Wolak, F. A (2001) “Estimating the Customer- Level Demand Under Real-Time Market Prices,” NBER Working paper No. 8213.
Power Pool of Alberta (2002) “Economic Withholding in the Alberta Energy Market” Discussion
Paper. Puller, S.L. (2000) “Pricing and Firm Conduct in California’s Deregulated Electricity Market,”
POWER Working Paper PWP-080. Rahimi, A. F. and Sheffrin, A.Y (2003) “Effective Market Monitoring in Deregulated Electricity
Markets” IEEE Transactions on Power Systems, Vol 18, No.2 May 2003. Robinson, T. and Baniak, A. (2002) “The Volatility of Prices in English and Welsh Electricity
Pool”, Applied Economics, 34, pp1487-1495. Rudkevich, A., Duckworth, M. and Rosen, R. (1998) “Modelling Electricity Pricing in a
Deregulated Generation Industry: the Potential for Oligopoly Pricing in a Poolco”, Energy Journal 19(3): 19-48.
Ruff, L. (2002) “Market Power Migitation: Principles and Practice”, mimeo, Charles River Associates, November 2002.
Schmalensee, R. and Golub, B.W. (1984) “Estimating Effective Concentration in Deregulated Wholesale Electricity Markets” RAND Journal of Economics, vol 15,1.
Scheffman, D.T. and P.T. Spiller (1987), "Geographic Market Definition under the U.S. Department of Justice Merger Guidelines", Journal of Law and Economics 30, 123-147.
Shapiro, Carl (1989) ‘Theories of Oligopoly Behavior.’ In Handbook of Industrial Organization, ed. R. Schmalensee and R. D.Willig, vol. 1 (Elsevier Science Publishers) pp. 329–414.
Sheffrin, A. (2001) “Critical Actions Necessary for Effective Market Monitoring” Draft Comments Dept of Market Analysis, California ISO, FERC RTO Workshop, October 19, 2001.
Sheffrin, A. (2002a) “Predicting Market Power Using the Residual Supply Index” Presented to FERC Market Monitoring Workshop December 3-4, 2002.
Sheffrin, A. (2002b) “Empirical evidence of strategic bidding in California ISO real-time market”, in Electric Pricing In Transition, Norwell, MA: Kluwer 2002, p.267-281.
Sheffrin, A. and Chen, J. (2002c) “Predicting market power in wholesale electricity markets”, in Proceedings, 15th annual Western Conference, South Lake Tahoe, CA, June 19-21, 2002.
Short, C., and Swan, A. (2002) “Competition in the Australian National Electricity Market,” ABARE Current Issues, January, 2002.
Smeers, Y., 1997, Computable equilibrium models and the restructuring of the European electricity and gas markets, Energy Journal 18(4), 1-31.
Stoft S. (1998) Using Game Theory to study Market Power in Simple Networks, IEEE Tutorial on Game Theory Applications to Power Markets.
Stoft, S. (2002) “Power System Economics: Designing Markets for Electricity”, IEEE Press. Stoft, S. (2003) “The Demand for Operating Reserves: Key to Price Spikes and Investment” IEEE
Transactions on Power Systems, Vol. 18, No.2. Synapse (2001) “Best Practices in Market Monitoring” report. Tabors Caramanis and Associates (2000) “Horizontal Market Power in Wisconsin Electricity” A
Report to the Public Service Commission of Wisconsin, November 2000. Tirole, J. (2002), The Theory of Industrial Organization, Cambridge, MA: MIT Press. Vassilopoulos, P. (2003) “Models for the Identification of Market Power in Wholesale Electricity
Markets” UFR Sciences of Organizations, D.E.A., 129 , University of Paris Ventosa, M., A. Baíllo, M. Rivier, and A. Ramos (2004). “Electricity Market Modeling Trends.”
Energy Policy, in press. von der Fehr, N-H and Harbord, D. (1993) “Spot Market Competition in the UK Electricity
Industry.” The Economic Journal, Vol. 103, pp. 531-546. Wei, J.-Y., and Y. Smeers, 1999, Spatial oligopolistic electricity models with Cournot gen-erators
and regulated transmission prices, Operations Research 47(1), 102-112. Werden, G.J. and Froeb, L.M. (1993), "Correlation, Causality, and All that Jazz: The Inherent
Shortcomings of Price Tests for Antitrust Market Delineation", Review of Industrial Organization 8, 329-353.
59

Williams, E., and Rosen,R. (1999) “A Better Approach to Market Analysis” Tellus Institute, Boston, July 14, 1999, mimeo.
Wolak, F. A. (2000) “An empirical analysis of the impact of hedge contracts on bidding behaviour in a competitive electricity market”, International Economic Journal, Summer 2000, 14(2), pp.1-40.
Wolak, F. (2003) “Measuring Unilateral Market Power in Wholesale Electricity Markets: The California Market 1998 – 2000” Centre for the Study of Energy Markets, Working paper 114
Wolak, F. (2004) “Lessons from International Experience with Electricity Market Monitoring”, CSEM Working Paper 134, University of California Energy Institute.
Wolak, F. (2004) “The Need for and Role of an Independent Market Monitor: Lessons from International Experience” Presentation Slides.
Wolak, F., Barber, B., Bushnell, J., Hobbs, B. (2003) “Opinion on the Necessity of Effective Local Market Power Mitigation for a Workably Competitive Wholesale Market”, CAISO note.
Wolak, F.A. and Patrick, P.H (1997) “The Impact of Market Rules and Market Structure on the Price Determination Process in the England and Wales Electricity Market.” POWER Working Paper PWP-047, University of California.
Wolfram,C (1998) “ Strategic Bidding in a Multi-Unit auction: An empirical Analysis of Bids in Supply Electricity in England & Wales” RAND Journal of Economics, 29(4), 703-725
Wolfram,C (1999) “Measuring Duopoly Power in the British Electricity Spot Market” American Economic Review, 89, 805.
Yang, J (2001) “A Market Monitoring System for the Open Electricity Markets”, IEEE Power Engineering Society 2001 Summer Meeting, Vancouver, British Columbia, July 15-19, 2001.
Zhou, S. (2003) “Comparison of Market Designs”, Market Oversight Division Report for Electric Reliability Council of Texas.
60

Appendix A Case Studies
New York Market Overview18
New York State has a population of around 19 million people. Annual demand is approximately 150 TWh, and peak load is about 30,000 MW. The fuel mix is 2001 was: Gas 29%, Nuclear 28%, Coal 16%, Hydro 16%, Oil 10% and other 1%. In November 1999, the former NY Power Pool, which had been established in the 1960s, became the New York Independent System Operation (NYISO). The wholesale market it operates is an integrated market with day-ahead, hour ahead and real-time energy markets. Energy transactions and transmission usage scheduled in each of these markets are settled using Locational Based Marginal Prices (LBMPs). The pool is not compulsory and bilateral trade outside the pool is allowed. Load serving entities are required to contract for capacity at load plus an 18% reserve margin. Market Monitoring Market monitoring is performed by the Market Monitoring and Performance Division, a division of the NYISO. The division is composed of approximately 28 staff and is divided into four units: Mitigation and Compliance, Analysis, Investigation, and Data Services. The NYISO has explicit market mitigation authority. The Mitigation and Compliance unit performs day-to-day monitoring, checking for compliance and mitigating behavior as necessary and authorized, including administering the Automated Mitigation Procedure (AMP). The Analysis unit focuses on long-range issues, including analysis of market performance and design issues. The Investigation unit performs investigations, including physical audits of facilities, which are kept confidential, and formal investigations into irregular or potentially non-competitive behavior. The Data Services unit supports the data needs of the other groups. Under the NYISO Market Monitoring Plan, the MMU reports to the CEO of the NYISO, who is in turn responsible to the ISO board for monitoring activities. The MMU also works closely with a board-appointed independent Market Advisor who takes an active role in market monitoring activities. The Market Advisor aids in setting market monitoring and mitigation procedures, provides an independent assessment of the ISO
18 The market overviews in the appendix have partly drawn upon Zhou (2003) and Grimston (2004). The market monitoring sections have partly drawn upon Goldman et al. (2004) and Synapse (2001)
61

and the MMU itself, and prepares the yearly market report. The independent Market Advisor reports directly to the ISO board (Goldman, 2004). The following data or information may be obtained by the NYISO from Market Parties in accordance with the Market Monitoring Plan. Market parties shall retain the following categories of data or information for at least two years, or such other period specified in any applicable data or information retention policy issued by the NYISO.
1. Production costs - Data or information relating to the costs of operating a specified Electric Facility (for generating units such data or information shall include, but not be limited to, heat rates, start-up fuel requirements, fuel purchase costs, and operating and maintenance expenses). 2. Opportunity costs - Data or information relating to a claim of relatively high opportunity costs, including, but not limited to, contracts or price quotes. 3. Logs - Data or information relating to the operating status of an Electric Facility, including, for generating units, generator logs showing the generating status of a specified unit. Such data or information shall include, but not be limited to, any information relating to the validity of a claimed forced outage or derating of a generating unit or other Electric Facility. 4. Bidding Agreements - Data or information relating to the ability of a Market Party or its Affiliate to determine the pricing or output level of generating capacity owned by another entity, including but not limited to any document setting forth the terms or conditions the ability of the Market Party or its Affiliate to make such determinations.
Data and Indices Monitored The following data, indices and screens are monitored to identify potential problems with the market rules or potential market power concerns that need to be investigated further or warrant immediate mitigation. A. Energy Market 1. Day-ahead energy market bids/bilateral schedules
(a) Variable component (including incremental/decremental bids from bilaterals). (b) Start-up cost component and other commitment parameters (hours off-line,
minimum run-time, minimum down-time, notification, max stops). (c) Other generator specifications (e.g., changes to maximum operating limits,
minimum generation, response rates, penalty and power factors).
62

(d) Percent of the total unit Dependable Maximum Net Capability (DMNC) and/or Seasonal Maximum Operating Limit that was bid or scheduled in the day-ahead market.
(e) Total day-ahead energy bids. (f) Total amount of energy scheduled bilaterally. (g) Day-ahead ISO forecast of hourly total load. (h) Day-ahead participants’ forecast of hourly total load. (i) Day-ahead total load bid by participant. (j) Day-ahead total of load bids for the market.
2. Hour-ahead energy market bids
(a) Variable component (including incremental/decremental bids from bilaterals). (b) Percent of the total unit DMNC and/or Seasonal Maximum Operating Limit
that was bid or scheduled in the hour-ahead market. 3. Location-Based Marginal Prices
(a) Day-ahead LBMP at each bus. (b) Hour-ahead LBMP at each bus. (c) Real-Time (five minute) LBMP at each bus. (d) Day-ahead price for each load zone. (e) Real-time price for each load zone.
4. Transmission System Congestion
(a) Total system-wide congestion (total congestion revenue collected by the ISO). (b) Congestion component of each day-ahead bus LBMP. (c) Congestion component of each real-time bus LBMP. (d) Scheduled net import and exports between zones or areas within New York. (e) Actual net import and exports between zones or areas within New York.
5. Dispatch and load levels (a) Hourly dispatch level for each unit. (b) Hourly total dispatch level by owner. (c) Hourly total dispatch level for the NY market. (d) Hourly load by LSE (e) Hourly total market load. (f) Unit dispatch deviations from ISO signal.
B. Ancillary Service Markets 1. Spinning reserve market
(a) Day-ahead availability bid (MW, $/MW). (b) Hour-ahead availability bid (MW, $/MW). (c) Day-ahead Market clearing spinning reserve price.
63

(d) Real-time Market clearing spinning reserve price. (e) Amount of spinning reserve traded at day-ahead prices. (f) Amount of spinning reserve traded at real-time prices.
2. 10 Minute non-spinning reserve market
(a) Day-ahead availability bid (MW, $/MW). (b) Hour-ahead availability bid (MW, $/MW). (c) Day-ahead Market clearing 10 minute non-spinning reserve price. (d) Real-time Market clearing 10 minute non-spinning reserve price. (e) Amount of 10 minute non-spinning reserve traded at day-ahead prices. (f) Amount of 10 minute non-spinning reserve traded at real-time prices.
3. 30 Minute non-spinning reserve market
(a) Day-ahead availability bid (MW, $/MW). (b) Hour-ahead availability bid (MW, $/MW) (c) Day-ahead Market clearing 30 minute non-spinning reserve price. (d) Real-time Market clearing 30 minute non-spinning reserve price. (e) Amount of 30 minute non-spinning reserve traded at day-ahead prices. (f) Amount of 30 minute non-spinning reserve traded at real-time prices.
4. Regulation service
(a) Day-ahead availability bid (MW, $/MW). (b) Market clearing regulation price.
5. Supplemental resource bids C. Installed Capacity (ICAP) Market
1. Total ICAP Responsibilities. 2. Total resources capable of providing ICAP. 3. ICAP Responsibilities by LSE. 4. Subtotals of ICAP capable resources by owner. 5. Amount of ICAP sold or offered by each owner. 6. ICAP clearing price.
D. System Conditions
1. Transmission facility planned outages. 2. Transmission facility forced outages. 3. Generating unit planned outages. 4. Generating unit forced outages. 5. When congestion is present.
(a) Limiting transmission element. (b) Nature of constraint (thermal, voltage, stability). (c) Top ten contributors to constraint.
64

E. Adjacent Markets
1. Energy prices in PJM, ECAR, NEPOOL and Canada. 2. Hourly loads in PJM, ECAR, NEPOOL and Canada. 3. Hourly interchange with PJM, ECAR, NEPOOL and Canada. 4. Ancillary service prices in PJM, ECAR, NEPOOL and Canada. 5. ICAP prices in PJM, ECAR, NEPOOL and Canada.
F. Fuel Prices
1. Natural Gas (a) Spot prices. (b) Futures contracts.
2. Oil (a) Spot prices. (b) Futures prices.
3. Coal (a) Spot prices. (b) Futures prices.
Indices and Screens A. Bid Reference Prices
• The lower of the mean or the median of the unit’s bids over the previous 90 days for similar hours or load levels, adjusted for changes in fuel prices. • The mean of the LBMP at the unit’s location during the lowest-priced 25 percent of hours that the unit was dispatched over the previous 90 days, adjusted for changes in fuel prices. • The mean of the bids supplied by all units of similar types.
1. Day-ahead energy bid reference prices
(a) variable component. (b) start-up cost component.
2. Real-time energy market reference prices - variable component of hour-ahead bid 3. Spinning reserve market reference prices
(a) day-ahead availability bid. (b) hour-ahead availability bid.
4. 10 Minute non-spinning reserve market reference prices
(a) day-ahead availability bid. (b) hour-ahead availability bid
65

5. 30 Minute non-spinning reserve market reference prices (a) day-ahead availability bid. (b) hour-ahead availability bid.
6. Regulation service reference prices B. Bid variation 1. Deviation of bids from reference price levels
(a) Deviation of day ahead energy market bids. (b) Deviation of hour-ahead energy market bids. (c) Deviation of spinning reserve market bids. (d) Deviation of 10 Minute non-spinning reserve market bids. (e) Deviation of 30 Minute non-spinning reserve market bids. (f) Deviation of regulation service bids.
2. Deviation of bids from longer or shorter-term moving averages of prior bids
(a) Deviation of day ahead energy market bids. (b) Deviation of hour-ahead energy market bids. (c) Deviation of spinning reserve market bids. (d) Deviation of 10 Minute non-spinning reserve market bids. (e) Deviation of 30 Minute non-spinning reserve market bids. (f) Deviation of regulation service bids.
C. Scheduling variation 1. Deviation of day-ahead prices from day-ahead reference price levels when a generator is not scheduled or its schedule is reduced
(a) Deviation of day-ahead LBMPs from day-ahead energy reference prices (b) Deviation of day-ahead spinning reserve price from day-ahead spinning reserve reference price. (c) Deviation of day-ahead 10-minute non-spinning reserve price from day-ahead 10-minute non-spinning reserve reference price. (d) Deviation of day-ahead 30-minute non-spinning reserve price from day-ahead 30-minute non-spinning reserve reference price.
2. Deviation of real-time prices from real-time reference price levels when a generator is not scheduled or its schedule is reduced
(a) Deviation of real-time LBMPs from real-time energy reference prices. (b) Deviation of real-time spinning reserve price from real-time spinning reserve reference price. (c) Deviation of real-time 10-minute non-spinning reserve price from real-time 10-minute non-spinning reserve reference price.
66

(d) Deviation of real-time 30-minute non-spinning reserve price from real-time 30- minute non-spinning reserve reference price. (e) Deviation of current regulation service market price from regulation service reference price.
3. Deviation between an LSE’s actual load served real-time and the bid amount in the dayahead market. 4. Deviation between an LSE’s actual load served real-time and the load dispatched in the day-ahead market. 5. Deviation between the total market load served real-time and the total bid amount in the day-ahead market. 6. Deviation between the total market load served real-time and the total load dispatched in the day-ahead market. D. Bid and Schedule Correlations 1. Correlation of unit schedules or bids and the existence or magnitude of congestion. 2. Correlation of unit schedules or bids and generator bus LBMPs. 3. Correlation of total system load in New York and LBMPs. 4. Correlation of generator forced outages and LBMPs or congestion. 5. Correlation of transmission facility forced outages and LBMPs or congestion. E. Residual Demand Indices – percent of market demand that must be served by a specific supplier (assuming all other suppliers are selling at their maximum capability)
• An RDI of 10 percent indicates that the supplier is effectively a monopoly supplier over 10 percent of the demand. • Negative RDI values indicate that the supplier faces no residual demand over which it would effectively be a monopoly. 1. Energy Market
(a) Hourly market (b) Day-ahead market
2. Ancillary Service Markets 3. ICAP Market
F. Price Deviations
1. Hourly difference between the real-time and day-ahead price. 2. Average difference between the real-time and day-ahead price over a specified
period (i.e., initially a rolling eight week period).
67

3. Hourly difference in prices between New York and adjacent regions at the interconnection locations.
68

Pennsylvania-New Jersey-Maryland (PJM) Overview of Market The Pennsylvania-New Jersey-Maryland (PJM) Interconnection is the oldest power pool in the United Stated, established in 1927. It serves a population of more than about 35 million customers with an installed capacity of 106,000 MW and peak demand of 87,000 MW. In the year 2000, PJM served 446 million GWh of energy, which represents about 10% of U.S. electric energy. PJM’s power is generated from a fuel mix of 49% coal, 37% nuclear, 8% gas, 3% oil, and 3% hydroelectric. In 1998 PJM became an independent system operator and now operates a day-ahead energy market, a real-time energy market, a daily capacity market, monthly and multi-monthly capacity markets, a regulation market, and the monthly Financial Transmission Rights (FTRs) auction market. The power pool operated by the ISO is not a compulsory one, allowing for outside bilateral trading. PJM introduced nodal energy pricing with market-clearing prices in April 1998 and nodal market-clearing prices based on competitive offers in April 1999. PJM implemented a competitive auction-based FTR market in May 1999. Daily capacity markets were introduced in January 1999 and were broadened to include monthly and multi-monthly markets in mid-1999. PJM implemented the day-ahead energy market and the regulation market in June 2000. Market Monitoring As with all the US ISOs, PJM has established a Market Monitoring Unit (MMU). The PJM MMU has a staff of twelve and an external designated market advisor. The MMU is administratively under the President of PJM, but the manager has the authority to independently contact the PJM board and FERC. The objectives of PJM market monitoring unit are delineated in the Market Monitoring Plan, as approved by the Federal Energy Regulatory Commission (FERC). The objectives of PJM’s MMU are to monitor and report on issues relating to the operation of the PJM Market. These include the evaluation of the operation of both pool and bilateral markets to detect either design flaws in the PJM Market operating rules or to detect structural problems in the PJM Market, to evaluate any required enforcement mechanisms to ensure compliance with pool rules and to ensure that the monitoring program will be conducted in an independent and objective manner. In particular, the PJM Market Monitoring Plan states that the MMU shall be responsible for monitoring compliance with the PJM market rules, actual or potential design flaws in PJM market rules and the potential of any market participant(s) to exercise undue market power.
69
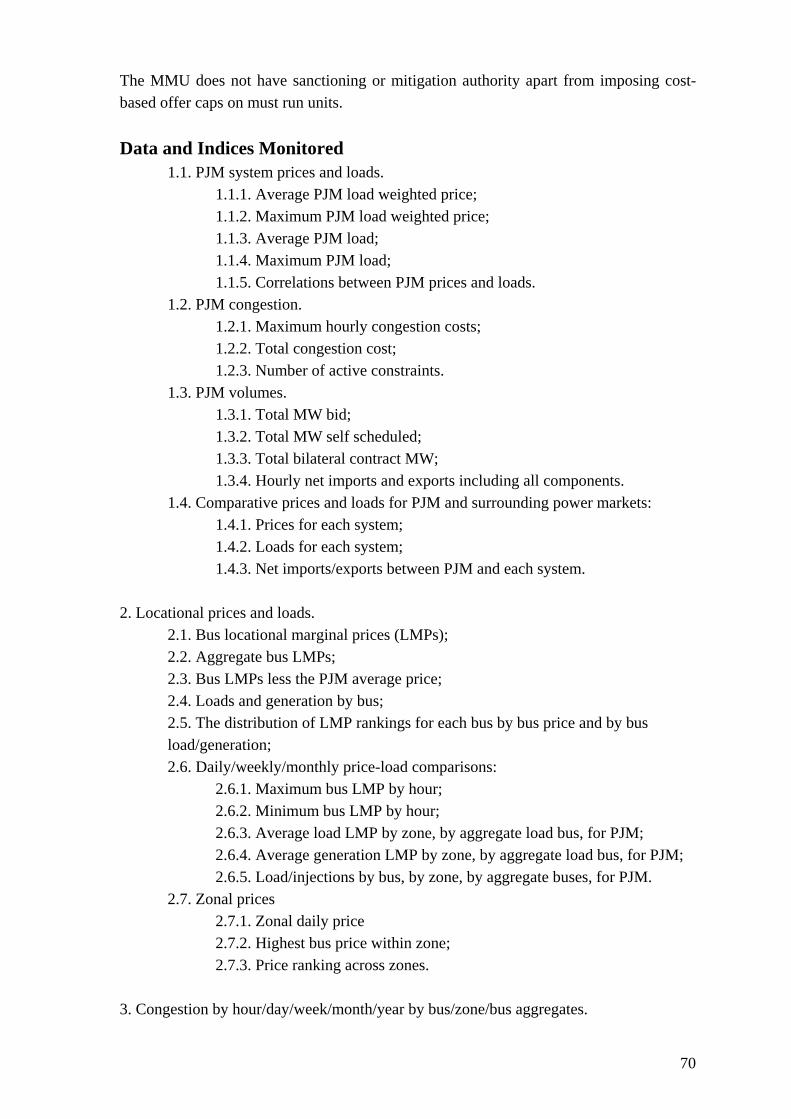
The MMU does not have sanctioning or mitigation authority apart from imposing cost-based offer caps on must run units. Data and Indices Monitored
1.1. PJM system prices and loads. 1.1.1. Average PJM load weighted price; 1.1.2. Maximum PJM load weighted price; 1.1.3. Average PJM load; 1.1.4. Maximum PJM load; 1.1.5. Correlations between PJM prices and loads.
1.2. PJM congestion. 1.2.1. Maximum hourly congestion costs; 1.2.2. Total congestion cost; 1.2.3. Number of active constraints.
1.3. PJM volumes. 1.3.1. Total MW bid; 1.3.2. Total MW self scheduled; 1.3.3. Total bilateral contract MW; 1.3.4. Hourly net imports and exports including all components.
1.4. Comparative prices and loads for PJM and surrounding power markets: 1.4.1. Prices for each system; 1.4.2. Loads for each system; 1.4.3. Net imports/exports between PJM and each system.
2. Locational prices and loads.
2.1. Bus locational marginal prices (LMPs); 2.2. Aggregate bus LMPs; 2.3. Bus LMPs less the PJM average price; 2.4. Loads and generation by bus; 2.5. The distribution of LMP rankings for each bus by bus price and by bus load/generation; 2.6. Daily/weekly/monthly price-load comparisons:
2.6.1. Maximum bus LMP by hour; 2.6.2. Minimum bus LMP by hour; 2.6.3. Average load LMP by zone, by aggregate load bus, for PJM; 2.6.4. Average generation LMP by zone, by aggregate load bus, for PJM; 2.6.5. Load/injections by bus, by zone, by aggregate buses, for PJM.
2.7. Zonal prices 2.7.1. Zonal daily price 2.7.2. Highest bus price within zone; 2.7.3. Price ranking across zones.
3. Congestion by hour/day/week/month/year by bus/zone/bus aggregates.
70

3.1. Total congestion costs for period; 3.2. Peak congestion costs; 3.3. Percent of time with congestion; 3.4. Frequency of constraint; 3.5. Frequency of must run price cap implementation; 3.6. Frequency of constraints without must run price cap implementation.
4. Offers and dispatch.
4.1. Unit offer/supply curves; 4.2. Company aggregate offer/supply curves; 4.3. Aggregate PJM supply curves; 4.4. Comparisons of unit offer/supply curves to historical offer curves; 4.5. Comparisons of company offer/supply curves to historical supply curves; 4.6. Comparisons of aggregate PJM supply curves to historical supply curves; 4.7. Identification of units which set price; 4.8. Frequency of individual units setting price; 4.9. Deviations from requested dispatch, by unit; 4.10. Ramp rates by unit, by time period, by company. 4.11. Comparisons of ramp rates by unit type, by company. 4.12. Conditions on offers: start times; minimum run requirements; start costs.
5. Available capacity
5.1. Total capacity resources; 5.2. Total available capacity; 5.3. Outage status by unit; 5.4. Frequency of outages, by type, by unit, by time period; 5.5. Comparisons of outages across units; 5.6. Company summary outage frequency; 5.7. Comparisons of outages across companies; 5.8. Frequency of unit outages by time period, by demand conditions; by system/bus price.
6. Market Structure
6.1. Concentration ratios by hour; 6.2. Incremental concentration ratios by hour; 6.3. Concentration ratios by transmission defined markets within PJM; 6.4. Concentration ratios by zone; 6.5. Concentration ratios by interface.
7. Price-cost margins
7.1. Unit specific price-cost margins; 7.1.1. Compare unit offers to unit costs 7.2. Company price-cost margins;
71

7.2.1. Compare unit price-cost margins by company. 8. Capacity market
8.1. Company supply curves by time period of market; 8.2. Company demand curves by time period of market; 8.3. Market prices for each market; 8.4. Capacity position by company
72

New England ISO Market Overview The ISO New England (ISO-NE) was established as a non-profit, private corporation on July 1, 1997. ISO-NE is responsible for operating New England’s electric bulk power system and for administering the region’s restructured wholesale electricity markets. The six-state region the ISO serves includes Connecticut, Maine, Massachusetts, New Hampshire, Rhode Island and Vermont. Made up of more than 350 generating units (installed capacity of 32,000 MW) connected by more than 8,000 miles of transmission lines, the ISO-NE serves more than 6.5 million New England customers. ISO-NE experienced a record demand of 24,967 MW in Summer 2001. Participants can sell via bilateral trades, day ahead market or real time market. In the current New England market, 75 percent of the electricity trading is covered under bilateral contracts, while 25 percent is traded in the real-time market. There is locational marginal pricing. There are also financial transmission rights. Market Monitoring The ISO-NE Market Monitoring and Mitigation (MMM) group is comprised of a manager and 10 full time staff. About half of this team works on day-to-day mitigation, including data review and other short-term analysis, while the remaining staff is responsible for taking a broader view of long-term market issues, collaborating with the market design group, and offering feedback to other groups within the ISO. The MMM group suggests changes to market rules, evaluates proposed market rules, and proposes new monitoring procedures. The manager of the MMM group reports to the CEO and has authority to independently contact the ISO board and FERC directly, if needed (see ISO-NE 2002). Occasionally, the MMM group also hires expert consultants to perform special analyses.
Similar to NYISO, ISO-NE uses an Independent Market Advisor who assesses ISO markets and conducts independent studies as needed, often times at the request of the ISO-NE board. The Market Advisor tends to interact informally with the Market Monitoring and Mitigation group and reports directly to the ISO board. (Goldman, 2004) Unfortunately, ISO-NE has not published an official list of the data and indices that it follows. However, examination of their annual reports makes clear that they follow a wide range of data on various prices, demand (including demand responsiveness), capacity, and transmission market conditions. The more advanced indices and analysis they report on include:
Market share analysis
73

HHI – system and local areas Residual supply index Outages and Reductions vs. Demand Levels Outage auditing Competitive Benchmark Analysis Net Revenue and Market Entry Analysis
74

California Market Overview California is the most populated State in the USA, with a population of about 27 million people. The state has an installed capacity of approximately 55 GW. In 2003, the generation mix comprised of gas 37%, coal 21%, hydro 16%, nuclear 15% and renewables 10%. Imports comprise 22% of supply. In 2003 demand was 276,000 GWh. In its Market Design 2002 (MD02), CAISO proposes a three-settlement system, including a day-ahead market, an hour-ahead market, and a real-time market based on Locational Marginal Pricing (LMP). Market Monitoring Market monitoring is conducted by the Division of Market Analysis in CAISO and comprises of three groups: Market Monitoring, Market Analysis and Mitigation, and Market Investigations. The Market Monitoring Division conducts the day-to-day monitoring, analysis and reporting. When this group uncovers unusual bids or potentially noncompetitive behavior, it turns over information to the Market Investigations group, which is responsible for investigating and reporting on the source of the unusual activity. Market Analysis and Mitigation primarily works on the design of market power mitigation measures and other market design issues related to market performance. The CAISO also has an independent advisory body, called the Market Surveillance Committee, which presently is composed of four experts from academia who perform studies and prepare reports on relevant market issues as requested by CAISO or others (e.g., FERC). The ISO Department of Market Analysis (DMA) has the task of developing, refining and maintaining a series of indices or indicators which may suggest the presence of market power or its exercise or of other behavior that may undermine the efficient working of these markets, or may result in uncompetitive market outcomes. These indices or indicators are seen, at a minimum, as serving as a warning sign to trigger further inquiry as to whether there is in the circumstances a problem that requires corrective action. Hence, the DMA does not see these indices or indicators, in most cases, as definitive tests of the existence of or the exercise of market power, or of behavior that undermines the market’s efficient functioning, but rather as a means of identifying circumstances that justify further inquiry or action. The following is a sample list of indices that the DMA proposed in 2002 that were to be developed over time.
75

Data and Indices Monitored
(1) The percentage of Settlement Periods in which a Market Participant has set, or has submitted bids close to, the Market Clearing Price in the Energy and Ancillary Service markets overall, and in relation to the following time periods or market conditions:
a) when such Market Participant is:
i. a net buyer of Energy and Ancillary Services, ii. a net seller of Energy and Ancillary Services;
b) during on-peak hours and off-peak hours; c) in different time periods otherwise of relevance to the state of the markets; These indices will also be examined in relationship to other “vulnerable periods” and bidding strategies;
(2) The relationships between the Market Clearing Prices in the various markets administered by the ISO, e.g., between the Imbalance Energy market and the Ancillary Services markets; (3) The record of Market Participants setting Market Clearing Prices in the context of the inter-market relationships as described in (2); (4) The percentage of Settlement Periods in which a Market Participant has set, or has submitted bids close to, the Market Clearing Price when such price falls into a particular segments of the market price curve, e.g., $20-30/MWh, and $30/MWh and above; (5) Other indices that monitor the efficacy and effects of market power mitigation measures.
Comparison and Evaluation of Specific Bidding Strategies of Market
Participants (6) Correlation between bidding behavior of Market Participants and their establishing the Market Clearing Price at times when they are:
i. net buyers of Energy and Ancillary Services, ii. net sellers of Energy and Ancillary Services;
(7) Bidding and re-bidding strategies of Market Participants, especially those that frequently set Market Clearing Prices during iterations in the bidding cycles of each market, both within and between the markets administered by the ISO;
76

(8) Comparison of bidding strategies for the same Generation unit into the Ancillary Service and Imbalance Energy markets; (9) Comparison of Supply Bids of Generation units with similar technology/age characteristics; (10) Supply Bid and Generation Unit withdrawals and redeclarations during bidding cycles; (11) Correlation of changes to initial Supply Bids with Market Clearing Prices, e.g., to ascertain if re-declarations cause or lead to increases in such prices; (12) Comparison of bidding strategies for the same Generation Unit in relation to the following time periods or market conditions:
a) when the Market Participant that owns the unit is a net seller or a net buyer of Energy or Ancillary Services;b) when congestion is or is not present;
c) when a Reliability Must-Run Unit is called or not called; d) when “near Congestion” occurs. “Near Congestion” means the final scheduled power flow over an Inter-Zonal Interface is within a few percentage points of the Available Transmission Capacity, or when congestion would occur with the initial Preferred Schedules but is alleviated after re-bidding;
(13) Comparison of bidding strategies of Market Participants in relation to their market share; (14) Relationships or correlations between the ability of Market Participants to set Market Clearing Prices or certain type of bidding behavior and periods or circumstances in which such Market Participants may have exclusive or restrictive access to data, e.g., as to costs or availability of Reliability Must- Run Units, or as to expected or actual outages of Generation Units or transmission facilities; and (15) Breakdowns of bids by price; to assist in the understanding of bidding patterns, at levels ranging from the entire bid stack to bids from an individual unit.
Indices of Market Concentration
The ISO Market Monitoring Unit will use dynamic, geographic and product market specific indices based on actual market operation data as indicators of the competitive condition of the ISO markets. The indicators include, but may not be limited to:
77

(16) Indices of “price-to-cost markup” that measure the difference between the Market Clearing Price or other appropriate price indices and an estimate of the competitive price; (17) The “Residual Supply Index,” or ratio of reserve capacity to the volume of generation provided by the largest single supplier, indicating that supplier’s capacity to be pivotal and potentially to hold prices above competitive levels; (18) A measure of supply responsiveness, or the volume of additional power that would be supplied for a given increase in price; (19) Traditional measures of concentration which might include conventional HHI (Herfindahl-Hirschman Index) analysis; and (20) Other indices as proposed and used effectively by members of the Energy Intermarket Surveillance Group, an association of market monitoring units in North America and Australia. Indices have been developed for: i. each of the geographic markets or zones; ii. each of ISO product markets including Imbalance Energy and Ancillary Services markets; iii. each of the market conditions such as on-peak and off-peak periods, periods with Congestion and without Congestion, and periods with and without other constraints;
Outages and Other Indices
(21) Generation Unit and transmission facility Outage indices in comparison with historical averages, with other similar units or facilities, and with other relevant standards such as bidding behavior; (22) New or unexpected occurrences of Congestion; and (23) Trend comparisons of Market Clearing Prices with fuel prices and other input prices.
78
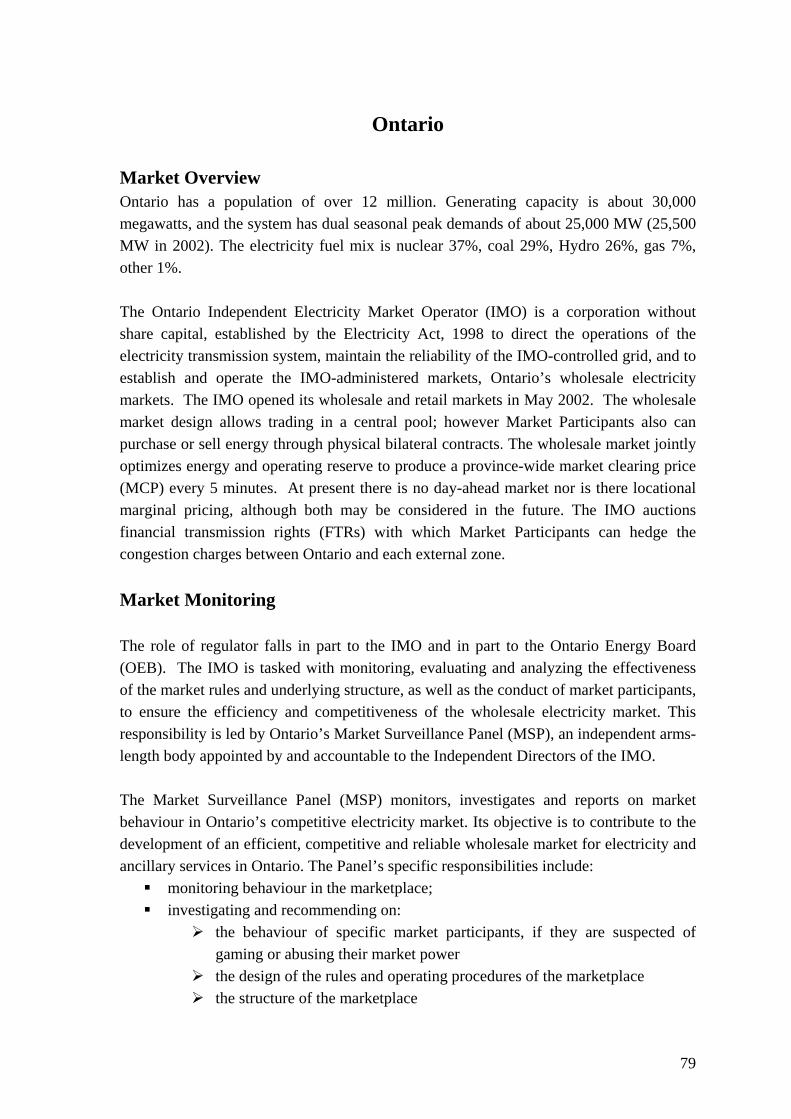
Ontario Market Overview Ontario has a population of over 12 million. Generating capacity is about 30,000 megawatts, and the system has dual seasonal peak demands of about 25,000 MW (25,500 MW in 2002). The electricity fuel mix is nuclear 37%, coal 29%, Hydro 26%, gas 7%, other 1%. The Ontario Independent Electricity Market Operator (IMO) is a corporation without share capital, established by the Electricity Act, 1998 to direct the operations of the electricity transmission system, maintain the reliability of the IMO-controlled grid, and to establish and operate the IMO-administered markets, Ontario’s wholesale electricity markets. The IMO opened its wholesale and retail markets in May 2002. The wholesale market design allows trading in a central pool; however Market Participants also can purchase or sell energy through physical bilateral contracts. The wholesale market jointly optimizes energy and operating reserve to produce a province-wide market clearing price (MCP) every 5 minutes. At present there is no day-ahead market nor is there locational marginal pricing, although both may be considered in the future. The IMO auctions financial transmission rights (FTRs) with which Market Participants can hedge the congestion charges between Ontario and each external zone. Market Monitoring The role of regulator falls in part to the IMO and in part to the Ontario Energy Board (OEB). The IMO is tasked with monitoring, evaluating and analyzing the effectiveness of the market rules and underlying structure, as well as the conduct of market participants, to ensure the efficiency and competitiveness of the wholesale electricity market. This responsibility is led by Ontario’s Market Surveillance Panel (MSP), an independent arms-length body appointed by and accountable to the Independent Directors of the IMO. The Market Surveillance Panel (MSP) monitors, investigates and reports on market behaviour in Ontario’s competitive electricity market. Its objective is to contribute to the development of an efficient, competitive and reliable wholesale market for electricity and ancillary services in Ontario. The Panel’s specific responsibilities include: monitoring behaviour in the marketplace; investigating and recommending on:
the behaviour of specific market participants, if they are suspected of gaming or abusing their market power the design of the rules and operating procedures of the marketplace the structure of the marketplace
79

reporting on the results of its monitoring and investigations Should the MSP detect that a market participant has acted to take advantage of the rules or abuse its market power, the Panel will initiate investigations and make recommendations to the IMO, the Ontario Energy Board, the federal Competition Bureau or other government agencies as appropriate. These organizations, in turn, have the authority to penalize and influence conduct through penalties, rule changes, altered licence conditions, divestiture orders or criminal prosecutions. The IMO and the MSP have signed an agreement with the OEB and the Competition Bureau outlining each organization’s role and responsibilities. The Panel will also carefully scrutinize any aspect of the market that could inhibit the normal adjustments to supply and demand that one would expect to see in a competitive marketplace. For example, in order to ensure that transmission constraints do not create opportunities to take advantage of the market rules, the Panel has developed mechanisms that will be used by the IMO to mitigate the effects of local market power. The IMO’s Market Assessment Unit (MAU), which supports the MSP in these areas of responsibility, closely monitors market activity by tracking a set of market indicators, such as price, cost curves, outages and loads. Comparing this information against market models enhances understanding of the supply and demand factors underlying price movements in the marketplace and assists in the detection of flaws in the market design and potential cases of market abuse by participants. The Data Catalogue and Catalogue of Market Monitoring Indices are tools set out in the Market Rules to assist effective monitoring by the Market Surveillance Panel. The MSP and MAU safeguard confidential information carefully as set out in the Market Surveillance Confidentiality Policy. MSP members are appointed by, and accountable to, the Committee of Independent Directors of the IMO. They must not have any material interest in a market participant and cannot be directors, officers or employees of the IMO or of a market participant.
Catalogue of Market Monitoring Indices 1 Available Generation
1.1 Total Capacity of Resources 1.2 Total MW on Planned Outage by Resource Id 1.3 Total MW on Forced Outage by Resource Id 1.4 Total Available Ontario Generation on an Hourly Basis 1.5 Market Participant Summary Outage Frequency 1.6 Frequency of Resource Outages by Time Period, by Demand Conditions 1.7 Comparison of Actual to Historical Outage Frequencies 1.8 Correlation Between Outage Frequency and High Load Periods
80

1.9 Correlation between Available Ontario Generation to Market Clearing Price 1.10 Comparison of Historical Water Transfers to Actual
2 Ontario Electricity Market Volumes
2.1 Total MW Offered on an Hourly Basis 2.2 Total MW Bid on an Hourly Basis 2.3 Total Dispatchable Load Bid 2.4 Total Dispatchable Load Accepted 2.5 Dispatchable Load Market Year over Year Average 2.6 Total Hourly Injections Offered and Scheduled 2.7 Total Hourly Off-takes Bid and Scheduled 2.8 Import and Export Volume Change Year over Year
3 Ontario Market Demand
3.1 Hourly Load 3.2 Comparison of Hourly Load to Pre-Dispatch Load 6 and 3 Hours Ahead of
Each Hour 4 Ontario Prices
4.1 Market Clearing Prices and Intertie Zonal Prices for Energy and Operating Reserve
4.2 Frequency of Maximum Market Clearing Price (MMCP) and Maximum Operating Reserve Price (MORP)
4.3 Correlation between Price and Load 4.4 Comparison between MCP and Pre-Dispatch Forecasted MCP 4.5 Comparison between Hourly Ontario Energy Price (HOEP) and Pre-Dispatch Prices 6 and 3 Hours Ahead of Each Hour
5 Ontario Nodal Prices 5.1 Hourly Energy Nodal Prices 5.2 Maximum Energy Nodal Price 5.3 Price Ranking across Nodes
6 Price Cost Margins
6.1 Resource Specific Price-Cost Margins 7 Comparative Prices and Loads for Surrounding Power Markets
7.1 Hourly Prices for each System Day Ahead Market (DAM), Hour Ahead Markt (HAM) and Real Time 7.2 Hourly Loads for each System 7.3 Net Injections / Off-takes between Ontario and each System 7.4 Comparison of Injections / Off-takes to Arbitrage Opportunities between Markets 7.5 Comparison of Scheduled to Actual Transactions by Intertie Zone
81
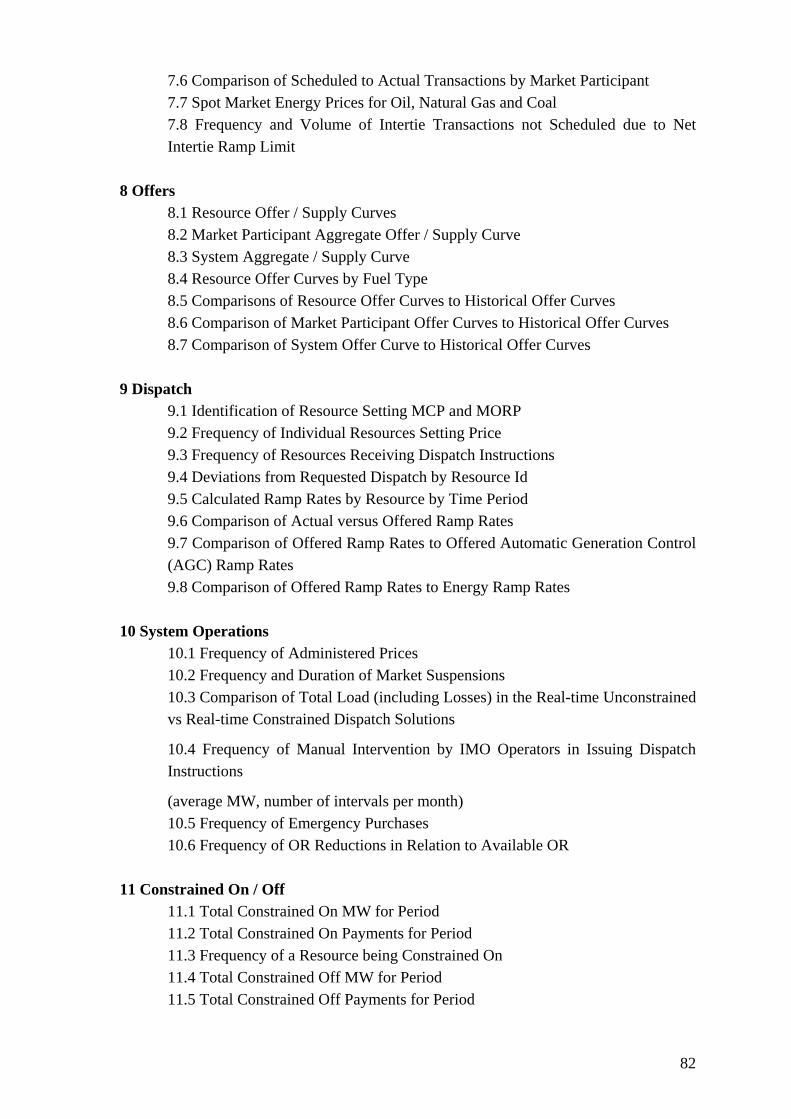
7.6 Comparison of Scheduled to Actual Transactions by Market Participant 7.7 Spot Market Energy Prices for Oil, Natural Gas and Coal 7.8 Frequency and Volume of Intertie Transactions not Scheduled due to Net Intertie Ramp Limit
8 Offers
8.1 Resource Offer / Supply Curves 8.2 Market Participant Aggregate Offer / Supply Curve 8.3 System Aggregate / Supply Curve 8.4 Resource Offer Curves by Fuel Type 8.5 Comparisons of Resource Offer Curves to Historical Offer Curves 8.6 Comparison of Market Participant Offer Curves to Historical Offer Curves 8.7 Comparison of System Offer Curve to Historical Offer Curves
9 Dispatch
9.1 Identification of Resource Setting MCP and MORP 9.2 Frequency of Individual Resources Setting Price 9.3 Frequency of Resources Receiving Dispatch Instructions 9.4 Deviations from Requested Dispatch by Resource Id 9.5 Calculated Ramp Rates by Resource by Time Period 9.6 Comparison of Actual versus Offered Ramp Rates 9.7 Comparison of Offered Ramp Rates to Offered Automatic Generation Control (AGC) Ramp Rates 9.8 Comparison of Offered Ramp Rates to Energy Ramp Rates
10 System Operations
10.1 Frequency of Administered Prices 10.2 Frequency and Duration of Market Suspensions 10.3 Comparison of Total Load (including Losses) in the Real-time Unconstrained vs Real-time Constrained Dispatch Solutions
10.4 Frequency of Manual Intervention by IMO Operators in Issuing Dispatch Instructions
(average MW, number of intervals per month) 10.5 Frequency of Emergency Purchases 10.6 Frequency of OR Reductions in Relation to Available OR
11 Constrained On / Off
11.1 Total Constrained On MW for Period 11.2 Total Constrained On Payments for Period 11.3 Frequency of a Resource being Constrained On 11.4 Total Constrained Off MW for Period 11.5 Total Constrained Off Payments for Period
82

11.6 Frequency of a Resource being Constrained Off 11.7 Dispatchable Load Constrained Events Year over Year
12 Transmission
12.1 Intertie Capability Comparison Year over Year 12.2 Congestion Management Settlement Credits Cost for Internal Transmission Constraints Year over Year 12.3 Percentage of Time Interties are Limited Year over Year
83

Australia
Market Overview The Australian National Electricity Market (NEM) was established in 1998 as a wholesale trading market across the interconnected electricity grid of South Australia, Victoria, New South Wales, Australian Capital Territory and Queensland. The market serves 7.7 million customers. Wholesale trading is through a compulsory pool for all significant generators (greater than 30 MW). Simple bids are lodged on a day-ahead basis and quantity re-bidding is allowed up until dispatch. Centralised dispatch is compulsory. There are no capacity payments. The wholesale market is operated by the National Electricity Market Management Company Limited (NEMMCO). Market Monitoring One of the distinctive features of the Australian regulatory model is that the Australian Competition and Consumer Commission (ACCC) is both the national electricity regulator and the competition authority. The primary responsibility for market monitoring and surveillance lies with the National Electricity Code Administrator (NECA). NEMMCO also has a role in the market monitoring process by being required to conduct reviews of significant operating incidents to assess the adequacy and response of facilities or services. These reviews must be made available to Code participants and the public. NEMMCO’s role also includes providing data to NECA. This includes
Re-bidding activity and reasons; Dispatch compliance; Routine reports and data requirements.
NECA prepares weekly market analyses and quarterly statistical digests that monitor the performance of the market. These reports include:
Monitoring and responding to potential Code breaches through continuous and targeted monitoring of market participants and systems
o routine review of market operations using reports and data provided by NEMMCO;
o random targeting of specific Code requirements o monitoring and assessment of power traders and their ability to
comply with the Code. o monitoring of variations between forecast and actual spot prices o determination of reasons for deviations o where breach of the Trade Practices Act (TPA) is possible,
reporting to the Australian Competition and Consumer
84
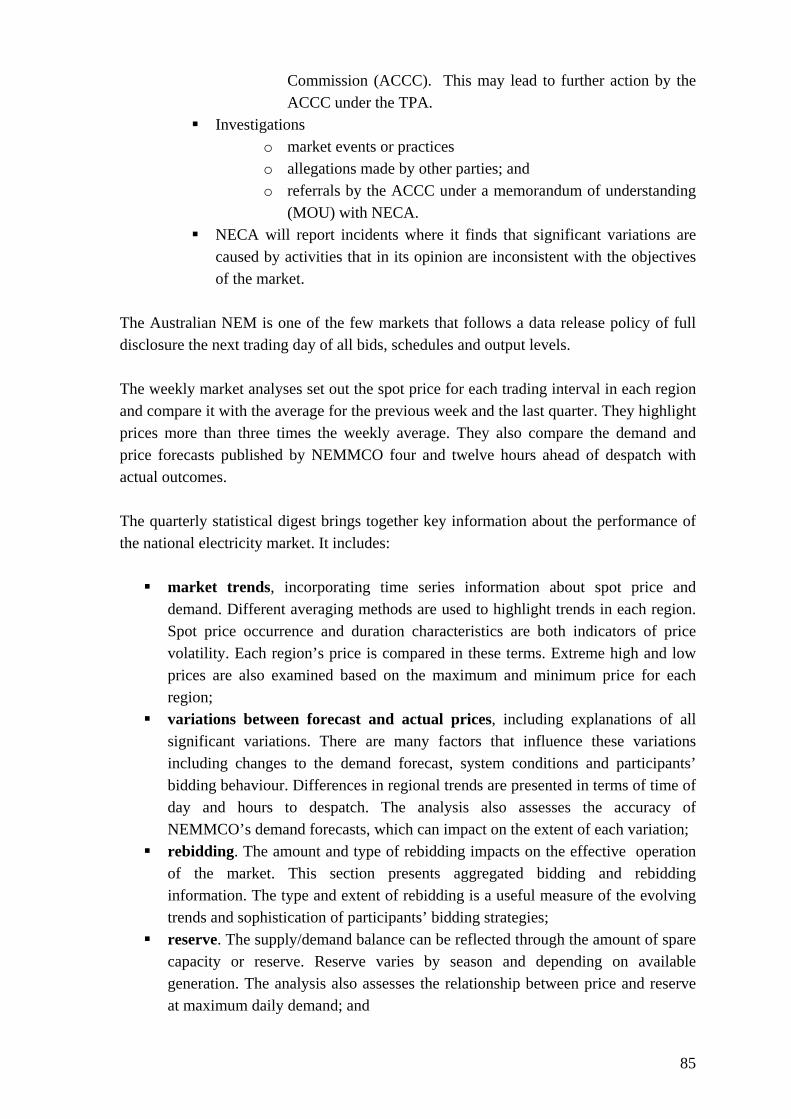
Commission (ACCC). This may lead to further action by the ACCC under the TPA.
Investigations o market events or practices o allegations made by other parties; and o referrals by the ACCC under a memorandum of understanding
(MOU) with NECA. NECA will report incidents where it finds that significant variations are
caused by activities that in its opinion are inconsistent with the objectives of the market.
The Australian NEM is one of the few markets that follows a data release policy of full disclosure the next trading day of all bids, schedules and output levels. The weekly market analyses set out the spot price for each trading interval in each region and compare it with the average for the previous week and the last quarter. They highlight prices more than three times the weekly average. They also compare the demand and price forecasts published by NEMMCO four and twelve hours ahead of despatch with actual outcomes. The quarterly statistical digest brings together key information about the performance of the national electricity market. It includes: market trends, incorporating time series information about spot price and
demand. Different averaging methods are used to highlight trends in each region. Spot price occurrence and duration characteristics are both indicators of price volatility. Each region’s price is compared in these terms. Extreme high and low prices are also examined based on the maximum and minimum price for each region;
variations between forecast and actual prices, including explanations of all significant variations. There are many factors that influence these variations including changes to the demand forecast, system conditions and participants’ bidding behaviour. Differences in regional trends are presented in terms of time of day and hours to despatch. The analysis also assesses the accuracy of NEMMCO’s demand forecasts, which can impact on the extent of each variation;
rebidding. The amount and type of rebidding impacts on the effective operation of the market. This section presents aggregated bidding and rebidding information. The type and extent of rebidding is a useful measure of the evolving trends and sophistication of participants’ bidding strategies;
reserve. The supply/demand balance can be reflected through the amount of spare capacity or reserve. Reserve varies by season and depending on available generation. The analysis also assesses the relationship between price and reserve at maximum daily demand; and
85

ancillary services, including aggregate and time services information about the requirements and prices for these services. It also highlights changes in market share and rebidding.
In addition to weekly analyses and quarterly digests, NECA also publishes reports of investigations into specific events in the market. There have been 15 published reports since April 1999.
86

Singapore Market Overview As of year-end 2003, Singapore had a capacity of 8,919 MW. In 2003 its annual electricity consumption was 32,000 GWh. Almost all of Singapore's electricity supply is from oil- and gas-fired power plants. In January 2003, Singapore’s New Electricity Market (NEM) was launched under the authority of the Electricity Act. All of Singapore’s electricity is bought and sold through the Energy Market Company (EMC) in a half-hourly spot market. The overall least cost dispatch schedule and market prices are determined each half hour by a computer model called the Market Clearing Engine (MCE). The MCE takes account of a full range of system constraints and generates locational marginal (nodal) prices for 33 injection nodes and 350 off-take nodes. Generators receive the relevant nodal spot price. Customers pay the Uniform Singapore Electricity Price (USEP). Market Monitoring The principal legislation governing the electricity market is the Singapore Electricity Act 2001. This Act oversees the electricity licences, the Transmission Code, the Singapore Wholesale Market Rules and other codes, which all market participants, including the Energy Market Company, Power System Operator and the Market Support and Services Licensee (Power Supply Ltd) must comply with. The Energy Market Authority (EMA) is the regulator of the NEM and has the ultimate responsibility of ensuring that the NEM meets the needs of Singapore. The Market Surveillance and Compliance Panel (MSCP) is an independent body established under the Singapore Electricity Market Rules and currently consists of five members. The Market Surveillance and Compliance Panel is responsible for the provision of a fair and competitive environment for all participants and can:
• determine breaches of the Market Rules, • impose sanctions, • suggest rule modifications, • suspend, terminate or revoke the registration of market participants, • pass on its findings to Energy Market Company and Energy Market Authority, • publish its findings on Energy Market Company’s website.
As an independent body, the panel ensures that monitoring, investigation and enforcement apply to all parties in the electricity market, including the Energy Market Company.
87

The Market Surveillance and Compliance Panel is supported in its functions by the EMC’s Market Assessment Unit. This unit, under the supervision and direction of the MSCP, was directed by the Electricity Act to develop an information requirements system and evaluation criteria to enable effective monitoring of the market. After going through a consultation process with industry participants it released in August 2003 a catalogue of data to be maintained by the MSCP. In July 2004 MSCP released a catalogue of monitoring indices to be used by the MSCP and the MAU to evaluate data collected. The market assessment unit is required to make a report, at least quarterly, on its day to day monitoring and evaluation activities to the market surveillance panel and the Chief Executive of the EMC. It is also required in the following cases to report: To the market surveillance panel, where it discovers evidence of phenomena that
may require investigation; and To the Chief Executive of the EMC, where is discovers the possible need for a
change to the market rules or evidence that a market participant may be breaching the market rules.
Similarly, the market surveillance panel is required to make a report, at least annually, to the EMC board, giving an overview of its monitoring activities, a summary of all complaints, referrals and investigations, and any investigations it had conducted in respect of offer variations reported to it by the EMC. The annual report must also contain the market surveillance panel’s general assessment as to the state of competition in, and the efficiency of, the wholesale market. Catalogue of Data Generation Registered Facility Characteristics
Maximum installed capacity of each generation registered facility (Confidential; Frequency: once and within 3 business days upon change)
Maximum generation capacity of each generation registered facility (Confidential; once and within 3 business days upon change)
Maximum ramp-up rate of each generation registered facility Maximum ramp-down rate of each generation registered facility Maximum reserve capacity (primary, secondary and contingency) of each
generation registered facility Maximum combined generation capacity and reserve capacity of each
generation registered facility Maximum regulation capacity of each generation registered facility Maximum energy output at which AGC can operate for each generation
registered facility Minimum energy output at which AGC can operate for each generation
registered facility Fuel type of each generation registered facility; once and within 3 business
days upon change
88

Year the generation registered facility was first commissioned Total annual forced outage hours (past three years) of each generation
registered facility Total annual planned outage hours (past three years) of each generation
registered facility Total annual overhaul hours (past three years) of each generation registered
facility Annual availability factor i.e. the percentage of time a generation registered
facility is available to generate electricity in a year (past three years) of each generation registered facility
Transmission System Data Maps and diagrams of the transmission system showing: ratings of
transmission lines, import links from Malaysia, and location of each generation registered facility
Transmission line forced outage upon occurrence, by the next business day by fax
Proposed transmission line de-rating advice upon occurrence, by the next business day
Proposed transmission line maintenance outage programme daily, by the next business day
Supply Data Occurrences of discretionary dispatch action taken by PSO (Upon
occurrence, by the next business day) Offers of energy, reserve and regulation submitted by all market participants
(Daily, within 6 business days after the trading day Supply Data) Offers exceeding offer change limits (offer variations and revisions to
standing offers) (Daily, by the next business day EMC By CSV reports) Scheduled dispatch quantity of energy, reserve and regulation by generation
registered facility/market participant. (Daily, within 6 business days after the trading day)
Maximum target, minimum target and initial output of each scheduled generation registered facility. (Daily, within 6 business days after the trading day)
Metered generation quantity by generation registered facility/market participant (Daily, within 11 business days after the trading day EMC By CSV reports)
Annual overhaul duration of each generation registered facility in hours (Annually and upon change, within 3 business days after approval by PSO)
Total generation capacity under maintenance (planned outages and annual overhaul) (Daily, by the next business day)
Short-term planned outage by generation registered facility (Upon occurrence, by the next business day)
89

Forced outage by generation registered facility (Upon occurrence, by the next business day)
Generation registered facility de-rating notification (Upon occurrence, by the next business day)
Security constraints (location, timing, volume, cause) (Upon occurrence, by the next business day)
Load shed forecast (Upon occurrence, by the next business day) Load shed advisory notice (Upon occurrence, by the next business day By E-
mail) Intertie submission information (Upon occurrence, by the next business day) Availability factor (i.e. the percentage of time a generation registered facility
is available to generate electricity) of each generation registered facility (Quarterly, within 6 business days after the end of quarter Generation Licensee)
Demand Data Pre-dispatch load forecast (Daily, within 6 business days after the trading
day) Real-time load forecast (Daily, within 6 business days after the trading day) Actual system demand (settlement ready metering data) (Daily, within 11
business days after the trading day) Historical system demand (past three years) (Once)
Pricing Data Half hourly Market Energy Price ("MEP") at all market network nodes
("MNN") (Daily, within 6 business days after the trading day) Half hourly Uniform Singapore Energy Price (“USEP”) (Daily, within 6
business days after the trading day) Half hourly regulation price (Daily, within 6 business days after the trading
day) Half hourly reserve prices: primary, secondary and contingency (Daily,
within 6 business days after the trading day) Uplift charges (Daily, within 11 business days after the trading day) Pre-dispatch schedules (Daily, within 6 business days after the trading day) Real-time dispatch schedules (Daily, within 6 business days after the trading
day) Wholesale price (i.e. the approximate wholesale price that retailers pay for
electricity) in $/MWh (Monthly within 6 business days after month end) Other Data
Advisory notices reported by frequency, time, day and type Daily, within 6 business days after the trading day
Information on issuance of notice of default and exercise of rights of credit support (Upon occurrence, by the next business day)
Information on total cost and providers of contracts of ancillary services (Within10 business days of entry into new contracts)
90

Total turnover in the energy market in MWh and $ Monthly (within 11 business days after month end)
Catalogue of Monitoring Data Supply Indices
Capacity ratio of a generation registered facility – Ratio of a generation registered facility’s (a) scheduled generation output to (b) maximum generation capacity
Supply cushion - Ratio of (a) the difference between total offered volume and system demand to (b) total offered volume
Outage frequency Market share by (a) generation licensee and (b) generation registered facility Comparison of metered generation quantity with scheduled dispatch quantity
by generation registered facility/generation licensee Frequency of issuance by PSO of dispatch instructions deviating from real-
time dispatch schedule Frequency of offer variations or revisions to standing offers exceeding offer
change limits Demand Indices
Comparison of latest available very short-term load forecast with real-time load forecast and
Comparison of real-time load forecast with metered generation quantity Price Indices
Trend of USEP, reserve prices, regulation price and comparison of trends Percentage of hours and quantity of load when WEP1 falls into a particular
price range Correlation between WEP and system demand Correlation between WEP and fuel price Comparison of latest available short-term schedule projected prices with
real-time prices
91

Nord Pool Market Overview The population of Norway, Sweden, Finland, and Denmark totals about 24 million. Electric power production in Norway is almost 100% hydropower. Sweden and Finland use hydropower, nuclear and fossil-fuel-powered generation plants. Over 90% of Denmark’s electricity comes from conventional thermal plants and combined heating and power (CHP) facilities. Nord Pool ASA - The Nordic Power Exchange - is the world's only multinational exchange for trading electric power and was established in 1993. It is owned by two national grid companies, Statnett SF in Norway (50%) and Affärsverket Svenska Kraftnät in Sweden (50%). Market Monitoring Originally most market monitoring was at the national regulatory authorities. However, at end of 2000, Nord Pool decided to strengthen the market surveillance it performs and established an independent market surveillance department responsible for monitoring the Nordic Power Exchange’s physical and financial markets. The goals of this supervision includes ensuring that the market participants are acting according to the rules of the Exchange and that information disclosure is conducted in a correct manner. With respect to market power issues, the department does not publish a list of data and indices that it regularly tracks. However, it does produce a 2-page report three times a year that contains some references to its activity in monitoring markets. These reports make clear that the market monitoring process includes: tracking pricing trends within and between zones; monitoring capacity levels; conducting correlation analysis between zonal prices and transmission/generation outages/constraints. However, there is no evidence that it is performing some of the more elaborate market monitoring procedures discussed elsewhere in this report.
92